Peach Springs, AZ Map & Demographics
Peach Springs Map
Peach Springs Overview
$14,585
PER CAPITA INCOME
$43,500
AVG FAMILY INCOME
$55,000
AVG HOUSEHOLD INCOME
0.44
INEQUALITY / GINI INDEX
1,482
TOTAL POPULATION
759
MALE POPULATION
723
FEMALE POPULATION
104.98
MALES / 100 FEMALES
95.26
FEMALES / 100 MALES
21.4
MEDIAN AGE
4.5
AVG FAMILY SIZE
4.5
AVG HOUSEHOLD SIZE
507
LABOR FORCE [ PEOPLE ]
55.9%
PERCENT IN LABOR FORCE
18.7%
UNEMPLOYMENT RATE
Peach Springs Zip Codes
Peach Springs Area Codes
Income in Peach Springs
Income Overview in Peach Springs
Per Capita Income in Peach Springs is $14,585, while median incomes of families and households are $43,500 and $55,000 respectively.
| Characteristic | Number | Measure |
| Per Capita Income | 1,482 | $14,585 |
| Median Family Income | 314 | $43,500 |
| Mean Family Income | 314 | $57,848 |
| Median Household Income | 324 | $55,000 |
| Mean Household Income | 324 | $61,247 |
| Income Deficit | 314 | $0 |
| Wage / Income Gap (%) | 1,482 | 0.00% |
| Wage / Income Gap ($) | 1,482 | 100.00¢ per $1 |
| Gini / Inequality Index | 1,482 | 0.44 |
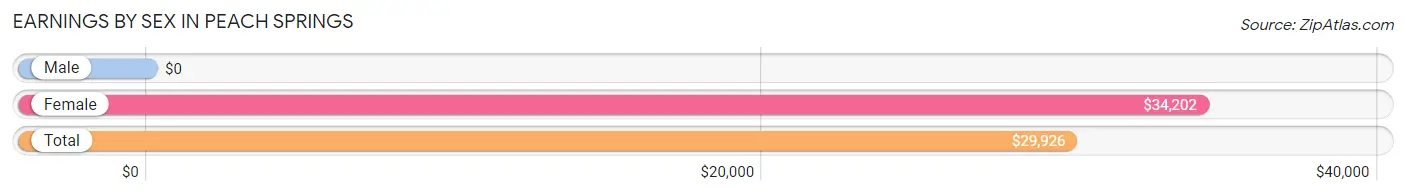
Earnings by Sex in Peach Springs
| Sex | Number | Average Earnings |
| Male | 252 (48.3%) | $0 |
| Female | 270 (51.7%) | $34,202 |
| Total | 522 (100.0%) | $29,926 |
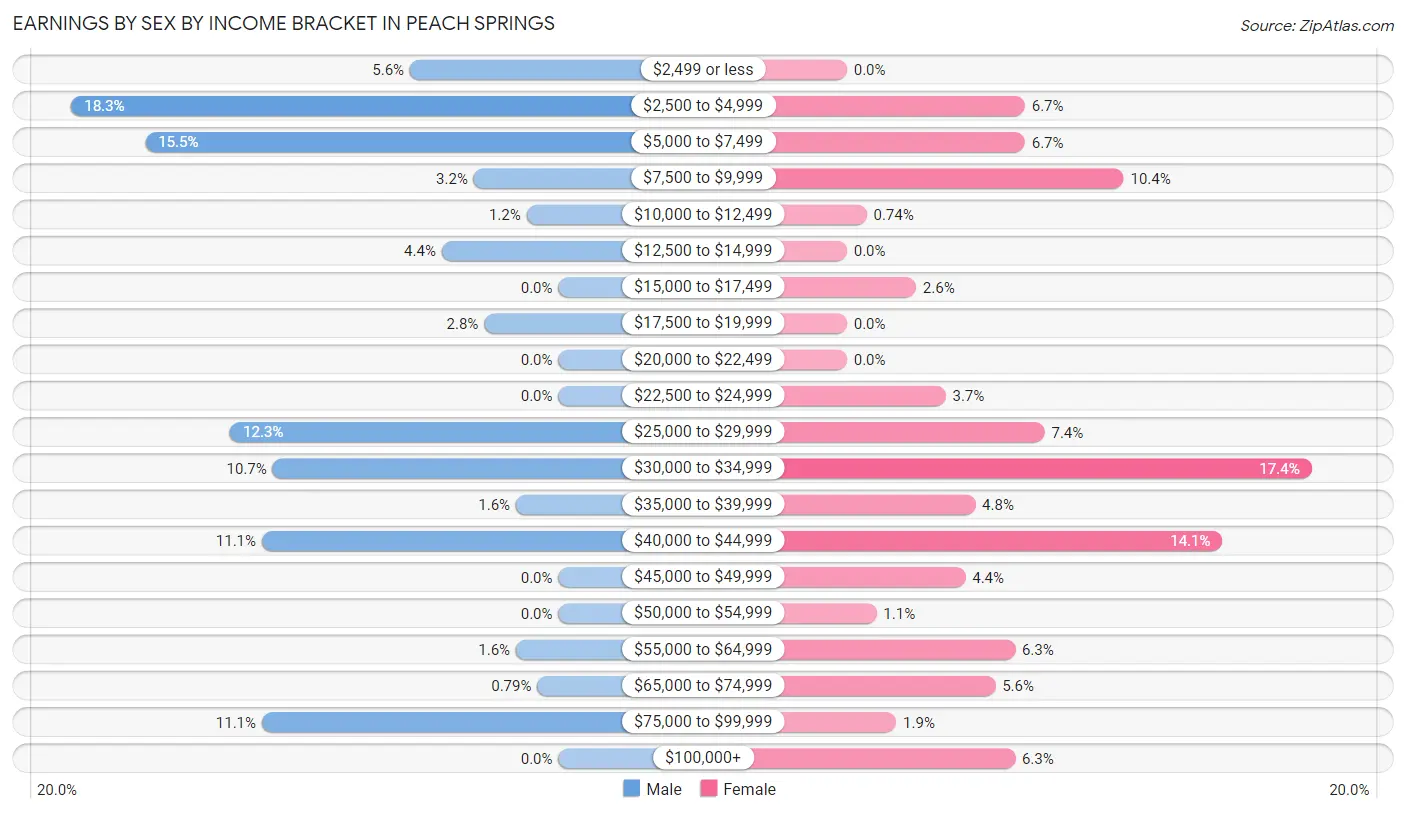
Earnings by Sex by Income Bracket in Peach Springs
The most common earnings brackets in Peach Springs are $2,500 to $4,999 for men (46 | 18.2%) and $30,000 to $34,999 for women (47 | 17.4%).
| Income | Male | Female |
| $2,499 or less | 14 (5.6%) | 0 (0.0%) |
| $2,500 to $4,999 | 46 (18.2%) | 18 (6.7%) |
| $5,000 to $7,499 | 39 (15.5%) | 18 (6.7%) |
| $7,500 to $9,999 | 8 (3.2%) | 28 (10.4%) |
| $10,000 to $12,499 | 3 (1.2%) | 2 (0.7%) |
| $12,500 to $14,999 | 11 (4.4%) | 0 (0.0%) |
| $15,000 to $17,499 | 0 (0.0%) | 7 (2.6%) |
| $17,500 to $19,999 | 7 (2.8%) | 0 (0.0%) |
| $20,000 to $22,499 | 0 (0.0%) | 0 (0.0%) |
| $22,500 to $24,999 | 0 (0.0%) | 10 (3.7%) |
| $25,000 to $29,999 | 31 (12.3%) | 20 (7.4%) |
| $30,000 to $34,999 | 27 (10.7%) | 47 (17.4%) |
| $35,000 to $39,999 | 4 (1.6%) | 13 (4.8%) |
| $40,000 to $44,999 | 28 (11.1%) | 38 (14.1%) |
| $45,000 to $49,999 | 0 (0.0%) | 12 (4.4%) |
| $50,000 to $54,999 | 0 (0.0%) | 3 (1.1%) |
| $55,000 to $64,999 | 4 (1.6%) | 17 (6.3%) |
| $65,000 to $74,999 | 2 (0.8%) | 15 (5.6%) |
| $75,000 to $99,999 | 28 (11.1%) | 5 (1.8%) |
| $100,000+ | 0 (0.0%) | 17 (6.3%) |
| Total | 252 (100.0%) | 270 (100.0%) |
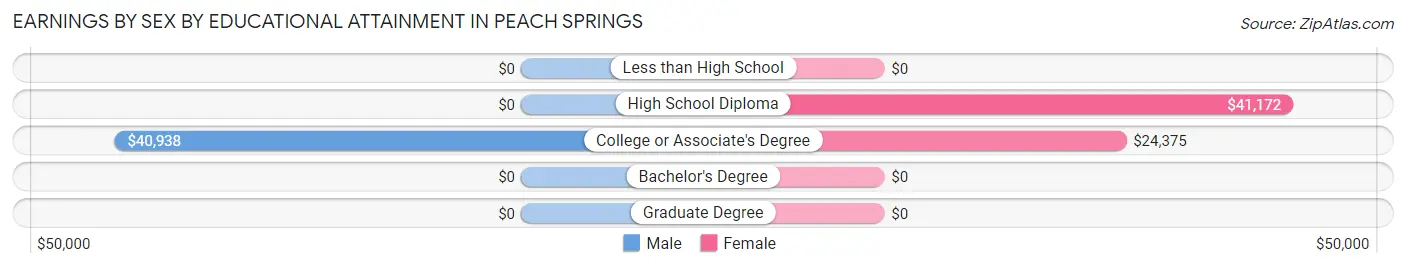
Earnings by Sex by Educational Attainment in Peach Springs
Average earnings in Peach Springs are $27,946 for men and $34,318 for women, a difference of 18.6%. Men with an educational attainment of college or associate's degree enjoy the highest average annual earnings of $40,938, while those with college or associate's degree education earn the least with $40,938. Women with an educational attainment of high school diploma earn the most with the average annual earnings of $41,172, while those with college or associate's degree education have the smallest earnings of $24,375.
| Educational Attainment | Male Income | Female Income |
| Less than High School | - | - |
| High School Diploma | - | - |
| College or Associate's Degree | $40,938 | $24,375 |
| Bachelor's Degree | - | - |
| Graduate Degree | - | - |
| Total | $27,946 | $34,318 |
Family Income in Peach Springs
Family Income Brackets in Peach Springs
According to the Peach Springs family income data, there are 76 families falling into the $50,000 to $74,999 income range, which is the most common income bracket and makes up 24.2% of all families.
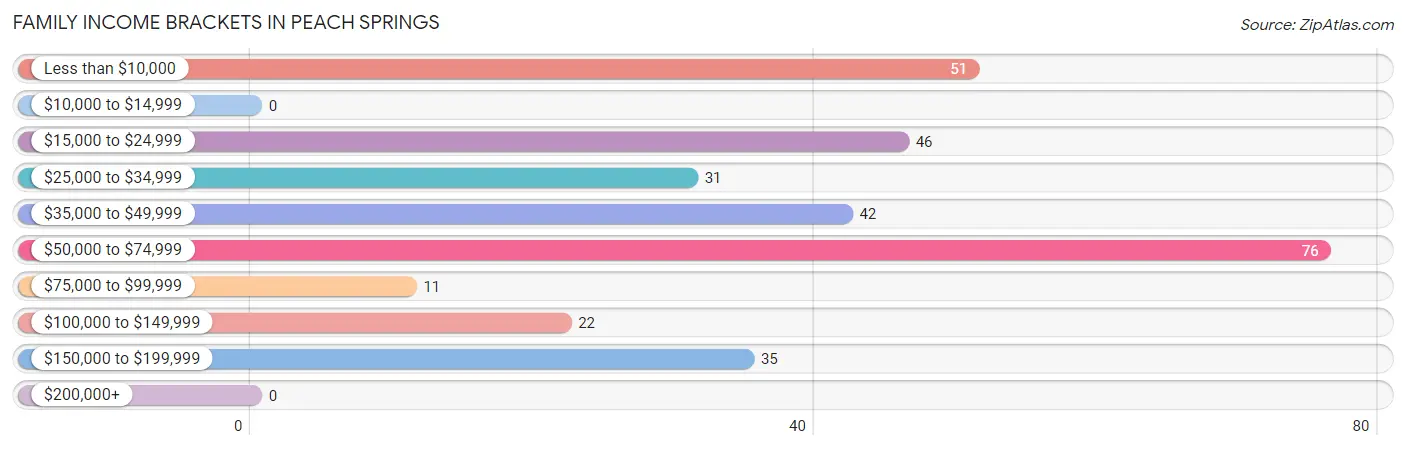
| Income Bracket | # Families | % Families |
| Less than $10,000 | 51 | 16.2% |
| $10,000 to $14,999 | 0 | 0.0% |
| $15,000 to $24,999 | 46 | 14.6% |
| $25,000 to $34,999 | 31 | 9.9% |
| $35,000 to $49,999 | 42 | 13.4% |
| $50,000 to $74,999 | 76 | 24.2% |
| $75,000 to $99,999 | 11 | 3.5% |
| $100,000 to $149,999 | 22 | 7.0% |
| $150,000 to $199,999 | 35 | 11.1% |
| $200,000+ | 0 | 0.0% |
Family Income by Famaliy Size in Peach Springs
7+ person families (25 | 8.0%) account for the highest median family income in Peach Springs with $63,047 per family, while 4-person families (61 | 19.4%) have the highest median income of $13,963 per family member.
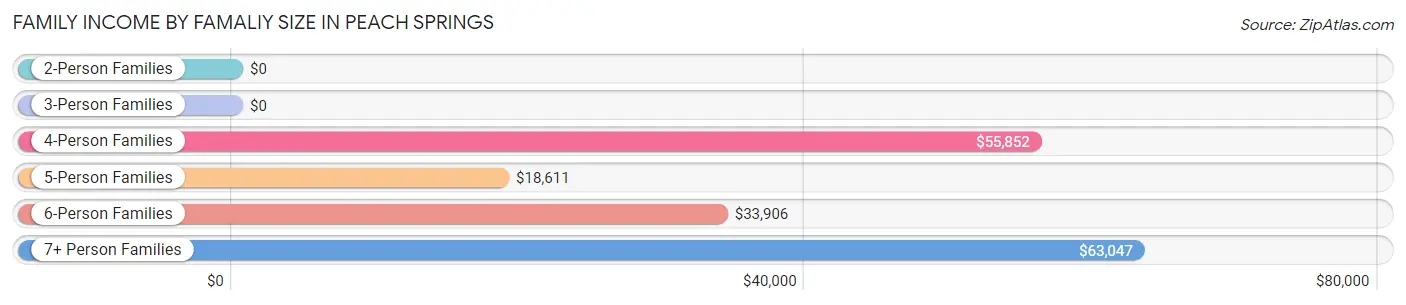
| Income Bracket | # Families | Median Income |
| 2-Person Families | 77 (24.5%) | $0 |
| 3-Person Families | 71 (22.6%) | $0 |
| 4-Person Families | 61 (19.4%) | $55,852 |
| 5-Person Families | 34 (10.8%) | $18,611 |
| 6-Person Families | 46 (14.6%) | $33,906 |
| 7+ Person Families | 25 (8.0%) | $63,047 |
| Total | 314 (100.0%) | $43,500 |
Family Income by Number of Earners in Peach Springs
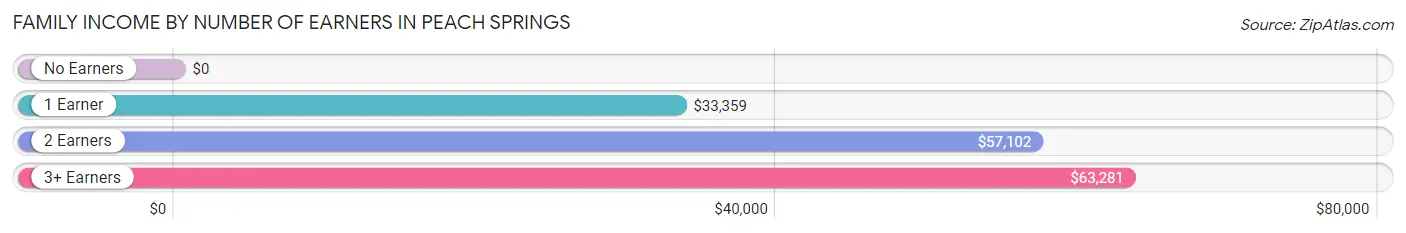
| Number of Earners | # Families | Median Income |
| No Earners | 52 (16.6%) | $0 |
| 1 Earner | 131 (41.7%) | $33,359 |
| 2 Earners | 101 (32.2%) | $57,102 |
| 3+ Earners | 30 (9.6%) | $63,281 |
| Total | 314 (100.0%) | $43,500 |
Household Income in Peach Springs
Household Income Brackets in Peach Springs
With 102 households falling in the category, the $50,000 to $74,999 income range is the most frequent in Peach Springs, accounting for 31.5% of all households.
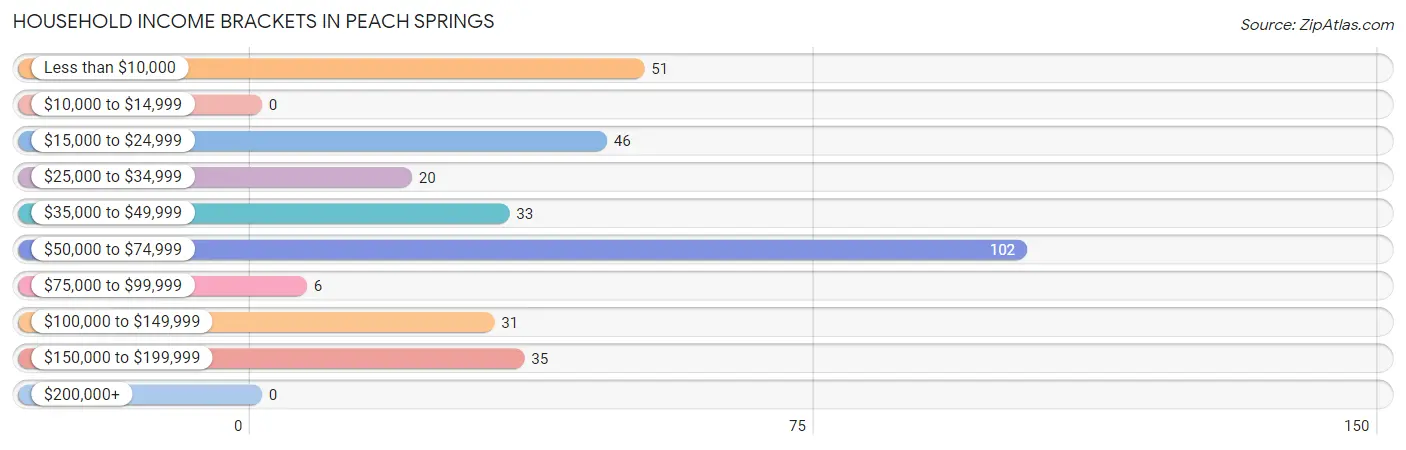
| Income Bracket | # Households | % Households |
| Less than $10,000 | 51 | 15.7% |
| $10,000 to $14,999 | 0 | 0.0% |
| $15,000 to $24,999 | 46 | 14.2% |
| $25,000 to $34,999 | 20 | 6.2% |
| $35,000 to $49,999 | 33 | 10.2% |
| $50,000 to $74,999 | 102 | 31.5% |
| $75,000 to $99,999 | 6 | 1.9% |
| $100,000 to $149,999 | 31 | 9.6% |
| $150,000 to $199,999 | 35 | 10.8% |
| $200,000+ | 0 | 0.0% |
Household Income by Householder Age in Peach Springs
The median household income in Peach Springs is $55,000, with the highest median household income of $70,526 found in the 45 to 64 years age bracket for the primary householder. A total of 118 households (36.4%) fall into this category. Meanwhile, the 15 to 24 years age bracket for the primary householder has the lowest median household income of $0, with 12 households (3.7%) in this group.
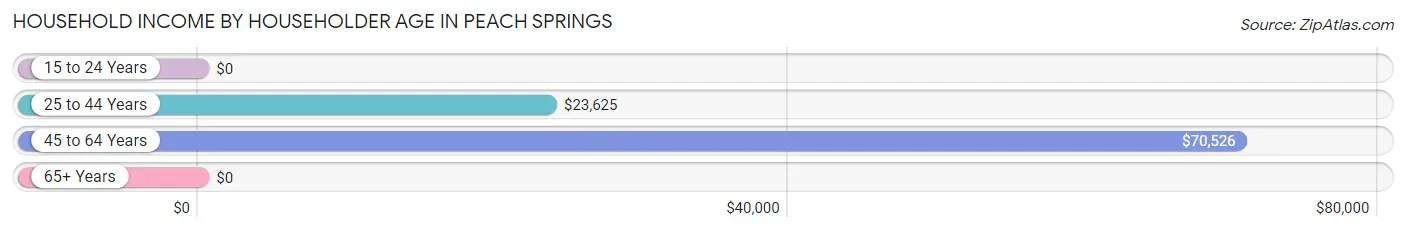
| Income Bracket | # Households | Median Income |
| 15 to 24 Years | 12 (3.7%) | $0 |
| 25 to 44 Years | 151 (46.6%) | $23,625 |
| 45 to 64 Years | 118 (36.4%) | $70,526 |
| 65+ Years | 43 (13.3%) | $0 |
| Total | 324 (100.0%) | $55,000 |
Poverty in Peach Springs
Income Below Poverty by Sex and Age in Peach Springs
With 40.0% poverty level for males and 36.6% for females among the residents of Peach Springs, 15 year old males and 5 year old females are the most vulnerable to poverty, with 16 males (100.0%) and 7 females (100.0%) in their respective age groups living below the poverty level.
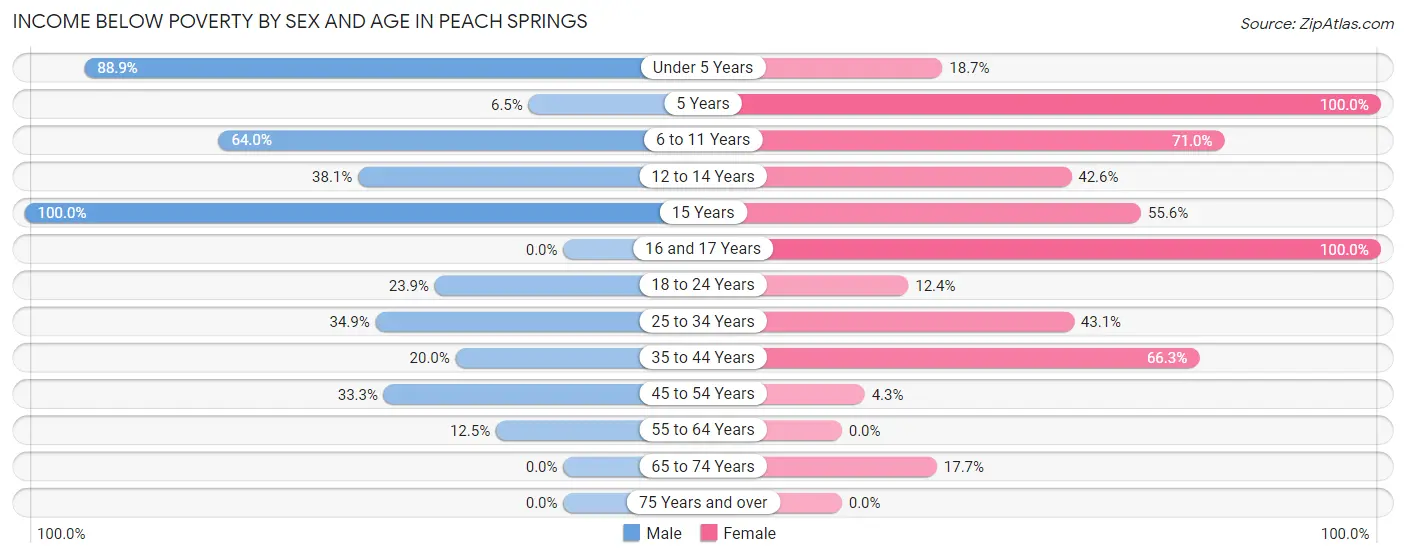
| Age Bracket | Male | Female |
| Under 5 Years | 56 (88.9%) | 14 (18.7%) |
| 5 Years | 2 (6.5%) | 7 (100.0%) |
| 6 to 11 Years | 112 (64.0%) | 71 (71.0%) |
| 12 to 14 Years | 16 (38.1%) | 23 (42.6%) |
| 15 Years | 16 (100.0%) | 5 (55.6%) |
| 16 and 17 Years | 0 (0.0%) | 5 (100.0%) |
| 18 to 24 Years | 26 (23.8%) | 10 (12.3%) |
| 25 to 34 Years | 38 (34.9%) | 56 (43.1%) |
| 35 to 44 Years | 6 (20.0%) | 59 (66.3%) |
| 45 to 54 Years | 19 (33.3%) | 4 (4.3%) |
| 55 to 64 Years | 2 (12.5%) | 0 (0.0%) |
| 65 to 74 Years | 0 (0.0%) | 6 (17.6%) |
| 75 Years and over | 0 (0.0%) | 0 (0.0%) |
| Total | 293 (40.0%) | 260 (36.6%) |
Income Above Poverty by Sex and Age in Peach Springs
According to the poverty statistics in Peach Springs, males aged 16 and 17 years and females aged 55 to 64 years are the age groups that are most secure financially, with 100.0% of males and 100.0% of females in these age groups living above the poverty line.
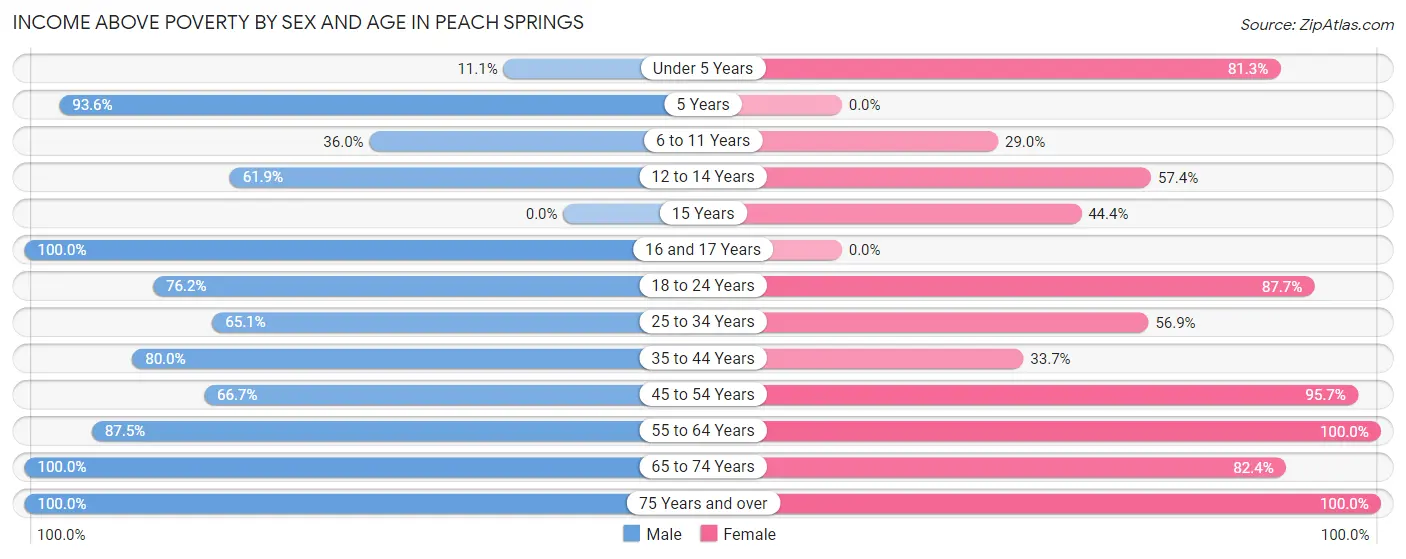
| Age Bracket | Male | Female |
| Under 5 Years | 7 (11.1%) | 61 (81.3%) |
| 5 Years | 29 (93.5%) | 0 (0.0%) |
| 6 to 11 Years | 63 (36.0%) | 29 (29.0%) |
| 12 to 14 Years | 26 (61.9%) | 31 (57.4%) |
| 15 Years | 0 (0.0%) | 4 (44.4%) |
| 16 and 17 Years | 57 (100.0%) | 0 (0.0%) |
| 18 to 24 Years | 83 (76.1%) | 71 (87.6%) |
| 25 to 34 Years | 71 (65.1%) | 74 (56.9%) |
| 35 to 44 Years | 24 (80.0%) | 30 (33.7%) |
| 45 to 54 Years | 38 (66.7%) | 90 (95.7%) |
| 55 to 64 Years | 14 (87.5%) | 22 (100.0%) |
| 65 to 74 Years | 21 (100.0%) | 28 (82.4%) |
| 75 Years and over | 7 (100.0%) | 10 (100.0%) |
| Total | 440 (60.0%) | 450 (63.4%) |
Income Below Poverty Among Married-Couple Families in Peach Springs
The poverty statistics for married-couple families in Peach Springs show that 22.1% or 28 of the total 127 families live below the poverty line. Families with 3 or 4 children have the highest poverty rate of 35.7%, comprising of 5 families. On the other hand, families with 5 or more children have the lowest poverty rate of 15.8%, which includes 3 families.
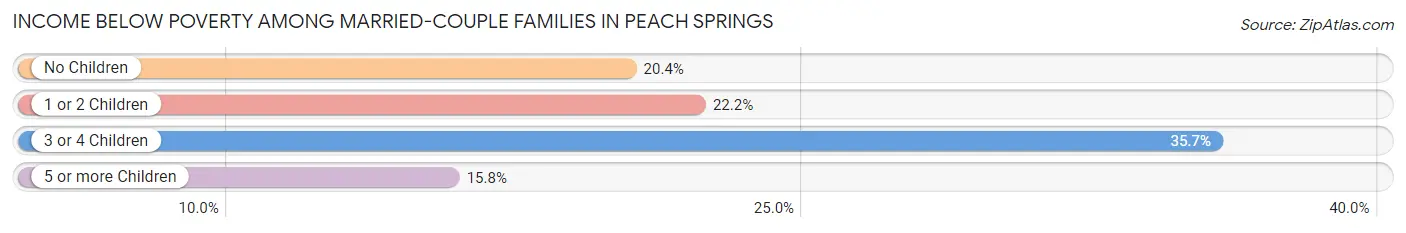
| Children | Above Poverty | Below Poverty |
| No Children | 39 (79.6%) | 10 (20.4%) |
| 1 or 2 Children | 35 (77.8%) | 10 (22.2%) |
| 3 or 4 Children | 9 (64.3%) | 5 (35.7%) |
| 5 or more Children | 16 (84.2%) | 3 (15.8%) |
| Total | 99 (77.9%) | 28 (22.1%) |
Income Below Poverty Among Single-Parent Households in Peach Springs
According to the poverty data in Peach Springs, 58.1% or 25 single-father households and 43.1% or 62 single-mother households are living below the poverty line. Among single-father households, those with 5 or more children have the highest poverty rate, with 25 households (100.0%) experiencing poverty. Likewise, among single-mother households, those with 3 or 4 children have the highest poverty rate, with 33 households (82.5%) falling below the poverty line.
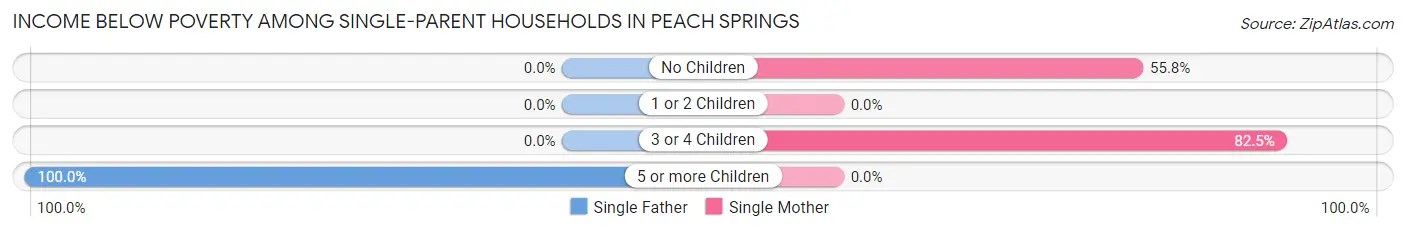
| Children | Single Father | Single Mother |
| No Children | 0 (0.0%) | 29 (55.8%) |
| 1 or 2 Children | 0 (0.0%) | 0 (0.0%) |
| 3 or 4 Children | 0 (0.0%) | 33 (82.5%) |
| 5 or more Children | 25 (100.0%) | 0 (0.0%) |
| Total | 25 (58.1%) | 62 (43.1%) |
Income Below Poverty Among Married-Couple vs Single-Parent Households in Peach Springs
The poverty data for Peach Springs shows that 28 of the married-couple family households (22.1%) and 87 of the single-parent households (46.5%) are living below the poverty level. Within the married-couple family households, those with 3 or 4 children have the highest poverty rate, with 5 households (35.7%) falling below the poverty line. Among the single-parent households, those with 5 or more children have the highest poverty rate, with 25 household (100.0%) living below poverty.
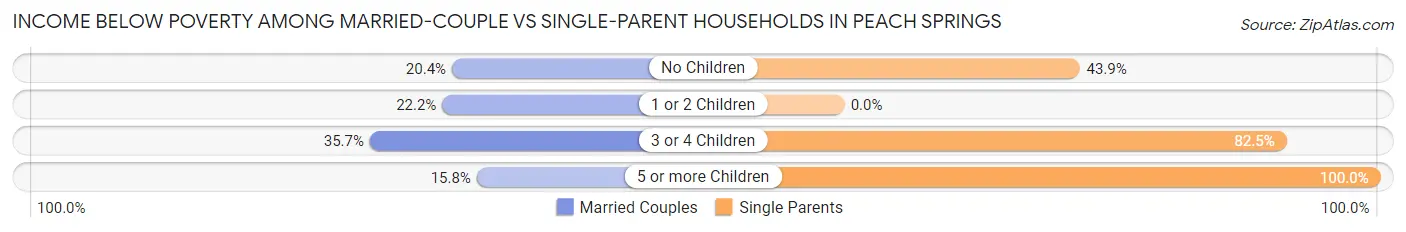
| Children | Married-Couple Families | Single-Parent Households |
| No Children | 10 (20.4%) | 29 (43.9%) |
| 1 or 2 Children | 10 (22.2%) | 0 (0.0%) |
| 3 or 4 Children | 5 (35.7%) | 33 (82.5%) |
| 5 or more Children | 3 (15.8%) | 25 (100.0%) |
| Total | 28 (22.1%) | 87 (46.5%) |
Race in Peach Springs
The most populous races in Peach Springs are Native / Alaskan (1,343 | 90.6%), Hispanic or Latino (271 | 18.3%), and Some other Race (106 | 7.1%).
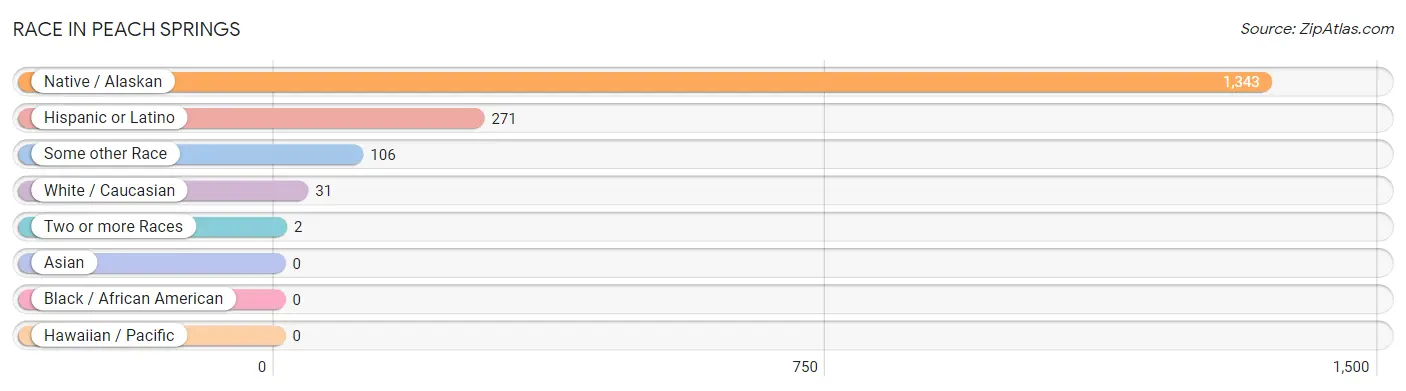
| Race | # Population | % Population |
| Asian | 0 | 0.0% |
| Black / African American | 0 | 0.0% |
| Hawaiian / Pacific | 0 | 0.0% |
| Hispanic or Latino | 271 | 18.3% |
| Native / Alaskan | 1,343 | 90.6% |
| White / Caucasian | 31 | 2.1% |
| Two or more Races | 2 | 0.1% |
| Some other Race | 106 | 7.1% |
| Total | 1,482 | 100.0% |
Ancestry in Peach Springs
The most populous ancestries reported in Peach Springs are Yuman (1,178 | 79.5%), Mexican (261 | 17.6%), Apache (41 | 2.8%), Paiute (38 | 2.6%), and Puerto Rican (9 | 0.6%), together accounting for 103.0% of all Peach Springs residents.
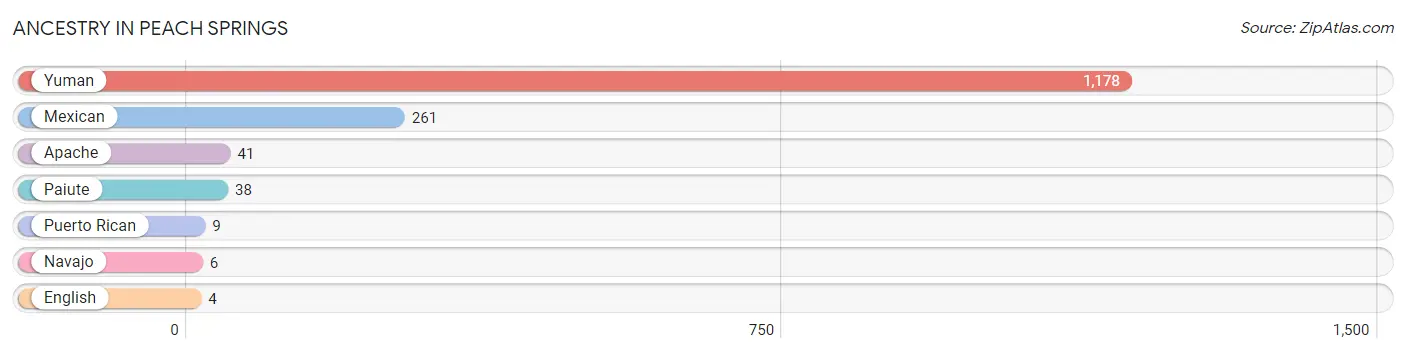
| Ancestry | # Population | % Population |
| Apache | 41 | 2.8% |
| English | 4 | 0.3% |
| Mexican | 261 | 17.6% |
| Navajo | 6 | 0.4% |
| Paiute | 38 | 2.6% |
| Puerto Rican | 9 | 0.6% |
| Yuman | 1,178 | 79.5% | View All 7 Rows |
Immigrants in Peach Springs
The most numerous immigrant groups reported in Peach Springs came from Central America (22 | 1.5%), Latin America (22 | 1.5%), and Mexico (22 | 1.5%), together accounting for 4.4% of all Peach Springs residents.
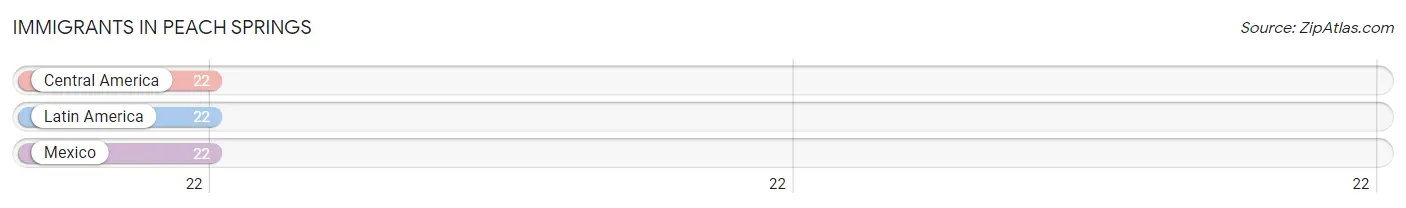
| Immigration Origin | # Population | % Population |
| Central America | 22 | 1.5% |
| Latin America | 22 | 1.5% |
| Mexico | 22 | 1.5% | View All 3 Rows |
Sex and Age in Peach Springs
Sex and Age in Peach Springs
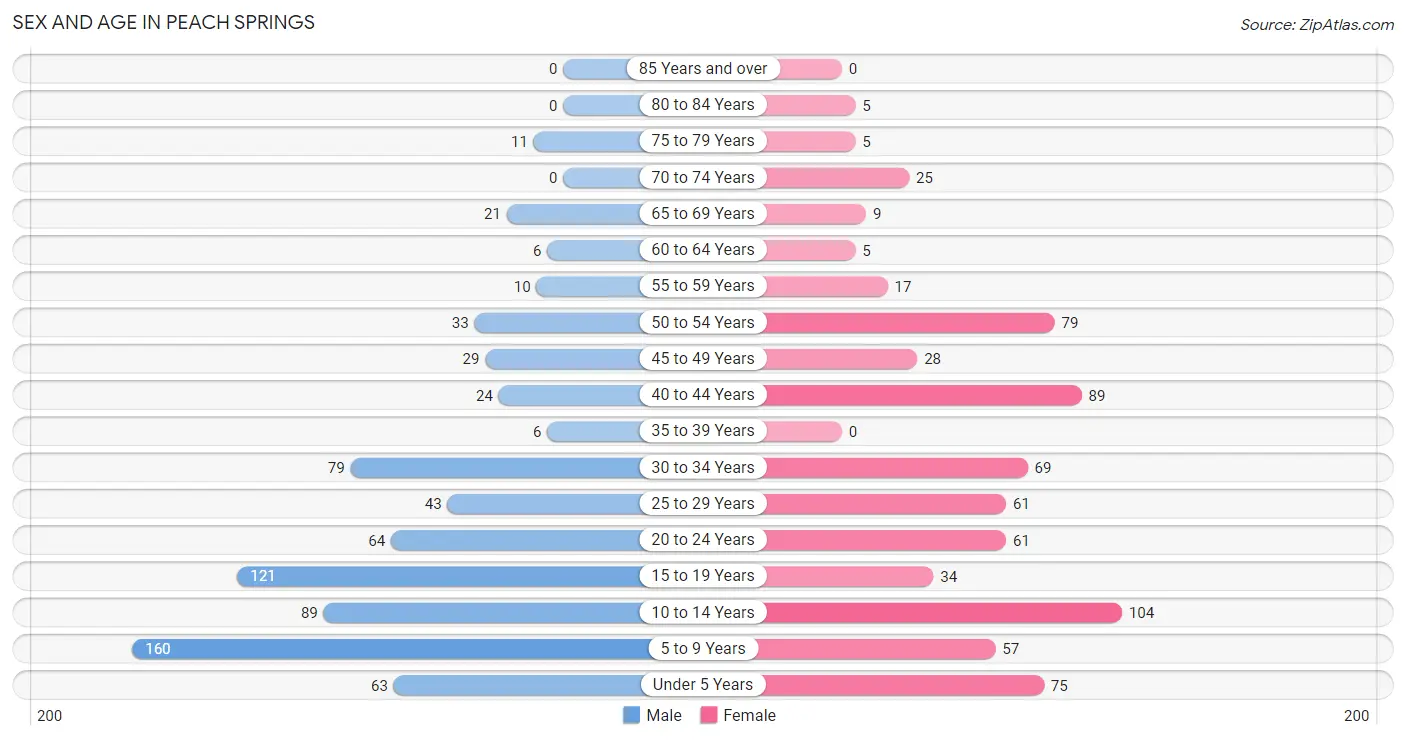
The most populous age groups in Peach Springs are 5 to 9 Years (160 | 21.1%) for men and 10 to 14 Years (104 | 14.4%) for women.
| Age Bracket | Male | Female |
| Under 5 Years | 63 (8.3%) | 75 (10.4%) |
| 5 to 9 Years | 160 (21.1%) | 57 (7.9%) |
| 10 to 14 Years | 89 (11.7%) | 104 (14.4%) |
| 15 to 19 Years | 121 (15.9%) | 34 (4.7%) |
| 20 to 24 Years | 64 (8.4%) | 61 (8.4%) |
| 25 to 29 Years | 43 (5.7%) | 61 (8.4%) |
| 30 to 34 Years | 79 (10.4%) | 69 (9.5%) |
| 35 to 39 Years | 6 (0.8%) | 0 (0.0%) |
| 40 to 44 Years | 24 (3.2%) | 89 (12.3%) |
| 45 to 49 Years | 29 (3.8%) | 28 (3.9%) |
| 50 to 54 Years | 33 (4.3%) | 79 (10.9%) |
| 55 to 59 Years | 10 (1.3%) | 17 (2.4%) |
| 60 to 64 Years | 6 (0.8%) | 5 (0.7%) |
| 65 to 69 Years | 21 (2.8%) | 9 (1.2%) |
| 70 to 74 Years | 0 (0.0%) | 25 (3.5%) |
| 75 to 79 Years | 11 (1.5%) | 5 (0.7%) |
| 80 to 84 Years | 0 (0.0%) | 5 (0.7%) |
| 85 Years and over | 0 (0.0%) | 0 (0.0%) |
| Total | 759 (100.0%) | 723 (100.0%) |
Families and Households in Peach Springs
Median Family Size in Peach Springs
The median family size in Peach Springs is 4.45 persons per family, with married-couple families (127 | 40.5%) accounting for the largest median family size of 4.92 persons per family. On the other hand, single male/father families (43 | 13.7%) represent the smallest median family size with 3.72 persons per family.
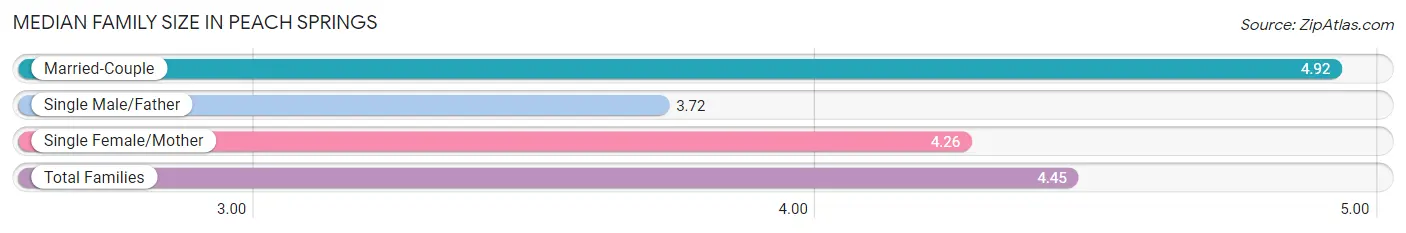
| Family Type | # Families | Family Size |
| Married-Couple | 127 (40.5%) | 4.92 |
| Single Male/Father | 43 (13.7%) | 3.72 |
| Single Female/Mother | 144 (45.9%) | 4.26 |
| Total Families | 314 (100.0%) | 4.45 |
Median Household Size in Peach Springs
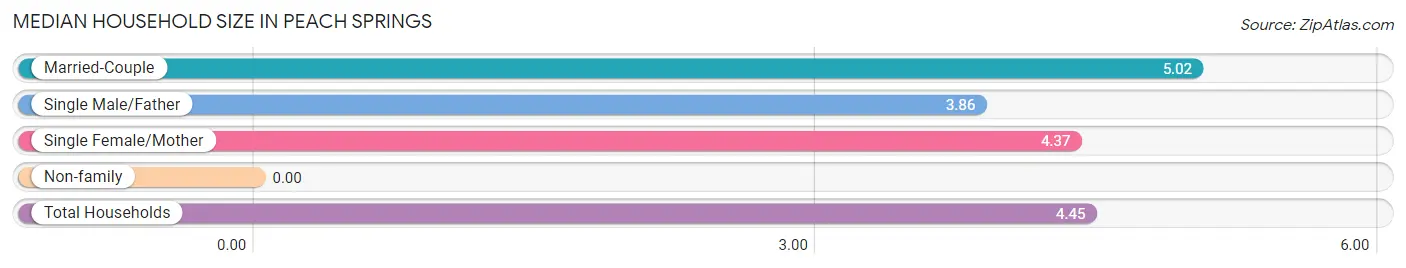
| Household Type | # Households | Household Size |
| Married-Couple | 127 (39.2%) | 5.02 |
| Single Male/Father | 43 (13.3%) | 3.86 |
| Single Female/Mother | 144 (44.4%) | 4.37 |
| Non-family | 10 (3.1%) | - |
| Total Households | 324 (100.0%) | 4.45 |
Household Size by Marriage Status in Peach Springs
Out of a total of 324 households in Peach Springs, 314 (96.9%) are family households, while 10 (3.1%) are nonfamily households. The most numerous type of family households are 3-person households, comprising 80, and the most common type of nonfamily households are 1-person households, comprising 10.
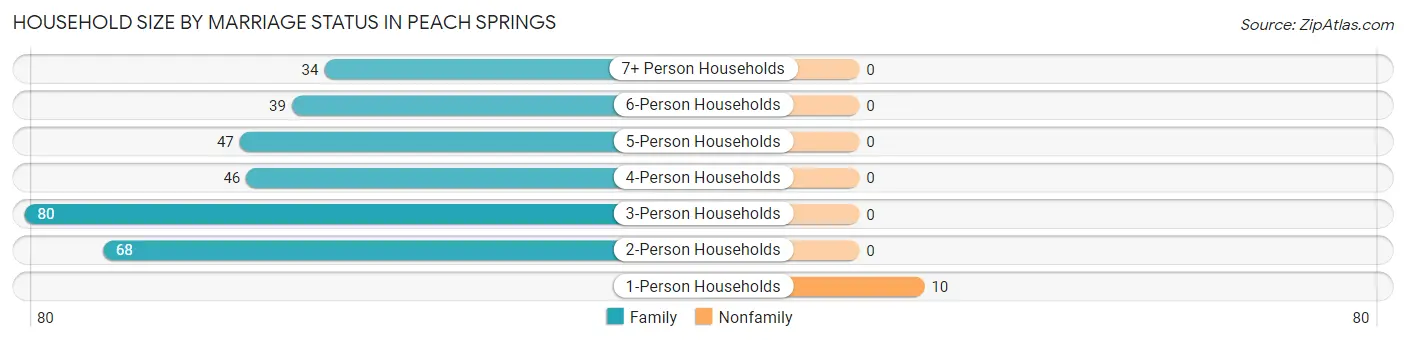
| Household Size | Family Households | Nonfamily Households |
| 1-Person Households | - | 10 (3.1%) |
| 2-Person Households | 68 (21.0%) | 0 (0.0%) |
| 3-Person Households | 80 (24.7%) | 0 (0.0%) |
| 4-Person Households | 46 (14.2%) | 0 (0.0%) |
| 5-Person Households | 47 (14.5%) | 0 (0.0%) |
| 6-Person Households | 39 (12.0%) | 0 (0.0%) |
| 7+ Person Households | 34 (10.5%) | 0 (0.0%) |
| Total | 314 (96.9%) | 10 (3.1%) |
Female Fertility in Peach Springs
Fertility by Age in Peach Springs
Average fertility rate in Peach Springs is 26.0 births per 1,000 women. Women in the age bracket of 20 to 34 years have the highest fertility rate with 47.0 births per 1,000 women. Women in the age bracket of 20 to 34 years acount for 100.0% of all women with births.
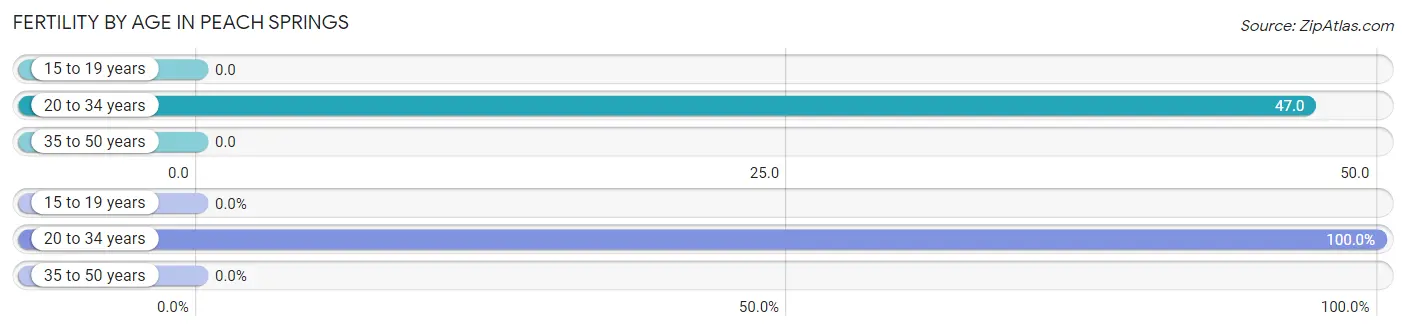
| Age Bracket | Women with Births | Births / 1,000 Women |
| 15 to 19 years | 0 (0.0%) | 0.0 |
| 20 to 34 years | 9 (100.0%) | 47.0 |
| 35 to 50 years | 0 (0.0%) | 0.0 |
| Total | 9 (100.0%) | 26.0 |
Fertility by Age by Marriage Status in Peach Springs
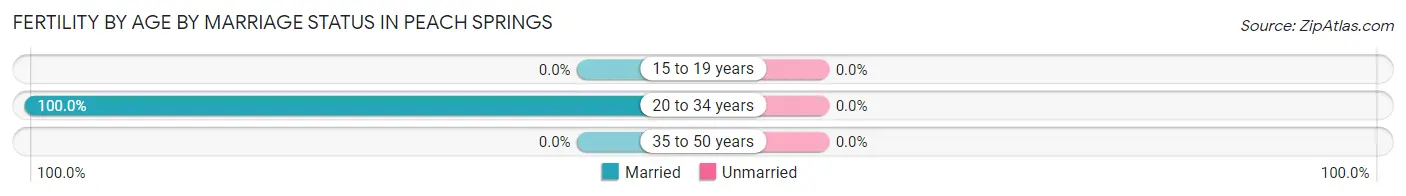
| Age Bracket | Married | Unmarried |
| 15 to 19 years | 0 (0.0%) | 0 (0.0%) |
| 20 to 34 years | 9 (100.0%) | 0 (0.0%) |
| 35 to 50 years | 0 (0.0%) | 0 (0.0%) |
| Total | 9 (100.0%) | 0 (0.0%) |
Fertility by Education in Peach Springs
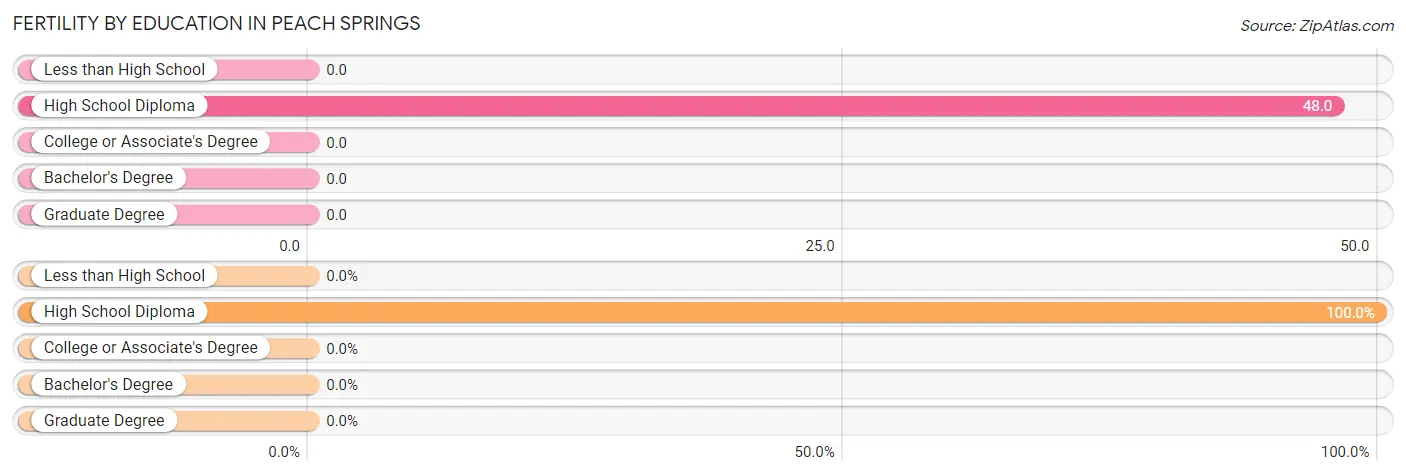
| Educational Attainment | Women with Births | Births / 1,000 Women |
| Less than High School | 0 (0.0%) | 0.0 |
| High School Diploma | 9 (100.0%) | 48.0 |
| College or Associate's Degree | 0 (0.0%) | 0.0 |
| Bachelor's Degree | 0 (0.0%) | 0.0 |
| Graduate Degree | 0 (0.0%) | 0.0 |
| Total | 9 (100.0%) | 26.0 |
Fertility by Education by Marriage Status in Peach Springs
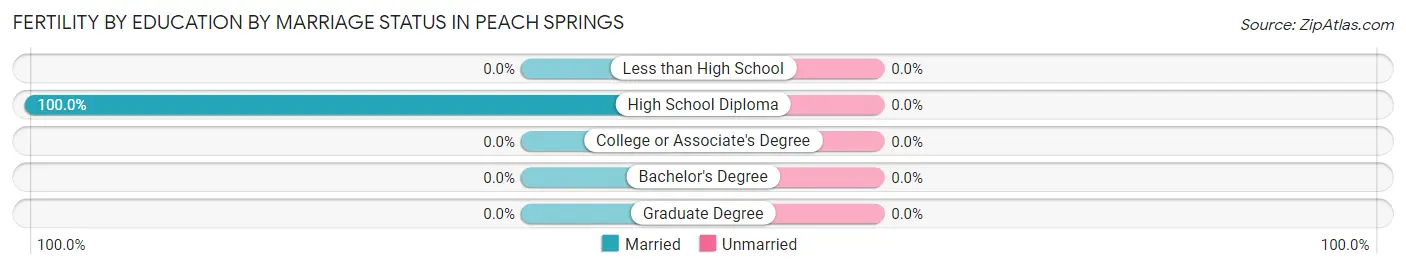
| Educational Attainment | Married | Unmarried |
| Less than High School | 0 (0.0%) | 0 (0.0%) |
| High School Diploma | 9 (100.0%) | 0 (0.0%) |
| College or Associate's Degree | 0 (0.0%) | 0 (0.0%) |
| Bachelor's Degree | 0 (0.0%) | 0 (0.0%) |
| Graduate Degree | 0 (0.0%) | 0 (0.0%) |
| Total | 9 (100.0%) | 0 (0.0%) |
Employment Characteristics in Peach Springs
Employment by Class of Employer in Peach Springs
Among the 412 employed individuals in Peach Springs, local government employees (279 | 67.7%), private company employees (88 | 21.4%), and federal government employees (31 | 7.5%) make up the most common classes of employment.
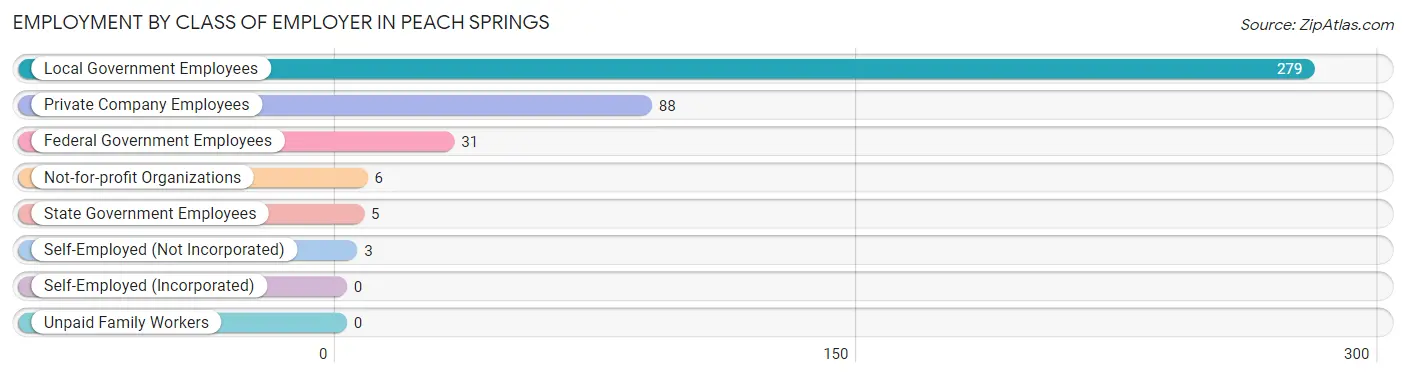
| Employer Class | # Employees | % Employees |
| Private Company Employees | 88 | 21.4% |
| Self-Employed (Incorporated) | 0 | 0.0% |
| Self-Employed (Not Incorporated) | 3 | 0.7% |
| Not-for-profit Organizations | 6 | 1.5% |
| Local Government Employees | 279 | 67.7% |
| State Government Employees | 5 | 1.2% |
| Federal Government Employees | 31 | 7.5% |
| Unpaid Family Workers | 0 | 0.0% |
| Total | 412 | 100.0% |
Employment Status by Age in Peach Springs
According to the labor force statistics for Peach Springs, out of the total population over 16 years of age (907), 55.9% or 507 individuals are in the labor force, with 18.7% or 95 of them unemployed. The age group with the highest labor force participation rate is 60 to 64 years, with 100.0% or 11 individuals in the labor force. Within the labor force, the 16 to 19 years age range has the highest percentage of unemployed individuals, with 100.0% or 10 of them being unemployed.
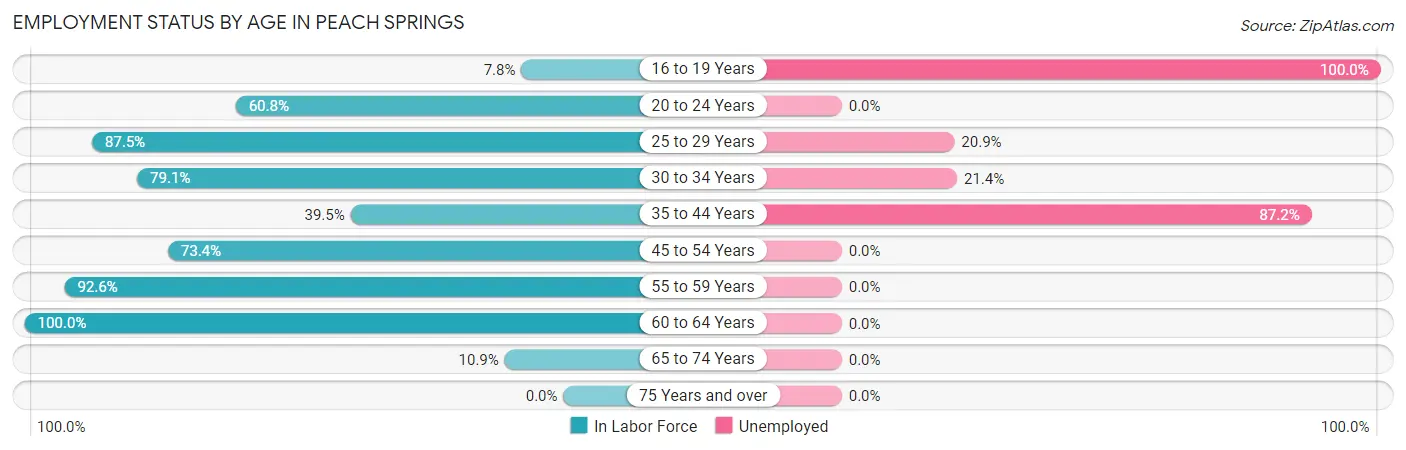
| Age Bracket | In Labor Force | Unemployed |
| 16 to 19 Years | 10 (7.8%) | 10 (100.0%) |
| 20 to 24 Years | 76 (60.8%) | 0 (0.0%) |
| 25 to 29 Years | 91 (87.5%) | 19 (20.9%) |
| 30 to 34 Years | 117 (79.1%) | 25 (21.4%) |
| 35 to 44 Years | 47 (39.5%) | 41 (87.2%) |
| 45 to 54 Years | 124 (73.4%) | 0 (0.0%) |
| 55 to 59 Years | 25 (92.6%) | 0 (0.0%) |
| 60 to 64 Years | 11 (100.0%) | 0 (0.0%) |
| 65 to 74 Years | 6 (10.9%) | 0 (0.0%) |
| 75 Years and over | 0 (0.0%) | 0 (0.0%) |
| Total | 507 (55.9%) | 95 (18.7%) |
Employment Status by Educational Attainment in Peach Springs
According to labor force statistics for Peach Springs, 71.8% of individuals (415) out of the total population between 25 and 64 years of age (578) are in the labor force, with 20.5% or 85 of them being unemployed. The group with the highest labor force participation rate are those with the educational attainment of college / associate degree, with 82.3% or 163 individuals in the labor force. Within the labor force, individuals with less than high school education have the highest percentage of unemployment, with 32.1% or 25 of them being unemployed.
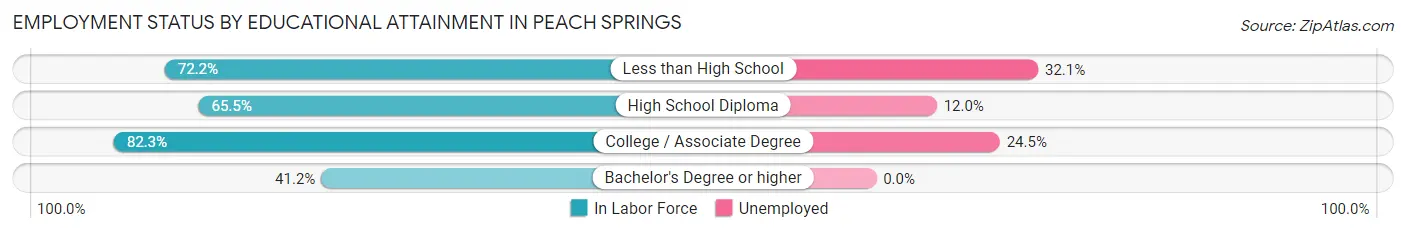
| Educational Attainment | In Labor Force | Unemployed |
| Less than High School | 78 (72.2%) | 35 (32.1%) |
| High School Diploma | 167 (65.5%) | 31 (12.0%) |
| College / Associate Degree | 163 (82.3%) | 49 (24.5%) |
| Bachelor's Degree or higher | 7 (41.2%) | 0 (0.0%) |
| Total | 415 (71.8%) | 118 (20.5%) |
Employment Occupations by Sex in Peach Springs
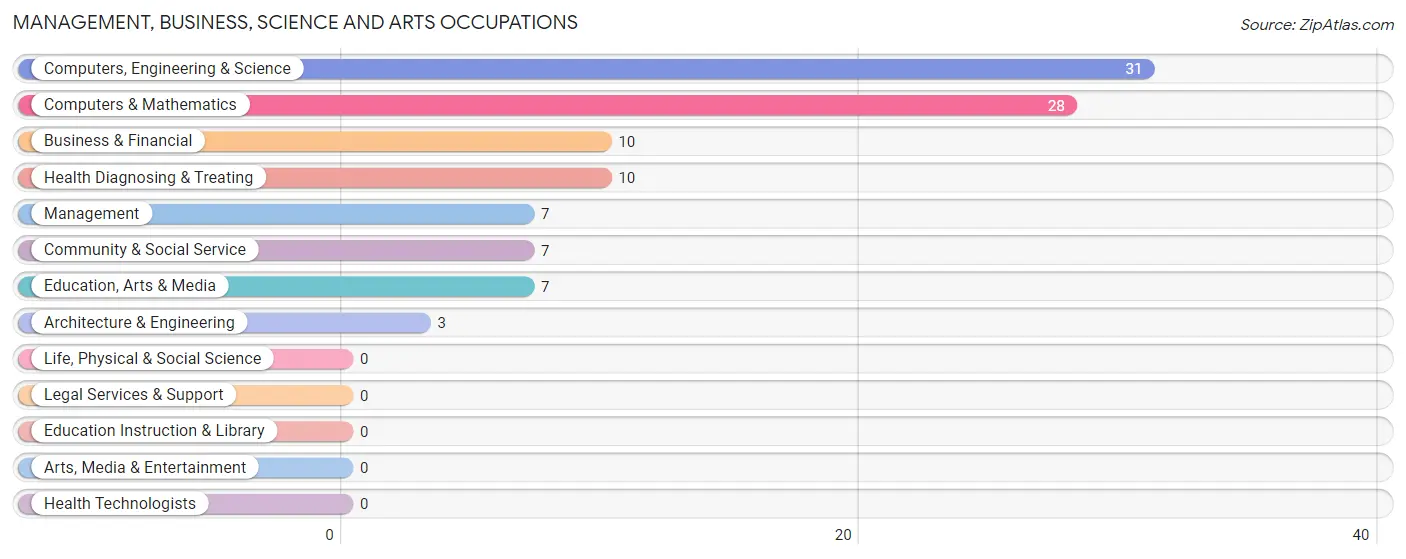
Management, Business, Science and Arts Occupations
The most common Management, Business, Science and Arts occupations in Peach Springs are Computers, Engineering & Science (31 | 7.5%), Computers & Mathematics (28 | 6.8%), Business & Financial (10 | 2.4%), Health Diagnosing & Treating (10 | 2.4%), and Management (7 | 1.7%).
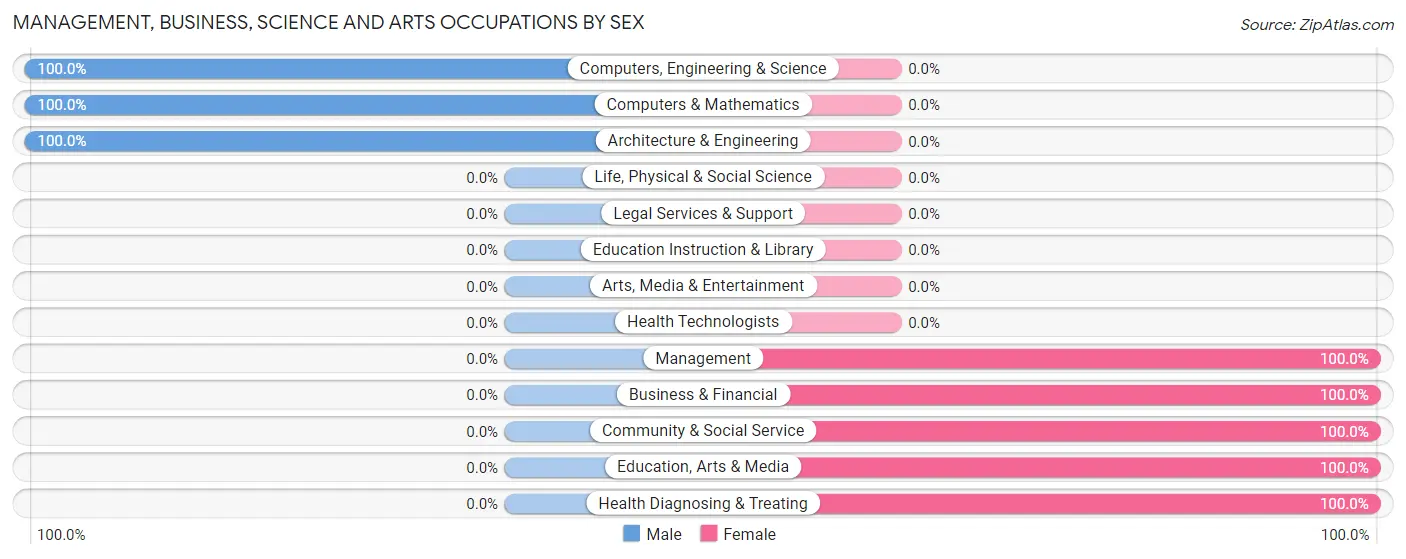
Management, Business, Science and Arts Occupations by Sex
Within the Management, Business, Science and Arts occupations in Peach Springs, the most male-oriented occupations are Computers, Engineering & Science (100.0%), Computers & Mathematics (100.0%), and Architecture & Engineering (100.0%), while the most female-oriented occupations are Management (100.0%), Business & Financial (100.0%), and Community & Social Service (100.0%).
| Occupation | Male | Female |
| Management | 0 (0.0%) | 7 (100.0%) |
| Business & Financial | 0 (0.0%) | 10 (100.0%) |
| Computers, Engineering & Science | 31 (100.0%) | 0 (0.0%) |
| Computers & Mathematics | 28 (100.0%) | 0 (0.0%) |
| Architecture & Engineering | 3 (100.0%) | 0 (0.0%) |
| Life, Physical & Social Science | 0 (0.0%) | 0 (0.0%) |
| Community & Social Service | 0 (0.0%) | 7 (100.0%) |
| Education, Arts & Media | 0 (0.0%) | 7 (100.0%) |
| Legal Services & Support | 0 (0.0%) | 0 (0.0%) |
| Education Instruction & Library | 0 (0.0%) | 0 (0.0%) |
| Arts, Media & Entertainment | 0 (0.0%) | 0 (0.0%) |
| Health Diagnosing & Treating | 0 (0.0%) | 10 (100.0%) |
| Health Technologists | 0 (0.0%) | 0 (0.0%) |
| Total (Category) | 31 (47.7%) | 34 (52.3%) |
| Total (Overall) | 194 (47.1%) | 218 (52.9%) |
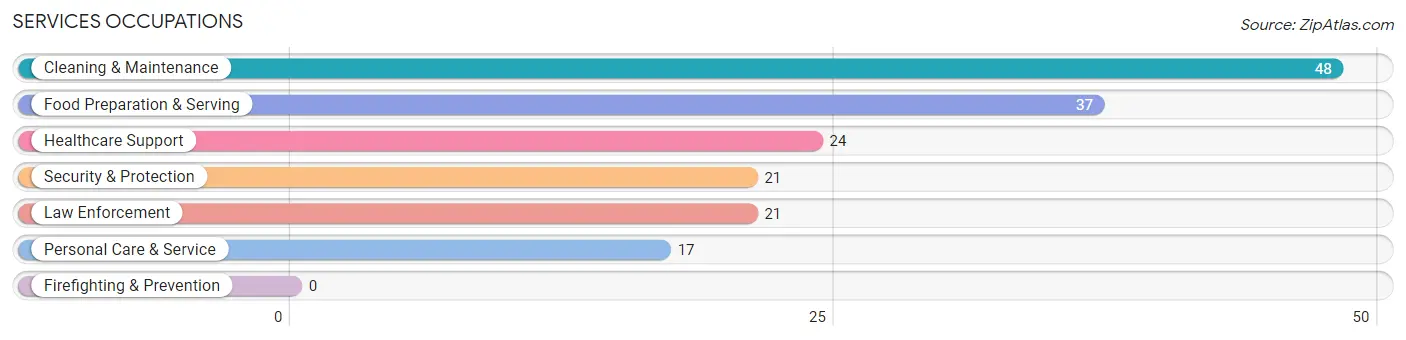
Services Occupations
The most common Services occupations in Peach Springs are Cleaning & Maintenance (48 | 11.7%), Food Preparation & Serving (37 | 9.0%), Healthcare Support (24 | 5.8%), Security & Protection (21 | 5.1%), and Law Enforcement (21 | 5.1%).
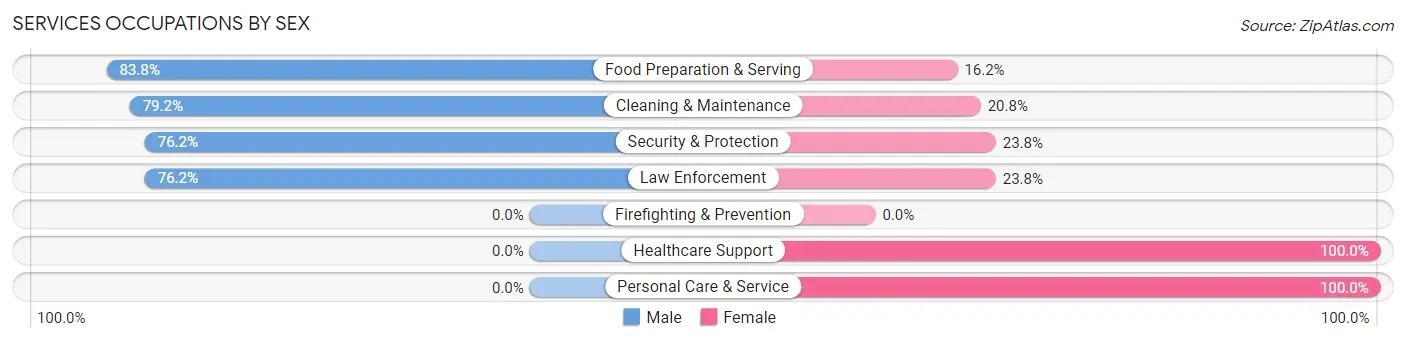
Services Occupations by Sex
Within the Services occupations in Peach Springs, the most male-oriented occupations are Food Preparation & Serving (83.8%), Cleaning & Maintenance (79.2%), and Security & Protection (76.2%), while the most female-oriented occupations are Healthcare Support (100.0%), Personal Care & Service (100.0%), and Security & Protection (23.8%).
| Occupation | Male | Female |
| Healthcare Support | 0 (0.0%) | 24 (100.0%) |
| Security & Protection | 16 (76.2%) | 5 (23.8%) |
| Firefighting & Prevention | 0 (0.0%) | 0 (0.0%) |
| Law Enforcement | 16 (76.2%) | 5 (23.8%) |
| Food Preparation & Serving | 31 (83.8%) | 6 (16.2%) |
| Cleaning & Maintenance | 38 (79.2%) | 10 (20.8%) |
| Personal Care & Service | 0 (0.0%) | 17 (100.0%) |
| Total (Category) | 85 (57.8%) | 62 (42.2%) |
| Total (Overall) | 194 (47.1%) | 218 (52.9%) |
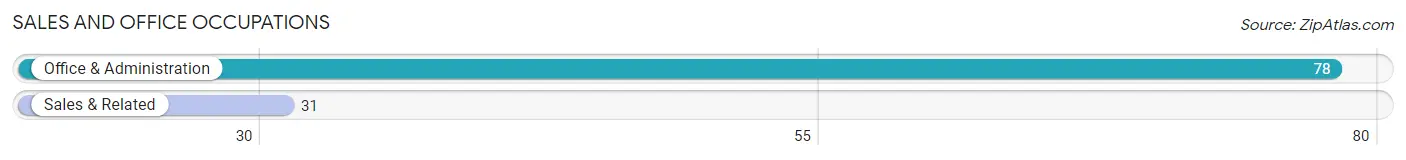
Sales and Office Occupations
The most common Sales and Office occupations in Peach Springs are Office & Administration (78 | 18.9%), and Sales & Related (31 | 7.5%).
Sales and Office Occupations by Sex
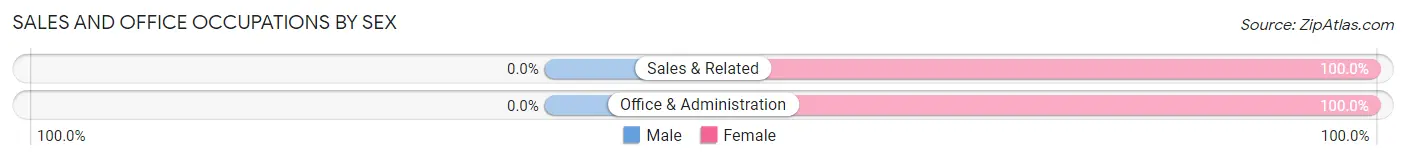
| Occupation | Male | Female |
| Sales & Related | 0 (0.0%) | 31 (100.0%) |
| Office & Administration | 0 (0.0%) | 78 (100.0%) |
| Total (Category) | 0 (0.0%) | 109 (100.0%) |
| Total (Overall) | 194 (47.1%) | 218 (52.9%) |
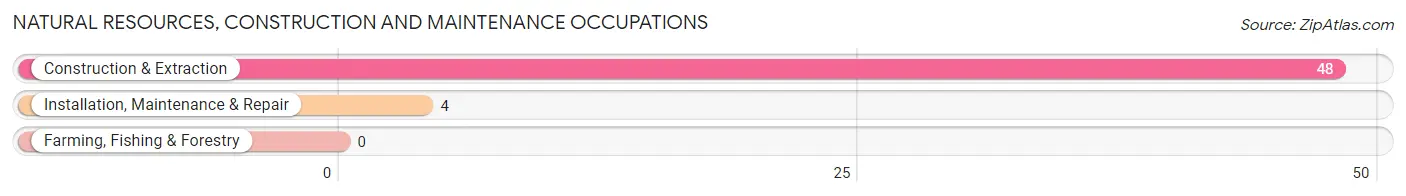
Natural Resources, Construction and Maintenance Occupations
The most common Natural Resources, Construction and Maintenance occupations in Peach Springs are Construction & Extraction (48 | 11.7%), and Installation, Maintenance & Repair (4 | 1.0%).
Natural Resources, Construction and Maintenance Occupations by Sex
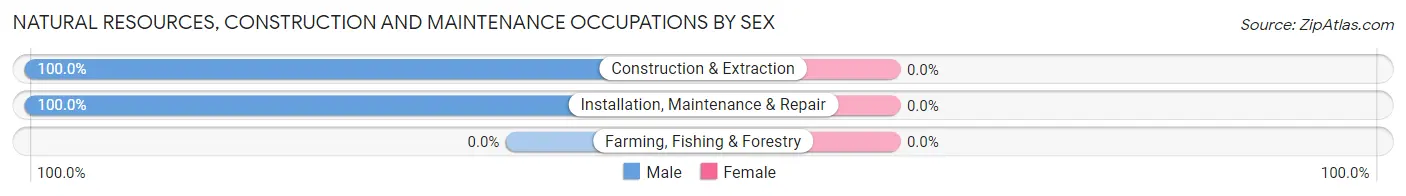
| Occupation | Male | Female |
| Farming, Fishing & Forestry | 0 (0.0%) | 0 (0.0%) |
| Construction & Extraction | 48 (100.0%) | 0 (0.0%) |
| Installation, Maintenance & Repair | 4 (100.0%) | 0 (0.0%) |
| Total (Category) | 52 (100.0%) | 0 (0.0%) |
| Total (Overall) | 194 (47.1%) | 218 (52.9%) |
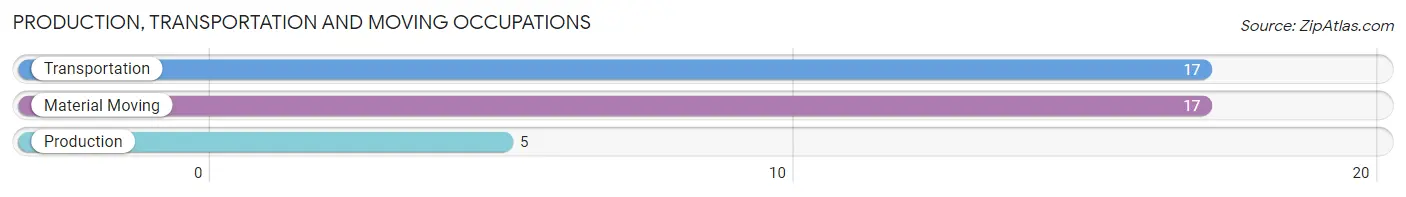
Production, Transportation and Moving Occupations
The most common Production, Transportation and Moving occupations in Peach Springs are Transportation (17 | 4.1%), Material Moving (17 | 4.1%), and Production (5 | 1.2%).
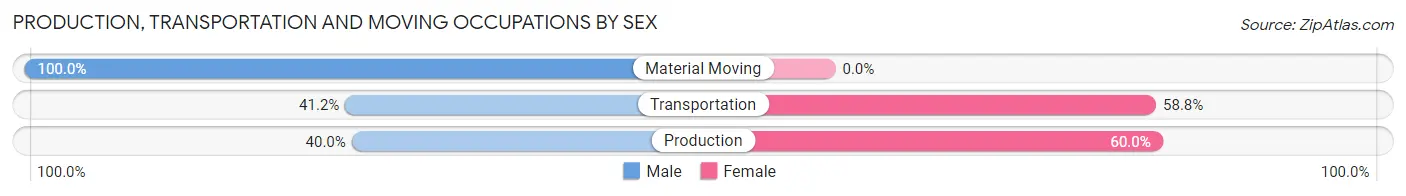
Production, Transportation and Moving Occupations by Sex
| Occupation | Male | Female |
| Production | 2 (40.0%) | 3 (60.0%) |
| Transportation | 7 (41.2%) | 10 (58.8%) |
| Material Moving | 17 (100.0%) | 0 (0.0%) |
| Total (Category) | 26 (66.7%) | 13 (33.3%) |
| Total (Overall) | 194 (47.1%) | 218 (52.9%) |
Employment Industries by Sex in Peach Springs
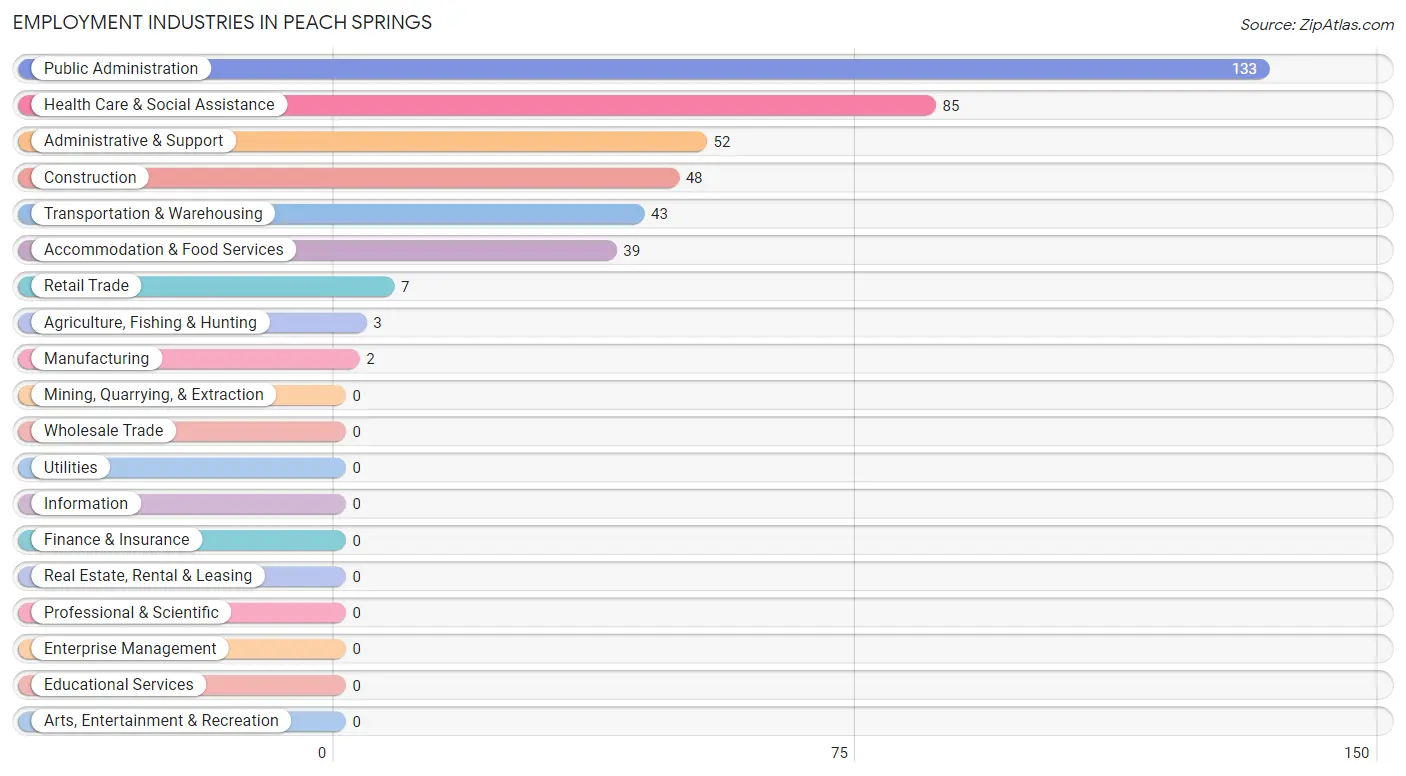
Employment Industries in Peach Springs
The major employment industries in Peach Springs include Public Administration (133 | 32.3%), Health Care & Social Assistance (85 | 20.6%), Administrative & Support (52 | 12.6%), Construction (48 | 11.7%), and Transportation & Warehousing (43 | 10.4%).
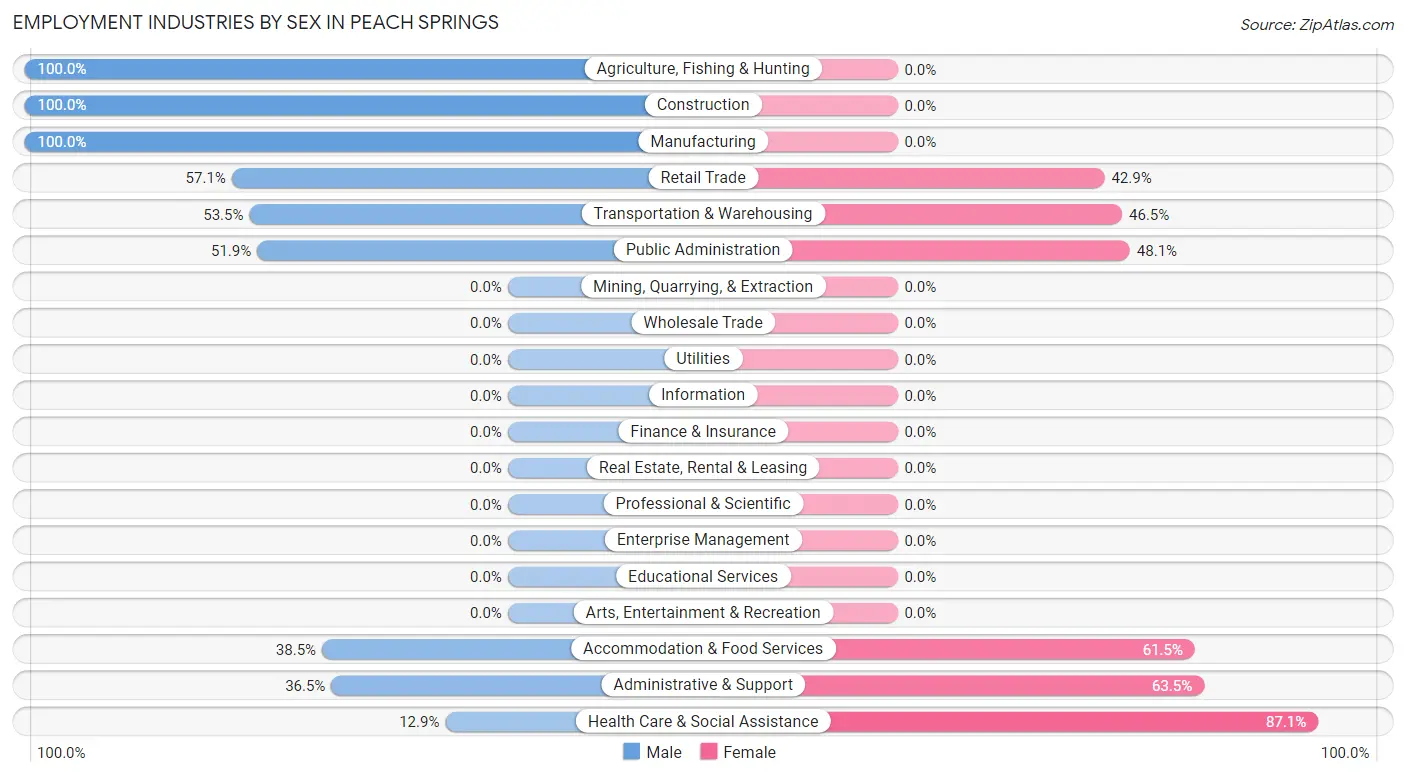
Employment Industries by Sex in Peach Springs
The Peach Springs industries that see more men than women are Agriculture, Fishing & Hunting (100.0%), Construction (100.0%), and Manufacturing (100.0%), whereas the industries that tend to have a higher number of women are Health Care & Social Assistance (87.1%), Administrative & Support (63.5%), and Accommodation & Food Services (61.5%).
| Industry | Male | Female |
| Agriculture, Fishing & Hunting | 3 (100.0%) | 0 (0.0%) |
| Mining, Quarrying, & Extraction | 0 (0.0%) | 0 (0.0%) |
| Construction | 48 (100.0%) | 0 (0.0%) |
| Manufacturing | 2 (100.0%) | 0 (0.0%) |
| Wholesale Trade | 0 (0.0%) | 0 (0.0%) |
| Retail Trade | 4 (57.1%) | 3 (42.9%) |
| Transportation & Warehousing | 23 (53.5%) | 20 (46.5%) |
| Utilities | 0 (0.0%) | 0 (0.0%) |
| Information | 0 (0.0%) | 0 (0.0%) |
| Finance & Insurance | 0 (0.0%) | 0 (0.0%) |
| Real Estate, Rental & Leasing | 0 (0.0%) | 0 (0.0%) |
| Professional & Scientific | 0 (0.0%) | 0 (0.0%) |
| Enterprise Management | 0 (0.0%) | 0 (0.0%) |
| Administrative & Support | 19 (36.5%) | 33 (63.5%) |
| Educational Services | 0 (0.0%) | 0 (0.0%) |
| Health Care & Social Assistance | 11 (12.9%) | 74 (87.1%) |
| Arts, Entertainment & Recreation | 0 (0.0%) | 0 (0.0%) |
| Accommodation & Food Services | 15 (38.5%) | 24 (61.5%) |
| Public Administration | 69 (51.9%) | 64 (48.1%) |
| Total | 194 (47.1%) | 218 (52.9%) |
Education in Peach Springs
School Enrollment in Peach Springs
The most common levels of schooling among the 652 students in Peach Springs are elementary school (161 | 24.7%), high school (161 | 24.7%), and middle school (151 | 23.2%).
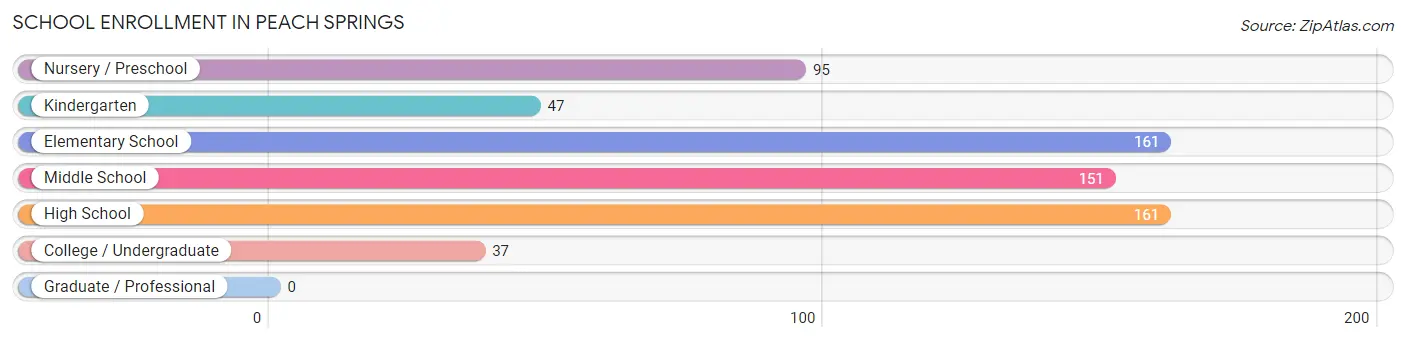
| School Level | # Students | % Students |
| Nursery / Preschool | 95 | 14.6% |
| Kindergarten | 47 | 7.2% |
| Elementary School | 161 | 24.7% |
| Middle School | 151 | 23.2% |
| High School | 161 | 24.7% |
| College / Undergraduate | 37 | 5.7% |
| Graduate / Professional | 0 | 0.0% |
| Total | 652 | 100.0% |
School Enrollment by Age by Funding Source in Peach Springs
Out of a total of 652 students who are enrolled in schools in Peach Springs, 113 (17.3%) attend a private institution, while the remaining 539 (82.7%) are enrolled in public schools. The age group of 20 to 24 year olds has the highest likelihood of being enrolled in private schools, with 9 (100.0% in the age bracket) enrolled. Conversely, the age group of 3 to 4 year olds has the lowest likelihood of being enrolled in a private school, with 70 (100.0% in the age bracket) attending a public institution.
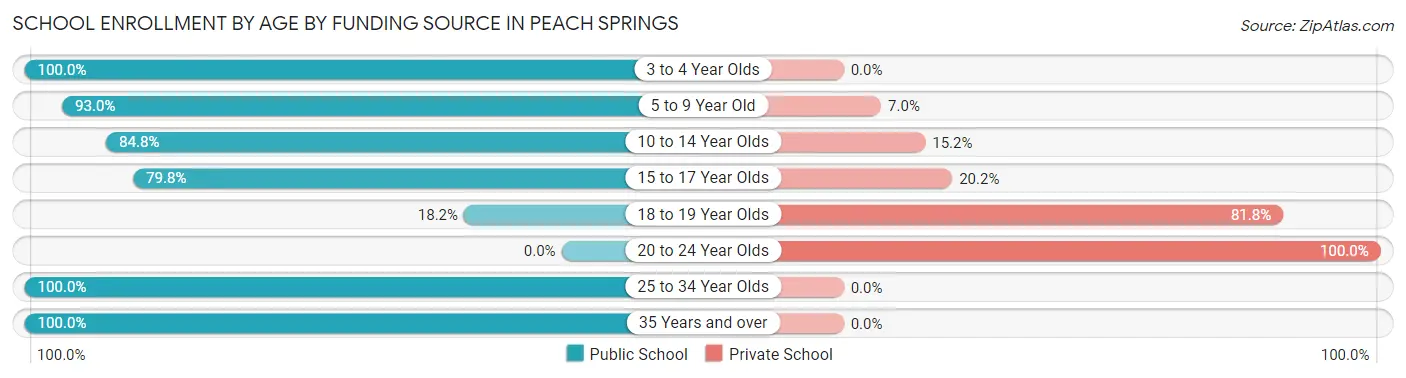
| Age Bracket | Public School | Private School |
| 3 to 4 Year Olds | 70 (100.0%) | 0 (0.0%) |
| 5 to 9 Year Old | 200 (93.0%) | 15 (7.0%) |
| 10 to 14 Year Olds | 145 (84.8%) | 26 (15.2%) |
| 15 to 17 Year Olds | 71 (79.8%) | 18 (20.2%) |
| 18 to 19 Year Olds | 10 (18.2%) | 45 (81.8%) |
| 20 to 24 Year Olds | 0 (0.0%) | 9 (100.0%) |
| 25 to 34 Year Olds | 37 (100.0%) | 0 (0.0%) |
| 35 Years and over | 6 (100.0%) | 0 (0.0%) |
| Total | 539 (82.7%) | 113 (17.3%) |
Educational Attainment by Field of Study in Peach Springs
Social sciences (7 | 30.4%), computers & mathematics (5 | 21.7%), education (5 | 21.7%), bio, nature & agricultural (3 | 13.0%), and science & technology (3 | 13.0%) are the most common fields of study among 23 individuals in Peach Springs who have obtained a bachelor's degree or higher.
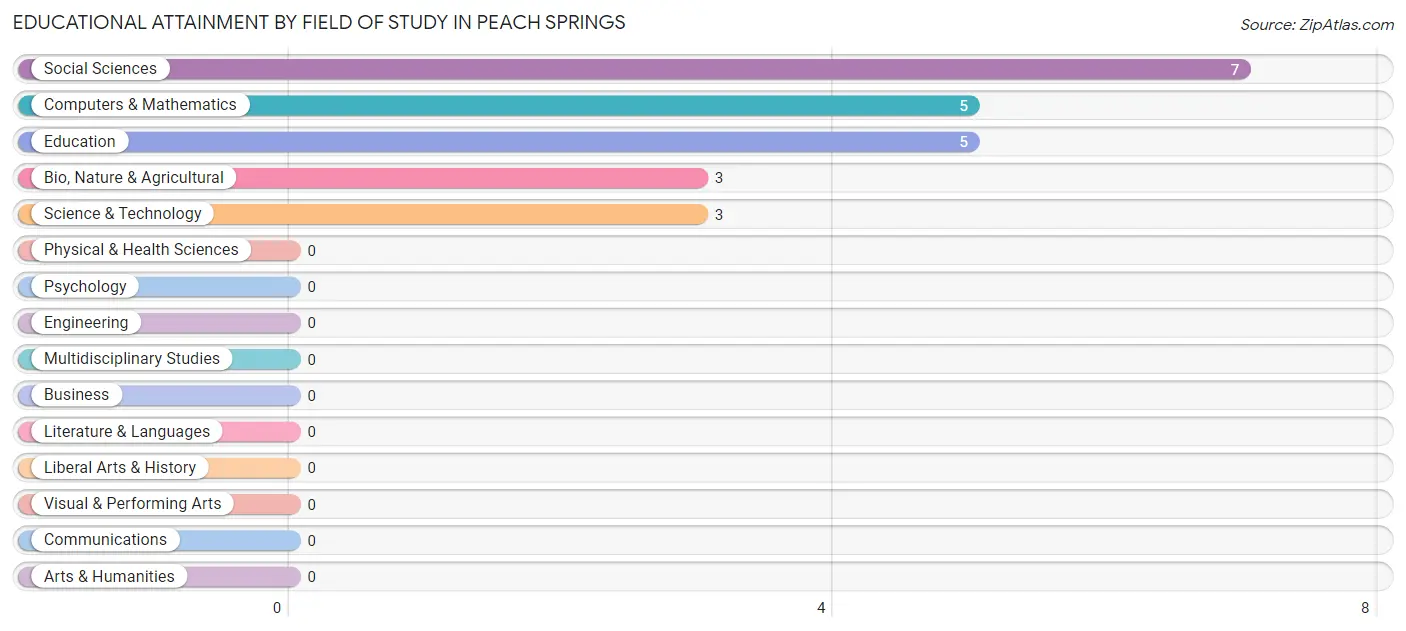
| Field of Study | # Graduates | % Graduates |
| Computers & Mathematics | 5 | 21.7% |
| Bio, Nature & Agricultural | 3 | 13.0% |
| Physical & Health Sciences | 0 | 0.0% |
| Psychology | 0 | 0.0% |
| Social Sciences | 7 | 30.4% |
| Engineering | 0 | 0.0% |
| Multidisciplinary Studies | 0 | 0.0% |
| Science & Technology | 3 | 13.0% |
| Business | 0 | 0.0% |
| Education | 5 | 21.7% |
| Literature & Languages | 0 | 0.0% |
| Liberal Arts & History | 0 | 0.0% |
| Visual & Performing Arts | 0 | 0.0% |
| Communications | 0 | 0.0% |
| Arts & Humanities | 0 | 0.0% |
| Total | 23 | 100.0% |
Transportation & Commute in Peach Springs
Vehicle Availability by Sex in Peach Springs
The most prevalent vehicle ownership categories in Peach Springs are males with 1 vehicle (65, accounting for 33.5%) and females with 1 vehicle (86, making up 29.8%).
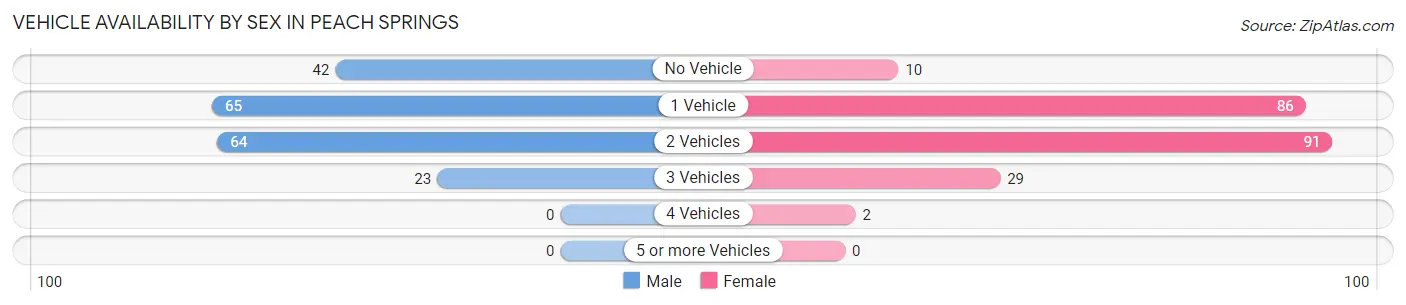
| Vehicles Available | Male | Female |
| No Vehicle | 42 (21.6%) | 10 (4.6%) |
| 1 Vehicle | 65 (33.5%) | 86 (39.5%) |
| 2 Vehicles | 64 (33.0%) | 91 (41.7%) |
| 3 Vehicles | 23 (11.9%) | 29 (13.3%) |
| 4 Vehicles | 0 (0.0%) | 2 (0.9%) |
| 5 or more Vehicles | 0 (0.0%) | 0 (0.0%) |
| Total | 194 (100.0%) | 218 (100.0%) |
Commute Time in Peach Springs
The most frequently occuring commute durations in Peach Springs are 5 to 9 minutes (137 commuters, 33.7%), 90 or more minutes (101 commuters, 24.8%), and less than 5 minutes (99 commuters, 24.3%).
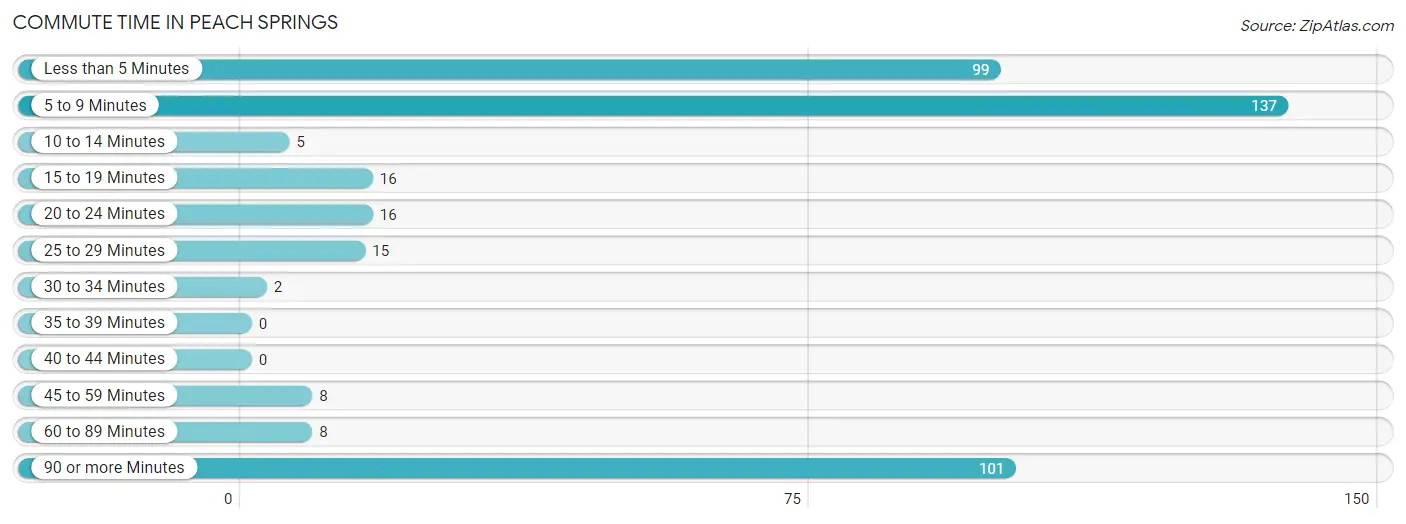
| Commute Time | # Commuters | % Commuters |
| Less than 5 Minutes | 99 | 24.3% |
| 5 to 9 Minutes | 137 | 33.7% |
| 10 to 14 Minutes | 5 | 1.2% |
| 15 to 19 Minutes | 16 | 3.9% |
| 20 to 24 Minutes | 16 | 3.9% |
| 25 to 29 Minutes | 15 | 3.7% |
| 30 to 34 Minutes | 2 | 0.5% |
| 35 to 39 Minutes | 0 | 0.0% |
| 40 to 44 Minutes | 0 | 0.0% |
| 45 to 59 Minutes | 8 | 2.0% |
| 60 to 89 Minutes | 8 | 2.0% |
| 90 or more Minutes | 101 | 24.8% |
Commute Time by Sex in Peach Springs
The most common commute times in Peach Springs are 90 or more minutes (53 commuters, 27.3%) for males and 5 to 9 minutes (94 commuters, 44.1%) for females.
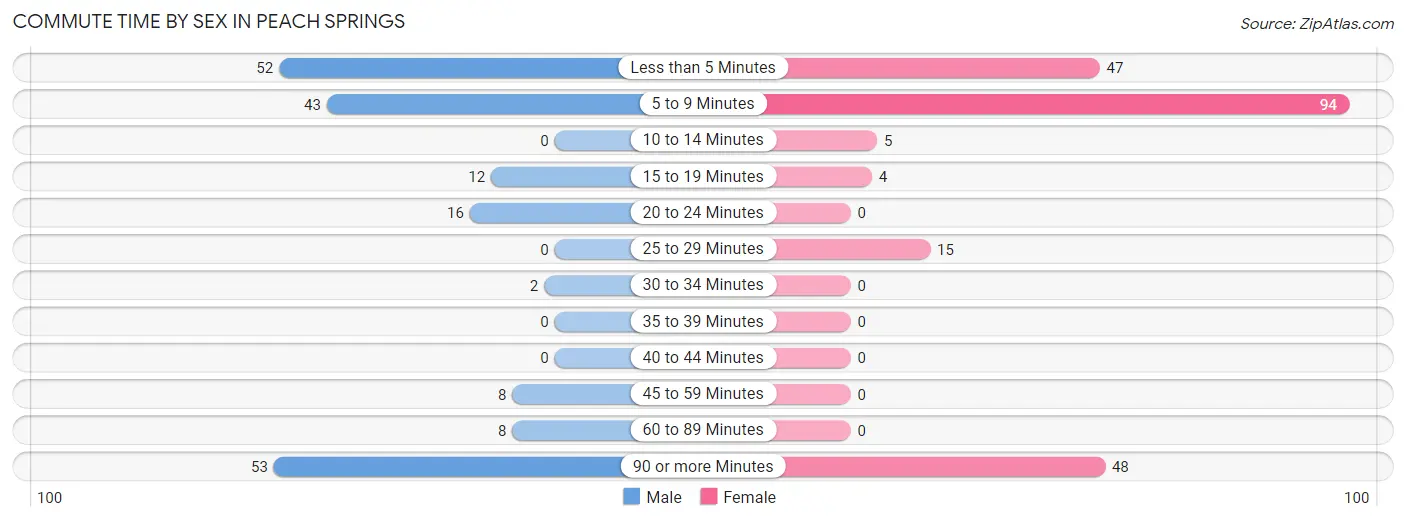
| Commute Time | Male | Female |
| Less than 5 Minutes | 52 (26.8%) | 47 (22.1%) |
| 5 to 9 Minutes | 43 (22.2%) | 94 (44.1%) |
| 10 to 14 Minutes | 0 (0.0%) | 5 (2.4%) |
| 15 to 19 Minutes | 12 (6.2%) | 4 (1.9%) |
| 20 to 24 Minutes | 16 (8.3%) | 0 (0.0%) |
| 25 to 29 Minutes | 0 (0.0%) | 15 (7.0%) |
| 30 to 34 Minutes | 2 (1.0%) | 0 (0.0%) |
| 35 to 39 Minutes | 0 (0.0%) | 0 (0.0%) |
| 40 to 44 Minutes | 0 (0.0%) | 0 (0.0%) |
| 45 to 59 Minutes | 8 (4.1%) | 0 (0.0%) |
| 60 to 89 Minutes | 8 (4.1%) | 0 (0.0%) |
| 90 or more Minutes | 53 (27.3%) | 48 (22.5%) |
Time of Departure to Work by Sex in Peach Springs
The most frequent times of departure to work in Peach Springs are 7:00 AM to 7:29 AM (48, 24.7%) for males and 6:30 AM to 6:59 AM (52, 24.4%) for females.
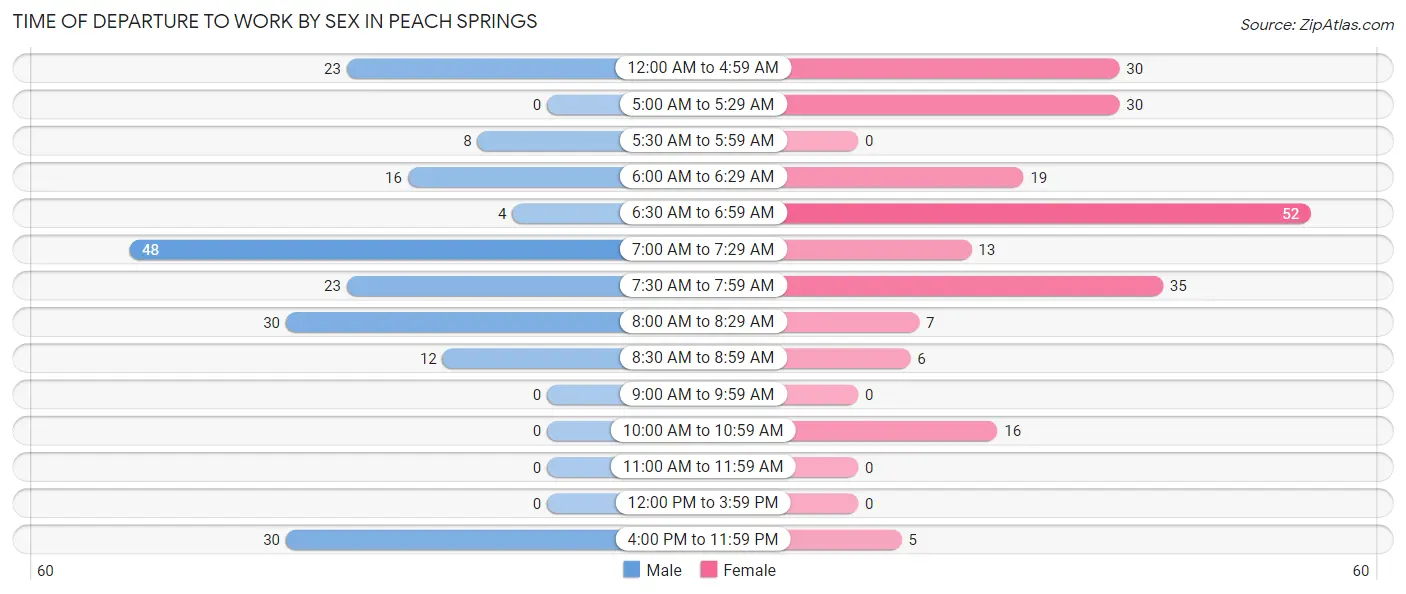
| Time of Departure | Male | Female |
| 12:00 AM to 4:59 AM | 23 (11.9%) | 30 (14.1%) |
| 5:00 AM to 5:29 AM | 0 (0.0%) | 30 (14.1%) |
| 5:30 AM to 5:59 AM | 8 (4.1%) | 0 (0.0%) |
| 6:00 AM to 6:29 AM | 16 (8.3%) | 19 (8.9%) |
| 6:30 AM to 6:59 AM | 4 (2.1%) | 52 (24.4%) |
| 7:00 AM to 7:29 AM | 48 (24.7%) | 13 (6.1%) |
| 7:30 AM to 7:59 AM | 23 (11.9%) | 35 (16.4%) |
| 8:00 AM to 8:29 AM | 30 (15.5%) | 7 (3.3%) |
| 8:30 AM to 8:59 AM | 12 (6.2%) | 6 (2.8%) |
| 9:00 AM to 9:59 AM | 0 (0.0%) | 0 (0.0%) |
| 10:00 AM to 10:59 AM | 0 (0.0%) | 16 (7.5%) |
| 11:00 AM to 11:59 AM | 0 (0.0%) | 0 (0.0%) |
| 12:00 PM to 3:59 PM | 0 (0.0%) | 0 (0.0%) |
| 4:00 PM to 11:59 PM | 30 (15.5%) | 5 (2.4%) |
| Total | 194 (100.0%) | 213 (100.0%) |
Housing Occupancy in Peach Springs
Occupancy by Ownership in Peach Springs
Of the total 324 dwellings in Peach Springs, owner-occupied units account for 121 (37.3%), while renter-occupied units make up 203 (62.6%).
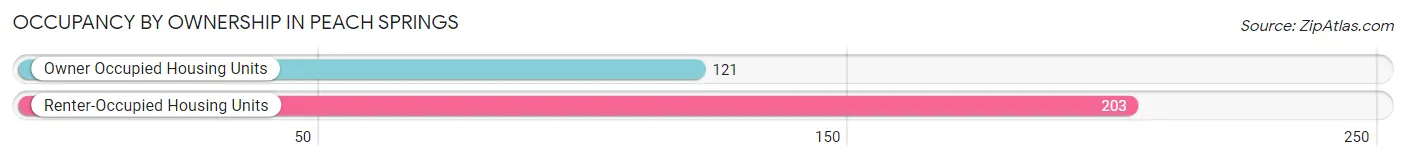
| Occupancy | # Housing Units | % Housing Units |
| Owner Occupied Housing Units | 121 | 37.3% |
| Renter-Occupied Housing Units | 203 | 62.6% |
| Total Occupied Housing Units | 324 | 100.0% |
Occupancy by Household Size in Peach Springs
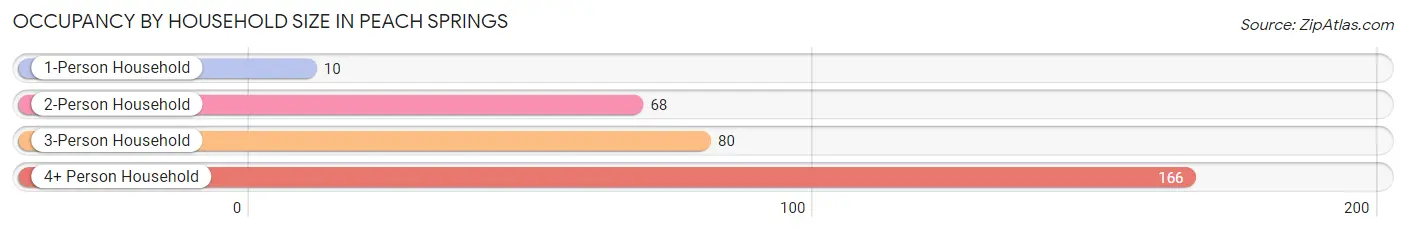
| Household Size | # Housing Units | % Housing Units |
| 1-Person Household | 10 | 3.1% |
| 2-Person Household | 68 | 21.0% |
| 3-Person Household | 80 | 24.7% |
| 4+ Person Household | 166 | 51.2% |
| Total Housing Units | 324 | 100.0% |
Occupancy by Ownership by Household Size in Peach Springs
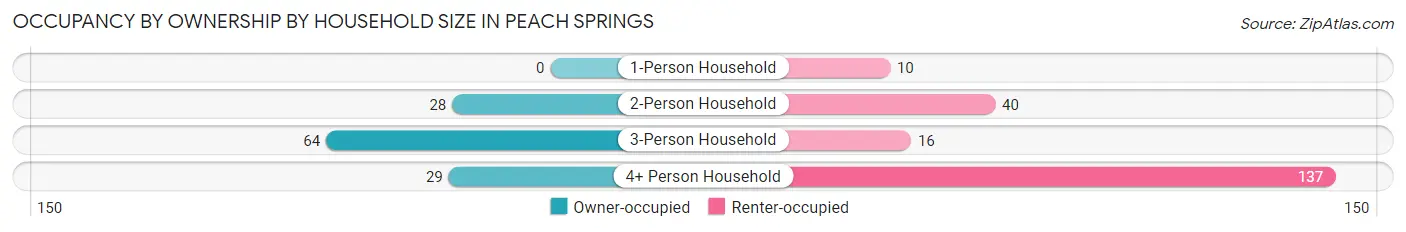
| Household Size | Owner-occupied | Renter-occupied |
| 1-Person Household | 0 (0.0%) | 10 (100.0%) |
| 2-Person Household | 28 (41.2%) | 40 (58.8%) |
| 3-Person Household | 64 (80.0%) | 16 (20.0%) |
| 4+ Person Household | 29 (17.5%) | 137 (82.5%) |
| Total Housing Units | 121 (37.3%) | 203 (62.6%) |
Occupancy by Educational Attainment in Peach Springs
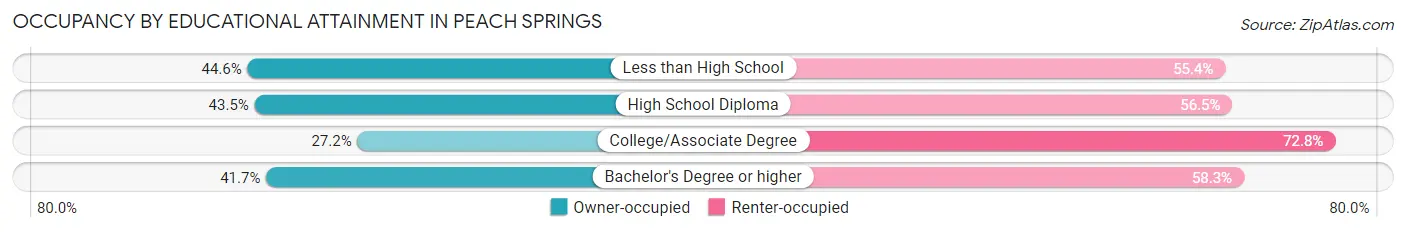
| Household Size | Owner-occupied | Renter-occupied |
| Less than High School | 25 (44.6%) | 31 (55.4%) |
| High School Diploma | 57 (43.5%) | 74 (56.5%) |
| College/Associate Degree | 34 (27.2%) | 91 (72.8%) |
| Bachelor's Degree or higher | 5 (41.7%) | 7 (58.3%) |
Occupancy by Age of Householder in Peach Springs
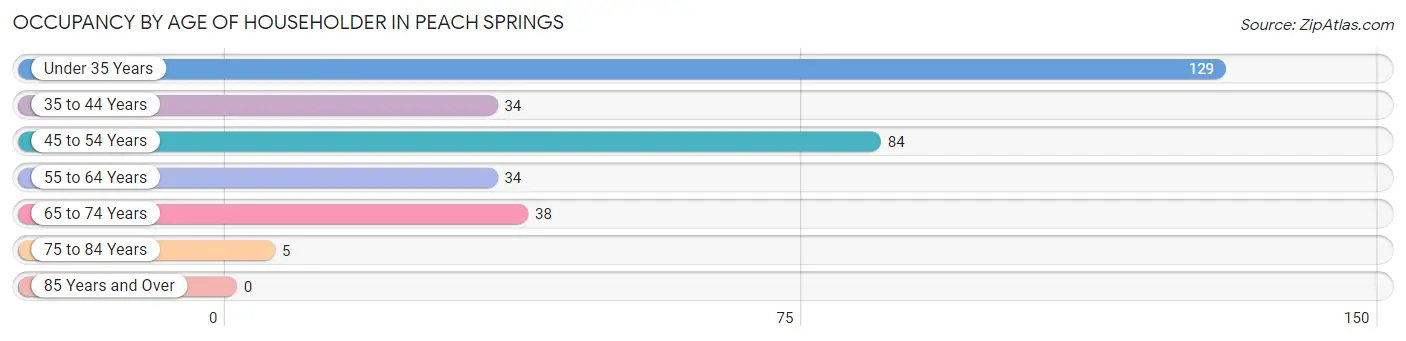
| Age Bracket | # Households | % Households |
| Under 35 Years | 129 | 39.8% |
| 35 to 44 Years | 34 | 10.5% |
| 45 to 54 Years | 84 | 25.9% |
| 55 to 64 Years | 34 | 10.5% |
| 65 to 74 Years | 38 | 11.7% |
| 75 to 84 Years | 5 | 1.5% |
| 85 Years and Over | 0 | 0.0% |
| Total | 324 | 100.0% |
Housing Finances in Peach Springs
Median Income by Occupancy in Peach Springs
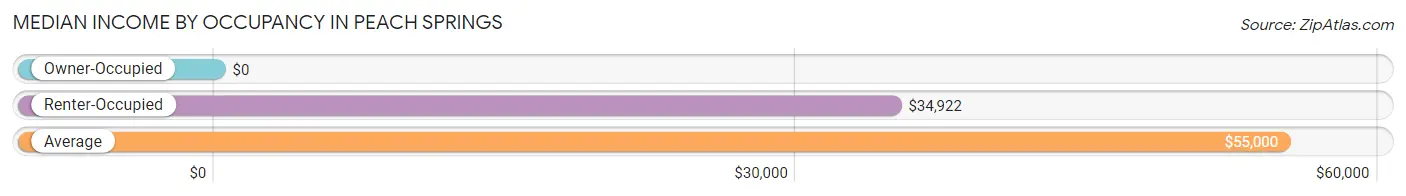
| Occupancy Type | # Households | Median Income |
| Owner-Occupied | 121 (37.3%) | $0 |
| Renter-Occupied | 203 (62.6%) | $34,922 |
| Average | 324 (100.0%) | $55,000 |
Occupancy by Householder Income Bracket in Peach Springs
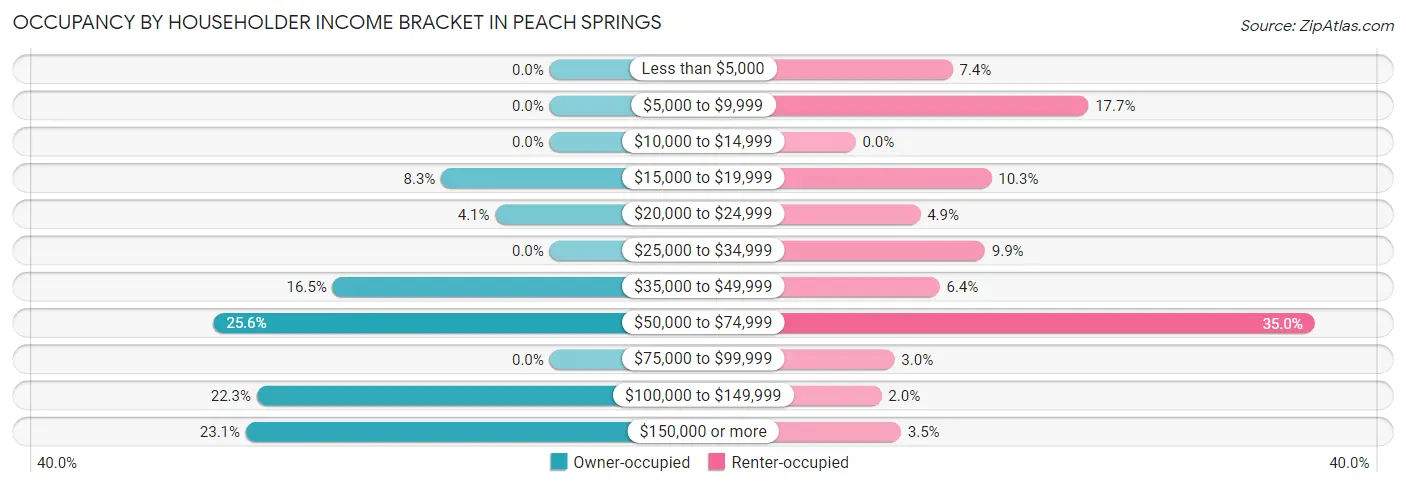
| Income Bracket | Owner-occupied | Renter-occupied |
| Less than $5,000 | 0 (0.0%) | 15 (7.4%) |
| $5,000 to $9,999 | 0 (0.0%) | 36 (17.7%) |
| $10,000 to $14,999 | 0 (0.0%) | 0 (0.0%) |
| $15,000 to $19,999 | 10 (8.3%) | 21 (10.3%) |
| $20,000 to $24,999 | 5 (4.1%) | 10 (4.9%) |
| $25,000 to $34,999 | 0 (0.0%) | 20 (9.9%) |
| $35,000 to $49,999 | 20 (16.5%) | 13 (6.4%) |
| $50,000 to $74,999 | 31 (25.6%) | 71 (35.0%) |
| $75,000 to $99,999 | 0 (0.0%) | 6 (3.0%) |
| $100,000 to $149,999 | 27 (22.3%) | 4 (2.0%) |
| $150,000 or more | 28 (23.1%) | 7 (3.5%) |
| Total | 121 (100.0%) | 203 (100.0%) |
Monthly Housing Cost Tiers in Peach Springs
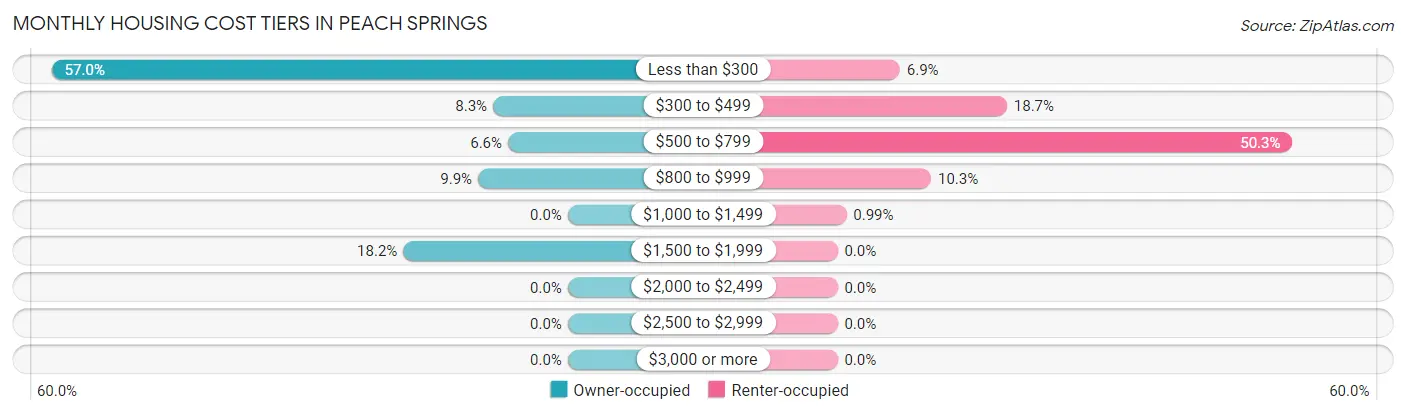
| Monthly Cost | Owner-occupied | Renter-occupied |
| Less than $300 | 69 (57.0%) | 14 (6.9%) |
| $300 to $499 | 10 (8.3%) | 38 (18.7%) |
| $500 to $799 | 8 (6.6%) | 102 (50.2%) |
| $800 to $999 | 12 (9.9%) | 21 (10.3%) |
| $1,000 to $1,499 | 0 (0.0%) | 2 (1.0%) |
| $1,500 to $1,999 | 22 (18.2%) | 0 (0.0%) |
| $2,000 to $2,499 | 0 (0.0%) | 0 (0.0%) |
| $2,500 to $2,999 | 0 (0.0%) | 0 (0.0%) |
| $3,000 or more | 0 (0.0%) | 0 (0.0%) |
| Total | 121 (100.0%) | 203 (100.0%) |
Physical Housing Characteristics in Peach Springs
Housing Structures in Peach Springs
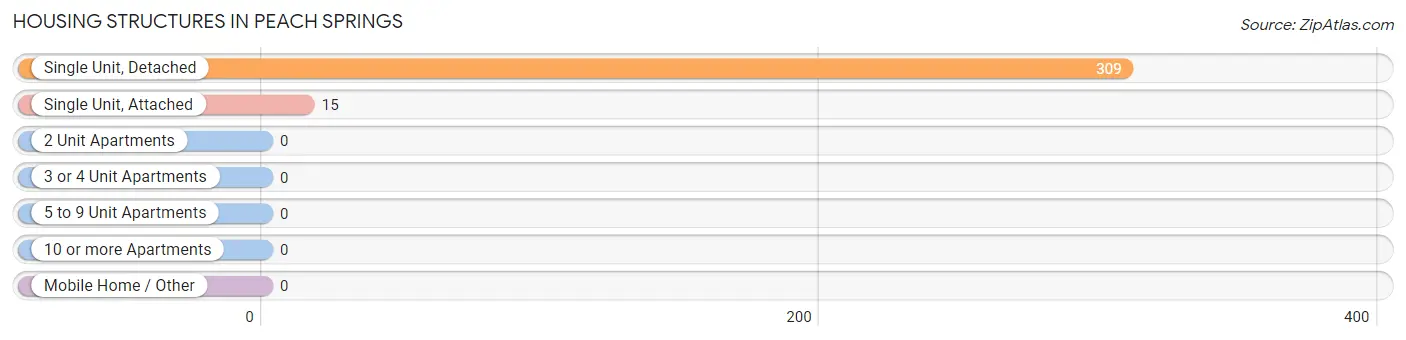
| Structure Type | # Housing Units | % Housing Units |
| Single Unit, Detached | 309 | 95.4% |
| Single Unit, Attached | 15 | 4.6% |
| 2 Unit Apartments | 0 | 0.0% |
| 3 or 4 Unit Apartments | 0 | 0.0% |
| 5 to 9 Unit Apartments | 0 | 0.0% |
| 10 or more Apartments | 0 | 0.0% |
| Mobile Home / Other | 0 | 0.0% |
| Total | 324 | 100.0% |
Housing Structures by Occupancy in Peach Springs
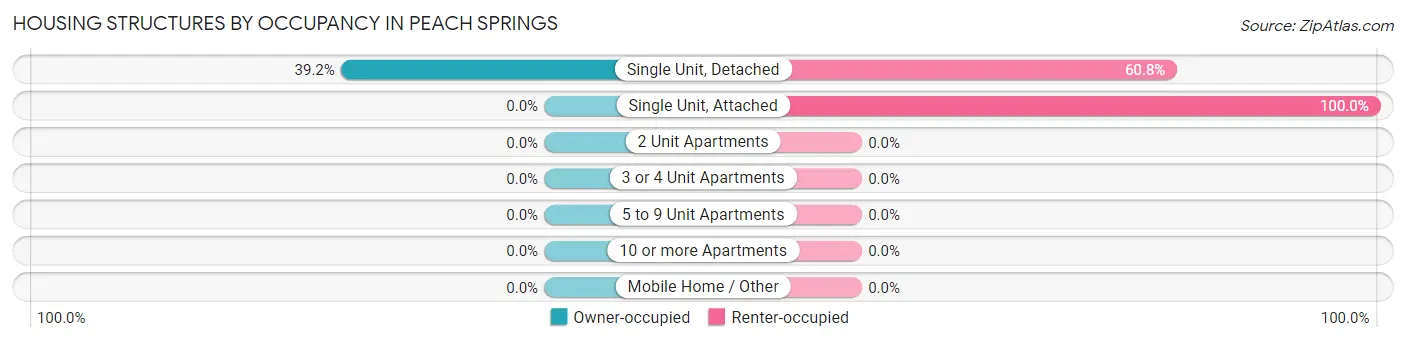
| Structure Type | Owner-occupied | Renter-occupied |
| Single Unit, Detached | 121 (39.2%) | 188 (60.8%) |
| Single Unit, Attached | 0 (0.0%) | 15 (100.0%) |
| 2 Unit Apartments | 0 (0.0%) | 0 (0.0%) |
| 3 or 4 Unit Apartments | 0 (0.0%) | 0 (0.0%) |
| 5 to 9 Unit Apartments | 0 (0.0%) | 0 (0.0%) |
| 10 or more Apartments | 0 (0.0%) | 0 (0.0%) |
| Mobile Home / Other | 0 (0.0%) | 0 (0.0%) |
| Total | 121 (37.3%) | 203 (62.6%) |
Housing Structures by Number of Rooms in Peach Springs
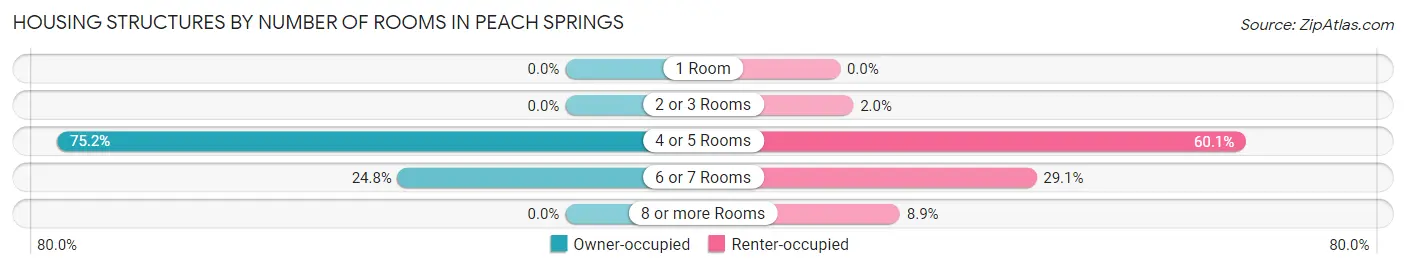
| Number of Rooms | Owner-occupied | Renter-occupied |
| 1 Room | 0 (0.0%) | 0 (0.0%) |
| 2 or 3 Rooms | 0 (0.0%) | 4 (2.0%) |
| 4 or 5 Rooms | 91 (75.2%) | 122 (60.1%) |
| 6 or 7 Rooms | 30 (24.8%) | 59 (29.1%) |
| 8 or more Rooms | 0 (0.0%) | 18 (8.9%) |
| Total | 121 (100.0%) | 203 (100.0%) |
Housing Structure by Heating Type in Peach Springs
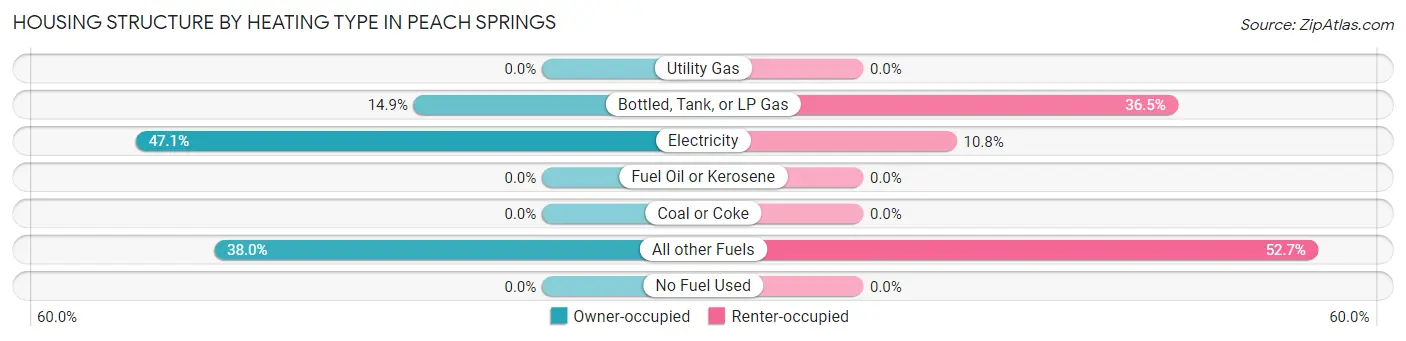
| Heating Type | Owner-occupied | Renter-occupied |
| Utility Gas | 0 (0.0%) | 0 (0.0%) |
| Bottled, Tank, or LP Gas | 18 (14.9%) | 74 (36.4%) |
| Electricity | 57 (47.1%) | 22 (10.8%) |
| Fuel Oil or Kerosene | 0 (0.0%) | 0 (0.0%) |
| Coal or Coke | 0 (0.0%) | 0 (0.0%) |
| All other Fuels | 46 (38.0%) | 107 (52.7%) |
| No Fuel Used | 0 (0.0%) | 0 (0.0%) |
| Total | 121 (100.0%) | 203 (100.0%) |
Household Vehicle Usage in Peach Springs
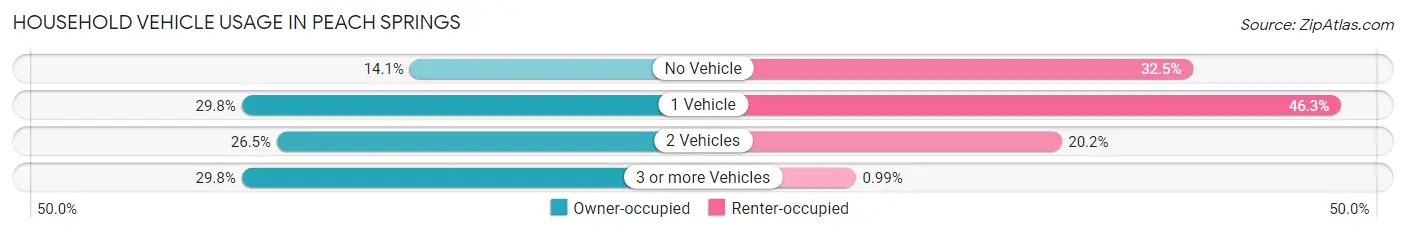
| Vehicles per Household | Owner-occupied | Renter-occupied |
| No Vehicle | 17 (14.1%) | 66 (32.5%) |
| 1 Vehicle | 36 (29.7%) | 94 (46.3%) |
| 2 Vehicles | 32 (26.5%) | 41 (20.2%) |
| 3 or more Vehicles | 36 (29.7%) | 2 (1.0%) |
| Total | 121 (100.0%) | 203 (100.0%) |
Real Estate & Mortgages in Peach Springs
Real Estate and Mortgage Overview in Peach Springs
| Characteristic | Without Mortgage | With Mortgage |
| Housing Units | 79 | 42 |
| Median Property Value | - | - |
| Median Household Income | - | - |
| Monthly Housing Costs | $206 | $0 |
| Real Estate Taxes | - | - |
Property Value by Mortgage Status in Peach Springs
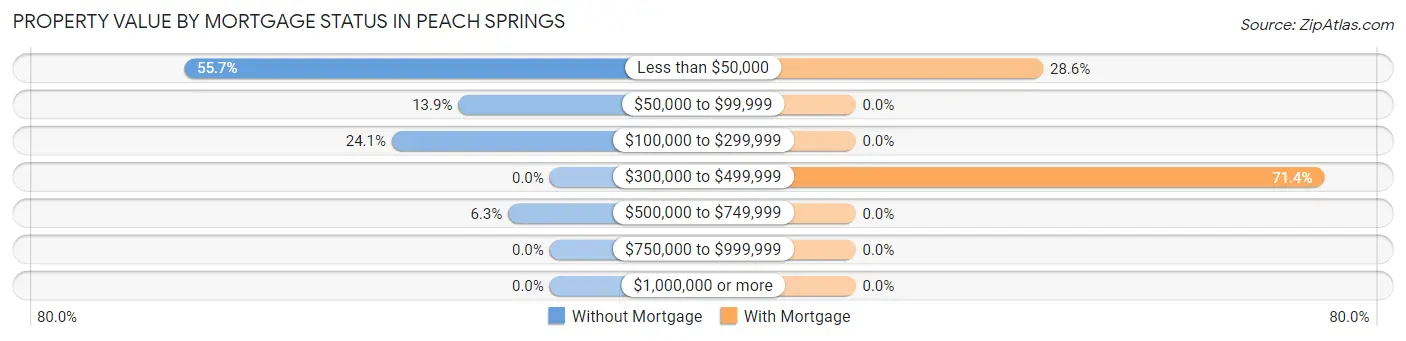
| Property Value | Without Mortgage | With Mortgage |
| Less than $50,000 | 44 (55.7%) | 12 (28.6%) |
| $50,000 to $99,999 | 11 (13.9%) | 0 (0.0%) |
| $100,000 to $299,999 | 19 (24.0%) | 0 (0.0%) |
| $300,000 to $499,999 | 0 (0.0%) | 30 (71.4%) |
| $500,000 to $749,999 | 5 (6.3%) | 0 (0.0%) |
| $750,000 to $999,999 | 0 (0.0%) | 0 (0.0%) |
| $1,000,000 or more | 0 (0.0%) | 0 (0.0%) |
| Total | 79 (100.0%) | 42 (100.0%) |
Household Income by Mortgage Status in Peach Springs
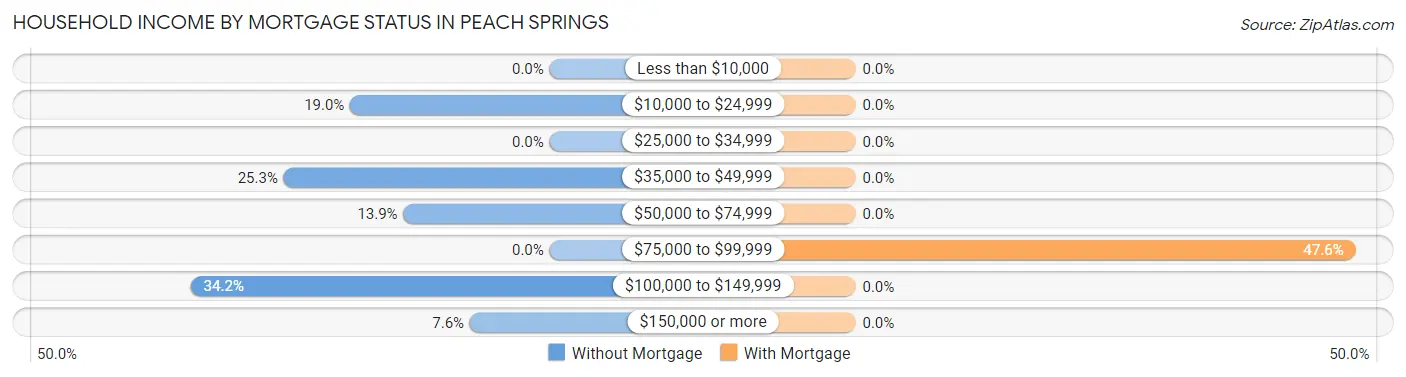
| Household Income | Without Mortgage | With Mortgage |
| Less than $10,000 | 0 (0.0%) | 0 (0.0%) |
| $10,000 to $24,999 | 15 (19.0%) | 0 (0.0%) |
| $25,000 to $34,999 | 0 (0.0%) | 0 (0.0%) |
| $35,000 to $49,999 | 20 (25.3%) | 0 (0.0%) |
| $50,000 to $74,999 | 11 (13.9%) | 0 (0.0%) |
| $75,000 to $99,999 | 0 (0.0%) | 20 (47.6%) |
| $100,000 to $149,999 | 27 (34.2%) | 0 (0.0%) |
| $150,000 or more | 6 (7.6%) | 0 (0.0%) |
| Total | 79 (100.0%) | 42 (100.0%) |
Property Value to Household Income Ratio in Peach Springs
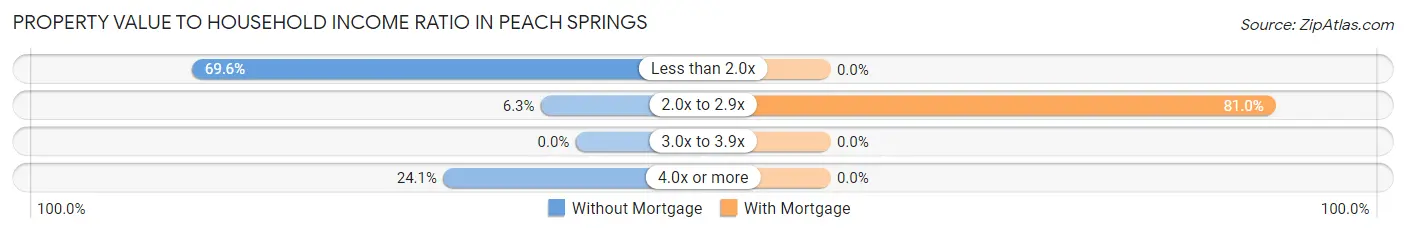
| Value-to-Income Ratio | Without Mortgage | With Mortgage |
| Less than 2.0x | 55 (69.6%) | 0 (0.0%) |
| 2.0x to 2.9x | 5 (6.3%) | 34 (80.9%) |
| 3.0x to 3.9x | 0 (0.0%) | 0 (0.0%) |
| 4.0x or more | 19 (24.0%) | 0 (0.0%) |
| Total | 79 (100.0%) | 42 (100.0%) |
Real Estate Taxes by Mortgage Status in Peach Springs
| Property Taxes | Without Mortgage | With Mortgage |
| Less than $800 | 0 (0.0%) | 0 (0.0%) |
| $800 to $1,499 | 0 (0.0%) | 0 (0.0%) |
| $800 to $1,499 | 0 (0.0%) | 0 (0.0%) |
| Total | 79 (100.0%) | 42 (100.0%) |
Health & Disability in Peach Springs
Health Insurance Coverage by Age in Peach Springs
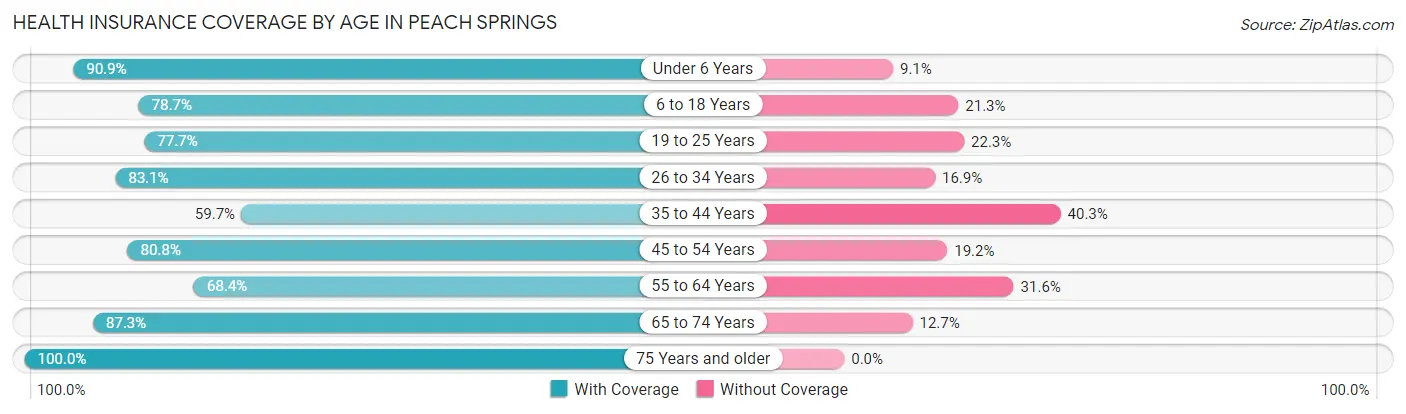
| Age Bracket | With Coverage | Without Coverage |
| Under 6 Years | 160 (90.9%) | 16 (9.1%) |
| 6 to 18 Years | 385 (78.7%) | 104 (21.3%) |
| 19 to 25 Years | 153 (77.7%) | 44 (22.3%) |
| 26 to 34 Years | 167 (83.1%) | 34 (16.9%) |
| 35 to 44 Years | 71 (59.7%) | 48 (40.3%) |
| 45 to 54 Years | 122 (80.8%) | 29 (19.2%) |
| 55 to 64 Years | 26 (68.4%) | 12 (31.6%) |
| 65 to 74 Years | 48 (87.3%) | 7 (12.7%) |
| 75 Years and older | 17 (100.0%) | 0 (0.0%) |
| Total | 1,149 (79.6%) | 294 (20.4%) |
Health Insurance Coverage by Citizenship Status in Peach Springs
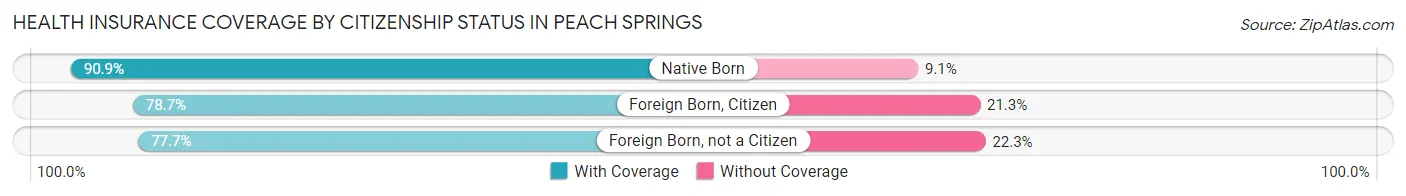
| Citizenship Status | With Coverage | Without Coverage |
| Native Born | 160 (90.9%) | 16 (9.1%) |
| Foreign Born, Citizen | 385 (78.7%) | 104 (21.3%) |
| Foreign Born, not a Citizen | 153 (77.7%) | 44 (22.3%) |
Health Insurance Coverage by Household Income in Peach Springs
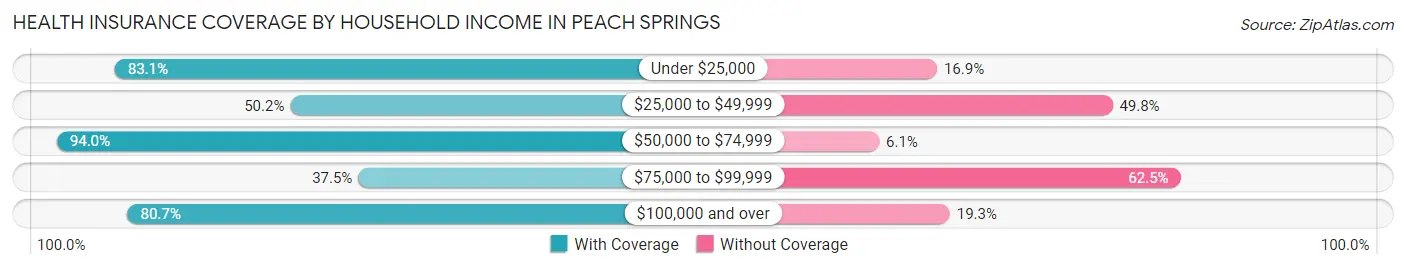
| Household Income | With Coverage | Without Coverage |
| Under $25,000 | 349 (83.1%) | 71 (16.9%) |
| $25,000 to $49,999 | 111 (50.2%) | 110 (49.8%) |
| $50,000 to $74,999 | 419 (94.0%) | 27 (6.0%) |
| $75,000 to $99,999 | 15 (37.5%) | 25 (62.5%) |
| $100,000 and over | 255 (80.7%) | 61 (19.3%) |
Public vs Private Health Insurance Coverage by Age in Peach Springs
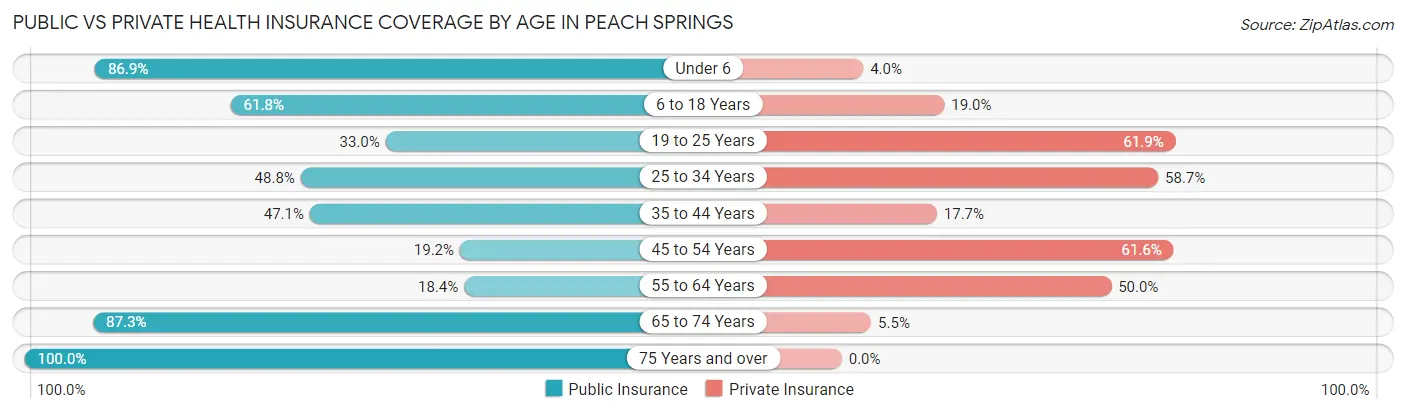
| Age Bracket | Public Insurance | Private Insurance |
| Under 6 | 153 (86.9%) | 7 (4.0%) |
| 6 to 18 Years | 302 (61.8%) | 93 (19.0%) |
| 19 to 25 Years | 65 (33.0%) | 122 (61.9%) |
| 25 to 34 Years | 98 (48.8%) | 118 (58.7%) |
| 35 to 44 Years | 56 (47.1%) | 21 (17.6%) |
| 45 to 54 Years | 29 (19.2%) | 93 (61.6%) |
| 55 to 64 Years | 7 (18.4%) | 19 (50.0%) |
| 65 to 74 Years | 48 (87.3%) | 3 (5.4%) |
| 75 Years and over | 17 (100.0%) | 0 (0.0%) |
| Total | 775 (53.7%) | 476 (33.0%) |
Disability Status by Sex by Age in Peach Springs
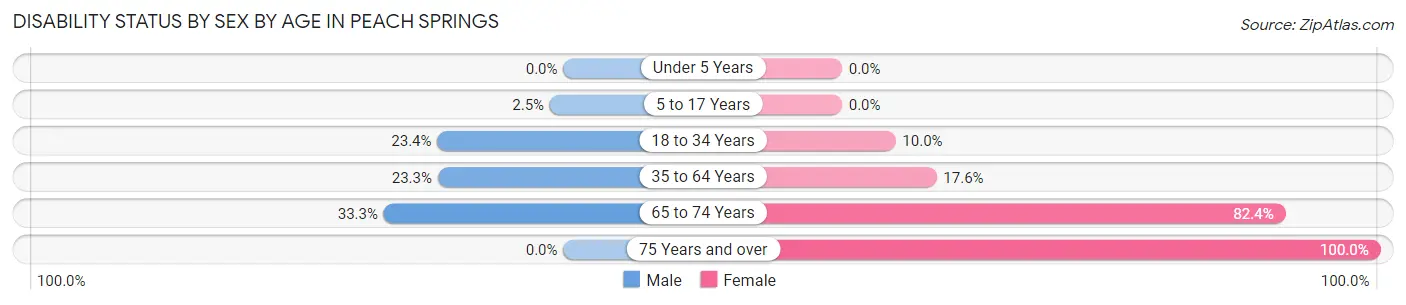
| Age Bracket | Male | Female |
| Under 5 Years | 0 (0.0%) | 0 (0.0%) |
| 5 to 17 Years | 8 (2.5%) | 0 (0.0%) |
| 18 to 34 Years | 51 (23.4%) | 21 (10.0%) |
| 35 to 64 Years | 24 (23.3%) | 36 (17.6%) |
| 65 to 74 Years | 7 (33.3%) | 28 (82.4%) |
| 75 Years and over | 0 (0.0%) | 10 (100.0%) |
Disability Class by Sex by Age in Peach Springs
Disability Class: Hearing Difficulty
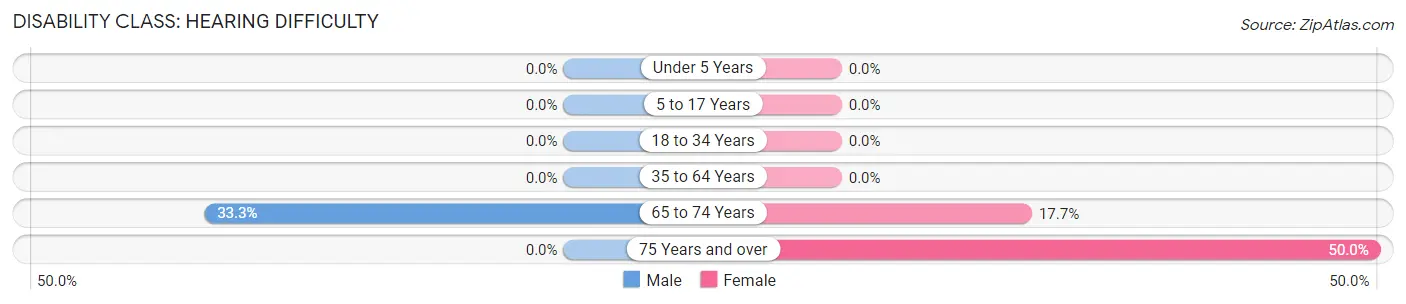
| Age Bracket | Male | Female |
| Under 5 Years | 0 (0.0%) | 0 (0.0%) |
| 5 to 17 Years | 0 (0.0%) | 0 (0.0%) |
| 18 to 34 Years | 0 (0.0%) | 0 (0.0%) |
| 35 to 64 Years | 0 (0.0%) | 0 (0.0%) |
| 65 to 74 Years | 7 (33.3%) | 6 (17.6%) |
| 75 Years and over | 0 (0.0%) | 5 (50.0%) |
Disability Class: Vision Difficulty
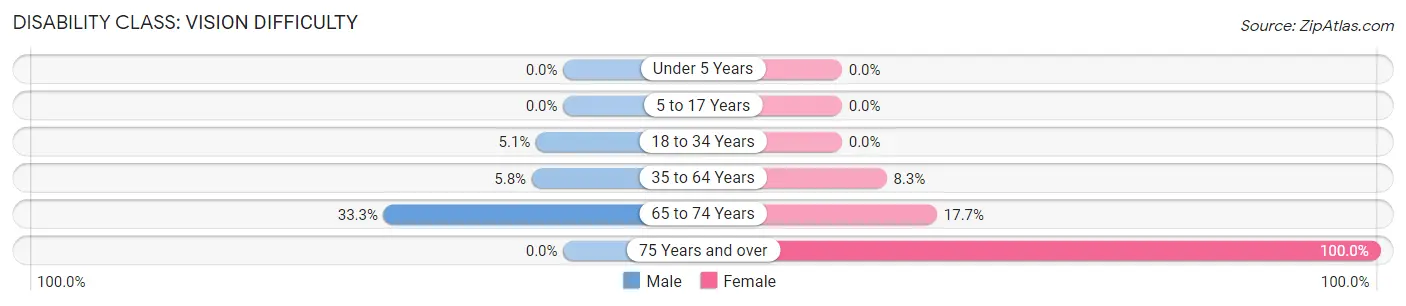
| Age Bracket | Male | Female |
| Under 5 Years | 0 (0.0%) | 0 (0.0%) |
| 5 to 17 Years | 0 (0.0%) | 0 (0.0%) |
| 18 to 34 Years | 11 (5.1%) | 0 (0.0%) |
| 35 to 64 Years | 6 (5.8%) | 17 (8.3%) |
| 65 to 74 Years | 7 (33.3%) | 6 (17.6%) |
| 75 Years and over | 0 (0.0%) | 10 (100.0%) |
Disability Class: Cognitive Difficulty
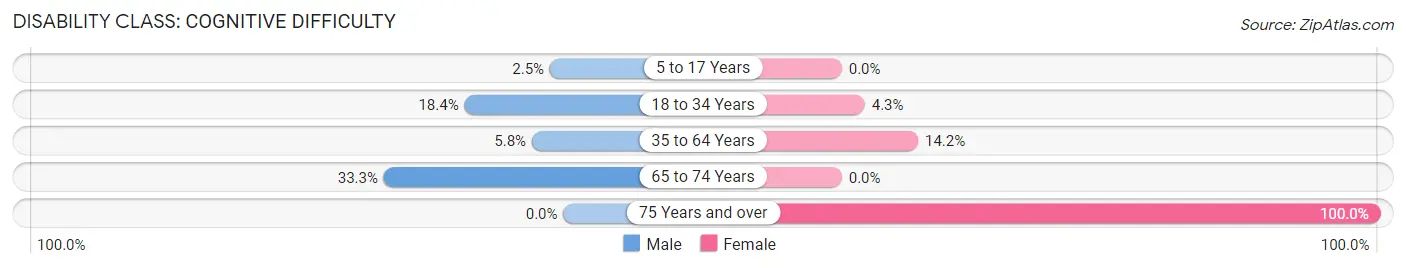
| Age Bracket | Male | Female |
| 5 to 17 Years | 8 (2.5%) | 0 (0.0%) |
| 18 to 34 Years | 40 (18.3%) | 9 (4.3%) |
| 35 to 64 Years | 6 (5.8%) | 29 (14.1%) |
| 65 to 74 Years | 7 (33.3%) | 0 (0.0%) |
| 75 Years and over | 0 (0.0%) | 10 (100.0%) |
Disability Class: Ambulatory Difficulty
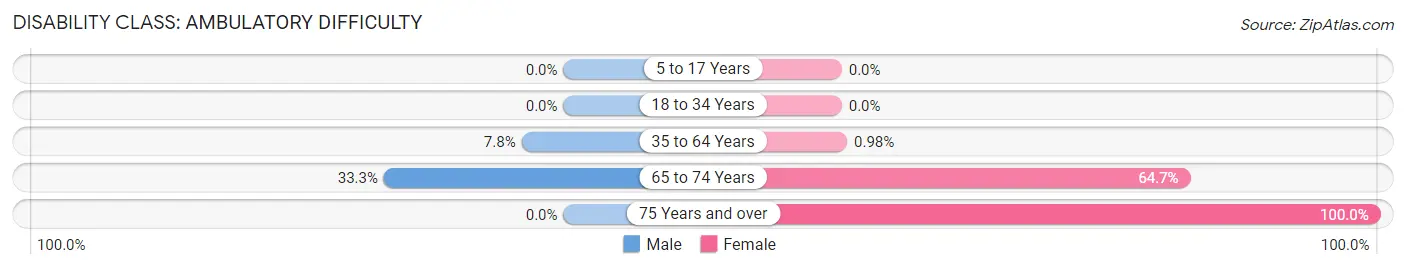
| Age Bracket | Male | Female |
| 5 to 17 Years | 0 (0.0%) | 0 (0.0%) |
| 18 to 34 Years | 0 (0.0%) | 0 (0.0%) |
| 35 to 64 Years | 8 (7.8%) | 2 (1.0%) |
| 65 to 74 Years | 7 (33.3%) | 22 (64.7%) |
| 75 Years and over | 0 (0.0%) | 10 (100.0%) |
Disability Class: Self-Care Difficulty
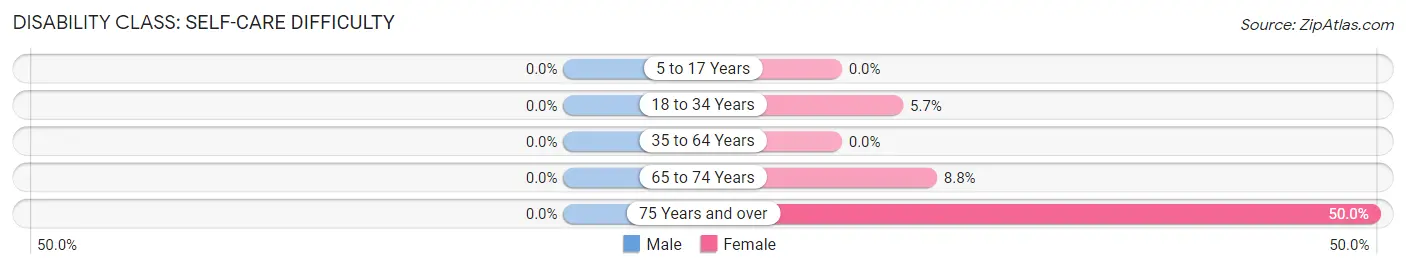
| Age Bracket | Male | Female |
| 5 to 17 Years | 0 (0.0%) | 0 (0.0%) |
| 18 to 34 Years | 0 (0.0%) | 12 (5.7%) |
| 35 to 64 Years | 0 (0.0%) | 0 (0.0%) |
| 65 to 74 Years | 0 (0.0%) | 3 (8.8%) |
| 75 Years and over | 0 (0.0%) | 5 (50.0%) |
Technology Access in Peach Springs
Computing Device Access in Peach Springs
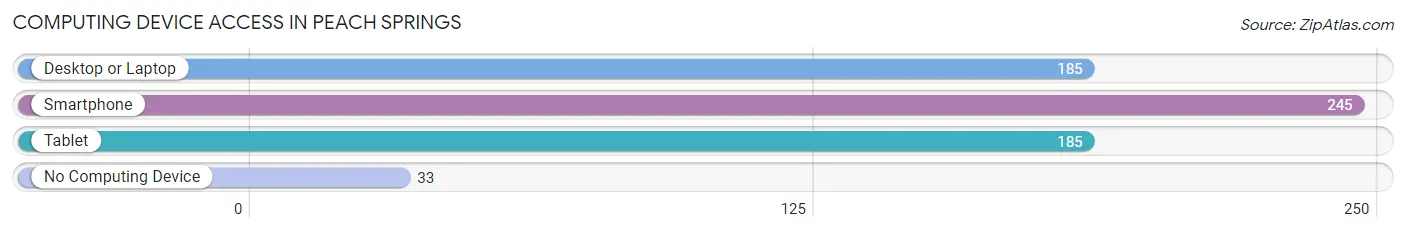
| Device Type | # Households | % Households |
| Desktop or Laptop | 185 | 57.1% |
| Smartphone | 245 | 75.6% |
| Tablet | 185 | 57.1% |
| No Computing Device | 33 | 10.2% |
| Total | 324 | 100.0% |
Internet Access in Peach Springs
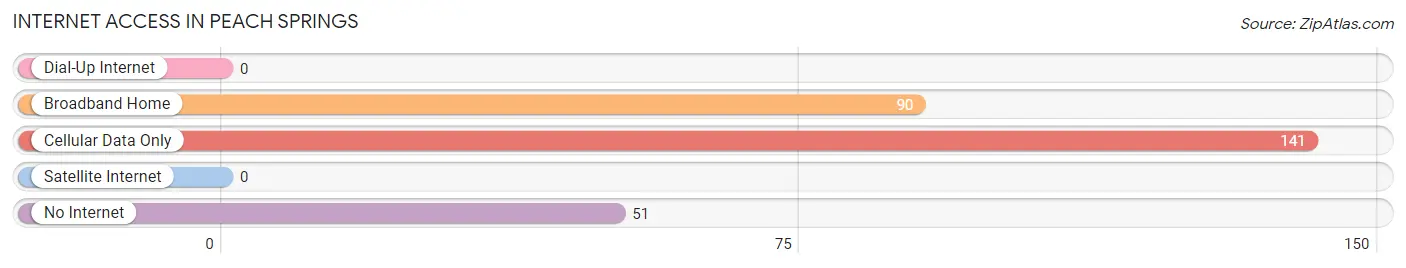
| Internet Type | # Households | % Households |
| Dial-Up Internet | 0 | 0.0% |
| Broadband Home | 90 | 27.8% |
| Cellular Data Only | 141 | 43.5% |
| Satellite Internet | 0 | 0.0% |
| No Internet | 51 | 15.7% |
| Total | 324 | 100.0% |
Peach Springs Summary
Peach Springs is a small town located in Mohave County, Arizona. It is situated on the Hualapai Indian Reservation, and is the tribal headquarters of the Hualapai Tribe. The town is located along the historic Route 66, and is the gateway to the Grand Canyon Skywalk, a glass bridge that extends 70 feet over the edge of the Grand Canyon.
History
Peach Springs was originally established in 1883 as a stagecoach stop along the Beale Wagon Road, which connected Fort Mojave to Prescott, Arizona. The town was named after the peach trees that grew in the area. In the early 1900s, the town became a popular stop along the newly established Route 66. The town was home to a number of businesses, including a gas station, a hotel, and a restaurant.
In the 1950s, the town began to decline as the popularity of Route 66 began to wane. In the 1970s, the town was revitalized when the Hualapai Tribe established its headquarters in Peach Springs. The tribe also opened the Grand Canyon Skywalk, a glass bridge that extends 70 feet over the edge of the Grand Canyon.
Geography
Peach Springs is located in Mohave County, Arizona. It is situated on the Hualapai Indian Reservation, and is the tribal headquarters of the Hualapai Tribe. The town is located along the historic Route 66, and is the gateway to the Grand Canyon Skywalk, a glass bridge that extends 70 feet over the edge of the Grand Canyon.
The town is located in the Mojave Desert, and is surrounded by the Hualapai Mountains. The climate is arid, with hot summers and mild winters. The average annual temperature is 68°F, and the average annual precipitation is 8.5 inches.
Economy
The economy of Peach Springs is largely based on tourism. The town is home to the Grand Canyon Skywalk, a glass bridge that extends 70 feet over the edge of the Grand Canyon. The Skywalk is a popular tourist attraction, and draws visitors from around the world.
The town is also home to a number of businesses, including a gas station, a hotel, and a restaurant. The Hualapai Tribe also operates a number of businesses in the town, including a casino, a hotel, and a gift shop.
Demographics
As of the 2010 census, the population of Peach Springs was 1,071. The racial makeup of the town was 75.3% Native American, 19.2% White, 0.3% African American, 0.2% Asian, 0.1% Pacific Islander, and 4.9% from other races. The median household income was $25,938, and the median family income was $30,000. The per capita income was $13,945.
Conclusion
Peach Springs is a small town located in Mohave County, Arizona. It is situated on the Hualapai Indian Reservation, and is the tribal headquarters of the Hualapai Tribe. The town is located along the historic Route 66, and is the gateway to the Grand Canyon Skywalk, a glass bridge that extends 70 feet over the edge of the Grand Canyon. The economy of Peach Springs is largely based on tourism, and the town is home to a number of businesses, including a gas station, a hotel, and a restaurant. As of the 2010 census, the population of Peach Springs was 1,071. The racial makeup of the town was 75.3% Native American, 19.2% White, 0.3% African American, 0.2% Asian, 0.1% Pacific Islander, and 4.9% from other races. The median household income was $25,938, and the median family income was $30,000. The per capita income was $13,945.
Common Questions
What is Per Capita Income in Peach Springs?
Per Capita income in Peach Springs is $14,585.
What is the Median Family Income in Peach Springs?
Median Family Income in Peach Springs is $43,500.
What is the Median Household income in Peach Springs?
Median Household Income in Peach Springs is $55,000.
What is Inequality or Gini Index in Peach Springs?
Inequality or Gini Index in Peach Springs is 0.44.
What is the Total Population of Peach Springs?
Total Population of Peach Springs is 1,482.
What is the Total Male Population of Peach Springs?
Total Male Population of Peach Springs is 759.
What is the Total Female Population of Peach Springs?
Total Female Population of Peach Springs is 723.
What is the Ratio of Males per 100 Females in Peach Springs?
There are 104.98 Males per 100 Females in Peach Springs.
What is the Ratio of Females per 100 Males in Peach Springs?
There are 95.26 Females per 100 Males in Peach Springs.
What is the Median Population Age in Peach Springs?
Median Population Age in Peach Springs is 21.4 Years.
What is the Average Family Size in Peach Springs
Average Family Size in Peach Springs is 4.5 People.
What is the Average Household Size in Peach Springs
Average Household Size in Peach Springs is 4.5 People.
How Large is the Labor Force in Peach Springs?
There are 507 People in the Labor Forcein in Peach Springs.
What is the Percentage of People in the Labor Force in Peach Springs?
55.9% of People are in the Labor Force in Peach Springs.
What is the Unemployment Rate in Peach Springs?
Unemployment Rate in Peach Springs is 18.7%.