Kaibab, AZ Map & Demographics
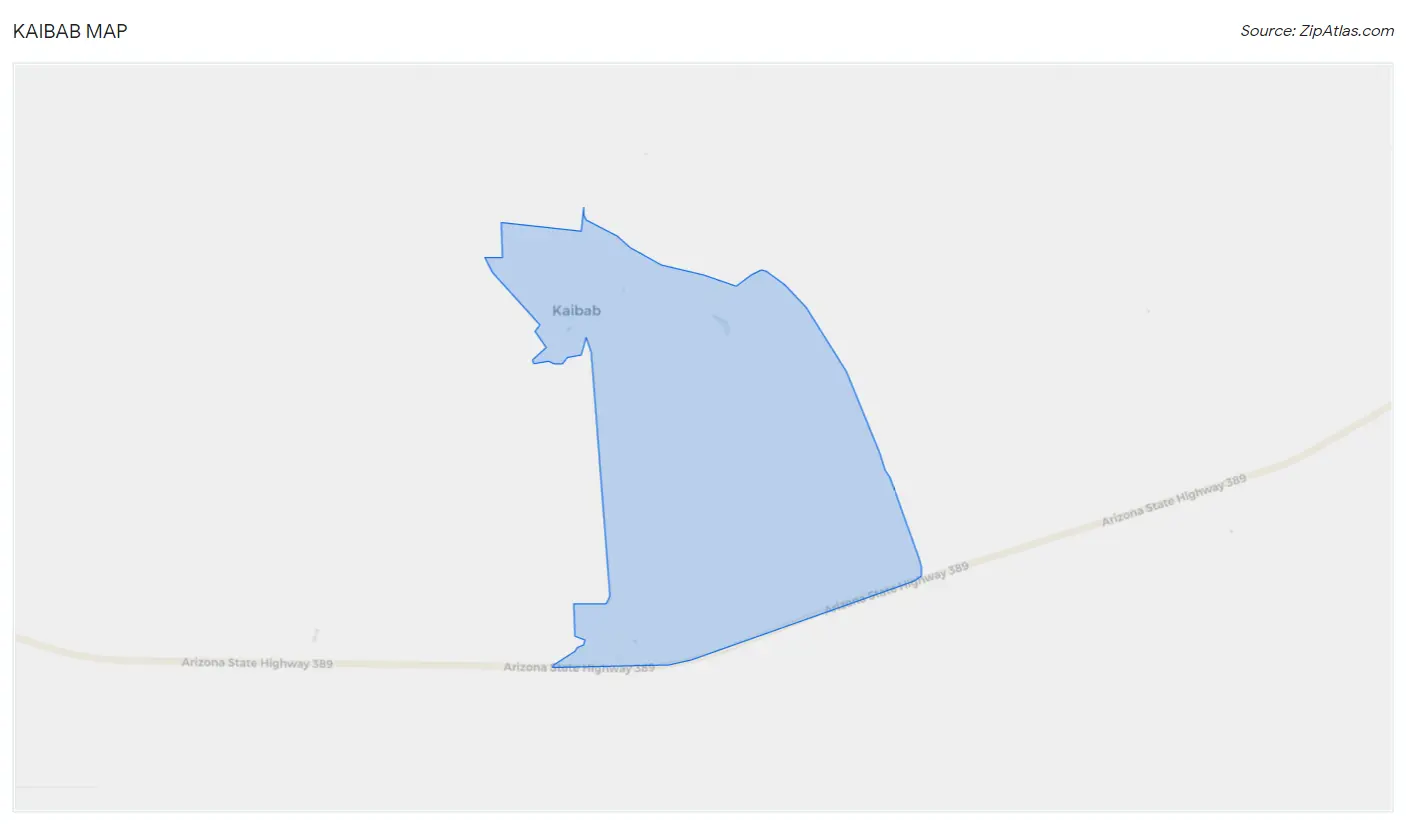
Kaibab Map
Kaibab Overview
$20,417
PER CAPITA INCOME
$34,688
AVG FAMILY INCOME
$34,375
AVG HOUSEHOLD INCOME
0.31
INEQUALITY / GINI INDEX
135
TOTAL POPULATION
62
MALE POPULATION
73
FEMALE POPULATION
84.93
MALES / 100 FEMALES
117.74
FEMALES / 100 MALES
26.3
MEDIAN AGE
2.9
AVG FAMILY SIZE
2.4
AVG HOUSEHOLD SIZE
72
LABOR FORCE [ PEOPLE ]
69.9%
PERCENT IN LABOR FORCE
9.7%
UNEMPLOYMENT RATE
Income in Kaibab
Income Overview in Kaibab
Per Capita Income in Kaibab is $20,417, while median incomes of families and households are $34,688 and $34,375 respectively.
| Characteristic | Number | Measure |
| Per Capita Income | 135 | $20,417 |
| Median Family Income | 33 | $34,688 |
| Mean Family Income | 33 | $46,500 |
| Median Household Income | 56 | $34,375 |
| Mean Household Income | 56 | $45,111 |
| Income Deficit | 33 | $0 |
| Wage / Income Gap (%) | 135 | 0.00% |
| Wage / Income Gap ($) | 135 | 100.00¢ per $1 |
| Gini / Inequality Index | 135 | 0.31 |
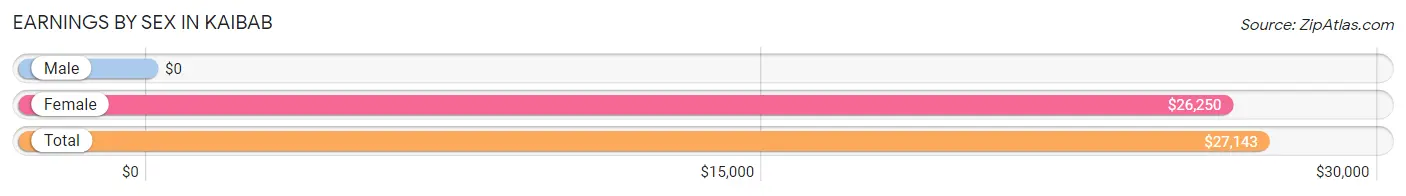
Earnings by Sex in Kaibab
| Sex | Number | Average Earnings |
| Male | 34 (42.5%) | $0 |
| Female | 46 (57.5%) | $26,250 |
| Total | 80 (100.0%) | $27,143 |
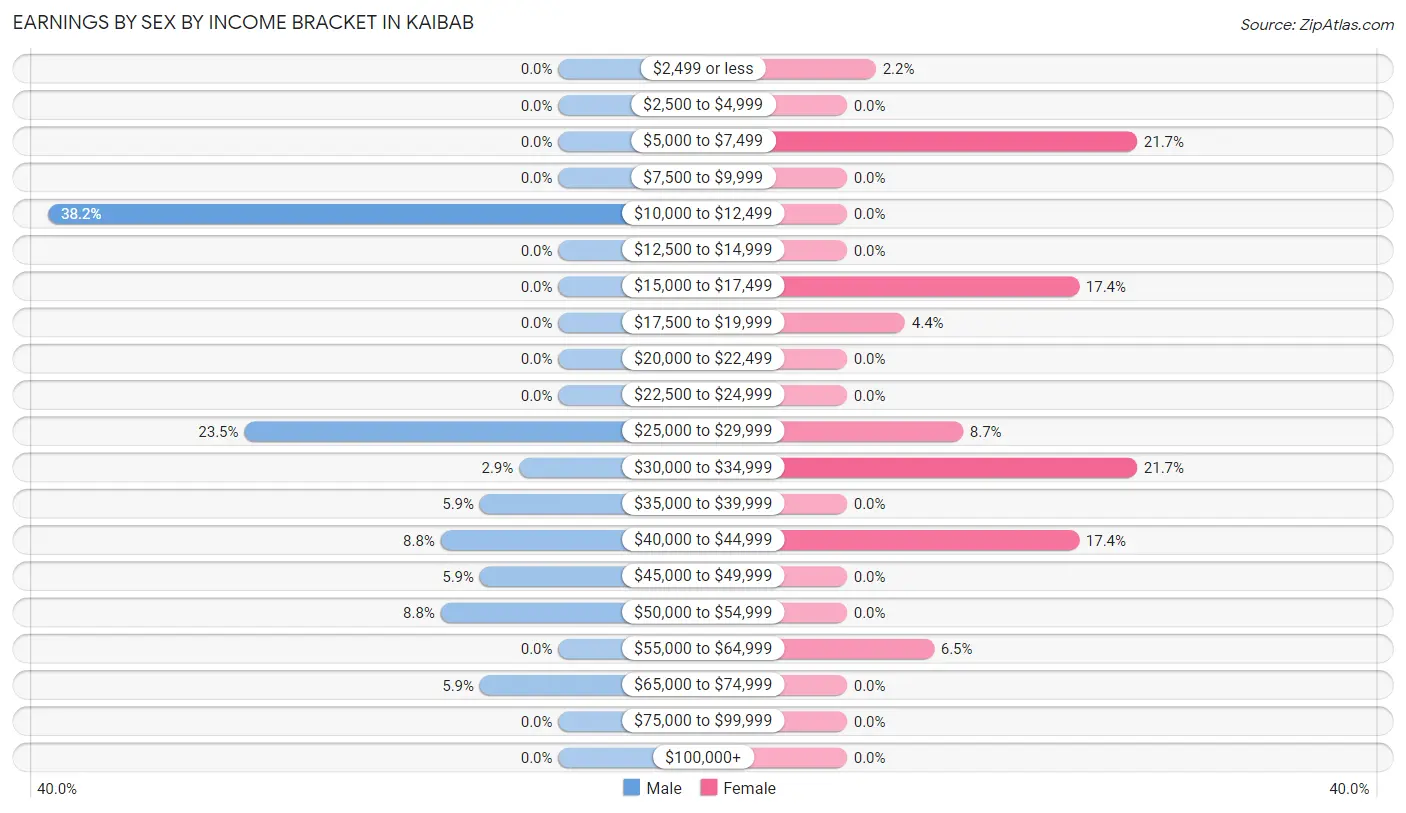
Earnings by Sex by Income Bracket in Kaibab
The most common earnings brackets in Kaibab are $10,000 to $12,499 for men (13 | 38.2%) and $5,000 to $7,499 for women (10 | 21.7%).
| Income | Male | Female |
| $2,499 or less | 0 (0.0%) | 1 (2.2%) |
| $2,500 to $4,999 | 0 (0.0%) | 0 (0.0%) |
| $5,000 to $7,499 | 0 (0.0%) | 10 (21.7%) |
| $7,500 to $9,999 | 0 (0.0%) | 0 (0.0%) |
| $10,000 to $12,499 | 13 (38.2%) | 0 (0.0%) |
| $12,500 to $14,999 | 0 (0.0%) | 0 (0.0%) |
| $15,000 to $17,499 | 0 (0.0%) | 8 (17.4%) |
| $17,500 to $19,999 | 0 (0.0%) | 2 (4.3%) |
| $20,000 to $22,499 | 0 (0.0%) | 0 (0.0%) |
| $22,500 to $24,999 | 0 (0.0%) | 0 (0.0%) |
| $25,000 to $29,999 | 8 (23.5%) | 4 (8.7%) |
| $30,000 to $34,999 | 1 (2.9%) | 10 (21.7%) |
| $35,000 to $39,999 | 2 (5.9%) | 0 (0.0%) |
| $40,000 to $44,999 | 3 (8.8%) | 8 (17.4%) |
| $45,000 to $49,999 | 2 (5.9%) | 0 (0.0%) |
| $50,000 to $54,999 | 3 (8.8%) | 0 (0.0%) |
| $55,000 to $64,999 | 0 (0.0%) | 3 (6.5%) |
| $65,000 to $74,999 | 2 (5.9%) | 0 (0.0%) |
| $75,000 to $99,999 | 0 (0.0%) | 0 (0.0%) |
| $100,000+ | 0 (0.0%) | 0 (0.0%) |
| Total | 34 (100.0%) | 46 (100.0%) |
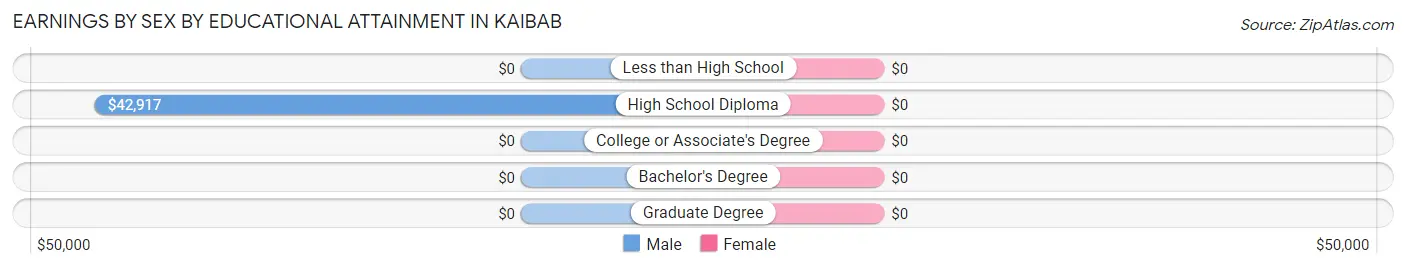
Earnings by Sex by Educational Attainment in Kaibab
| Educational Attainment | Male Income | Female Income |
| Less than High School | - | - |
| High School Diploma | $42,917 | $0 |
| College or Associate's Degree | - | - |
| Bachelor's Degree | - | - |
| Graduate Degree | - | - |
| Total | - | - |
Family Income in Kaibab
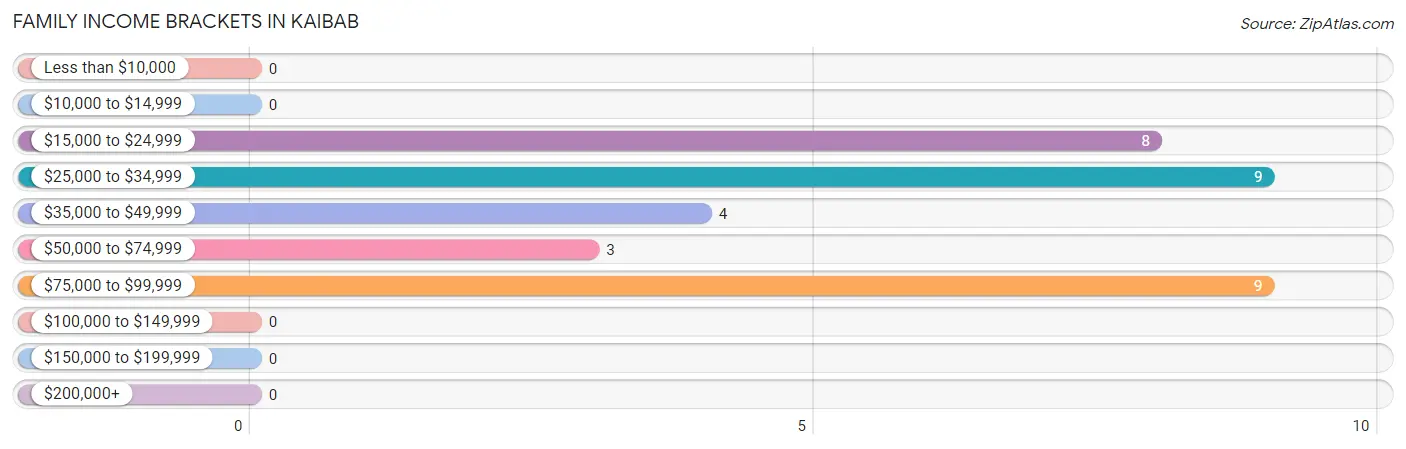
Family Income Brackets in Kaibab
According to the Kaibab family income data, there are 9 families falling into the $25,000 to $34,999 income range, which is the most common income bracket and makes up 27.3% of all families.
| Income Bracket | # Families | % Families |
| Less than $10,000 | 0 | 0.0% |
| $10,000 to $14,999 | 0 | 0.0% |
| $15,000 to $24,999 | 8 | 24.2% |
| $25,000 to $34,999 | 9 | 27.3% |
| $35,000 to $49,999 | 4 | 12.1% |
| $50,000 to $74,999 | 3 | 9.1% |
| $75,000 to $99,999 | 9 | 27.3% |
| $100,000 to $149,999 | 0 | 0.0% |
| $150,000 to $199,999 | 0 | 0.0% |
| $200,000+ | 0 | 0.0% |
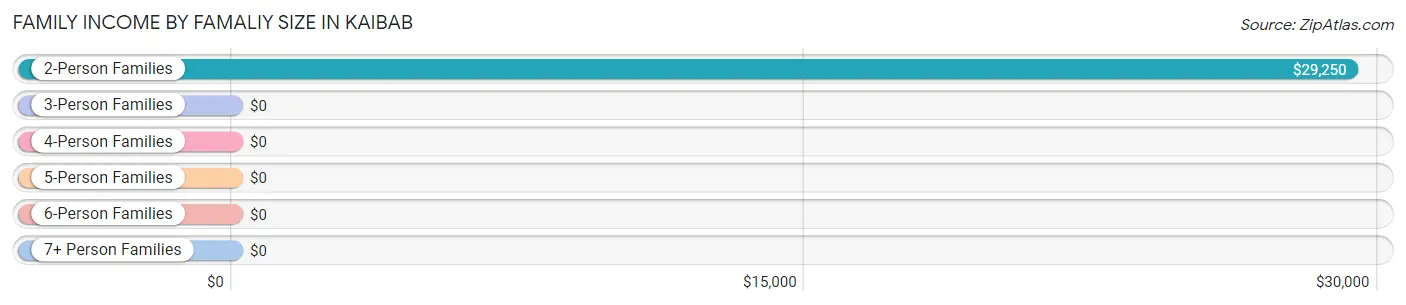
Family Income by Famaliy Size in Kaibab
2-person families (23 | 69.7%) account for the highest median family income in Kaibab with $29,250 per family, while 2-person families (23 | 69.7%) have the highest median income of $14,625 per family member.
| Income Bracket | # Families | Median Income |
| 2-Person Families | 23 (69.7%) | $29,250 |
| 3-Person Families | 8 (24.2%) | $0 |
| 4-Person Families | 0 (0.0%) | $0 |
| 5-Person Families | 0 (0.0%) | $0 |
| 6-Person Families | 2 (6.1%) | $0 |
| 7+ Person Families | 0 (0.0%) | $0 |
| Total | 33 (100.0%) | $34,688 |
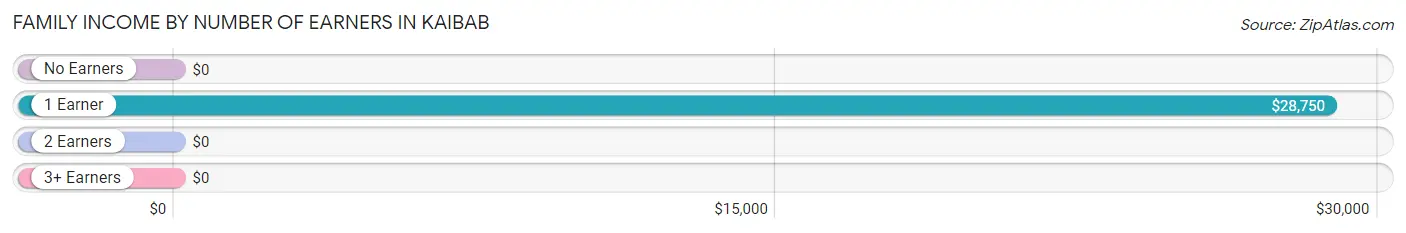
Family Income by Number of Earners in Kaibab
| Number of Earners | # Families | Median Income |
| No Earners | 0 (0.0%) | $0 |
| 1 Earner | 21 (63.6%) | $28,750 |
| 2 Earners | 6 (18.2%) | $0 |
| 3+ Earners | 6 (18.2%) | $0 |
| Total | 33 (100.0%) | $34,688 |
Household Income in Kaibab
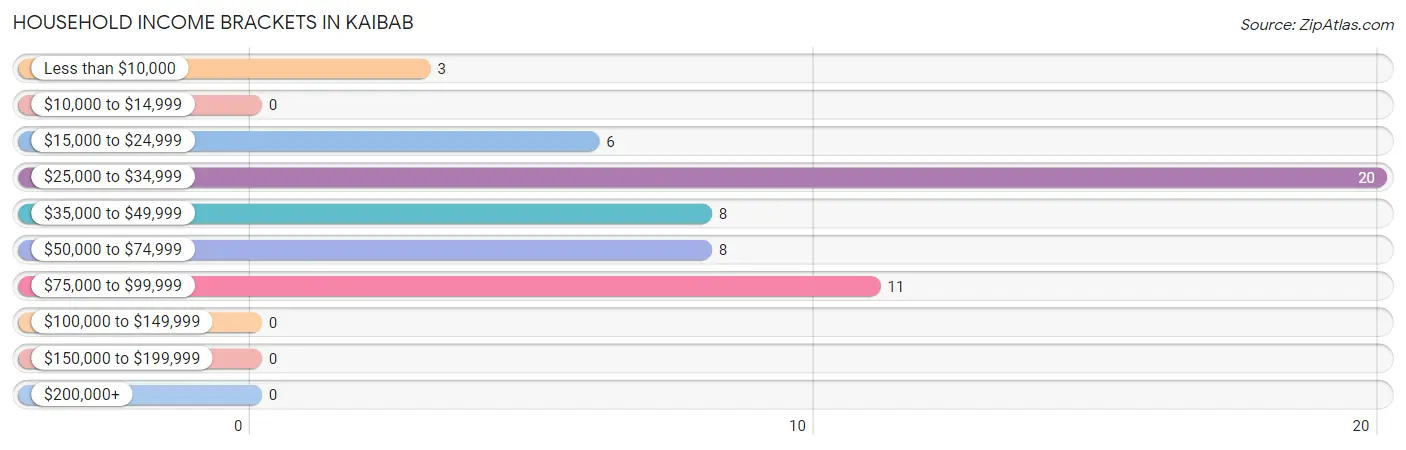
Household Income Brackets in Kaibab
With 20 households falling in the category, the $25,000 to $34,999 income range is the most frequent in Kaibab, accounting for 35.7% of all households.
| Income Bracket | # Households | % Households |
| Less than $10,000 | 3 | 5.4% |
| $10,000 to $14,999 | 0 | 0.0% |
| $15,000 to $24,999 | 6 | 10.7% |
| $25,000 to $34,999 | 20 | 35.7% |
| $35,000 to $49,999 | 8 | 14.3% |
| $50,000 to $74,999 | 8 | 14.3% |
| $75,000 to $99,999 | 11 | 19.6% |
| $100,000 to $149,999 | 0 | 0.0% |
| $150,000 to $199,999 | 0 | 0.0% |
| $200,000+ | 0 | 0.0% |
Household Income by Householder Age in Kaibab
The median household income in Kaibab is $34,375, with the highest median household income of $36,875 found in the 25 to 44 years age bracket for the primary householder. A total of 22 households (39.3%) fall into this category. Meanwhile, the 15 to 24 years age bracket for the primary householder has the lowest median household income of $0, with 9 households (16.1%) in this group.
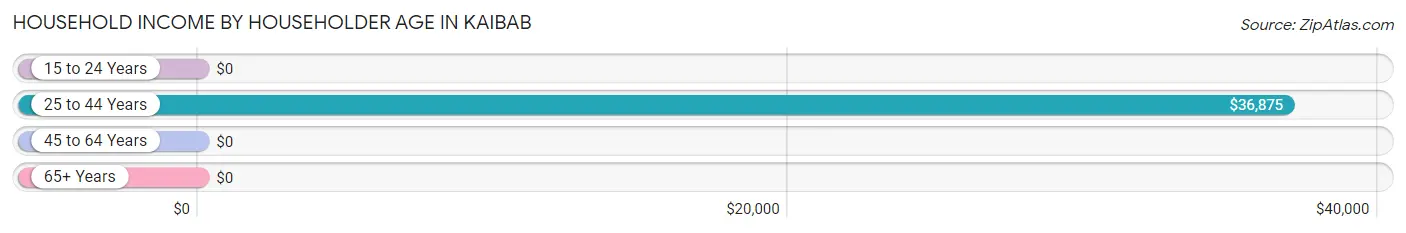
| Income Bracket | # Households | Median Income |
| 15 to 24 Years | 9 (16.1%) | $0 |
| 25 to 44 Years | 22 (39.3%) | $36,875 |
| 45 to 64 Years | 12 (21.4%) | $0 |
| 65+ Years | 13 (23.2%) | $0 |
| Total | 56 (100.0%) | $34,375 |
Poverty in Kaibab
Income Below Poverty by Sex and Age in Kaibab
With 45.2% poverty level for males and 17.8% for females among the residents of Kaibab, under 5 year old males and 75 year old and over females are the most vulnerable to poverty, with 14 males (87.5%) and 2 females (40.0%) in their respective age groups living below the poverty level.
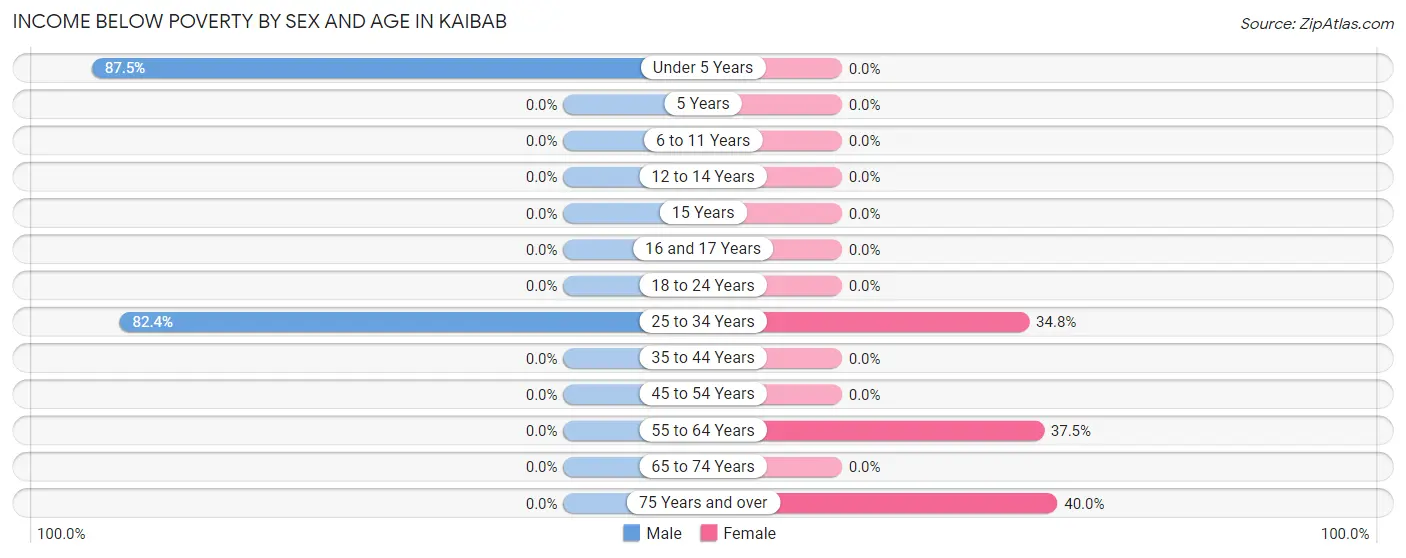
| Age Bracket | Male | Female |
| Under 5 Years | 14 (87.5%) | 0 (0.0%) |
| 5 Years | 0 (0.0%) | 0 (0.0%) |
| 6 to 11 Years | 0 (0.0%) | 0 (0.0%) |
| 12 to 14 Years | 0 (0.0%) | 0 (0.0%) |
| 15 Years | 0 (0.0%) | 0 (0.0%) |
| 16 and 17 Years | 0 (0.0%) | 0 (0.0%) |
| 18 to 24 Years | 0 (0.0%) | 0 (0.0%) |
| 25 to 34 Years | 14 (82.4%) | 8 (34.8%) |
| 35 to 44 Years | 0 (0.0%) | 0 (0.0%) |
| 45 to 54 Years | 0 (0.0%) | 0 (0.0%) |
| 55 to 64 Years | 0 (0.0%) | 3 (37.5%) |
| 65 to 74 Years | 0 (0.0%) | 0 (0.0%) |
| 75 Years and over | 0 (0.0%) | 2 (40.0%) |
| Total | 28 (45.2%) | 13 (17.8%) |
Income Above Poverty by Sex and Age in Kaibab
According to the poverty statistics in Kaibab, males aged 5 years and females aged under 5 years are the age groups that are most secure financially, with 100.0% of males and 100.0% of females in these age groups living above the poverty line.
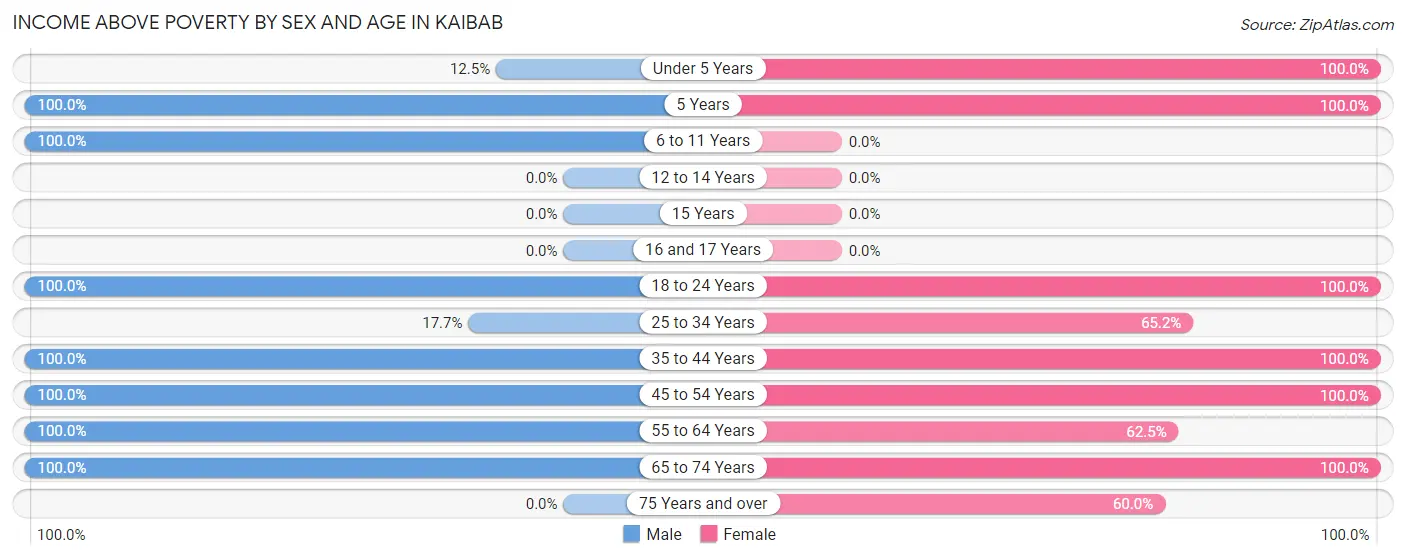
| Age Bracket | Male | Female |
| Under 5 Years | 2 (12.5%) | 8 (100.0%) |
| 5 Years | 3 (100.0%) | 3 (100.0%) |
| 6 to 11 Years | 2 (100.0%) | 0 (0.0%) |
| 12 to 14 Years | 0 (0.0%) | 0 (0.0%) |
| 15 Years | 0 (0.0%) | 0 (0.0%) |
| 16 and 17 Years | 0 (0.0%) | 0 (0.0%) |
| 18 to 24 Years | 8 (100.0%) | 11 (100.0%) |
| 25 to 34 Years | 3 (17.6%) | 15 (65.2%) |
| 35 to 44 Years | 2 (100.0%) | 6 (100.0%) |
| 45 to 54 Years | 3 (100.0%) | 3 (100.0%) |
| 55 to 64 Years | 4 (100.0%) | 5 (62.5%) |
| 65 to 74 Years | 7 (100.0%) | 6 (100.0%) |
| 75 Years and over | 0 (0.0%) | 3 (60.0%) |
| Total | 34 (54.8%) | 60 (82.2%) |
Income Below Poverty Among Married-Couple Families in Kaibab
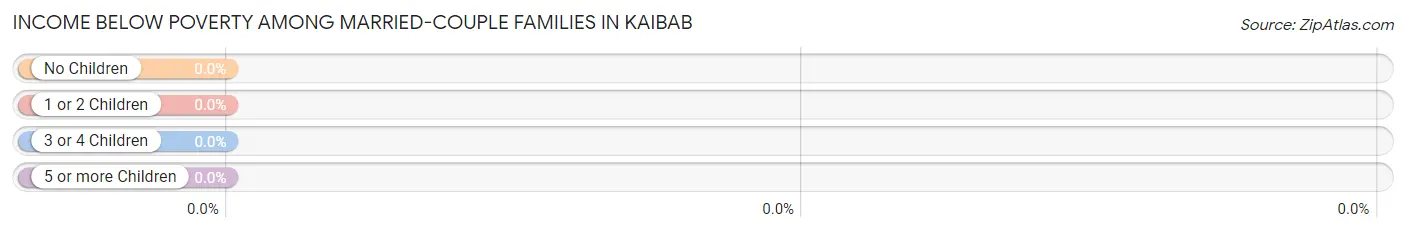
| Children | Above Poverty | Below Poverty |
| No Children | 6 (100.0%) | 0 (0.0%) |
| 1 or 2 Children | 0 (0.0%) | 0 (0.0%) |
| 3 or 4 Children | 0 (0.0%) | 0 (0.0%) |
| 5 or more Children | 0 (0.0%) | 0 (0.0%) |
| Total | 6 (100.0%) | 0 (0.0%) |
Income Below Poverty Among Single-Parent Households in Kaibab
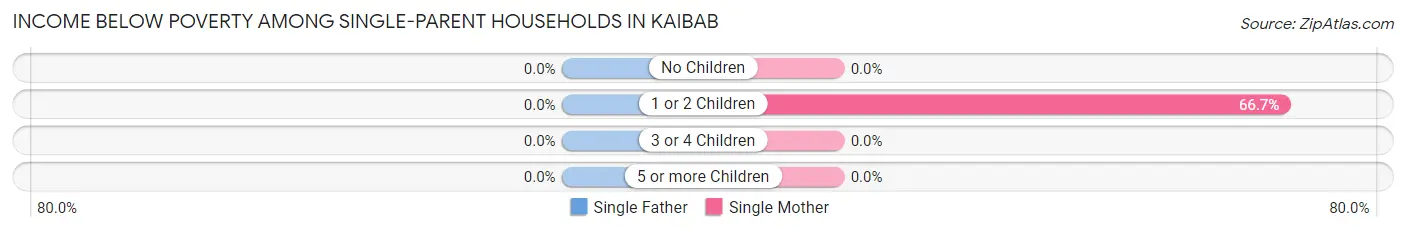
| Children | Single Father | Single Mother |
| No Children | 0 (0.0%) | 0 (0.0%) |
| 1 or 2 Children | 0 (0.0%) | 8 (66.7%) |
| 3 or 4 Children | 0 (0.0%) | 0 (0.0%) |
| 5 or more Children | 0 (0.0%) | 0 (0.0%) |
| Total | 0 (0.0%) | 8 (47.1%) |
Income Below Poverty Among Married-Couple vs Single-Parent Households in Kaibab
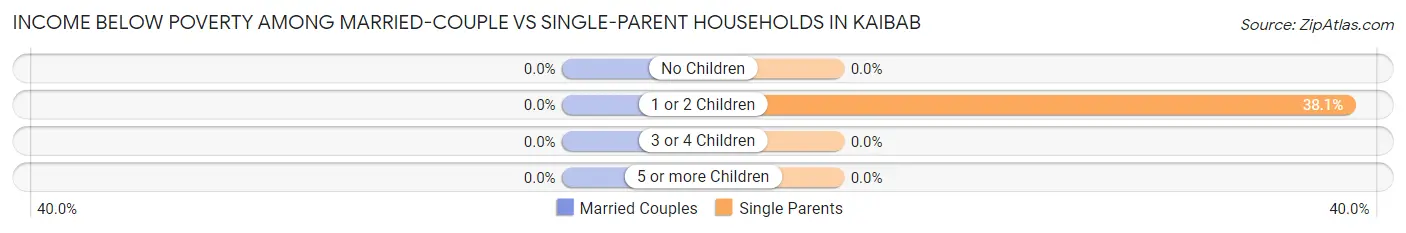
| Children | Married-Couple Families | Single-Parent Households |
| No Children | 0 (0.0%) | 0 (0.0%) |
| 1 or 2 Children | 0 (0.0%) | 8 (38.1%) |
| 3 or 4 Children | 0 (0.0%) | 0 (0.0%) |
| 5 or more Children | 0 (0.0%) | 0 (0.0%) |
| Total | 0 (0.0%) | 8 (29.6%) |
Race in Kaibab
The most populous races in Kaibab are Native / Alaskan (101 | 74.8%), Two or more Races (17 | 12.6%), and Black / African American (12 | 8.9%).
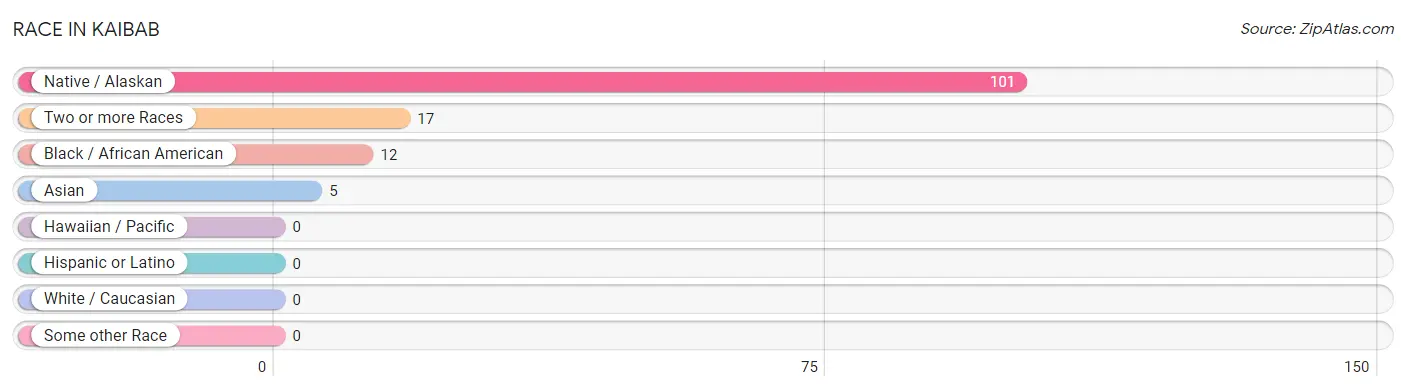
| Race | # Population | % Population |
| Asian | 5 | 3.7% |
| Black / African American | 12 | 8.9% |
| Hawaiian / Pacific | 0 | 0.0% |
| Hispanic or Latino | 0 | 0.0% |
| Native / Alaskan | 101 | 74.8% |
| White / Caucasian | 0 | 0.0% |
| Two or more Races | 17 | 12.6% |
| Some other Race | 0 | 0.0% |
| Total | 135 | 100.0% |
Ancestry in Kaibab
The most populous ancestries reported in Kaibab are Paiute (97 | 71.9%), Pueblo (6 | 4.4%), Navajo (5 | 3.7%), Indian (Asian) (4 | 3.0%), and Cherokee (3 | 2.2%), together accounting for 85.2% of all Kaibab residents.
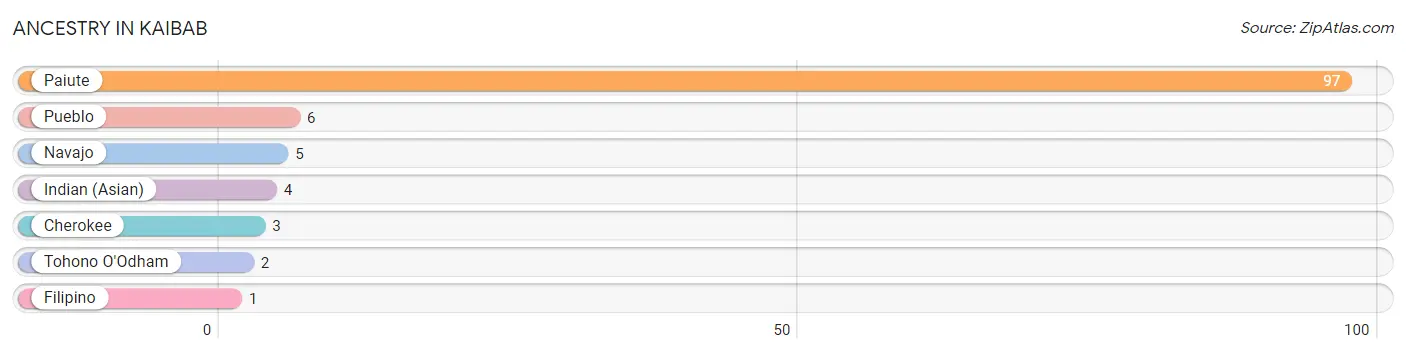
| Ancestry | # Population | % Population |
| Cherokee | 3 | 2.2% |
| Filipino | 1 | 0.7% |
| Indian (Asian) | 4 | 3.0% |
| Navajo | 5 | 3.7% |
| Paiute | 97 | 71.9% |
| Pueblo | 6 | 4.4% |
| Tohono O'Odham | 2 | 1.5% | View All 7 Rows |
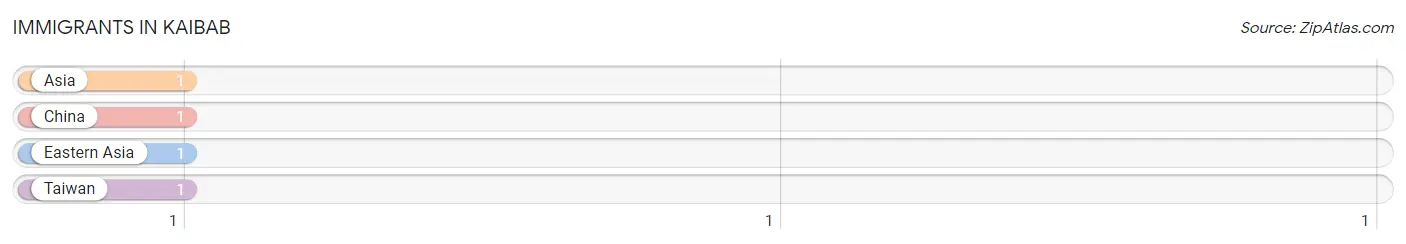
Immigrants in Kaibab
The most numerous immigrant groups reported in Kaibab came from Asia (1 | 0.7%), China (1 | 0.7%), Eastern Asia (1 | 0.7%), and Taiwan (1 | 0.7%), together accounting for 3.0% of all Kaibab residents.
| Immigration Origin | # Population | % Population |
| Asia | 1 | 0.7% |
| China | 1 | 0.7% |
| Eastern Asia | 1 | 0.7% |
| Taiwan | 1 | 0.7% | View All 4 Rows |
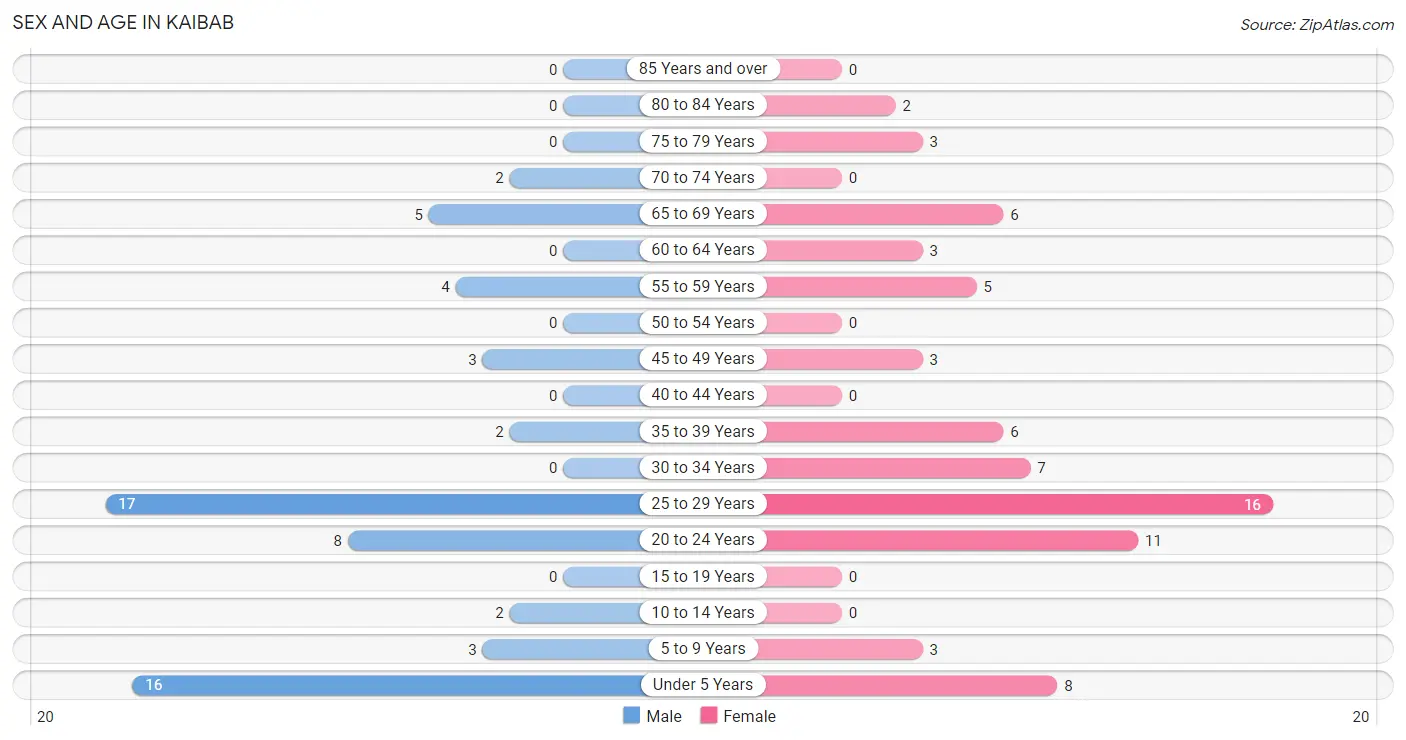
Sex and Age in Kaibab
Sex and Age in Kaibab
The most populous age groups in Kaibab are 25 to 29 Years (17 | 27.4%) for men and 25 to 29 Years (16 | 21.9%) for women.
| Age Bracket | Male | Female |
| Under 5 Years | 16 (25.8%) | 8 (11.0%) |
| 5 to 9 Years | 3 (4.8%) | 3 (4.1%) |
| 10 to 14 Years | 2 (3.2%) | 0 (0.0%) |
| 15 to 19 Years | 0 (0.0%) | 0 (0.0%) |
| 20 to 24 Years | 8 (12.9%) | 11 (15.1%) |
| 25 to 29 Years | 17 (27.4%) | 16 (21.9%) |
| 30 to 34 Years | 0 (0.0%) | 7 (9.6%) |
| 35 to 39 Years | 2 (3.2%) | 6 (8.2%) |
| 40 to 44 Years | 0 (0.0%) | 0 (0.0%) |
| 45 to 49 Years | 3 (4.8%) | 3 (4.1%) |
| 50 to 54 Years | 0 (0.0%) | 0 (0.0%) |
| 55 to 59 Years | 4 (6.5%) | 5 (6.9%) |
| 60 to 64 Years | 0 (0.0%) | 3 (4.1%) |
| 65 to 69 Years | 5 (8.1%) | 6 (8.2%) |
| 70 to 74 Years | 2 (3.2%) | 0 (0.0%) |
| 75 to 79 Years | 0 (0.0%) | 3 (4.1%) |
| 80 to 84 Years | 0 (0.0%) | 2 (2.7%) |
| 85 Years and over | 0 (0.0%) | 0 (0.0%) |
| Total | 62 (100.0%) | 73 (100.0%) |
Families and Households in Kaibab
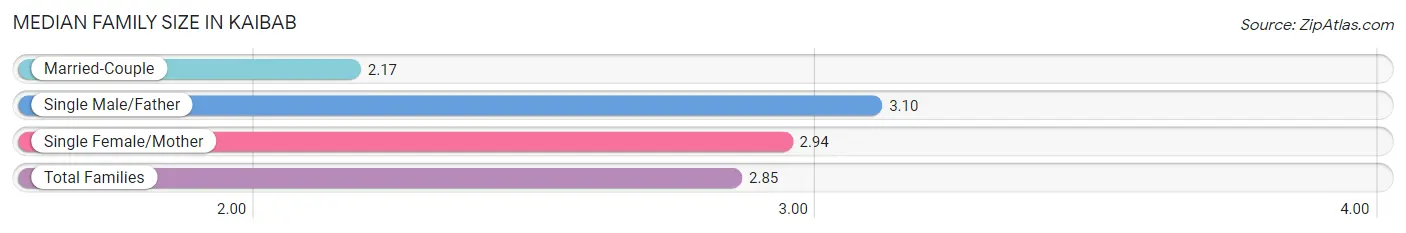
Median Family Size in Kaibab
The median family size in Kaibab is 2.85 persons per family, with single male/father families (10 | 30.3%) accounting for the largest median family size of 3.1 persons per family. On the other hand, married-couple families (6 | 18.2%) represent the smallest median family size with 2.17 persons per family.
| Family Type | # Families | Family Size |
| Married-Couple | 6 (18.2%) | 2.17 |
| Single Male/Father | 10 (30.3%) | 3.10 |
| Single Female/Mother | 17 (51.5%) | 2.94 |
| Total Families | 33 (100.0%) | 2.85 |
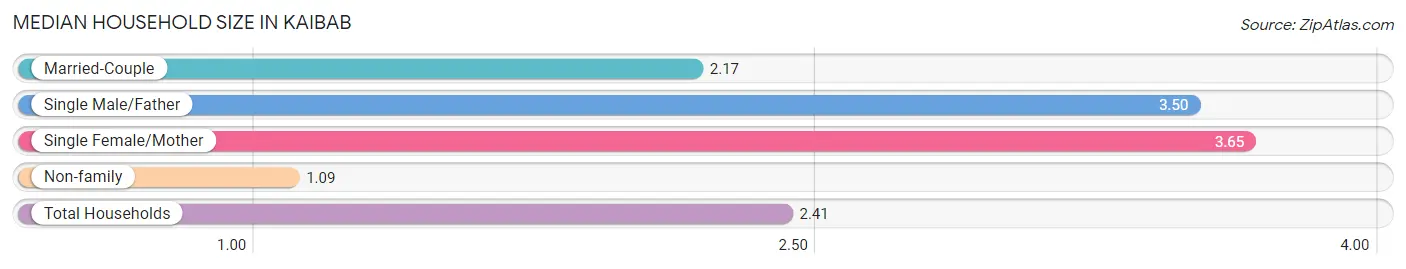
Median Household Size in Kaibab
The median household size in Kaibab is 2.41 persons per household, with single female/mother households (17 | 30.4%) accounting for the largest median household size of 3.65 persons per household. non-family households (23 | 41.1%) represent the smallest median household size with 1.09 persons per household.
| Household Type | # Households | Household Size |
| Married-Couple | 6 (10.7%) | 2.17 |
| Single Male/Father | 10 (17.9%) | 3.50 |
| Single Female/Mother | 17 (30.4%) | 3.65 |
| Non-family | 23 (41.1%) | 1.09 |
| Total Households | 56 (100.0%) | 2.41 |
Household Size by Marriage Status in Kaibab
Out of a total of 56 households in Kaibab, 33 (58.9%) are family households, while 23 (41.1%) are nonfamily households. The most numerous type of family households are 3-person households, comprising 18, and the most common type of nonfamily households are 1-person households, comprising 21.
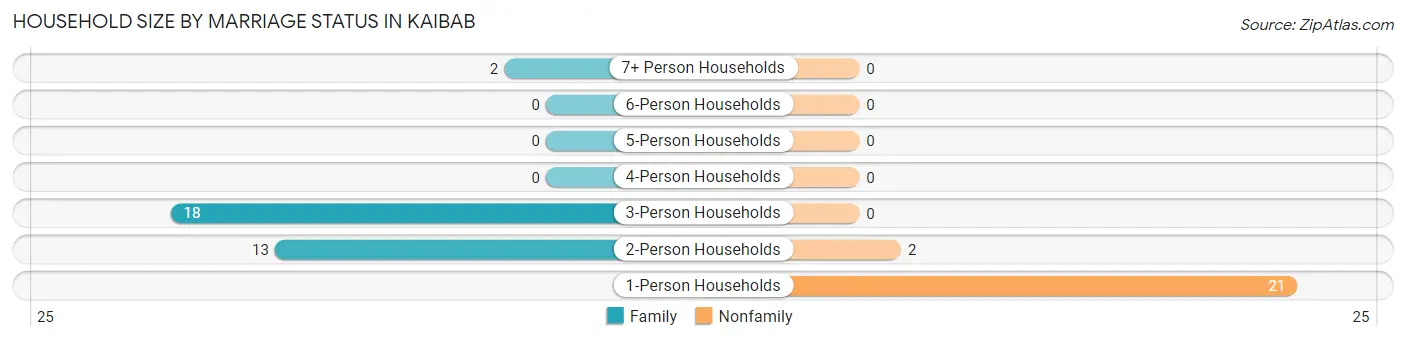
| Household Size | Family Households | Nonfamily Households |
| 1-Person Households | - | 21 (37.5%) |
| 2-Person Households | 13 (23.2%) | 2 (3.6%) |
| 3-Person Households | 18 (32.1%) | 0 (0.0%) |
| 4-Person Households | 0 (0.0%) | 0 (0.0%) |
| 5-Person Households | 0 (0.0%) | 0 (0.0%) |
| 6-Person Households | 0 (0.0%) | 0 (0.0%) |
| 7+ Person Households | 2 (3.6%) | 0 (0.0%) |
| Total | 33 (58.9%) | 23 (41.1%) |
Female Fertility in Kaibab
Fertility by Age in Kaibab
| Age Bracket | Women with Births | Births / 1,000 Women |
| 15 to 19 years | 0 (0.0%) | 0.0 |
| 20 to 34 years | 0 (0.0%) | 0.0 |
| 35 to 50 years | 0 (0.0%) | 0.0 |
| Total | 0 (0.0%) | 0.0 |
Fertility by Age by Marriage Status in Kaibab
| Age Bracket | Married | Unmarried |
| 15 to 19 years | 0 (0.0%) | 0 (0.0%) |
| 20 to 34 years | 0 (0.0%) | 0 (0.0%) |
| 35 to 50 years | 0 (0.0%) | 0 (0.0%) |
| Total | 0 (0.0%) | 0 (0.0%) |
Fertility by Education in Kaibab
| Educational Attainment | Women with Births | Births / 1,000 Women |
| Less than High School | 0 (0.0%) | 0.0 |
| High School Diploma | 0 (0.0%) | 0.0 |
| College or Associate's Degree | 0 (0.0%) | 0.0 |
| Bachelor's Degree | 0 (0.0%) | 0.0 |
| Graduate Degree | 0 (0.0%) | 0.0 |
| Total | 0 (0.0%) | 0.0 |
Fertility by Education by Marriage Status in Kaibab
| Educational Attainment | Married | Unmarried |
| Less than High School | 0 (0.0%) | 0 (0.0%) |
| High School Diploma | 0 (0.0%) | 0 (0.0%) |
| College or Associate's Degree | 0 (0.0%) | 0 (0.0%) |
| Bachelor's Degree | 0 (0.0%) | 0 (0.0%) |
| Graduate Degree | 0 (0.0%) | 0 (0.0%) |
| Total | 0 (0.0%) | 0 (0.0%) |
Employment Characteristics in Kaibab
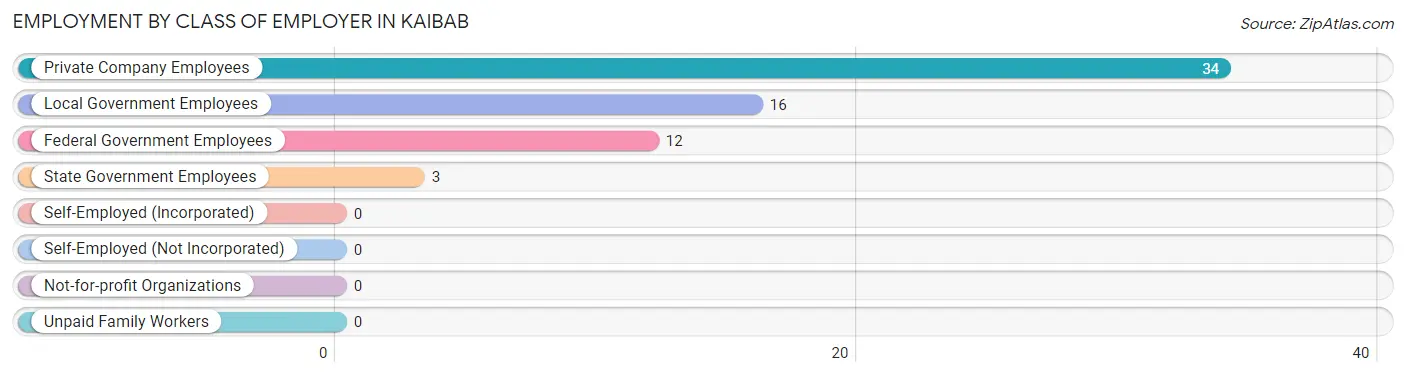
Employment by Class of Employer in Kaibab
Among the 65 employed individuals in Kaibab, private company employees (34 | 52.3%), local government employees (16 | 24.6%), and federal government employees (12 | 18.5%) make up the most common classes of employment.
| Employer Class | # Employees | % Employees |
| Private Company Employees | 34 | 52.3% |
| Self-Employed (Incorporated) | 0 | 0.0% |
| Self-Employed (Not Incorporated) | 0 | 0.0% |
| Not-for-profit Organizations | 0 | 0.0% |
| Local Government Employees | 16 | 24.6% |
| State Government Employees | 3 | 4.6% |
| Federal Government Employees | 12 | 18.5% |
| Unpaid Family Workers | 0 | 0.0% |
| Total | 65 | 100.0% |
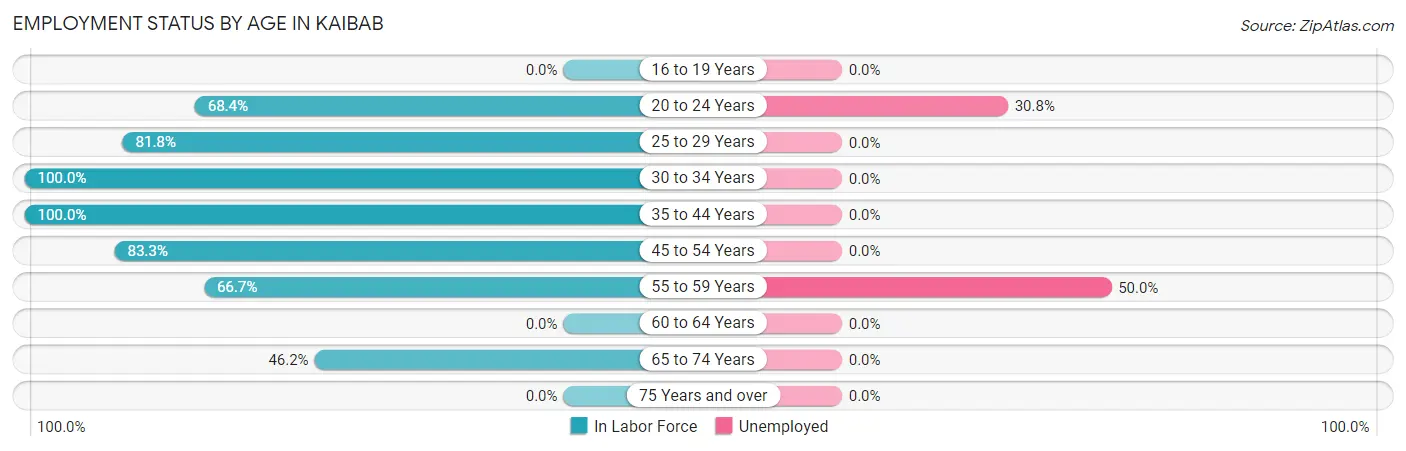
Employment Status by Age in Kaibab
According to the labor force statistics for Kaibab, out of the total population over 16 years of age (103), 69.9% or 72 individuals are in the labor force, with 9.7% or 7 of them unemployed. The age group with the highest labor force participation rate is 30 to 34 years, with 100.0% or 7 individuals in the labor force. Within the labor force, the 55 to 59 years age range has the highest percentage of unemployed individuals, with 50.0% or 3 of them being unemployed.
| Age Bracket | In Labor Force | Unemployed |
| 16 to 19 Years | 0 (0.0%) | 0 (0.0%) |
| 20 to 24 Years | 13 (68.4%) | 4 (30.8%) |
| 25 to 29 Years | 27 (81.8%) | 0 (0.0%) |
| 30 to 34 Years | 7 (100.0%) | 0 (0.0%) |
| 35 to 44 Years | 8 (100.0%) | 0 (0.0%) |
| 45 to 54 Years | 5 (83.3%) | 0 (0.0%) |
| 55 to 59 Years | 6 (66.7%) | 3 (50.0%) |
| 60 to 64 Years | 0 (0.0%) | 0 (0.0%) |
| 65 to 74 Years | 6 (46.2%) | 0 (0.0%) |
| 75 Years and over | 0 (0.0%) | 0 (0.0%) |
| Total | 72 (69.9%) | 7 (9.7%) |
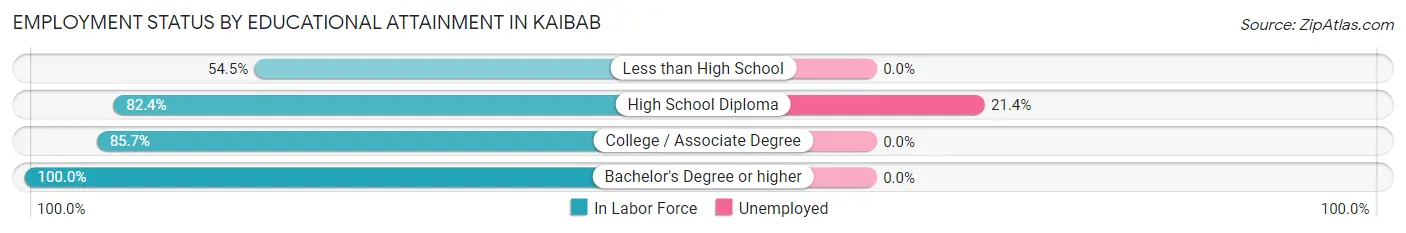
Employment Status by Educational Attainment in Kaibab
According to labor force statistics for Kaibab, 80.3% of individuals (53) out of the total population between 25 and 64 years of age (66) are in the labor force, with 5.7% or 3 of them being unemployed. The group with the highest labor force participation rate are those with the educational attainment of bachelor's degree or higher, with 100.0% or 3 individuals in the labor force. Within the labor force, individuals with high school diploma education have the highest percentage of unemployment, with 21.4% or 3 of them being unemployed.
| Educational Attainment | In Labor Force | Unemployed |
| Less than High School | 6 (54.5%) | 0 (0.0%) |
| High School Diploma | 14 (82.4%) | 4 (21.4%) |
| College / Associate Degree | 30 (85.7%) | 0 (0.0%) |
| Bachelor's Degree or higher | 3 (100.0%) | 0 (0.0%) |
| Total | 53 (80.3%) | 4 (5.7%) |
Employment Occupations by Sex in Kaibab
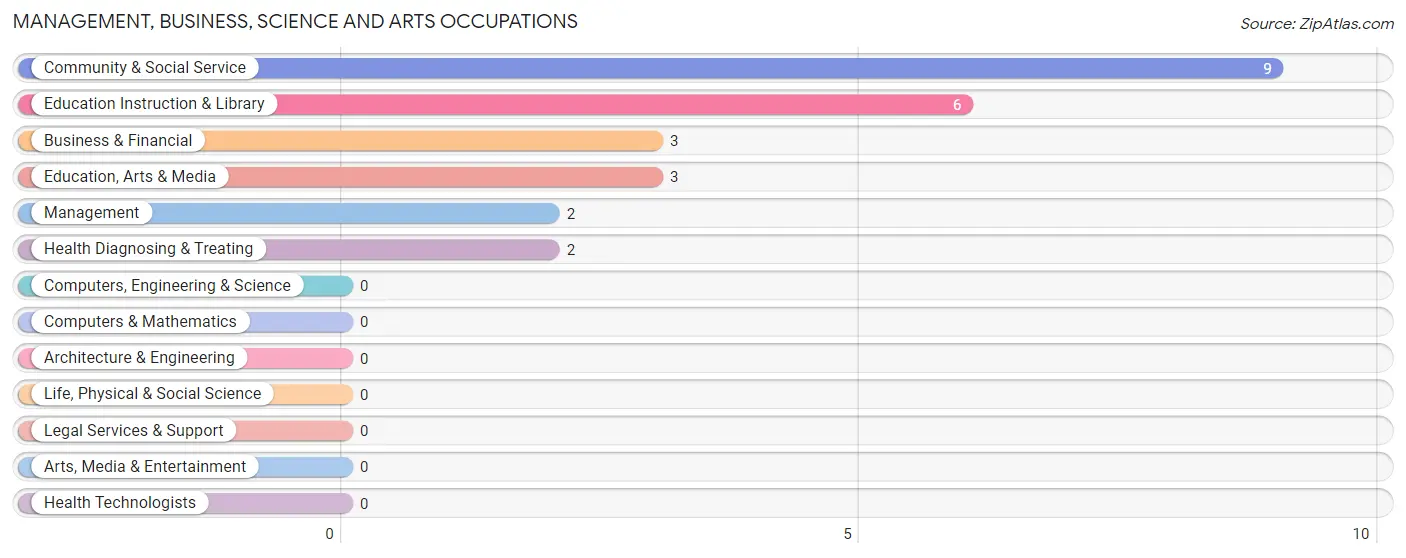
Management, Business, Science and Arts Occupations
The most common Management, Business, Science and Arts occupations in Kaibab are Community & Social Service (9 | 13.9%), Education Instruction & Library (6 | 9.2%), Business & Financial (3 | 4.6%), Education, Arts & Media (3 | 4.6%), and Management (2 | 3.1%).
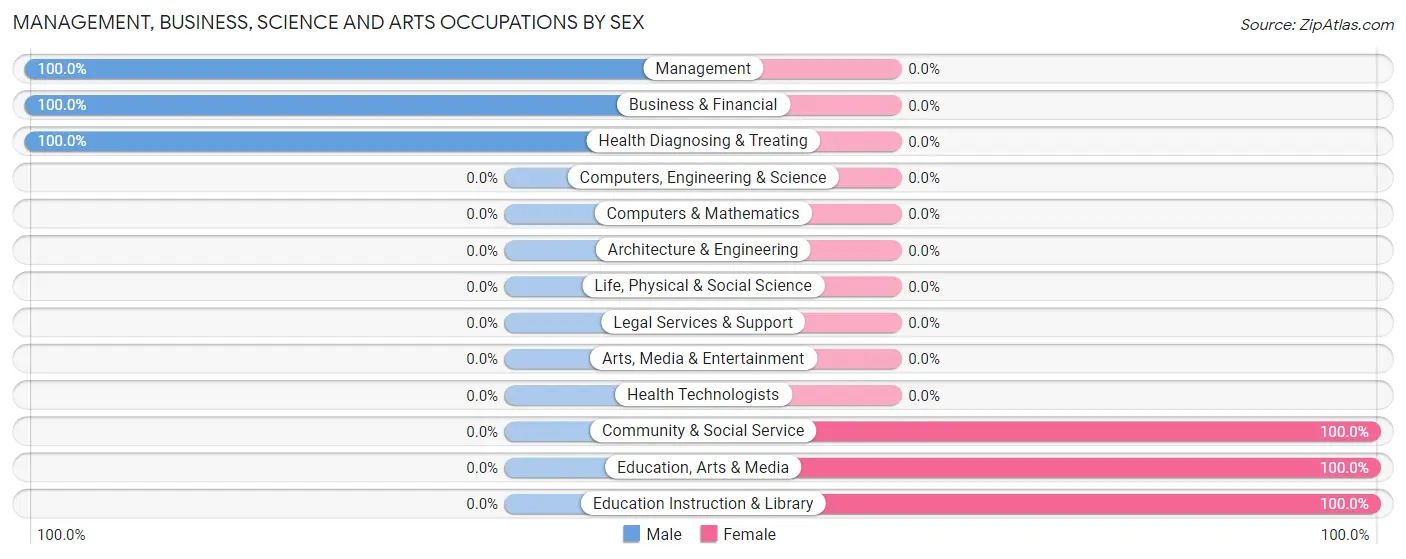
Management, Business, Science and Arts Occupations by Sex
Within the Management, Business, Science and Arts occupations in Kaibab, the most male-oriented occupations are Management (100.0%), Business & Financial (100.0%), and Health Diagnosing & Treating (100.0%), while the most female-oriented occupations are Community & Social Service (100.0%), Education, Arts & Media (100.0%), and Education Instruction & Library (100.0%).
| Occupation | Male | Female |
| Management | 2 (100.0%) | 0 (0.0%) |
| Business & Financial | 3 (100.0%) | 0 (0.0%) |
| Computers, Engineering & Science | 0 (0.0%) | 0 (0.0%) |
| Computers & Mathematics | 0 (0.0%) | 0 (0.0%) |
| Architecture & Engineering | 0 (0.0%) | 0 (0.0%) |
| Life, Physical & Social Science | 0 (0.0%) | 0 (0.0%) |
| Community & Social Service | 0 (0.0%) | 9 (100.0%) |
| Education, Arts & Media | 0 (0.0%) | 3 (100.0%) |
| Legal Services & Support | 0 (0.0%) | 0 (0.0%) |
| Education Instruction & Library | 0 (0.0%) | 6 (100.0%) |
| Arts, Media & Entertainment | 0 (0.0%) | 0 (0.0%) |
| Health Diagnosing & Treating | 2 (100.0%) | 0 (0.0%) |
| Health Technologists | 0 (0.0%) | 0 (0.0%) |
| Total (Category) | 7 (43.8%) | 9 (56.2%) |
| Total (Overall) | 31 (47.7%) | 34 (52.3%) |
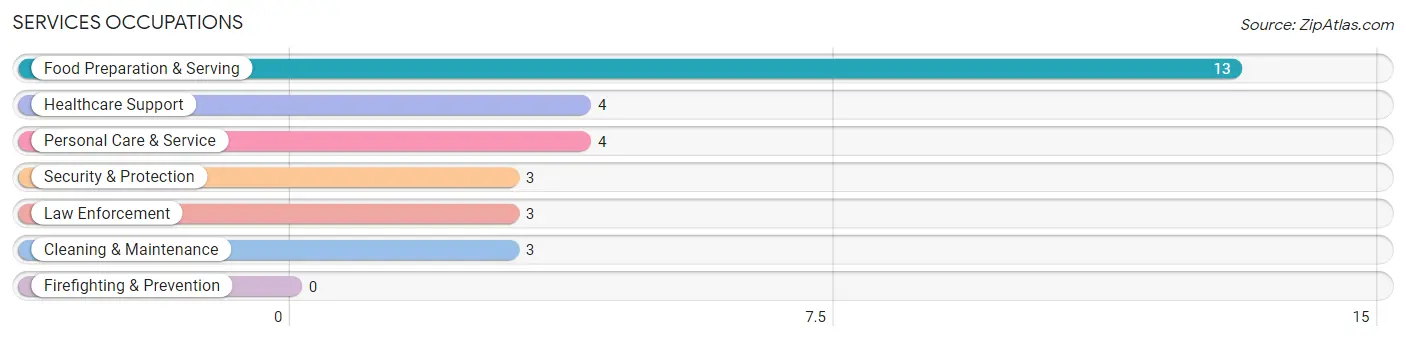
Services Occupations
The most common Services occupations in Kaibab are Food Preparation & Serving (13 | 20.0%), Healthcare Support (4 | 6.1%), Personal Care & Service (4 | 6.1%), Security & Protection (3 | 4.6%), and Law Enforcement (3 | 4.6%).
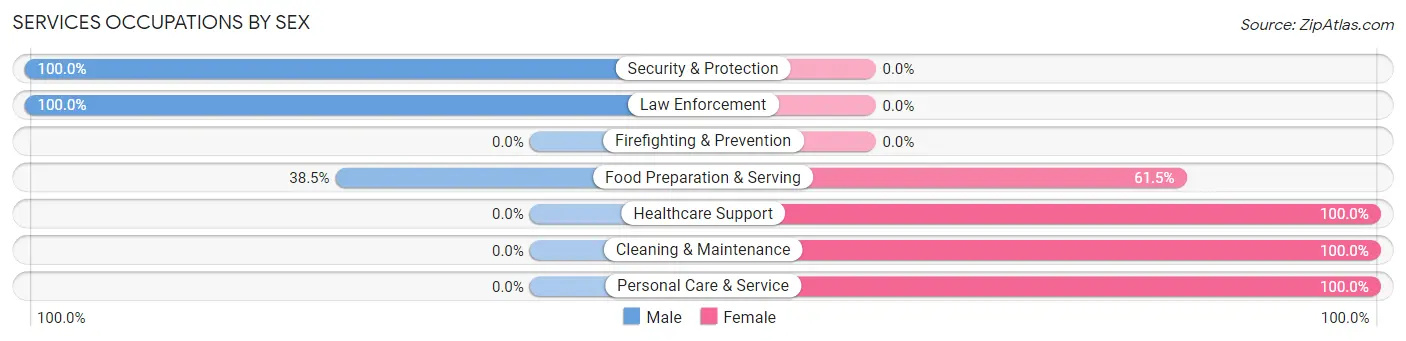
Services Occupations by Sex
Within the Services occupations in Kaibab, the most male-oriented occupations are Security & Protection (100.0%), Law Enforcement (100.0%), and Food Preparation & Serving (38.5%), while the most female-oriented occupations are Healthcare Support (100.0%), Cleaning & Maintenance (100.0%), and Personal Care & Service (100.0%).
| Occupation | Male | Female |
| Healthcare Support | 0 (0.0%) | 4 (100.0%) |
| Security & Protection | 3 (100.0%) | 0 (0.0%) |
| Firefighting & Prevention | 0 (0.0%) | 0 (0.0%) |
| Law Enforcement | 3 (100.0%) | 0 (0.0%) |
| Food Preparation & Serving | 5 (38.5%) | 8 (61.5%) |
| Cleaning & Maintenance | 0 (0.0%) | 3 (100.0%) |
| Personal Care & Service | 0 (0.0%) | 4 (100.0%) |
| Total (Category) | 8 (29.6%) | 19 (70.4%) |
| Total (Overall) | 31 (47.7%) | 34 (52.3%) |
Sales and Office Occupations
The most common Sales and Office occupations in Kaibab are , and Sales & Related (6 | 9.2%).
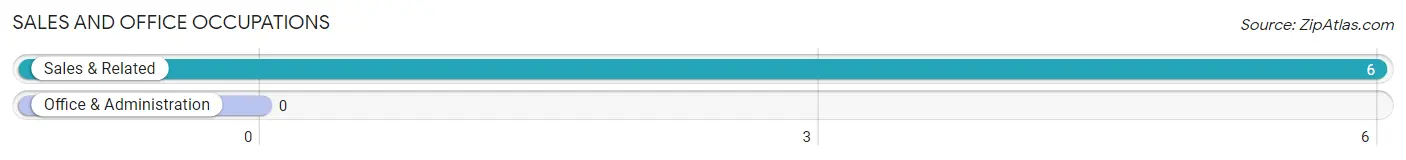
Sales and Office Occupations by Sex
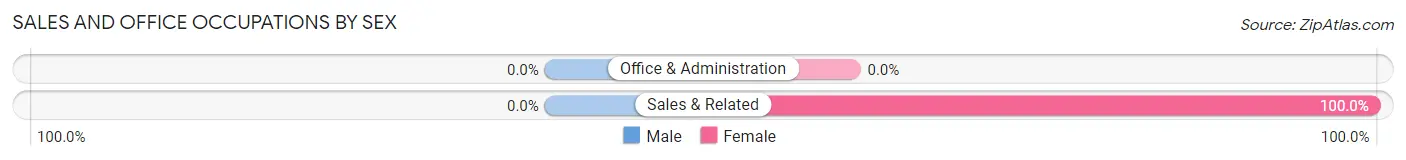
| Occupation | Male | Female |
| Sales & Related | 0 (0.0%) | 6 (100.0%) |
| Office & Administration | 0 (0.0%) | 0 (0.0%) |
| Total (Category) | 0 (0.0%) | 6 (100.0%) |
| Total (Overall) | 31 (47.7%) | 34 (52.3%) |
Natural Resources, Construction and Maintenance Occupations
The most common Natural Resources, Construction and Maintenance occupations in Kaibab are , and Construction & Extraction (1 | 1.5%).
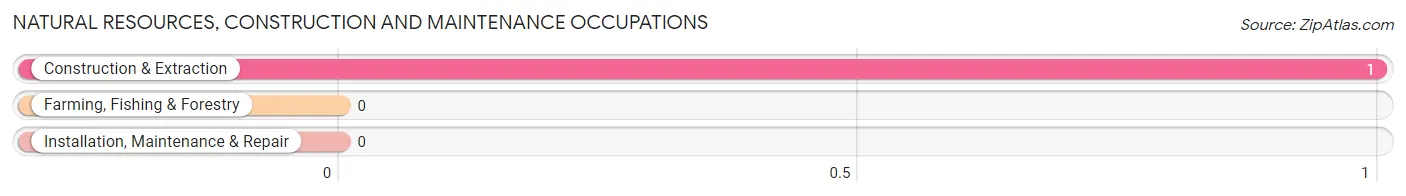
Natural Resources, Construction and Maintenance Occupations by Sex
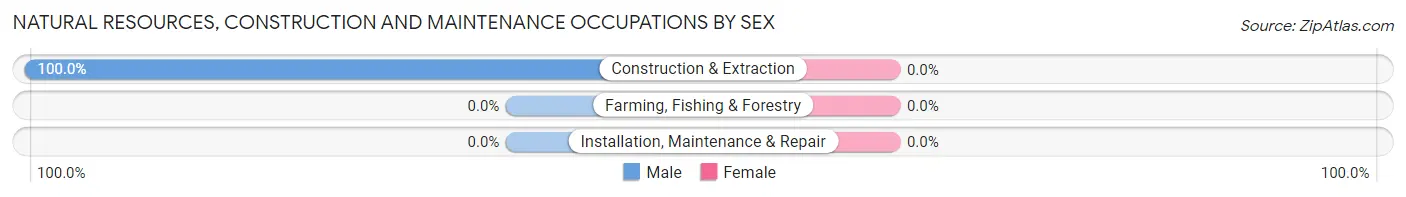
| Occupation | Male | Female |
| Farming, Fishing & Forestry | 0 (0.0%) | 0 (0.0%) |
| Construction & Extraction | 1 (100.0%) | 0 (0.0%) |
| Installation, Maintenance & Repair | 0 (0.0%) | 0 (0.0%) |
| Total (Category) | 1 (100.0%) | 0 (0.0%) |
| Total (Overall) | 31 (47.7%) | 34 (52.3%) |
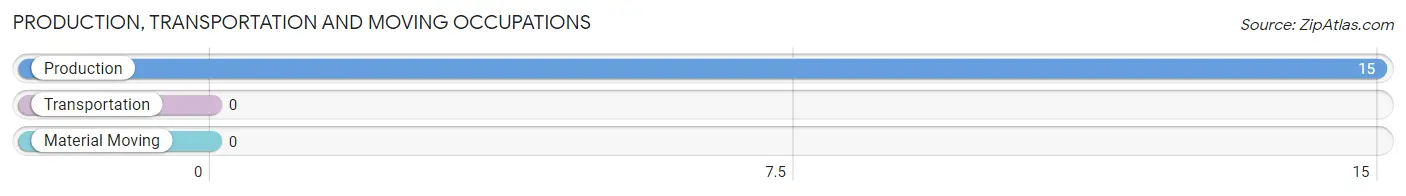
Production, Transportation and Moving Occupations
The most common Production, Transportation and Moving occupations in Kaibab are , and Production (15 | 23.1%).
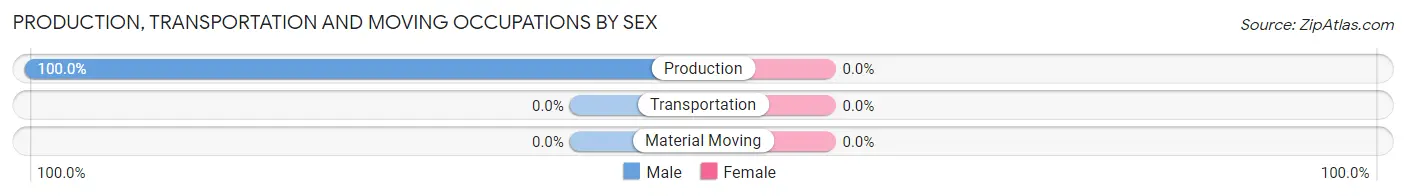
Production, Transportation and Moving Occupations by Sex
| Occupation | Male | Female |
| Production | 15 (100.0%) | 0 (0.0%) |
| Transportation | 0 (0.0%) | 0 (0.0%) |
| Material Moving | 0 (0.0%) | 0 (0.0%) |
| Total (Category) | 15 (100.0%) | 0 (0.0%) |
| Total (Overall) | 31 (47.7%) | 34 (52.3%) |
Employment Industries by Sex in Kaibab
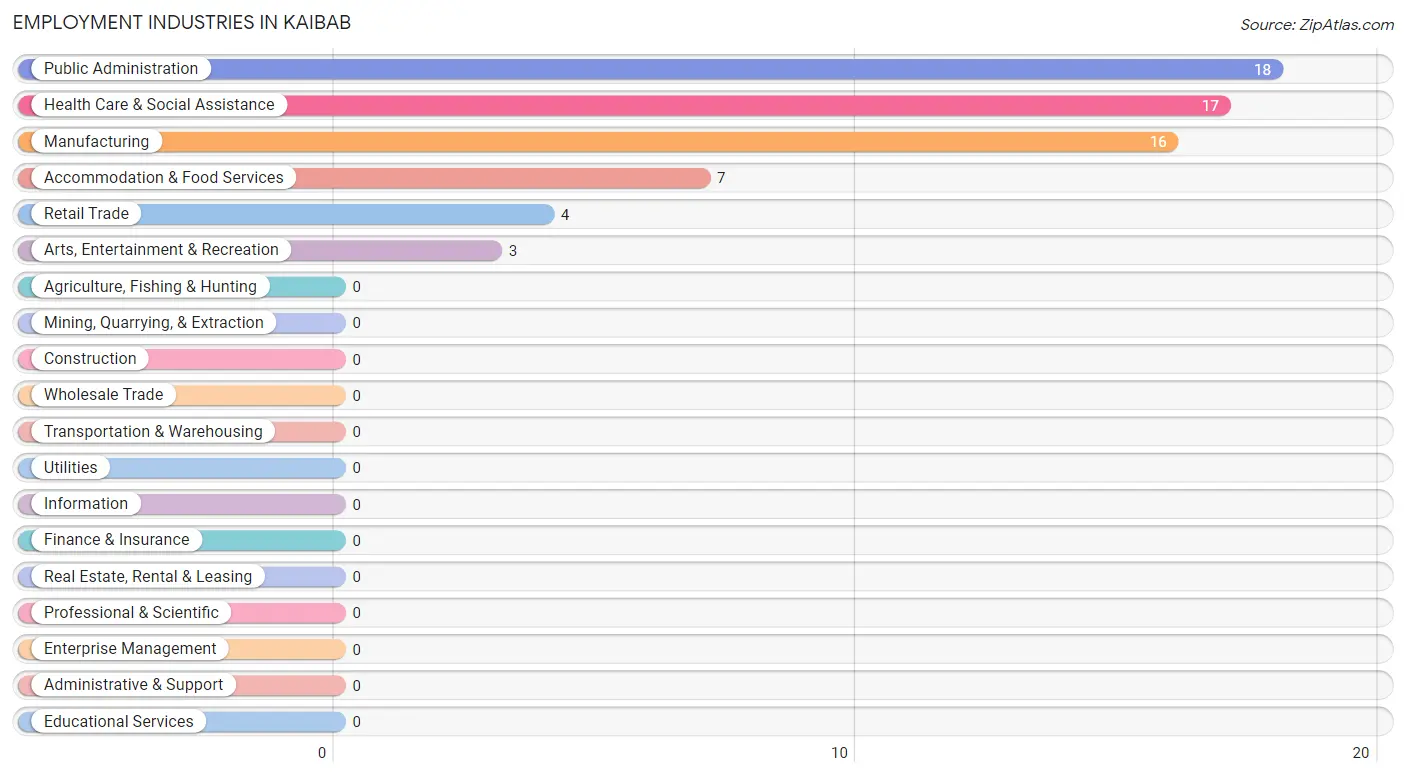
Employment Industries in Kaibab
The major employment industries in Kaibab include Public Administration (18 | 27.7%), Health Care & Social Assistance (17 | 26.2%), Manufacturing (16 | 24.6%), Accommodation & Food Services (7 | 10.8%), and Retail Trade (4 | 6.1%).
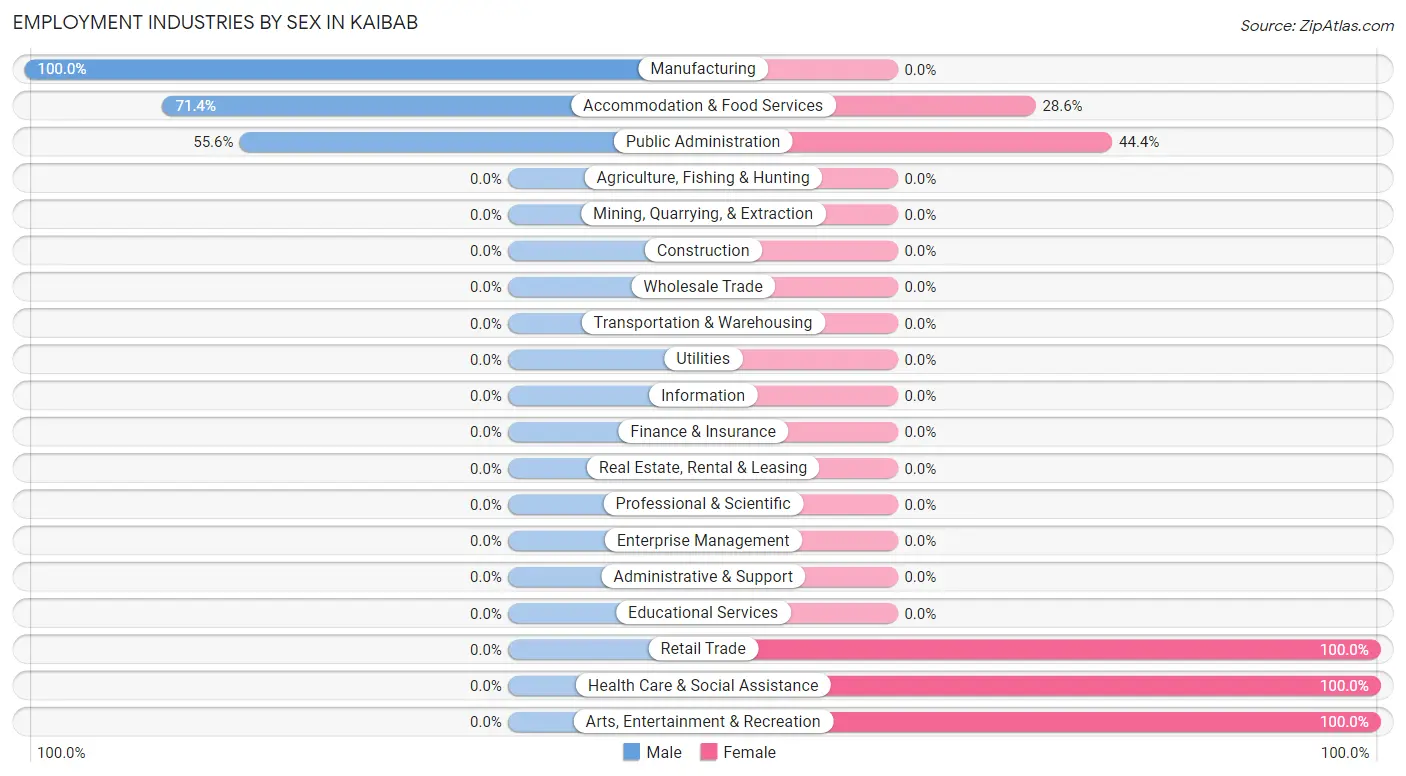
Employment Industries by Sex in Kaibab
The Kaibab industries that see more men than women are Manufacturing (100.0%), Accommodation & Food Services (71.4%), and Public Administration (55.6%), whereas the industries that tend to have a higher number of women are Retail Trade (100.0%), Health Care & Social Assistance (100.0%), and Arts, Entertainment & Recreation (100.0%).
| Industry | Male | Female |
| Agriculture, Fishing & Hunting | 0 (0.0%) | 0 (0.0%) |
| Mining, Quarrying, & Extraction | 0 (0.0%) | 0 (0.0%) |
| Construction | 0 (0.0%) | 0 (0.0%) |
| Manufacturing | 16 (100.0%) | 0 (0.0%) |
| Wholesale Trade | 0 (0.0%) | 0 (0.0%) |
| Retail Trade | 0 (0.0%) | 4 (100.0%) |
| Transportation & Warehousing | 0 (0.0%) | 0 (0.0%) |
| Utilities | 0 (0.0%) | 0 (0.0%) |
| Information | 0 (0.0%) | 0 (0.0%) |
| Finance & Insurance | 0 (0.0%) | 0 (0.0%) |
| Real Estate, Rental & Leasing | 0 (0.0%) | 0 (0.0%) |
| Professional & Scientific | 0 (0.0%) | 0 (0.0%) |
| Enterprise Management | 0 (0.0%) | 0 (0.0%) |
| Administrative & Support | 0 (0.0%) | 0 (0.0%) |
| Educational Services | 0 (0.0%) | 0 (0.0%) |
| Health Care & Social Assistance | 0 (0.0%) | 17 (100.0%) |
| Arts, Entertainment & Recreation | 0 (0.0%) | 3 (100.0%) |
| Accommodation & Food Services | 5 (71.4%) | 2 (28.6%) |
| Public Administration | 10 (55.6%) | 8 (44.4%) |
| Total | 31 (47.7%) | 34 (52.3%) |
Education in Kaibab
School Enrollment in Kaibab
The most common levels of schooling among the 19 students in Kaibab are college / undergraduate (12 | 63.2%), high school (4 | 21.0%), and kindergarten (3 | 15.8%).
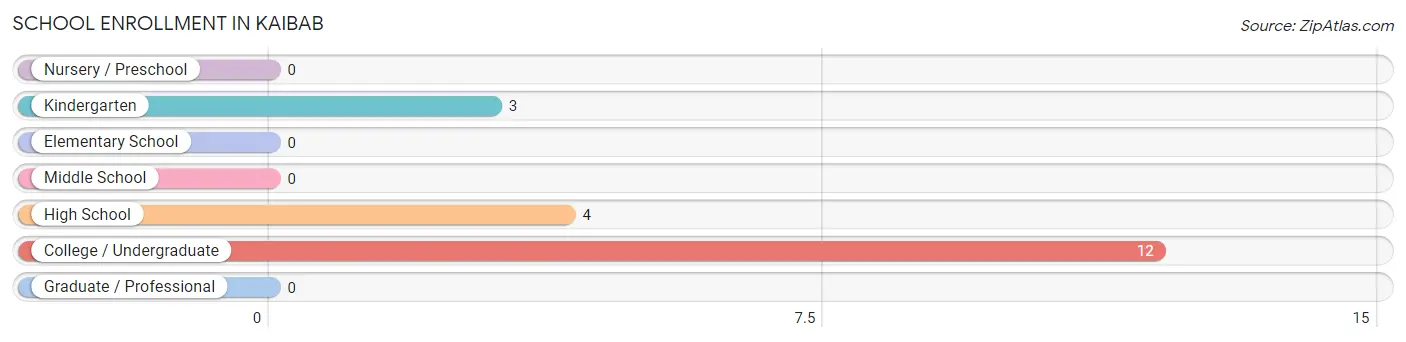
| School Level | # Students | % Students |
| Nursery / Preschool | 0 | 0.0% |
| Kindergarten | 3 | 15.8% |
| Elementary School | 0 | 0.0% |
| Middle School | 0 | 0.0% |
| High School | 4 | 21.0% |
| College / Undergraduate | 12 | 63.2% |
| Graduate / Professional | 0 | 0.0% |
| Total | 19 | 100.0% |
School Enrollment by Age by Funding Source in Kaibab
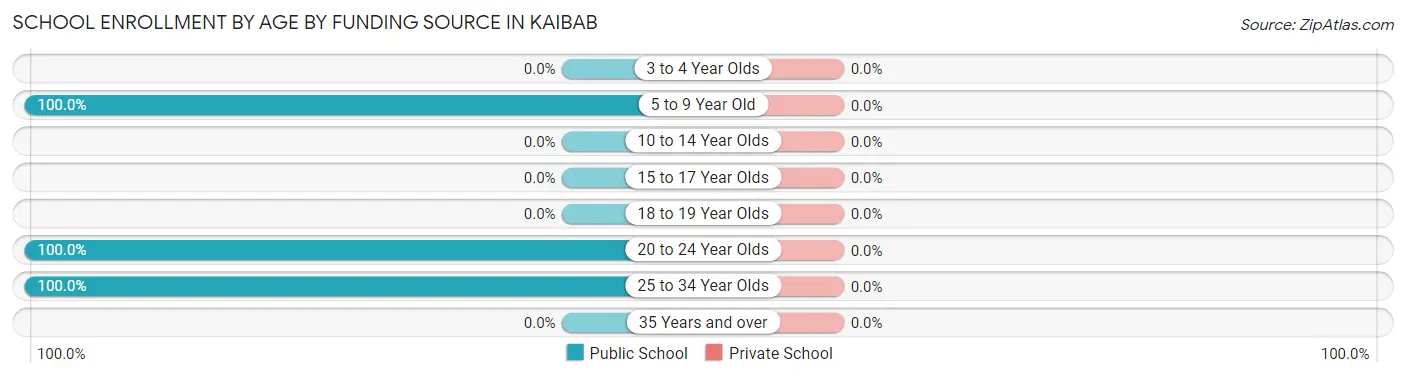
| Age Bracket | Public School | Private School |
| 3 to 4 Year Olds | 0 (0.0%) | 0 (0.0%) |
| 5 to 9 Year Old | 3 (100.0%) | 0 (0.0%) |
| 10 to 14 Year Olds | 0 (0.0%) | 0 (0.0%) |
| 15 to 17 Year Olds | 0 (0.0%) | 0 (0.0%) |
| 18 to 19 Year Olds | 0 (0.0%) | 0 (0.0%) |
| 20 to 24 Year Olds | 4 (100.0%) | 0 (0.0%) |
| 25 to 34 Year Olds | 12 (100.0%) | 0 (0.0%) |
| 35 Years and over | 0 (0.0%) | 0 (0.0%) |
| Total | 19 (100.0%) | 0 (0.0%) |
Educational Attainment by Field of Study in Kaibab
Business (3 | 75.0%), and psychology (1 | 25.0%) are the most common fields of study among 4 individuals in Kaibab who have obtained a bachelor's degree or higher.
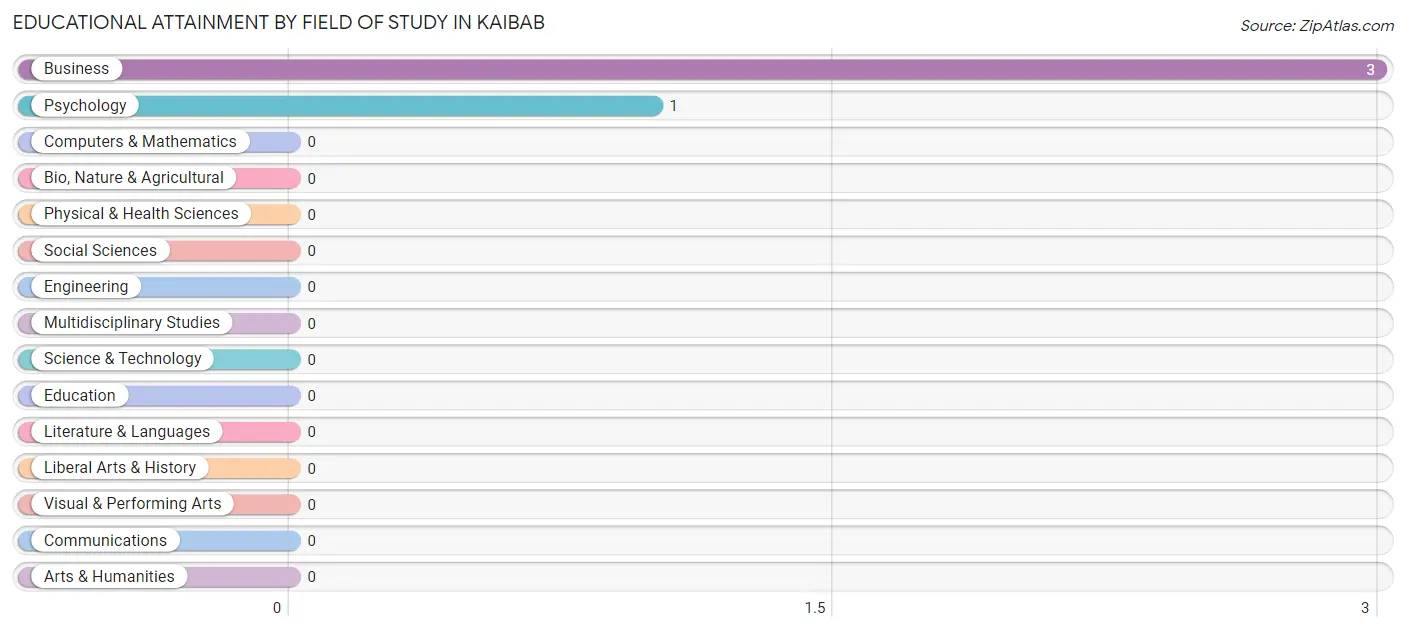
| Field of Study | # Graduates | % Graduates |
| Computers & Mathematics | 0 | 0.0% |
| Bio, Nature & Agricultural | 0 | 0.0% |
| Physical & Health Sciences | 0 | 0.0% |
| Psychology | 1 | 25.0% |
| Social Sciences | 0 | 0.0% |
| Engineering | 0 | 0.0% |
| Multidisciplinary Studies | 0 | 0.0% |
| Science & Technology | 0 | 0.0% |
| Business | 3 | 75.0% |
| Education | 0 | 0.0% |
| Literature & Languages | 0 | 0.0% |
| Liberal Arts & History | 0 | 0.0% |
| Visual & Performing Arts | 0 | 0.0% |
| Communications | 0 | 0.0% |
| Arts & Humanities | 0 | 0.0% |
| Total | 4 | 100.0% |
Transportation & Commute in Kaibab
Vehicle Availability by Sex in Kaibab
The most prevalent vehicle ownership categories in Kaibab are males with 3 vehicles (17, accounting for 54.8%) and females with 3 vehicles (18, making up 50.0%).
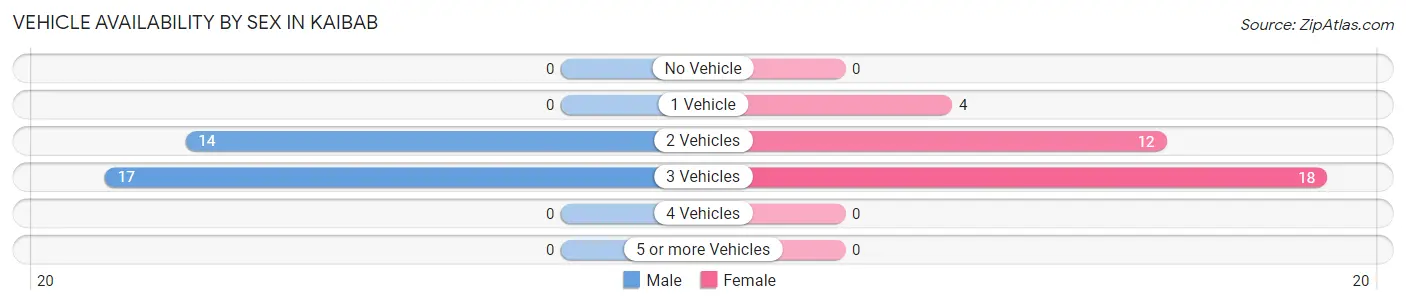
| Vehicles Available | Male | Female |
| No Vehicle | 0 (0.0%) | 0 (0.0%) |
| 1 Vehicle | 0 (0.0%) | 4 (11.8%) |
| 2 Vehicles | 14 (45.2%) | 12 (35.3%) |
| 3 Vehicles | 17 (54.8%) | 18 (52.9%) |
| 4 Vehicles | 0 (0.0%) | 0 (0.0%) |
| 5 or more Vehicles | 0 (0.0%) | 0 (0.0%) |
| Total | 31 (100.0%) | 34 (100.0%) |
Commute Time in Kaibab
The most frequently occuring commute durations in Kaibab are 5 to 9 minutes (22 commuters, 33.9%), less than 5 minutes (17 commuters, 26.2%), and 30 to 34 minutes (14 commuters, 21.5%).
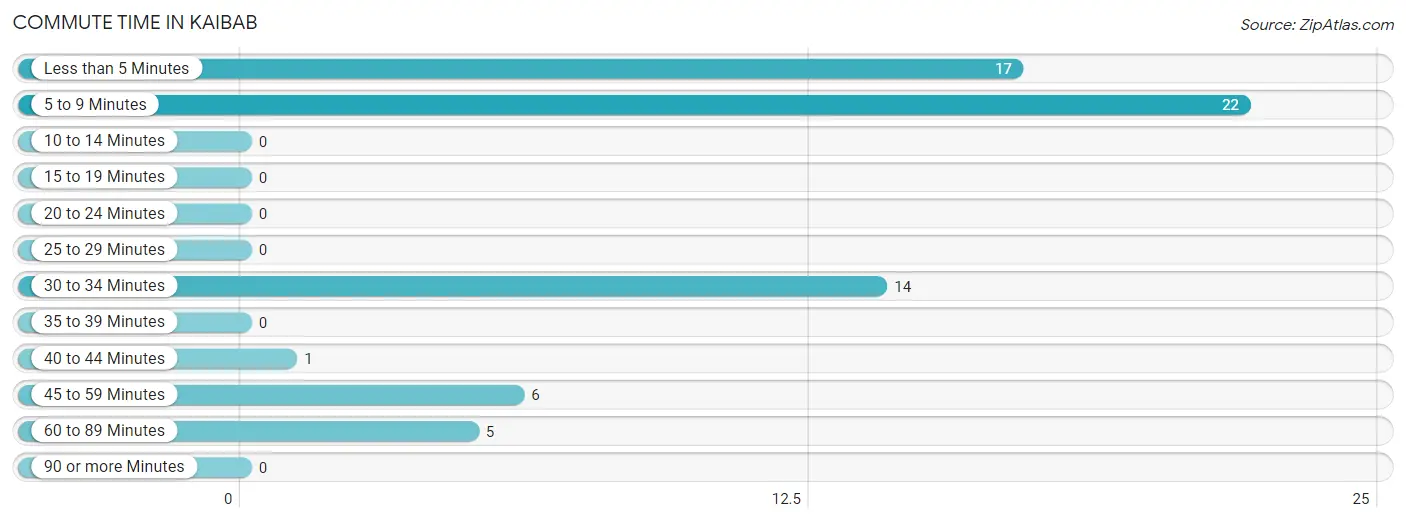
| Commute Time | # Commuters | % Commuters |
| Less than 5 Minutes | 17 | 26.2% |
| 5 to 9 Minutes | 22 | 33.9% |
| 10 to 14 Minutes | 0 | 0.0% |
| 15 to 19 Minutes | 0 | 0.0% |
| 20 to 24 Minutes | 0 | 0.0% |
| 25 to 29 Minutes | 0 | 0.0% |
| 30 to 34 Minutes | 14 | 21.5% |
| 35 to 39 Minutes | 0 | 0.0% |
| 40 to 44 Minutes | 1 | 1.5% |
| 45 to 59 Minutes | 6 | 9.2% |
| 60 to 89 Minutes | 5 | 7.7% |
| 90 or more Minutes | 0 | 0.0% |
Commute Time by Sex in Kaibab
The most common commute times in Kaibab are less than 5 minutes (17 commuters, 54.8%) for males and 5 to 9 minutes (14 commuters, 41.2%) for females.
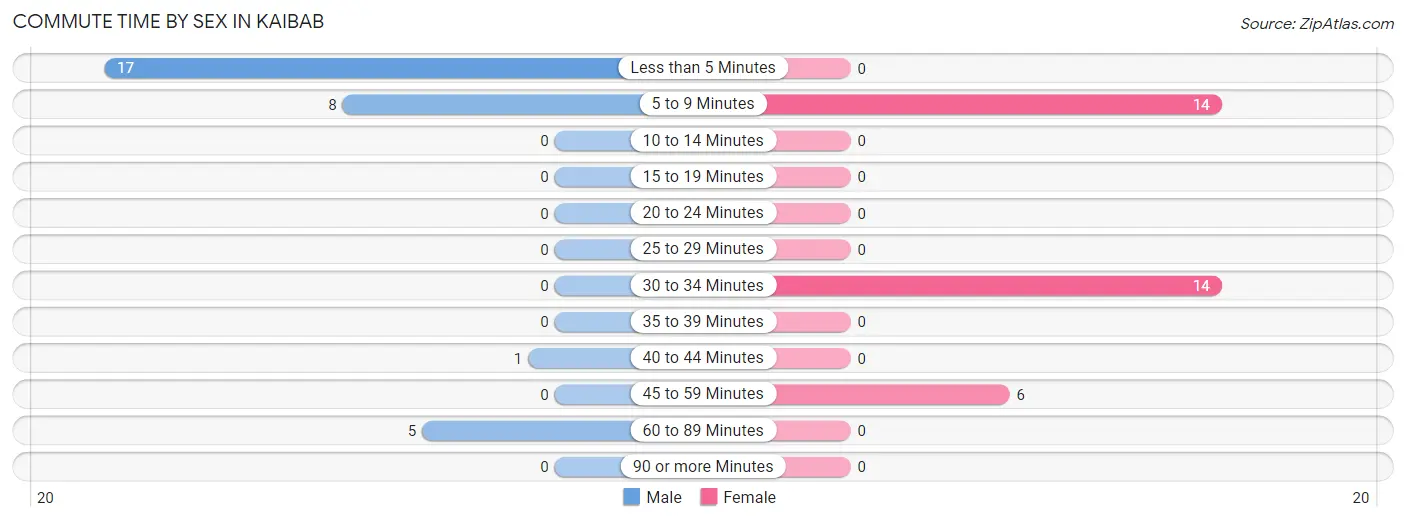
| Commute Time | Male | Female |
| Less than 5 Minutes | 17 (54.8%) | 0 (0.0%) |
| 5 to 9 Minutes | 8 (25.8%) | 14 (41.2%) |
| 10 to 14 Minutes | 0 (0.0%) | 0 (0.0%) |
| 15 to 19 Minutes | 0 (0.0%) | 0 (0.0%) |
| 20 to 24 Minutes | 0 (0.0%) | 0 (0.0%) |
| 25 to 29 Minutes | 0 (0.0%) | 0 (0.0%) |
| 30 to 34 Minutes | 0 (0.0%) | 14 (41.2%) |
| 35 to 39 Minutes | 0 (0.0%) | 0 (0.0%) |
| 40 to 44 Minutes | 1 (3.2%) | 0 (0.0%) |
| 45 to 59 Minutes | 0 (0.0%) | 6 (17.6%) |
| 60 to 89 Minutes | 5 (16.1%) | 0 (0.0%) |
| 90 or more Minutes | 0 (0.0%) | 0 (0.0%) |
Time of Departure to Work by Sex in Kaibab
The most frequent times of departure to work in Kaibab are 8:00 AM to 8:29 AM (20, 64.5%) for males and 7:00 AM to 7:29 AM (12, 35.3%) for females.
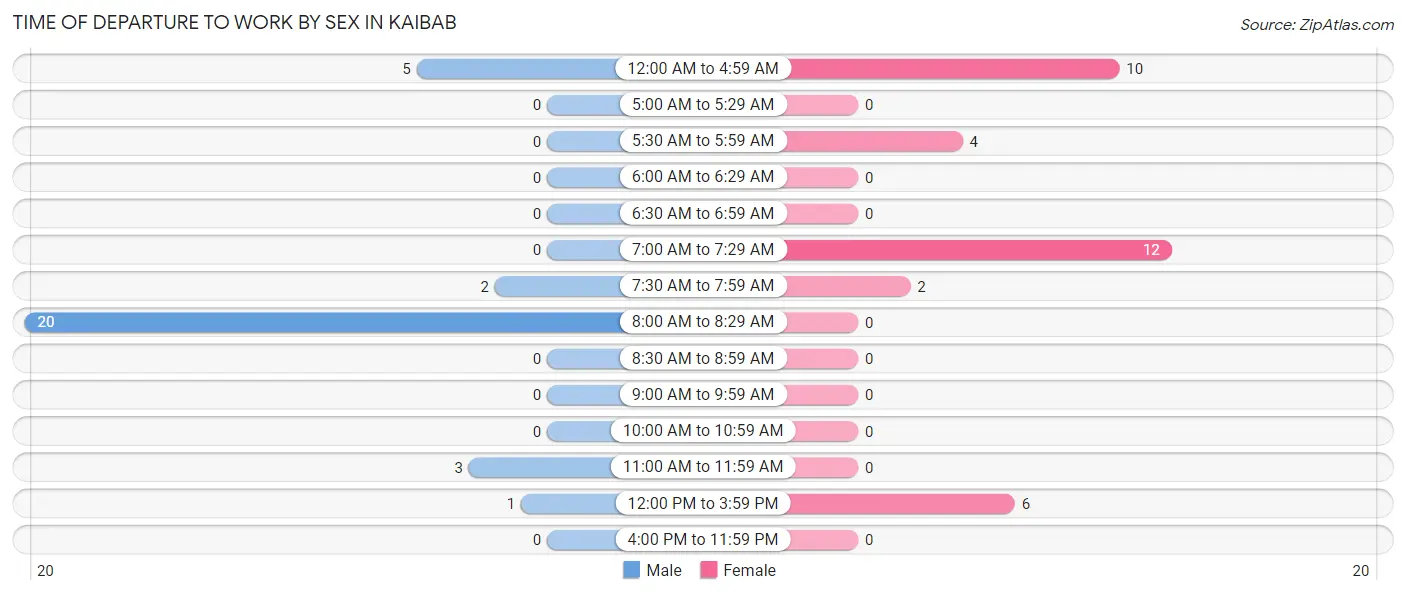
| Time of Departure | Male | Female |
| 12:00 AM to 4:59 AM | 5 (16.1%) | 10 (29.4%) |
| 5:00 AM to 5:29 AM | 0 (0.0%) | 0 (0.0%) |
| 5:30 AM to 5:59 AM | 0 (0.0%) | 4 (11.8%) |
| 6:00 AM to 6:29 AM | 0 (0.0%) | 0 (0.0%) |
| 6:30 AM to 6:59 AM | 0 (0.0%) | 0 (0.0%) |
| 7:00 AM to 7:29 AM | 0 (0.0%) | 12 (35.3%) |
| 7:30 AM to 7:59 AM | 2 (6.5%) | 2 (5.9%) |
| 8:00 AM to 8:29 AM | 20 (64.5%) | 0 (0.0%) |
| 8:30 AM to 8:59 AM | 0 (0.0%) | 0 (0.0%) |
| 9:00 AM to 9:59 AM | 0 (0.0%) | 0 (0.0%) |
| 10:00 AM to 10:59 AM | 0 (0.0%) | 0 (0.0%) |
| 11:00 AM to 11:59 AM | 3 (9.7%) | 0 (0.0%) |
| 12:00 PM to 3:59 PM | 1 (3.2%) | 6 (17.6%) |
| 4:00 PM to 11:59 PM | 0 (0.0%) | 0 (0.0%) |
| Total | 31 (100.0%) | 34 (100.0%) |
Housing Occupancy in Kaibab
Occupancy by Ownership in Kaibab
Of the total 56 dwellings in Kaibab, owner-occupied units account for 39 (69.6%), while renter-occupied units make up 17 (30.4%).
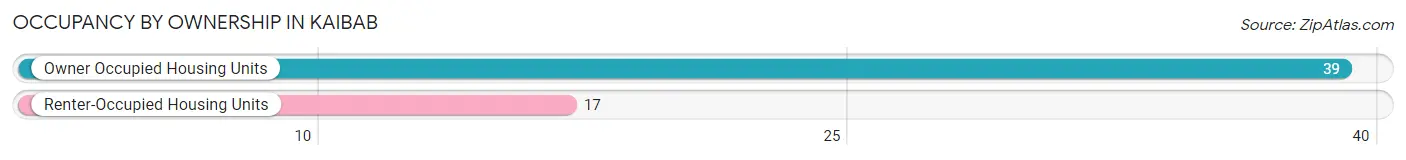
| Occupancy | # Housing Units | % Housing Units |
| Owner Occupied Housing Units | 39 | 69.6% |
| Renter-Occupied Housing Units | 17 | 30.4% |
| Total Occupied Housing Units | 56 | 100.0% |
Occupancy by Household Size in Kaibab
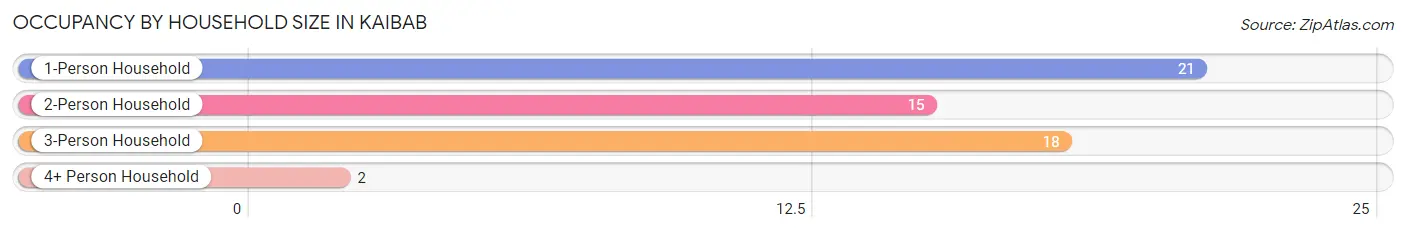
| Household Size | # Housing Units | % Housing Units |
| 1-Person Household | 21 | 37.5% |
| 2-Person Household | 15 | 26.8% |
| 3-Person Household | 18 | 32.1% |
| 4+ Person Household | 2 | 3.6% |
| Total Housing Units | 56 | 100.0% |
Occupancy by Ownership by Household Size in Kaibab
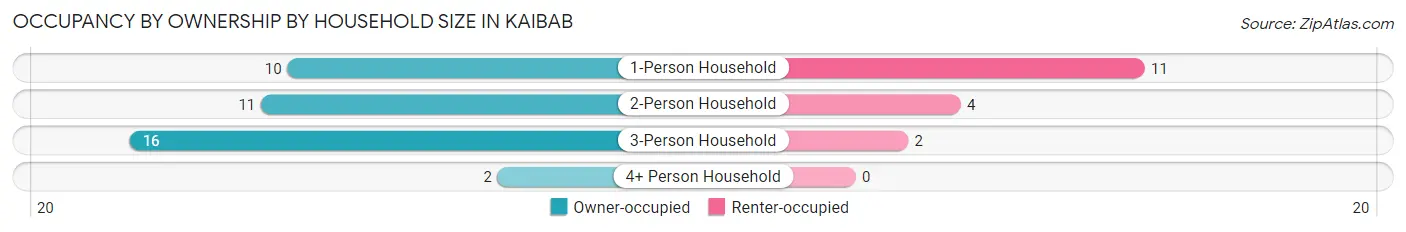
| Household Size | Owner-occupied | Renter-occupied |
| 1-Person Household | 10 (47.6%) | 11 (52.4%) |
| 2-Person Household | 11 (73.3%) | 4 (26.7%) |
| 3-Person Household | 16 (88.9%) | 2 (11.1%) |
| 4+ Person Household | 2 (100.0%) | 0 (0.0%) |
| Total Housing Units | 39 (69.6%) | 17 (30.4%) |
Occupancy by Educational Attainment in Kaibab
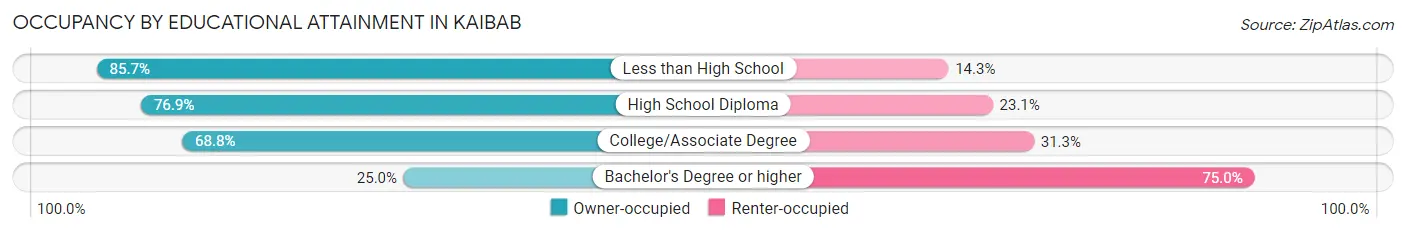
| Household Size | Owner-occupied | Renter-occupied |
| Less than High School | 6 (85.7%) | 1 (14.3%) |
| High School Diploma | 10 (76.9%) | 3 (23.1%) |
| College/Associate Degree | 22 (68.8%) | 10 (31.2%) |
| Bachelor's Degree or higher | 1 (25.0%) | 3 (75.0%) |
Occupancy by Age of Householder in Kaibab
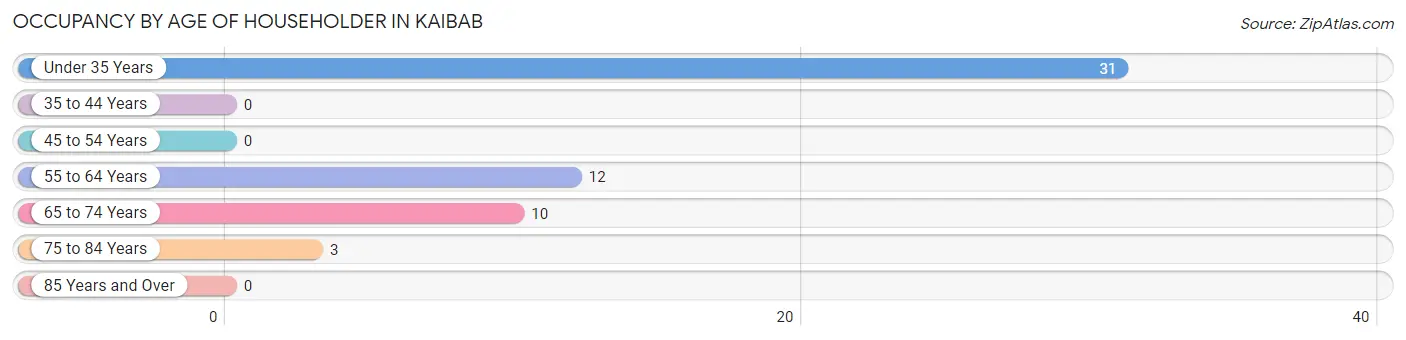
| Age Bracket | # Households | % Households |
| Under 35 Years | 31 | 55.4% |
| 35 to 44 Years | 0 | 0.0% |
| 45 to 54 Years | 0 | 0.0% |
| 55 to 64 Years | 12 | 21.4% |
| 65 to 74 Years | 10 | 17.9% |
| 75 to 84 Years | 3 | 5.4% |
| 85 Years and Over | 0 | 0.0% |
| Total | 56 | 100.0% |
Housing Finances in Kaibab
Median Income by Occupancy in Kaibab
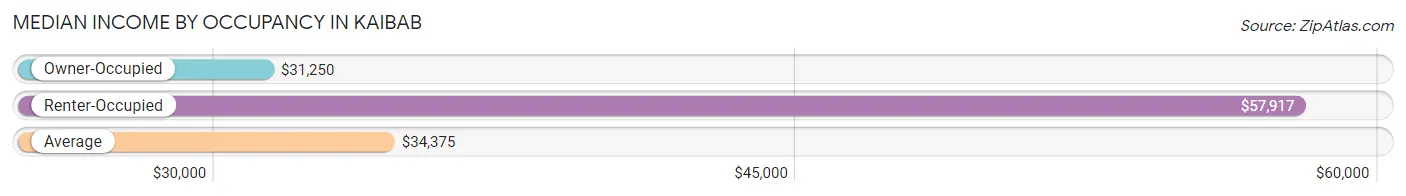
| Occupancy Type | # Households | Median Income |
| Owner-Occupied | 39 (69.6%) | $31,250 |
| Renter-Occupied | 17 (30.4%) | $57,917 |
| Average | 56 (100.0%) | $34,375 |
Occupancy by Householder Income Bracket in Kaibab
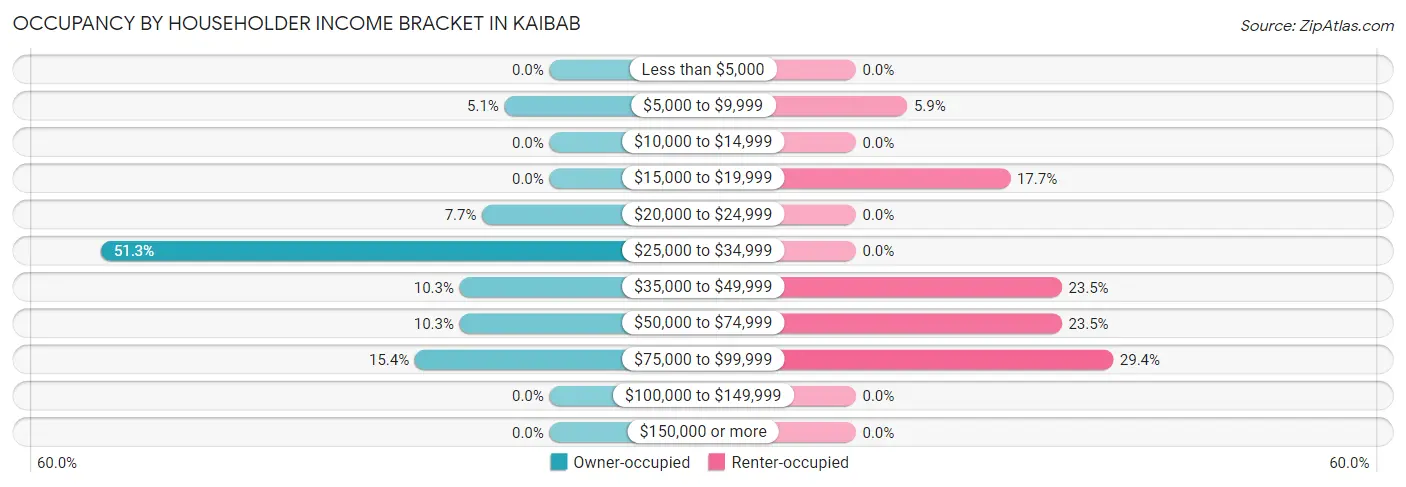
| Income Bracket | Owner-occupied | Renter-occupied |
| Less than $5,000 | 0 (0.0%) | 0 (0.0%) |
| $5,000 to $9,999 | 2 (5.1%) | 1 (5.9%) |
| $10,000 to $14,999 | 0 (0.0%) | 0 (0.0%) |
| $15,000 to $19,999 | 0 (0.0%) | 3 (17.6%) |
| $20,000 to $24,999 | 3 (7.7%) | 0 (0.0%) |
| $25,000 to $34,999 | 20 (51.3%) | 0 (0.0%) |
| $35,000 to $49,999 | 4 (10.3%) | 4 (23.5%) |
| $50,000 to $74,999 | 4 (10.3%) | 4 (23.5%) |
| $75,000 to $99,999 | 6 (15.4%) | 5 (29.4%) |
| $100,000 to $149,999 | 0 (0.0%) | 0 (0.0%) |
| $150,000 or more | 0 (0.0%) | 0 (0.0%) |
| Total | 39 (100.0%) | 17 (100.0%) |
Monthly Housing Cost Tiers in Kaibab
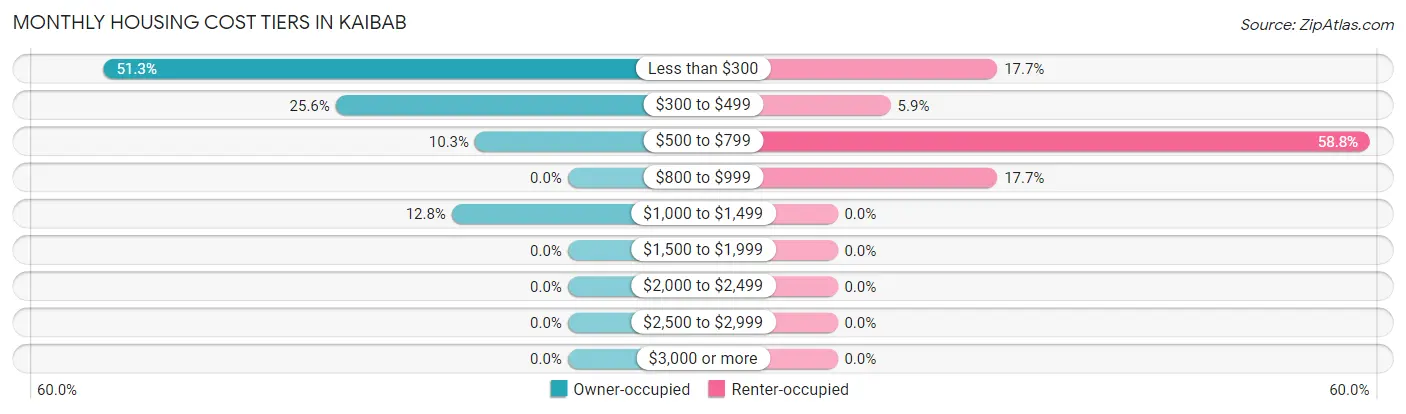
| Monthly Cost | Owner-occupied | Renter-occupied |
| Less than $300 | 20 (51.3%) | 3 (17.6%) |
| $300 to $499 | 10 (25.6%) | 1 (5.9%) |
| $500 to $799 | 4 (10.3%) | 10 (58.8%) |
| $800 to $999 | 0 (0.0%) | 3 (17.6%) |
| $1,000 to $1,499 | 5 (12.8%) | 0 (0.0%) |
| $1,500 to $1,999 | 0 (0.0%) | 0 (0.0%) |
| $2,000 to $2,499 | 0 (0.0%) | 0 (0.0%) |
| $2,500 to $2,999 | 0 (0.0%) | 0 (0.0%) |
| $3,000 or more | 0 (0.0%) | 0 (0.0%) |
| Total | 39 (100.0%) | 17 (100.0%) |
Physical Housing Characteristics in Kaibab
Housing Structures in Kaibab
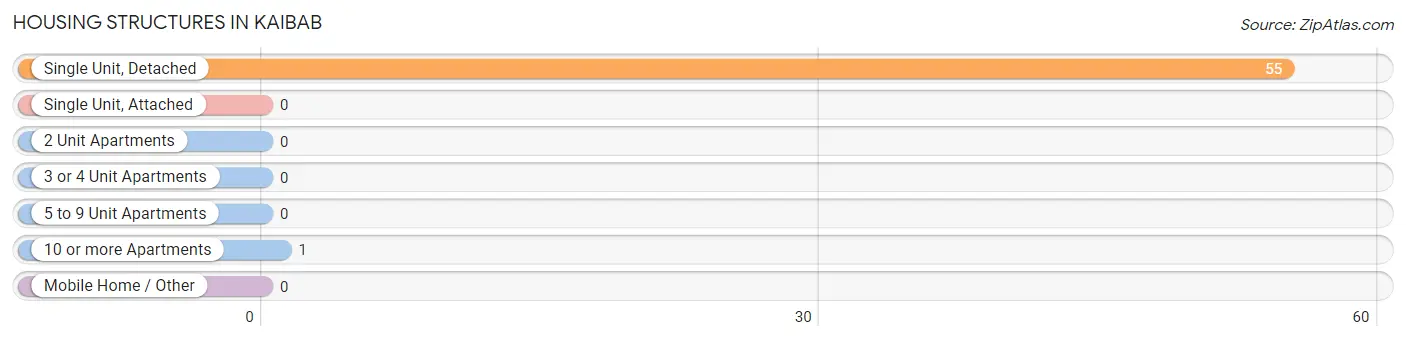
| Structure Type | # Housing Units | % Housing Units |
| Single Unit, Detached | 55 | 98.2% |
| Single Unit, Attached | 0 | 0.0% |
| 2 Unit Apartments | 0 | 0.0% |
| 3 or 4 Unit Apartments | 0 | 0.0% |
| 5 to 9 Unit Apartments | 0 | 0.0% |
| 10 or more Apartments | 1 | 1.8% |
| Mobile Home / Other | 0 | 0.0% |
| Total | 56 | 100.0% |
Housing Structures by Occupancy in Kaibab
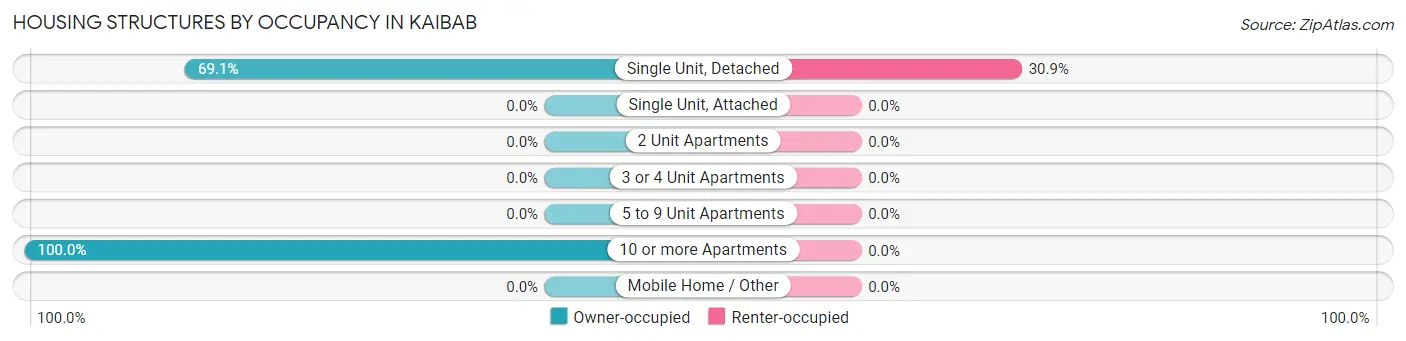
| Structure Type | Owner-occupied | Renter-occupied |
| Single Unit, Detached | 38 (69.1%) | 17 (30.9%) |
| Single Unit, Attached | 0 (0.0%) | 0 (0.0%) |
| 2 Unit Apartments | 0 (0.0%) | 0 (0.0%) |
| 3 or 4 Unit Apartments | 0 (0.0%) | 0 (0.0%) |
| 5 to 9 Unit Apartments | 0 (0.0%) | 0 (0.0%) |
| 10 or more Apartments | 1 (100.0%) | 0 (0.0%) |
| Mobile Home / Other | 0 (0.0%) | 0 (0.0%) |
| Total | 39 (69.6%) | 17 (30.4%) |
Housing Structures by Number of Rooms in Kaibab
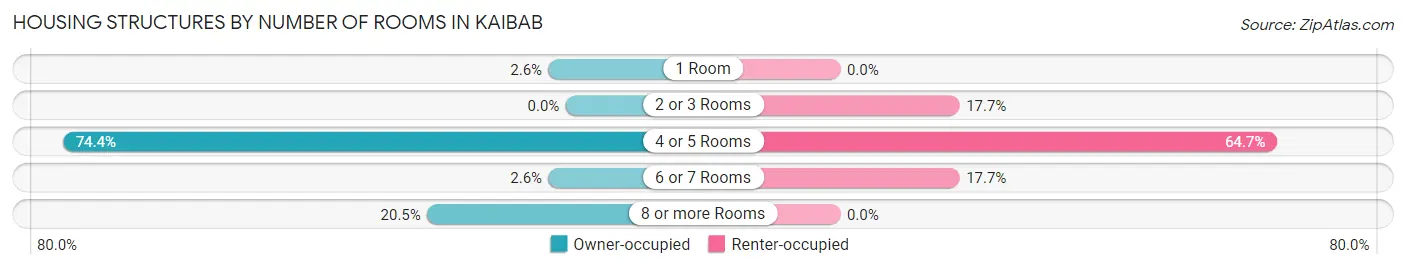
| Number of Rooms | Owner-occupied | Renter-occupied |
| 1 Room | 1 (2.6%) | 0 (0.0%) |
| 2 or 3 Rooms | 0 (0.0%) | 3 (17.6%) |
| 4 or 5 Rooms | 29 (74.4%) | 11 (64.7%) |
| 6 or 7 Rooms | 1 (2.6%) | 3 (17.6%) |
| 8 or more Rooms | 8 (20.5%) | 0 (0.0%) |
| Total | 39 (100.0%) | 17 (100.0%) |
Housing Structure by Heating Type in Kaibab
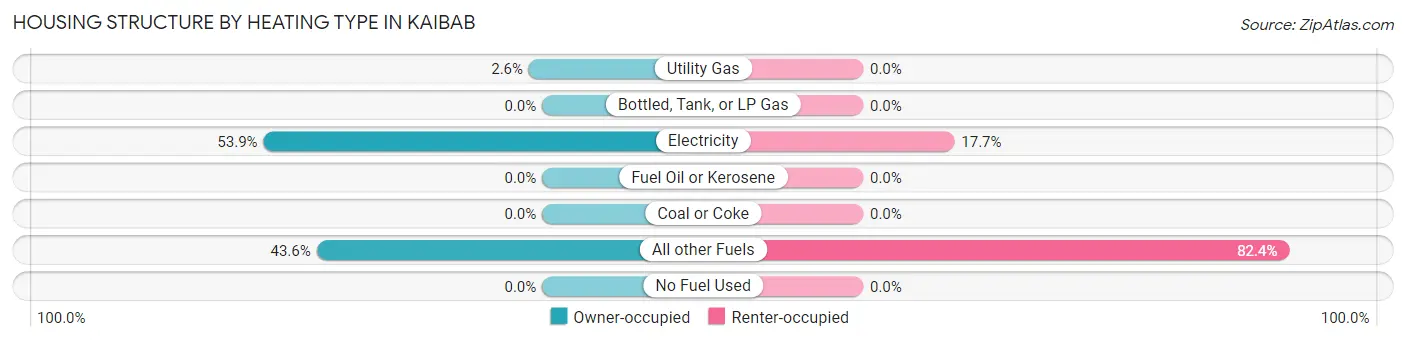
| Heating Type | Owner-occupied | Renter-occupied |
| Utility Gas | 1 (2.6%) | 0 (0.0%) |
| Bottled, Tank, or LP Gas | 0 (0.0%) | 0 (0.0%) |
| Electricity | 21 (53.8%) | 3 (17.6%) |
| Fuel Oil or Kerosene | 0 (0.0%) | 0 (0.0%) |
| Coal or Coke | 0 (0.0%) | 0 (0.0%) |
| All other Fuels | 17 (43.6%) | 14 (82.4%) |
| No Fuel Used | 0 (0.0%) | 0 (0.0%) |
| Total | 39 (100.0%) | 17 (100.0%) |
Household Vehicle Usage in Kaibab
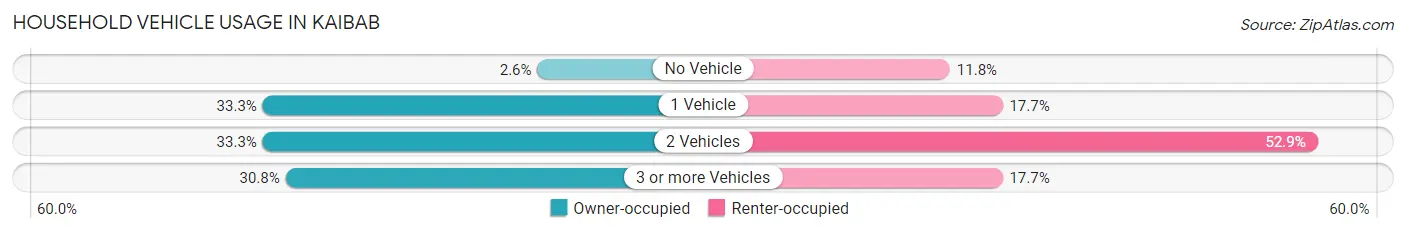
| Vehicles per Household | Owner-occupied | Renter-occupied |
| No Vehicle | 1 (2.6%) | 2 (11.8%) |
| 1 Vehicle | 13 (33.3%) | 3 (17.6%) |
| 2 Vehicles | 13 (33.3%) | 9 (52.9%) |
| 3 or more Vehicles | 12 (30.8%) | 3 (17.6%) |
| Total | 39 (100.0%) | 17 (100.0%) |
Real Estate & Mortgages in Kaibab
Real Estate and Mortgage Overview in Kaibab
| Characteristic | Without Mortgage | With Mortgage |
| Housing Units | 23 | 16 |
| Median Property Value | $105,800 | $208,300 |
| Median Household Income | $30,417 | $0 |
| Monthly Housing Costs | $211 | $0 |
| Real Estate Taxes | - | - |
Property Value by Mortgage Status in Kaibab
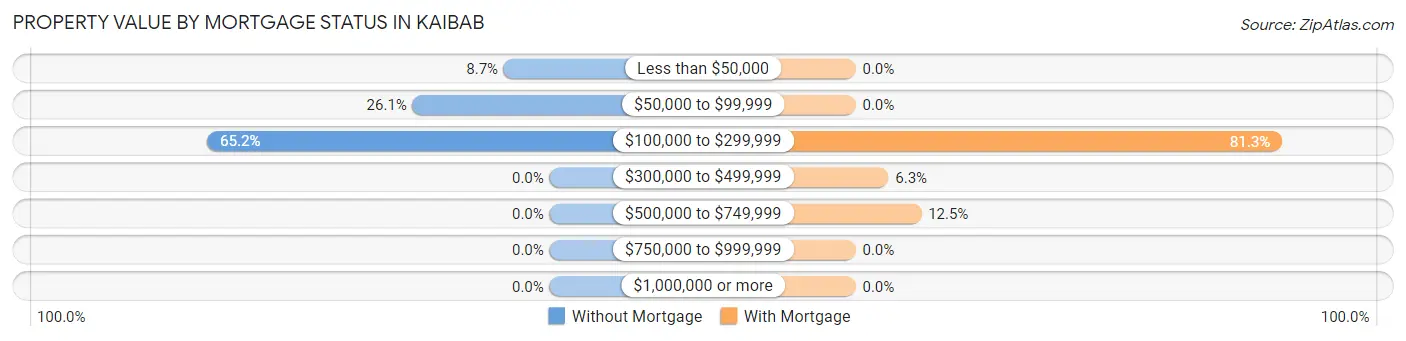
| Property Value | Without Mortgage | With Mortgage |
| Less than $50,000 | 2 (8.7%) | 0 (0.0%) |
| $50,000 to $99,999 | 6 (26.1%) | 0 (0.0%) |
| $100,000 to $299,999 | 15 (65.2%) | 13 (81.2%) |
| $300,000 to $499,999 | 0 (0.0%) | 1 (6.2%) |
| $500,000 to $749,999 | 0 (0.0%) | 2 (12.5%) |
| $750,000 to $999,999 | 0 (0.0%) | 0 (0.0%) |
| $1,000,000 or more | 0 (0.0%) | 0 (0.0%) |
| Total | 23 (100.0%) | 16 (100.0%) |
Household Income by Mortgage Status in Kaibab
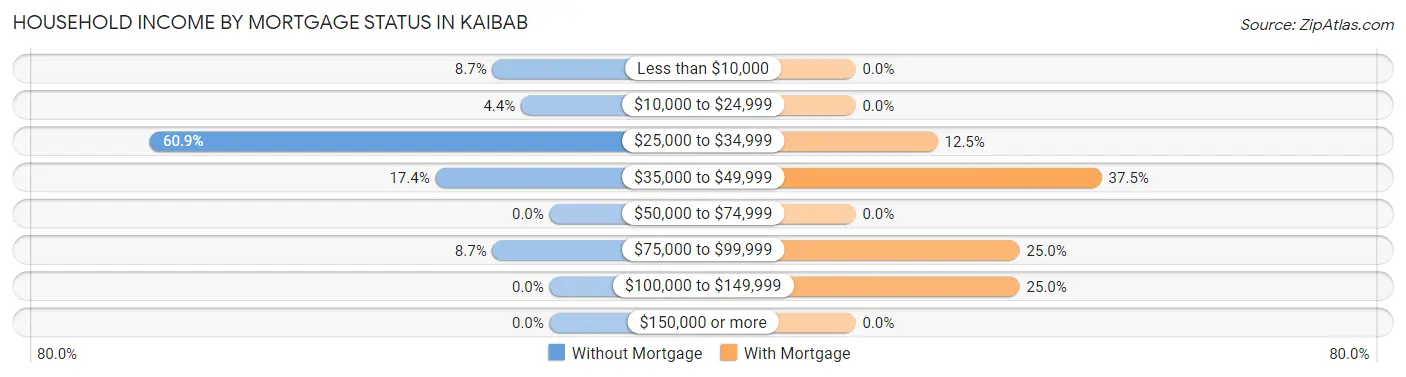
| Household Income | Without Mortgage | With Mortgage |
| Less than $10,000 | 2 (8.7%) | 0 (0.0%) |
| $10,000 to $24,999 | 1 (4.3%) | 0 (0.0%) |
| $25,000 to $34,999 | 14 (60.9%) | 2 (12.5%) |
| $35,000 to $49,999 | 4 (17.4%) | 6 (37.5%) |
| $50,000 to $74,999 | 0 (0.0%) | 0 (0.0%) |
| $75,000 to $99,999 | 2 (8.7%) | 4 (25.0%) |
| $100,000 to $149,999 | 0 (0.0%) | 4 (25.0%) |
| $150,000 or more | 0 (0.0%) | 0 (0.0%) |
| Total | 23 (100.0%) | 16 (100.0%) |
Property Value to Household Income Ratio in Kaibab
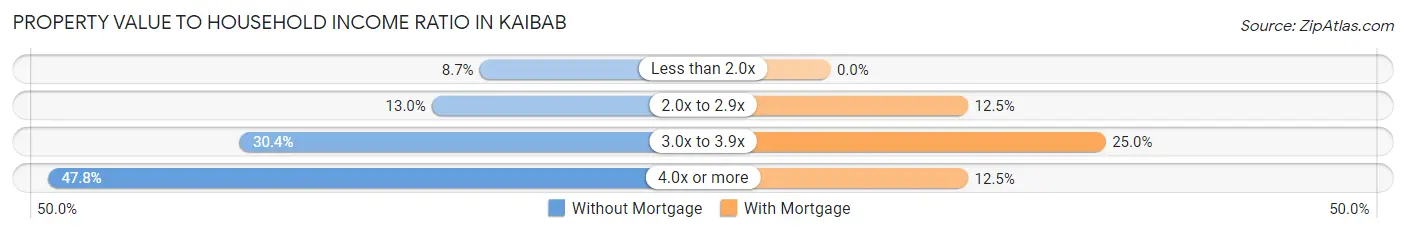
| Value-to-Income Ratio | Without Mortgage | With Mortgage |
| Less than 2.0x | 2 (8.7%) | 0 (0.0%) |
| 2.0x to 2.9x | 3 (13.0%) | 2 (12.5%) |
| 3.0x to 3.9x | 7 (30.4%) | 4 (25.0%) |
| 4.0x or more | 11 (47.8%) | 2 (12.5%) |
| Total | 23 (100.0%) | 16 (100.0%) |
Real Estate Taxes by Mortgage Status in Kaibab
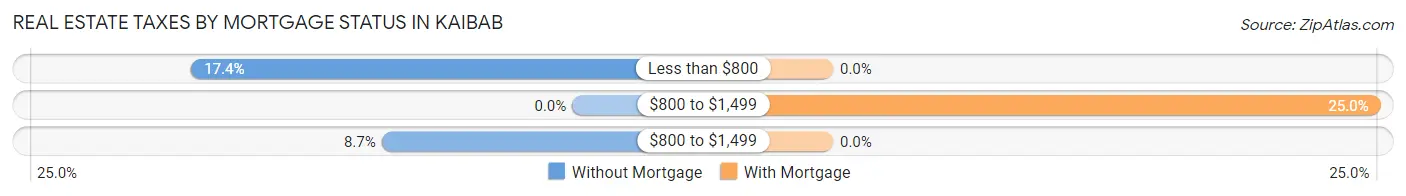
| Property Taxes | Without Mortgage | With Mortgage |
| Less than $800 | 4 (17.4%) | 0 (0.0%) |
| $800 to $1,499 | 0 (0.0%) | 4 (25.0%) |
| $800 to $1,499 | 2 (8.7%) | 0 (0.0%) |
| Total | 23 (100.0%) | 16 (100.0%) |
Health & Disability in Kaibab
Health Insurance Coverage by Age in Kaibab
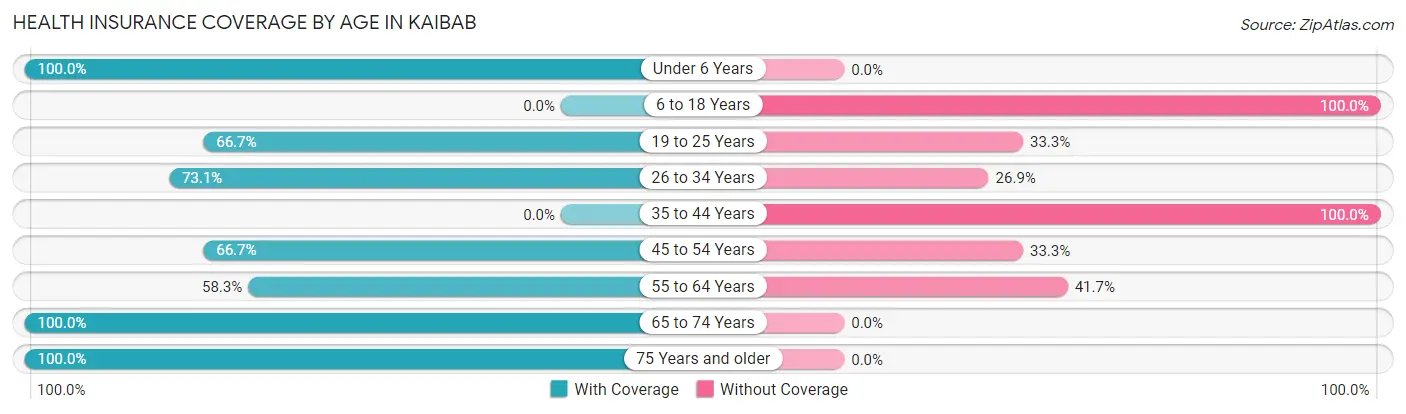
| Age Bracket | With Coverage | Without Coverage |
| Under 6 Years | 30 (100.0%) | 0 (0.0%) |
| 6 to 18 Years | 0 (0.0%) | 2 (100.0%) |
| 19 to 25 Years | 22 (66.7%) | 11 (33.3%) |
| 26 to 34 Years | 19 (73.1%) | 7 (26.9%) |
| 35 to 44 Years | 0 (0.0%) | 8 (100.0%) |
| 45 to 54 Years | 4 (66.7%) | 2 (33.3%) |
| 55 to 64 Years | 7 (58.3%) | 5 (41.7%) |
| 65 to 74 Years | 13 (100.0%) | 0 (0.0%) |
| 75 Years and older | 5 (100.0%) | 0 (0.0%) |
| Total | 100 (74.1%) | 35 (25.9%) |
Health Insurance Coverage by Citizenship Status in Kaibab
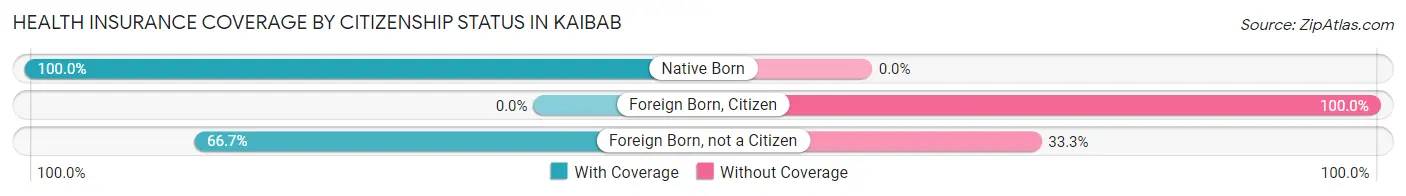
| Citizenship Status | With Coverage | Without Coverage |
| Native Born | 30 (100.0%) | 0 (0.0%) |
| Foreign Born, Citizen | 0 (0.0%) | 2 (100.0%) |
| Foreign Born, not a Citizen | 22 (66.7%) | 11 (33.3%) |
Health Insurance Coverage by Household Income in Kaibab
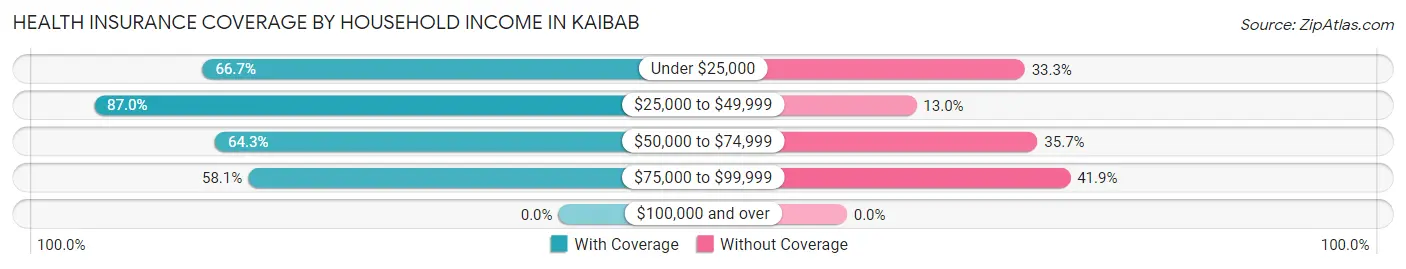
| Household Income | With Coverage | Without Coverage |
| Under $25,000 | 6 (66.7%) | 3 (33.3%) |
| $25,000 to $49,999 | 60 (87.0%) | 9 (13.0%) |
| $50,000 to $74,999 | 9 (64.3%) | 5 (35.7%) |
| $75,000 to $99,999 | 25 (58.1%) | 18 (41.9%) |
| $100,000 and over | 0 (0.0%) | 0 (0.0%) |
Public vs Private Health Insurance Coverage by Age in Kaibab
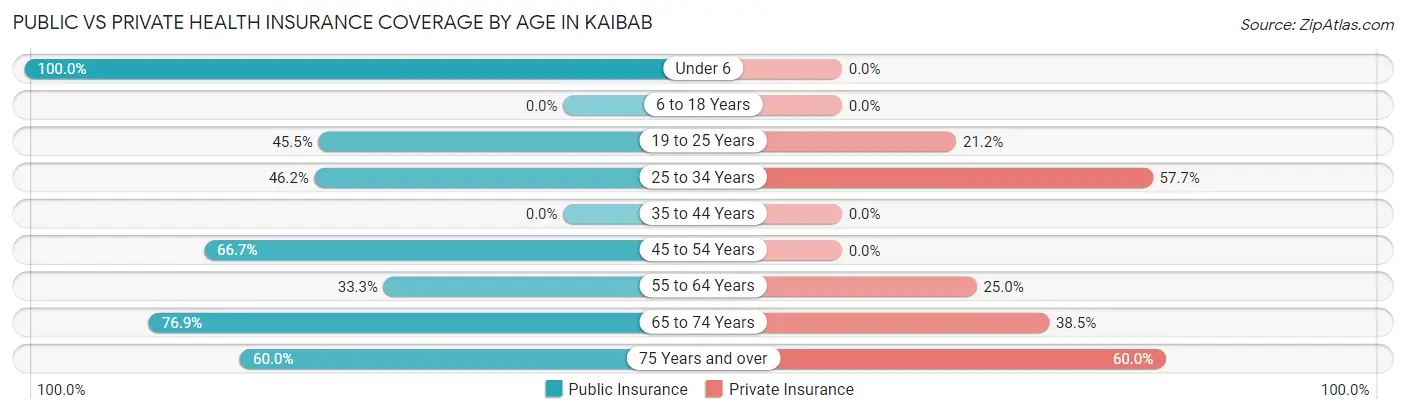
| Age Bracket | Public Insurance | Private Insurance |
| Under 6 | 30 (100.0%) | 0 (0.0%) |
| 6 to 18 Years | 0 (0.0%) | 0 (0.0%) |
| 19 to 25 Years | 15 (45.5%) | 7 (21.2%) |
| 25 to 34 Years | 12 (46.2%) | 15 (57.7%) |
| 35 to 44 Years | 0 (0.0%) | 0 (0.0%) |
| 45 to 54 Years | 4 (66.7%) | 0 (0.0%) |
| 55 to 64 Years | 4 (33.3%) | 3 (25.0%) |
| 65 to 74 Years | 10 (76.9%) | 5 (38.5%) |
| 75 Years and over | 3 (60.0%) | 3 (60.0%) |
| Total | 78 (57.8%) | 33 (24.4%) |
Disability Status by Sex by Age in Kaibab
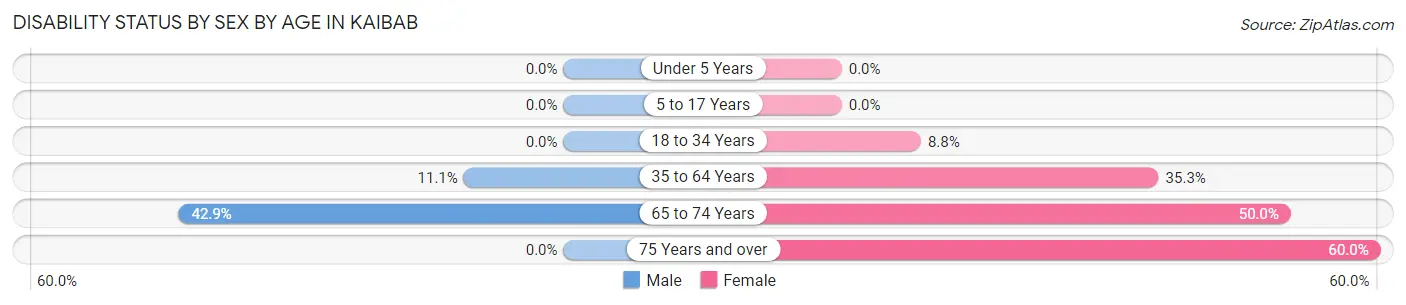
| Age Bracket | Male | Female |
| Under 5 Years | 0 (0.0%) | 0 (0.0%) |
| 5 to 17 Years | 0 (0.0%) | 0 (0.0%) |
| 18 to 34 Years | 0 (0.0%) | 3 (8.8%) |
| 35 to 64 Years | 1 (11.1%) | 6 (35.3%) |
| 65 to 74 Years | 3 (42.9%) | 3 (50.0%) |
| 75 Years and over | 0 (0.0%) | 3 (60.0%) |
Disability Class by Sex by Age in Kaibab
Disability Class: Hearing Difficulty
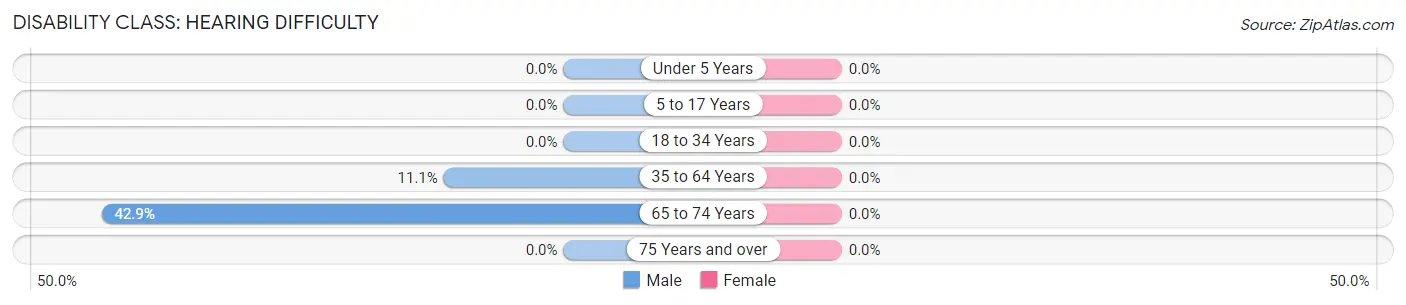
| Age Bracket | Male | Female |
| Under 5 Years | 0 (0.0%) | 0 (0.0%) |
| 5 to 17 Years | 0 (0.0%) | 0 (0.0%) |
| 18 to 34 Years | 0 (0.0%) | 0 (0.0%) |
| 35 to 64 Years | 1 (11.1%) | 0 (0.0%) |
| 65 to 74 Years | 3 (42.9%) | 0 (0.0%) |
| 75 Years and over | 0 (0.0%) | 0 (0.0%) |
Disability Class: Vision Difficulty
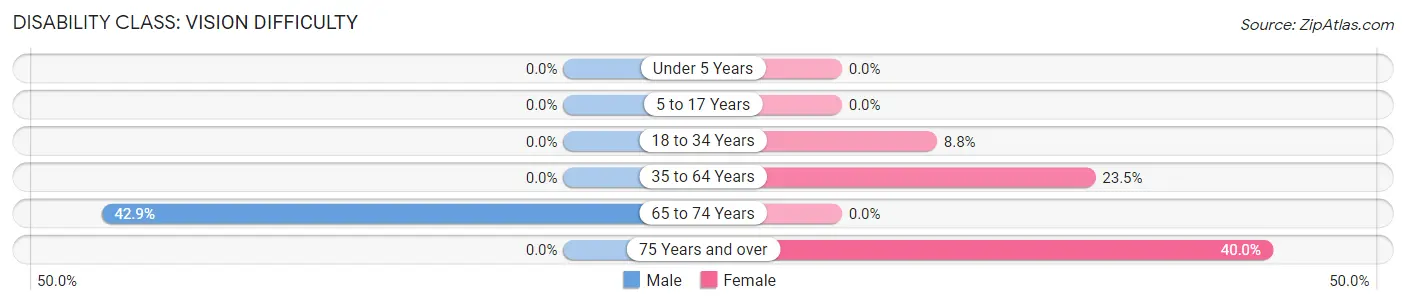
| Age Bracket | Male | Female |
| Under 5 Years | 0 (0.0%) | 0 (0.0%) |
| 5 to 17 Years | 0 (0.0%) | 0 (0.0%) |
| 18 to 34 Years | 0 (0.0%) | 3 (8.8%) |
| 35 to 64 Years | 0 (0.0%) | 4 (23.5%) |
| 65 to 74 Years | 3 (42.9%) | 0 (0.0%) |
| 75 Years and over | 0 (0.0%) | 2 (40.0%) |
Disability Class: Cognitive Difficulty
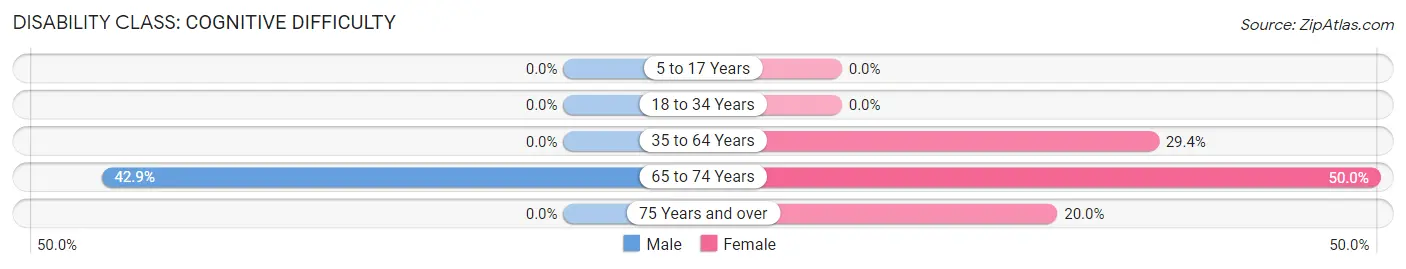
| Age Bracket | Male | Female |
| 5 to 17 Years | 0 (0.0%) | 0 (0.0%) |
| 18 to 34 Years | 0 (0.0%) | 0 (0.0%) |
| 35 to 64 Years | 0 (0.0%) | 5 (29.4%) |
| 65 to 74 Years | 3 (42.9%) | 3 (50.0%) |
| 75 Years and over | 0 (0.0%) | 1 (20.0%) |
Disability Class: Ambulatory Difficulty
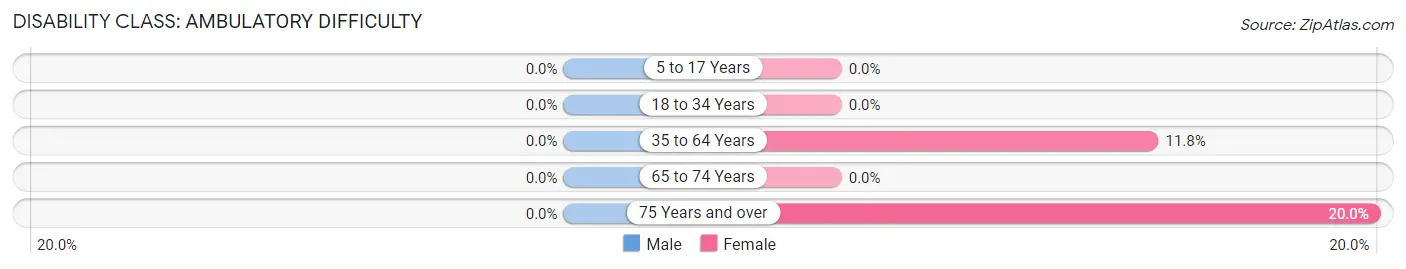
| Age Bracket | Male | Female |
| 5 to 17 Years | 0 (0.0%) | 0 (0.0%) |
| 18 to 34 Years | 0 (0.0%) | 0 (0.0%) |
| 35 to 64 Years | 0 (0.0%) | 2 (11.8%) |
| 65 to 74 Years | 0 (0.0%) | 0 (0.0%) |
| 75 Years and over | 0 (0.0%) | 1 (20.0%) |
Disability Class: Self-Care Difficulty
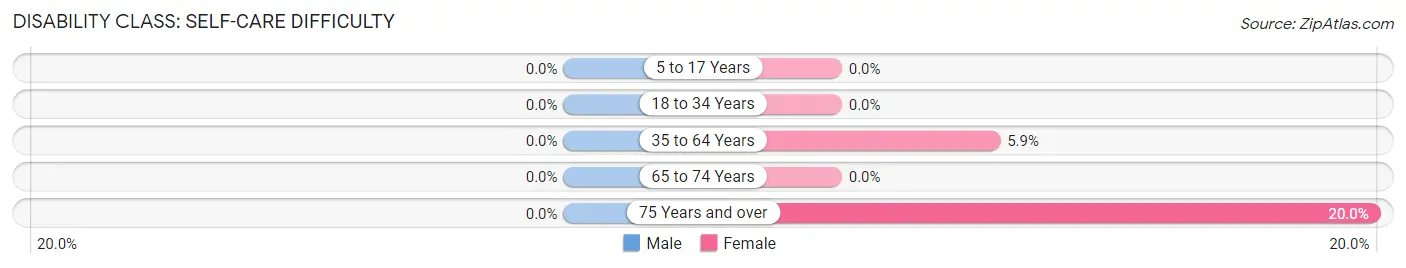
| Age Bracket | Male | Female |
| 5 to 17 Years | 0 (0.0%) | 0 (0.0%) |
| 18 to 34 Years | 0 (0.0%) | 0 (0.0%) |
| 35 to 64 Years | 0 (0.0%) | 1 (5.9%) |
| 65 to 74 Years | 0 (0.0%) | 0 (0.0%) |
| 75 Years and over | 0 (0.0%) | 1 (20.0%) |
Technology Access in Kaibab
Computing Device Access in Kaibab
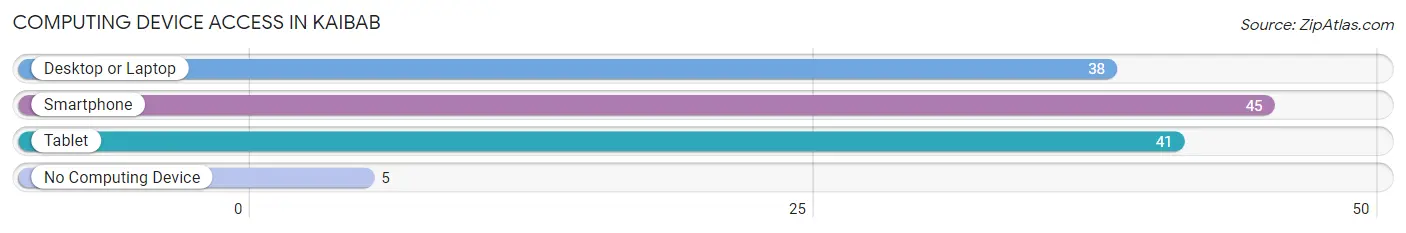
| Device Type | # Households | % Households |
| Desktop or Laptop | 38 | 67.9% |
| Smartphone | 45 | 80.4% |
| Tablet | 41 | 73.2% |
| No Computing Device | 5 | 8.9% |
| Total | 56 | 100.0% |
Internet Access in Kaibab
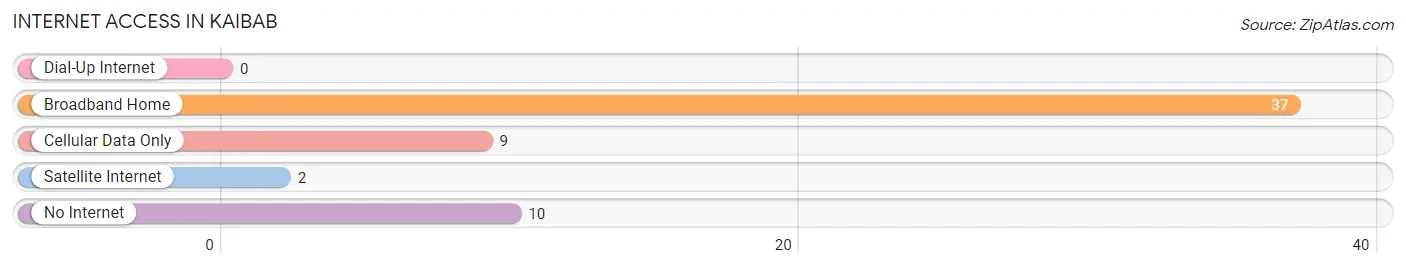
| Internet Type | # Households | % Households |
| Dial-Up Internet | 0 | 0.0% |
| Broadband Home | 37 | 66.1% |
| Cellular Data Only | 9 | 16.1% |
| Satellite Internet | 2 | 3.6% |
| No Internet | 10 | 17.9% |
| Total | 56 | 100.0% |
Kaibab Summary
Kaibab, Arizona is a small unincorporated community located in Coconino County, Arizona. It is situated in the Kaibab Plateau, a high-elevation plateau located in northern Arizona. The Kaibab Plateau is part of the Colorado Plateau, a large physiographic region that covers much of the southwestern United States. Kaibab is located approximately 25 miles south of the Utah border and is bordered by the Grand Canyon National Park to the west and the Kaibab National Forest to the east.
History
The Kaibab Plateau has been inhabited by Native Americans for thousands of years. The area was first explored by Europeans in the late 18th century, when Spanish explorers traveled through the region. The first permanent settlement in the area was established in 1882, when Mormon settlers arrived in the area and established the town of Kaibab. The town was named after the nearby Kaibab Plateau, which was named by the Paiute Indians who lived in the area.
The town of Kaibab grew slowly over the next few decades, and by the early 20th century, it had become a popular tourist destination. The town was home to a number of hotels, restaurants, and other businesses catering to tourists. In the 1920s, the town was also home to a number of movie studios, which produced a number of western films.
In the 1930s, the town began to decline as the Great Depression took its toll on the local economy. The town was further impacted by the construction of the Grand Canyon Dam in the 1950s, which flooded much of the surrounding area. The town of Kaibab was eventually abandoned in the 1960s, and today it is a ghost town.
Geography
Kaibab is located in northern Arizona, in the Kaibab Plateau. The Kaibab Plateau is a high-elevation plateau located in the Colorado Plateau region of the southwestern United States. The plateau is bordered by the Grand Canyon National Park to the west and the Kaibab National Forest to the east. The town of Kaibab is located approximately 25 miles south of the Utah border.
The Kaibab Plateau is characterized by its high elevation and its rugged terrain. The plateau is home to a variety of plant and animal species, including the Kaibab squirrel, which is found only in this region. The plateau is also home to a number of archaeological sites, including the ruins of ancient Native American settlements.
Economy
The economy of Kaibab is largely based on tourism. The town is located near the Grand Canyon National Park, which is one of the most popular tourist destinations in the United States. The town is also home to a number of hotels, restaurants, and other businesses catering to tourists.
In addition to tourism, the town is also home to a number of small businesses, including a general store, a gas station, and a post office. The town is also home to a number of ranches, which raise cattle and other livestock.
Demographics
As of the 2010 census, the population of Kaibab was 545. The town is predominantly white, with 95.3% of the population identifying as white. The town is also home to a small Native American population, with 4.7% of the population identifying as Native American. The median household income in Kaibab is $37,500, and the median age is 44.
Common Questions
What is Per Capita Income in Kaibab?
Per Capita income in Kaibab is $20,417.
What is the Median Family Income in Kaibab?
Median Family Income in Kaibab is $34,688.
What is the Median Household income in Kaibab?
Median Household Income in Kaibab is $34,375.
What is Inequality or Gini Index in Kaibab?
Inequality or Gini Index in Kaibab is 0.31.
What is the Total Population of Kaibab?
Total Population of Kaibab is 135.
What is the Total Male Population of Kaibab?
Total Male Population of Kaibab is 62.
What is the Total Female Population of Kaibab?
Total Female Population of Kaibab is 73.
What is the Ratio of Males per 100 Females in Kaibab?
There are 84.93 Males per 100 Females in Kaibab.
What is the Ratio of Females per 100 Males in Kaibab?
There are 117.74 Females per 100 Males in Kaibab.
What is the Median Population Age in Kaibab?
Median Population Age in Kaibab is 26.3 Years.
What is the Average Family Size in Kaibab
Average Family Size in Kaibab is 2.9 People.
What is the Average Household Size in Kaibab
Average Household Size in Kaibab is 2.4 People.
How Large is the Labor Force in Kaibab?
There are 72 People in the Labor Forcein in Kaibab.
What is the Percentage of People in the Labor Force in Kaibab?
69.9% of People are in the Labor Force in Kaibab.
What is the Unemployment Rate in Kaibab?
Unemployment Rate in Kaibab is 9.7%.