Arizona Village, AZ Map & Demographics
Arizona Village Map
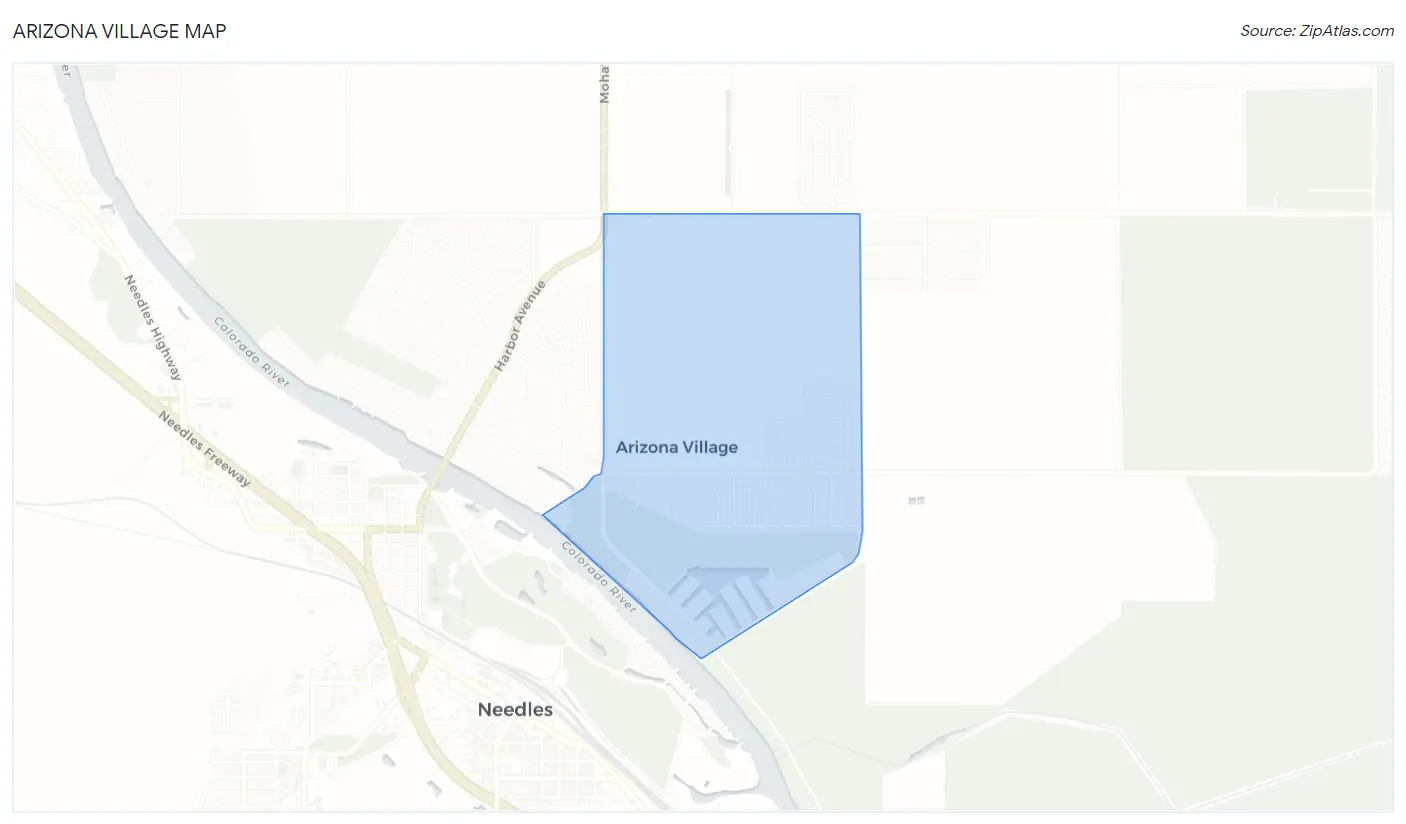
Arizona Village Overview
$16,007
PER CAPITA INCOME
$47,019
AVG FAMILY INCOME
$43,750
AVG HOUSEHOLD INCOME
0.35
INEQUALITY / GINI INDEX
630
TOTAL POPULATION
351
MALE POPULATION
279
FEMALE POPULATION
125.81
MALES / 100 FEMALES
79.49
FEMALES / 100 MALES
32.6
MEDIAN AGE
3.2
AVG FAMILY SIZE
3.0
AVG HOUSEHOLD SIZE
230
LABOR FORCE [ PEOPLE ]
48.3%
PERCENT IN LABOR FORCE
6.5%
UNEMPLOYMENT RATE
Income in Arizona Village
Income Overview in Arizona Village
Per Capita Income in Arizona Village is $16,007, while median incomes of families and households are $47,019 and $43,750 respectively.
| Characteristic | Number | Measure |
| Per Capita Income | 630 | $16,007 |
| Median Family Income | 159 | $47,019 |
| Mean Family Income | 159 | $47,039 |
| Median Household Income | 213 | $43,750 |
| Mean Household Income | 213 | $46,578 |
| Income Deficit | 159 | $0 |
| Wage / Income Gap (%) | 630 | 0.00% |
| Wage / Income Gap ($) | 630 | 100.00¢ per $1 |
| Gini / Inequality Index | 630 | 0.35 |
Earnings by Sex in Arizona Village
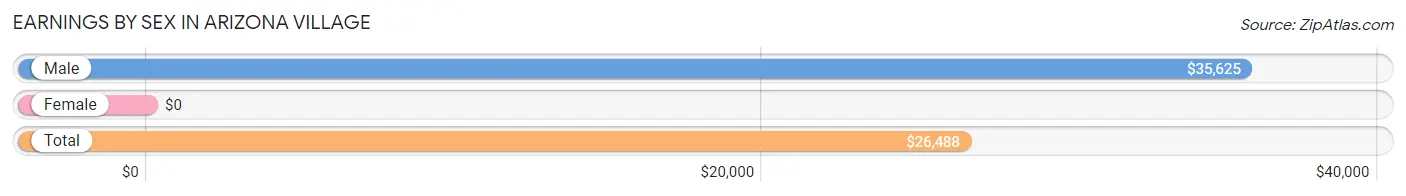
| Sex | Number | Average Earnings |
| Male | 179 (59.3%) | $35,625 |
| Female | 123 (40.7%) | $0 |
| Total | 302 (100.0%) | $26,488 |
Earnings by Sex by Income Bracket in Arizona Village
The most common earnings brackets in Arizona Village are $40,000 to $44,999 for men (69 | 38.6%) and $2,500 to $4,999 for women (29 | 23.6%).
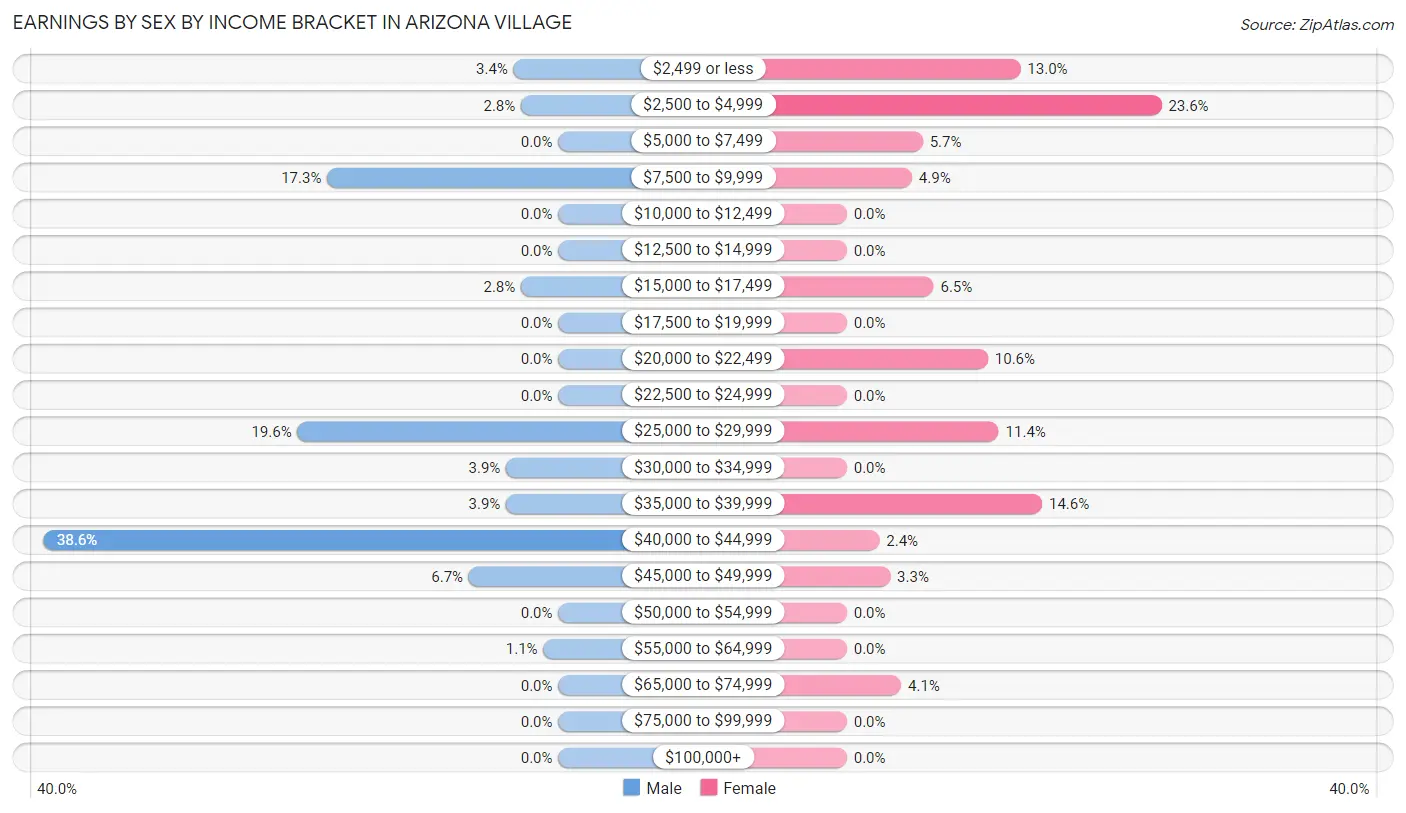
| Income | Male | Female |
| $2,499 or less | 6 (3.4%) | 16 (13.0%) |
| $2,500 to $4,999 | 5 (2.8%) | 29 (23.6%) |
| $5,000 to $7,499 | 0 (0.0%) | 7 (5.7%) |
| $7,500 to $9,999 | 31 (17.3%) | 6 (4.9%) |
| $10,000 to $12,499 | 0 (0.0%) | 0 (0.0%) |
| $12,500 to $14,999 | 0 (0.0%) | 0 (0.0%) |
| $15,000 to $17,499 | 5 (2.8%) | 8 (6.5%) |
| $17,500 to $19,999 | 0 (0.0%) | 0 (0.0%) |
| $20,000 to $22,499 | 0 (0.0%) | 13 (10.6%) |
| $22,500 to $24,999 | 0 (0.0%) | 0 (0.0%) |
| $25,000 to $29,999 | 35 (19.6%) | 14 (11.4%) |
| $30,000 to $34,999 | 7 (3.9%) | 0 (0.0%) |
| $35,000 to $39,999 | 7 (3.9%) | 18 (14.6%) |
| $40,000 to $44,999 | 69 (38.6%) | 3 (2.4%) |
| $45,000 to $49,999 | 12 (6.7%) | 4 (3.3%) |
| $50,000 to $54,999 | 0 (0.0%) | 0 (0.0%) |
| $55,000 to $64,999 | 2 (1.1%) | 0 (0.0%) |
| $65,000 to $74,999 | 0 (0.0%) | 5 (4.1%) |
| $75,000 to $99,999 | 0 (0.0%) | 0 (0.0%) |
| $100,000+ | 0 (0.0%) | 0 (0.0%) |
| Total | 179 (100.0%) | 123 (100.0%) |
Earnings by Sex by Educational Attainment in Arizona Village
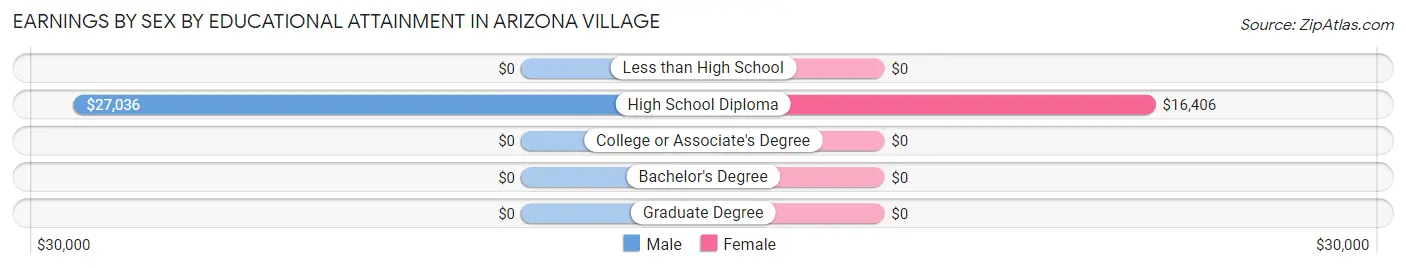
| Educational Attainment | Male Income | Female Income |
| Less than High School | - | - |
| High School Diploma | $27,036 | $16,406 |
| College or Associate's Degree | - | - |
| Bachelor's Degree | - | - |
| Graduate Degree | - | - |
| Total | $26,679 | $0 |
Family Income in Arizona Village
Family Income Brackets in Arizona Village
According to the Arizona Village family income data, there are 35 families falling into the $75,000 to $99,999 income range, which is the most common income bracket and makes up 22.0% of all families.
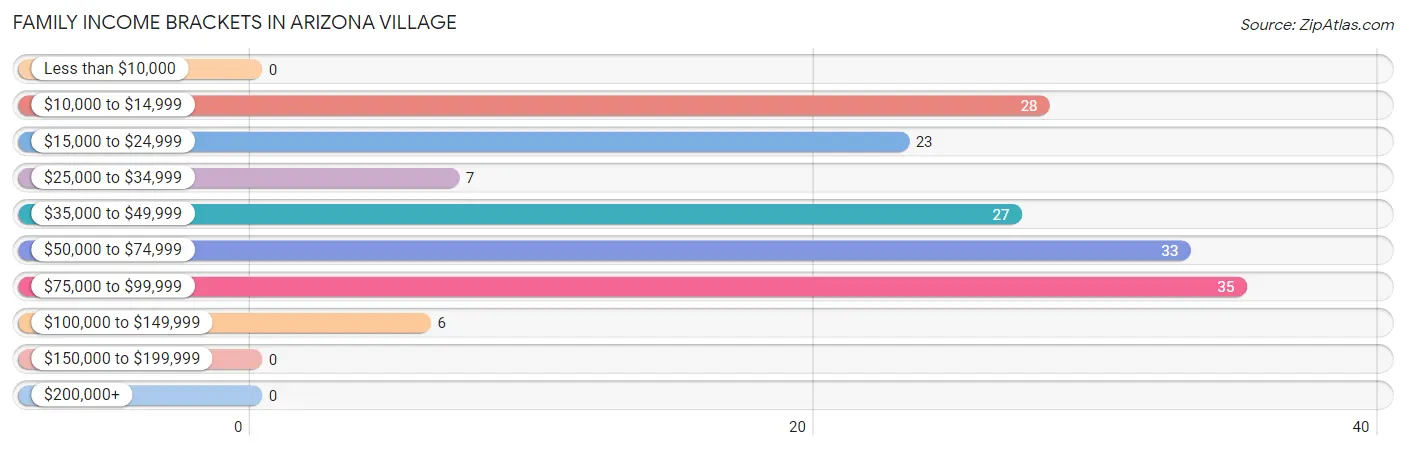
| Income Bracket | # Families | % Families |
| Less than $10,000 | 0 | 0.0% |
| $10,000 to $14,999 | 28 | 17.6% |
| $15,000 to $24,999 | 23 | 14.5% |
| $25,000 to $34,999 | 7 | 4.4% |
| $35,000 to $49,999 | 27 | 17.0% |
| $50,000 to $74,999 | 33 | 20.8% |
| $75,000 to $99,999 | 35 | 22.0% |
| $100,000 to $149,999 | 6 | 3.8% |
| $150,000 to $199,999 | 0 | 0.0% |
| $200,000+ | 0 | 0.0% |
Family Income by Famaliy Size in Arizona Village
2-person families (55 | 34.6%) account for the highest median family income in Arizona Village with $50,647 per family, while 2-person families (55 | 34.6%) have the highest median income of $25,324 per family member.
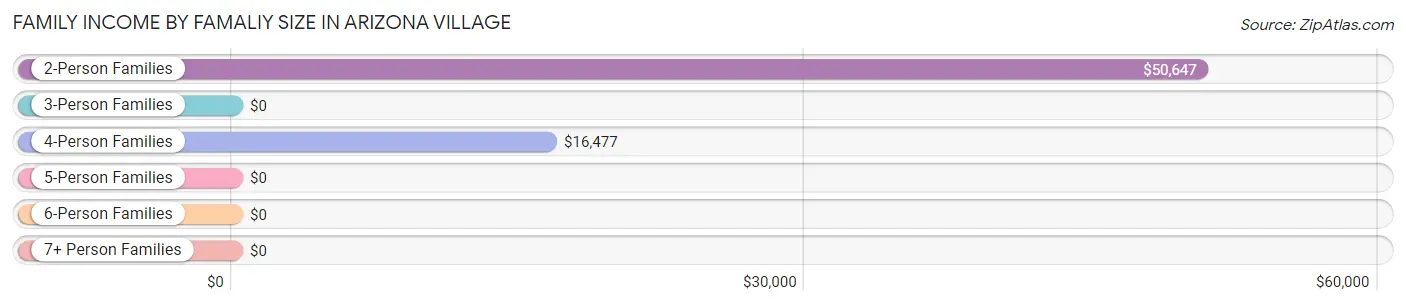
| Income Bracket | # Families | Median Income |
| 2-Person Families | 55 (34.6%) | $50,647 |
| 3-Person Families | 61 (38.4%) | $0 |
| 4-Person Families | 13 (8.2%) | $16,477 |
| 5-Person Families | 23 (14.5%) | $0 |
| 6-Person Families | 7 (4.4%) | $0 |
| 7+ Person Families | 0 (0.0%) | $0 |
| Total | 159 (100.0%) | $47,019 |
Family Income by Number of Earners in Arizona Village
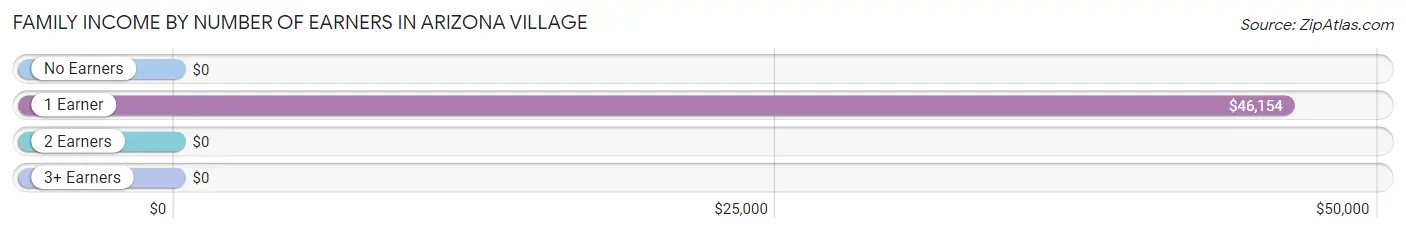
| Number of Earners | # Families | Median Income |
| No Earners | 24 (15.1%) | $0 |
| 1 Earner | 86 (54.1%) | $46,154 |
| 2 Earners | 16 (10.1%) | $0 |
| 3+ Earners | 33 (20.7%) | $0 |
| Total | 159 (100.0%) | $47,019 |
Household Income in Arizona Village
Household Income Brackets in Arizona Village
With 47 households falling in the category, the $25,000 to $34,999 income range is the most frequent in Arizona Village, accounting for 22.1% of all households.
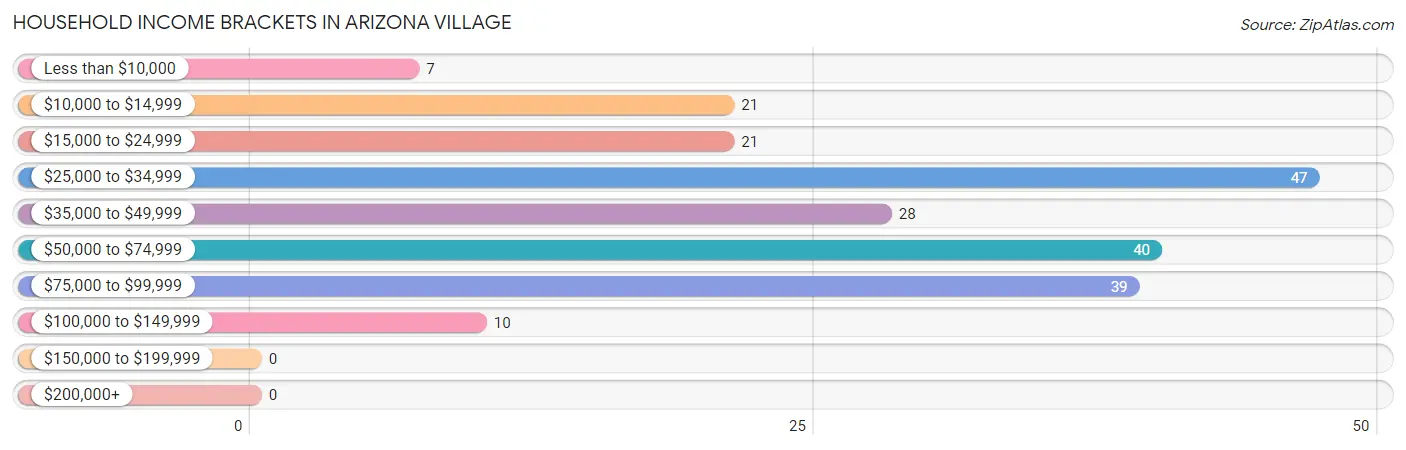
| Income Bracket | # Households | % Households |
| Less than $10,000 | 7 | 3.3% |
| $10,000 to $14,999 | 21 | 9.9% |
| $15,000 to $24,999 | 21 | 9.9% |
| $25,000 to $34,999 | 47 | 22.1% |
| $35,000 to $49,999 | 28 | 13.1% |
| $50,000 to $74,999 | 40 | 18.8% |
| $75,000 to $99,999 | 39 | 18.3% |
| $100,000 to $149,999 | 10 | 4.7% |
| $150,000 to $199,999 | 0 | 0.0% |
| $200,000+ | 0 | 0.0% |
Household Income by Householder Age in Arizona Village
The median household income in Arizona Village is $43,750, with the highest median household income of $45,682 found in the 25 to 44 years age bracket for the primary householder. A total of 62 households (29.1%) fall into this category. Meanwhile, the 15 to 24 years age bracket for the primary householder has the lowest median household income of $0, with 9 households (4.2%) in this group.
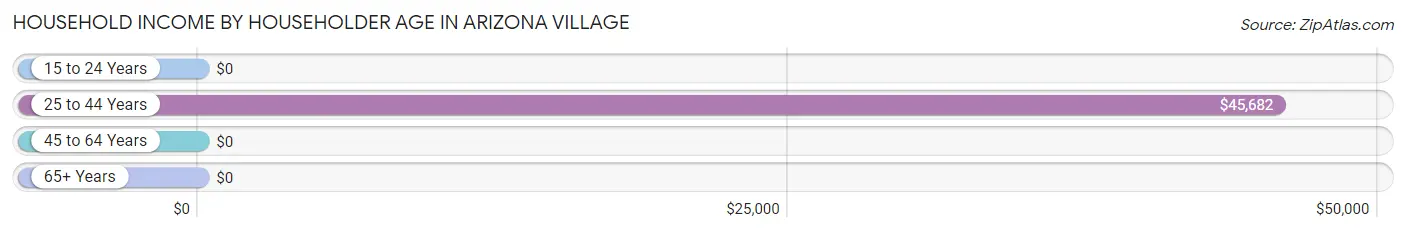
| Income Bracket | # Households | Median Income |
| 15 to 24 Years | 9 (4.2%) | $0 |
| 25 to 44 Years | 62 (29.1%) | $45,682 |
| 45 to 64 Years | 82 (38.5%) | $0 |
| 65+ Years | 60 (28.2%) | $0 |
| Total | 213 (100.0%) | $43,750 |
Poverty in Arizona Village
Income Below Poverty by Sex and Age in Arizona Village
With 32.0% poverty level for males and 33.9% for females among the residents of Arizona Village, 15 year old males and 15 year old females are the most vulnerable to poverty, with 12 males (100.0%) and 2 females (100.0%) in their respective age groups living below the poverty level.
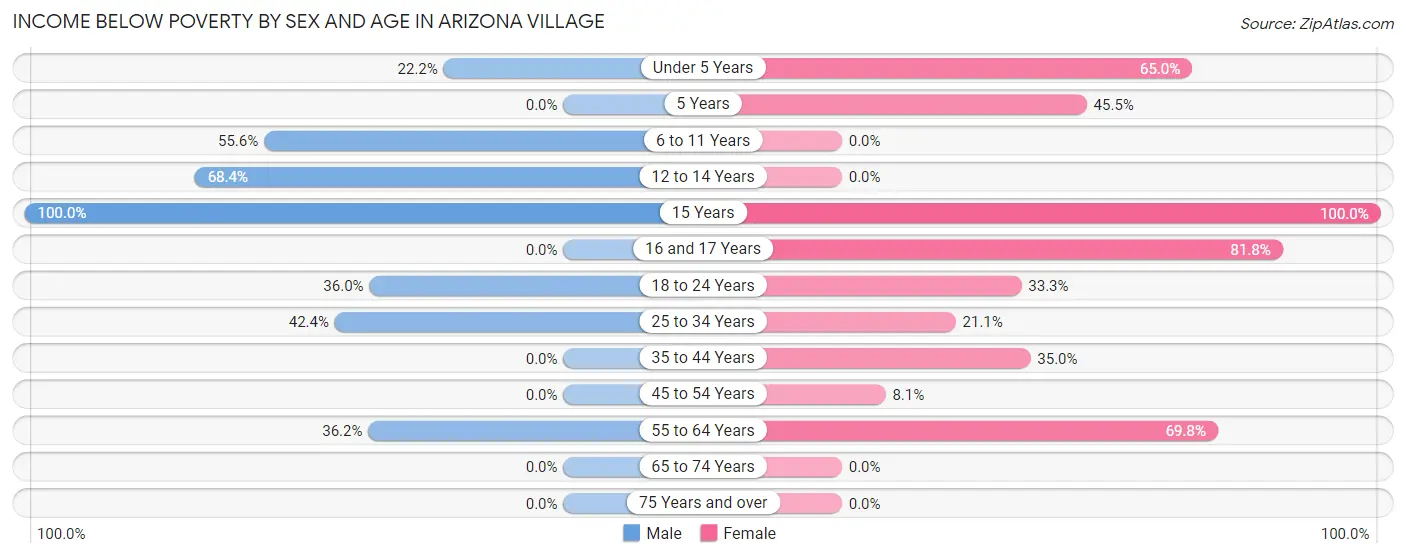
| Age Bracket | Male | Female |
| Under 5 Years | 4 (22.2%) | 13 (65.0%) |
| 5 Years | 0 (0.0%) | 5 (45.5%) |
| 6 to 11 Years | 15 (55.6%) | 0 (0.0%) |
| 12 to 14 Years | 13 (68.4%) | 0 (0.0%) |
| 15 Years | 12 (100.0%) | 2 (100.0%) |
| 16 and 17 Years | 0 (0.0%) | 9 (81.8%) |
| 18 to 24 Years | 27 (36.0%) | 3 (33.3%) |
| 25 to 34 Years | 14 (42.4%) | 15 (21.1%) |
| 35 to 44 Years | 0 (0.0%) | 7 (35.0%) |
| 45 to 54 Years | 0 (0.0%) | 3 (8.1%) |
| 55 to 64 Years | 21 (36.2%) | 30 (69.8%) |
| 65 to 74 Years | 0 (0.0%) | 0 (0.0%) |
| 75 Years and over | 0 (0.0%) | 0 (0.0%) |
| Total | 106 (32.0%) | 87 (33.9%) |
Income Above Poverty by Sex and Age in Arizona Village
According to the poverty statistics in Arizona Village, males aged 35 to 44 years and females aged 12 to 14 years are the age groups that are most secure financially, with 100.0% of males and 100.0% of females in these age groups living above the poverty line.
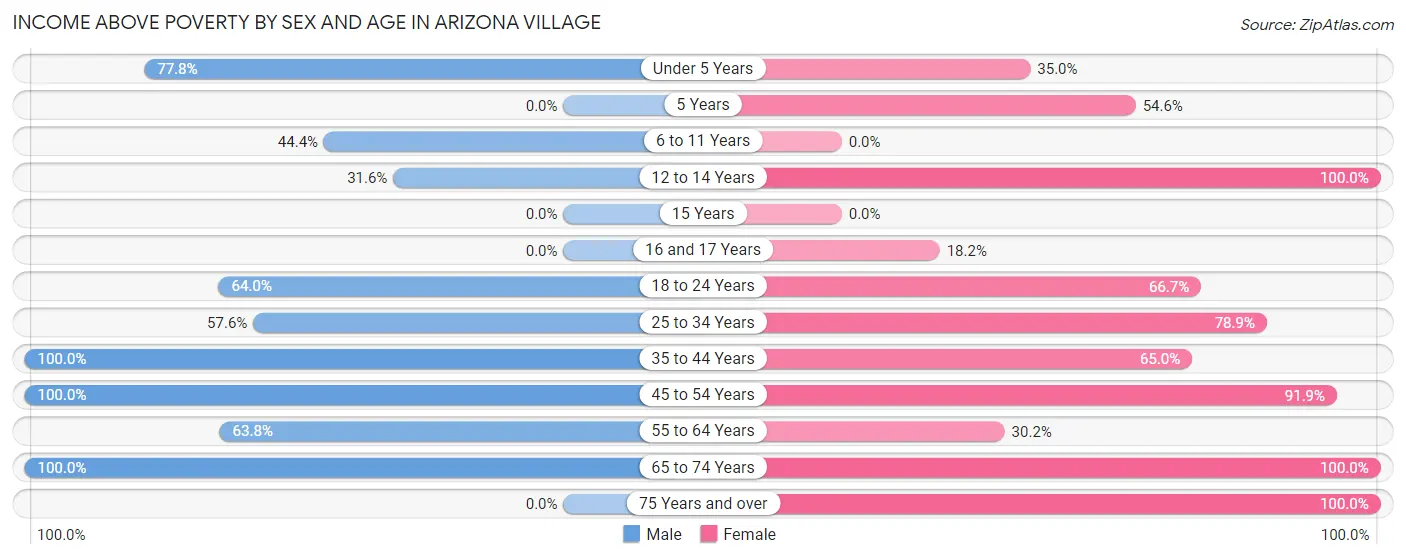
| Age Bracket | Male | Female |
| Under 5 Years | 14 (77.8%) | 7 (35.0%) |
| 5 Years | 0 (0.0%) | 6 (54.5%) |
| 6 to 11 Years | 12 (44.4%) | 0 (0.0%) |
| 12 to 14 Years | 6 (31.6%) | 3 (100.0%) |
| 15 Years | 0 (0.0%) | 0 (0.0%) |
| 16 and 17 Years | 0 (0.0%) | 2 (18.2%) |
| 18 to 24 Years | 48 (64.0%) | 6 (66.7%) |
| 25 to 34 Years | 19 (57.6%) | 56 (78.9%) |
| 35 to 44 Years | 19 (100.0%) | 13 (65.0%) |
| 45 to 54 Years | 40 (100.0%) | 34 (91.9%) |
| 55 to 64 Years | 37 (63.8%) | 13 (30.2%) |
| 65 to 74 Years | 30 (100.0%) | 29 (100.0%) |
| 75 Years and over | 0 (0.0%) | 1 (100.0%) |
| Total | 225 (68.0%) | 170 (66.1%) |
Income Below Poverty Among Married-Couple Families in Arizona Village
The poverty statistics for married-couple families in Arizona Village show that 26.2% or 28 of the total 107 families live below the poverty line. Families with 3 or 4 children have the highest poverty rate of 50.0%, comprising of 7 families. On the other hand, families with 1 or 2 children have the lowest poverty rate of 0.0%, which includes 0 families.
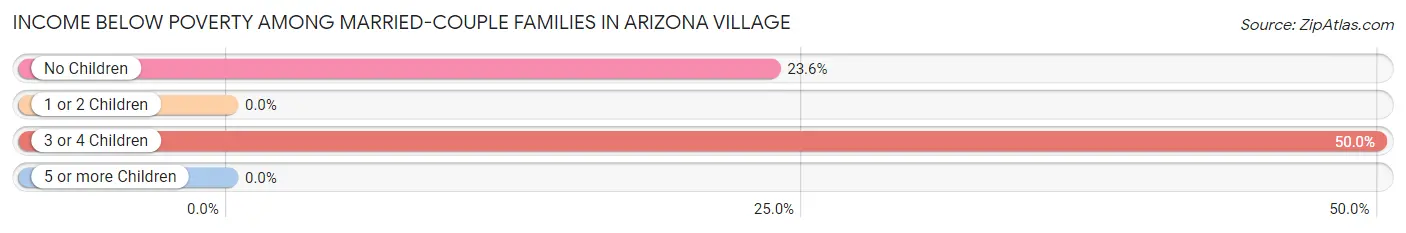
| Children | Above Poverty | Below Poverty |
| No Children | 68 (76.4%) | 21 (23.6%) |
| 1 or 2 Children | 4 (100.0%) | 0 (0.0%) |
| 3 or 4 Children | 7 (50.0%) | 7 (50.0%) |
| 5 or more Children | 0 (0.0%) | 0 (0.0%) |
| Total | 79 (73.8%) | 28 (26.2%) |
Income Below Poverty Among Single-Parent Households in Arizona Village
| Children | Single Father | Single Mother |
| No Children | 0 (0.0%) | 0 (0.0%) |
| 1 or 2 Children | 0 (0.0%) | 6 (30.0%) |
| 3 or 4 Children | 0 (0.0%) | 18 (100.0%) |
| 5 or more Children | 0 (0.0%) | 0 (0.0%) |
| Total | 0 (0.0%) | 24 (48.0%) |
Income Below Poverty Among Married-Couple vs Single-Parent Households in Arizona Village
The poverty data for Arizona Village shows that 28 of the married-couple family households (26.2%) and 24 of the single-parent households (46.2%) are living below the poverty level. Within the married-couple family households, those with 3 or 4 children have the highest poverty rate, with 7 households (50.0%) falling below the poverty line. Among the single-parent households, those with 3 or 4 children have the highest poverty rate, with 18 household (90.0%) living below poverty.
| Children | Married-Couple Families | Single-Parent Households |
| No Children | 21 (23.6%) | 0 (0.0%) |
| 1 or 2 Children | 0 (0.0%) | 6 (30.0%) |
| 3 or 4 Children | 7 (50.0%) | 18 (90.0%) |
| 5 or more Children | 0 (0.0%) | 0 (0.0%) |
| Total | 28 (26.2%) | 24 (46.2%) |
Race in Arizona Village
The most populous races in Arizona Village are Native / Alaskan (305 | 48.4%), White / Caucasian (260 | 41.3%), and Hispanic or Latino (171 | 27.1%).
| Race | # Population | % Population |
| Asian | 0 | 0.0% |
| Black / African American | 5 | 0.8% |
| Hawaiian / Pacific | 3 | 0.5% |
| Hispanic or Latino | 171 | 27.1% |
| Native / Alaskan | 305 | 48.4% |
| White / Caucasian | 260 | 41.3% |
| Two or more Races | 54 | 8.6% |
| Some other Race | 3 | 0.5% |
| Total | 630 | 100.0% |
Ancestry in Arizona Village
The most populous ancestries reported in Arizona Village are Yuman (321 | 50.9%), American (101 | 16.0%), Mexican (94 | 14.9%), Spaniard (68 | 10.8%), and English (33 | 5.2%), together accounting for 97.9% of all Arizona Village residents.
| Ancestry | # Population | % Population |
| American | 101 | 16.0% |
| Central American | 9 | 1.4% |
| English | 33 | 5.2% |
| German | 29 | 4.6% |
| Guatemalan | 9 | 1.4% |
| Hopi | 3 | 0.5% |
| Irish | 30 | 4.8% |
| Italian | 29 | 4.6% |
| Mexican | 94 | 14.9% |
| Potawatomi | 3 | 0.5% |
| Samoan | 8 | 1.3% |
| Spaniard | 68 | 10.8% |
| Tohono O'Odham | 10 | 1.6% |
| Yuman | 321 | 50.9% | View All 14 Rows |
Immigrants in Arizona Village

| Immigration Origin | # Population | % Population | View All 0 Rows |
Sex and Age in Arizona Village
Sex and Age in Arizona Village
The most populous age groups in Arizona Village are 20 to 24 Years (66 | 18.8%) for men and 25 to 29 Years (43 | 15.4%) for women.
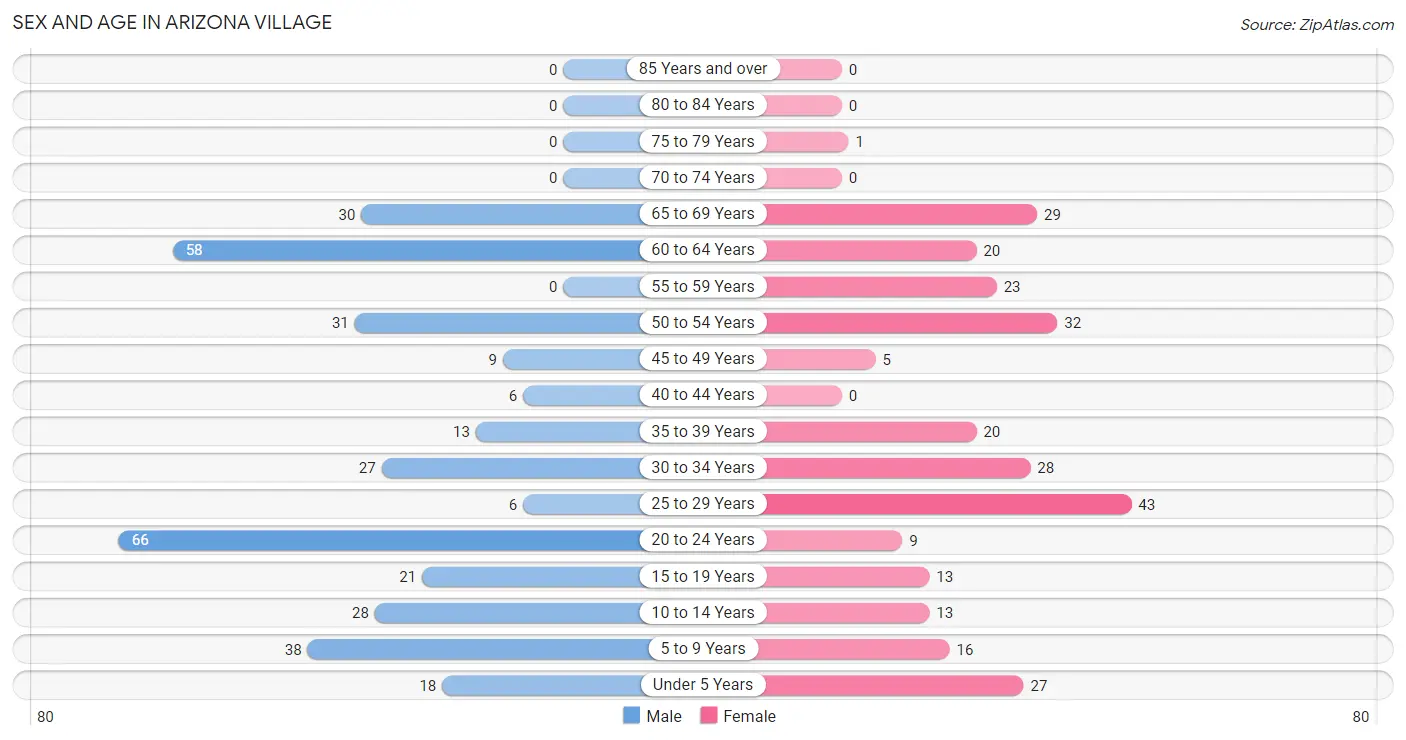
| Age Bracket | Male | Female |
| Under 5 Years | 18 (5.1%) | 27 (9.7%) |
| 5 to 9 Years | 38 (10.8%) | 16 (5.7%) |
| 10 to 14 Years | 28 (8.0%) | 13 (4.7%) |
| 15 to 19 Years | 21 (6.0%) | 13 (4.7%) |
| 20 to 24 Years | 66 (18.8%) | 9 (3.2%) |
| 25 to 29 Years | 6 (1.7%) | 43 (15.4%) |
| 30 to 34 Years | 27 (7.7%) | 28 (10.0%) |
| 35 to 39 Years | 13 (3.7%) | 20 (7.2%) |
| 40 to 44 Years | 6 (1.7%) | 0 (0.0%) |
| 45 to 49 Years | 9 (2.6%) | 5 (1.8%) |
| 50 to 54 Years | 31 (8.8%) | 32 (11.5%) |
| 55 to 59 Years | 0 (0.0%) | 23 (8.2%) |
| 60 to 64 Years | 58 (16.5%) | 20 (7.2%) |
| 65 to 69 Years | 30 (8.6%) | 29 (10.4%) |
| 70 to 74 Years | 0 (0.0%) | 0 (0.0%) |
| 75 to 79 Years | 0 (0.0%) | 1 (0.4%) |
| 80 to 84 Years | 0 (0.0%) | 0 (0.0%) |
| 85 Years and over | 0 (0.0%) | 0 (0.0%) |
| Total | 351 (100.0%) | 279 (100.0%) |
Families and Households in Arizona Village
Median Family Size in Arizona Village
The median family size in Arizona Village is 3.21 persons per family, with single male/father families (2 | 1.3%) accounting for the largest median family size of 6.5 persons per family. On the other hand, single female/mother families (50 | 31.5%) represent the smallest median family size with 3.06 persons per family.
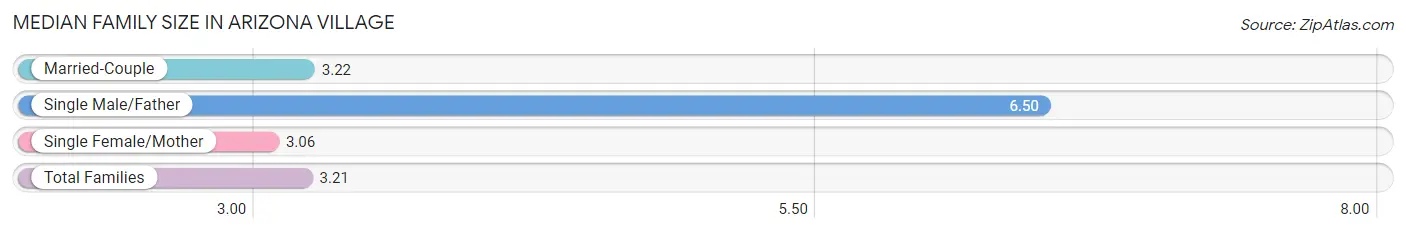
| Family Type | # Families | Family Size |
| Married-Couple | 107 (67.3%) | 3.22 |
| Single Male/Father | 2 (1.3%) | 6.50 |
| Single Female/Mother | 50 (31.5%) | 3.06 |
| Total Families | 159 (100.0%) | 3.21 |
Median Household Size in Arizona Village
The median household size in Arizona Village is 2.96 persons per household, with single male/father households (2 | 0.9%) accounting for the largest median household size of 6.5 persons per household. non-family households (54 | 25.4%) represent the smallest median household size with 1.72 persons per household.
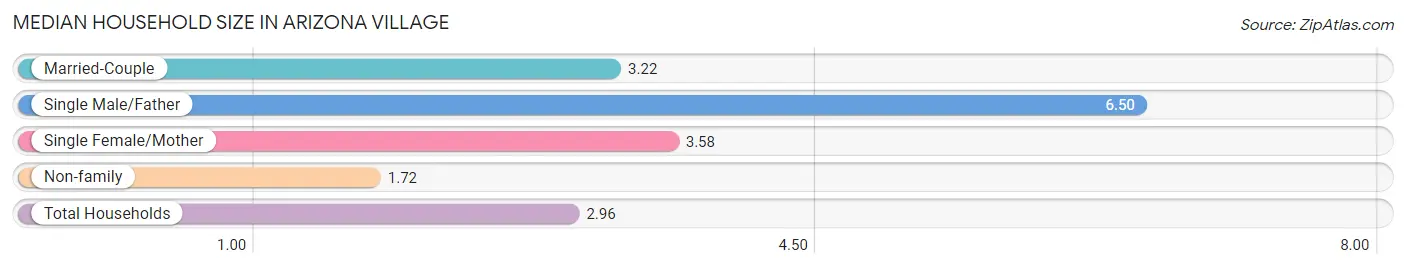
| Household Type | # Households | Household Size |
| Married-Couple | 107 (50.2%) | 3.22 |
| Single Male/Father | 2 (0.9%) | 6.50 |
| Single Female/Mother | 50 (23.5%) | 3.58 |
| Non-family | 54 (25.4%) | 1.72 |
| Total Households | 213 (100.0%) | 2.96 |
Household Size by Marriage Status in Arizona Village
Out of a total of 213 households in Arizona Village, 159 (74.7%) are family households, while 54 (25.4%) are nonfamily households. The most numerous type of family households are 3-person households, comprising 58, and the most common type of nonfamily households are 1-person households, comprising 39.
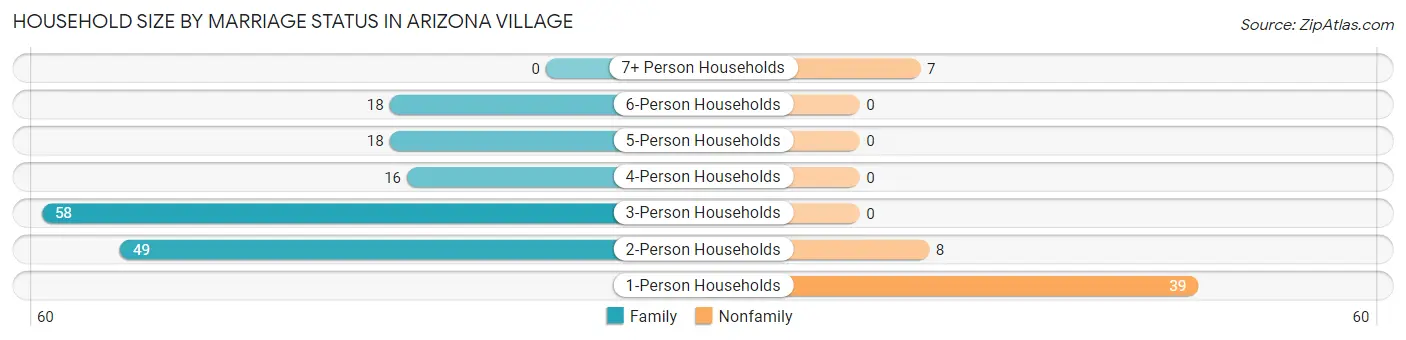
| Household Size | Family Households | Nonfamily Households |
| 1-Person Households | - | 39 (18.3%) |
| 2-Person Households | 49 (23.0%) | 8 (3.8%) |
| 3-Person Households | 58 (27.2%) | 0 (0.0%) |
| 4-Person Households | 16 (7.5%) | 0 (0.0%) |
| 5-Person Households | 18 (8.5%) | 0 (0.0%) |
| 6-Person Households | 18 (8.5%) | 0 (0.0%) |
| 7+ Person Households | 0 (0.0%) | 7 (3.3%) |
| Total | 159 (74.7%) | 54 (25.4%) |
Female Fertility in Arizona Village
Fertility by Age in Arizona Village
Average fertility rate in Arizona Village is 34.0 births per 1,000 women. Women in the age bracket of 20 to 34 years have the highest fertility rate with 63.0 births per 1,000 women. Women in the age bracket of 20 to 34 years acount for 100.0% of all women with births.
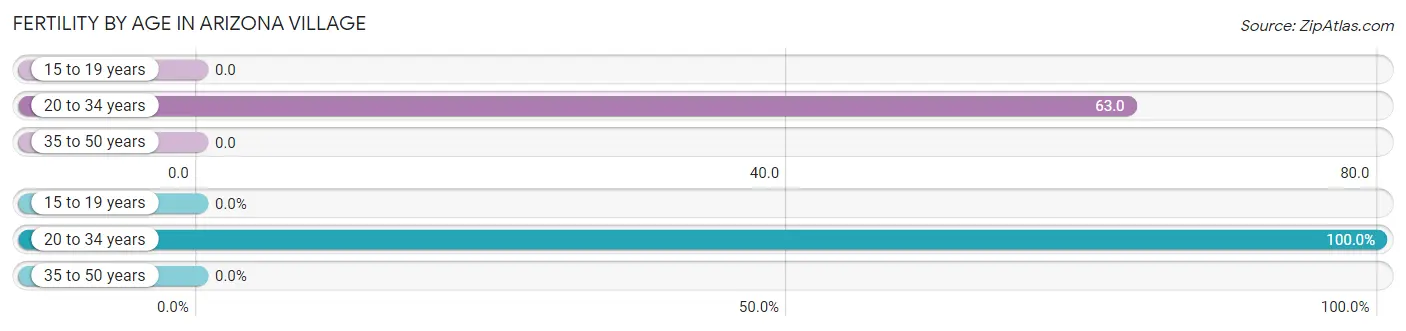
| Age Bracket | Women with Births | Births / 1,000 Women |
| 15 to 19 years | 0 (0.0%) | 0.0 |
| 20 to 34 years | 5 (100.0%) | 63.0 |
| 35 to 50 years | 0 (0.0%) | 0.0 |
| Total | 5 (100.0%) | 34.0 |
Fertility by Age by Marriage Status in Arizona Village
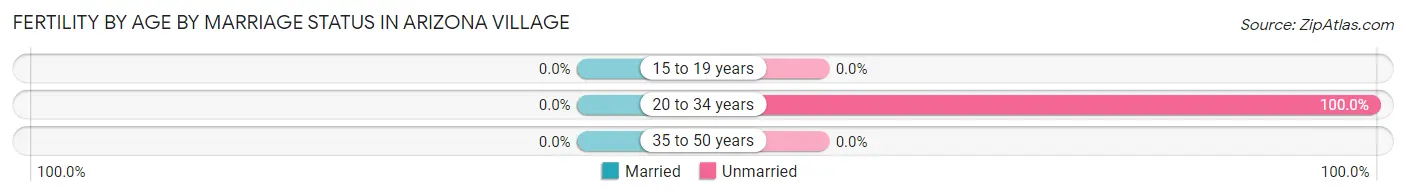
| Age Bracket | Married | Unmarried |
| 15 to 19 years | 0 (0.0%) | 0 (0.0%) |
| 20 to 34 years | 0 (0.0%) | 5 (100.0%) |
| 35 to 50 years | 0 (0.0%) | 0 (0.0%) |
| Total | 0 (0.0%) | 5 (100.0%) |
Fertility by Education in Arizona Village
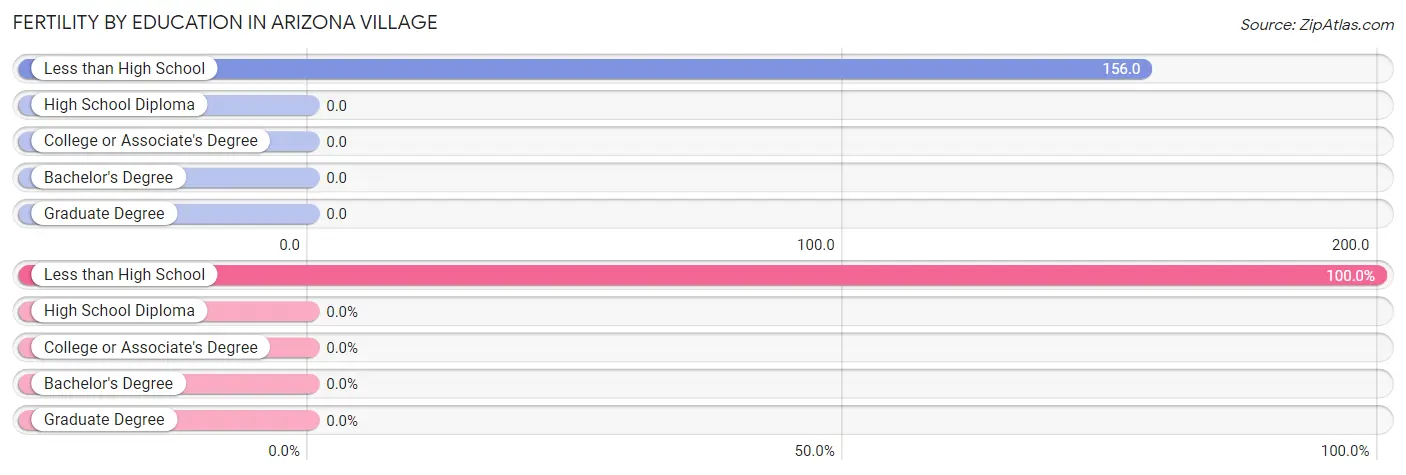
| Educational Attainment | Women with Births | Births / 1,000 Women |
| Less than High School | 5 (100.0%) | 156.0 |
| High School Diploma | 0 (0.0%) | 0.0 |
| College or Associate's Degree | 0 (0.0%) | 0.0 |
| Bachelor's Degree | 0 (0.0%) | 0.0 |
| Graduate Degree | 0 (0.0%) | 0.0 |
| Total | 5 (100.0%) | 34.0 |
Fertility by Education by Marriage Status in Arizona Village
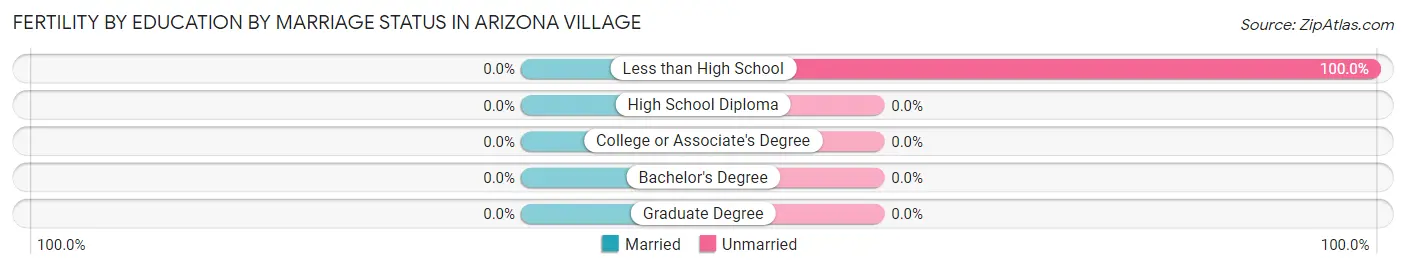
| Educational Attainment | Married | Unmarried |
| Less than High School | 0 (0.0%) | 5 (100.0%) |
| High School Diploma | 0 (0.0%) | 0 (0.0%) |
| College or Associate's Degree | 0 (0.0%) | 0 (0.0%) |
| Bachelor's Degree | 0 (0.0%) | 0 (0.0%) |
| Graduate Degree | 0 (0.0%) | 0 (0.0%) |
| Total | 0 (0.0%) | 5 (100.0%) |
Employment Characteristics in Arizona Village
Employment by Class of Employer in Arizona Village
Among the 215 employed individuals in Arizona Village, private company employees (138 | 64.2%), local government employees (44 | 20.5%), and not-for-profit organizations (19 | 8.8%) make up the most common classes of employment.
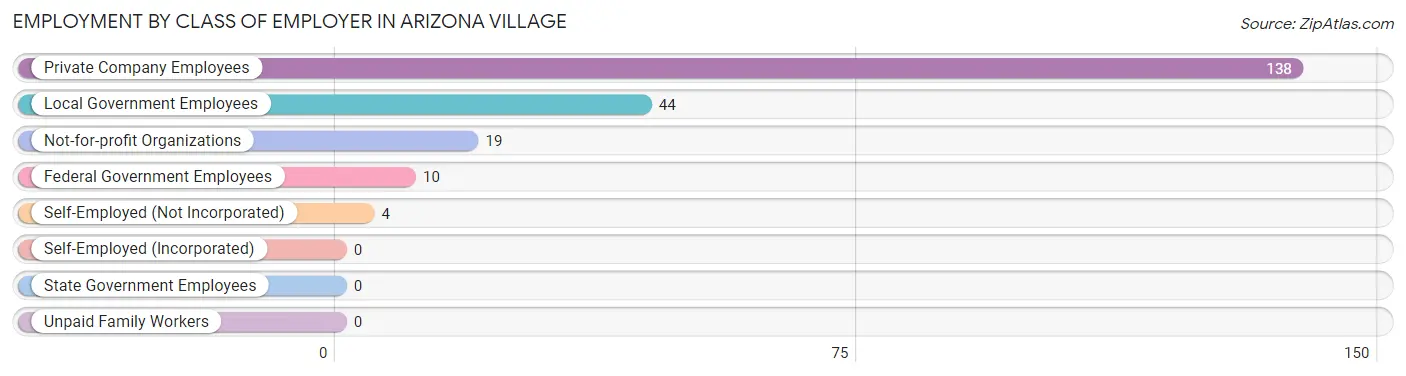
| Employer Class | # Employees | % Employees |
| Private Company Employees | 138 | 64.2% |
| Self-Employed (Incorporated) | 0 | 0.0% |
| Self-Employed (Not Incorporated) | 4 | 1.9% |
| Not-for-profit Organizations | 19 | 8.8% |
| Local Government Employees | 44 | 20.5% |
| State Government Employees | 0 | 0.0% |
| Federal Government Employees | 10 | 4.6% |
| Unpaid Family Workers | 0 | 0.0% |
| Total | 215 | 100.0% |
Employment Status by Age in Arizona Village
According to the labor force statistics for Arizona Village, out of the total population over 16 years of age (476), 48.3% or 230 individuals are in the labor force, with 6.5% or 15 of them unemployed. The age group with the highest labor force participation rate is 25 to 29 years, with 77.6% or 38 individuals in the labor force. Within the labor force, the 16 to 19 years age range has the highest percentage of unemployed individuals, with 63.6% or 7 of them being unemployed.
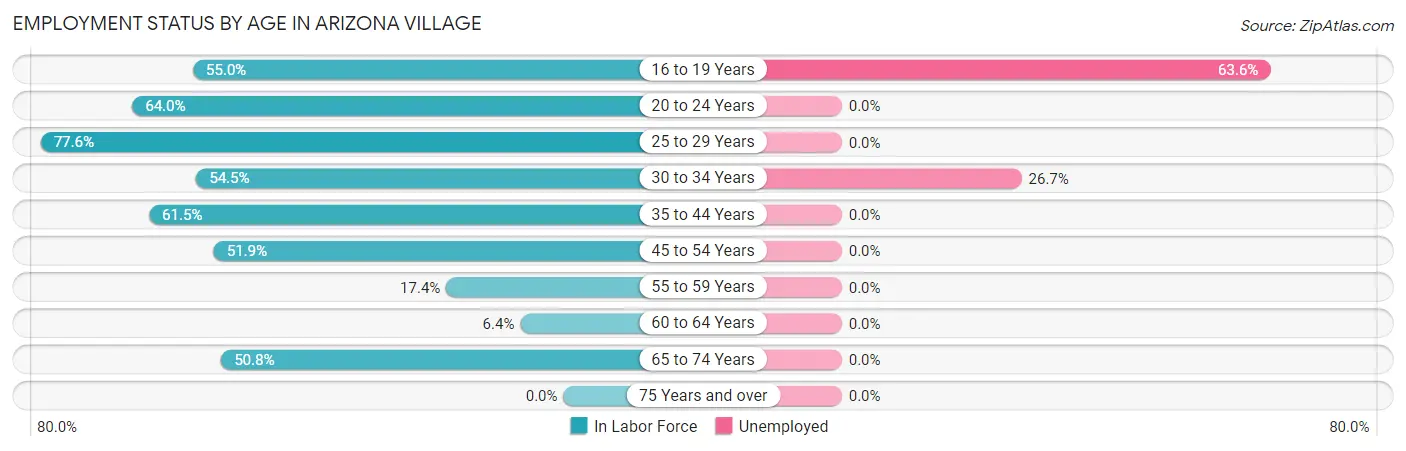
| Age Bracket | In Labor Force | Unemployed |
| 16 to 19 Years | 11 (55.0%) | 7 (63.6%) |
| 20 to 24 Years | 48 (64.0%) | 0 (0.0%) |
| 25 to 29 Years | 38 (77.6%) | 0 (0.0%) |
| 30 to 34 Years | 30 (54.5%) | 8 (26.7%) |
| 35 to 44 Years | 24 (61.5%) | 0 (0.0%) |
| 45 to 54 Years | 40 (51.9%) | 0 (0.0%) |
| 55 to 59 Years | 4 (17.4%) | 0 (0.0%) |
| 60 to 64 Years | 5 (6.4%) | 0 (0.0%) |
| 65 to 74 Years | 30 (50.8%) | 0 (0.0%) |
| 75 Years and over | 0 (0.0%) | 0 (0.0%) |
| Total | 230 (48.3%) | 15 (6.5%) |
Employment Status by Educational Attainment in Arizona Village
According to labor force statistics for Arizona Village, 43.9% of individuals (141) out of the total population between 25 and 64 years of age (321) are in the labor force, with 5.7% or 8 of them being unemployed. The group with the highest labor force participation rate are those with the educational attainment of bachelor's degree or higher, with 100.0% or 13 individuals in the labor force. Within the labor force, individuals with less than high school education have the highest percentage of unemployment, with 100.0% or 5 of them being unemployed.
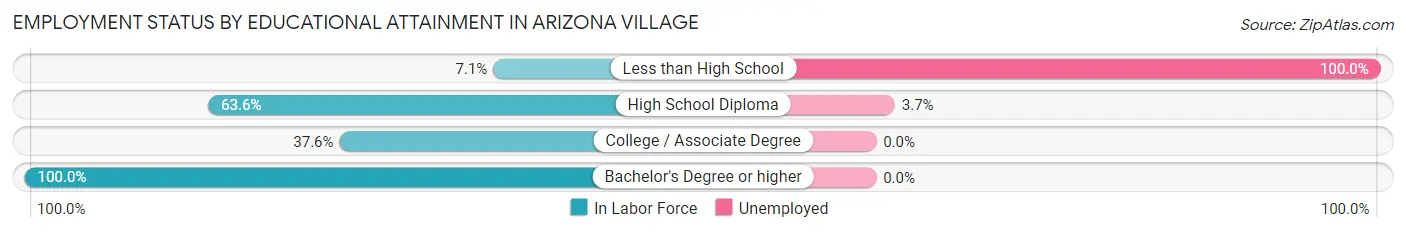
| Educational Attainment | In Labor Force | Unemployed |
| Less than High School | 5 (7.1%) | 70 (100.0%) |
| High School Diploma | 82 (63.6%) | 5 (3.7%) |
| College / Associate Degree | 41 (37.6%) | 0 (0.0%) |
| Bachelor's Degree or higher | 13 (100.0%) | 0 (0.0%) |
| Total | 141 (43.9%) | 18 (5.7%) |
Employment Occupations by Sex in Arizona Village
Management, Business, Science and Arts Occupations
The most common Management, Business, Science and Arts occupations in Arizona Village are Management (12 | 5.6%), Community & Social Service (12 | 5.6%), Education Instruction & Library (12 | 5.6%), and Health Diagnosing & Treating (6 | 2.8%).
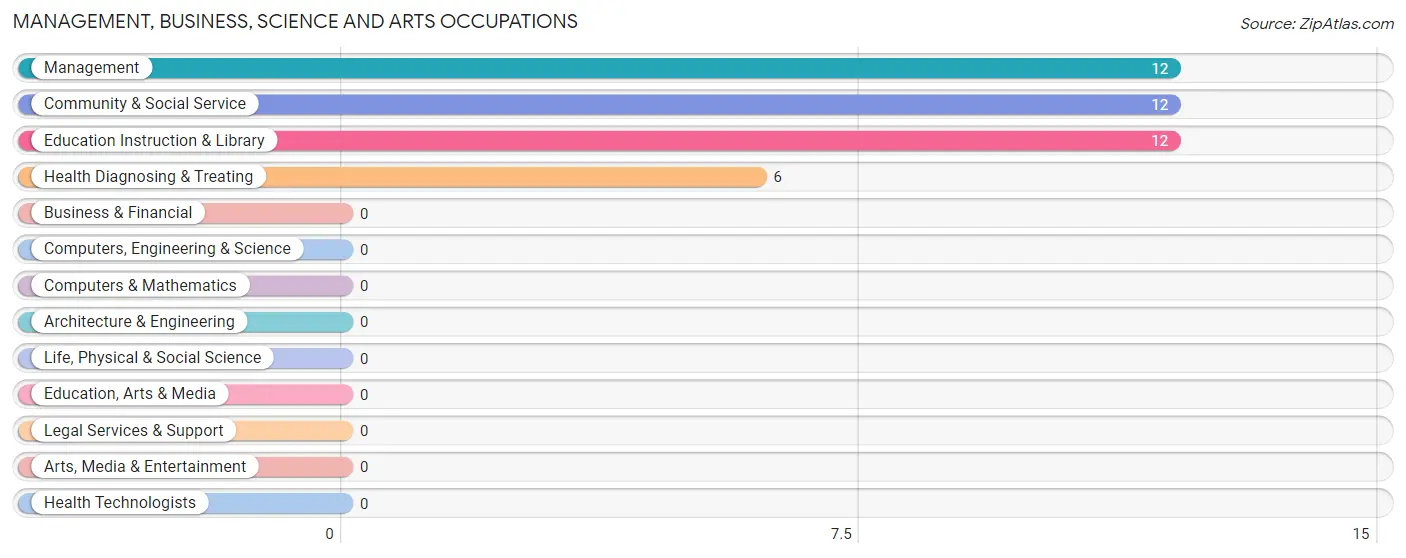
Management, Business, Science and Arts Occupations by Sex
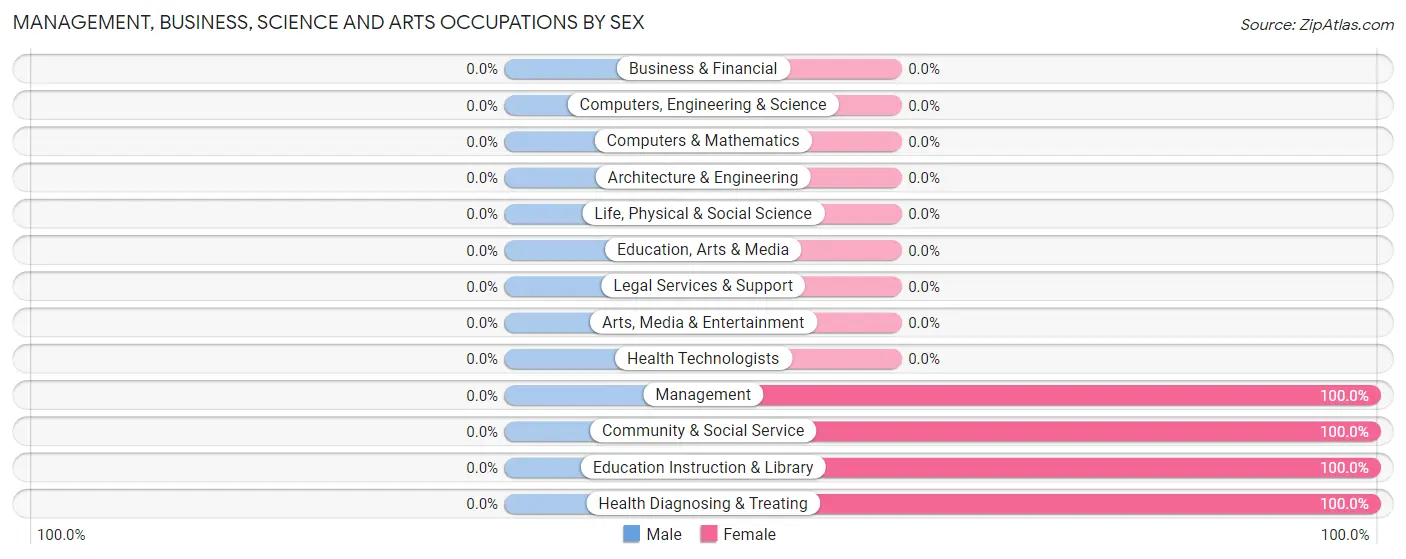
| Occupation | Male | Female |
| Management | 0 (0.0%) | 12 (100.0%) |
| Business & Financial | 0 (0.0%) | 0 (0.0%) |
| Computers, Engineering & Science | 0 (0.0%) | 0 (0.0%) |
| Computers & Mathematics | 0 (0.0%) | 0 (0.0%) |
| Architecture & Engineering | 0 (0.0%) | 0 (0.0%) |
| Life, Physical & Social Science | 0 (0.0%) | 0 (0.0%) |
| Community & Social Service | 0 (0.0%) | 12 (100.0%) |
| Education, Arts & Media | 0 (0.0%) | 0 (0.0%) |
| Legal Services & Support | 0 (0.0%) | 0 (0.0%) |
| Education Instruction & Library | 0 (0.0%) | 12 (100.0%) |
| Arts, Media & Entertainment | 0 (0.0%) | 0 (0.0%) |
| Health Diagnosing & Treating | 0 (0.0%) | 6 (100.0%) |
| Health Technologists | 0 (0.0%) | 0 (0.0%) |
| Total (Category) | 0 (0.0%) | 30 (100.0%) |
| Total (Overall) | 144 (67.0%) | 71 (33.0%) |
Services Occupations
The most common Services occupations in Arizona Village are Security & Protection (52 | 24.2%), Firefighting & Prevention (52 | 24.2%), Food Preparation & Serving (48 | 22.3%), Healthcare Support (9 | 4.2%), and Cleaning & Maintenance (6 | 2.8%).
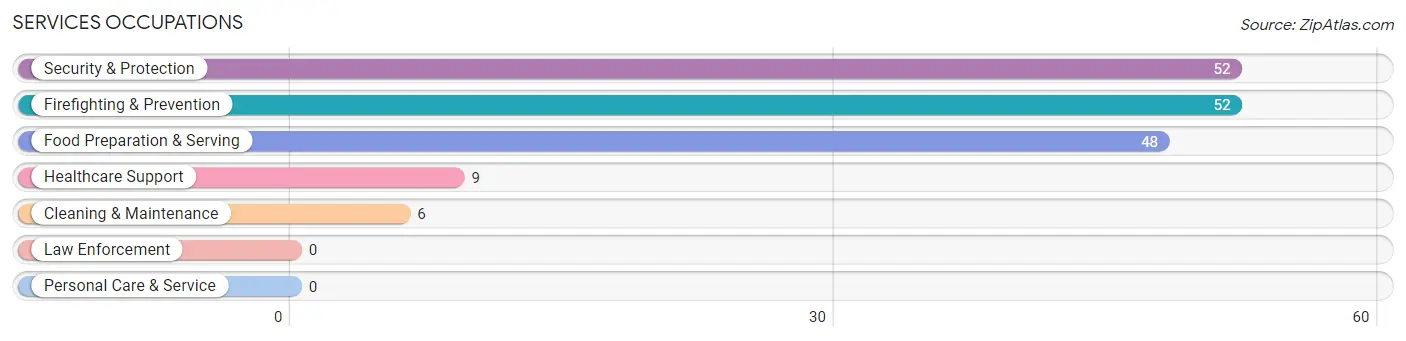
Services Occupations by Sex
Within the Services occupations in Arizona Village, the most male-oriented occupations are Food Preparation & Serving (93.8%), Security & Protection (75.0%), and Firefighting & Prevention (75.0%), while the most female-oriented occupations are Cleaning & Maintenance (100.0%), Healthcare Support (55.6%), and Security & Protection (25.0%).
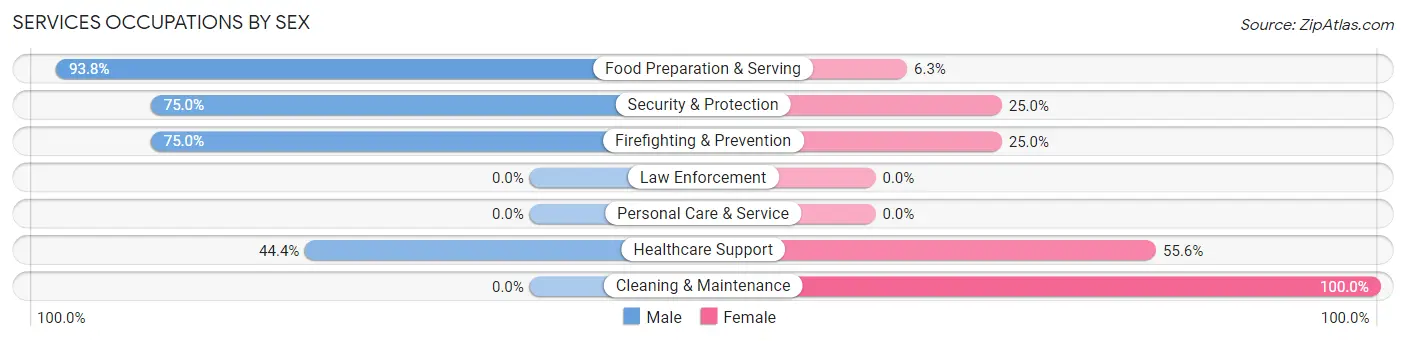
| Occupation | Male | Female |
| Healthcare Support | 4 (44.4%) | 5 (55.6%) |
| Security & Protection | 39 (75.0%) | 13 (25.0%) |
| Firefighting & Prevention | 39 (75.0%) | 13 (25.0%) |
| Law Enforcement | 0 (0.0%) | 0 (0.0%) |
| Food Preparation & Serving | 45 (93.8%) | 3 (6.2%) |
| Cleaning & Maintenance | 0 (0.0%) | 6 (100.0%) |
| Personal Care & Service | 0 (0.0%) | 0 (0.0%) |
| Total (Category) | 88 (76.5%) | 27 (23.5%) |
| Total (Overall) | 144 (67.0%) | 71 (33.0%) |
Sales and Office Occupations
The most common Sales and Office occupations in Arizona Village are Office & Administration (23 | 10.7%), and Sales & Related (1 | 0.5%).
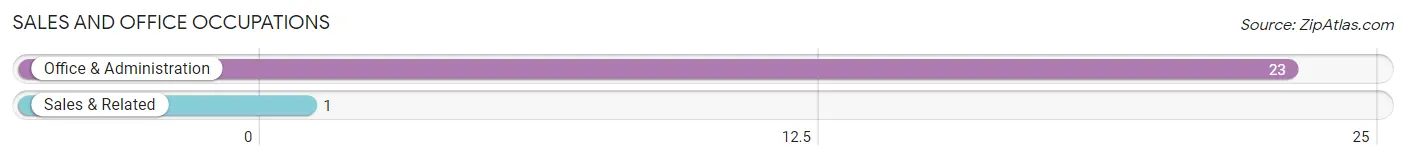
Sales and Office Occupations by Sex
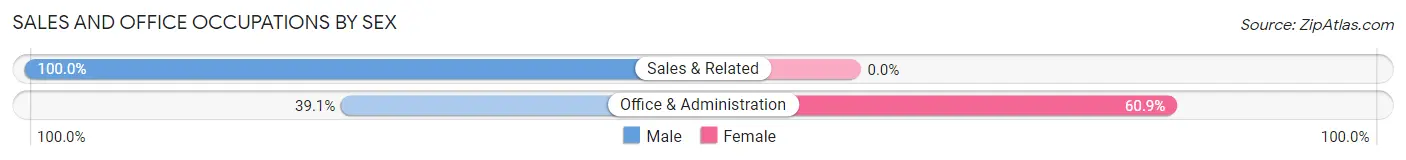
| Occupation | Male | Female |
| Sales & Related | 1 (100.0%) | 0 (0.0%) |
| Office & Administration | 9 (39.1%) | 14 (60.9%) |
| Total (Category) | 10 (41.7%) | 14 (58.3%) |
| Total (Overall) | 144 (67.0%) | 71 (33.0%) |
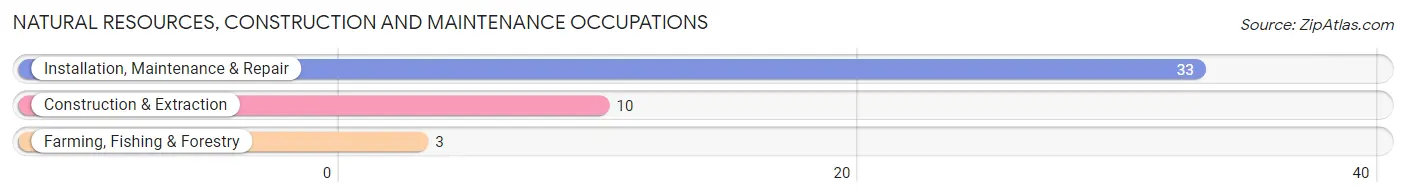
Natural Resources, Construction and Maintenance Occupations
The most common Natural Resources, Construction and Maintenance occupations in Arizona Village are Installation, Maintenance & Repair (33 | 15.3%), Construction & Extraction (10 | 4.6%), and Farming, Fishing & Forestry (3 | 1.4%).
Natural Resources, Construction and Maintenance Occupations by Sex
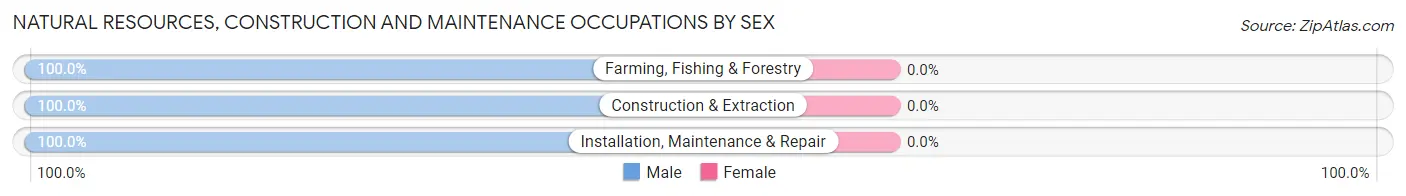
| Occupation | Male | Female |
| Farming, Fishing & Forestry | 3 (100.0%) | 0 (0.0%) |
| Construction & Extraction | 10 (100.0%) | 0 (0.0%) |
| Installation, Maintenance & Repair | 33 (100.0%) | 0 (0.0%) |
| Total (Category) | 46 (100.0%) | 0 (0.0%) |
| Total (Overall) | 144 (67.0%) | 71 (33.0%) |
Production, Transportation and Moving Occupations
Production, Transportation and Moving Occupations by Sex
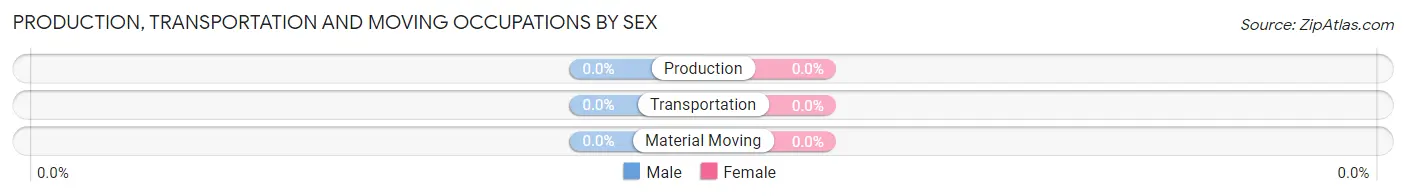
| Occupation | Male | Female |
| Production | 0 (0.0%) | 0 (0.0%) |
| Transportation | 0 (0.0%) | 0 (0.0%) |
| Material Moving | 0 (0.0%) | 0 (0.0%) |
| Total (Category) | 0 (0.0%) | 0 (0.0%) |
| Total (Overall) | 144 (67.0%) | 71 (33.0%) |
Employment Industries by Sex in Arizona Village
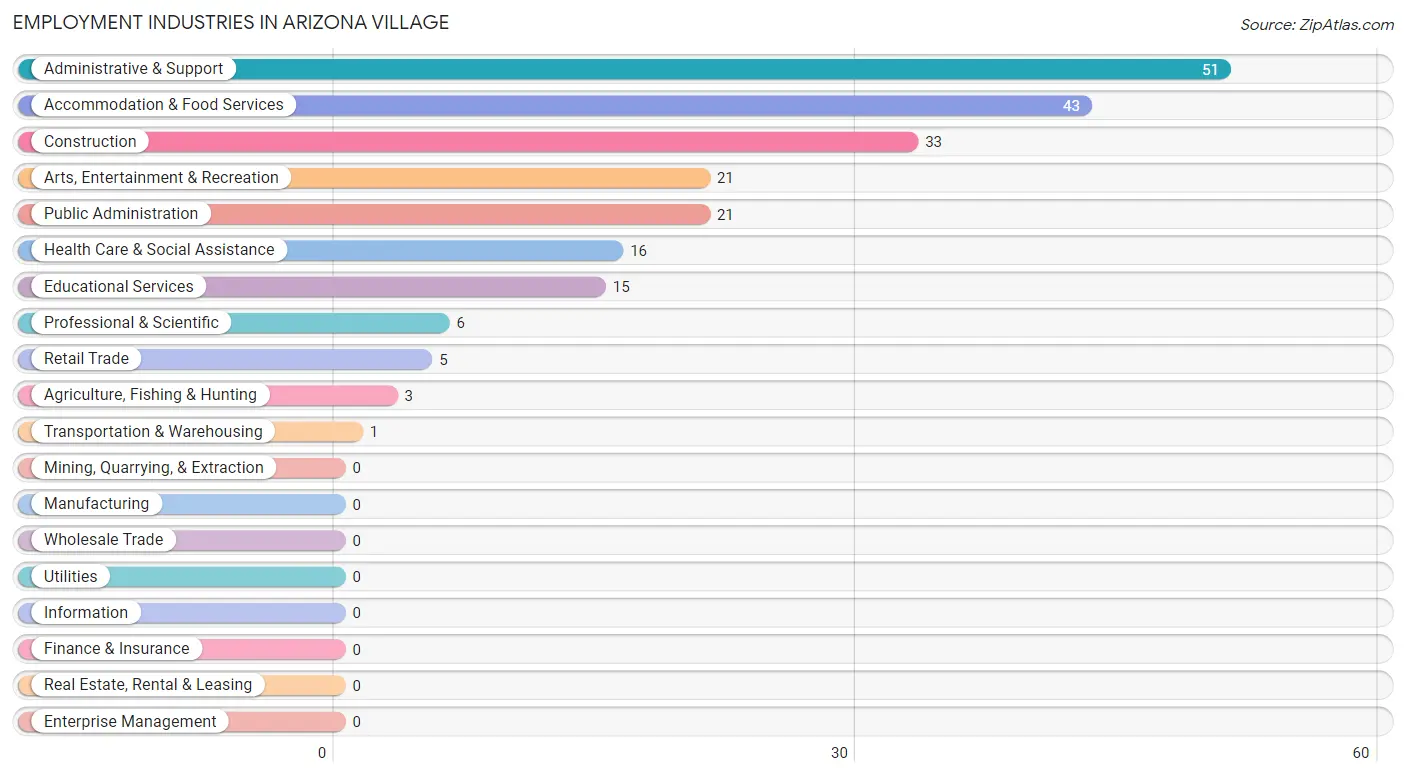
Employment Industries in Arizona Village
The major employment industries in Arizona Village include Administrative & Support (51 | 23.7%), Accommodation & Food Services (43 | 20.0%), Construction (33 | 15.3%), Arts, Entertainment & Recreation (21 | 9.8%), and Public Administration (21 | 9.8%).
Employment Industries by Sex in Arizona Village
The Arizona Village industries that see more men than women are Agriculture, Fishing & Hunting (100.0%), Construction (100.0%), and Transportation & Warehousing (100.0%), whereas the industries that tend to have a higher number of women are Professional & Scientific (100.0%), Educational Services (100.0%), and Retail Trade (80.0%).
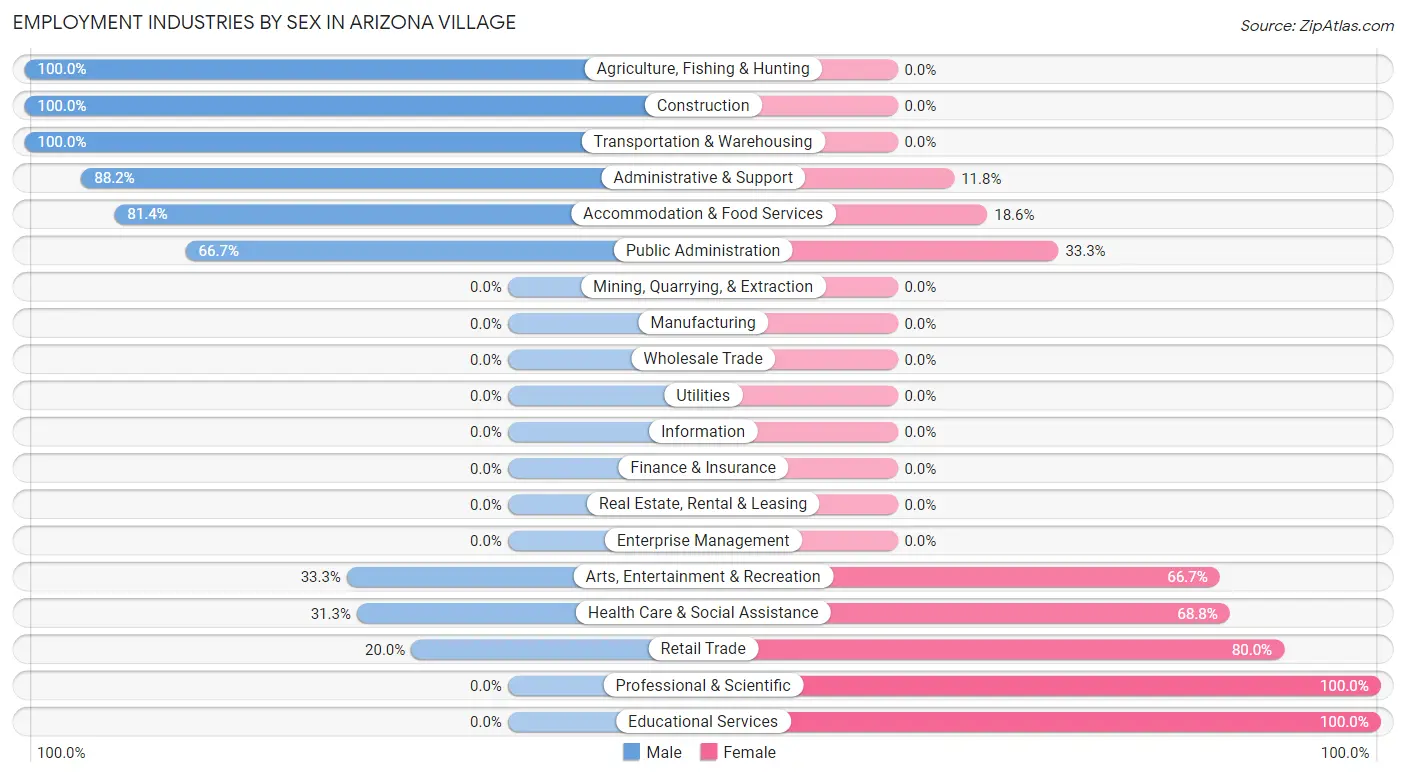
| Industry | Male | Female |
| Agriculture, Fishing & Hunting | 3 (100.0%) | 0 (0.0%) |
| Mining, Quarrying, & Extraction | 0 (0.0%) | 0 (0.0%) |
| Construction | 33 (100.0%) | 0 (0.0%) |
| Manufacturing | 0 (0.0%) | 0 (0.0%) |
| Wholesale Trade | 0 (0.0%) | 0 (0.0%) |
| Retail Trade | 1 (20.0%) | 4 (80.0%) |
| Transportation & Warehousing | 1 (100.0%) | 0 (0.0%) |
| Utilities | 0 (0.0%) | 0 (0.0%) |
| Information | 0 (0.0%) | 0 (0.0%) |
| Finance & Insurance | 0 (0.0%) | 0 (0.0%) |
| Real Estate, Rental & Leasing | 0 (0.0%) | 0 (0.0%) |
| Professional & Scientific | 0 (0.0%) | 6 (100.0%) |
| Enterprise Management | 0 (0.0%) | 0 (0.0%) |
| Administrative & Support | 45 (88.2%) | 6 (11.8%) |
| Educational Services | 0 (0.0%) | 15 (100.0%) |
| Health Care & Social Assistance | 5 (31.2%) | 11 (68.8%) |
| Arts, Entertainment & Recreation | 7 (33.3%) | 14 (66.7%) |
| Accommodation & Food Services | 35 (81.4%) | 8 (18.6%) |
| Public Administration | 14 (66.7%) | 7 (33.3%) |
| Total | 144 (67.0%) | 71 (33.0%) |
Education in Arizona Village
School Enrollment in Arizona Village
The most common levels of schooling among the 159 students in Arizona Village are elementary school (53 | 33.3%), college / undergraduate (39 | 24.5%), and high school (29 | 18.2%).
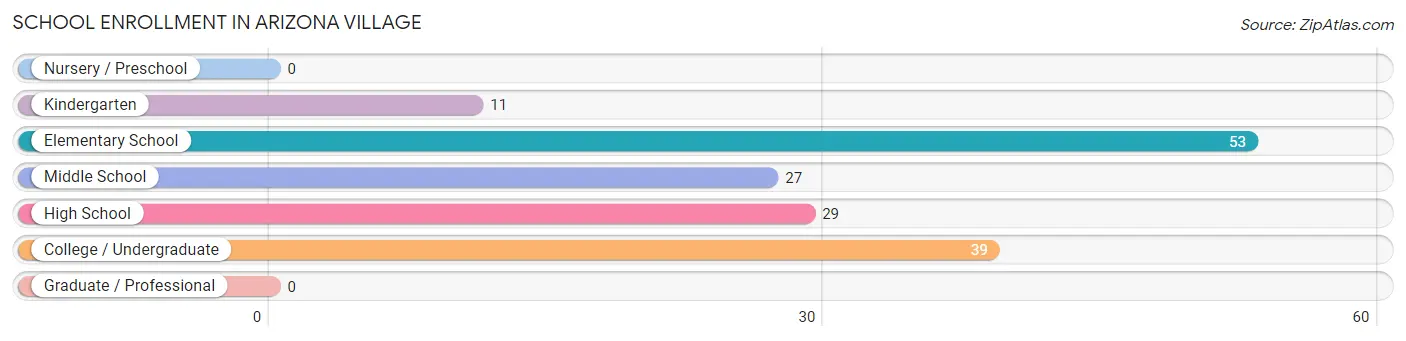
| School Level | # Students | % Students |
| Nursery / Preschool | 0 | 0.0% |
| Kindergarten | 11 | 6.9% |
| Elementary School | 53 | 33.3% |
| Middle School | 27 | 17.0% |
| High School | 29 | 18.2% |
| College / Undergraduate | 39 | 24.5% |
| Graduate / Professional | 0 | 0.0% |
| Total | 159 | 100.0% |
School Enrollment by Age by Funding Source in Arizona Village
Out of a total of 159 students who are enrolled in schools in Arizona Village, 3 (1.9%) attend a private institution, while the remaining 156 (98.1%) are enrolled in public schools. The age group of 5 to 9 year old has the highest likelihood of being enrolled in private schools, with 3 (5.6% in the age bracket) enrolled. Conversely, the age group of 10 to 14 year olds has the lowest likelihood of being enrolled in a private school, with 41 (100.0% in the age bracket) attending a public institution.
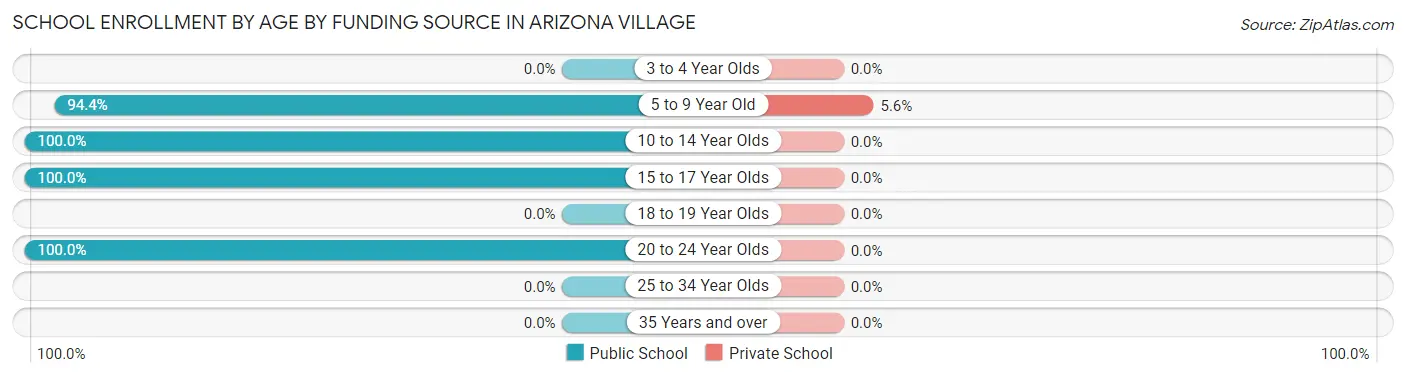
| Age Bracket | Public School | Private School |
| 3 to 4 Year Olds | 0 (0.0%) | 0 (0.0%) |
| 5 to 9 Year Old | 51 (94.4%) | 3 (5.6%) |
| 10 to 14 Year Olds | 41 (100.0%) | 0 (0.0%) |
| 15 to 17 Year Olds | 25 (100.0%) | 0 (0.0%) |
| 18 to 19 Year Olds | 0 (0.0%) | 0 (0.0%) |
| 20 to 24 Year Olds | 39 (100.0%) | 0 (0.0%) |
| 25 to 34 Year Olds | 0 (0.0%) | 0 (0.0%) |
| 35 Years and over | 0 (0.0%) | 0 (0.0%) |
| Total | 156 (98.1%) | 3 (1.9%) |
Educational Attainment by Field of Study in Arizona Village
Literature & languages (8 | 61.5%), and arts & humanities (5 | 38.5%) are the most common fields of study among 13 individuals in Arizona Village who have obtained a bachelor's degree or higher.
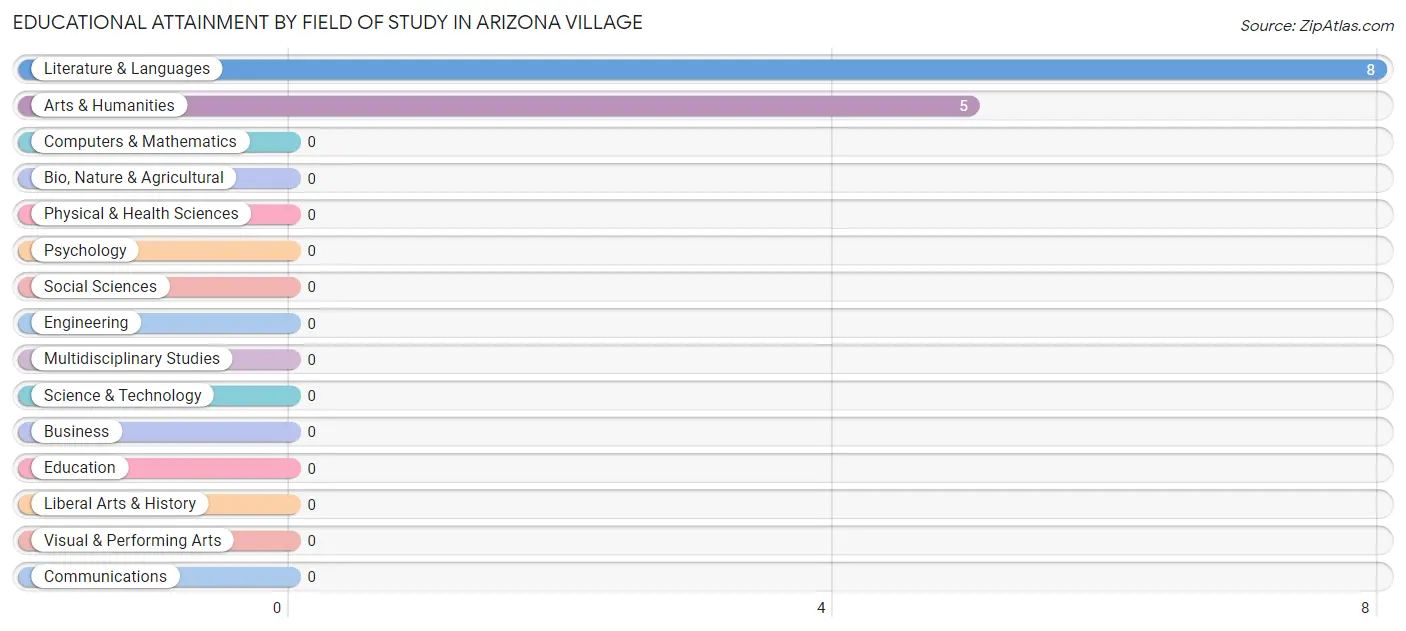
| Field of Study | # Graduates | % Graduates |
| Computers & Mathematics | 0 | 0.0% |
| Bio, Nature & Agricultural | 0 | 0.0% |
| Physical & Health Sciences | 0 | 0.0% |
| Psychology | 0 | 0.0% |
| Social Sciences | 0 | 0.0% |
| Engineering | 0 | 0.0% |
| Multidisciplinary Studies | 0 | 0.0% |
| Science & Technology | 0 | 0.0% |
| Business | 0 | 0.0% |
| Education | 0 | 0.0% |
| Literature & Languages | 8 | 61.5% |
| Liberal Arts & History | 0 | 0.0% |
| Visual & Performing Arts | 0 | 0.0% |
| Communications | 0 | 0.0% |
| Arts & Humanities | 5 | 38.5% |
| Total | 13 | 100.0% |
Transportation & Commute in Arizona Village
Vehicle Availability by Sex in Arizona Village
The most prevalent vehicle ownership categories in Arizona Village are males with 3 vehicles (76, accounting for 52.8%) and females with 3 vehicles (12, making up 107.0%).
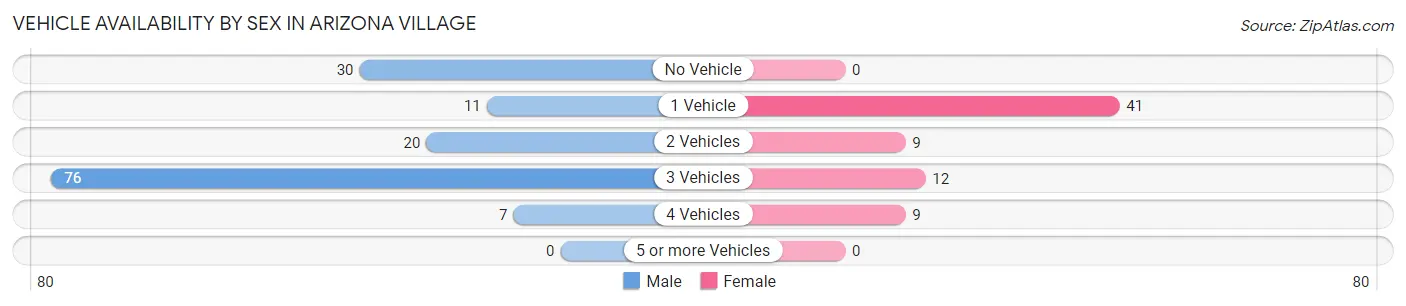
| Vehicles Available | Male | Female |
| No Vehicle | 30 (20.8%) | 0 (0.0%) |
| 1 Vehicle | 11 (7.6%) | 41 (57.8%) |
| 2 Vehicles | 20 (13.9%) | 9 (12.7%) |
| 3 Vehicles | 76 (52.8%) | 12 (16.9%) |
| 4 Vehicles | 7 (4.9%) | 9 (12.7%) |
| 5 or more Vehicles | 0 (0.0%) | 0 (0.0%) |
| Total | 144 (100.0%) | 71 (100.0%) |
Commute Time in Arizona Village
The most frequently occuring commute durations in Arizona Village are 10 to 14 minutes (91 commuters, 49.2%), 5 to 9 minutes (46 commuters, 24.9%), and 15 to 19 minutes (11 commuters, 5.9%).
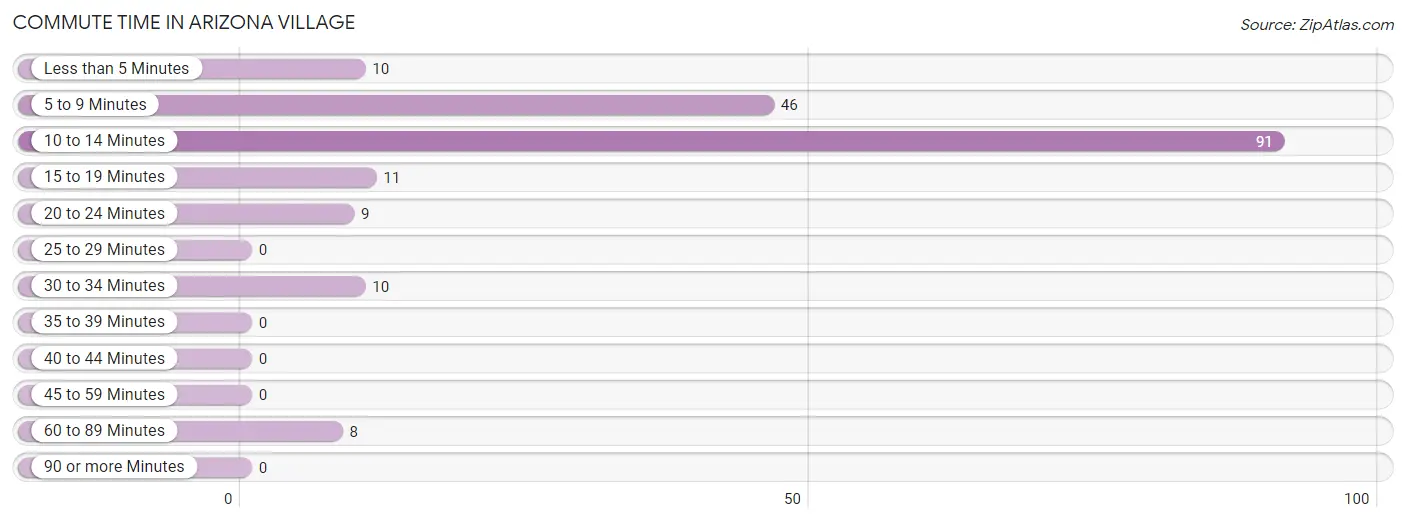
| Commute Time | # Commuters | % Commuters |
| Less than 5 Minutes | 10 | 5.4% |
| 5 to 9 Minutes | 46 | 24.9% |
| 10 to 14 Minutes | 91 | 49.2% |
| 15 to 19 Minutes | 11 | 5.9% |
| 20 to 24 Minutes | 9 | 4.9% |
| 25 to 29 Minutes | 0 | 0.0% |
| 30 to 34 Minutes | 10 | 5.4% |
| 35 to 39 Minutes | 0 | 0.0% |
| 40 to 44 Minutes | 0 | 0.0% |
| 45 to 59 Minutes | 0 | 0.0% |
| 60 to 89 Minutes | 8 | 4.3% |
| 90 or more Minutes | 0 | 0.0% |
Commute Time by Sex in Arizona Village
The most common commute times in Arizona Village are 10 to 14 minutes (79 commuters, 69.3%) for males and 5 to 9 minutes (21 commuters, 29.6%) for females.
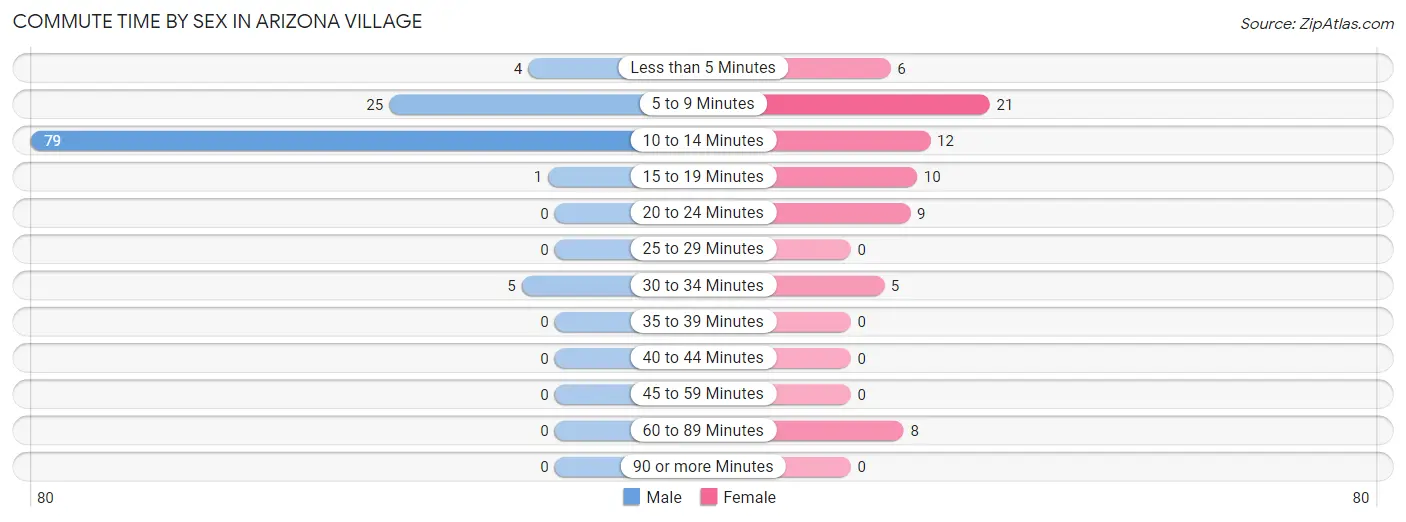
| Commute Time | Male | Female |
| Less than 5 Minutes | 4 (3.5%) | 6 (8.5%) |
| 5 to 9 Minutes | 25 (21.9%) | 21 (29.6%) |
| 10 to 14 Minutes | 79 (69.3%) | 12 (16.9%) |
| 15 to 19 Minutes | 1 (0.9%) | 10 (14.1%) |
| 20 to 24 Minutes | 0 (0.0%) | 9 (12.7%) |
| 25 to 29 Minutes | 0 (0.0%) | 0 (0.0%) |
| 30 to 34 Minutes | 5 (4.4%) | 5 (7.0%) |
| 35 to 39 Minutes | 0 (0.0%) | 0 (0.0%) |
| 40 to 44 Minutes | 0 (0.0%) | 0 (0.0%) |
| 45 to 59 Minutes | 0 (0.0%) | 0 (0.0%) |
| 60 to 89 Minutes | 0 (0.0%) | 8 (11.3%) |
| 90 or more Minutes | 0 (0.0%) | 0 (0.0%) |
Time of Departure to Work by Sex in Arizona Village
The most frequent times of departure to work in Arizona Village are 8:30 AM to 8:59 AM (39, 34.2%) for males and 7:00 AM to 7:29 AM (17, 23.9%) for females.
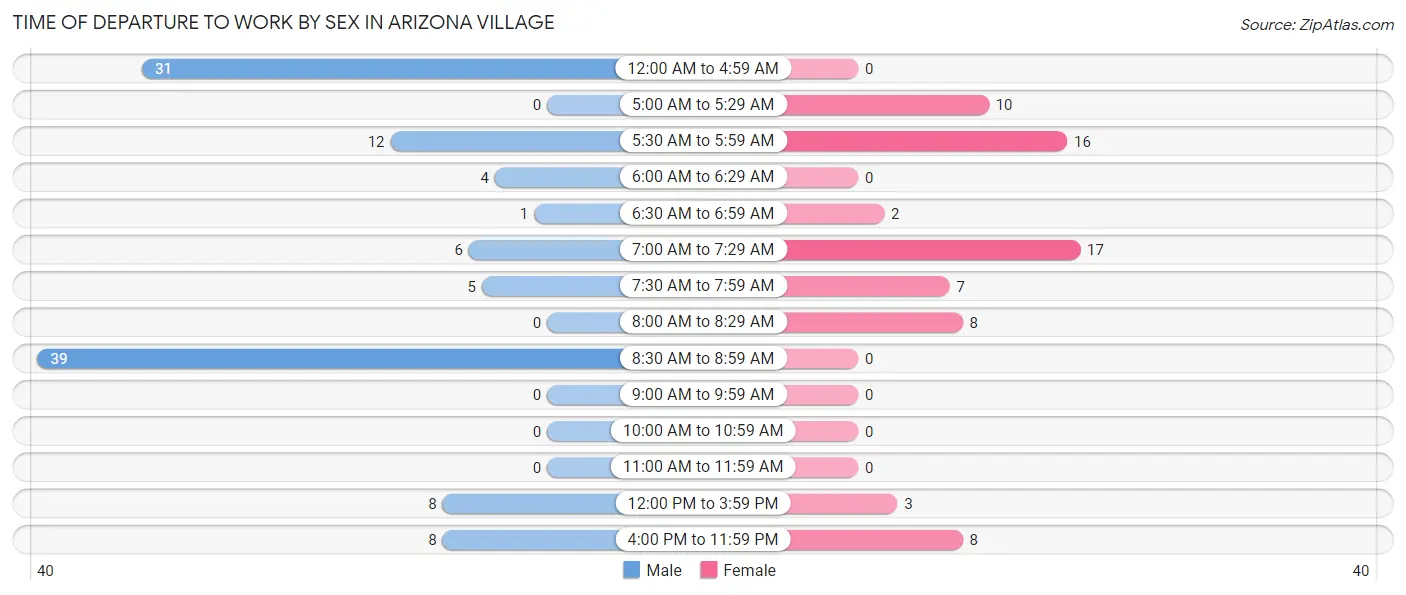
| Time of Departure | Male | Female |
| 12:00 AM to 4:59 AM | 31 (27.2%) | 0 (0.0%) |
| 5:00 AM to 5:29 AM | 0 (0.0%) | 10 (14.1%) |
| 5:30 AM to 5:59 AM | 12 (10.5%) | 16 (22.5%) |
| 6:00 AM to 6:29 AM | 4 (3.5%) | 0 (0.0%) |
| 6:30 AM to 6:59 AM | 1 (0.9%) | 2 (2.8%) |
| 7:00 AM to 7:29 AM | 6 (5.3%) | 17 (23.9%) |
| 7:30 AM to 7:59 AM | 5 (4.4%) | 7 (9.9%) |
| 8:00 AM to 8:29 AM | 0 (0.0%) | 8 (11.3%) |
| 8:30 AM to 8:59 AM | 39 (34.2%) | 0 (0.0%) |
| 9:00 AM to 9:59 AM | 0 (0.0%) | 0 (0.0%) |
| 10:00 AM to 10:59 AM | 0 (0.0%) | 0 (0.0%) |
| 11:00 AM to 11:59 AM | 0 (0.0%) | 0 (0.0%) |
| 12:00 PM to 3:59 PM | 8 (7.0%) | 3 (4.2%) |
| 4:00 PM to 11:59 PM | 8 (7.0%) | 8 (11.3%) |
| Total | 114 (100.0%) | 71 (100.0%) |
Housing Occupancy in Arizona Village
Occupancy by Ownership in Arizona Village
Of the total 213 dwellings in Arizona Village, owner-occupied units account for 92 (43.2%), while renter-occupied units make up 121 (56.8%).
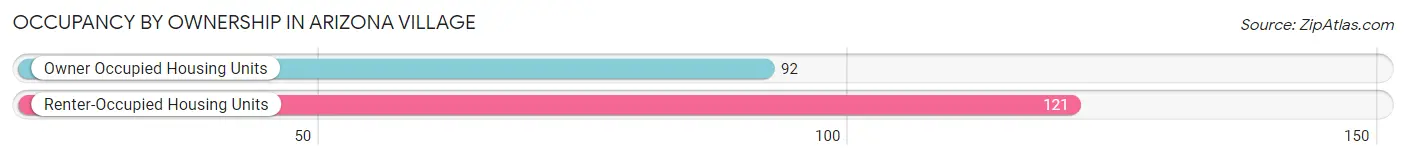
| Occupancy | # Housing Units | % Housing Units |
| Owner Occupied Housing Units | 92 | 43.2% |
| Renter-Occupied Housing Units | 121 | 56.8% |
| Total Occupied Housing Units | 213 | 100.0% |
Occupancy by Household Size in Arizona Village
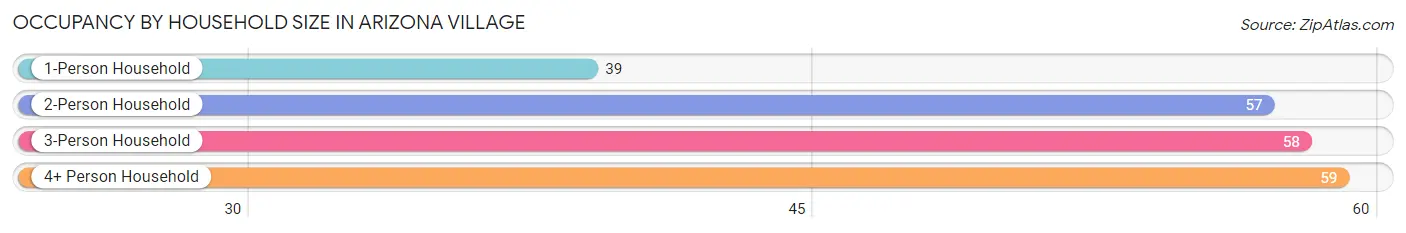
| Household Size | # Housing Units | % Housing Units |
| 1-Person Household | 39 | 18.3% |
| 2-Person Household | 57 | 26.8% |
| 3-Person Household | 58 | 27.2% |
| 4+ Person Household | 59 | 27.7% |
| Total Housing Units | 213 | 100.0% |
Occupancy by Ownership by Household Size in Arizona Village
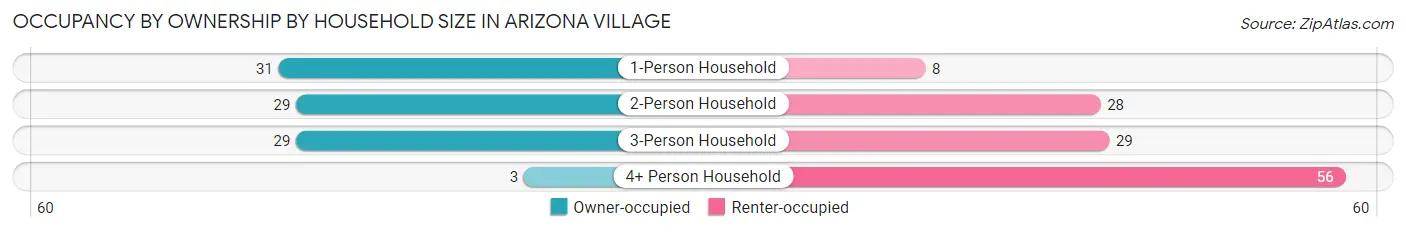
| Household Size | Owner-occupied | Renter-occupied |
| 1-Person Household | 31 (79.5%) | 8 (20.5%) |
| 2-Person Household | 29 (50.9%) | 28 (49.1%) |
| 3-Person Household | 29 (50.0%) | 29 (50.0%) |
| 4+ Person Household | 3 (5.1%) | 56 (94.9%) |
| Total Housing Units | 92 (43.2%) | 121 (56.8%) |
Occupancy by Educational Attainment in Arizona Village
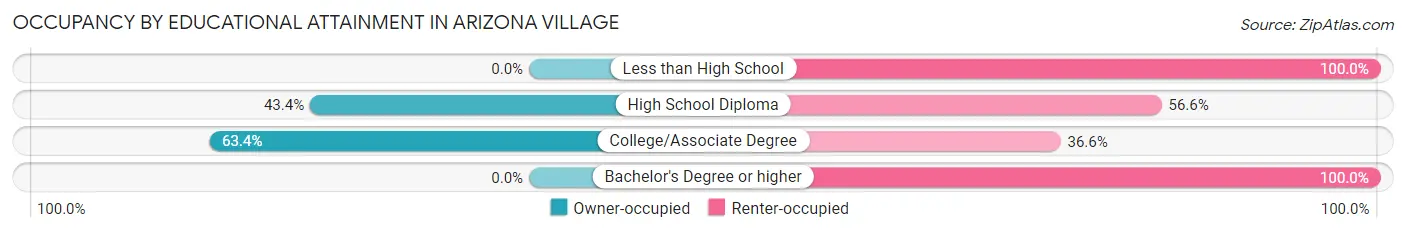
| Household Size | Owner-occupied | Renter-occupied |
| Less than High School | 0 (0.0%) | 36 (100.0%) |
| High School Diploma | 33 (43.4%) | 43 (56.6%) |
| College/Associate Degree | 59 (63.4%) | 34 (36.6%) |
| Bachelor's Degree or higher | 0 (0.0%) | 8 (100.0%) |
Occupancy by Age of Householder in Arizona Village
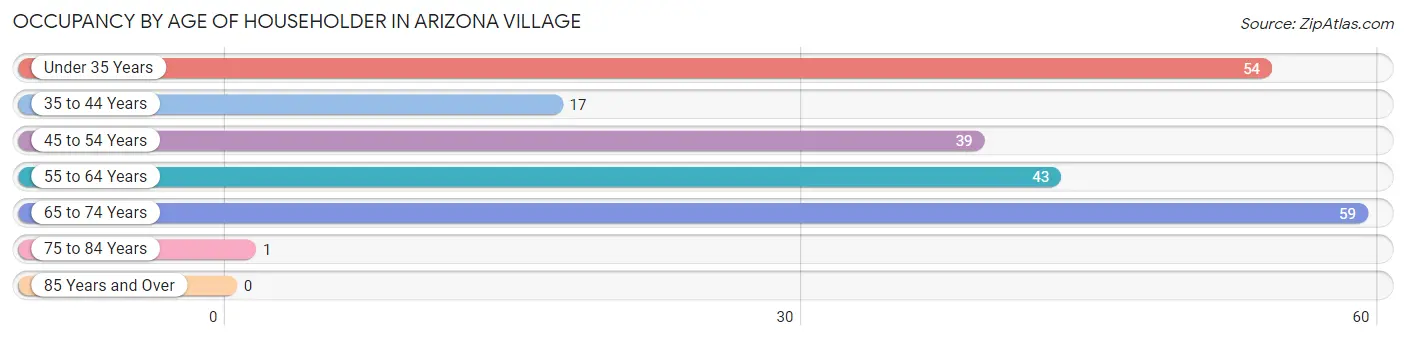
| Age Bracket | # Households | % Households |
| Under 35 Years | 54 | 25.4% |
| 35 to 44 Years | 17 | 8.0% |
| 45 to 54 Years | 39 | 18.3% |
| 55 to 64 Years | 43 | 20.2% |
| 65 to 74 Years | 59 | 27.7% |
| 75 to 84 Years | 1 | 0.5% |
| 85 Years and Over | 0 | 0.0% |
| Total | 213 | 100.0% |
Housing Finances in Arizona Village
Median Income by Occupancy in Arizona Village
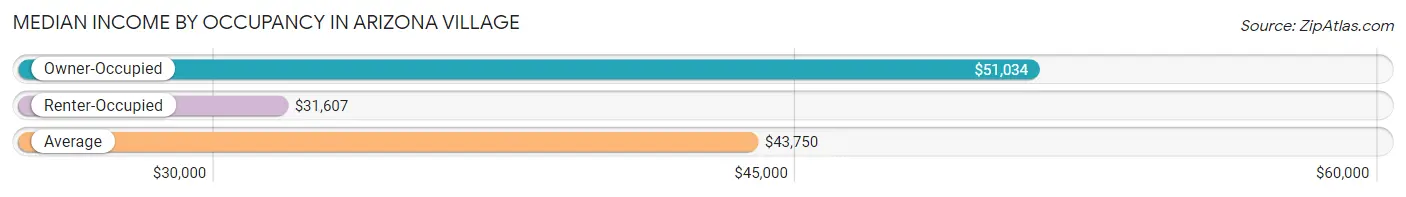
| Occupancy Type | # Households | Median Income |
| Owner-Occupied | 92 (43.2%) | $51,034 |
| Renter-Occupied | 121 (56.8%) | $31,607 |
| Average | 213 (100.0%) | $43,750 |
Occupancy by Householder Income Bracket in Arizona Village
| Income Bracket | Owner-occupied | Renter-occupied |
| Less than $5,000 | 0 (0.0%) | 0 (0.0%) |
| $5,000 to $9,999 | 0 (0.0%) | 7 (5.8%) |
| $10,000 to $14,999 | 0 (0.0%) | 21 (17.4%) |
| $15,000 to $19,999 | 3 (3.3%) | 12 (9.9%) |
| $20,000 to $24,999 | 0 (0.0%) | 6 (5.0%) |
| $25,000 to $34,999 | 30 (32.6%) | 17 (14.1%) |
| $35,000 to $49,999 | 1 (1.1%) | 27 (22.3%) |
| $50,000 to $74,999 | 29 (31.5%) | 11 (9.1%) |
| $75,000 to $99,999 | 29 (31.5%) | 10 (8.3%) |
| $100,000 to $149,999 | 0 (0.0%) | 10 (8.3%) |
| $150,000 or more | 0 (0.0%) | 0 (0.0%) |
| Total | 92 (100.0%) | 121 (100.0%) |
Monthly Housing Cost Tiers in Arizona Village
| Monthly Cost | Owner-occupied | Renter-occupied |
| Less than $300 | 3 (3.3%) | 22 (18.2%) |
| $300 to $499 | 1 (1.1%) | 56 (46.3%) |
| $500 to $799 | 30 (32.6%) | 40 (33.1%) |
| $800 to $999 | 58 (63.0%) | 0 (0.0%) |
| $1,000 to $1,499 | 0 (0.0%) | 0 (0.0%) |
| $1,500 to $1,999 | 0 (0.0%) | 0 (0.0%) |
| $2,000 to $2,499 | 0 (0.0%) | 0 (0.0%) |
| $2,500 to $2,999 | 0 (0.0%) | 0 (0.0%) |
| $3,000 or more | 0 (0.0%) | 0 (0.0%) |
| Total | 92 (100.0%) | 121 (100.0%) |
Physical Housing Characteristics in Arizona Village
Housing Structures in Arizona Village
| Structure Type | # Housing Units | % Housing Units |
| Single Unit, Detached | 180 | 84.5% |
| Single Unit, Attached | 0 | 0.0% |
| 2 Unit Apartments | 4 | 1.9% |
| 3 or 4 Unit Apartments | 0 | 0.0% |
| 5 to 9 Unit Apartments | 0 | 0.0% |
| 10 or more Apartments | 0 | 0.0% |
| Mobile Home / Other | 29 | 13.6% |
| Total | 213 | 100.0% |
Housing Structures by Occupancy in Arizona Village
| Structure Type | Owner-occupied | Renter-occupied |
| Single Unit, Detached | 63 (35.0%) | 117 (65.0%) |
| Single Unit, Attached | 0 (0.0%) | 0 (0.0%) |
| 2 Unit Apartments | 0 (0.0%) | 4 (100.0%) |
| 3 or 4 Unit Apartments | 0 (0.0%) | 0 (0.0%) |
| 5 to 9 Unit Apartments | 0 (0.0%) | 0 (0.0%) |
| 10 or more Apartments | 0 (0.0%) | 0 (0.0%) |
| Mobile Home / Other | 29 (100.0%) | 0 (0.0%) |
| Total | 92 (43.2%) | 121 (56.8%) |
Housing Structures by Number of Rooms in Arizona Village
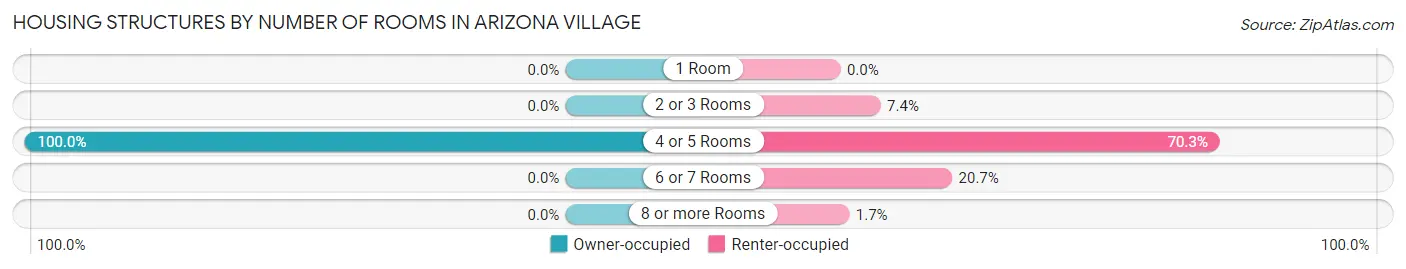
| Number of Rooms | Owner-occupied | Renter-occupied |
| 1 Room | 0 (0.0%) | 0 (0.0%) |
| 2 or 3 Rooms | 0 (0.0%) | 9 (7.4%) |
| 4 or 5 Rooms | 92 (100.0%) | 85 (70.3%) |
| 6 or 7 Rooms | 0 (0.0%) | 25 (20.7%) |
| 8 or more Rooms | 0 (0.0%) | 2 (1.7%) |
| Total | 92 (100.0%) | 121 (100.0%) |
Housing Structure by Heating Type in Arizona Village
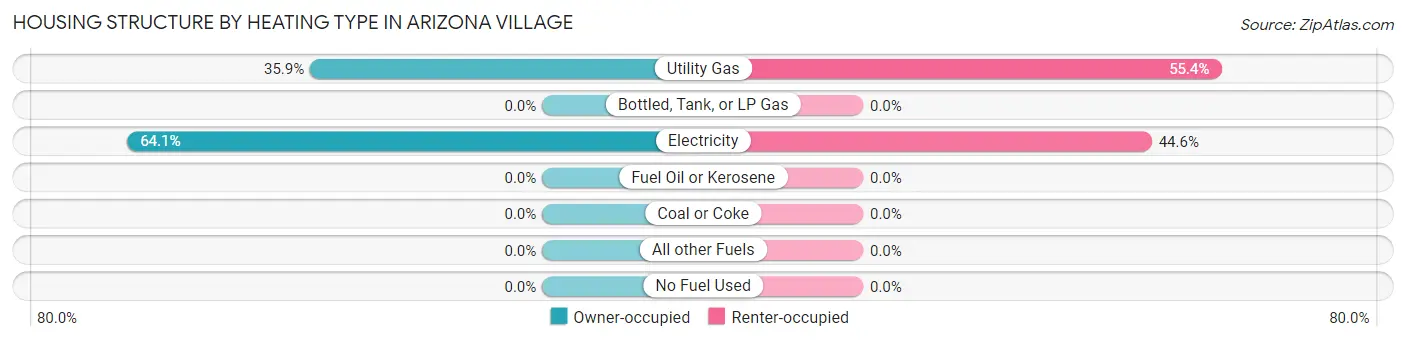
| Heating Type | Owner-occupied | Renter-occupied |
| Utility Gas | 33 (35.9%) | 67 (55.4%) |
| Bottled, Tank, or LP Gas | 0 (0.0%) | 0 (0.0%) |
| Electricity | 59 (64.1%) | 54 (44.6%) |
| Fuel Oil or Kerosene | 0 (0.0%) | 0 (0.0%) |
| Coal or Coke | 0 (0.0%) | 0 (0.0%) |
| All other Fuels | 0 (0.0%) | 0 (0.0%) |
| No Fuel Used | 0 (0.0%) | 0 (0.0%) |
| Total | 92 (100.0%) | 121 (100.0%) |
Household Vehicle Usage in Arizona Village
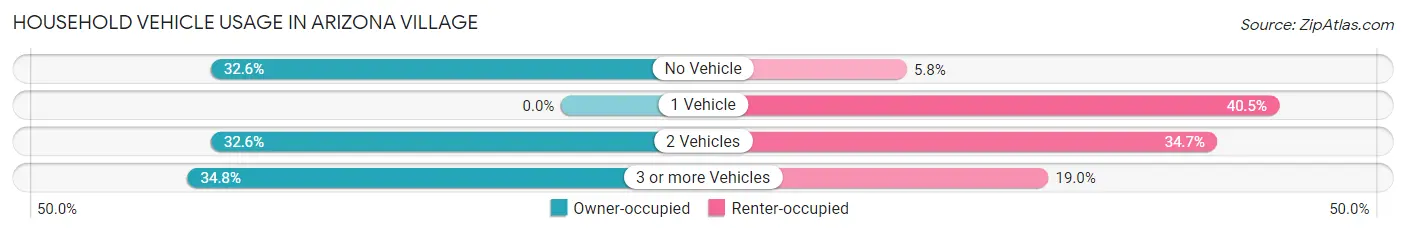
| Vehicles per Household | Owner-occupied | Renter-occupied |
| No Vehicle | 30 (32.6%) | 7 (5.8%) |
| 1 Vehicle | 0 (0.0%) | 49 (40.5%) |
| 2 Vehicles | 30 (32.6%) | 42 (34.7%) |
| 3 or more Vehicles | 32 (34.8%) | 23 (19.0%) |
| Total | 92 (100.0%) | 121 (100.0%) |
Real Estate & Mortgages in Arizona Village
Real Estate and Mortgage Overview in Arizona Village
| Characteristic | Without Mortgage | With Mortgage |
| Housing Units | 33 | 59 |
| Median Property Value | - | - |
| Median Household Income | - | - |
| Monthly Housing Costs | - | - |
| Real Estate Taxes | - | - |
Property Value by Mortgage Status in Arizona Village
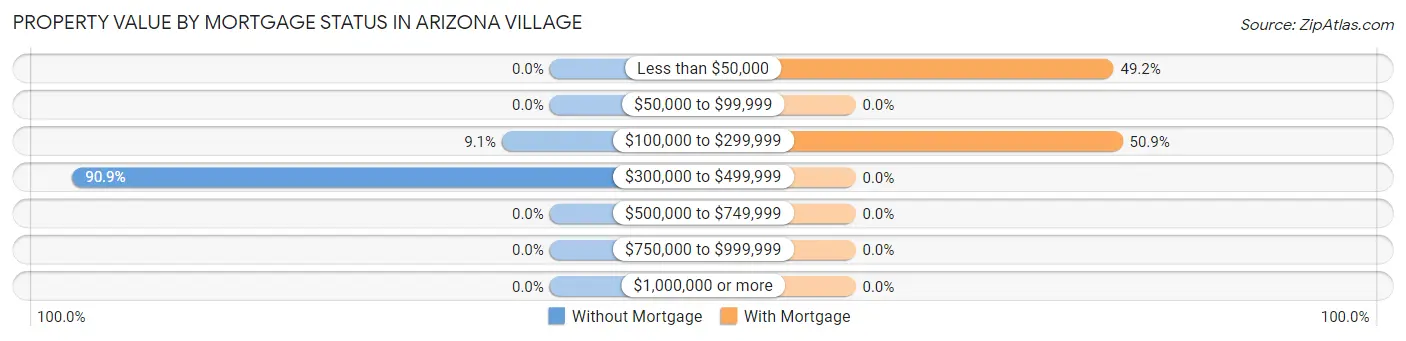
| Property Value | Without Mortgage | With Mortgage |
| Less than $50,000 | 0 (0.0%) | 29 (49.1%) |
| $50,000 to $99,999 | 0 (0.0%) | 0 (0.0%) |
| $100,000 to $299,999 | 3 (9.1%) | 30 (50.8%) |
| $300,000 to $499,999 | 30 (90.9%) | 0 (0.0%) |
| $500,000 to $749,999 | 0 (0.0%) | 0 (0.0%) |
| $750,000 to $999,999 | 0 (0.0%) | 0 (0.0%) |
| $1,000,000 or more | 0 (0.0%) | 0 (0.0%) |
| Total | 33 (100.0%) | 59 (100.0%) |
Household Income by Mortgage Status in Arizona Village
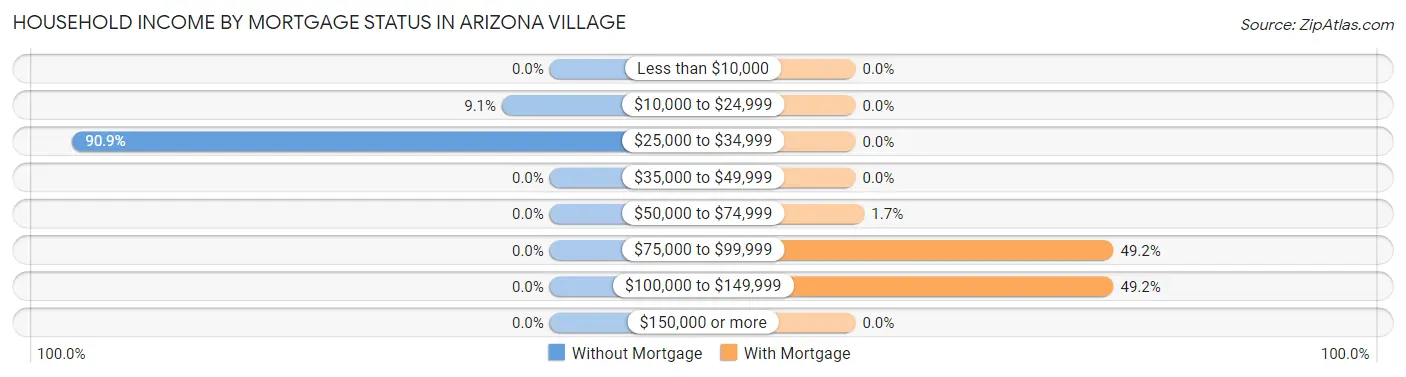
| Household Income | Without Mortgage | With Mortgage |
| Less than $10,000 | 0 (0.0%) | 0 (0.0%) |
| $10,000 to $24,999 | 3 (9.1%) | 0 (0.0%) |
| $25,000 to $34,999 | 30 (90.9%) | 0 (0.0%) |
| $35,000 to $49,999 | 0 (0.0%) | 0 (0.0%) |
| $50,000 to $74,999 | 0 (0.0%) | 1 (1.7%) |
| $75,000 to $99,999 | 0 (0.0%) | 29 (49.1%) |
| $100,000 to $149,999 | 0 (0.0%) | 29 (49.1%) |
| $150,000 or more | 0 (0.0%) | 0 (0.0%) |
| Total | 33 (100.0%) | 59 (100.0%) |
Property Value to Household Income Ratio in Arizona Village
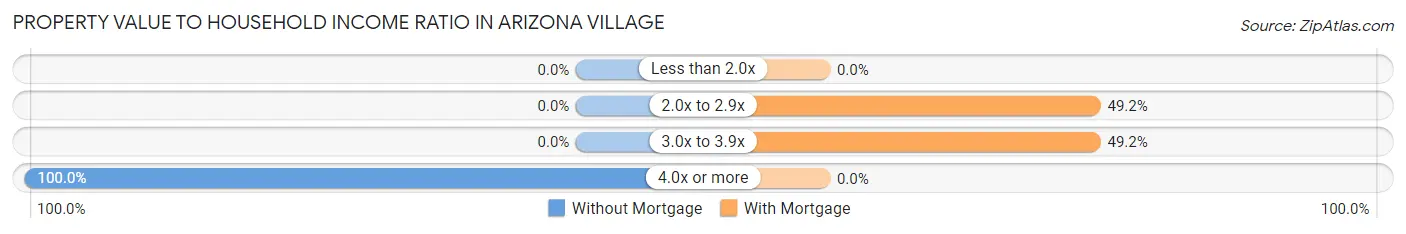
| Value-to-Income Ratio | Without Mortgage | With Mortgage |
| Less than 2.0x | 0 (0.0%) | 0 (0.0%) |
| 2.0x to 2.9x | 0 (0.0%) | 29 (49.1%) |
| 3.0x to 3.9x | 0 (0.0%) | 29 (49.1%) |
| 4.0x or more | 33 (100.0%) | 0 (0.0%) |
| Total | 33 (100.0%) | 59 (100.0%) |
Real Estate Taxes by Mortgage Status in Arizona Village
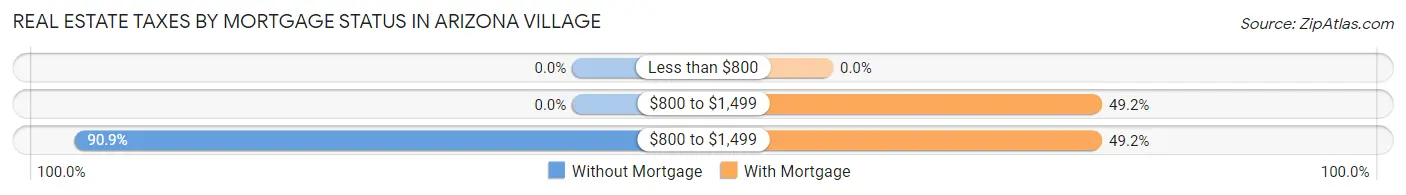
| Property Taxes | Without Mortgage | With Mortgage |
| Less than $800 | 0 (0.0%) | 0 (0.0%) |
| $800 to $1,499 | 0 (0.0%) | 29 (49.1%) |
| $800 to $1,499 | 30 (90.9%) | 29 (49.1%) |
| Total | 33 (100.0%) | 59 (100.0%) |
Health & Disability in Arizona Village
Health Insurance Coverage by Age in Arizona Village
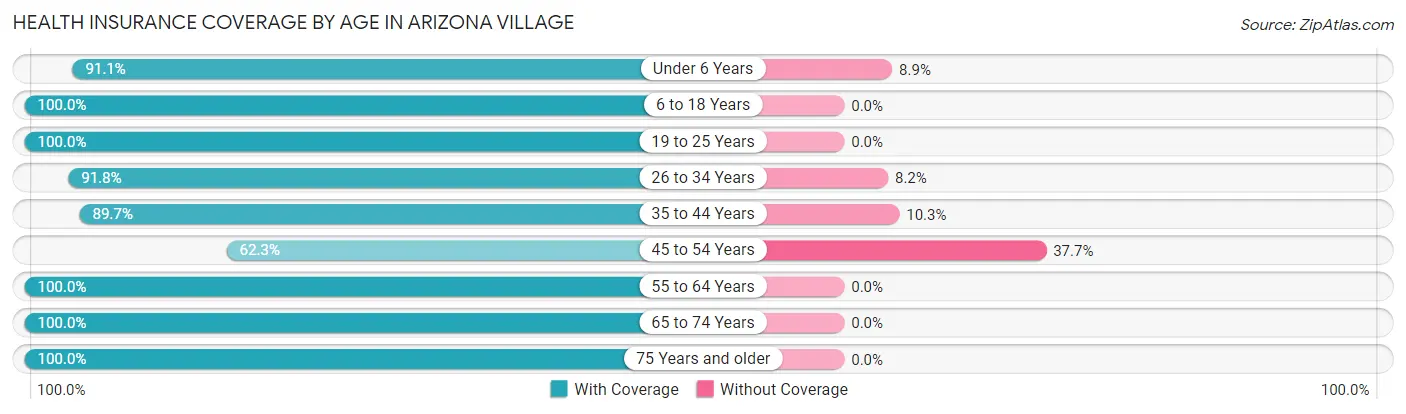
| Age Bracket | With Coverage | Without Coverage |
| Under 6 Years | 51 (91.1%) | 5 (8.9%) |
| 6 to 18 Years | 114 (100.0%) | 0 (0.0%) |
| 19 to 25 Years | 85 (100.0%) | 0 (0.0%) |
| 26 to 34 Years | 90 (91.8%) | 8 (8.2%) |
| 35 to 44 Years | 35 (89.7%) | 4 (10.3%) |
| 45 to 54 Years | 48 (62.3%) | 29 (37.7%) |
| 55 to 64 Years | 101 (100.0%) | 0 (0.0%) |
| 65 to 74 Years | 59 (100.0%) | 0 (0.0%) |
| 75 Years and older | 1 (100.0%) | 0 (0.0%) |
| Total | 584 (92.7%) | 46 (7.3%) |
Health Insurance Coverage by Citizenship Status in Arizona Village
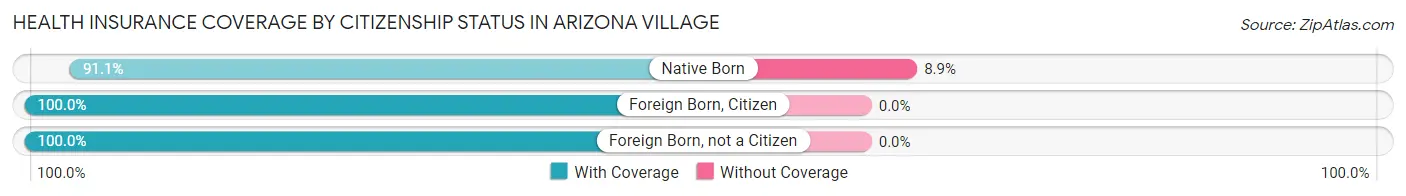
| Citizenship Status | With Coverage | Without Coverage |
| Native Born | 51 (91.1%) | 5 (8.9%) |
| Foreign Born, Citizen | 114 (100.0%) | 0 (0.0%) |
| Foreign Born, not a Citizen | 85 (100.0%) | 0 (0.0%) |
Health Insurance Coverage by Household Income in Arizona Village
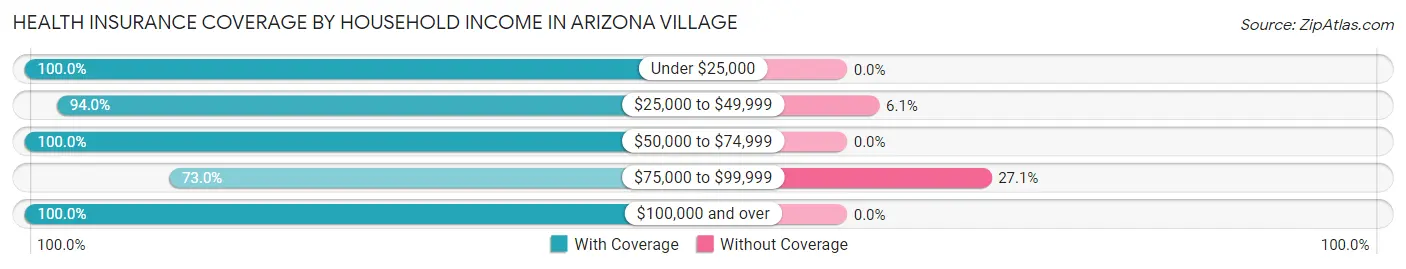
| Household Income | With Coverage | Without Coverage |
| Under $25,000 | 130 (100.0%) | 0 (0.0%) |
| $25,000 to $49,999 | 202 (94.0%) | 13 (6.0%) |
| $50,000 to $74,999 | 111 (100.0%) | 0 (0.0%) |
| $75,000 to $99,999 | 89 (73.0%) | 33 (27.1%) |
| $100,000 and over | 52 (100.0%) | 0 (0.0%) |
Public vs Private Health Insurance Coverage by Age in Arizona Village
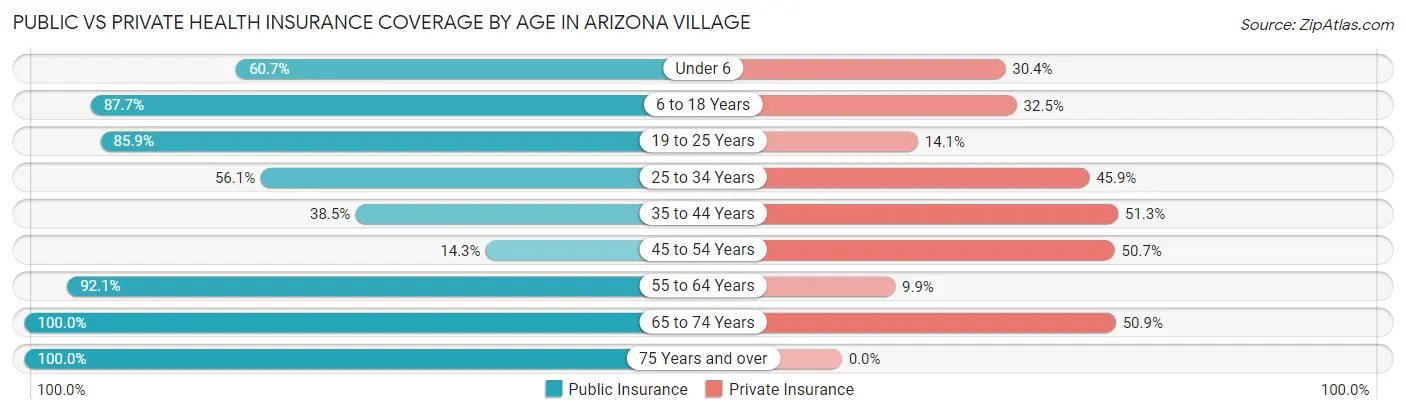
| Age Bracket | Public Insurance | Private Insurance |
| Under 6 | 34 (60.7%) | 17 (30.4%) |
| 6 to 18 Years | 100 (87.7%) | 37 (32.5%) |
| 19 to 25 Years | 73 (85.9%) | 12 (14.1%) |
| 25 to 34 Years | 55 (56.1%) | 45 (45.9%) |
| 35 to 44 Years | 15 (38.5%) | 20 (51.3%) |
| 45 to 54 Years | 11 (14.3%) | 39 (50.6%) |
| 55 to 64 Years | 93 (92.1%) | 10 (9.9%) |
| 65 to 74 Years | 59 (100.0%) | 30 (50.8%) |
| 75 Years and over | 1 (100.0%) | 0 (0.0%) |
| Total | 441 (70.0%) | 210 (33.3%) |
Disability Status by Sex by Age in Arizona Village
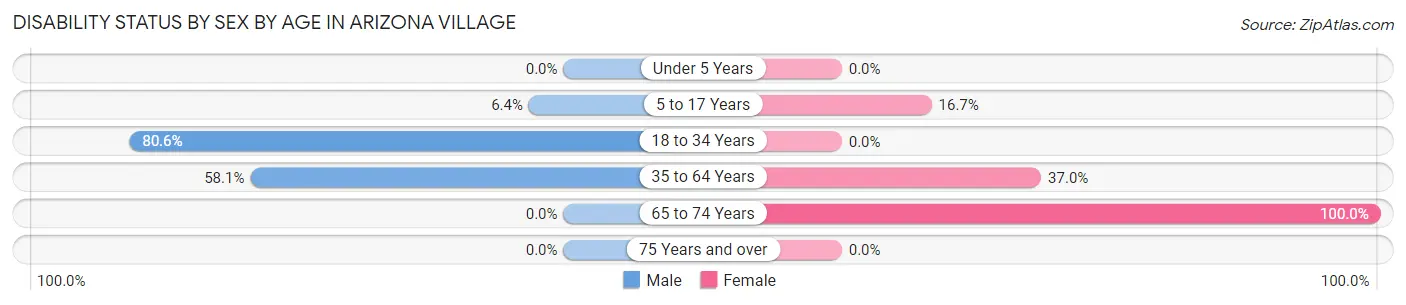
| Age Bracket | Male | Female |
| Under 5 Years | 0 (0.0%) | 0 (0.0%) |
| 5 to 17 Years | 5 (6.4%) | 7 (16.7%) |
| 18 to 34 Years | 87 (80.6%) | 0 (0.0%) |
| 35 to 64 Years | 68 (58.1%) | 37 (37.0%) |
| 65 to 74 Years | 0 (0.0%) | 29 (100.0%) |
| 75 Years and over | 0 (0.0%) | 0 (0.0%) |
Disability Class by Sex by Age in Arizona Village
Disability Class: Hearing Difficulty
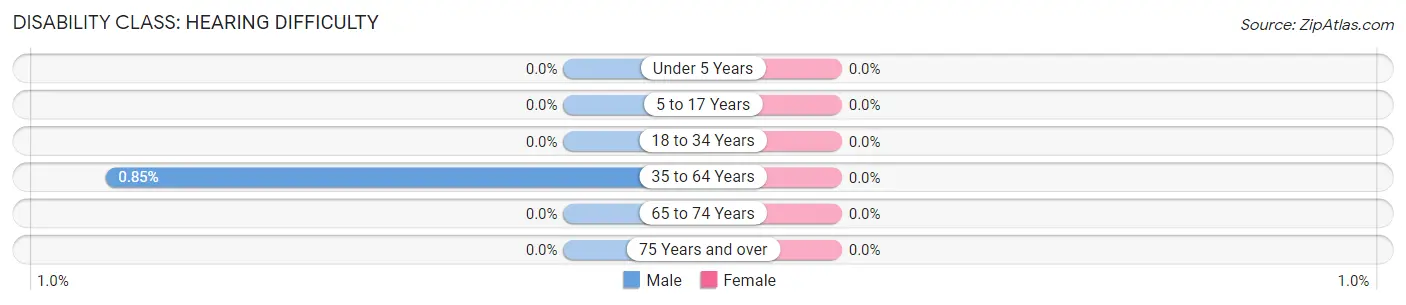
| Age Bracket | Male | Female |
| Under 5 Years | 0 (0.0%) | 0 (0.0%) |
| 5 to 17 Years | 0 (0.0%) | 0 (0.0%) |
| 18 to 34 Years | 0 (0.0%) | 0 (0.0%) |
| 35 to 64 Years | 1 (0.9%) | 0 (0.0%) |
| 65 to 74 Years | 0 (0.0%) | 0 (0.0%) |
| 75 Years and over | 0 (0.0%) | 0 (0.0%) |
Disability Class: Vision Difficulty
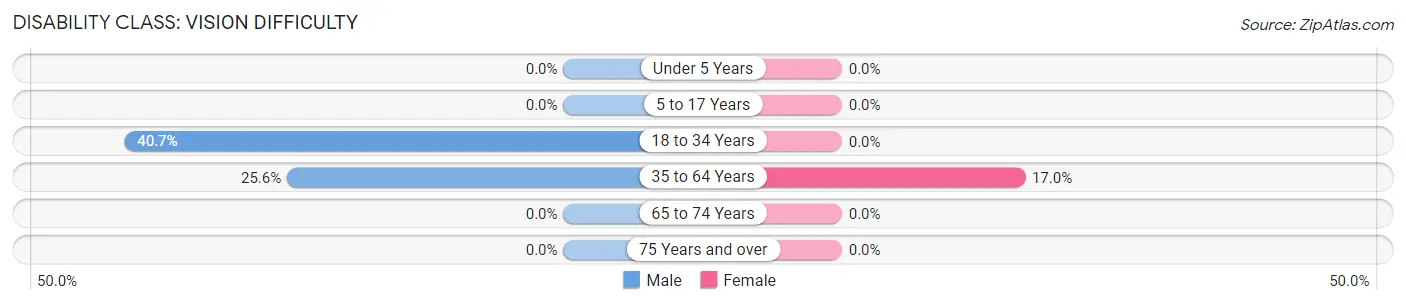
| Age Bracket | Male | Female |
| Under 5 Years | 0 (0.0%) | 0 (0.0%) |
| 5 to 17 Years | 0 (0.0%) | 0 (0.0%) |
| 18 to 34 Years | 44 (40.7%) | 0 (0.0%) |
| 35 to 64 Years | 30 (25.6%) | 17 (17.0%) |
| 65 to 74 Years | 0 (0.0%) | 0 (0.0%) |
| 75 Years and over | 0 (0.0%) | 0 (0.0%) |
Disability Class: Cognitive Difficulty
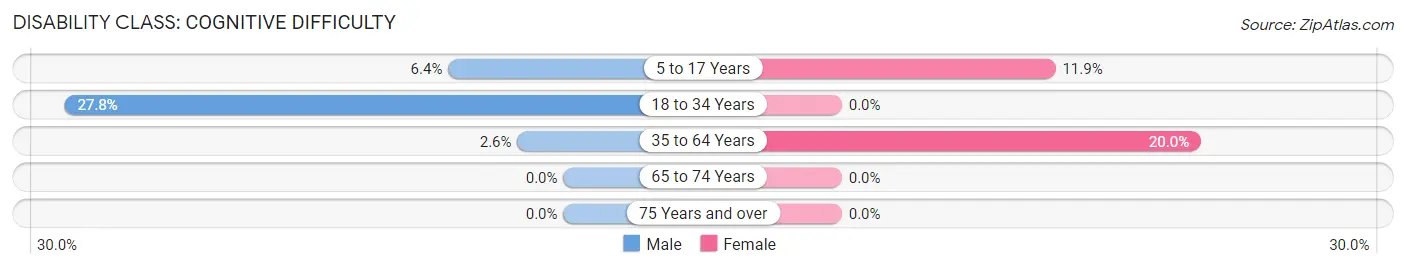
| Age Bracket | Male | Female |
| 5 to 17 Years | 5 (6.4%) | 5 (11.9%) |
| 18 to 34 Years | 30 (27.8%) | 0 (0.0%) |
| 35 to 64 Years | 3 (2.6%) | 20 (20.0%) |
| 65 to 74 Years | 0 (0.0%) | 0 (0.0%) |
| 75 Years and over | 0 (0.0%) | 0 (0.0%) |
Disability Class: Ambulatory Difficulty
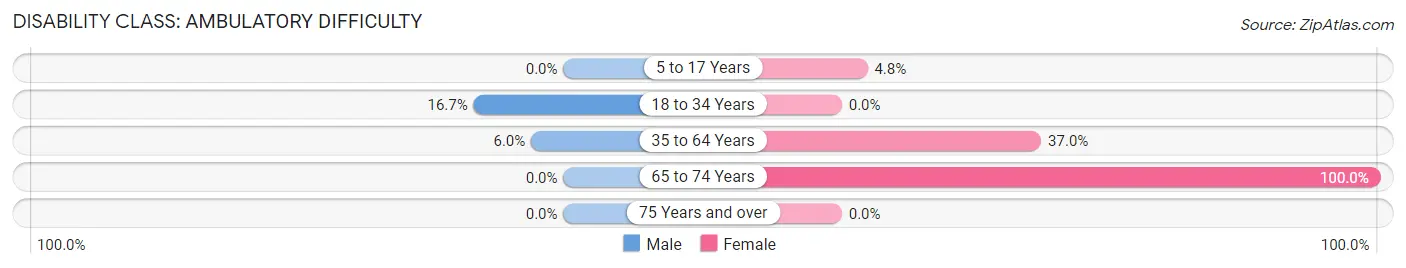
| Age Bracket | Male | Female |
| 5 to 17 Years | 0 (0.0%) | 2 (4.8%) |
| 18 to 34 Years | 18 (16.7%) | 0 (0.0%) |
| 35 to 64 Years | 7 (6.0%) | 37 (37.0%) |
| 65 to 74 Years | 0 (0.0%) | 29 (100.0%) |
| 75 Years and over | 0 (0.0%) | 0 (0.0%) |
Disability Class: Self-Care Difficulty
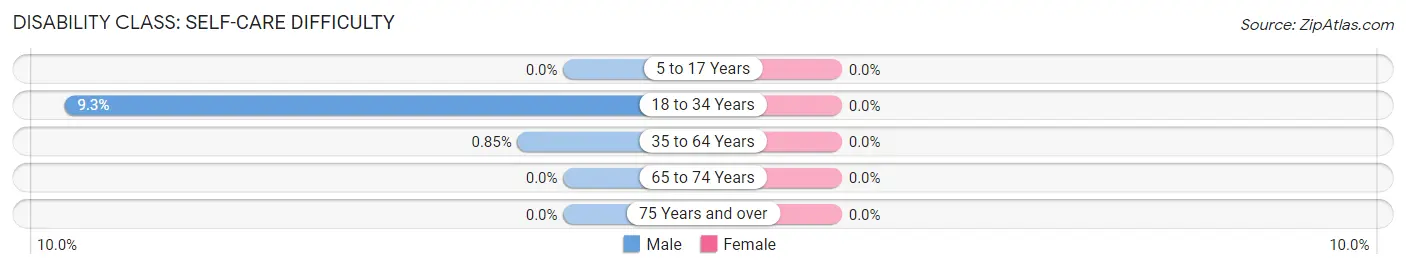
| Age Bracket | Male | Female |
| 5 to 17 Years | 0 (0.0%) | 0 (0.0%) |
| 18 to 34 Years | 10 (9.3%) | 0 (0.0%) |
| 35 to 64 Years | 1 (0.9%) | 0 (0.0%) |
| 65 to 74 Years | 0 (0.0%) | 0 (0.0%) |
| 75 Years and over | 0 (0.0%) | 0 (0.0%) |
Technology Access in Arizona Village
Computing Device Access in Arizona Village
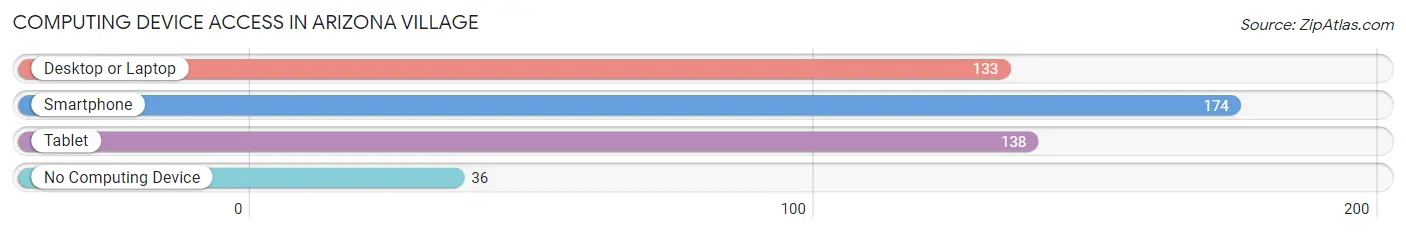
| Device Type | # Households | % Households |
| Desktop or Laptop | 133 | 62.4% |
| Smartphone | 174 | 81.7% |
| Tablet | 138 | 64.8% |
| No Computing Device | 36 | 16.9% |
| Total | 213 | 100.0% |
Internet Access in Arizona Village
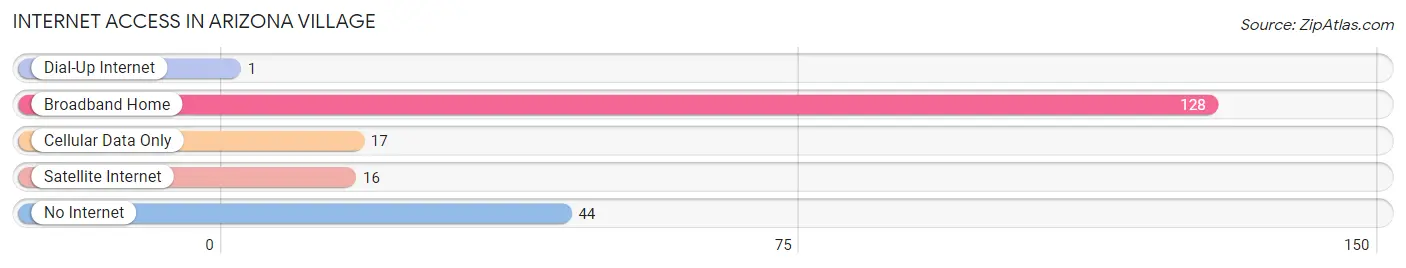
| Internet Type | # Households | % Households |
| Dial-Up Internet | 1 | 0.5% |
| Broadband Home | 128 | 60.1% |
| Cellular Data Only | 17 | 8.0% |
| Satellite Internet | 16 | 7.5% |
| No Internet | 44 | 20.7% |
| Total | 213 | 100.0% |
Arizona Village Summary
Introduction
Arizona Village is a small unincorporated community located in Maricopa County, Arizona. It is situated in the Sonoran Desert, approximately 25 miles south of Phoenix. The community is home to a diverse population of approximately 1,000 people, and is known for its unique culture and history. This paper will provide an overview of the history, geography, economy, and demographics of Arizona Village.
History
Arizona Village was founded in the late 19th century by a group of settlers from the nearby town of Phoenix. The settlers were attracted to the area due to its proximity to the Salt River, which provided a reliable source of water for the community. The settlers established a small farming community, and the area quickly grew in population.
In the early 20th century, Arizona Village became a popular destination for tourists, who were drawn to the area’s unique culture and scenery. The community was also home to a number of businesses, including a general store, a post office, and a hotel.
In the 1950s, Arizona Village began to experience a decline in population as many of its residents moved to larger cities in search of better job opportunities. The community was further impacted by the construction of the Central Arizona Project, which diverted water away from the Salt River and caused the local economy to suffer.
Geography
Arizona Village is located in the Sonoran Desert, approximately 25 miles south of Phoenix. The area is characterized by its arid climate, with temperatures ranging from hot in the summer to mild in the winter. The community is situated at an elevation of 1,500 feet, and is surrounded by the White Tank Mountains to the west and the Superstition Mountains to the east.
The area is home to a variety of wildlife, including coyotes, bobcats, javelinas, and rattlesnakes. The nearby Salt River provides a reliable source of water for the community, and is home to a variety of fish and other aquatic life.
Economy
Arizona Village is home to a diverse economy, with a variety of businesses and industries. The community is home to a number of small businesses, including restaurants, retail stores, and service providers. The area is also home to a number of agricultural operations, including farms and ranches.
The local economy is also supported by tourism, as the area is a popular destination for visitors from around the world. The nearby White Tank Mountains are a popular destination for hikers and campers, and the area is also home to a number of historic sites and attractions.
Demographics
As of the 2010 census, Arizona Village had a population of 1,000 people. The population is diverse, with a variety of ethnic and racial backgrounds. The majority of the population is of Hispanic or Latino origin, followed by White, Native American, and African American.
The median household income in Arizona Village is $35,000, and the median age is 35 years. The unemployment rate is 8.5%, and the poverty rate is 16.5%.
Conclusion
Arizona Village is a small unincorporated community located in Maricopa County, Arizona. The area is known for its unique culture and history, and is home to a diverse population of approximately 1,000 people. The community is situated in the Sonoran Desert, and is home to a variety of businesses and industries. The local economy is supported by tourism, agriculture, and small businesses. The population is diverse, with a variety of ethnic and racial backgrounds.
Common Questions
What is Per Capita Income in Arizona Village?
Per Capita income in Arizona Village is $16,007.
What is the Median Family Income in Arizona Village?
Median Family Income in Arizona Village is $47,019.
What is the Median Household income in Arizona Village?
Median Household Income in Arizona Village is $43,750.
What is Inequality or Gini Index in Arizona Village?
Inequality or Gini Index in Arizona Village is 0.35.
What is the Total Population of Arizona Village?
Total Population of Arizona Village is 630.
What is the Total Male Population of Arizona Village?
Total Male Population of Arizona Village is 351.
What is the Total Female Population of Arizona Village?
Total Female Population of Arizona Village is 279.
What is the Ratio of Males per 100 Females in Arizona Village?
There are 125.81 Males per 100 Females in Arizona Village.
What is the Ratio of Females per 100 Males in Arizona Village?
There are 79.49 Females per 100 Males in Arizona Village.
What is the Median Population Age in Arizona Village?
Median Population Age in Arizona Village is 32.6 Years.
What is the Average Family Size in Arizona Village
Average Family Size in Arizona Village is 3.2 People.
What is the Average Household Size in Arizona Village
Average Household Size in Arizona Village is 3.0 People.
How Large is the Labor Force in Arizona Village?
There are 230 People in the Labor Forcein in Arizona Village.
What is the Percentage of People in the Labor Force in Arizona Village?
48.3% of People are in the Labor Force in Arizona Village.
What is the Unemployment Rate in Arizona Village?
Unemployment Rate in Arizona Village is 6.5%.