Mesquite Creek, AZ Map & Demographics
Mesquite Creek Map
Mesquite Creek Overview
$31,644
PER CAPITA INCOME
$52,614
AVG FAMILY INCOME
$52,125
AVG HOUSEHOLD INCOME
0.36
INEQUALITY / GINI INDEX
494
TOTAL POPULATION
246
MALE POPULATION
248
FEMALE POPULATION
99.19
MALES / 100 FEMALES
100.81
FEMALES / 100 MALES
67.2
MEDIAN AGE
2.4
AVG FAMILY SIZE
1.9
AVG HOUSEHOLD SIZE
134
LABOR FORCE [ PEOPLE ]
29.5%
PERCENT IN LABOR FORCE
3.7%
UNEMPLOYMENT RATE
Income in Mesquite Creek
Income Overview in Mesquite Creek
Per Capita Income in Mesquite Creek is $31,644, while median incomes of families and households are $52,614 and $52,125 respectively.
| Characteristic | Number | Measure |
| Per Capita Income | 494 | $31,644 |
| Median Family Income | 157 | $52,614 |
| Mean Family Income | 157 | $64,574 |
| Median Household Income | 255 | $52,125 |
| Mean Household Income | 255 | $58,202 |
| Income Deficit | 157 | $0 |
| Wage / Income Gap (%) | 494 | 0.00% |
| Wage / Income Gap ($) | 494 | 100.00¢ per $1 |
| Gini / Inequality Index | 494 | 0.36 |
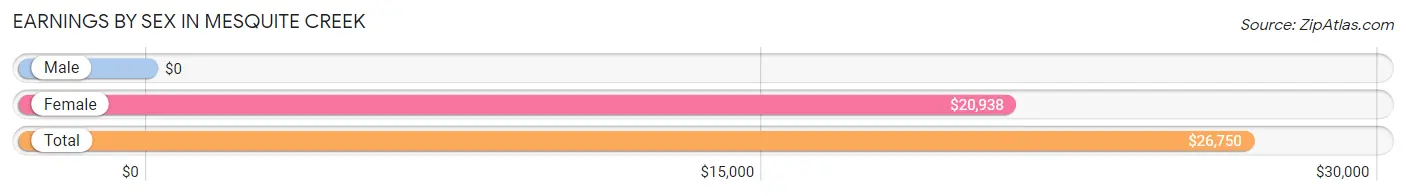
Earnings by Sex in Mesquite Creek
| Sex | Number | Average Earnings |
| Male | 76 (57.1%) | $0 |
| Female | 57 (42.9%) | $20,938 |
| Total | 133 (100.0%) | $26,750 |
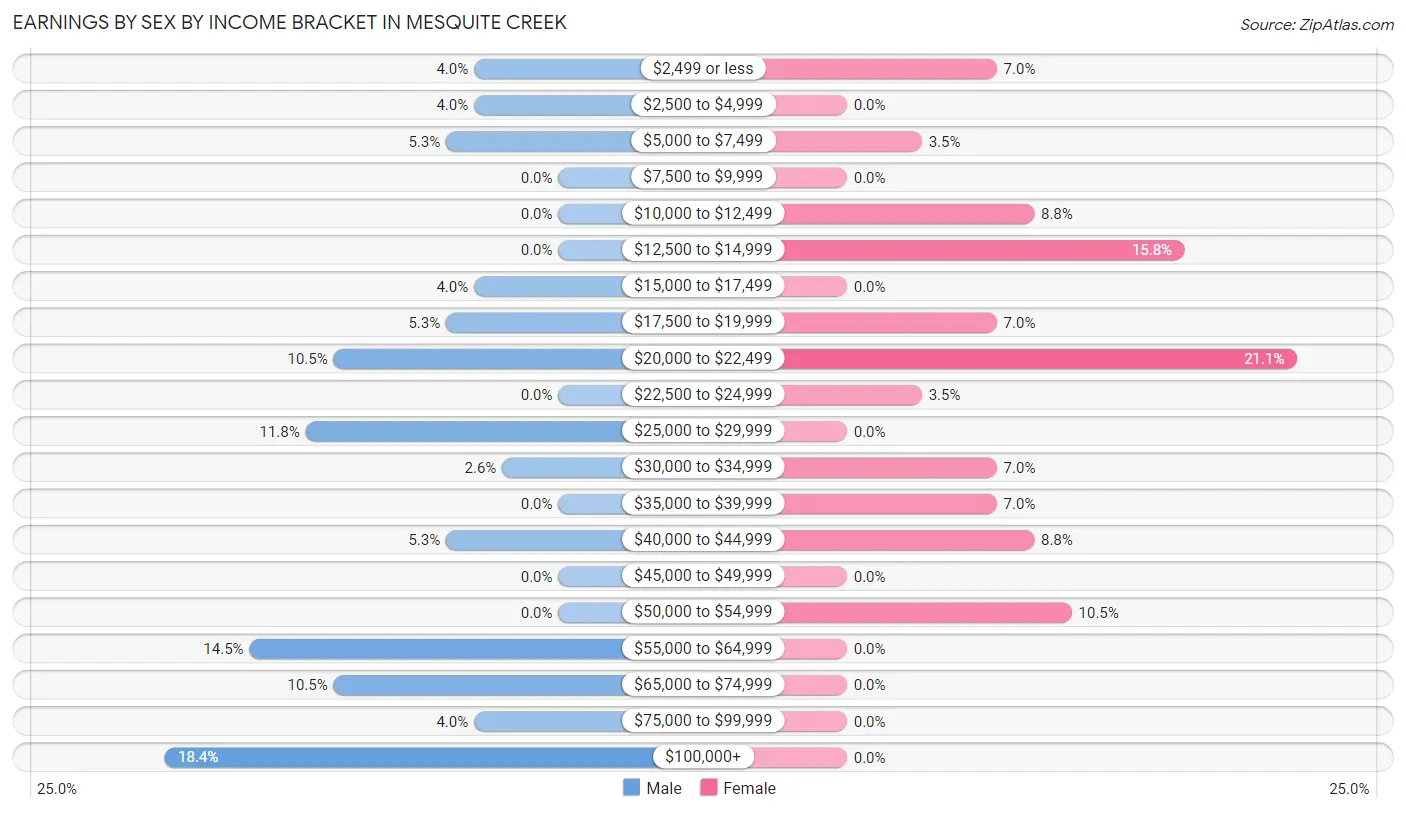
Earnings by Sex by Income Bracket in Mesquite Creek
The most common earnings brackets in Mesquite Creek are $100,000+ for men (14 | 18.4%) and $20,000 to $22,499 for women (12 | 21.0%).
| Income | Male | Female |
| $2,499 or less | 3 (4.0%) | 4 (7.0%) |
| $2,500 to $4,999 | 3 (4.0%) | 0 (0.0%) |
| $5,000 to $7,499 | 4 (5.3%) | 2 (3.5%) |
| $7,500 to $9,999 | 0 (0.0%) | 0 (0.0%) |
| $10,000 to $12,499 | 0 (0.0%) | 5 (8.8%) |
| $12,500 to $14,999 | 0 (0.0%) | 9 (15.8%) |
| $15,000 to $17,499 | 3 (4.0%) | 0 (0.0%) |
| $17,500 to $19,999 | 4 (5.3%) | 4 (7.0%) |
| $20,000 to $22,499 | 8 (10.5%) | 12 (21.0%) |
| $22,500 to $24,999 | 0 (0.0%) | 2 (3.5%) |
| $25,000 to $29,999 | 9 (11.8%) | 0 (0.0%) |
| $30,000 to $34,999 | 2 (2.6%) | 4 (7.0%) |
| $35,000 to $39,999 | 0 (0.0%) | 4 (7.0%) |
| $40,000 to $44,999 | 4 (5.3%) | 5 (8.8%) |
| $45,000 to $49,999 | 0 (0.0%) | 0 (0.0%) |
| $50,000 to $54,999 | 0 (0.0%) | 6 (10.5%) |
| $55,000 to $64,999 | 11 (14.5%) | 0 (0.0%) |
| $65,000 to $74,999 | 8 (10.5%) | 0 (0.0%) |
| $75,000 to $99,999 | 3 (4.0%) | 0 (0.0%) |
| $100,000+ | 14 (18.4%) | 0 (0.0%) |
| Total | 76 (100.0%) | 57 (100.0%) |
Earnings by Sex by Educational Attainment in Mesquite Creek
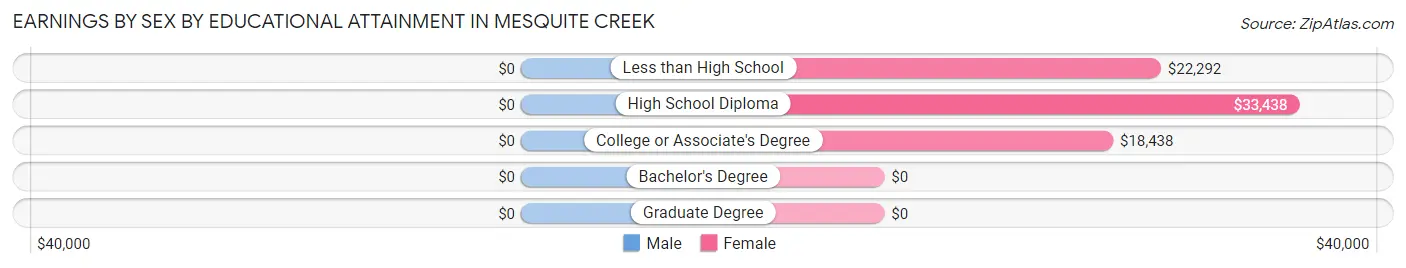
| Educational Attainment | Male Income | Female Income |
| Less than High School | - | - |
| High School Diploma | - | - |
| College or Associate's Degree | - | - |
| Bachelor's Degree | - | - |
| Graduate Degree | - | - |
| Total | - | - |
Family Income in Mesquite Creek
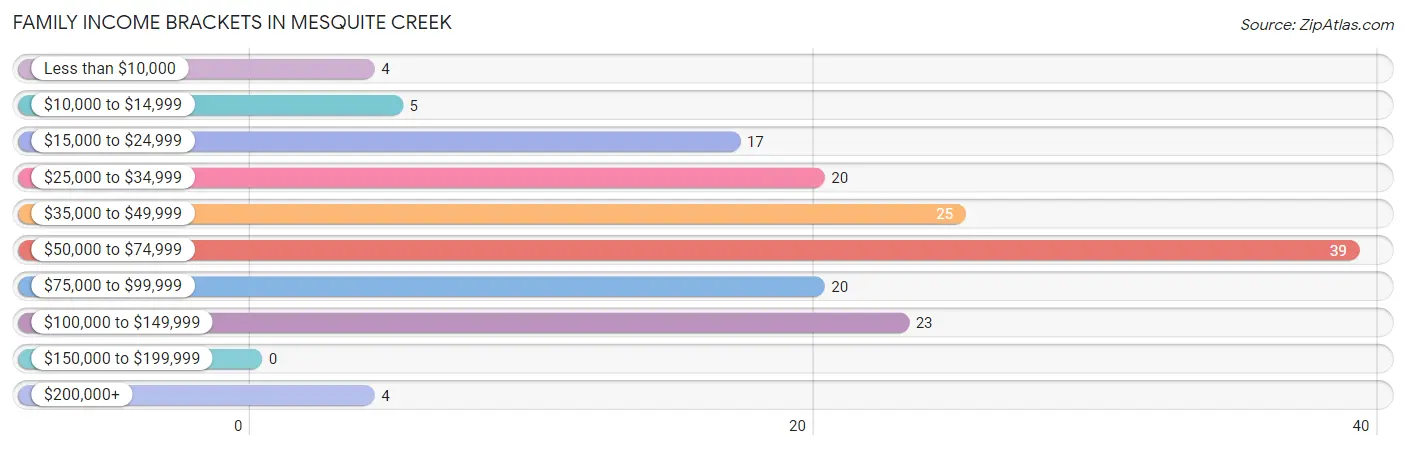
Family Income Brackets in Mesquite Creek
According to the Mesquite Creek family income data, there are 39 families falling into the $50,000 to $74,999 income range, which is the most common income bracket and makes up 24.8% of all families.
| Income Bracket | # Families | % Families |
| Less than $10,000 | 4 | 2.5% |
| $10,000 to $14,999 | 5 | 3.2% |
| $15,000 to $24,999 | 17 | 10.8% |
| $25,000 to $34,999 | 20 | 12.7% |
| $35,000 to $49,999 | 25 | 15.9% |
| $50,000 to $74,999 | 39 | 24.8% |
| $75,000 to $99,999 | 20 | 12.7% |
| $100,000 to $149,999 | 23 | 14.6% |
| $150,000 to $199,999 | 0 | 0.0% |
| $200,000+ | 4 | 2.5% |
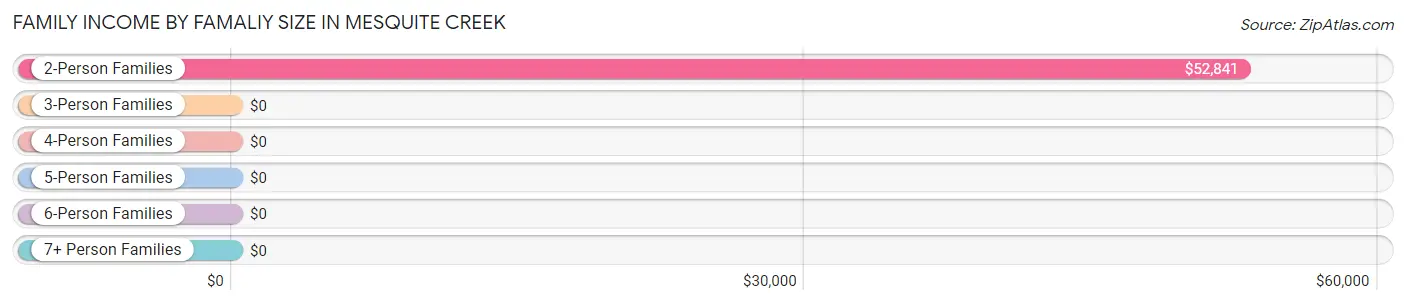
Family Income by Famaliy Size in Mesquite Creek
2-person families (129 | 82.2%) account for the highest median family income in Mesquite Creek with $52,841 per family, while 2-person families (129 | 82.2%) have the highest median income of $26,420 per family member.
| Income Bracket | # Families | Median Income |
| 2-Person Families | 129 (82.2%) | $52,841 |
| 3-Person Families | 13 (8.3%) | $0 |
| 4-Person Families | 15 (9.6%) | $0 |
| 5-Person Families | 0 (0.0%) | $0 |
| 6-Person Families | 0 (0.0%) | $0 |
| 7+ Person Families | 0 (0.0%) | $0 |
| Total | 157 (100.0%) | $52,614 |
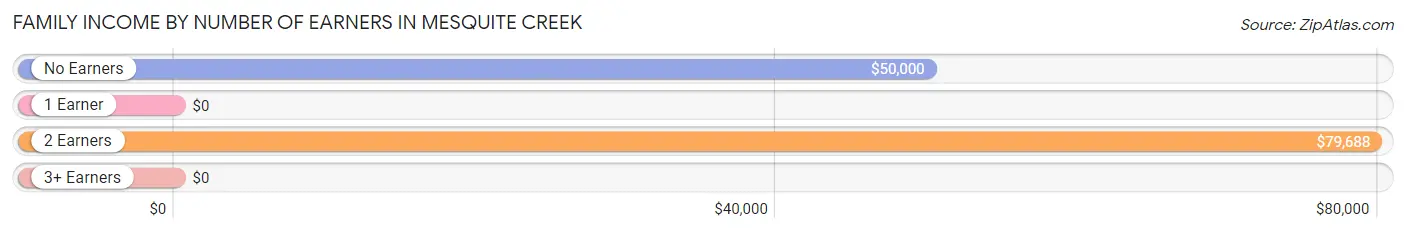
Family Income by Number of Earners in Mesquite Creek
| Number of Earners | # Families | Median Income |
| No Earners | 82 (52.2%) | $50,000 |
| 1 Earner | 50 (31.9%) | $0 |
| 2 Earners | 25 (15.9%) | $79,688 |
| 3+ Earners | 0 (0.0%) | $0 |
| Total | 157 (100.0%) | $52,614 |
Household Income in Mesquite Creek
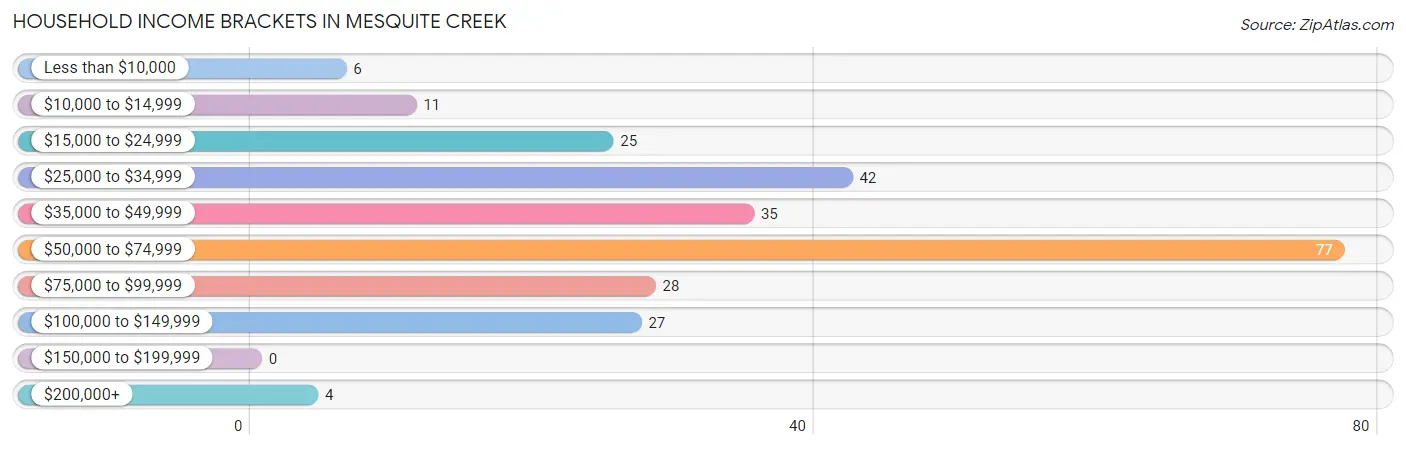
Household Income Brackets in Mesquite Creek
With 77 households falling in the category, the $50,000 to $74,999 income range is the most frequent in Mesquite Creek, accounting for 30.2% of all households.
| Income Bracket | # Households | % Households |
| Less than $10,000 | 6 | 2.4% |
| $10,000 to $14,999 | 11 | 4.3% |
| $15,000 to $24,999 | 25 | 9.8% |
| $25,000 to $34,999 | 42 | 16.5% |
| $35,000 to $49,999 | 35 | 13.7% |
| $50,000 to $74,999 | 77 | 30.2% |
| $75,000 to $99,999 | 28 | 11.0% |
| $100,000 to $149,999 | 27 | 10.6% |
| $150,000 to $199,999 | 0 | 0.0% |
| $200,000+ | 4 | 1.6% |
Household Income by Householder Age in Mesquite Creek
The median household income in Mesquite Creek is $52,125, with the highest median household income of $62,813 found in the 45 to 64 years age bracket for the primary householder. A total of 69 households (27.1%) fall into this category.
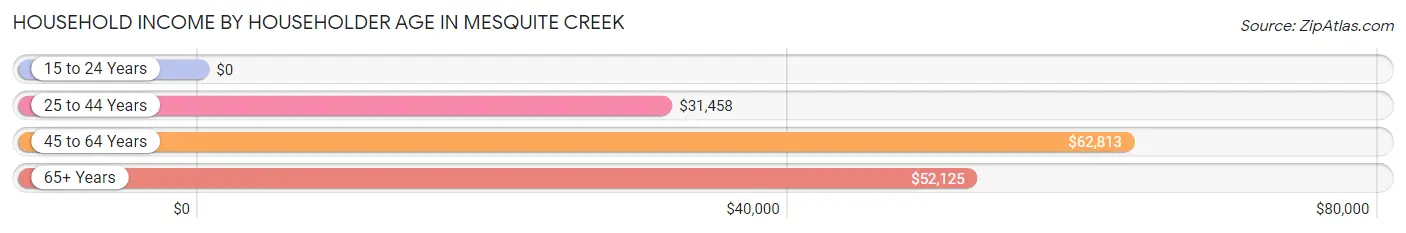
| Income Bracket | # Households | Median Income |
| 15 to 24 Years | 0 (0.0%) | $0 |
| 25 to 44 Years | 21 (8.2%) | $31,458 |
| 45 to 64 Years | 69 (27.1%) | $62,813 |
| 65+ Years | 165 (64.7%) | $52,125 |
| Total | 255 (100.0%) | $52,125 |
Poverty in Mesquite Creek
Income Below Poverty by Sex and Age in Mesquite Creek
With 7.3% poverty level for males and 17.3% for females among the residents of Mesquite Creek, 6 to 11 year old males and 6 to 11 year old females are the most vulnerable to poverty, with 2 males (100.0%) and 10 females (50.0%) in their respective age groups living below the poverty level.
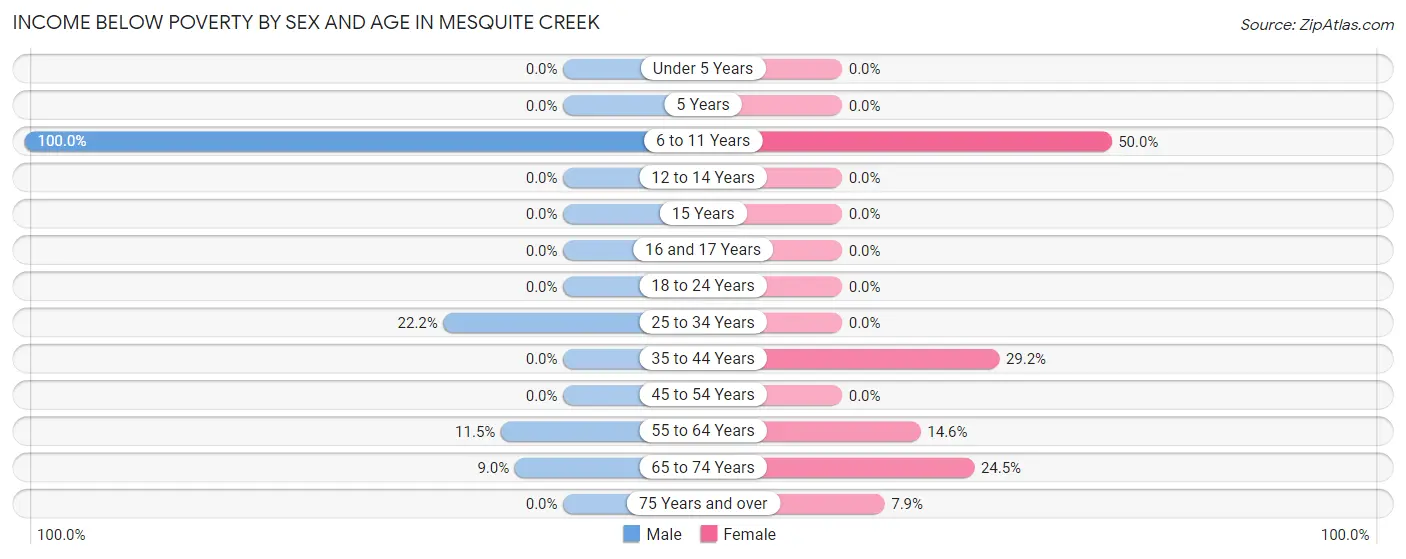
| Age Bracket | Male | Female |
| Under 5 Years | 0 (0.0%) | 0 (0.0%) |
| 5 Years | 0 (0.0%) | 0 (0.0%) |
| 6 to 11 Years | 2 (100.0%) | 10 (50.0%) |
| 12 to 14 Years | 0 (0.0%) | 0 (0.0%) |
| 15 Years | 0 (0.0%) | 0 (0.0%) |
| 16 and 17 Years | 0 (0.0%) | 0 (0.0%) |
| 18 to 24 Years | 0 (0.0%) | 0 (0.0%) |
| 25 to 34 Years | 4 (22.2%) | 0 (0.0%) |
| 35 to 44 Years | 0 (0.0%) | 7 (29.2%) |
| 45 to 54 Years | 0 (0.0%) | 0 (0.0%) |
| 55 to 64 Years | 6 (11.5%) | 7 (14.6%) |
| 65 to 74 Years | 6 (9.0%) | 13 (24.5%) |
| 75 Years and over | 0 (0.0%) | 6 (7.9%) |
| Total | 18 (7.3%) | 43 (17.3%) |
Income Above Poverty by Sex and Age in Mesquite Creek
According to the poverty statistics in Mesquite Creek, males aged 12 to 14 years and females aged under 5 years are the age groups that are most secure financially, with 100.0% of males and 100.0% of females in these age groups living above the poverty line.
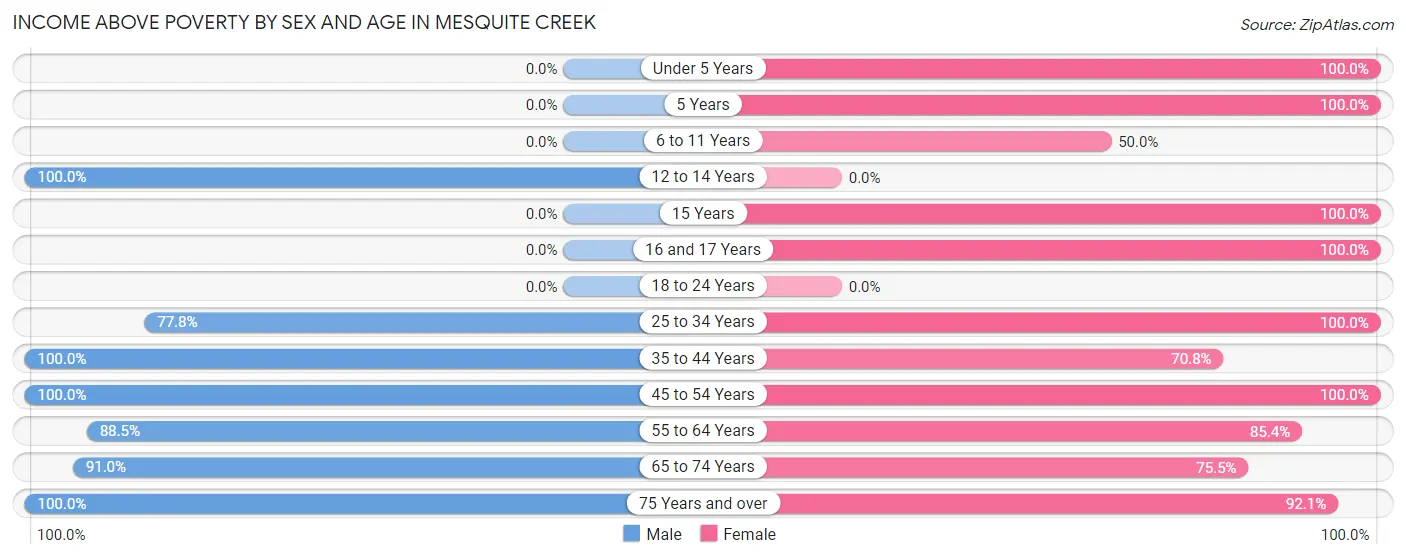
| Age Bracket | Male | Female |
| Under 5 Years | 0 (0.0%) | 4 (100.0%) |
| 5 Years | 0 (0.0%) | 4 (100.0%) |
| 6 to 11 Years | 0 (0.0%) | 10 (50.0%) |
| 12 to 14 Years | 5 (100.0%) | 0 (0.0%) |
| 15 Years | 0 (0.0%) | 4 (100.0%) |
| 16 and 17 Years | 0 (0.0%) | 4 (100.0%) |
| 18 to 24 Years | 0 (0.0%) | 0 (0.0%) |
| 25 to 34 Years | 14 (77.8%) | 4 (100.0%) |
| 35 to 44 Years | 4 (100.0%) | 17 (70.8%) |
| 45 to 54 Years | 11 (100.0%) | 7 (100.0%) |
| 55 to 64 Years | 46 (88.5%) | 41 (85.4%) |
| 65 to 74 Years | 61 (91.0%) | 40 (75.5%) |
| 75 Years and over | 87 (100.0%) | 70 (92.1%) |
| Total | 228 (92.7%) | 205 (82.7%) |
Income Below Poverty Among Married-Couple Families in Mesquite Creek
The poverty statistics for married-couple families in Mesquite Creek show that 6.8% or 9 of the total 133 families live below the poverty line. Families with 1 or 2 children have the highest poverty rate of 22.2%, comprising of 2 families. On the other hand, families with no children have the lowest poverty rate of 5.7%, which includes 7 families.
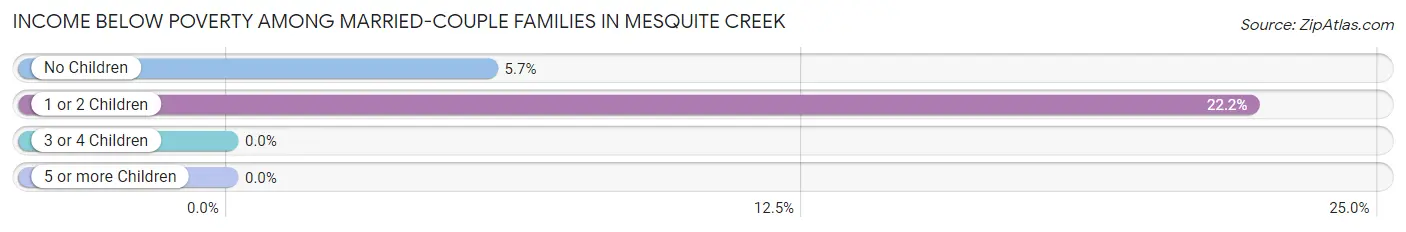
| Children | Above Poverty | Below Poverty |
| No Children | 117 (94.4%) | 7 (5.7%) |
| 1 or 2 Children | 7 (77.8%) | 2 (22.2%) |
| 3 or 4 Children | 0 (0.0%) | 0 (0.0%) |
| 5 or more Children | 0 (0.0%) | 0 (0.0%) |
| Total | 124 (93.2%) | 9 (6.8%) |
Income Below Poverty Among Single-Parent Households in Mesquite Creek
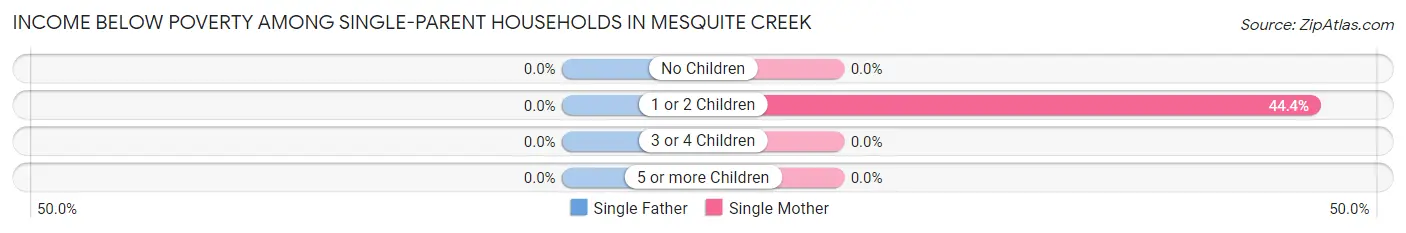
| Children | Single Father | Single Mother |
| No Children | 0 (0.0%) | 0 (0.0%) |
| 1 or 2 Children | 0 (0.0%) | 8 (44.4%) |
| 3 or 4 Children | 0 (0.0%) | 0 (0.0%) |
| 5 or more Children | 0 (0.0%) | 0 (0.0%) |
| Total | 0 (0.0%) | 8 (36.4%) |
Income Below Poverty Among Married-Couple vs Single-Parent Households in Mesquite Creek
The poverty data for Mesquite Creek shows that 9 of the married-couple family households (6.8%) and 8 of the single-parent households (33.3%) are living below the poverty level. Within the married-couple family households, those with 1 or 2 children have the highest poverty rate, with 2 households (22.2%) falling below the poverty line. Among the single-parent households, those with 1 or 2 children have the highest poverty rate, with 8 household (44.4%) living below poverty.
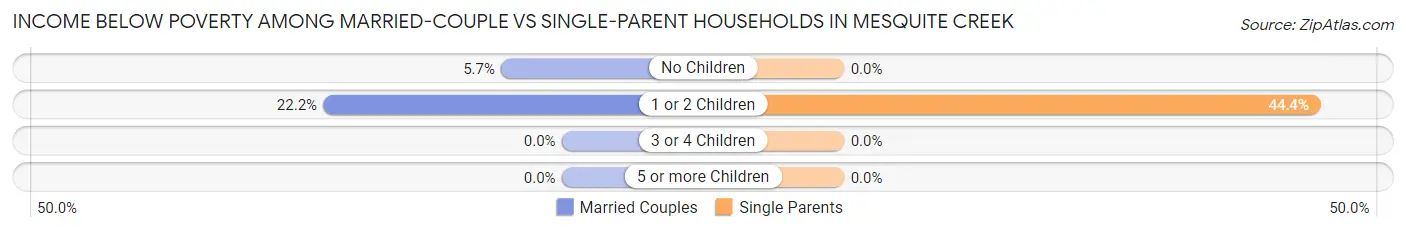
| Children | Married-Couple Families | Single-Parent Households |
| No Children | 7 (5.7%) | 0 (0.0%) |
| 1 or 2 Children | 2 (22.2%) | 8 (44.4%) |
| 3 or 4 Children | 0 (0.0%) | 0 (0.0%) |
| 5 or more Children | 0 (0.0%) | 0 (0.0%) |
| Total | 9 (6.8%) | 8 (33.3%) |
Race in Mesquite Creek
The most populous races in Mesquite Creek are White / Caucasian (426 | 86.2%), Hispanic or Latino (66 | 13.4%), and Two or more Races (42 | 8.5%).
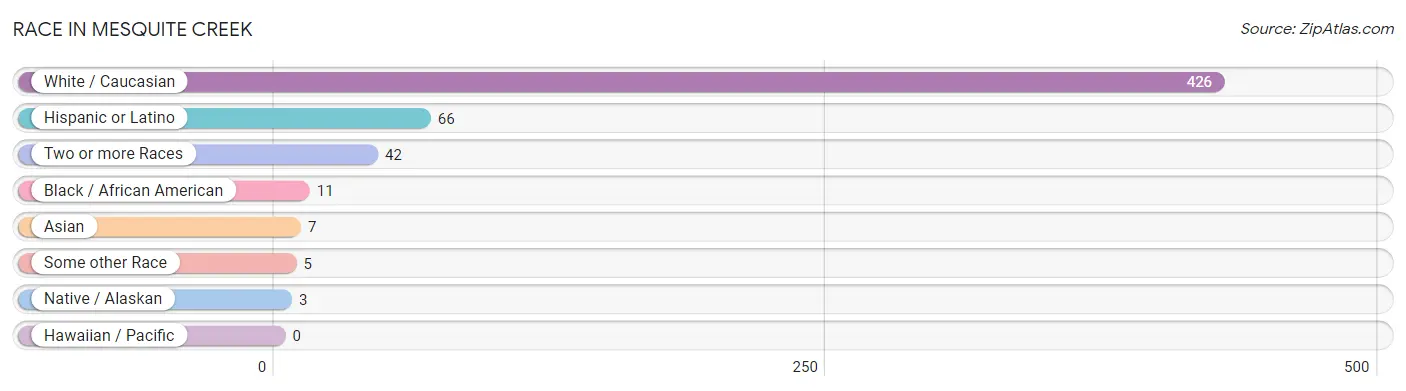
| Race | # Population | % Population |
| Asian | 7 | 1.4% |
| Black / African American | 11 | 2.2% |
| Hawaiian / Pacific | 0 | 0.0% |
| Hispanic or Latino | 66 | 13.4% |
| Native / Alaskan | 3 | 0.6% |
| White / Caucasian | 426 | 86.2% |
| Two or more Races | 42 | 8.5% |
| Some other Race | 5 | 1.0% |
| Total | 494 | 100.0% |
Ancestry in Mesquite Creek
The most populous ancestries reported in Mesquite Creek are English (97 | 19.6%), German (86 | 17.4%), Irish (68 | 13.8%), Mexican (64 | 13.0%), and Swedish (26 | 5.3%), together accounting for 69.0% of all Mesquite Creek residents.
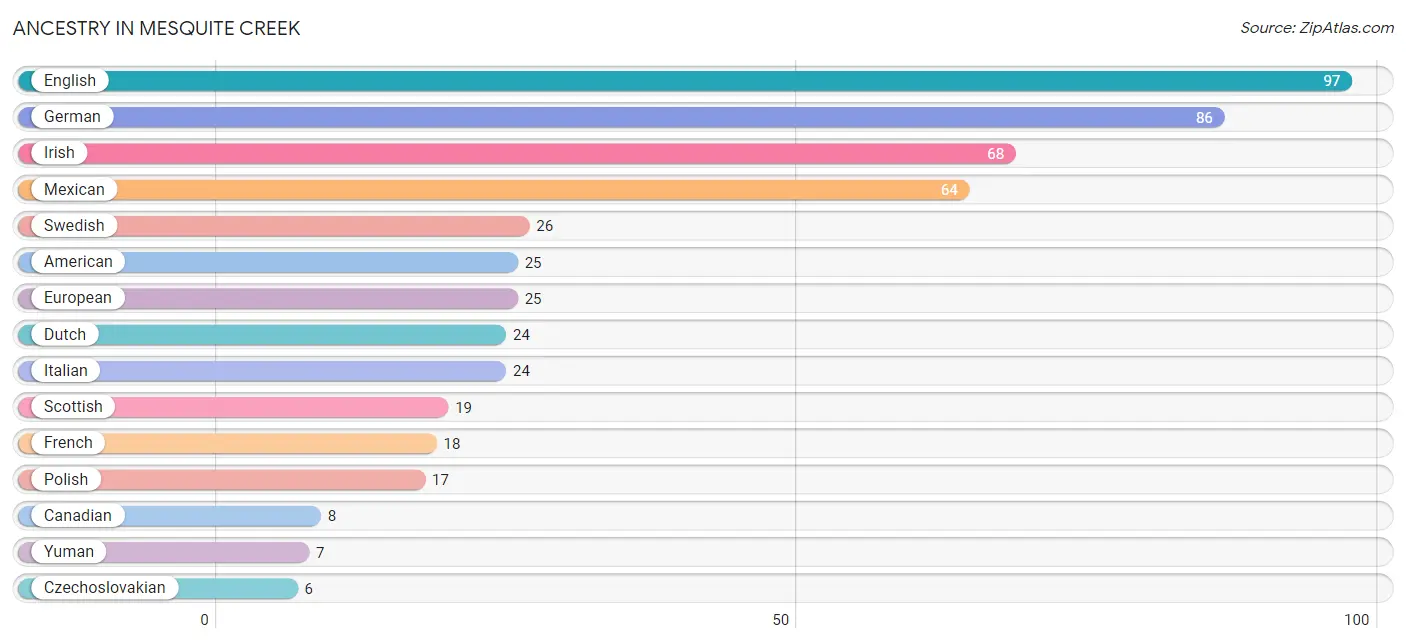
| Ancestry | # Population | % Population |
| American | 25 | 5.1% |
| Blackfeet | 2 | 0.4% |
| British | 2 | 0.4% |
| Burmese | 2 | 0.4% |
| Canadian | 8 | 1.6% |
| Croatian | 4 | 0.8% |
| Czechoslovakian | 6 | 1.2% |
| Danish | 2 | 0.4% |
| Dutch | 24 | 4.9% |
| English | 97 | 19.6% |
| European | 25 | 5.1% |
| Finnish | 1 | 0.2% |
| French | 18 | 3.6% |
| French Canadian | 5 | 1.0% |
| German | 86 | 17.4% |
| Irish | 68 | 13.8% |
| Italian | 24 | 4.9% |
| Luxembourger | 3 | 0.6% |
| Mexican | 64 | 13.0% |
| Norwegian | 3 | 0.6% |
| Osage | 2 | 0.4% |
| Pakistani | 5 | 1.0% |
| Pima | 4 | 0.8% |
| Polish | 17 | 3.4% |
| Romanian | 3 | 0.6% |
| Russian | 4 | 0.8% |
| Scandinavian | 5 | 1.0% |
| Scotch-Irish | 2 | 0.4% |
| Scottish | 19 | 3.8% |
| Spanish | 2 | 0.4% |
| Swedish | 26 | 5.3% |
| Yuman | 7 | 1.4% | View All 32 Rows |
Immigrants in Mesquite Creek
The most numerous immigrant groups reported in Mesquite Creek came from Europe (17 | 3.4%), Canada (13 | 2.6%), Eastern Europe (13 | 2.6%), Poland (13 | 2.6%), and Asia (12 | 2.4%), together accounting for 13.8% of all Mesquite Creek residents.
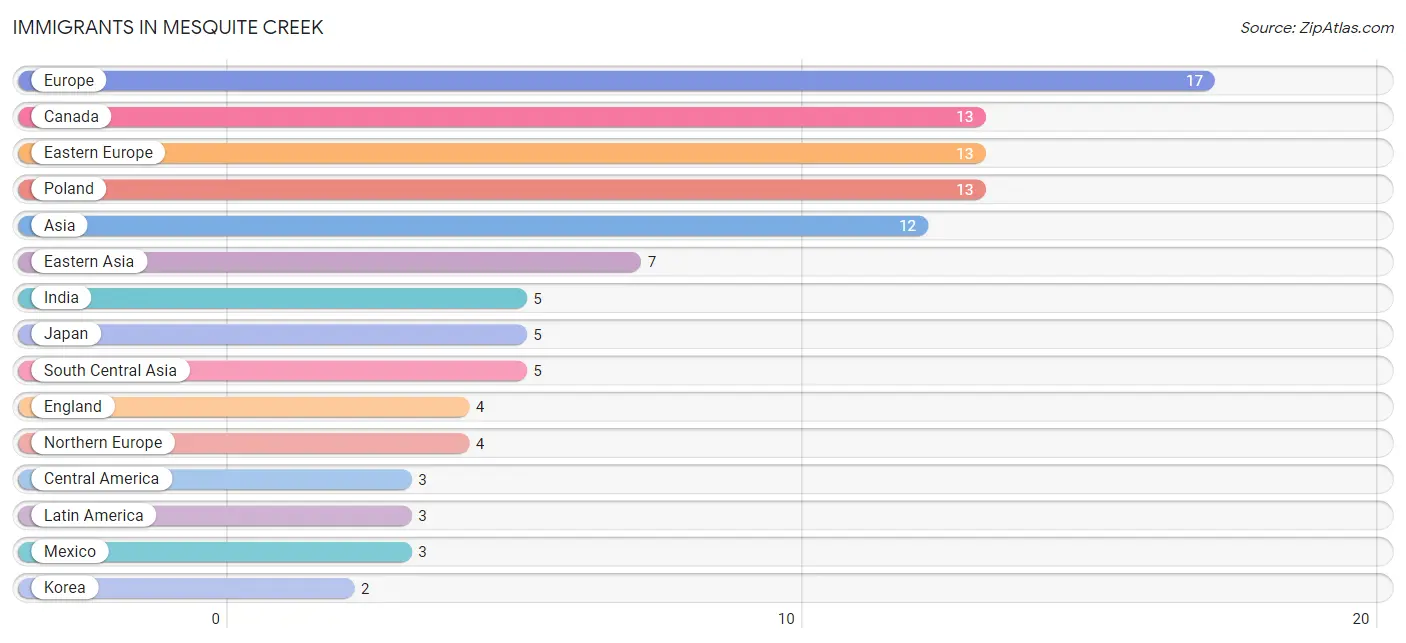
| Immigration Origin | # Population | % Population |
| Asia | 12 | 2.4% |
| Canada | 13 | 2.6% |
| Central America | 3 | 0.6% |
| Eastern Asia | 7 | 1.4% |
| Eastern Europe | 13 | 2.6% |
| England | 4 | 0.8% |
| Europe | 17 | 3.4% |
| India | 5 | 1.0% |
| Japan | 5 | 1.0% |
| Korea | 2 | 0.4% |
| Latin America | 3 | 0.6% |
| Mexico | 3 | 0.6% |
| Northern Europe | 4 | 0.8% |
| Poland | 13 | 2.6% |
| South Central Asia | 5 | 1.0% | View All 15 Rows |
Sex and Age in Mesquite Creek
Sex and Age in Mesquite Creek
The most populous age groups in Mesquite Creek are 65 to 69 Years (54 | 22.0%) for men and 75 to 79 Years (38 | 15.3%) for women.
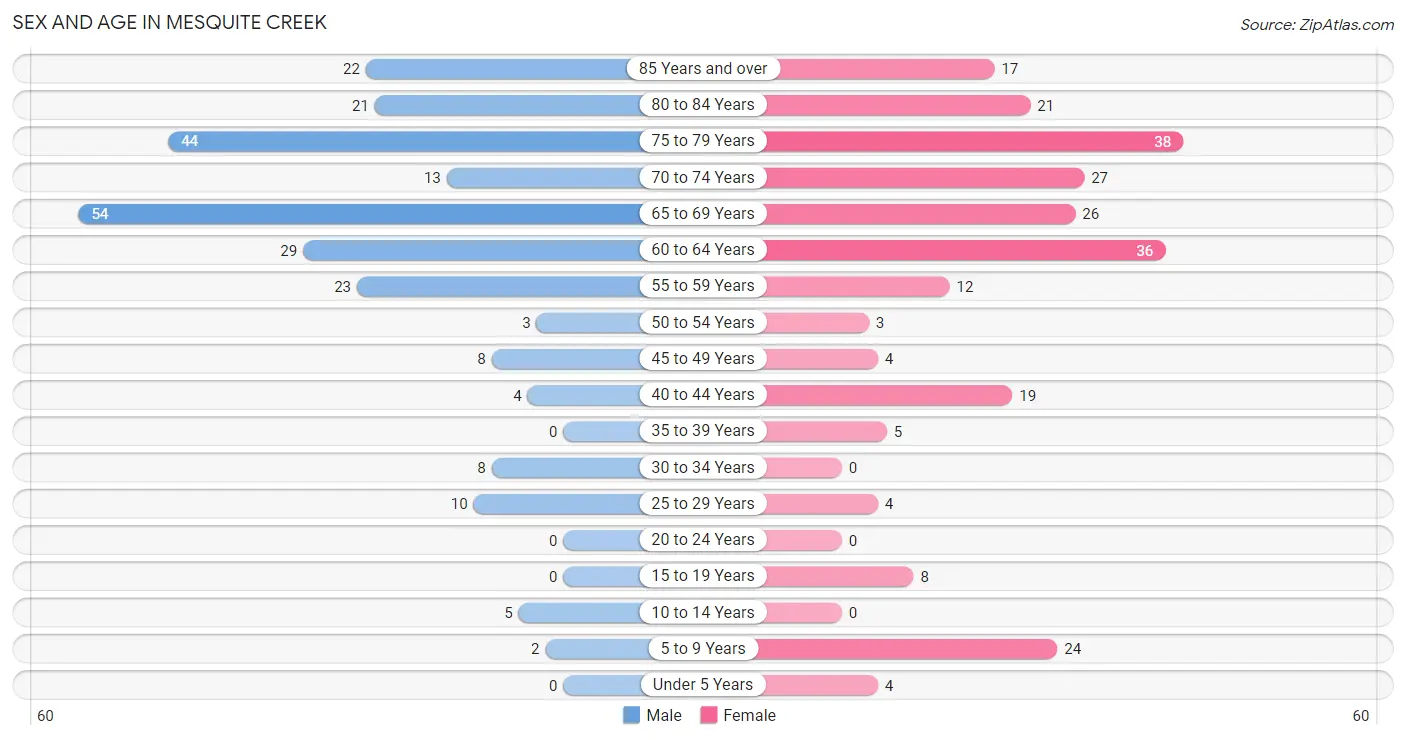
| Age Bracket | Male | Female |
| Under 5 Years | 0 (0.0%) | 4 (1.6%) |
| 5 to 9 Years | 2 (0.8%) | 24 (9.7%) |
| 10 to 14 Years | 5 (2.0%) | 0 (0.0%) |
| 15 to 19 Years | 0 (0.0%) | 8 (3.2%) |
| 20 to 24 Years | 0 (0.0%) | 0 (0.0%) |
| 25 to 29 Years | 10 (4.1%) | 4 (1.6%) |
| 30 to 34 Years | 8 (3.3%) | 0 (0.0%) |
| 35 to 39 Years | 0 (0.0%) | 5 (2.0%) |
| 40 to 44 Years | 4 (1.6%) | 19 (7.7%) |
| 45 to 49 Years | 8 (3.3%) | 4 (1.6%) |
| 50 to 54 Years | 3 (1.2%) | 3 (1.2%) |
| 55 to 59 Years | 23 (9.3%) | 12 (4.8%) |
| 60 to 64 Years | 29 (11.8%) | 36 (14.5%) |
| 65 to 69 Years | 54 (22.0%) | 26 (10.5%) |
| 70 to 74 Years | 13 (5.3%) | 27 (10.9%) |
| 75 to 79 Years | 44 (17.9%) | 38 (15.3%) |
| 80 to 84 Years | 21 (8.5%) | 21 (8.5%) |
| 85 Years and over | 22 (8.9%) | 17 (6.9%) |
| Total | 246 (100.0%) | 248 (100.0%) |
Families and Households in Mesquite Creek
Median Family Size in Mesquite Creek
The median family size in Mesquite Creek is 2.40 persons per family, with single female/mother families (22 | 14.0%) accounting for the largest median family size of 2.73 persons per family. On the other hand, married-couple families (133 | 84.7%) represent the smallest median family size with 2.35 persons per family.
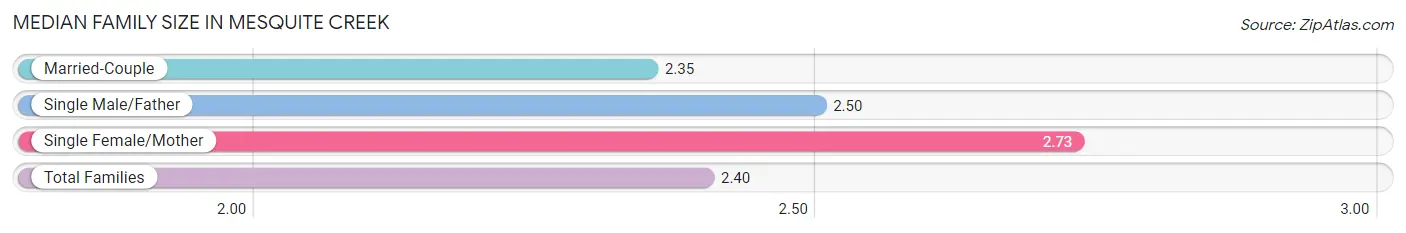
| Family Type | # Families | Family Size |
| Married-Couple | 133 (84.7%) | 2.35 |
| Single Male/Father | 2 (1.3%) | 2.50 |
| Single Female/Mother | 22 (14.0%) | 2.73 |
| Total Families | 157 (100.0%) | 2.40 |
Median Household Size in Mesquite Creek
The median household size in Mesquite Creek is 1.94 persons per household, with single female/mother households (22 | 8.6%) accounting for the largest median household size of 2.73 persons per household. non-family households (98 | 38.4%) represent the smallest median household size with 1.19 persons per household.
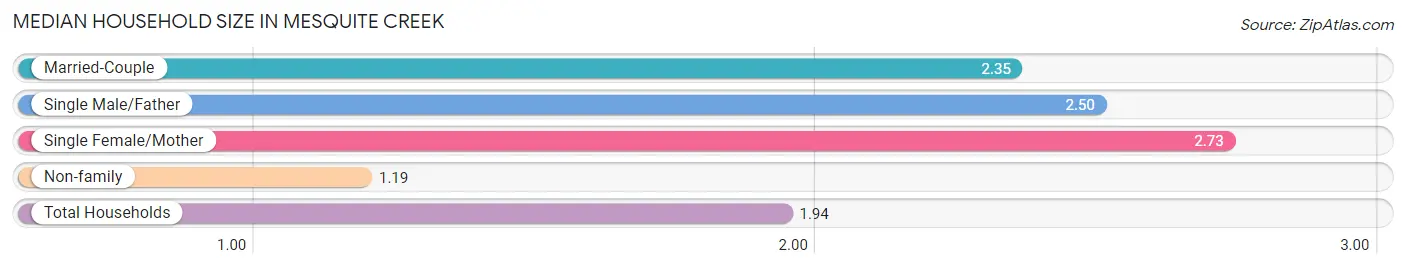
| Household Type | # Households | Household Size |
| Married-Couple | 133 (52.2%) | 2.35 |
| Single Male/Father | 2 (0.8%) | 2.50 |
| Single Female/Mother | 22 (8.6%) | 2.73 |
| Non-family | 98 (38.4%) | 1.19 |
| Total Households | 255 (100.0%) | 1.94 |
Household Size by Marriage Status in Mesquite Creek
Out of a total of 255 households in Mesquite Creek, 157 (61.6%) are family households, while 98 (38.4%) are nonfamily households. The most numerous type of family households are 2-person households, comprising 129, and the most common type of nonfamily households are 1-person households, comprising 81.
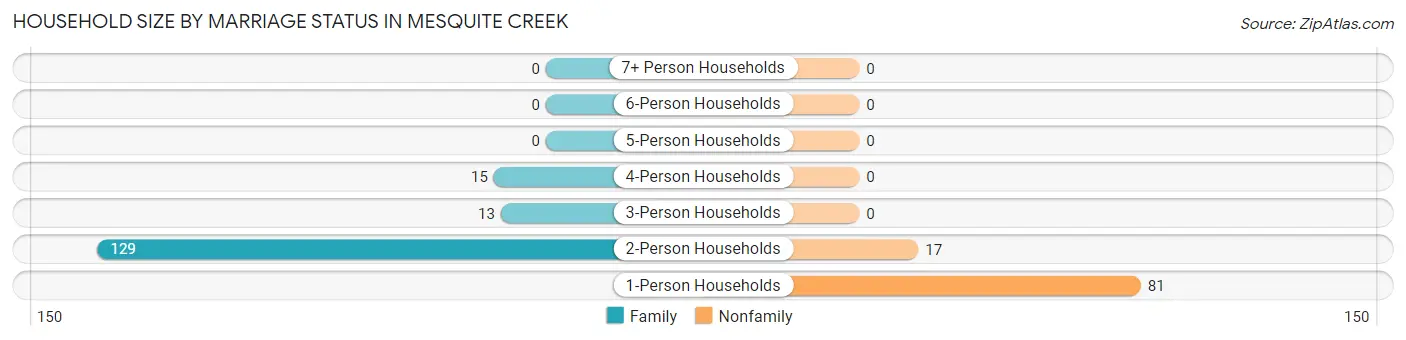
| Household Size | Family Households | Nonfamily Households |
| 1-Person Households | - | 81 (31.8%) |
| 2-Person Households | 129 (50.6%) | 17 (6.7%) |
| 3-Person Households | 13 (5.1%) | 0 (0.0%) |
| 4-Person Households | 15 (5.9%) | 0 (0.0%) |
| 5-Person Households | 0 (0.0%) | 0 (0.0%) |
| 6-Person Households | 0 (0.0%) | 0 (0.0%) |
| 7+ Person Households | 0 (0.0%) | 0 (0.0%) |
| Total | 157 (61.6%) | 98 (38.4%) |
Female Fertility in Mesquite Creek
Fertility by Age in Mesquite Creek
| Age Bracket | Women with Births | Births / 1,000 Women |
| 15 to 19 years | 0 (0.0%) | 0.0 |
| 20 to 34 years | 0 (0.0%) | 0.0 |
| 35 to 50 years | 0 (0.0%) | 0.0 |
| Total | 0 (0.0%) | 0.0 |
Fertility by Age by Marriage Status in Mesquite Creek
| Age Bracket | Married | Unmarried |
| 15 to 19 years | 0 (0.0%) | 0 (0.0%) |
| 20 to 34 years | 0 (0.0%) | 0 (0.0%) |
| 35 to 50 years | 0 (0.0%) | 0 (0.0%) |
| Total | 0 (0.0%) | 0 (0.0%) |
Fertility by Education in Mesquite Creek
| Educational Attainment | Women with Births | Births / 1,000 Women |
| Less than High School | 0 (0.0%) | 0.0 |
| High School Diploma | 0 (0.0%) | 0.0 |
| College or Associate's Degree | 0 (0.0%) | 0.0 |
| Bachelor's Degree | 0 (0.0%) | 0.0 |
| Graduate Degree | 0 (0.0%) | 0.0 |
| Total | 0 (0.0%) | 0.0 |
Fertility by Education by Marriage Status in Mesquite Creek
| Educational Attainment | Married | Unmarried |
| Less than High School | 0 (0.0%) | 0 (0.0%) |
| High School Diploma | 0 (0.0%) | 0 (0.0%) |
| College or Associate's Degree | 0 (0.0%) | 0 (0.0%) |
| Bachelor's Degree | 0 (0.0%) | 0 (0.0%) |
| Graduate Degree | 0 (0.0%) | 0 (0.0%) |
| Total | 0 (0.0%) | 0 (0.0%) |
Employment Characteristics in Mesquite Creek
Employment by Class of Employer in Mesquite Creek
Among the 121 employed individuals in Mesquite Creek, private company employees (65 | 53.7%), local government employees (17 | 14.1%), and not-for-profit organizations (15 | 12.4%) make up the most common classes of employment.
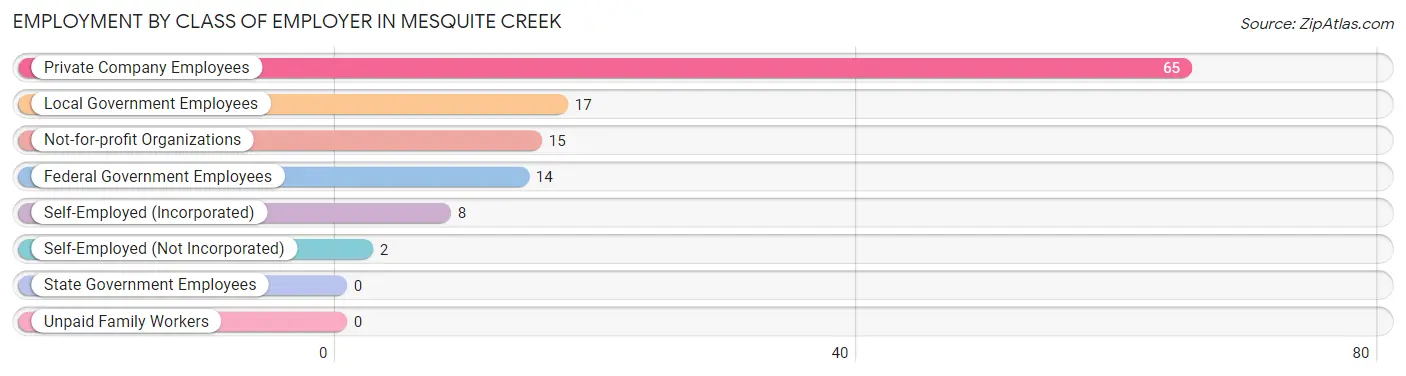
| Employer Class | # Employees | % Employees |
| Private Company Employees | 65 | 53.7% |
| Self-Employed (Incorporated) | 8 | 6.6% |
| Self-Employed (Not Incorporated) | 2 | 1.7% |
| Not-for-profit Organizations | 15 | 12.4% |
| Local Government Employees | 17 | 14.1% |
| State Government Employees | 0 | 0.0% |
| Federal Government Employees | 14 | 11.6% |
| Unpaid Family Workers | 0 | 0.0% |
| Total | 121 | 100.0% |
Employment Status by Age in Mesquite Creek
According to the labor force statistics for Mesquite Creek, out of the total population over 16 years of age (455), 29.5% or 134 individuals are in the labor force, with 3.7% or 5 of them unemployed. The age group with the highest labor force participation rate is 30 to 34 years, with 100.0% or 8 individuals in the labor force. Within the labor force, the 65 to 74 years age range has the highest percentage of unemployed individuals, with 13.0% or 3 of them being unemployed.
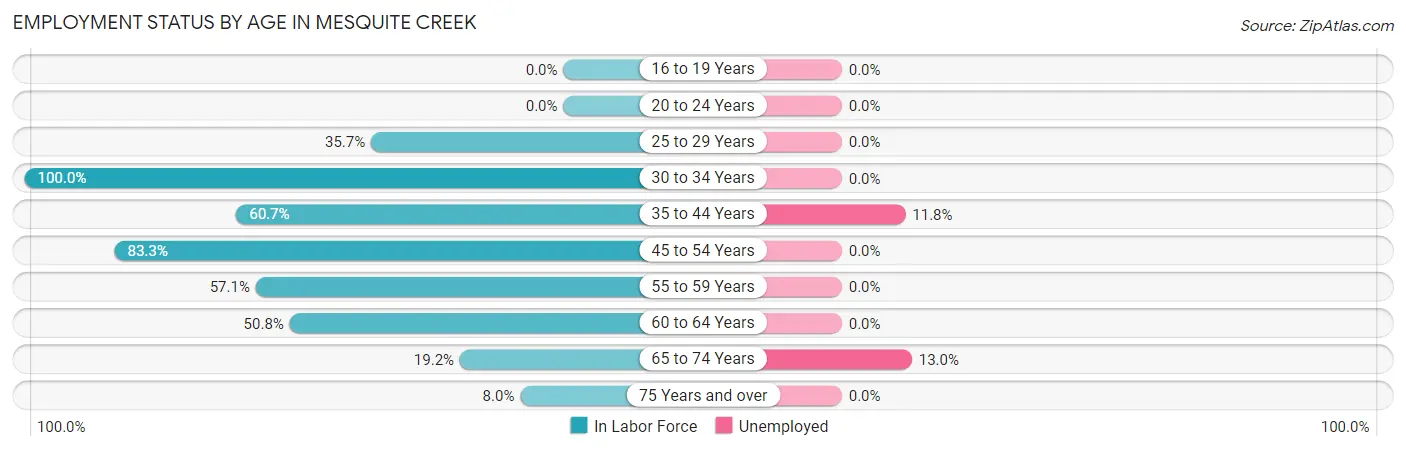
| Age Bracket | In Labor Force | Unemployed |
| 16 to 19 Years | 0 (0.0%) | 0 (0.0%) |
| 20 to 24 Years | 0 (0.0%) | 0 (0.0%) |
| 25 to 29 Years | 5 (35.7%) | 0 (0.0%) |
| 30 to 34 Years | 8 (100.0%) | 0 (0.0%) |
| 35 to 44 Years | 17 (60.7%) | 2 (11.8%) |
| 45 to 54 Years | 15 (83.3%) | 0 (0.0%) |
| 55 to 59 Years | 20 (57.1%) | 0 (0.0%) |
| 60 to 64 Years | 33 (50.8%) | 0 (0.0%) |
| 65 to 74 Years | 23 (19.2%) | 3 (13.0%) |
| 75 Years and over | 13 (8.0%) | 0 (0.0%) |
| Total | 134 (29.5%) | 5 (3.7%) |
Employment Status by Educational Attainment in Mesquite Creek
According to labor force statistics for Mesquite Creek, 58.3% of individuals (98) out of the total population between 25 and 64 years of age (168) are in the labor force, with 2.0% or 2 of them being unemployed. The group with the highest labor force participation rate are those with the educational attainment of bachelor's degree or higher, with 100.0% or 7 individuals in the labor force. Within the labor force, individuals with college / associate degree education have the highest percentage of unemployment, with 4.3% or 2 of them being unemployed.
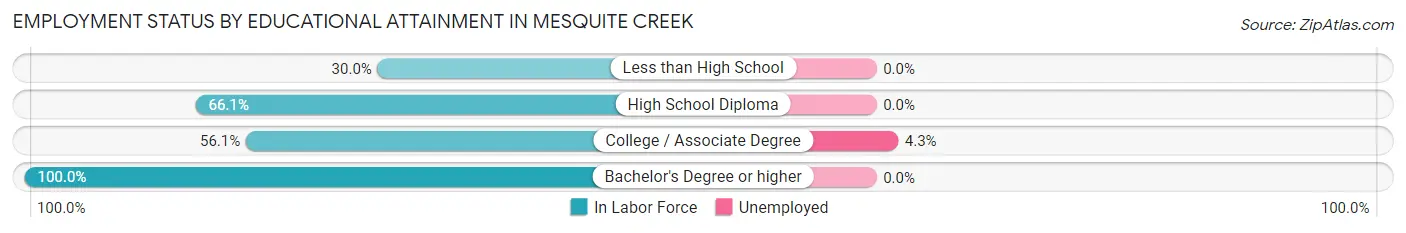
| Educational Attainment | In Labor Force | Unemployed |
| Less than High School | 6 (30.0%) | 0 (0.0%) |
| High School Diploma | 39 (66.1%) | 0 (0.0%) |
| College / Associate Degree | 46 (56.1%) | 4 (4.3%) |
| Bachelor's Degree or higher | 7 (100.0%) | 0 (0.0%) |
| Total | 98 (58.3%) | 3 (2.0%) |
Employment Occupations by Sex in Mesquite Creek
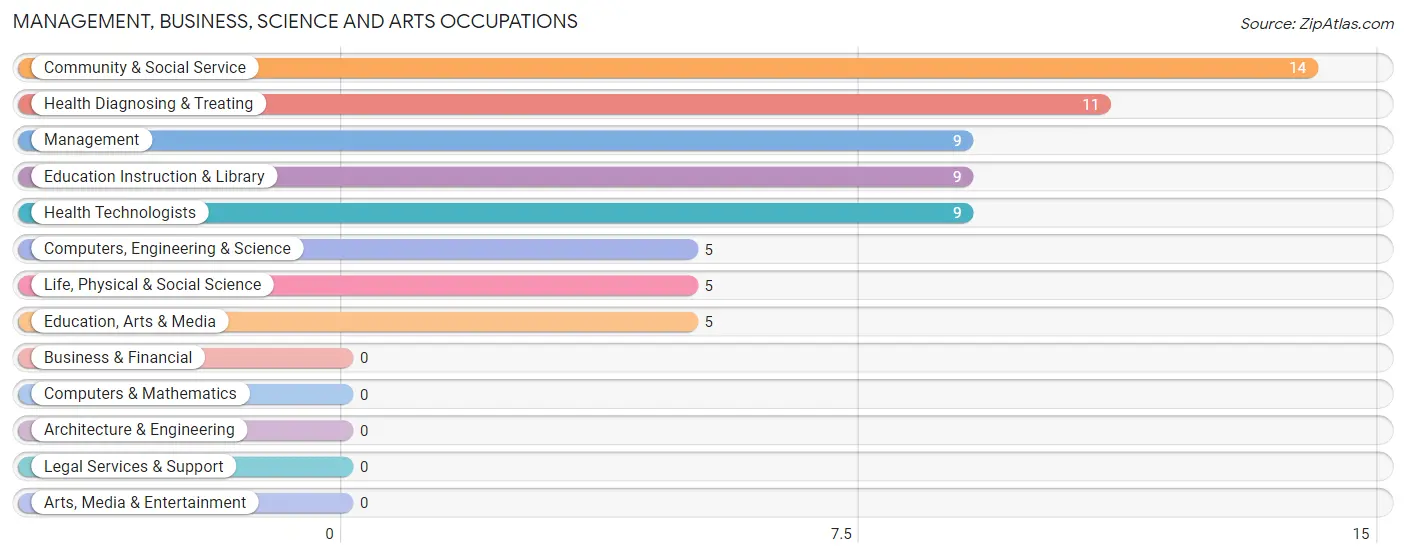
Management, Business, Science and Arts Occupations
The most common Management, Business, Science and Arts occupations in Mesquite Creek are Community & Social Service (14 | 10.8%), Health Diagnosing & Treating (11 | 8.5%), Management (9 | 7.0%), Education Instruction & Library (9 | 7.0%), and Health Technologists (9 | 7.0%).
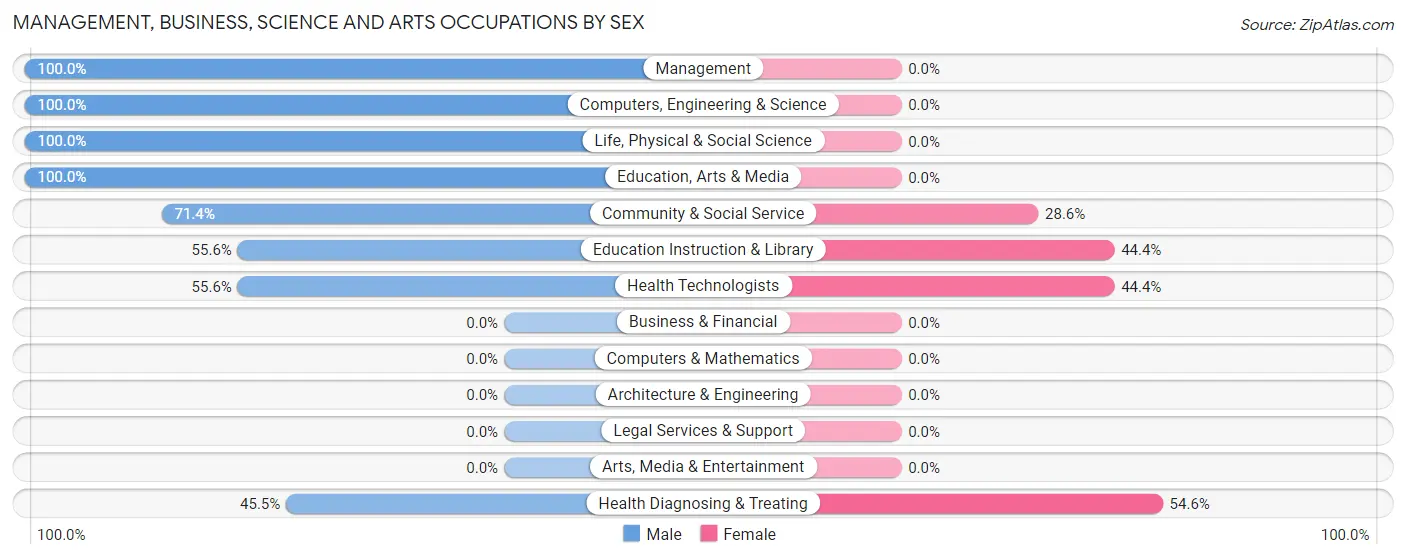
Management, Business, Science and Arts Occupations by Sex
Within the Management, Business, Science and Arts occupations in Mesquite Creek, the most male-oriented occupations are Management (100.0%), Computers, Engineering & Science (100.0%), and Life, Physical & Social Science (100.0%), while the most female-oriented occupations are Health Diagnosing & Treating (54.5%), Education Instruction & Library (44.4%), and Health Technologists (44.4%).
| Occupation | Male | Female |
| Management | 9 (100.0%) | 0 (0.0%) |
| Business & Financial | 0 (0.0%) | 0 (0.0%) |
| Computers, Engineering & Science | 5 (100.0%) | 0 (0.0%) |
| Computers & Mathematics | 0 (0.0%) | 0 (0.0%) |
| Architecture & Engineering | 0 (0.0%) | 0 (0.0%) |
| Life, Physical & Social Science | 5 (100.0%) | 0 (0.0%) |
| Community & Social Service | 10 (71.4%) | 4 (28.6%) |
| Education, Arts & Media | 5 (100.0%) | 0 (0.0%) |
| Legal Services & Support | 0 (0.0%) | 0 (0.0%) |
| Education Instruction & Library | 5 (55.6%) | 4 (44.4%) |
| Arts, Media & Entertainment | 0 (0.0%) | 0 (0.0%) |
| Health Diagnosing & Treating | 5 (45.5%) | 6 (54.5%) |
| Health Technologists | 5 (55.6%) | 4 (44.4%) |
| Total (Category) | 29 (74.4%) | 10 (25.6%) |
| Total (Overall) | 76 (58.9%) | 53 (41.1%) |
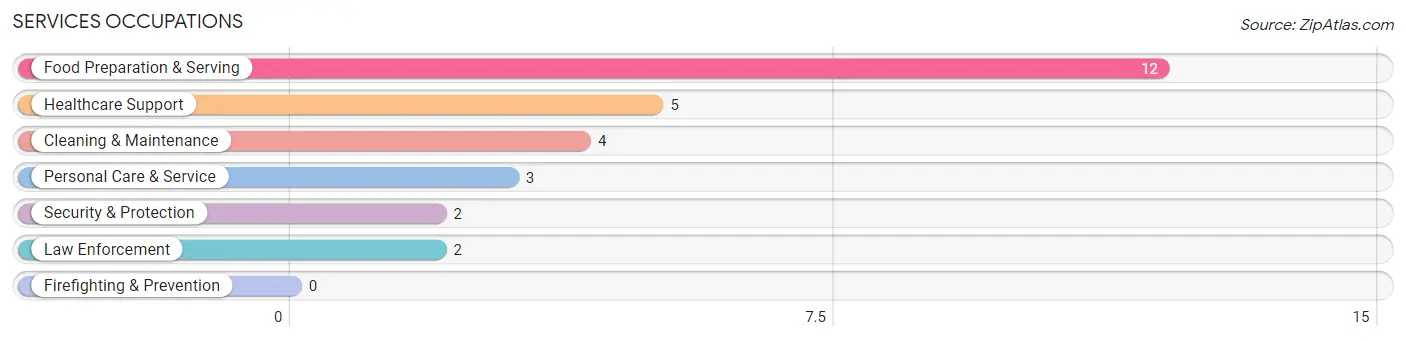
Services Occupations
The most common Services occupations in Mesquite Creek are Food Preparation & Serving (12 | 9.3%), Healthcare Support (5 | 3.9%), Cleaning & Maintenance (4 | 3.1%), Personal Care & Service (3 | 2.3%), and Security & Protection (2 | 1.5%).
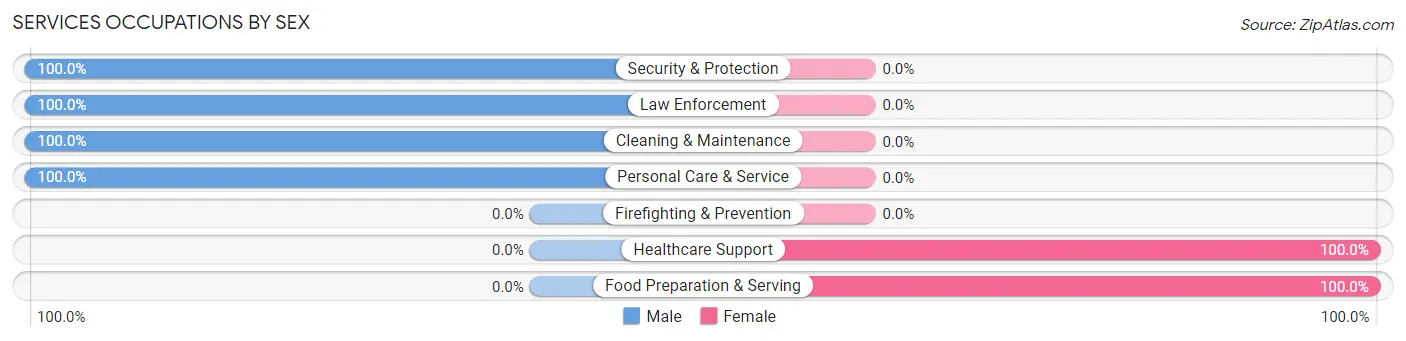
Services Occupations by Sex
Within the Services occupations in Mesquite Creek, the most male-oriented occupations are Security & Protection (100.0%), Law Enforcement (100.0%), and Cleaning & Maintenance (100.0%), while the most female-oriented occupations are Healthcare Support (100.0%), and Food Preparation & Serving (100.0%).
| Occupation | Male | Female |
| Healthcare Support | 0 (0.0%) | 5 (100.0%) |
| Security & Protection | 2 (100.0%) | 0 (0.0%) |
| Firefighting & Prevention | 0 (0.0%) | 0 (0.0%) |
| Law Enforcement | 2 (100.0%) | 0 (0.0%) |
| Food Preparation & Serving | 0 (0.0%) | 12 (100.0%) |
| Cleaning & Maintenance | 4 (100.0%) | 0 (0.0%) |
| Personal Care & Service | 3 (100.0%) | 0 (0.0%) |
| Total (Category) | 9 (34.6%) | 17 (65.4%) |
| Total (Overall) | 76 (58.9%) | 53 (41.1%) |
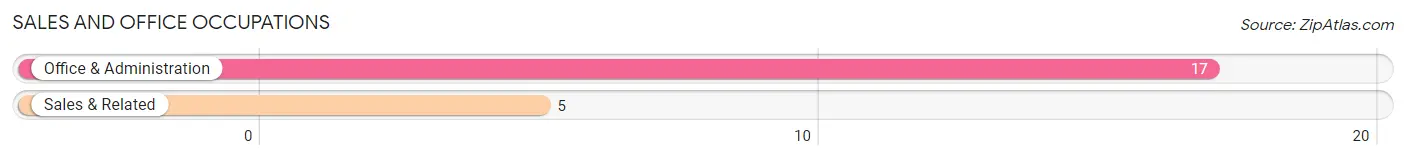
Sales and Office Occupations
The most common Sales and Office occupations in Mesquite Creek are Office & Administration (17 | 13.2%), and Sales & Related (5 | 3.9%).
Sales and Office Occupations by Sex
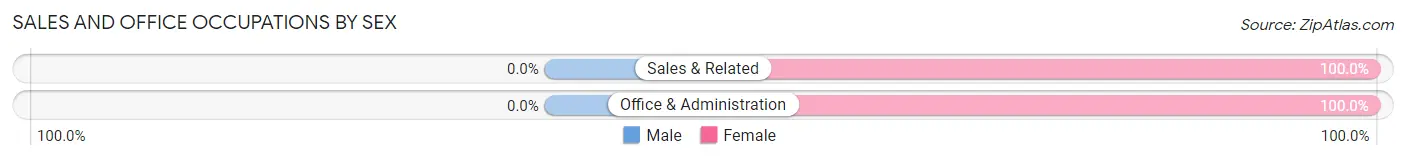
| Occupation | Male | Female |
| Sales & Related | 0 (0.0%) | 5 (100.0%) |
| Office & Administration | 0 (0.0%) | 17 (100.0%) |
| Total (Category) | 0 (0.0%) | 22 (100.0%) |
| Total (Overall) | 76 (58.9%) | 53 (41.1%) |
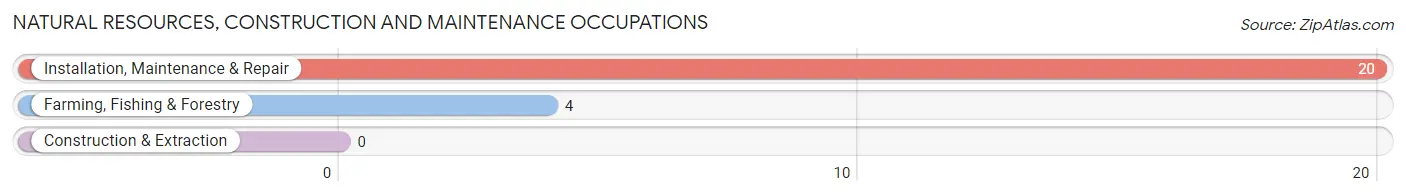
Natural Resources, Construction and Maintenance Occupations
The most common Natural Resources, Construction and Maintenance occupations in Mesquite Creek are Installation, Maintenance & Repair (20 | 15.5%), and Farming, Fishing & Forestry (4 | 3.1%).
Natural Resources, Construction and Maintenance Occupations by Sex
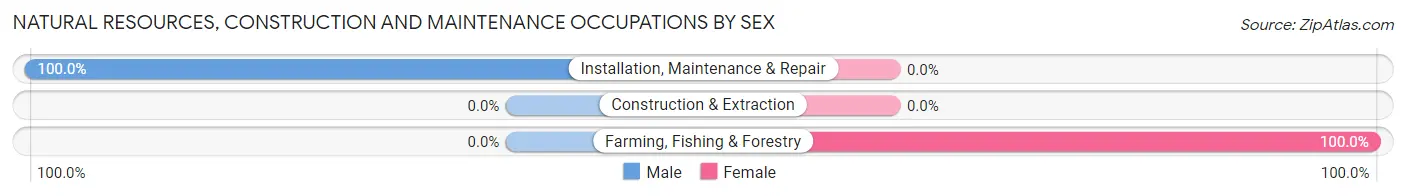
| Occupation | Male | Female |
| Farming, Fishing & Forestry | 0 (0.0%) | 4 (100.0%) |
| Construction & Extraction | 0 (0.0%) | 0 (0.0%) |
| Installation, Maintenance & Repair | 20 (100.0%) | 0 (0.0%) |
| Total (Category) | 20 (83.3%) | 4 (16.7%) |
| Total (Overall) | 76 (58.9%) | 53 (41.1%) |
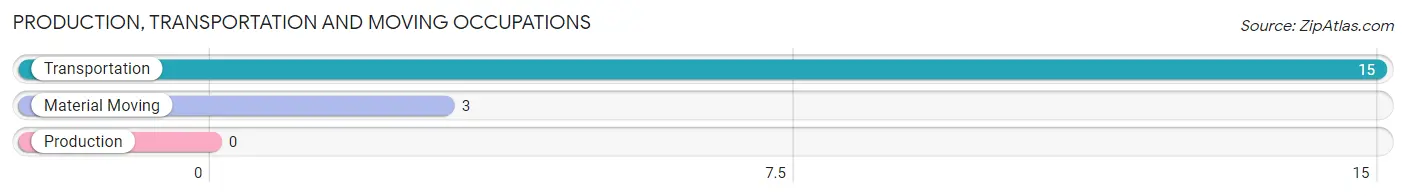
Production, Transportation and Moving Occupations
The most common Production, Transportation and Moving occupations in Mesquite Creek are Transportation (15 | 11.6%), and Material Moving (3 | 2.3%).
Production, Transportation and Moving Occupations by Sex
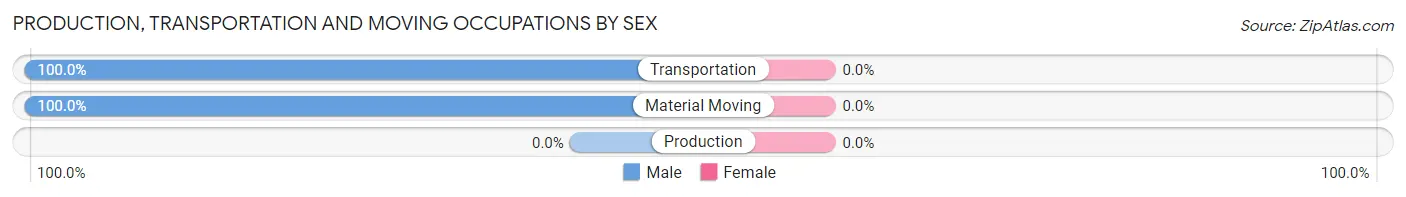
| Occupation | Male | Female |
| Production | 0 (0.0%) | 0 (0.0%) |
| Transportation | 15 (100.0%) | 0 (0.0%) |
| Material Moving | 3 (100.0%) | 0 (0.0%) |
| Total (Category) | 18 (100.0%) | 0 (0.0%) |
| Total (Overall) | 76 (58.9%) | 53 (41.1%) |
Employment Industries by Sex in Mesquite Creek
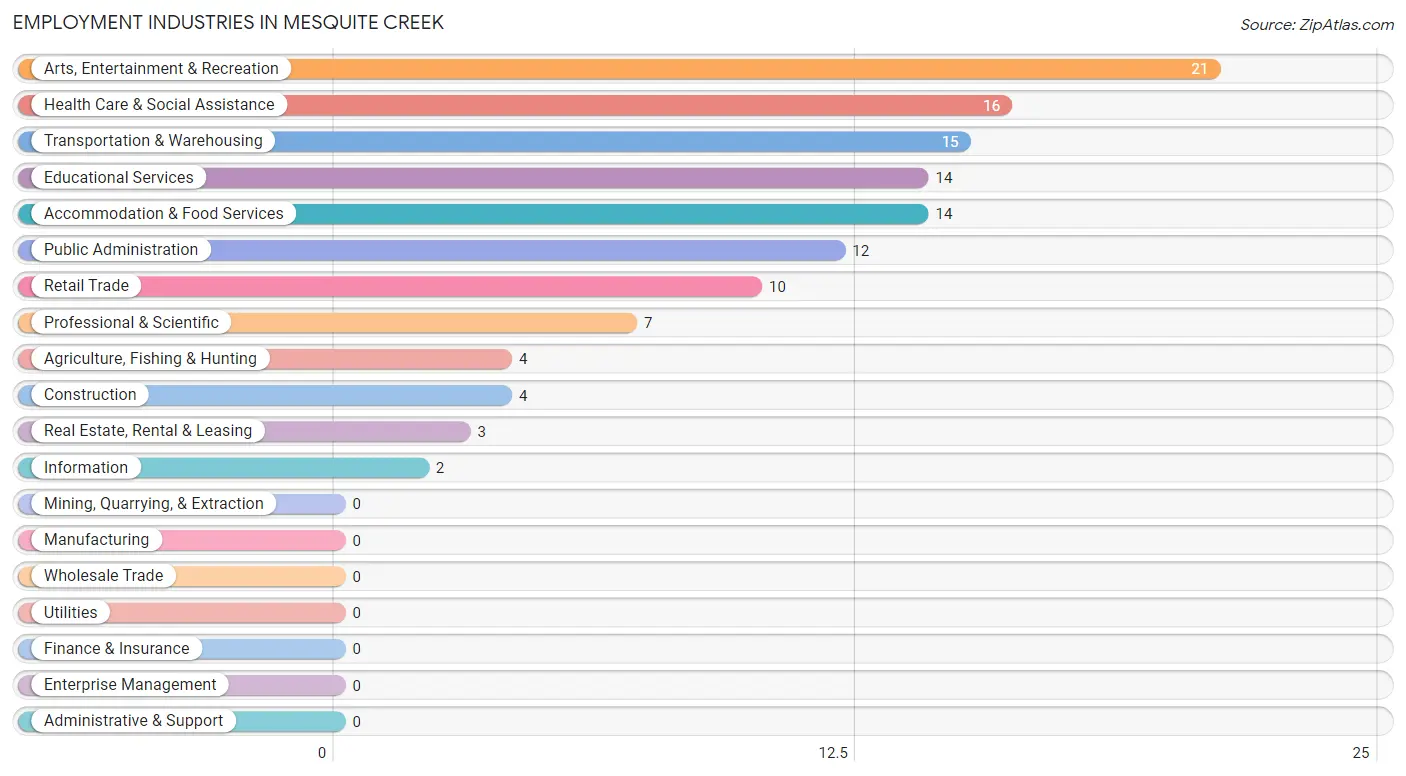
Employment Industries in Mesquite Creek
The major employment industries in Mesquite Creek include Arts, Entertainment & Recreation (21 | 16.3%), Health Care & Social Assistance (16 | 12.4%), Transportation & Warehousing (15 | 11.6%), Educational Services (14 | 10.8%), and Accommodation & Food Services (14 | 10.8%).
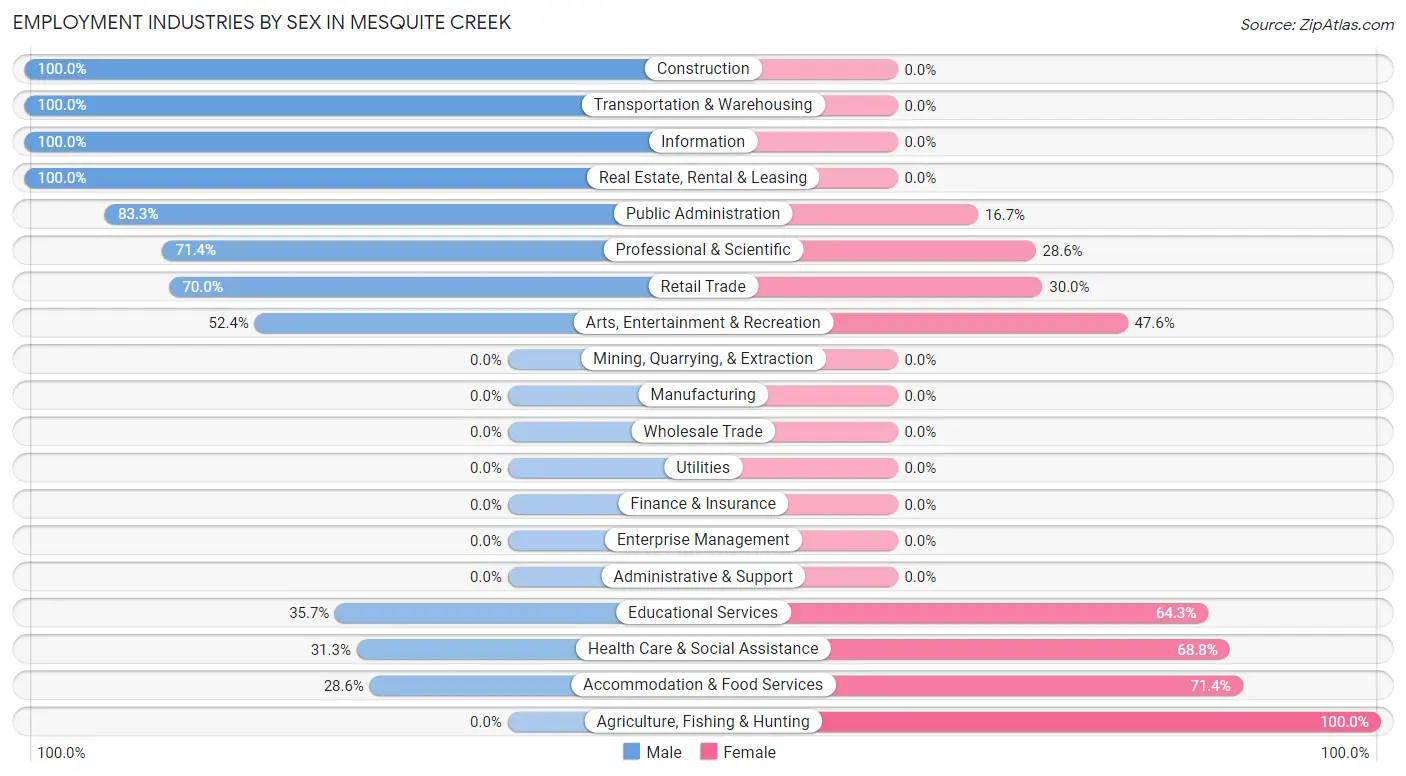
Employment Industries by Sex in Mesquite Creek
The Mesquite Creek industries that see more men than women are Construction (100.0%), Transportation & Warehousing (100.0%), and Information (100.0%), whereas the industries that tend to have a higher number of women are Agriculture, Fishing & Hunting (100.0%), Accommodation & Food Services (71.4%), and Health Care & Social Assistance (68.8%).
| Industry | Male | Female |
| Agriculture, Fishing & Hunting | 0 (0.0%) | 4 (100.0%) |
| Mining, Quarrying, & Extraction | 0 (0.0%) | 0 (0.0%) |
| Construction | 4 (100.0%) | 0 (0.0%) |
| Manufacturing | 0 (0.0%) | 0 (0.0%) |
| Wholesale Trade | 0 (0.0%) | 0 (0.0%) |
| Retail Trade | 7 (70.0%) | 3 (30.0%) |
| Transportation & Warehousing | 15 (100.0%) | 0 (0.0%) |
| Utilities | 0 (0.0%) | 0 (0.0%) |
| Information | 2 (100.0%) | 0 (0.0%) |
| Finance & Insurance | 0 (0.0%) | 0 (0.0%) |
| Real Estate, Rental & Leasing | 3 (100.0%) | 0 (0.0%) |
| Professional & Scientific | 5 (71.4%) | 2 (28.6%) |
| Enterprise Management | 0 (0.0%) | 0 (0.0%) |
| Administrative & Support | 0 (0.0%) | 0 (0.0%) |
| Educational Services | 5 (35.7%) | 9 (64.3%) |
| Health Care & Social Assistance | 5 (31.2%) | 11 (68.8%) |
| Arts, Entertainment & Recreation | 11 (52.4%) | 10 (47.6%) |
| Accommodation & Food Services | 4 (28.6%) | 10 (71.4%) |
| Public Administration | 10 (83.3%) | 2 (16.7%) |
| Total | 76 (58.9%) | 53 (41.1%) |
Education in Mesquite Creek
School Enrollment in Mesquite Creek
The most common levels of schooling among the 35 students in Mesquite Creek are elementary school (22 | 62.9%), middle school (9 | 25.7%), and kindergarten (4 | 11.4%).
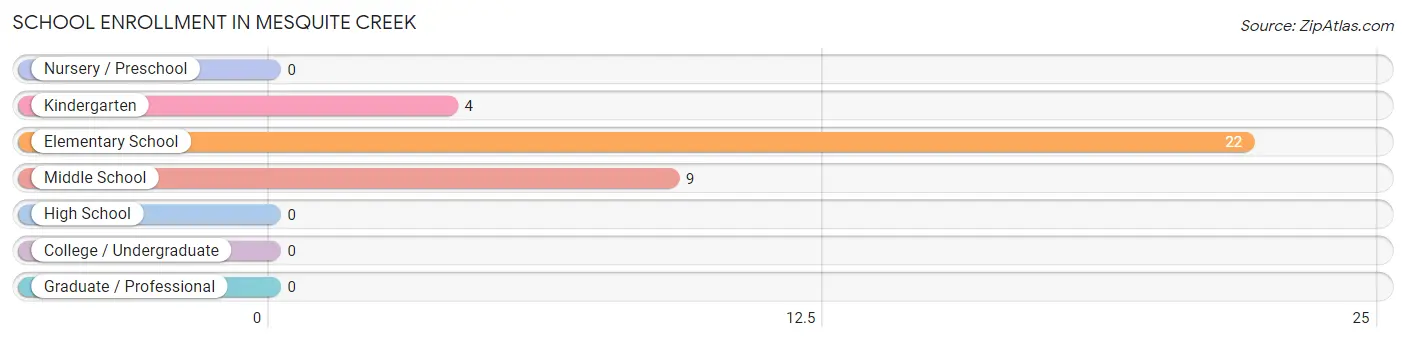
| School Level | # Students | % Students |
| Nursery / Preschool | 0 | 0.0% |
| Kindergarten | 4 | 11.4% |
| Elementary School | 22 | 62.9% |
| Middle School | 9 | 25.7% |
| High School | 0 | 0.0% |
| College / Undergraduate | 0 | 0.0% |
| Graduate / Professional | 0 | 0.0% |
| Total | 35 | 100.0% |
School Enrollment by Age by Funding Source in Mesquite Creek
Out of a total of 35 students who are enrolled in schools in Mesquite Creek, 10 (28.6%) attend a private institution, while the remaining 25 (71.4%) are enrolled in public schools. The age group of 15 to 17 year olds has the highest likelihood of being enrolled in private schools, with 4 (100.0% in the age bracket) enrolled. Conversely, the age group of 10 to 14 year olds has the lowest likelihood of being enrolled in a private school, with 5 (100.0% in the age bracket) attending a public institution.
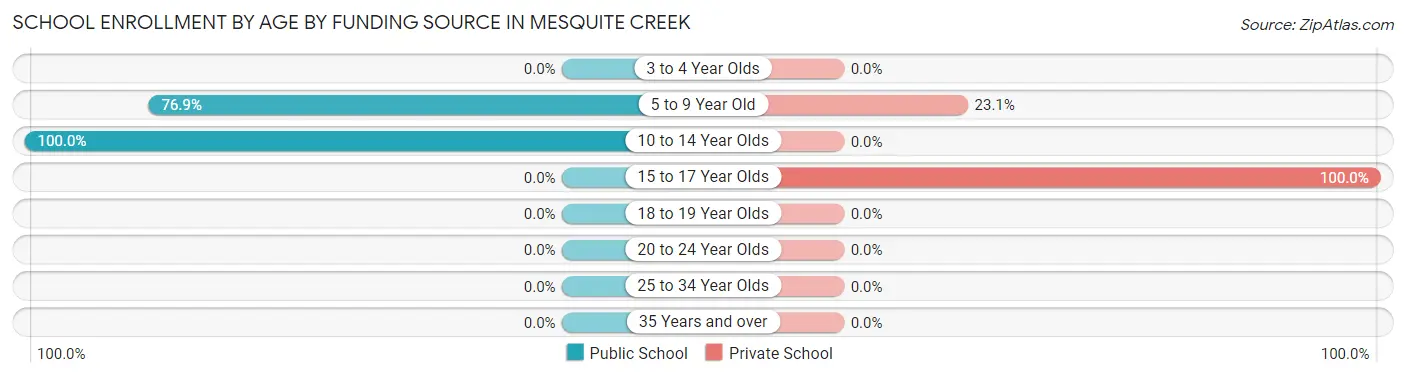
| Age Bracket | Public School | Private School |
| 3 to 4 Year Olds | 0 (0.0%) | 0 (0.0%) |
| 5 to 9 Year Old | 20 (76.9%) | 6 (23.1%) |
| 10 to 14 Year Olds | 5 (100.0%) | 0 (0.0%) |
| 15 to 17 Year Olds | 0 (0.0%) | 4 (100.0%) |
| 18 to 19 Year Olds | 0 (0.0%) | 0 (0.0%) |
| 20 to 24 Year Olds | 0 (0.0%) | 0 (0.0%) |
| 25 to 34 Year Olds | 0 (0.0%) | 0 (0.0%) |
| 35 Years and over | 0 (0.0%) | 0 (0.0%) |
| Total | 25 (71.4%) | 10 (28.6%) |
Educational Attainment by Field of Study in Mesquite Creek
Business (16 | 22.5%), bio, nature & agricultural (15 | 21.1%), psychology (7 | 9.9%), social sciences (7 | 9.9%), and engineering (7 | 9.9%) are the most common fields of study among 71 individuals in Mesquite Creek who have obtained a bachelor's degree or higher.
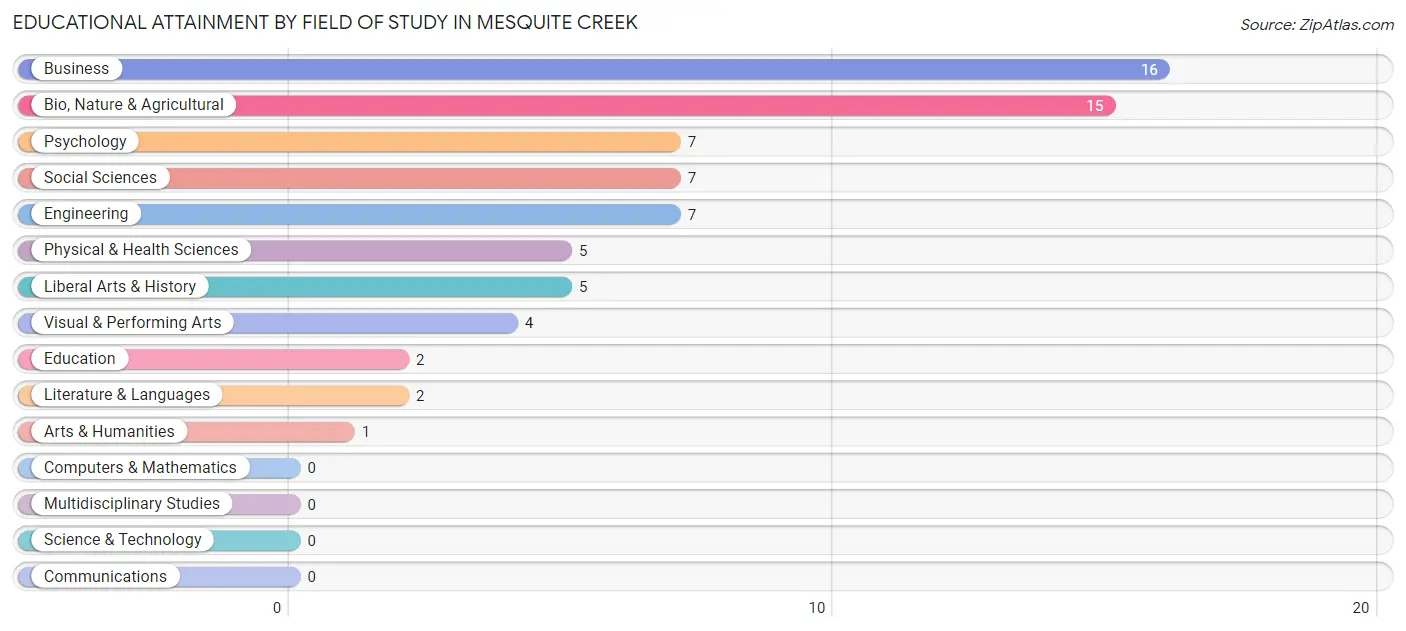
| Field of Study | # Graduates | % Graduates |
| Computers & Mathematics | 0 | 0.0% |
| Bio, Nature & Agricultural | 15 | 21.1% |
| Physical & Health Sciences | 5 | 7.0% |
| Psychology | 7 | 9.9% |
| Social Sciences | 7 | 9.9% |
| Engineering | 7 | 9.9% |
| Multidisciplinary Studies | 0 | 0.0% |
| Science & Technology | 0 | 0.0% |
| Business | 16 | 22.5% |
| Education | 2 | 2.8% |
| Literature & Languages | 2 | 2.8% |
| Liberal Arts & History | 5 | 7.0% |
| Visual & Performing Arts | 4 | 5.6% |
| Communications | 0 | 0.0% |
| Arts & Humanities | 1 | 1.4% |
| Total | 71 | 100.0% |
Transportation & Commute in Mesquite Creek
Vehicle Availability by Sex in Mesquite Creek
The most prevalent vehicle ownership categories in Mesquite Creek are males with 2 vehicles (40, accounting for 55.6%) and females with 2 vehicles (18, making up 81.6%).
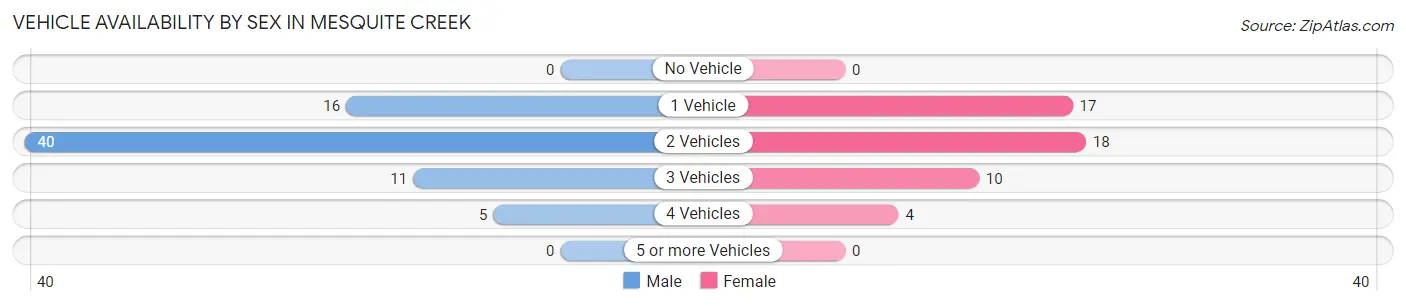
| Vehicles Available | Male | Female |
| No Vehicle | 0 (0.0%) | 0 (0.0%) |
| 1 Vehicle | 16 (22.2%) | 17 (34.7%) |
| 2 Vehicles | 40 (55.6%) | 18 (36.7%) |
| 3 Vehicles | 11 (15.3%) | 10 (20.4%) |
| 4 Vehicles | 5 (6.9%) | 4 (8.2%) |
| 5 or more Vehicles | 0 (0.0%) | 0 (0.0%) |
| Total | 72 (100.0%) | 49 (100.0%) |
Commute Time in Mesquite Creek
The most frequently occuring commute durations in Mesquite Creek are 20 to 24 minutes (25 commuters, 23.4%), 45 to 59 minutes (19 commuters, 17.8%), and 15 to 19 minutes (16 commuters, 14.9%).
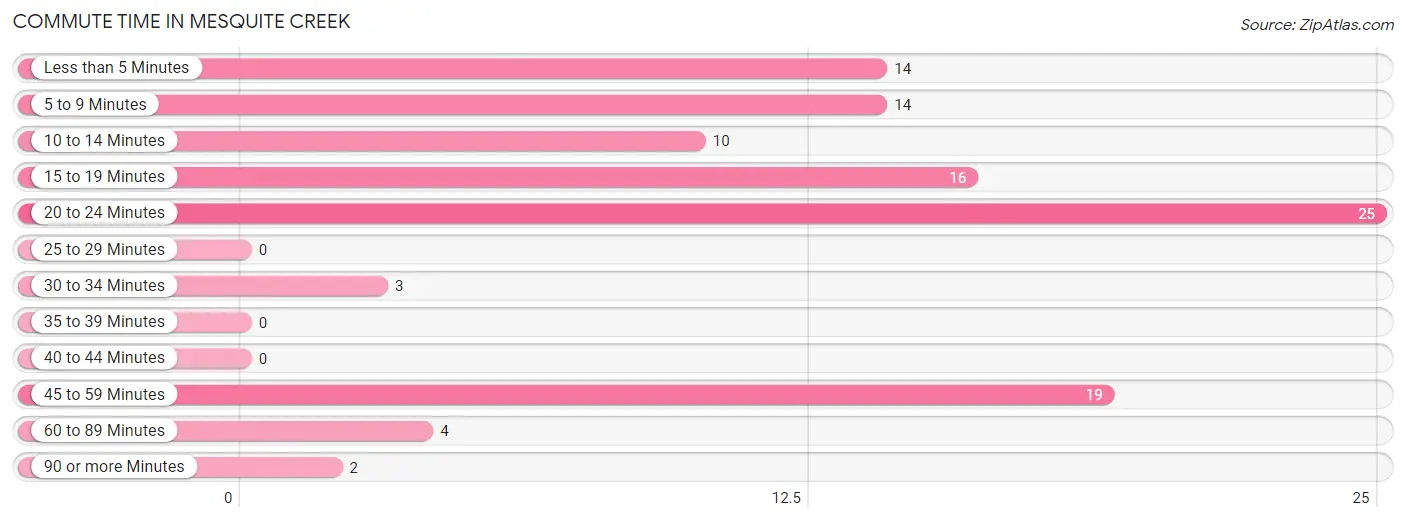
| Commute Time | # Commuters | % Commuters |
| Less than 5 Minutes | 14 | 13.1% |
| 5 to 9 Minutes | 14 | 13.1% |
| 10 to 14 Minutes | 10 | 9.3% |
| 15 to 19 Minutes | 16 | 14.9% |
| 20 to 24 Minutes | 25 | 23.4% |
| 25 to 29 Minutes | 0 | 0.0% |
| 30 to 34 Minutes | 3 | 2.8% |
| 35 to 39 Minutes | 0 | 0.0% |
| 40 to 44 Minutes | 0 | 0.0% |
| 45 to 59 Minutes | 19 | 17.8% |
| 60 to 89 Minutes | 4 | 3.7% |
| 90 or more Minutes | 2 | 1.9% |
Commute Time by Sex in Mesquite Creek
The most common commute times in Mesquite Creek are less than 5 minutes (14 commuters, 22.6%) for males and 15 to 19 minutes (16 commuters, 35.6%) for females.
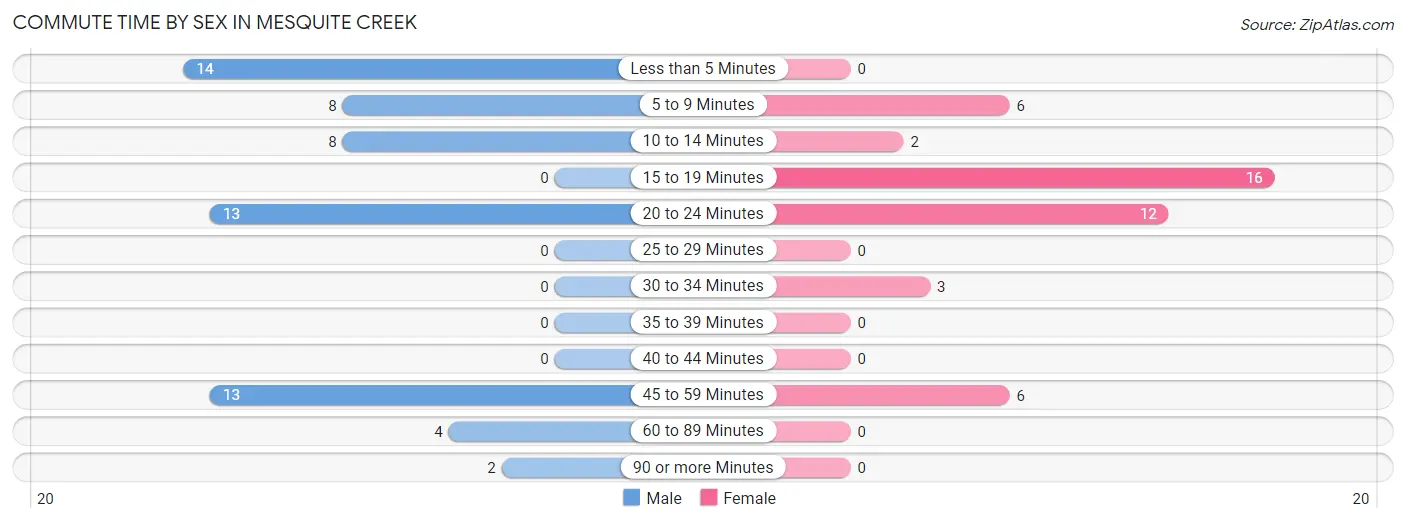
| Commute Time | Male | Female |
| Less than 5 Minutes | 14 (22.6%) | 0 (0.0%) |
| 5 to 9 Minutes | 8 (12.9%) | 6 (13.3%) |
| 10 to 14 Minutes | 8 (12.9%) | 2 (4.4%) |
| 15 to 19 Minutes | 0 (0.0%) | 16 (35.6%) |
| 20 to 24 Minutes | 13 (21.0%) | 12 (26.7%) |
| 25 to 29 Minutes | 0 (0.0%) | 0 (0.0%) |
| 30 to 34 Minutes | 0 (0.0%) | 3 (6.7%) |
| 35 to 39 Minutes | 0 (0.0%) | 0 (0.0%) |
| 40 to 44 Minutes | 0 (0.0%) | 0 (0.0%) |
| 45 to 59 Minutes | 13 (21.0%) | 6 (13.3%) |
| 60 to 89 Minutes | 4 (6.5%) | 0 (0.0%) |
| 90 or more Minutes | 2 (3.2%) | 0 (0.0%) |
Time of Departure to Work by Sex in Mesquite Creek
The most frequent times of departure to work in Mesquite Creek are 4:00 PM to 11:59 PM (16, 25.8%) for males and 6:00 AM to 6:29 AM (11, 24.4%) for females.
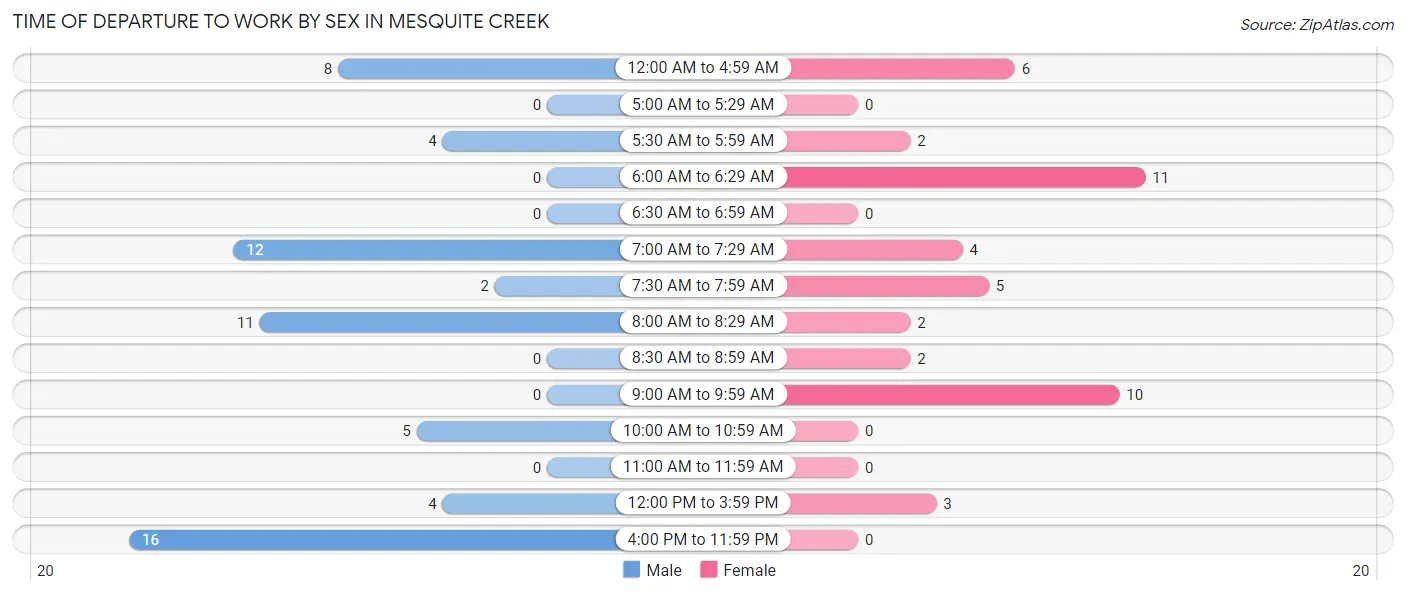
| Time of Departure | Male | Female |
| 12:00 AM to 4:59 AM | 8 (12.9%) | 6 (13.3%) |
| 5:00 AM to 5:29 AM | 0 (0.0%) | 0 (0.0%) |
| 5:30 AM to 5:59 AM | 4 (6.5%) | 2 (4.4%) |
| 6:00 AM to 6:29 AM | 0 (0.0%) | 11 (24.4%) |
| 6:30 AM to 6:59 AM | 0 (0.0%) | 0 (0.0%) |
| 7:00 AM to 7:29 AM | 12 (19.4%) | 4 (8.9%) |
| 7:30 AM to 7:59 AM | 2 (3.2%) | 5 (11.1%) |
| 8:00 AM to 8:29 AM | 11 (17.7%) | 2 (4.4%) |
| 8:30 AM to 8:59 AM | 0 (0.0%) | 2 (4.4%) |
| 9:00 AM to 9:59 AM | 0 (0.0%) | 10 (22.2%) |
| 10:00 AM to 10:59 AM | 5 (8.1%) | 0 (0.0%) |
| 11:00 AM to 11:59 AM | 0 (0.0%) | 0 (0.0%) |
| 12:00 PM to 3:59 PM | 4 (6.5%) | 3 (6.7%) |
| 4:00 PM to 11:59 PM | 16 (25.8%) | 0 (0.0%) |
| Total | 62 (100.0%) | 45 (100.0%) |
Housing Occupancy in Mesquite Creek
Occupancy by Ownership in Mesquite Creek
Of the total 255 dwellings in Mesquite Creek, owner-occupied units account for 227 (89.0%), while renter-occupied units make up 28 (11.0%).
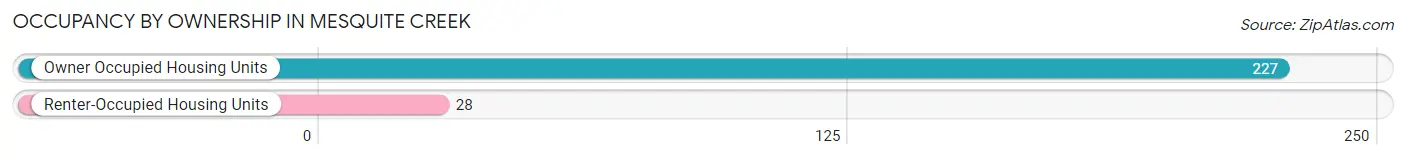
| Occupancy | # Housing Units | % Housing Units |
| Owner Occupied Housing Units | 227 | 89.0% |
| Renter-Occupied Housing Units | 28 | 11.0% |
| Total Occupied Housing Units | 255 | 100.0% |
Occupancy by Household Size in Mesquite Creek
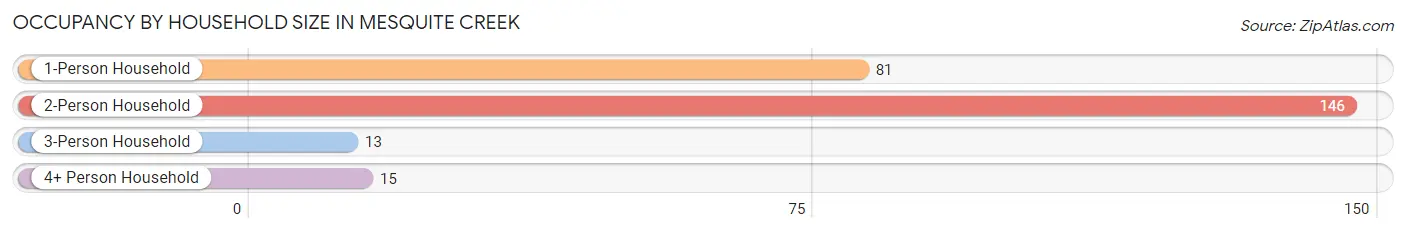
| Household Size | # Housing Units | % Housing Units |
| 1-Person Household | 81 | 31.8% |
| 2-Person Household | 146 | 57.3% |
| 3-Person Household | 13 | 5.1% |
| 4+ Person Household | 15 | 5.9% |
| Total Housing Units | 255 | 100.0% |
Occupancy by Ownership by Household Size in Mesquite Creek
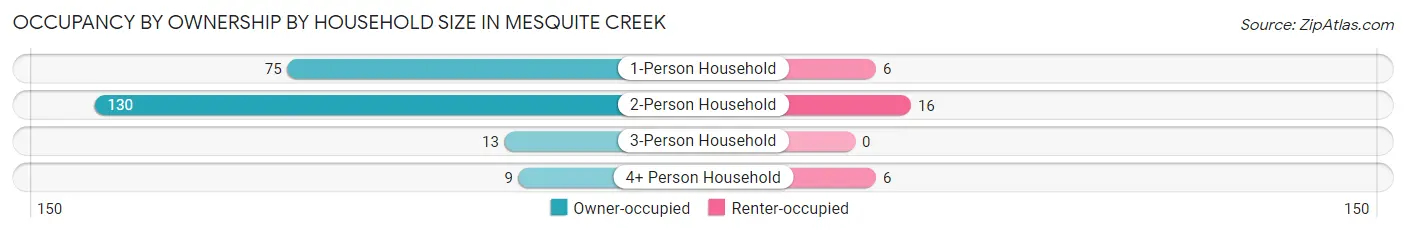
| Household Size | Owner-occupied | Renter-occupied |
| 1-Person Household | 75 (92.6%) | 6 (7.4%) |
| 2-Person Household | 130 (89.0%) | 16 (11.0%) |
| 3-Person Household | 13 (100.0%) | 0 (0.0%) |
| 4+ Person Household | 9 (60.0%) | 6 (40.0%) |
| Total Housing Units | 227 (89.0%) | 28 (11.0%) |
Occupancy by Educational Attainment in Mesquite Creek
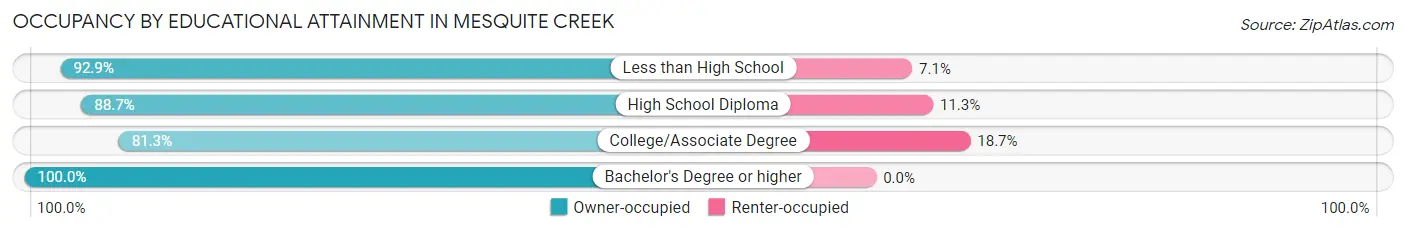
| Household Size | Owner-occupied | Renter-occupied |
| Less than High School | 39 (92.9%) | 3 (7.1%) |
| High School Diploma | 63 (88.7%) | 8 (11.3%) |
| College/Associate Degree | 74 (81.3%) | 17 (18.7%) |
| Bachelor's Degree or higher | 51 (100.0%) | 0 (0.0%) |
Occupancy by Age of Householder in Mesquite Creek
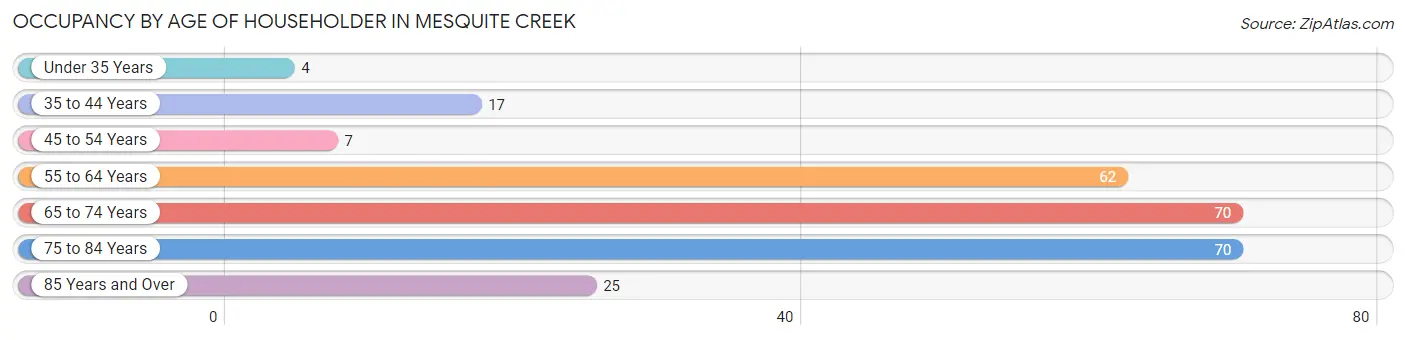
| Age Bracket | # Households | % Households |
| Under 35 Years | 4 | 1.6% |
| 35 to 44 Years | 17 | 6.7% |
| 45 to 54 Years | 7 | 2.8% |
| 55 to 64 Years | 62 | 24.3% |
| 65 to 74 Years | 70 | 27.5% |
| 75 to 84 Years | 70 | 27.5% |
| 85 Years and Over | 25 | 9.8% |
| Total | 255 | 100.0% |
Housing Finances in Mesquite Creek
Median Income by Occupancy in Mesquite Creek
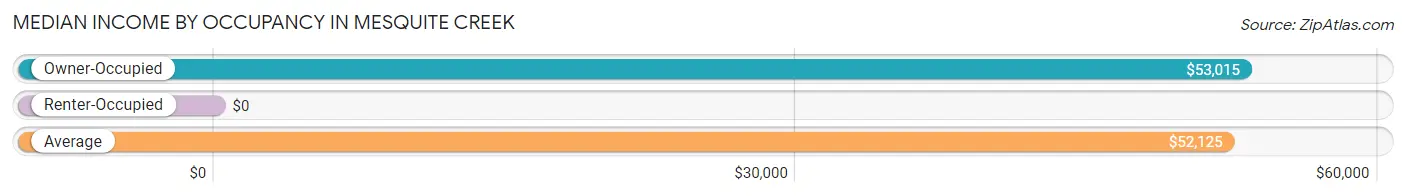
| Occupancy Type | # Households | Median Income |
| Owner-Occupied | 227 (89.0%) | $53,015 |
| Renter-Occupied | 28 (11.0%) | $0 |
| Average | 255 (100.0%) | $52,125 |
Occupancy by Householder Income Bracket in Mesquite Creek
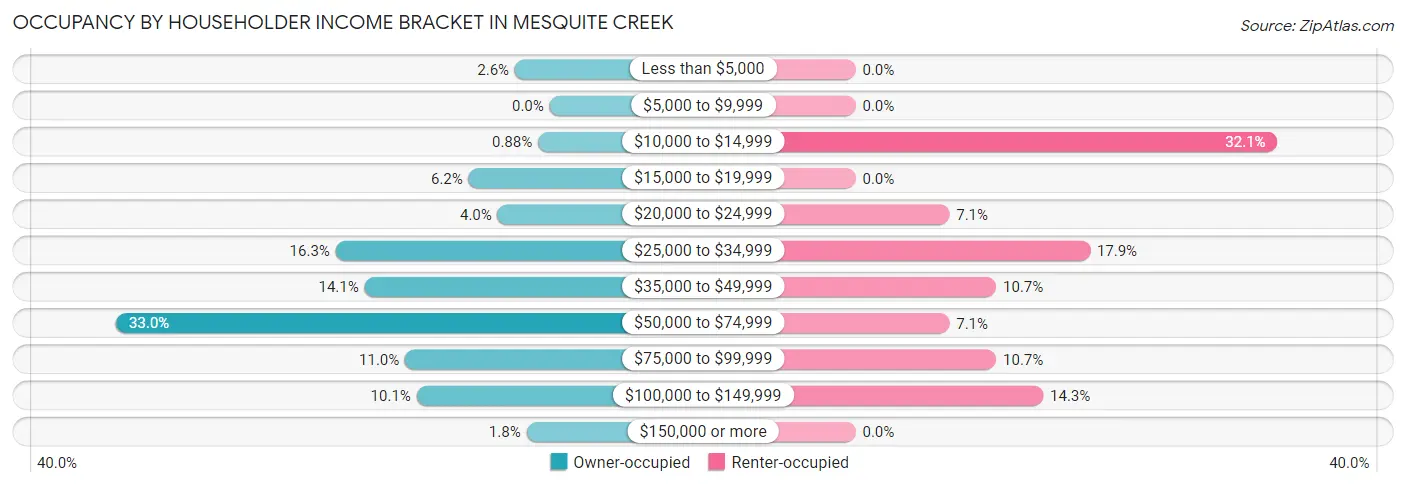
| Income Bracket | Owner-occupied | Renter-occupied |
| Less than $5,000 | 6 (2.6%) | 0 (0.0%) |
| $5,000 to $9,999 | 0 (0.0%) | 0 (0.0%) |
| $10,000 to $14,999 | 2 (0.9%) | 9 (32.1%) |
| $15,000 to $19,999 | 14 (6.2%) | 0 (0.0%) |
| $20,000 to $24,999 | 9 (4.0%) | 2 (7.1%) |
| $25,000 to $34,999 | 37 (16.3%) | 5 (17.9%) |
| $35,000 to $49,999 | 32 (14.1%) | 3 (10.7%) |
| $50,000 to $74,999 | 75 (33.0%) | 2 (7.1%) |
| $75,000 to $99,999 | 25 (11.0%) | 3 (10.7%) |
| $100,000 to $149,999 | 23 (10.1%) | 4 (14.3%) |
| $150,000 or more | 4 (1.8%) | 0 (0.0%) |
| Total | 227 (100.0%) | 28 (100.0%) |
Monthly Housing Cost Tiers in Mesquite Creek
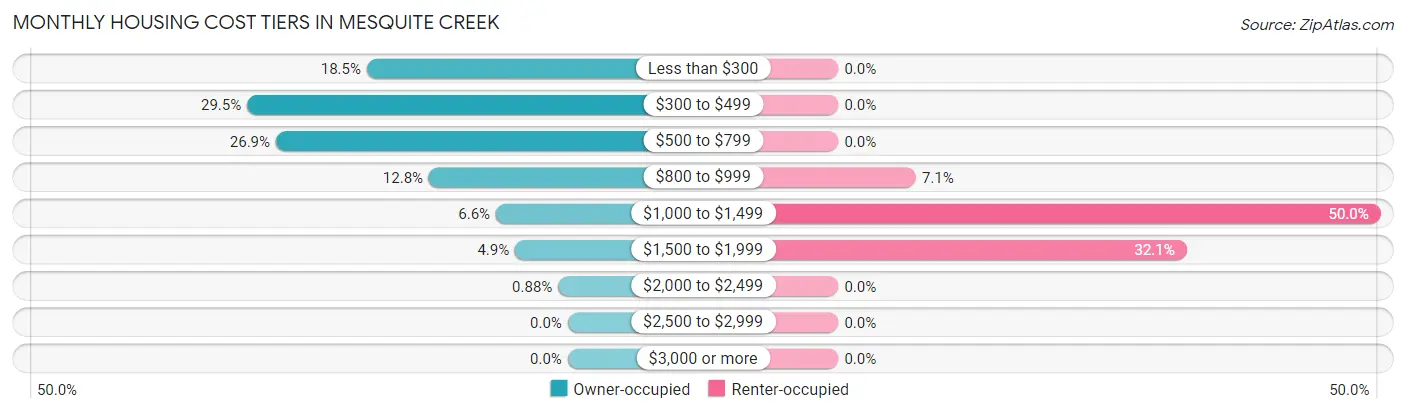
| Monthly Cost | Owner-occupied | Renter-occupied |
| Less than $300 | 42 (18.5%) | 0 (0.0%) |
| $300 to $499 | 67 (29.5%) | 0 (0.0%) |
| $500 to $799 | 61 (26.9%) | 0 (0.0%) |
| $800 to $999 | 29 (12.8%) | 2 (7.1%) |
| $1,000 to $1,499 | 15 (6.6%) | 14 (50.0%) |
| $1,500 to $1,999 | 11 (4.9%) | 9 (32.1%) |
| $2,000 to $2,499 | 2 (0.9%) | 0 (0.0%) |
| $2,500 to $2,999 | 0 (0.0%) | 0 (0.0%) |
| $3,000 or more | 0 (0.0%) | 0 (0.0%) |
| Total | 227 (100.0%) | 28 (100.0%) |
Physical Housing Characteristics in Mesquite Creek
Housing Structures in Mesquite Creek
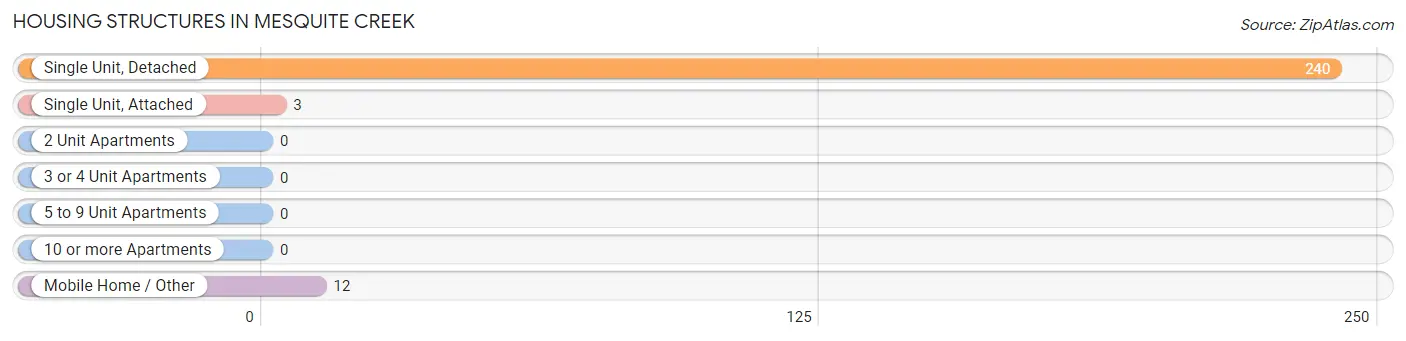
| Structure Type | # Housing Units | % Housing Units |
| Single Unit, Detached | 240 | 94.1% |
| Single Unit, Attached | 3 | 1.2% |
| 2 Unit Apartments | 0 | 0.0% |
| 3 or 4 Unit Apartments | 0 | 0.0% |
| 5 to 9 Unit Apartments | 0 | 0.0% |
| 10 or more Apartments | 0 | 0.0% |
| Mobile Home / Other | 12 | 4.7% |
| Total | 255 | 100.0% |
Housing Structures by Occupancy in Mesquite Creek
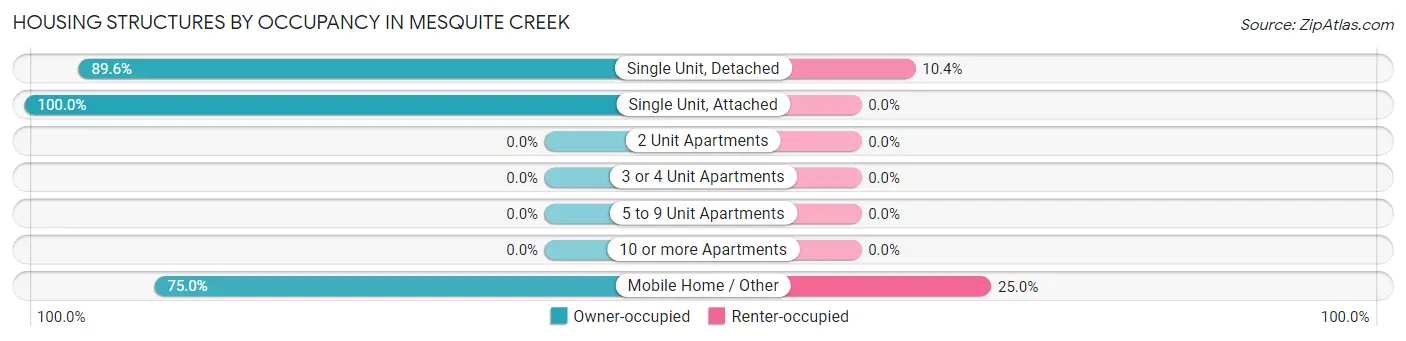
| Structure Type | Owner-occupied | Renter-occupied |
| Single Unit, Detached | 215 (89.6%) | 25 (10.4%) |
| Single Unit, Attached | 3 (100.0%) | 0 (0.0%) |
| 2 Unit Apartments | 0 (0.0%) | 0 (0.0%) |
| 3 or 4 Unit Apartments | 0 (0.0%) | 0 (0.0%) |
| 5 to 9 Unit Apartments | 0 (0.0%) | 0 (0.0%) |
| 10 or more Apartments | 0 (0.0%) | 0 (0.0%) |
| Mobile Home / Other | 9 (75.0%) | 3 (25.0%) |
| Total | 227 (89.0%) | 28 (11.0%) |
Housing Structures by Number of Rooms in Mesquite Creek
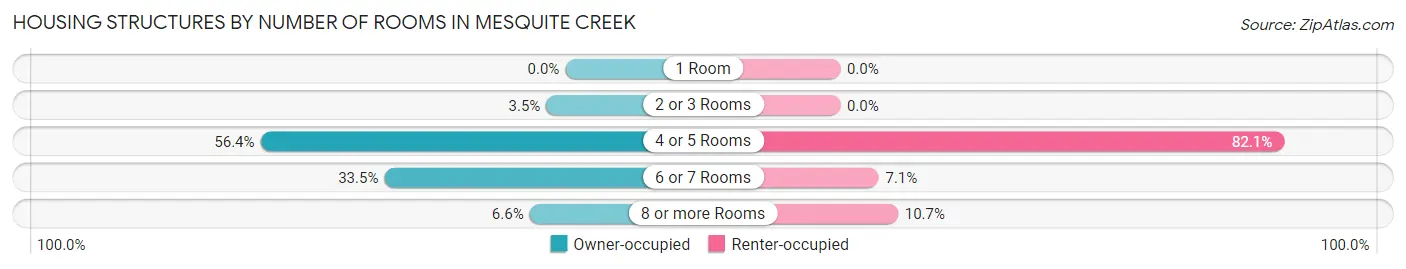
| Number of Rooms | Owner-occupied | Renter-occupied |
| 1 Room | 0 (0.0%) | 0 (0.0%) |
| 2 or 3 Rooms | 8 (3.5%) | 0 (0.0%) |
| 4 or 5 Rooms | 128 (56.4%) | 23 (82.1%) |
| 6 or 7 Rooms | 76 (33.5%) | 2 (7.1%) |
| 8 or more Rooms | 15 (6.6%) | 3 (10.7%) |
| Total | 227 (100.0%) | 28 (100.0%) |
Housing Structure by Heating Type in Mesquite Creek
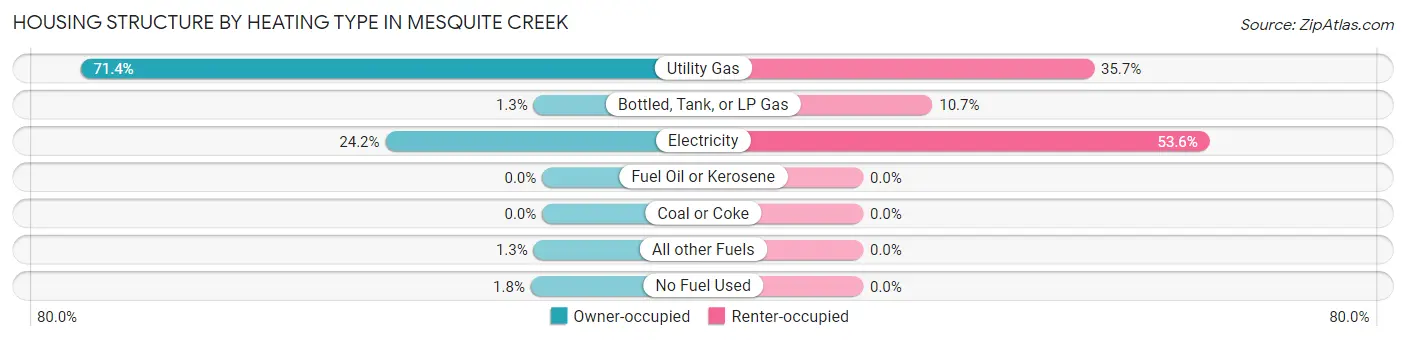
| Heating Type | Owner-occupied | Renter-occupied |
| Utility Gas | 162 (71.4%) | 10 (35.7%) |
| Bottled, Tank, or LP Gas | 3 (1.3%) | 3 (10.7%) |
| Electricity | 55 (24.2%) | 15 (53.6%) |
| Fuel Oil or Kerosene | 0 (0.0%) | 0 (0.0%) |
| Coal or Coke | 0 (0.0%) | 0 (0.0%) |
| All other Fuels | 3 (1.3%) | 0 (0.0%) |
| No Fuel Used | 4 (1.8%) | 0 (0.0%) |
| Total | 227 (100.0%) | 28 (100.0%) |
Household Vehicle Usage in Mesquite Creek
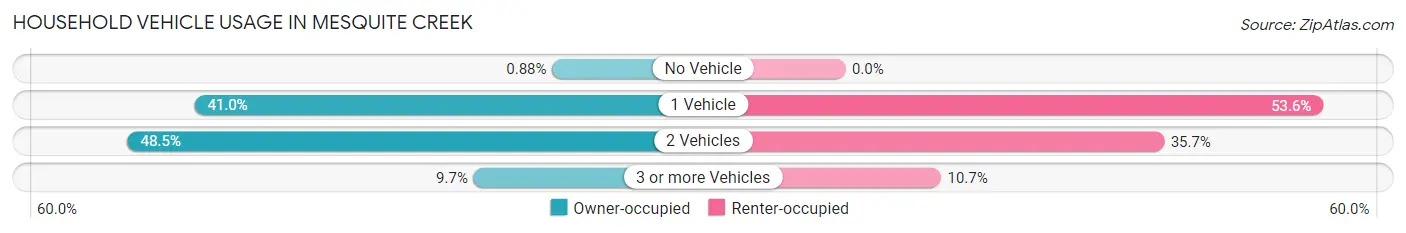
| Vehicles per Household | Owner-occupied | Renter-occupied |
| No Vehicle | 2 (0.9%) | 0 (0.0%) |
| 1 Vehicle | 93 (41.0%) | 15 (53.6%) |
| 2 Vehicles | 110 (48.5%) | 10 (35.7%) |
| 3 or more Vehicles | 22 (9.7%) | 3 (10.7%) |
| Total | 227 (100.0%) | 28 (100.0%) |
Real Estate & Mortgages in Mesquite Creek
Real Estate and Mortgage Overview in Mesquite Creek
| Characteristic | Without Mortgage | With Mortgage |
| Housing Units | 114 | 113 |
| Median Property Value | $170,700 | $154,800 |
| Median Household Income | $52,885 | $0 |
| Monthly Housing Costs | $346 | $0 |
| Real Estate Taxes | $1,063 | $5 |
Property Value by Mortgage Status in Mesquite Creek
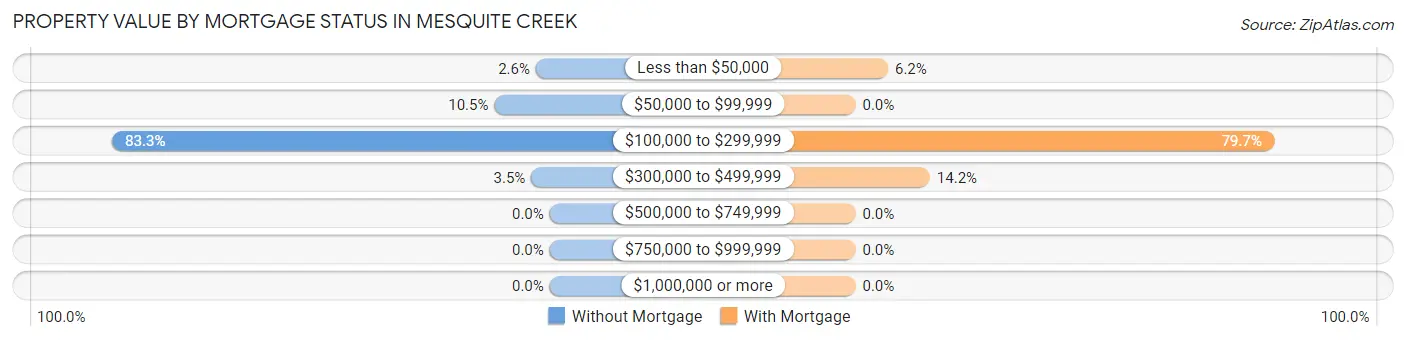
| Property Value | Without Mortgage | With Mortgage |
| Less than $50,000 | 3 (2.6%) | 7 (6.2%) |
| $50,000 to $99,999 | 12 (10.5%) | 0 (0.0%) |
| $100,000 to $299,999 | 95 (83.3%) | 90 (79.6%) |
| $300,000 to $499,999 | 4 (3.5%) | 16 (14.2%) |
| $500,000 to $749,999 | 0 (0.0%) | 0 (0.0%) |
| $750,000 to $999,999 | 0 (0.0%) | 0 (0.0%) |
| $1,000,000 or more | 0 (0.0%) | 0 (0.0%) |
| Total | 114 (100.0%) | 113 (100.0%) |
Household Income by Mortgage Status in Mesquite Creek
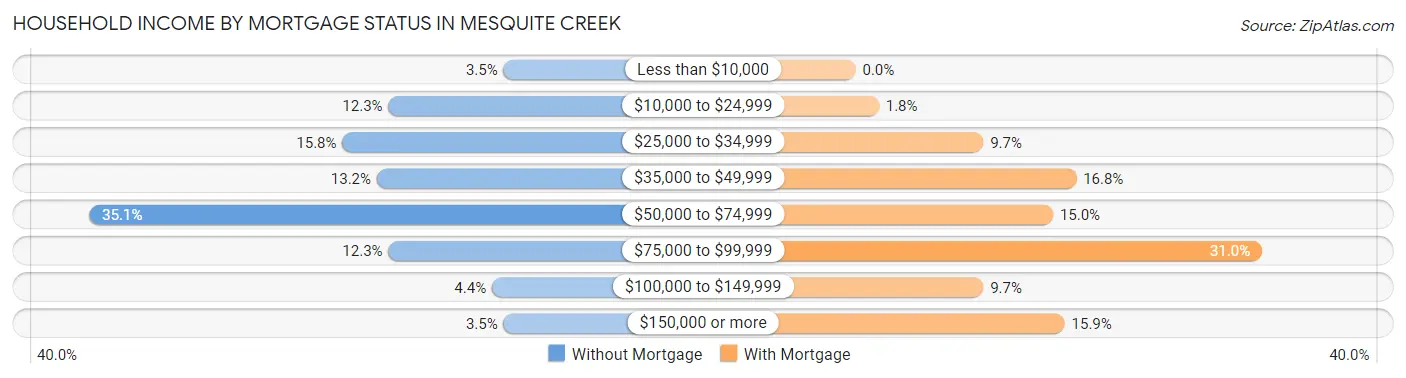
| Household Income | Without Mortgage | With Mortgage |
| Less than $10,000 | 4 (3.5%) | 0 (0.0%) |
| $10,000 to $24,999 | 14 (12.3%) | 2 (1.8%) |
| $25,000 to $34,999 | 18 (15.8%) | 11 (9.7%) |
| $35,000 to $49,999 | 15 (13.2%) | 19 (16.8%) |
| $50,000 to $74,999 | 40 (35.1%) | 17 (15.0%) |
| $75,000 to $99,999 | 14 (12.3%) | 35 (31.0%) |
| $100,000 to $149,999 | 5 (4.4%) | 11 (9.7%) |
| $150,000 or more | 4 (3.5%) | 18 (15.9%) |
| Total | 114 (100.0%) | 113 (100.0%) |
Property Value to Household Income Ratio in Mesquite Creek

| Value-to-Income Ratio | Without Mortgage | With Mortgage |
| Less than 2.0x | 17 (14.9%) | 53,438 (47,290.3%) |
| 2.0x to 2.9x | 42 (36.8%) | 33 (29.2%) |
| 3.0x to 3.9x | 15 (13.2%) | 21 (18.6%) |
| 4.0x or more | 36 (31.6%) | 11 (9.7%) |
| Total | 114 (100.0%) | 113 (100.0%) |
Real Estate Taxes by Mortgage Status in Mesquite Creek
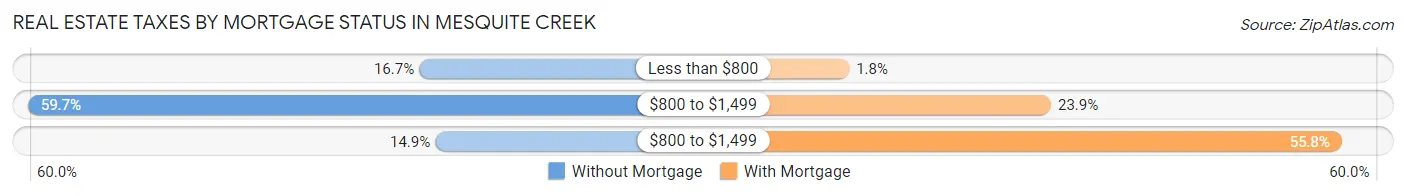
| Property Taxes | Without Mortgage | With Mortgage |
| Less than $800 | 19 (16.7%) | 2 (1.8%) |
| $800 to $1,499 | 68 (59.7%) | 27 (23.9%) |
| $800 to $1,499 | 17 (14.9%) | 63 (55.7%) |
| Total | 114 (100.0%) | 113 (100.0%) |
Health & Disability in Mesquite Creek
Health Insurance Coverage by Age in Mesquite Creek
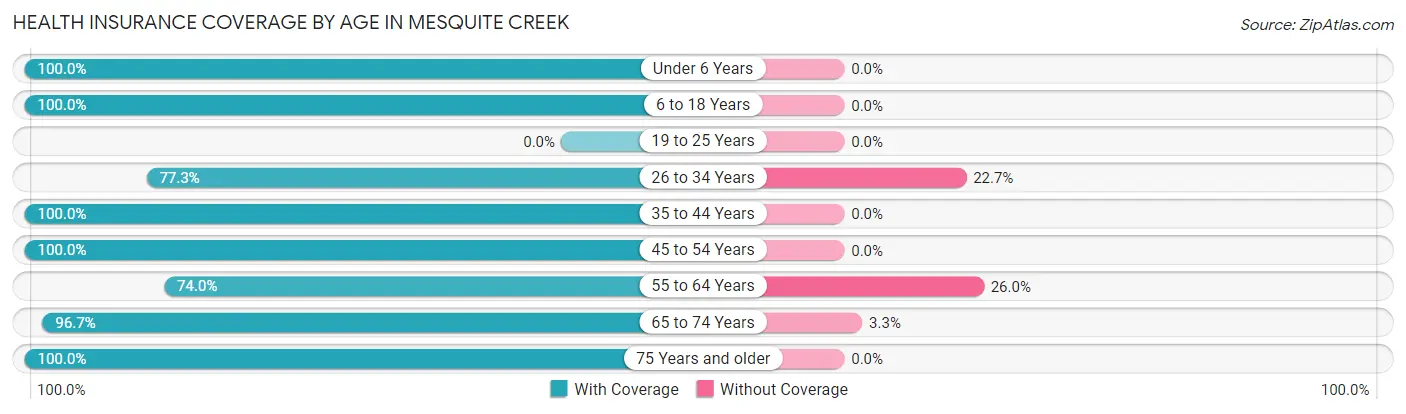
| Age Bracket | With Coverage | Without Coverage |
| Under 6 Years | 8 (100.0%) | 0 (0.0%) |
| 6 to 18 Years | 35 (100.0%) | 0 (0.0%) |
| 19 to 25 Years | 0 (0.0%) | 0 (0.0%) |
| 26 to 34 Years | 17 (77.3%) | 5 (22.7%) |
| 35 to 44 Years | 28 (100.0%) | 0 (0.0%) |
| 45 to 54 Years | 18 (100.0%) | 0 (0.0%) |
| 55 to 64 Years | 74 (74.0%) | 26 (26.0%) |
| 65 to 74 Years | 116 (96.7%) | 4 (3.3%) |
| 75 Years and older | 163 (100.0%) | 0 (0.0%) |
| Total | 459 (92.9%) | 35 (7.1%) |
Health Insurance Coverage by Citizenship Status in Mesquite Creek
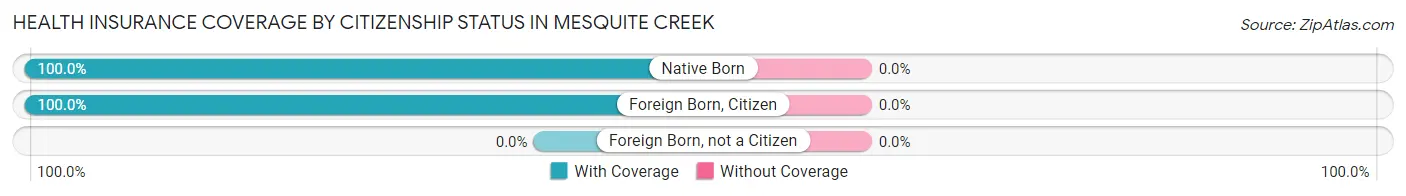
| Citizenship Status | With Coverage | Without Coverage |
| Native Born | 8 (100.0%) | 0 (0.0%) |
| Foreign Born, Citizen | 35 (100.0%) | 0 (0.0%) |
| Foreign Born, not a Citizen | 0 (0.0%) | 0 (0.0%) |
Health Insurance Coverage by Household Income in Mesquite Creek
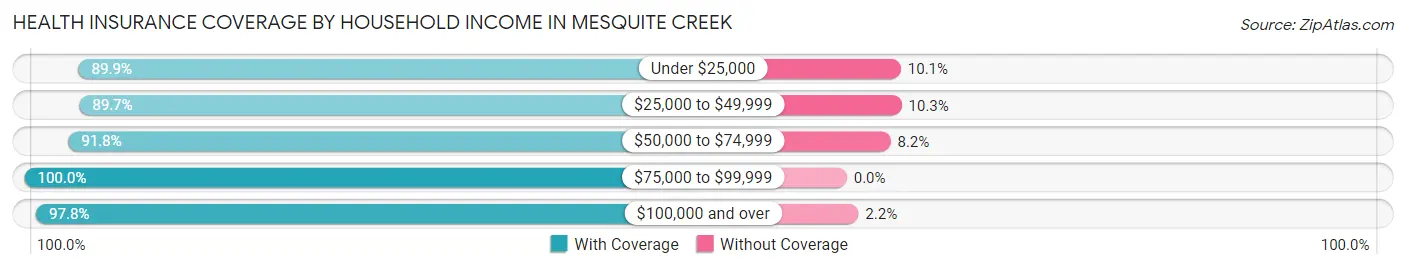
| Household Income | With Coverage | Without Coverage |
| Under $25,000 | 71 (89.9%) | 8 (10.1%) |
| $25,000 to $49,999 | 131 (89.7%) | 15 (10.3%) |
| $50,000 to $74,999 | 112 (91.8%) | 10 (8.2%) |
| $75,000 to $99,999 | 55 (100.0%) | 0 (0.0%) |
| $100,000 and over | 90 (97.8%) | 2 (2.2%) |
Public vs Private Health Insurance Coverage by Age in Mesquite Creek
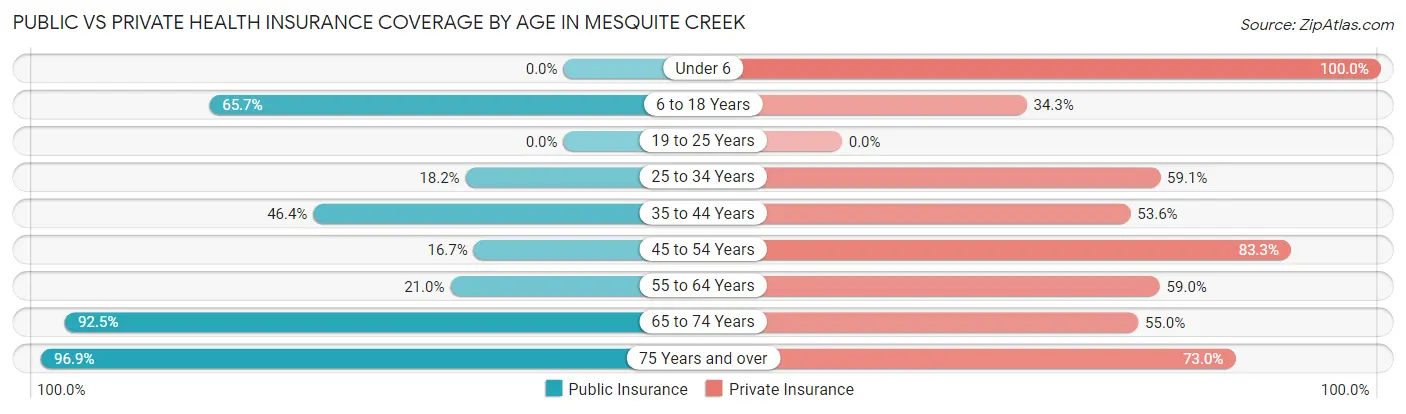
| Age Bracket | Public Insurance | Private Insurance |
| Under 6 | 0 (0.0%) | 8 (100.0%) |
| 6 to 18 Years | 23 (65.7%) | 12 (34.3%) |
| 19 to 25 Years | 0 (0.0%) | 0 (0.0%) |
| 25 to 34 Years | 4 (18.2%) | 13 (59.1%) |
| 35 to 44 Years | 13 (46.4%) | 15 (53.6%) |
| 45 to 54 Years | 3 (16.7%) | 15 (83.3%) |
| 55 to 64 Years | 21 (21.0%) | 59 (59.0%) |
| 65 to 74 Years | 111 (92.5%) | 66 (55.0%) |
| 75 Years and over | 158 (96.9%) | 119 (73.0%) |
| Total | 333 (67.4%) | 307 (62.2%) |
Disability Status by Sex by Age in Mesquite Creek
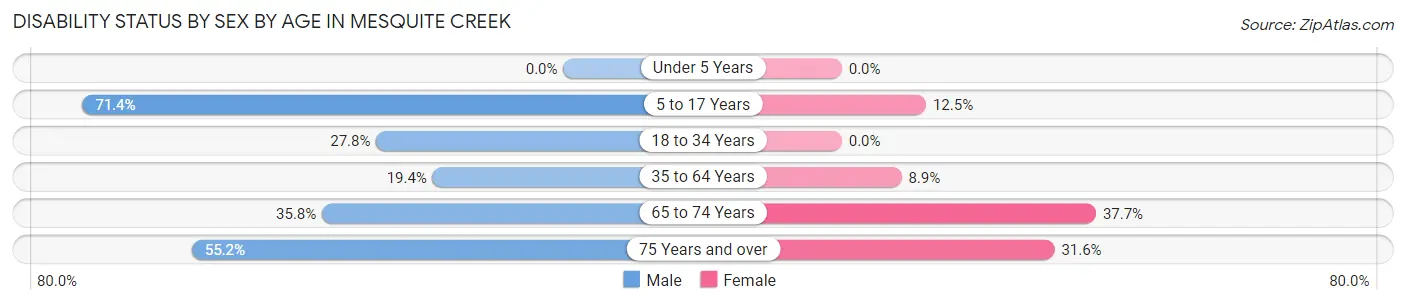
| Age Bracket | Male | Female |
| Under 5 Years | 0 (0.0%) | 0 (0.0%) |
| 5 to 17 Years | 5 (71.4%) | 4 (12.5%) |
| 18 to 34 Years | 5 (27.8%) | 0 (0.0%) |
| 35 to 64 Years | 13 (19.4%) | 7 (8.9%) |
| 65 to 74 Years | 24 (35.8%) | 20 (37.7%) |
| 75 Years and over | 48 (55.2%) | 24 (31.6%) |
Disability Class by Sex by Age in Mesquite Creek
Disability Class: Hearing Difficulty
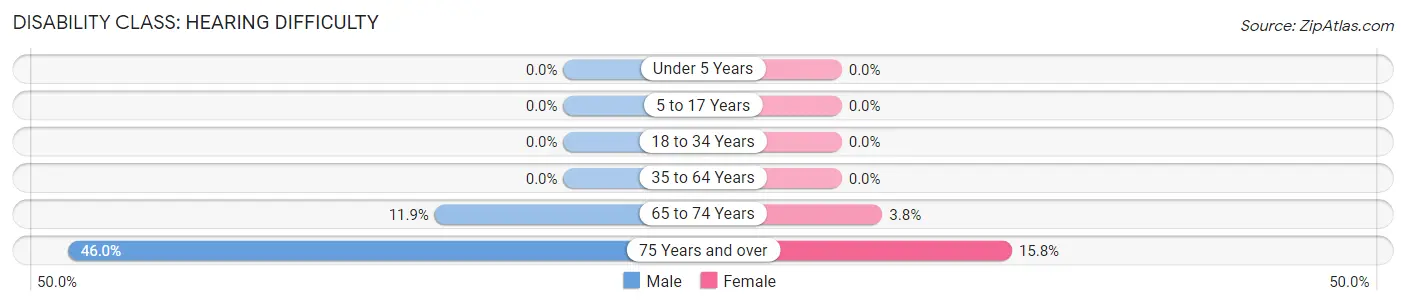
| Age Bracket | Male | Female |
| Under 5 Years | 0 (0.0%) | 0 (0.0%) |
| 5 to 17 Years | 0 (0.0%) | 0 (0.0%) |
| 18 to 34 Years | 0 (0.0%) | 0 (0.0%) |
| 35 to 64 Years | 0 (0.0%) | 0 (0.0%) |
| 65 to 74 Years | 8 (11.9%) | 2 (3.8%) |
| 75 Years and over | 40 (46.0%) | 12 (15.8%) |
Disability Class: Vision Difficulty
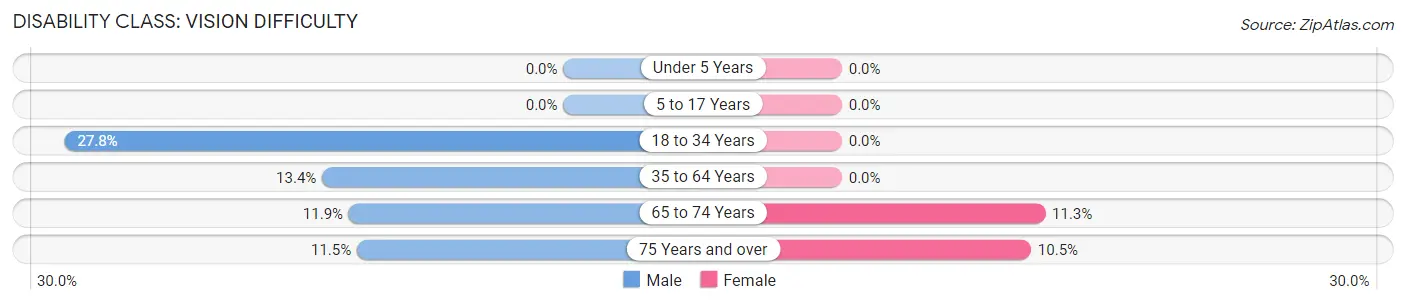
| Age Bracket | Male | Female |
| Under 5 Years | 0 (0.0%) | 0 (0.0%) |
| 5 to 17 Years | 0 (0.0%) | 0 (0.0%) |
| 18 to 34 Years | 5 (27.8%) | 0 (0.0%) |
| 35 to 64 Years | 9 (13.4%) | 0 (0.0%) |
| 65 to 74 Years | 8 (11.9%) | 6 (11.3%) |
| 75 Years and over | 10 (11.5%) | 8 (10.5%) |
Disability Class: Cognitive Difficulty
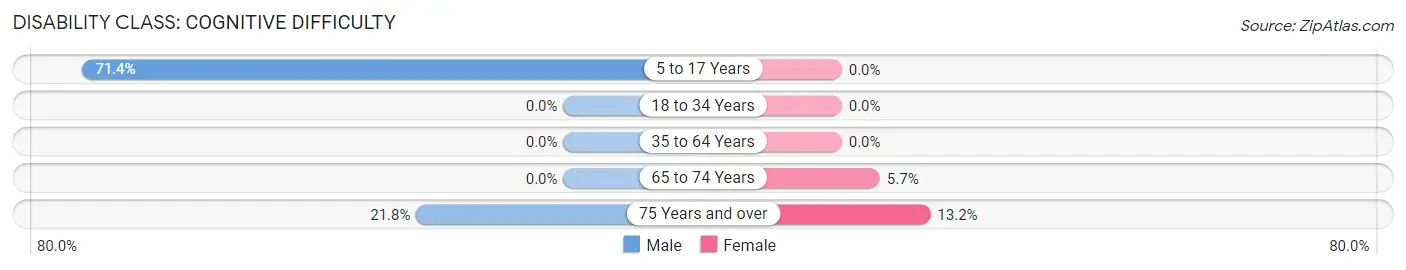
| Age Bracket | Male | Female |
| 5 to 17 Years | 5 (71.4%) | 0 (0.0%) |
| 18 to 34 Years | 0 (0.0%) | 0 (0.0%) |
| 35 to 64 Years | 0 (0.0%) | 0 (0.0%) |
| 65 to 74 Years | 0 (0.0%) | 3 (5.7%) |
| 75 Years and over | 19 (21.8%) | 10 (13.2%) |
Disability Class: Ambulatory Difficulty
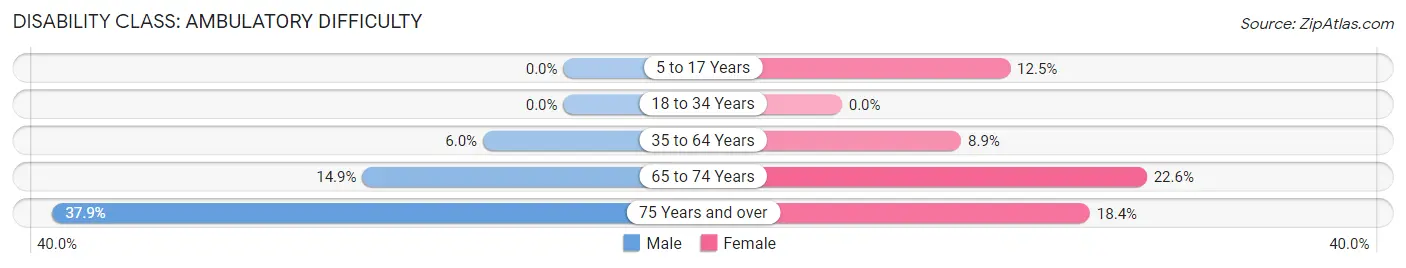
| Age Bracket | Male | Female |
| 5 to 17 Years | 0 (0.0%) | 4 (12.5%) |
| 18 to 34 Years | 0 (0.0%) | 0 (0.0%) |
| 35 to 64 Years | 4 (6.0%) | 7 (8.9%) |
| 65 to 74 Years | 10 (14.9%) | 12 (22.6%) |
| 75 Years and over | 33 (37.9%) | 14 (18.4%) |
Disability Class: Self-Care Difficulty
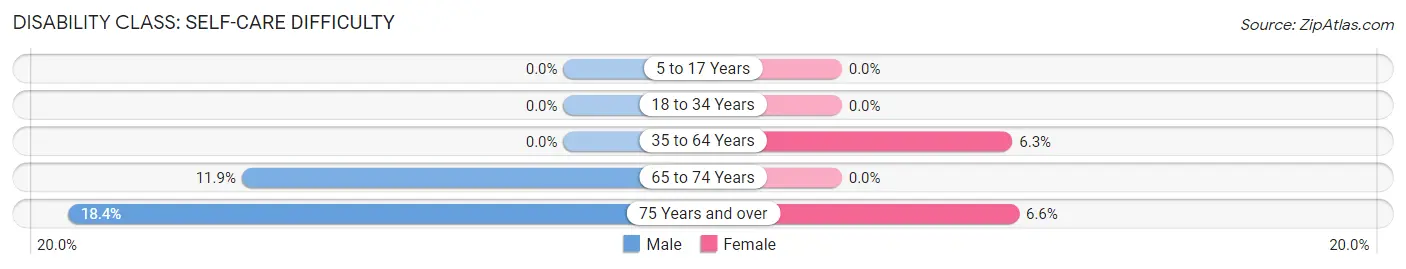
| Age Bracket | Male | Female |
| 5 to 17 Years | 0 (0.0%) | 0 (0.0%) |
| 18 to 34 Years | 0 (0.0%) | 0 (0.0%) |
| 35 to 64 Years | 0 (0.0%) | 5 (6.3%) |
| 65 to 74 Years | 8 (11.9%) | 0 (0.0%) |
| 75 Years and over | 16 (18.4%) | 5 (6.6%) |
Technology Access in Mesquite Creek
Computing Device Access in Mesquite Creek
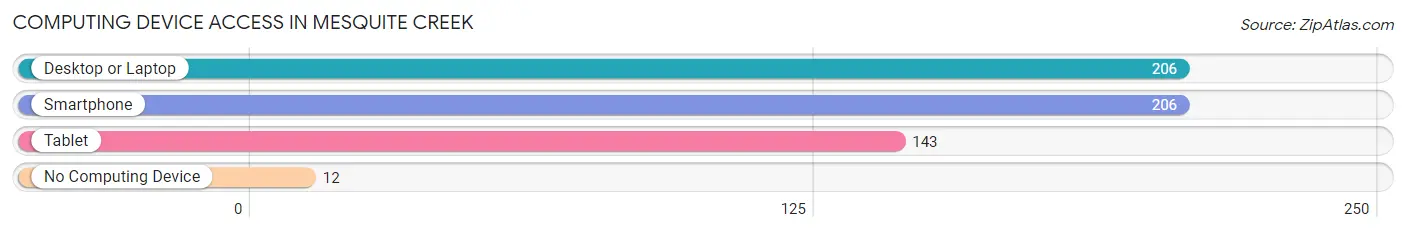
| Device Type | # Households | % Households |
| Desktop or Laptop | 206 | 80.8% |
| Smartphone | 206 | 80.8% |
| Tablet | 143 | 56.1% |
| No Computing Device | 12 | 4.7% |
| Total | 255 | 100.0% |
Internet Access in Mesquite Creek
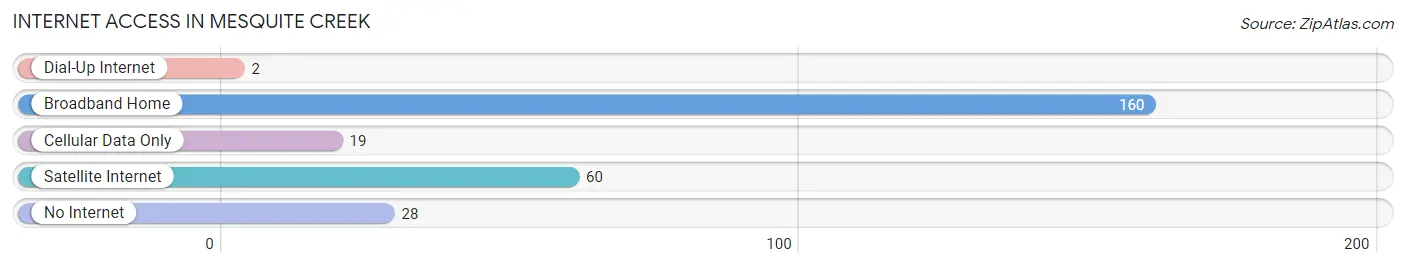
| Internet Type | # Households | % Households |
| Dial-Up Internet | 2 | 0.8% |
| Broadband Home | 160 | 62.7% |
| Cellular Data Only | 19 | 7.4% |
| Satellite Internet | 60 | 23.5% |
| No Internet | 28 | 11.0% |
| Total | 255 | 100.0% |
Mesquite Creek Summary
Mesquite Creek is a small unincorporated community located in the state of Arizona, in the United States. It is situated in the northern part of the state, in Coconino County, and is located approximately 25 miles south of Flagstaff. The community is situated in a rural area, surrounded by the Coconino National Forest and the Kaibab National Forest.
History
Mesquite Creek was first settled in the late 1800s by a group of Mormon settlers. The settlers were looking for a place to build a new community and chose the area due to its proximity to the nearby forests and the abundance of mesquite trees. The settlers named the community after the mesquite trees, and the creek that ran through the area.
The community grew slowly over the years, and by the early 1900s, it had become a small but thriving community. The town had a post office, a general store, a school, and a few other businesses. The town was also home to a number of ranches, which provided the community with much of its income.
In the 1950s, the town began to decline as many of the residents moved away in search of better opportunities. By the 1970s, the town had become a virtual ghost town, with only a few residents remaining. In the 1980s, the town began to experience a resurgence as new residents moved in and began to restore the town. Today, the town is still small, but it is slowly growing and is home to a number of businesses and services.
Geography
Mesquite Creek is located in the northern part of Arizona, in Coconino County. The town is situated in a rural area, surrounded by the Coconino National Forest and the Kaibab National Forest. The town is located approximately 25 miles south of Flagstaff, and is situated at an elevation of 5,400 feet.
The climate in Mesquite Creek is semi-arid, with hot summers and cold winters. The average temperature in the summer is around 90 degrees Fahrenheit, while the average temperature in the winter is around 30 degrees Fahrenheit. The town receives an average of 12 inches of precipitation per year, with most of it falling in the summer months.
Economy
Mesquite Creek is a small, rural community with a limited economy. The town is home to a few small businesses, including a general store, a post office, and a few other services. The town is also home to a number of ranches, which provide the community with much of its income.
The town is also home to a number of tourist attractions, including the nearby Coconino National Forest and the Kaibab National Forest. The town is also home to a number of outdoor recreation activities, including camping, hiking, fishing, and hunting.
Demographics
As of the 2010 census, the population of Mesquite Creek was 545. The racial makeup of the town was 95.3% White, 0.7% Native American, 0.2% Asian, 0.2% from other races, and 3.6% from two or more races. The median household income in the town was $37,500, and the median age was 44.5 years.
Conclusion
Mesquite Creek is a small, rural community located in the northern part of Arizona. The town was first settled in the late 1800s by a group of Mormon settlers, and has since grown into a small but thriving community. The town is home to a few small businesses, as well as a number of ranches and tourist attractions. The town has a population of 545, with a median household income of $37,500 and a median age of 44.5 years.
Common Questions
What is Per Capita Income in Mesquite Creek?
Per Capita income in Mesquite Creek is $31,644.
What is the Median Family Income in Mesquite Creek?
Median Family Income in Mesquite Creek is $52,614.
What is the Median Household income in Mesquite Creek?
Median Household Income in Mesquite Creek is $52,125.
What is Inequality or Gini Index in Mesquite Creek?
Inequality or Gini Index in Mesquite Creek is 0.36.
What is the Total Population of Mesquite Creek?
Total Population of Mesquite Creek is 494.
What is the Total Male Population of Mesquite Creek?
Total Male Population of Mesquite Creek is 246.
What is the Total Female Population of Mesquite Creek?
Total Female Population of Mesquite Creek is 248.
What is the Ratio of Males per 100 Females in Mesquite Creek?
There are 99.19 Males per 100 Females in Mesquite Creek.
What is the Ratio of Females per 100 Males in Mesquite Creek?
There are 100.81 Females per 100 Males in Mesquite Creek.
What is the Median Population Age in Mesquite Creek?
Median Population Age in Mesquite Creek is 67.2 Years.
What is the Average Family Size in Mesquite Creek
Average Family Size in Mesquite Creek is 2.4 People.
What is the Average Household Size in Mesquite Creek
Average Household Size in Mesquite Creek is 1.9 People.
How Large is the Labor Force in Mesquite Creek?
There are 134 People in the Labor Forcein in Mesquite Creek.
What is the Percentage of People in the Labor Force in Mesquite Creek?
29.5% of People are in the Labor Force in Mesquite Creek.
What is the Unemployment Rate in Mesquite Creek?
Unemployment Rate in Mesquite Creek is 3.7%.