Cibecue, AZ Map & Demographics
Cibecue Map
Cibecue Overview
$7,328
PER CAPITA INCOME
$20,938
AVG FAMILY INCOME
$18,250
AVG HOUSEHOLD INCOME
31.0%
WAGE / INCOME GAP [ % ]
69.0¢/ $1
WAGE / INCOME GAP [ $ ]
0.45
INEQUALITY / GINI INDEX
1,419
TOTAL POPULATION
657
MALE POPULATION
762
FEMALE POPULATION
86.22
MALES / 100 FEMALES
115.98
FEMALES / 100 MALES
25.1
MEDIAN AGE
5.0
AVG FAMILY SIZE
4.0
AVG HOUSEHOLD SIZE
405
LABOR FORCE [ PEOPLE ]
46.8%
PERCENT IN LABOR FORCE
16.3%
UNEMPLOYMENT RATE
Cibecue Zip Codes
Cibecue Area Codes
Income in Cibecue
Income Overview in Cibecue
Per Capita Income in Cibecue is $7,328, while median incomes of families and households are $20,938 and $18,250 respectively.
| Characteristic | Number | Measure |
| Per Capita Income | 1,419 | $7,328 |
| Median Family Income | 243 | $20,938 |
| Mean Family Income | 243 | $29,732 |
| Median Household Income | 357 | $18,250 |
| Mean Household Income | 357 | $27,924 |
| Income Deficit | 243 | $0 |
| Wage / Income Gap (%) | 1,419 | 30.97% |
| Wage / Income Gap ($) | 1,419 | 69.03¢ per $1 |
| Gini / Inequality Index | 1,419 | 0.45 |
Earnings by Sex in Cibecue
Average Earnings in Cibecue are $11,691, $8,862 for men and $12,837 for women, a difference of 31.0%.
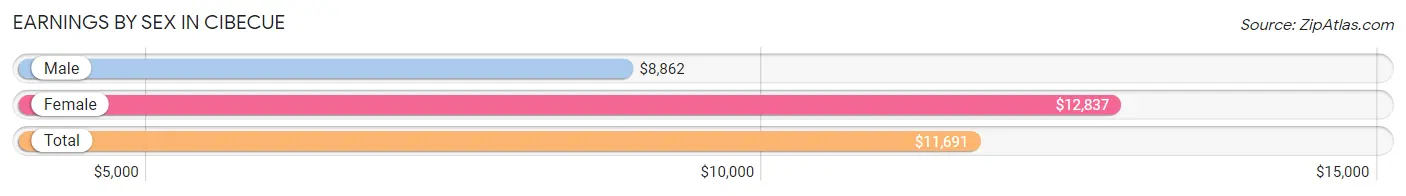
| Sex | Number | Average Earnings |
| Male | 211 (47.1%) | $8,862 |
| Female | 237 (52.9%) | $12,837 |
| Total | 448 (100.0%) | $11,691 |
Earnings by Sex by Income Bracket in Cibecue
The most common earnings brackets in Cibecue are $7,500 to $9,999 for men (56 | 26.5%) and $10,000 to $12,499 for women (68 | 28.7%).
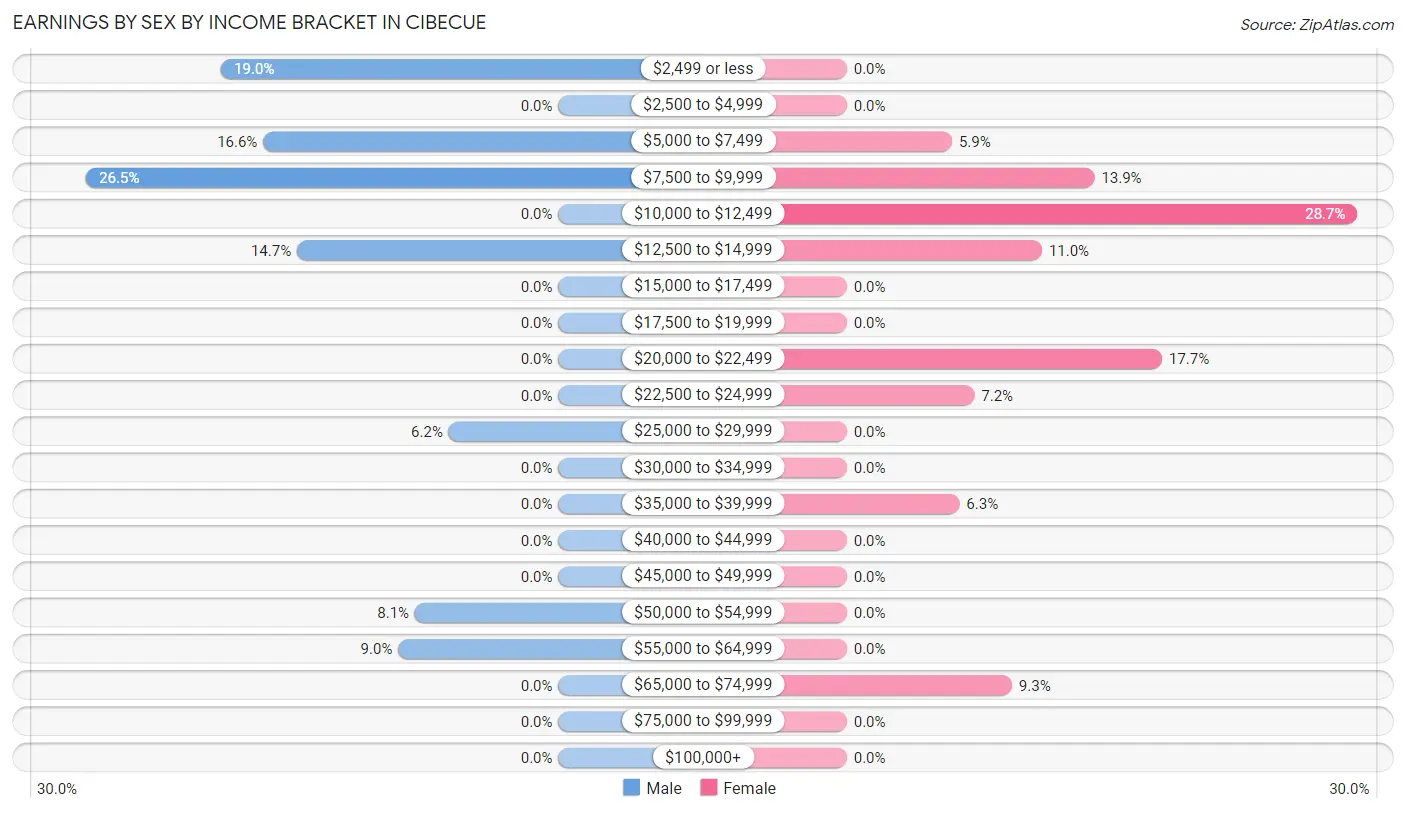
| Income | Male | Female |
| $2,499 or less | 40 (19.0%) | 0 (0.0%) |
| $2,500 to $4,999 | 0 (0.0%) | 0 (0.0%) |
| $5,000 to $7,499 | 35 (16.6%) | 14 (5.9%) |
| $7,500 to $9,999 | 56 (26.5%) | 33 (13.9%) |
| $10,000 to $12,499 | 0 (0.0%) | 68 (28.7%) |
| $12,500 to $14,999 | 31 (14.7%) | 26 (11.0%) |
| $15,000 to $17,499 | 0 (0.0%) | 0 (0.0%) |
| $17,500 to $19,999 | 0 (0.0%) | 0 (0.0%) |
| $20,000 to $22,499 | 0 (0.0%) | 42 (17.7%) |
| $22,500 to $24,999 | 0 (0.0%) | 17 (7.2%) |
| $25,000 to $29,999 | 13 (6.2%) | 0 (0.0%) |
| $30,000 to $34,999 | 0 (0.0%) | 0 (0.0%) |
| $35,000 to $39,999 | 0 (0.0%) | 15 (6.3%) |
| $40,000 to $44,999 | 0 (0.0%) | 0 (0.0%) |
| $45,000 to $49,999 | 0 (0.0%) | 0 (0.0%) |
| $50,000 to $54,999 | 17 (8.1%) | 0 (0.0%) |
| $55,000 to $64,999 | 19 (9.0%) | 0 (0.0%) |
| $65,000 to $74,999 | 0 (0.0%) | 22 (9.3%) |
| $75,000 to $99,999 | 0 (0.0%) | 0 (0.0%) |
| $100,000+ | 0 (0.0%) | 0 (0.0%) |
| Total | 211 (100.0%) | 237 (100.0%) |
Earnings by Sex by Educational Attainment in Cibecue
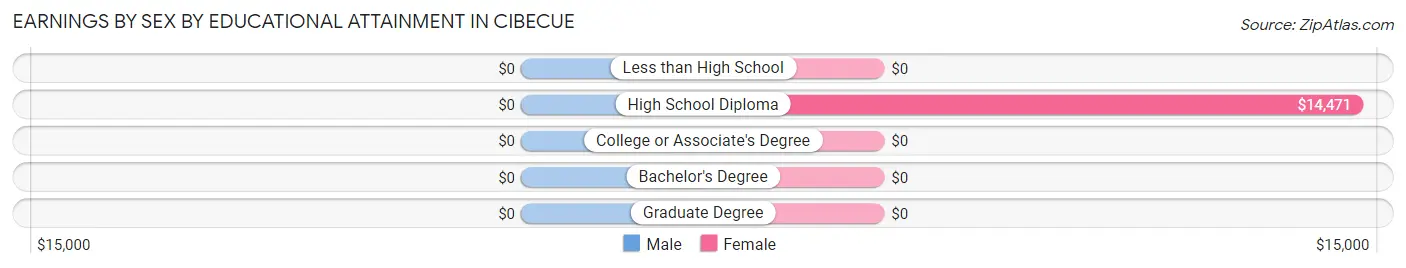
| Educational Attainment | Male Income | Female Income |
| Less than High School | - | - |
| High School Diploma | - | - |
| College or Associate's Degree | - | - |
| Bachelor's Degree | - | - |
| Graduate Degree | - | - |
| Total | $8,973 | $14,808 |
Family Income in Cibecue
Family Income Brackets in Cibecue
According to the Cibecue family income data, there are 58 families falling into the $15,000 to $24,999 income range, which is the most common income bracket and makes up 23.9% of all families.
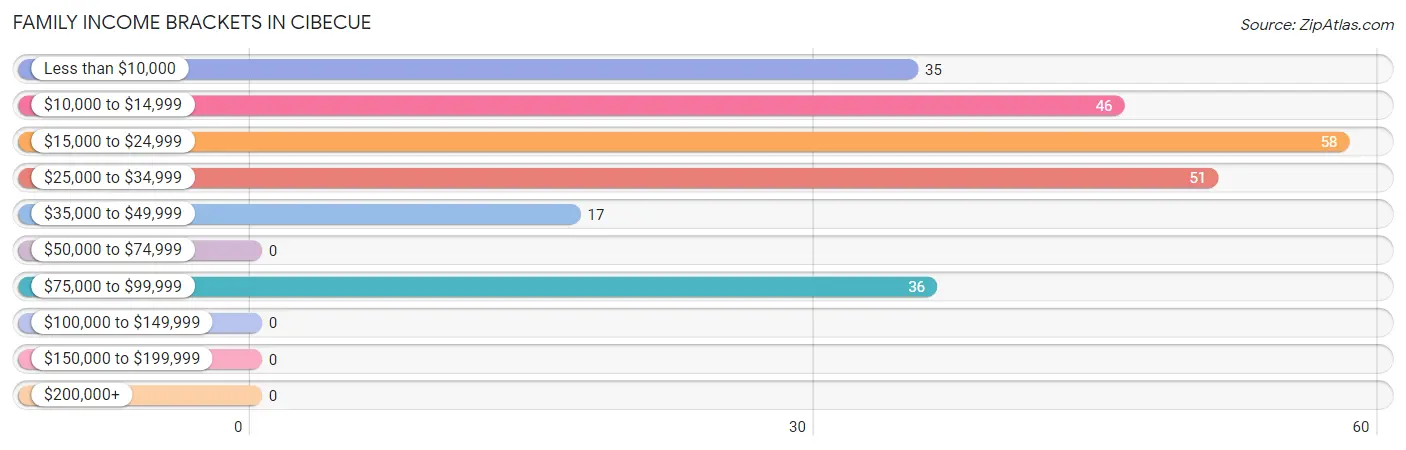
| Income Bracket | # Families | % Families |
| Less than $10,000 | 35 | 14.4% |
| $10,000 to $14,999 | 46 | 18.9% |
| $15,000 to $24,999 | 58 | 23.9% |
| $25,000 to $34,999 | 51 | 21.0% |
| $35,000 to $49,999 | 17 | 7.0% |
| $50,000 to $74,999 | 0 | 0.0% |
| $75,000 to $99,999 | 36 | 14.8% |
| $100,000 to $149,999 | 0 | 0.0% |
| $150,000 to $199,999 | 0 | 0.0% |
| $200,000+ | 0 | 0.0% |
Family Income by Famaliy Size in Cibecue
4-person families (107 | 44.0%) account for the highest median family income in Cibecue with $27,417 per family, while 4-person families (107 | 44.0%) have the highest median income of $6,854 per family member.
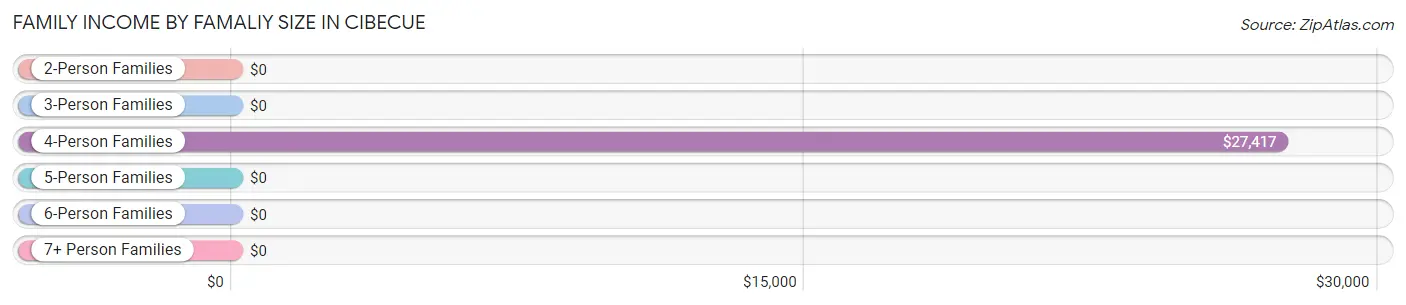
| Income Bracket | # Families | Median Income |
| 2-Person Families | 35 (14.4%) | $0 |
| 3-Person Families | 16 (6.6%) | $0 |
| 4-Person Families | 107 (44.0%) | $27,417 |
| 5-Person Families | 14 (5.8%) | $0 |
| 6-Person Families | 47 (19.3%) | $0 |
| 7+ Person Families | 24 (9.9%) | $0 |
| Total | 243 (100.0%) | $20,938 |
Family Income by Number of Earners in Cibecue
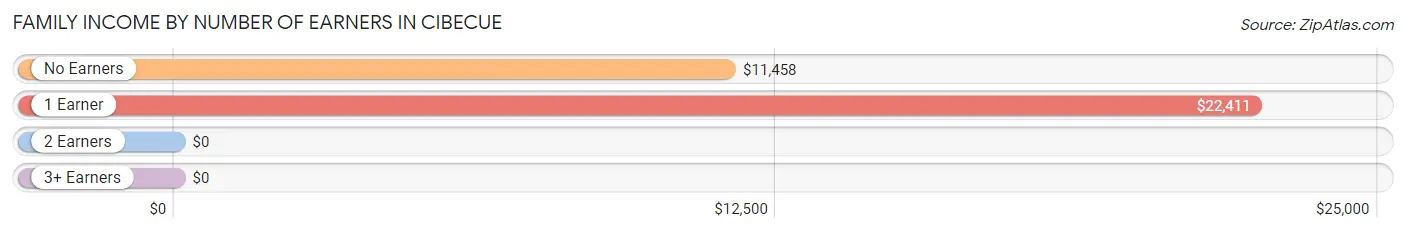
| Number of Earners | # Families | Median Income |
| No Earners | 70 (28.8%) | $11,458 |
| 1 Earner | 108 (44.4%) | $22,411 |
| 2 Earners | 46 (18.9%) | $0 |
| 3+ Earners | 19 (7.8%) | $0 |
| Total | 243 (100.0%) | $20,938 |
Household Income in Cibecue
Household Income Brackets in Cibecue
With 99 households falling in the category, the $15,000 to $24,999 income range is the most frequent in Cibecue, accounting for 27.7% of all households.
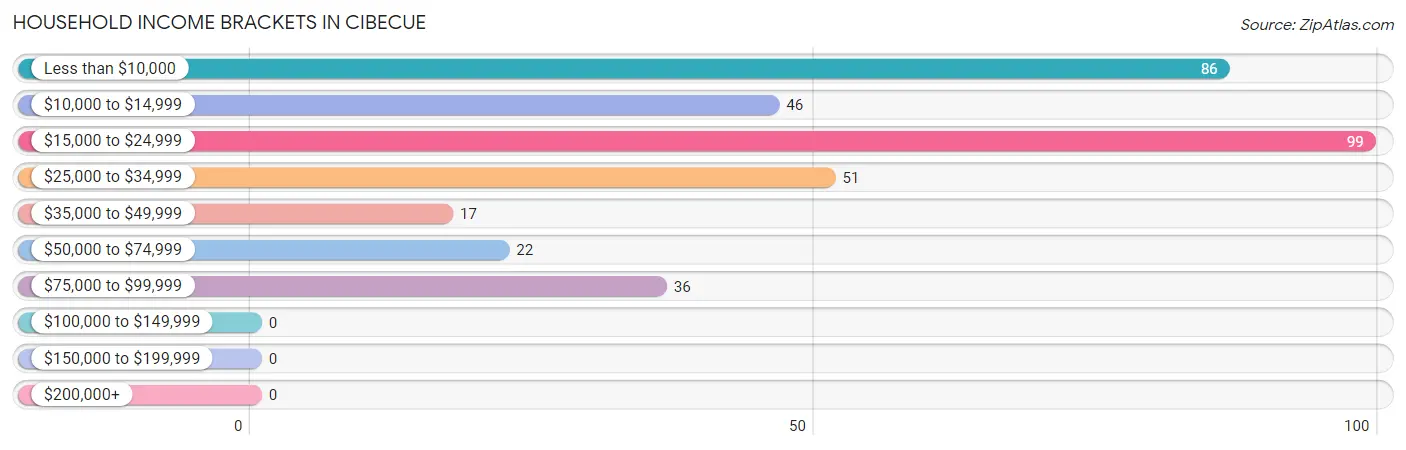
| Income Bracket | # Households | % Households |
| Less than $10,000 | 86 | 24.1% |
| $10,000 to $14,999 | 46 | 12.9% |
| $15,000 to $24,999 | 99 | 27.7% |
| $25,000 to $34,999 | 51 | 14.3% |
| $35,000 to $49,999 | 17 | 4.8% |
| $50,000 to $74,999 | 22 | 6.2% |
| $75,000 to $99,999 | 36 | 10.1% |
| $100,000 to $149,999 | 0 | 0.0% |
| $150,000 to $199,999 | 0 | 0.0% |
| $200,000+ | 0 | 0.0% |
Household Income by Householder Age in Cibecue
The median household income in Cibecue is $18,250, with the highest median household income of $23,080 found in the 25 to 44 years age bracket for the primary householder. A total of 119 households (33.3%) fall into this category. Meanwhile, the 15 to 24 years age bracket for the primary householder has the lowest median household income of $0, with 28 households (7.8%) in this group.
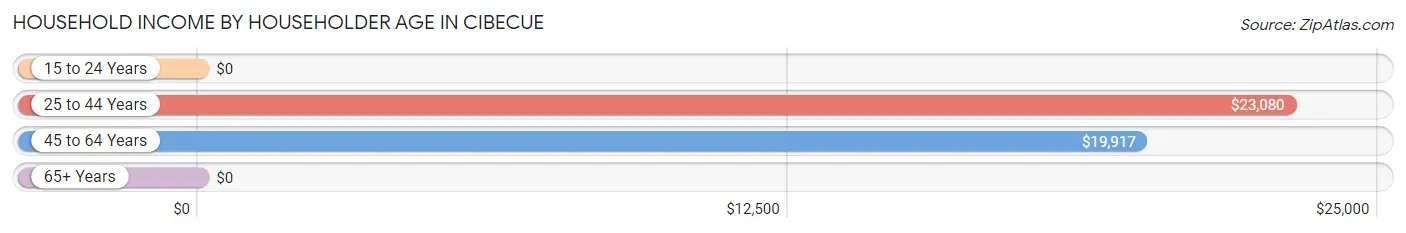
| Income Bracket | # Households | Median Income |
| 15 to 24 Years | 28 (7.8%) | $0 |
| 25 to 44 Years | 119 (33.3%) | $23,080 |
| 45 to 64 Years | 145 (40.6%) | $19,917 |
| 65+ Years | 65 (18.2%) | $0 |
| Total | 357 (100.0%) | $18,250 |
Poverty in Cibecue
Income Below Poverty by Sex and Age in Cibecue
With 82.2% poverty level for males and 70.9% for females among the residents of Cibecue, 12 to 14 year old males and 5 year old females are the most vulnerable to poverty, with 67 males (100.0%) and 14 females (100.0%) in their respective age groups living below the poverty level.
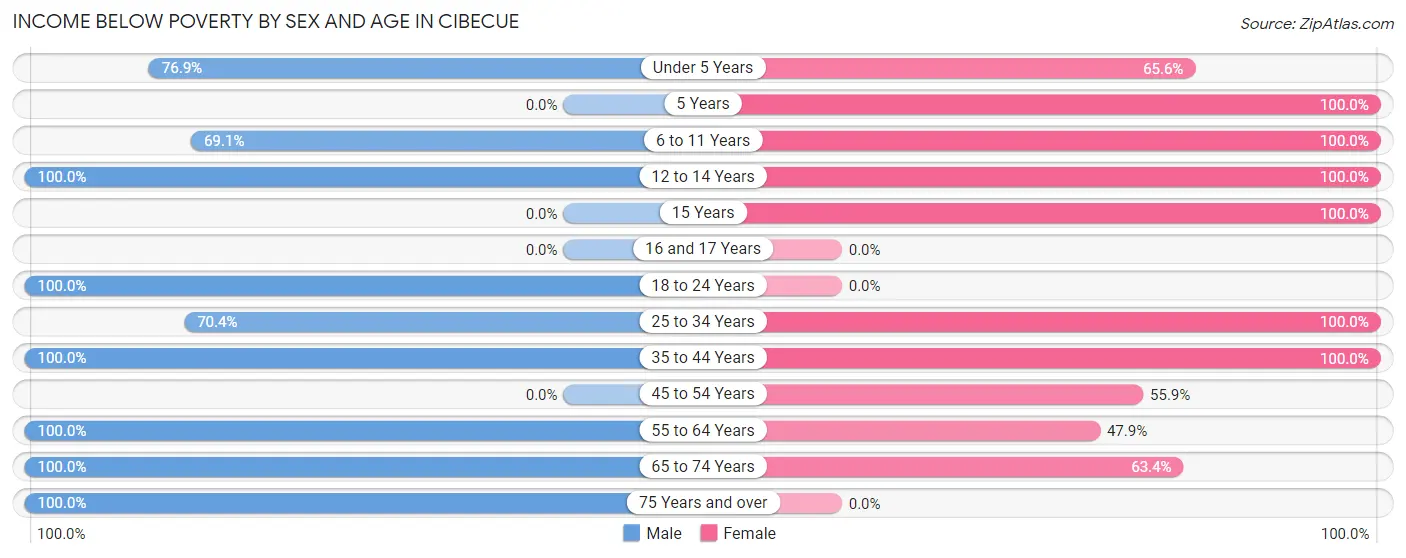
| Age Bracket | Male | Female |
| Under 5 Years | 40 (76.9%) | 61 (65.6%) |
| 5 Years | 0 (0.0%) | 14 (100.0%) |
| 6 to 11 Years | 85 (69.1%) | 88 (100.0%) |
| 12 to 14 Years | 67 (100.0%) | 66 (100.0%) |
| 15 Years | 0 (0.0%) | 50 (100.0%) |
| 16 and 17 Years | 0 (0.0%) | 0 (0.0%) |
| 18 to 24 Years | 47 (100.0%) | 0 (0.0%) |
| 25 to 34 Years | 114 (70.4%) | 129 (100.0%) |
| 35 to 44 Years | 108 (100.0%) | 27 (100.0%) |
| 45 to 54 Years | 0 (0.0%) | 33 (55.9%) |
| 55 to 64 Years | 28 (100.0%) | 46 (47.9%) |
| 65 to 74 Years | 28 (100.0%) | 26 (63.4%) |
| 75 Years and over | 23 (100.0%) | 0 (0.0%) |
| Total | 540 (82.2%) | 540 (70.9%) |
Income Above Poverty by Sex and Age in Cibecue
According to the poverty statistics in Cibecue, males aged 45 to 54 years and females aged 16 and 17 years are the age groups that are most secure financially, with 100.0% of males and 100.0% of females in these age groups living above the poverty line.
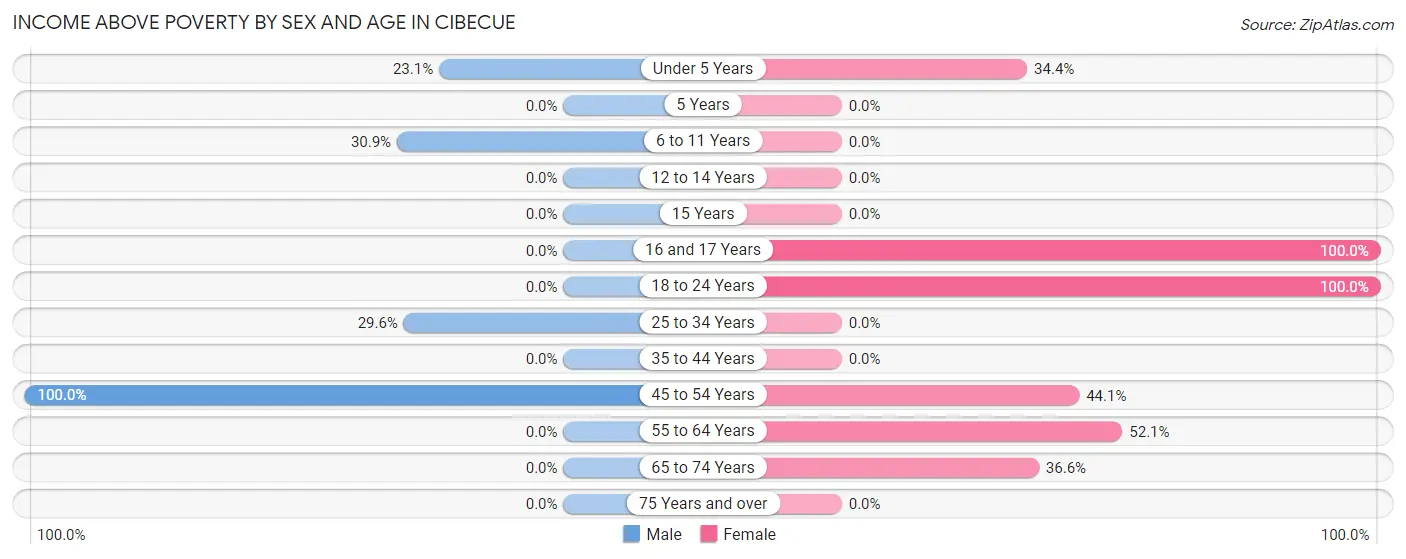
| Age Bracket | Male | Female |
| Under 5 Years | 12 (23.1%) | 32 (34.4%) |
| 5 Years | 0 (0.0%) | 0 (0.0%) |
| 6 to 11 Years | 38 (30.9%) | 0 (0.0%) |
| 12 to 14 Years | 0 (0.0%) | 0 (0.0%) |
| 15 Years | 0 (0.0%) | 0 (0.0%) |
| 16 and 17 Years | 0 (0.0%) | 24 (100.0%) |
| 18 to 24 Years | 0 (0.0%) | 75 (100.0%) |
| 25 to 34 Years | 48 (29.6%) | 0 (0.0%) |
| 35 to 44 Years | 0 (0.0%) | 0 (0.0%) |
| 45 to 54 Years | 19 (100.0%) | 26 (44.1%) |
| 55 to 64 Years | 0 (0.0%) | 50 (52.1%) |
| 65 to 74 Years | 0 (0.0%) | 15 (36.6%) |
| 75 Years and over | 0 (0.0%) | 0 (0.0%) |
| Total | 117 (17.8%) | 222 (29.1%) |
Income Below Poverty Among Married-Couple Families in Cibecue
The poverty statistics for married-couple families in Cibecue show that 58.6% or 51 of the total 87 families live below the poverty line. Families with no children have the highest poverty rate of 100.0%, comprising of 15 families. On the other hand, families with 1 or 2 children have the lowest poverty rate of 29.4%, which includes 15 families.
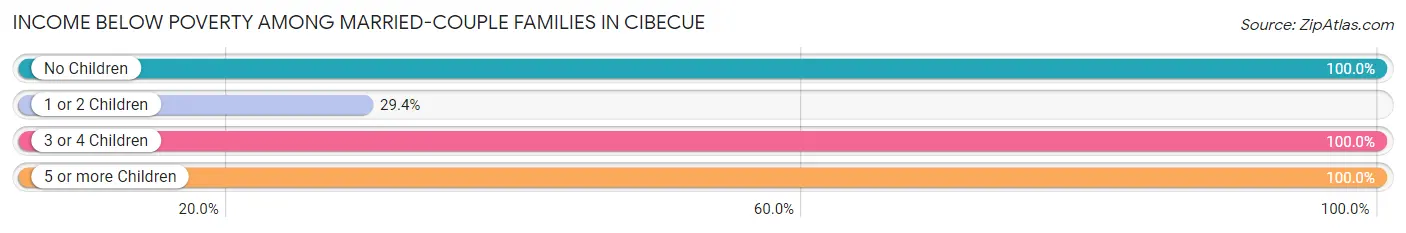
| Children | Above Poverty | Below Poverty |
| No Children | 0 (0.0%) | 15 (100.0%) |
| 1 or 2 Children | 36 (70.6%) | 15 (29.4%) |
| 3 or 4 Children | 0 (0.0%) | 14 (100.0%) |
| 5 or more Children | 0 (0.0%) | 7 (100.0%) |
| Total | 36 (41.4%) | 51 (58.6%) |
Income Below Poverty Among Single-Parent Households in Cibecue
According to the poverty data in Cibecue, 100.0% or 21 single-father households and 88.9% or 120 single-mother households are living below the poverty line. Among single-father households, those with 1 or 2 children have the highest poverty rate, with 21 households (100.0%) experiencing poverty. Likewise, among single-mother households, those with no children have the highest poverty rate, with 15 households (100.0%) falling below the poverty line.
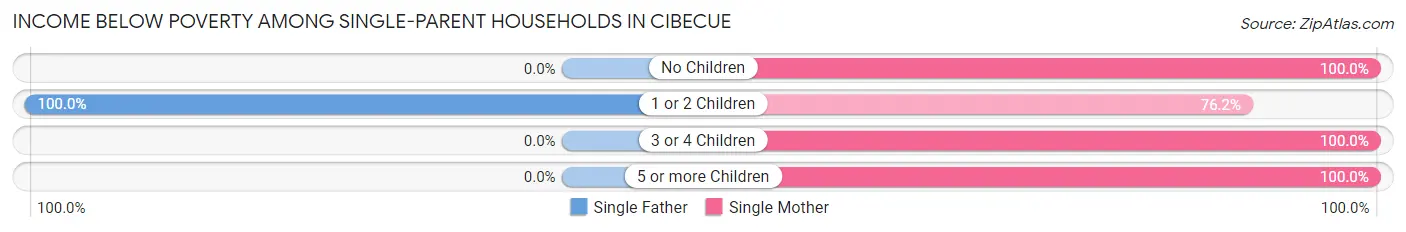
| Children | Single Father | Single Mother |
| No Children | 0 (0.0%) | 15 (100.0%) |
| 1 or 2 Children | 21 (100.0%) | 48 (76.2%) |
| 3 or 4 Children | 0 (0.0%) | 29 (100.0%) |
| 5 or more Children | 0 (0.0%) | 28 (100.0%) |
| Total | 21 (100.0%) | 120 (88.9%) |
Income Below Poverty Among Married-Couple vs Single-Parent Households in Cibecue
The poverty data for Cibecue shows that 51 of the married-couple family households (58.6%) and 141 of the single-parent households (90.4%) are living below the poverty level. Within the married-couple family households, those with no children have the highest poverty rate, with 15 households (100.0%) falling below the poverty line. Among the single-parent households, those with no children have the highest poverty rate, with 15 household (100.0%) living below poverty.
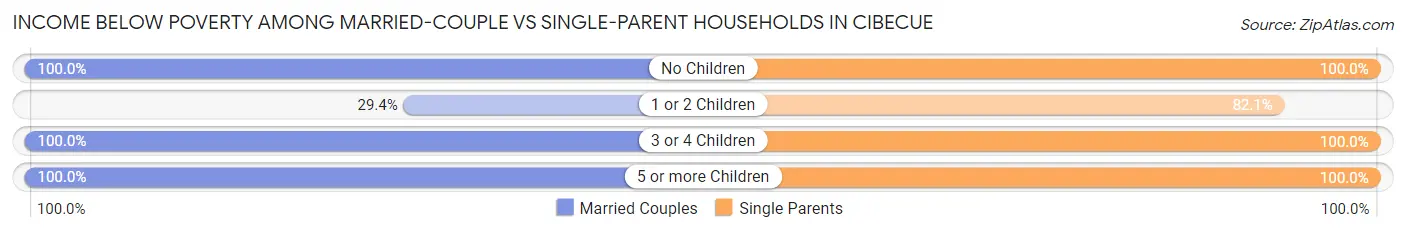
| Children | Married-Couple Families | Single-Parent Households |
| No Children | 15 (100.0%) | 15 (100.0%) |
| 1 or 2 Children | 15 (29.4%) | 69 (82.1%) |
| 3 or 4 Children | 14 (100.0%) | 29 (100.0%) |
| 5 or more Children | 7 (100.0%) | 28 (100.0%) |
| Total | 51 (58.6%) | 141 (90.4%) |
Race in Cibecue
The most populous races in Cibecue are Native / Alaskan (1,397 | 98.5%), and White / Caucasian (22 | 1.5%).
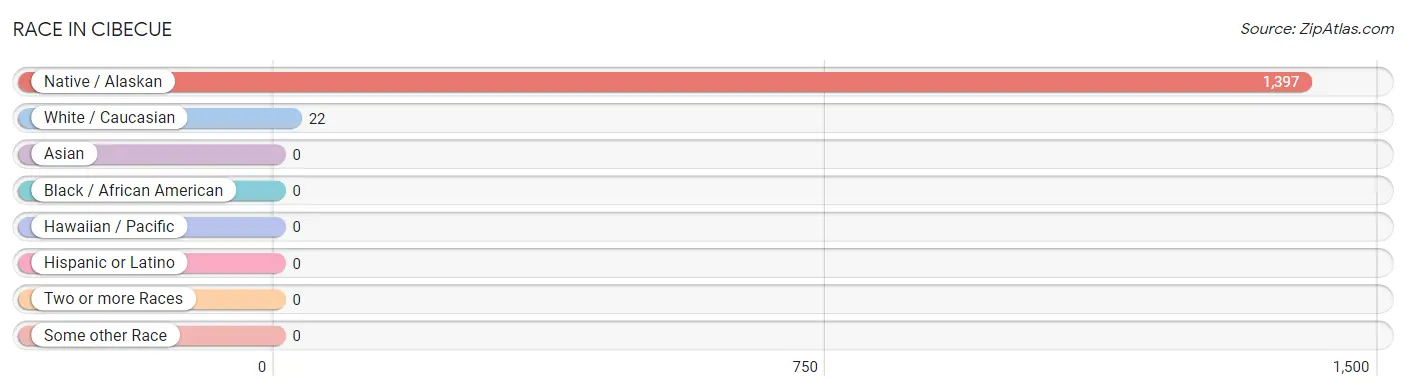
| Race | # Population | % Population |
| Asian | 0 | 0.0% |
| Black / African American | 0 | 0.0% |
| Hawaiian / Pacific | 0 | 0.0% |
| Hispanic or Latino | 0 | 0.0% |
| Native / Alaskan | 1,397 | 98.5% |
| White / Caucasian | 22 | 1.5% |
| Two or more Races | 0 | 0.0% |
| Some other Race | 0 | 0.0% |
| Total | 1,419 | 100.0% |
Ancestry in Cibecue
The most populous ancestries reported in Cibecue are Apache (1,308 | 92.2%), Irish (36 | 2.5%), Swedish (22 | 1.5%), Navajo (16 | 1.1%), and Cherokee (14 | 1.0%), together accounting for 98.4% of all Cibecue residents.
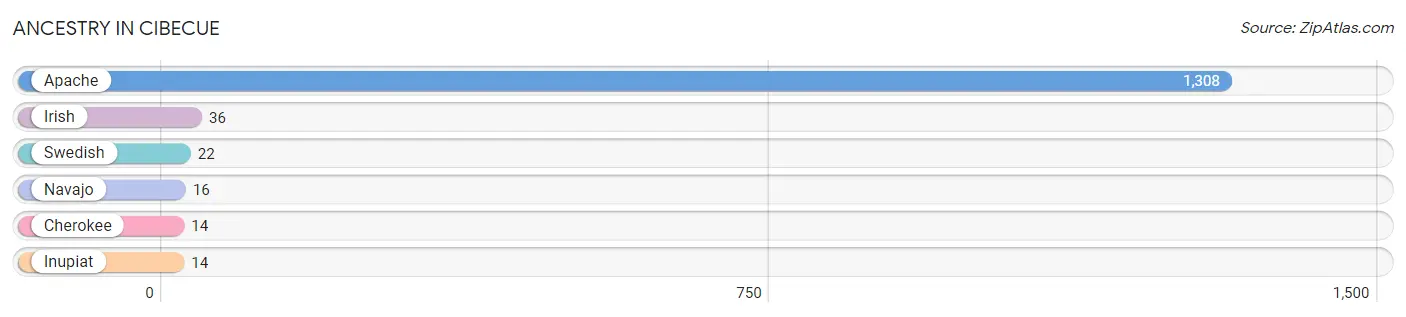
| Ancestry | # Population | % Population |
| Apache | 1,308 | 92.2% |
| Cherokee | 14 | 1.0% |
| Inupiat | 14 | 1.0% |
| Irish | 36 | 2.5% |
| Navajo | 16 | 1.1% |
| Swedish | 22 | 1.5% | View All 6 Rows |
Immigrants in Cibecue

| Immigration Origin | # Population | % Population | View All 0 Rows |
Sex and Age in Cibecue
Sex and Age in Cibecue
The most populous age groups in Cibecue are 10 to 14 Years (104 | 15.8%) for men and 5 to 9 Years (102 | 13.4%) for women.
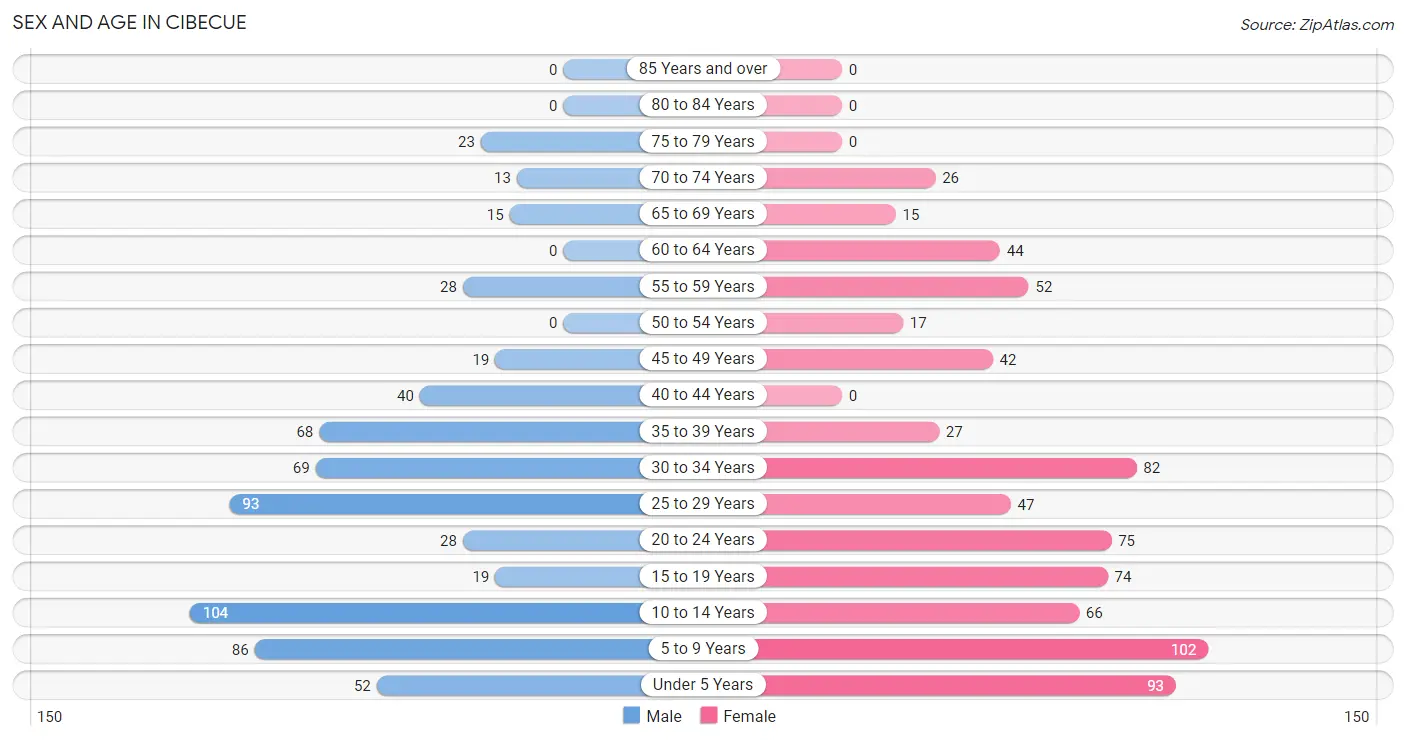
| Age Bracket | Male | Female |
| Under 5 Years | 52 (7.9%) | 93 (12.2%) |
| 5 to 9 Years | 86 (13.1%) | 102 (13.4%) |
| 10 to 14 Years | 104 (15.8%) | 66 (8.7%) |
| 15 to 19 Years | 19 (2.9%) | 74 (9.7%) |
| 20 to 24 Years | 28 (4.3%) | 75 (9.8%) |
| 25 to 29 Years | 93 (14.2%) | 47 (6.2%) |
| 30 to 34 Years | 69 (10.5%) | 82 (10.8%) |
| 35 to 39 Years | 68 (10.3%) | 27 (3.5%) |
| 40 to 44 Years | 40 (6.1%) | 0 (0.0%) |
| 45 to 49 Years | 19 (2.9%) | 42 (5.5%) |
| 50 to 54 Years | 0 (0.0%) | 17 (2.2%) |
| 55 to 59 Years | 28 (4.3%) | 52 (6.8%) |
| 60 to 64 Years | 0 (0.0%) | 44 (5.8%) |
| 65 to 69 Years | 15 (2.3%) | 15 (2.0%) |
| 70 to 74 Years | 13 (2.0%) | 26 (3.4%) |
| 75 to 79 Years | 23 (3.5%) | 0 (0.0%) |
| 80 to 84 Years | 0 (0.0%) | 0 (0.0%) |
| 85 Years and over | 0 (0.0%) | 0 (0.0%) |
| Total | 657 (100.0%) | 762 (100.0%) |
Families and Households in Cibecue
Median Family Size in Cibecue
The median family size in Cibecue is 4.96 persons per family, with married-couple families (87 | 35.8%) accounting for the largest median family size of 5.21 persons per family. On the other hand, single male/father families (21 | 8.6%) represent the smallest median family size with 3.05 persons per family.
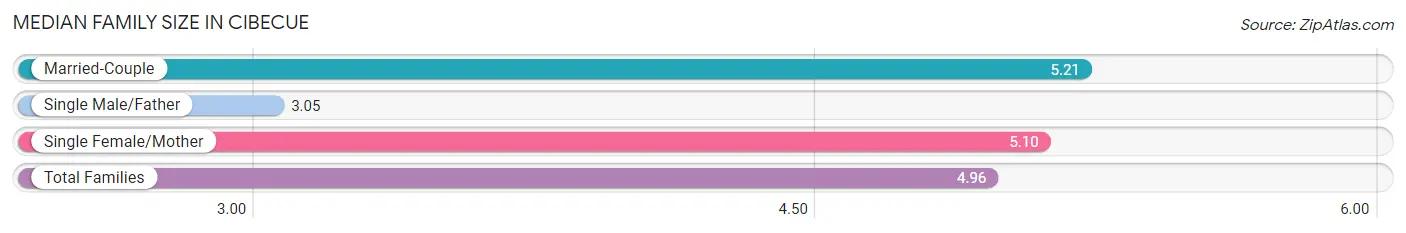
| Family Type | # Families | Family Size |
| Married-Couple | 87 (35.8%) | 5.21 |
| Single Male/Father | 21 (8.6%) | 3.05 |
| Single Female/Mother | 135 (55.6%) | 5.10 |
| Total Families | 243 (100.0%) | 4.96 |
Median Household Size in Cibecue
The median household size in Cibecue is 3.97 persons per household, with single female/mother households (135 | 37.8%) accounting for the largest median household size of 5.58 persons per household. non-family households (114 | 31.9%) represent the smallest median household size with 1.14 persons per household.
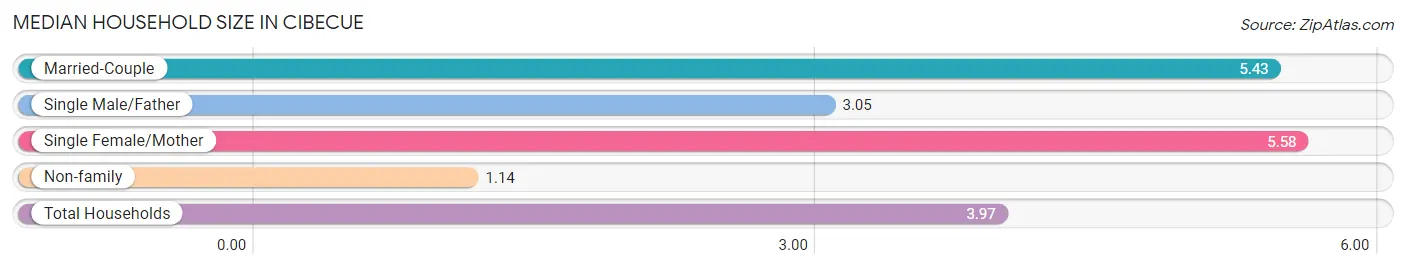
| Household Type | # Households | Household Size |
| Married-Couple | 87 (24.4%) | 5.43 |
| Single Male/Father | 21 (5.9%) | 3.05 |
| Single Female/Mother | 135 (37.8%) | 5.58 |
| Non-family | 114 (31.9%) | 1.14 |
| Total Households | 357 (100.0%) | 3.97 |
Household Size by Marriage Status in Cibecue
Out of a total of 357 households in Cibecue, 243 (68.1%) are family households, while 114 (31.9%) are nonfamily households. The most numerous type of family households are 4-person households, comprising 92, and the most common type of nonfamily households are 1-person households, comprising 101.
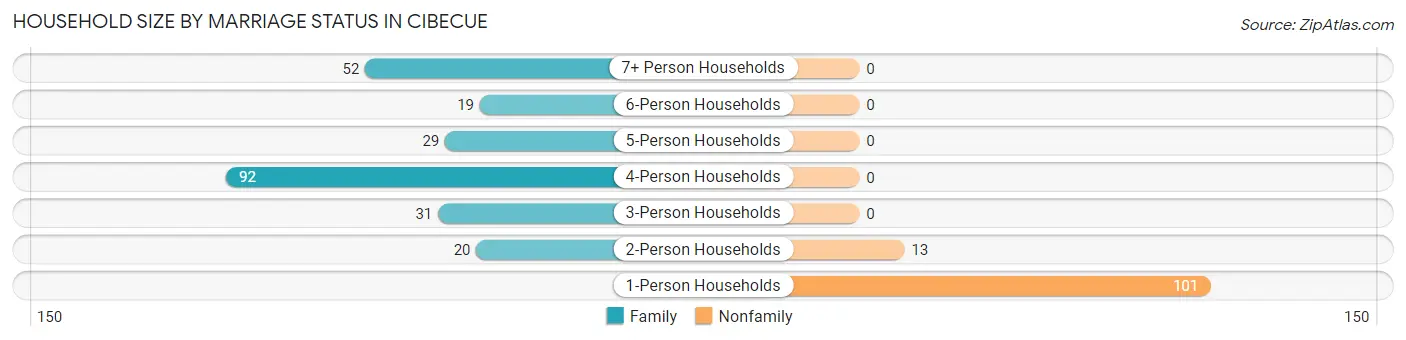
| Household Size | Family Households | Nonfamily Households |
| 1-Person Households | - | 101 (28.3%) |
| 2-Person Households | 20 (5.6%) | 13 (3.6%) |
| 3-Person Households | 31 (8.7%) | 0 (0.0%) |
| 4-Person Households | 92 (25.8%) | 0 (0.0%) |
| 5-Person Households | 29 (8.1%) | 0 (0.0%) |
| 6-Person Households | 19 (5.3%) | 0 (0.0%) |
| 7+ Person Households | 52 (14.6%) | 0 (0.0%) |
| Total | 243 (68.1%) | 114 (31.9%) |
Female Fertility in Cibecue
Fertility by Age in Cibecue
Average fertility rate in Cibecue is 40.0 births per 1,000 women. Women in the age bracket of 20 to 34 years have the highest fertility rate with 69.0 births per 1,000 women. Women in the age bracket of 20 to 34 years acount for 100.0% of all women with births.
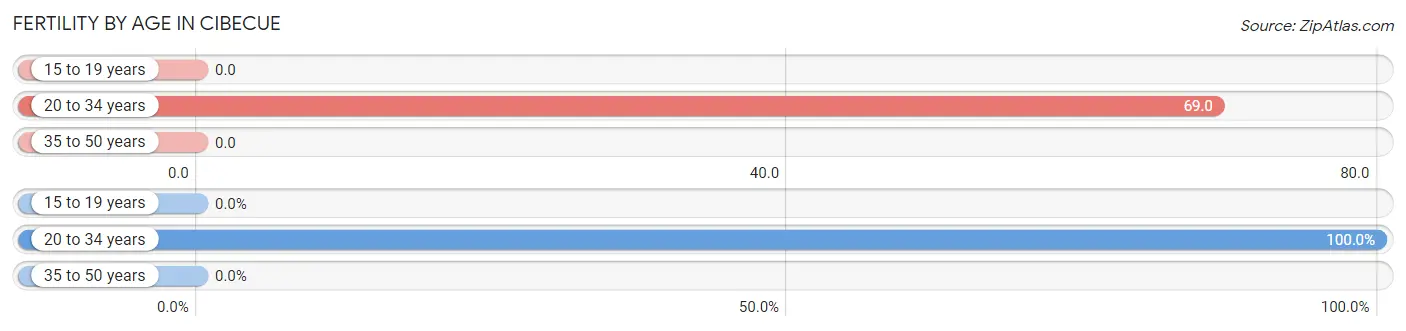
| Age Bracket | Women with Births | Births / 1,000 Women |
| 15 to 19 years | 0 (0.0%) | 0.0 |
| 20 to 34 years | 14 (100.0%) | 69.0 |
| 35 to 50 years | 0 (0.0%) | 0.0 |
| Total | 14 (100.0%) | 40.0 |
Fertility by Age by Marriage Status in Cibecue
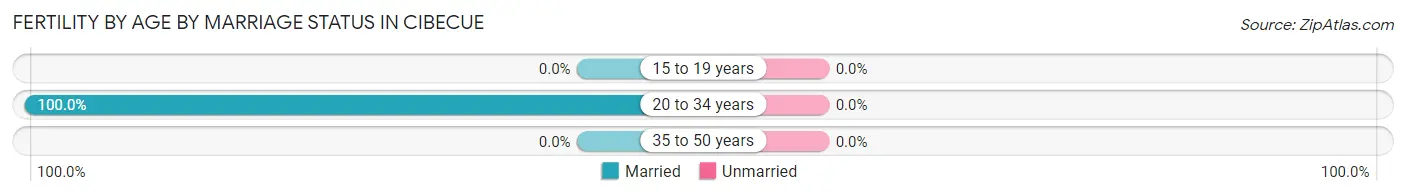
| Age Bracket | Married | Unmarried |
| 15 to 19 years | 0 (0.0%) | 0 (0.0%) |
| 20 to 34 years | 14 (100.0%) | 0 (0.0%) |
| 35 to 50 years | 0 (0.0%) | 0 (0.0%) |
| Total | 14 (100.0%) | 0 (0.0%) |
Fertility by Education in Cibecue
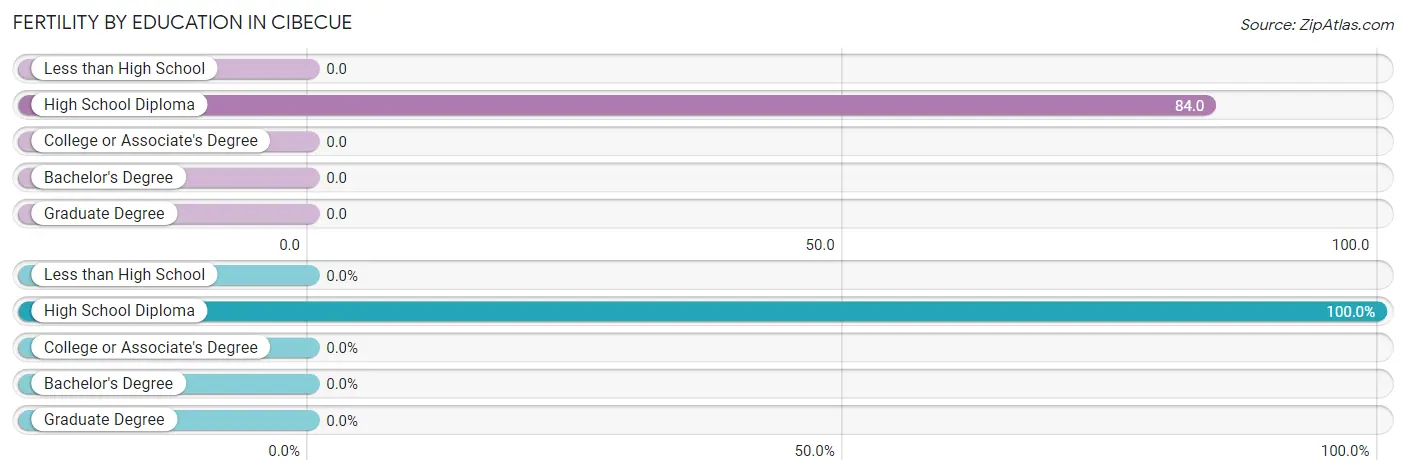
| Educational Attainment | Women with Births | Births / 1,000 Women |
| Less than High School | 0 (0.0%) | 0.0 |
| High School Diploma | 14 (100.0%) | 84.0 |
| College or Associate's Degree | 0 (0.0%) | 0.0 |
| Bachelor's Degree | 0 (0.0%) | 0.0 |
| Graduate Degree | 0 (0.0%) | 0.0 |
| Total | 14 (100.0%) | 40.0 |
Fertility by Education by Marriage Status in Cibecue
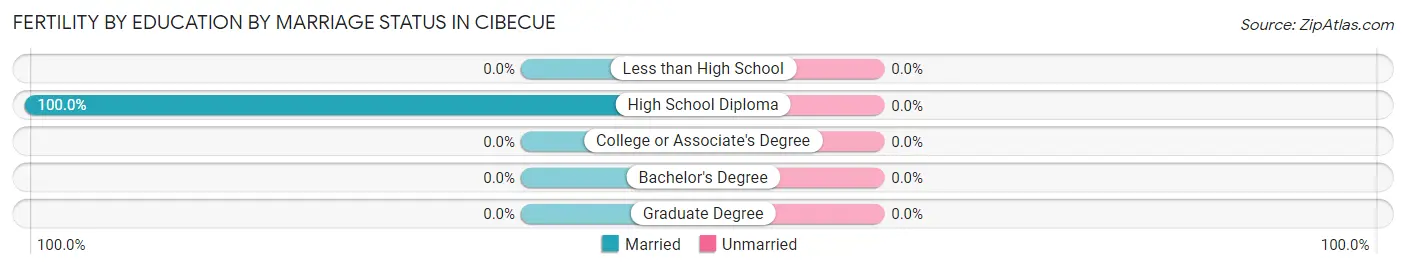
| Educational Attainment | Married | Unmarried |
| Less than High School | 0 (0.0%) | 0 (0.0%) |
| High School Diploma | 14 (100.0%) | 0 (0.0%) |
| College or Associate's Degree | 0 (0.0%) | 0 (0.0%) |
| Bachelor's Degree | 0 (0.0%) | 0 (0.0%) |
| Graduate Degree | 0 (0.0%) | 0 (0.0%) |
| Total | 14 (100.0%) | 0 (0.0%) |
Employment Characteristics in Cibecue
Employment by Class of Employer in Cibecue
Among the 339 employed individuals in Cibecue, local government employees (134 | 39.5%), not-for-profit organizations (81 | 23.9%), and private company employees (76 | 22.4%) make up the most common classes of employment.
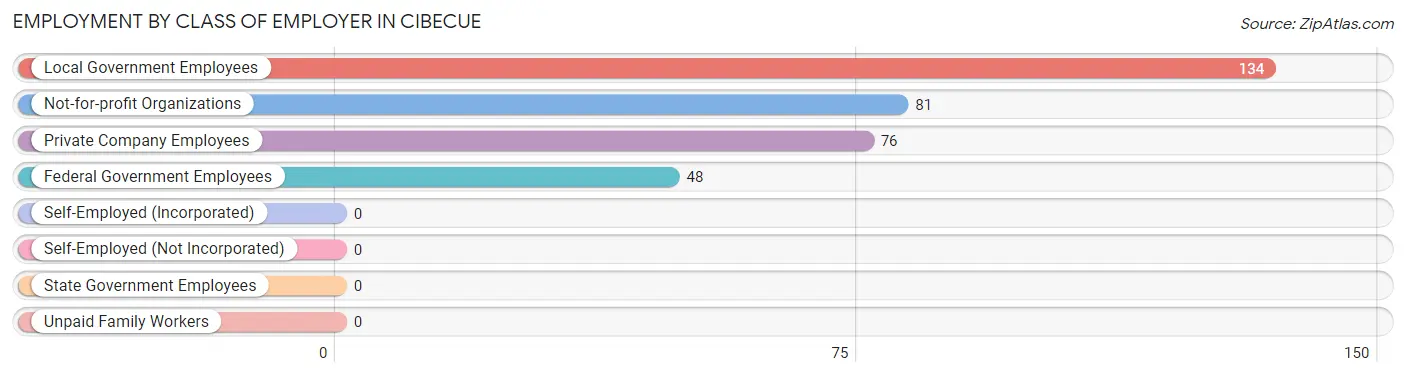
| Employer Class | # Employees | % Employees |
| Private Company Employees | 76 | 22.4% |
| Self-Employed (Incorporated) | 0 | 0.0% |
| Self-Employed (Not Incorporated) | 0 | 0.0% |
| Not-for-profit Organizations | 81 | 23.9% |
| Local Government Employees | 134 | 39.5% |
| State Government Employees | 0 | 0.0% |
| Federal Government Employees | 48 | 14.2% |
| Unpaid Family Workers | 0 | 0.0% |
| Total | 339 | 100.0% |
Employment Status by Age in Cibecue
According to the labor force statistics for Cibecue, out of the total population over 16 years of age (866), 46.8% or 405 individuals are in the labor force, with 16.3% or 66 of them unemployed. The age group with the highest labor force participation rate is 20 to 24 years, with 72.8% or 75 individuals in the labor force. Within the labor force, the 35 to 44 years age range has the highest percentage of unemployed individuals, with 51.2% or 21 of them being unemployed.
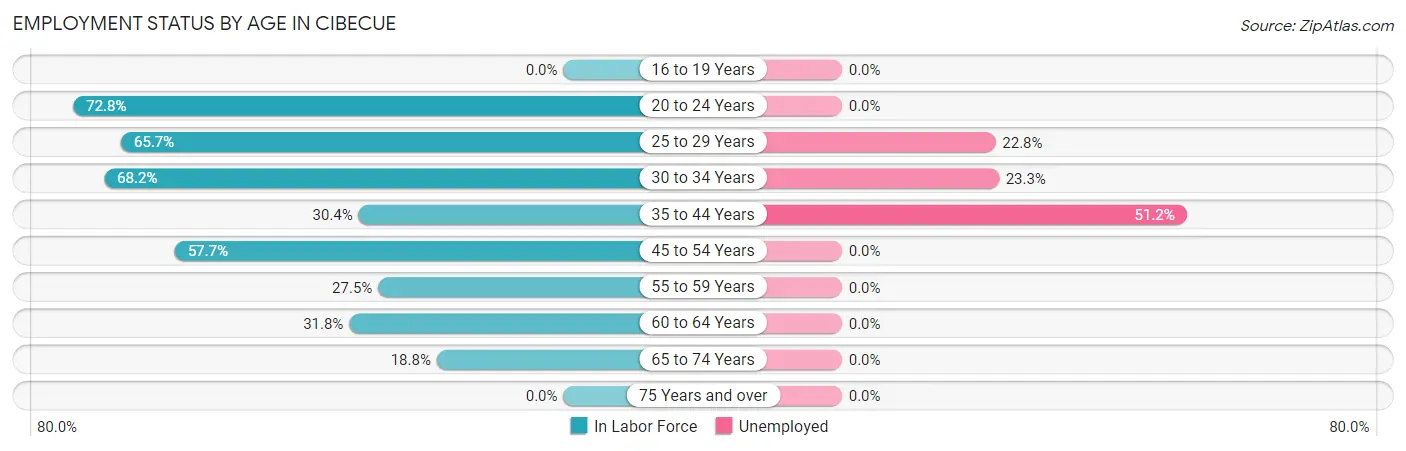
| Age Bracket | In Labor Force | Unemployed |
| 16 to 19 Years | 0 (0.0%) | 0 (0.0%) |
| 20 to 24 Years | 75 (72.8%) | 0 (0.0%) |
| 25 to 29 Years | 92 (65.7%) | 21 (22.8%) |
| 30 to 34 Years | 103 (68.2%) | 24 (23.3%) |
| 35 to 44 Years | 41 (30.4%) | 21 (51.2%) |
| 45 to 54 Years | 45 (57.7%) | 0 (0.0%) |
| 55 to 59 Years | 22 (27.5%) | 0 (0.0%) |
| 60 to 64 Years | 14 (31.8%) | 0 (0.0%) |
| 65 to 74 Years | 13 (18.8%) | 0 (0.0%) |
| 75 Years and over | 0 (0.0%) | 0 (0.0%) |
| Total | 405 (46.8%) | 66 (16.3%) |
Employment Status by Educational Attainment in Cibecue
According to labor force statistics for Cibecue, 50.5% of individuals (317) out of the total population between 25 and 64 years of age (628) are in the labor force, with 20.8% or 66 of them being unemployed. The group with the highest labor force participation rate are those with the educational attainment of bachelor's degree or higher, with 100.0% or 22 individuals in the labor force. Within the labor force, individuals with less than high school education have the highest percentage of unemployment, with 74.2% or 66 of them being unemployed.
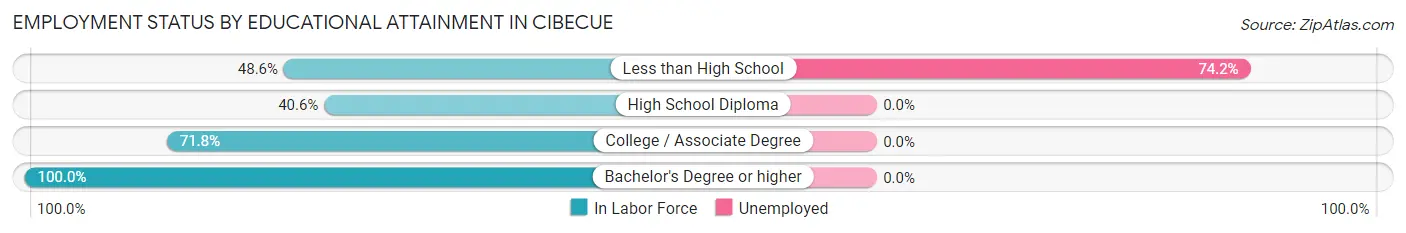
| Educational Attainment | In Labor Force | Unemployed |
| Less than High School | 89 (48.6%) | 136 (74.2%) |
| High School Diploma | 127 (40.6%) | 0 (0.0%) |
| College / Associate Degree | 79 (71.8%) | 0 (0.0%) |
| Bachelor's Degree or higher | 22 (100.0%) | 0 (0.0%) |
| Total | 317 (50.5%) | 131 (20.8%) |
Employment Occupations by Sex in Cibecue
Management, Business, Science and Arts Occupations
The most common Management, Business, Science and Arts occupations in Cibecue are Community & Social Service (43 | 12.7%), Education Instruction & Library (43 | 12.7%), Management (36 | 10.6%), Business & Financial (22 | 6.5%), and Health Diagnosing & Treating (19 | 5.6%).
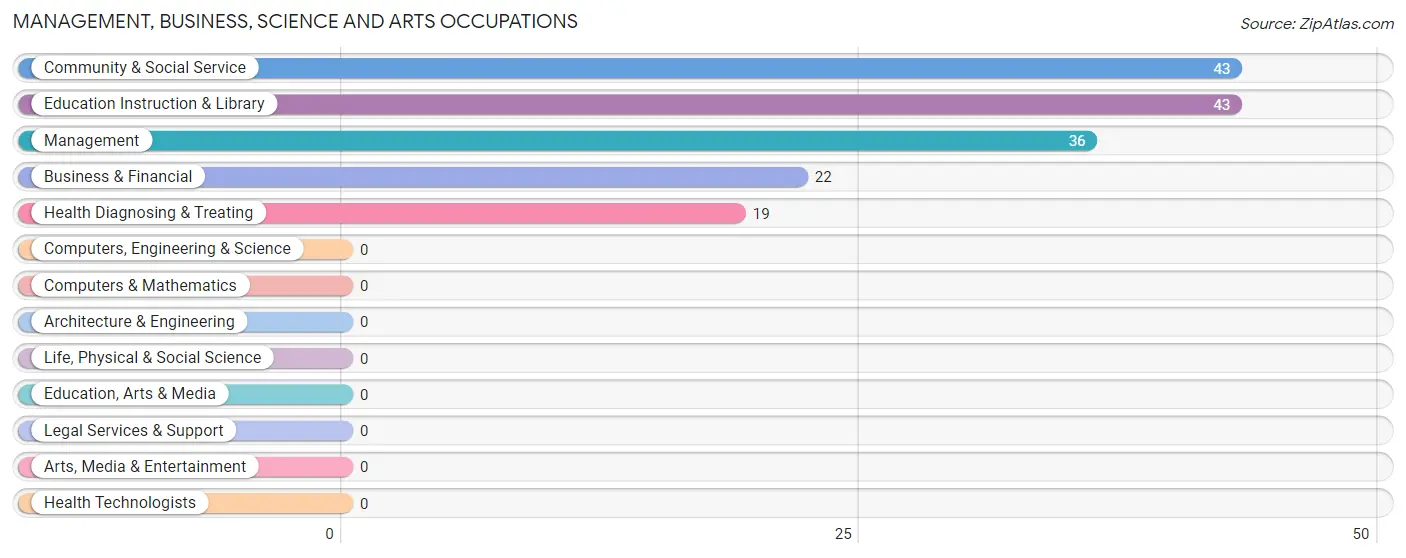
Management, Business, Science and Arts Occupations by Sex
Within the Management, Business, Science and Arts occupations in Cibecue, the most male-oriented occupations are Health Diagnosing & Treating (100.0%), and Management (61.1%), while the most female-oriented occupations are Business & Financial (100.0%), Community & Social Service (100.0%), and Education Instruction & Library (100.0%).
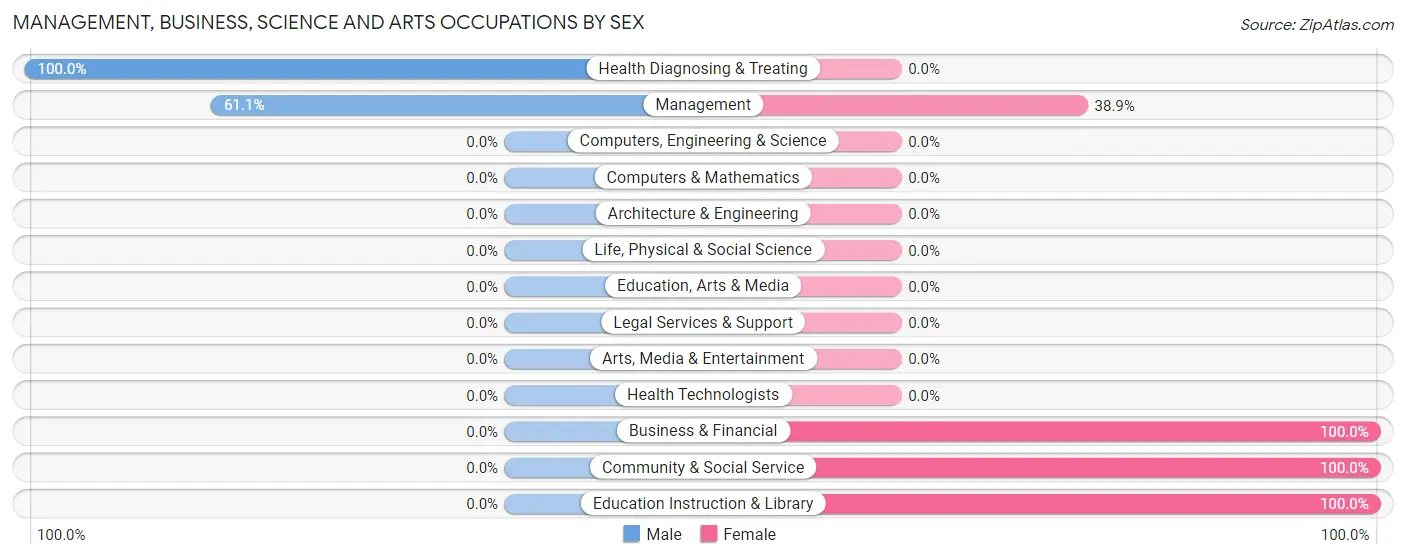
| Occupation | Male | Female |
| Management | 22 (61.1%) | 14 (38.9%) |
| Business & Financial | 0 (0.0%) | 22 (100.0%) |
| Computers, Engineering & Science | 0 (0.0%) | 0 (0.0%) |
| Computers & Mathematics | 0 (0.0%) | 0 (0.0%) |
| Architecture & Engineering | 0 (0.0%) | 0 (0.0%) |
| Life, Physical & Social Science | 0 (0.0%) | 0 (0.0%) |
| Community & Social Service | 0 (0.0%) | 43 (100.0%) |
| Education, Arts & Media | 0 (0.0%) | 0 (0.0%) |
| Legal Services & Support | 0 (0.0%) | 0 (0.0%) |
| Education Instruction & Library | 0 (0.0%) | 43 (100.0%) |
| Arts, Media & Entertainment | 0 (0.0%) | 0 (0.0%) |
| Health Diagnosing & Treating | 19 (100.0%) | 0 (0.0%) |
| Health Technologists | 0 (0.0%) | 0 (0.0%) |
| Total (Category) | 41 (34.2%) | 79 (65.8%) |
| Total (Overall) | 102 (30.1%) | 237 (69.9%) |
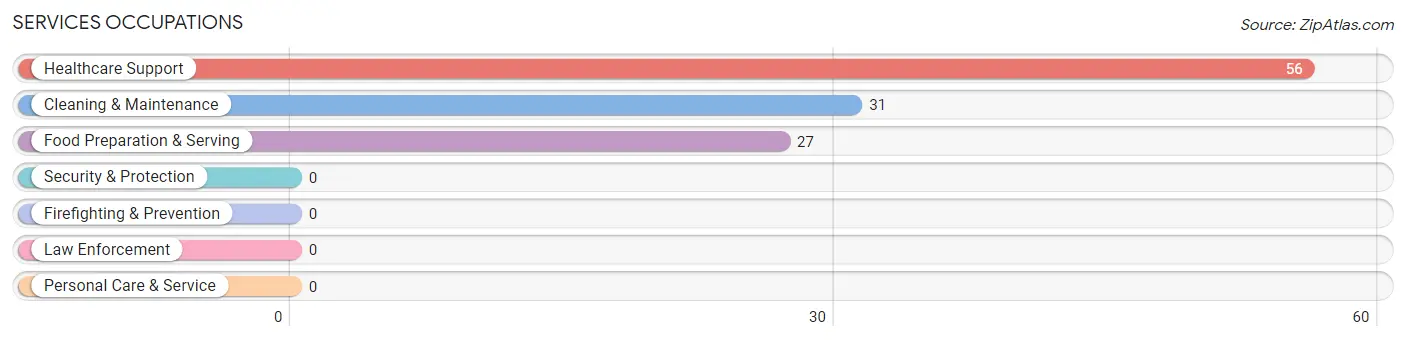
Services Occupations
The most common Services occupations in Cibecue are Healthcare Support (56 | 16.5%), Cleaning & Maintenance (31 | 9.1%), and Food Preparation & Serving (27 | 8.0%).
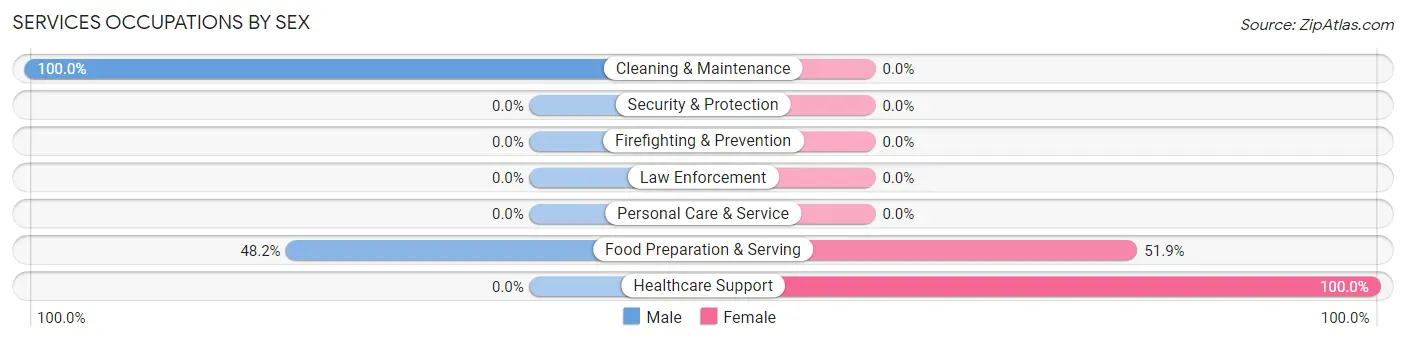
Services Occupations by Sex
Within the Services occupations in Cibecue, the most male-oriented occupations are Cleaning & Maintenance (100.0%), and Food Preparation & Serving (48.1%), while the most female-oriented occupations are Healthcare Support (100.0%), and Food Preparation & Serving (51.8%).
| Occupation | Male | Female |
| Healthcare Support | 0 (0.0%) | 56 (100.0%) |
| Security & Protection | 0 (0.0%) | 0 (0.0%) |
| Firefighting & Prevention | 0 (0.0%) | 0 (0.0%) |
| Law Enforcement | 0 (0.0%) | 0 (0.0%) |
| Food Preparation & Serving | 13 (48.1%) | 14 (51.8%) |
| Cleaning & Maintenance | 31 (100.0%) | 0 (0.0%) |
| Personal Care & Service | 0 (0.0%) | 0 (0.0%) |
| Total (Category) | 44 (38.6%) | 70 (61.4%) |
| Total (Overall) | 102 (30.1%) | 237 (69.9%) |
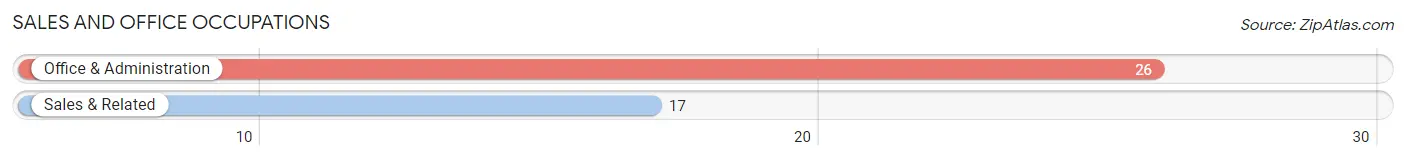
Sales and Office Occupations
The most common Sales and Office occupations in Cibecue are Office & Administration (26 | 7.7%), and Sales & Related (17 | 5.0%).
Sales and Office Occupations by Sex
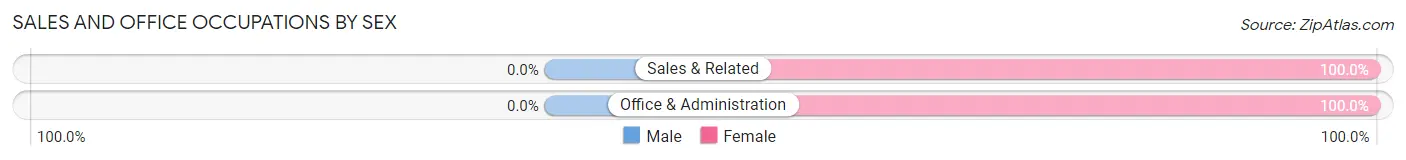
| Occupation | Male | Female |
| Sales & Related | 0 (0.0%) | 17 (100.0%) |
| Office & Administration | 0 (0.0%) | 26 (100.0%) |
| Total (Category) | 0 (0.0%) | 43 (100.0%) |
| Total (Overall) | 102 (30.1%) | 237 (69.9%) |
Natural Resources, Construction and Maintenance Occupations
The most common Natural Resources, Construction and Maintenance occupations in Cibecue are , and Installation, Maintenance & Repair (17 | 5.0%).
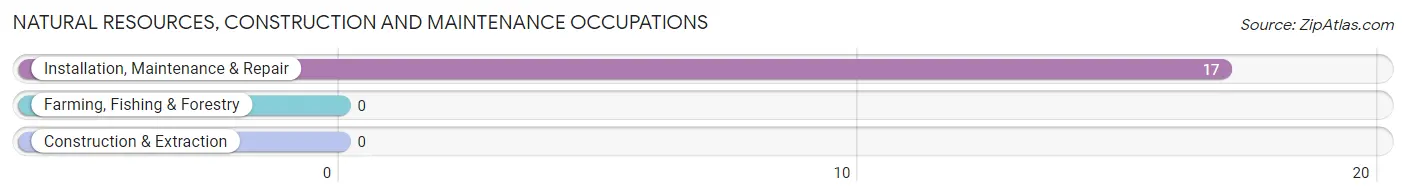
Natural Resources, Construction and Maintenance Occupations by Sex
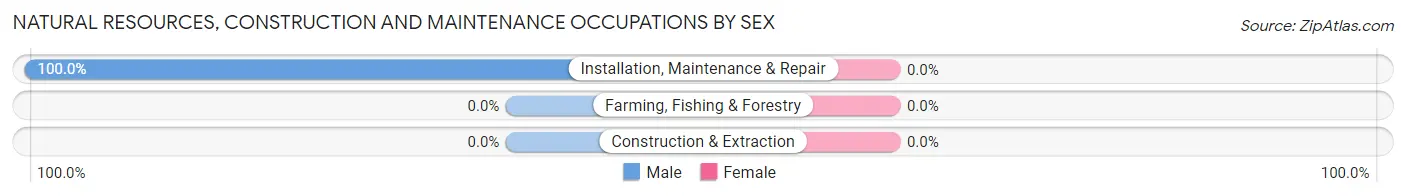
| Occupation | Male | Female |
| Farming, Fishing & Forestry | 0 (0.0%) | 0 (0.0%) |
| Construction & Extraction | 0 (0.0%) | 0 (0.0%) |
| Installation, Maintenance & Repair | 17 (100.0%) | 0 (0.0%) |
| Total (Category) | 17 (100.0%) | 0 (0.0%) |
| Total (Overall) | 102 (30.1%) | 237 (69.9%) |
Production, Transportation and Moving Occupations
The most common Production, Transportation and Moving occupations in Cibecue are Material Moving (25 | 7.4%), and Transportation (20 | 5.9%).
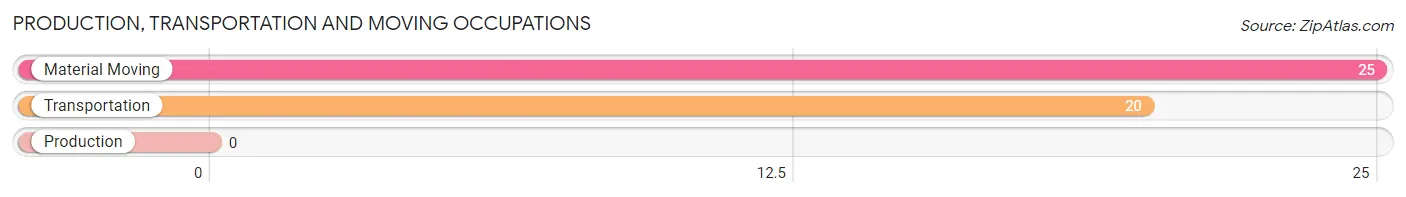
Production, Transportation and Moving Occupations by Sex
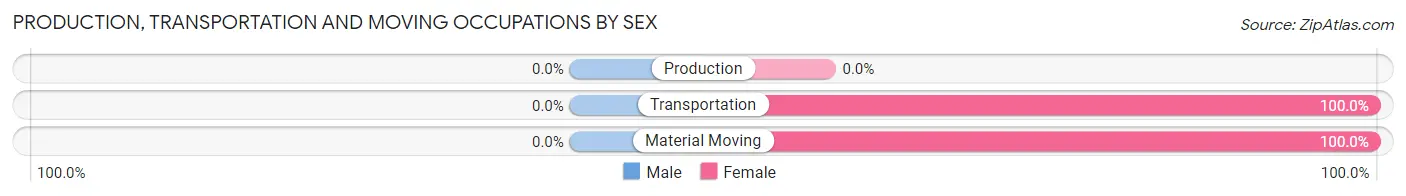
| Occupation | Male | Female |
| Production | 0 (0.0%) | 0 (0.0%) |
| Transportation | 0 (0.0%) | 20 (100.0%) |
| Material Moving | 0 (0.0%) | 25 (100.0%) |
| Total (Category) | 0 (0.0%) | 45 (100.0%) |
| Total (Overall) | 102 (30.1%) | 237 (69.9%) |
Employment Industries by Sex in Cibecue
Employment Industries in Cibecue
The major employment industries in Cibecue include Public Administration (108 | 31.9%), Educational Services (65 | 19.2%), Health Care & Social Assistance (59 | 17.4%), Retail Trade (42 | 12.4%), and Arts, Entertainment & Recreation (31 | 9.1%).
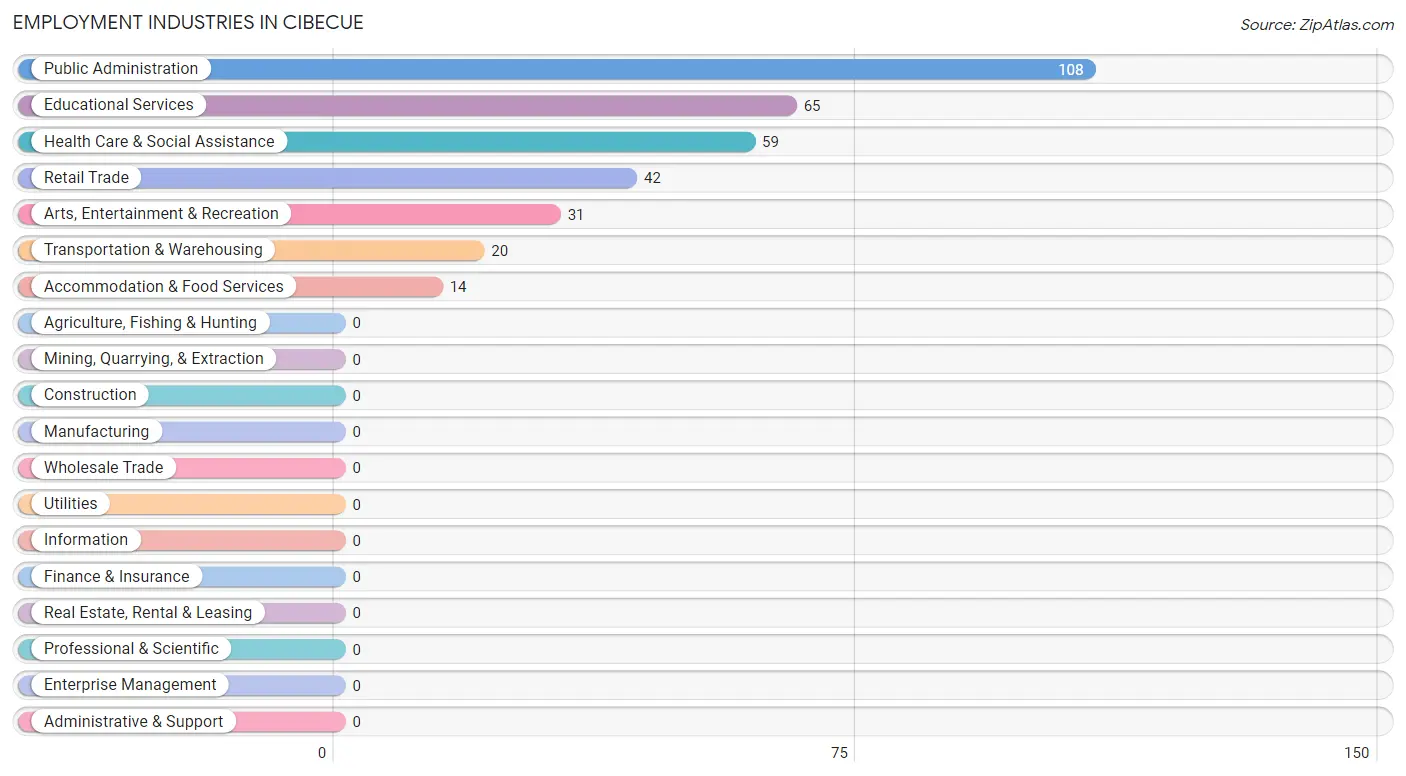
Employment Industries by Sex in Cibecue
The Cibecue industries that see more men than women are Arts, Entertainment & Recreation (100.0%), Public Administration (45.4%), and Health Care & Social Assistance (37.3%), whereas the industries that tend to have a higher number of women are Retail Trade (100.0%), Transportation & Warehousing (100.0%), and Educational Services (100.0%).
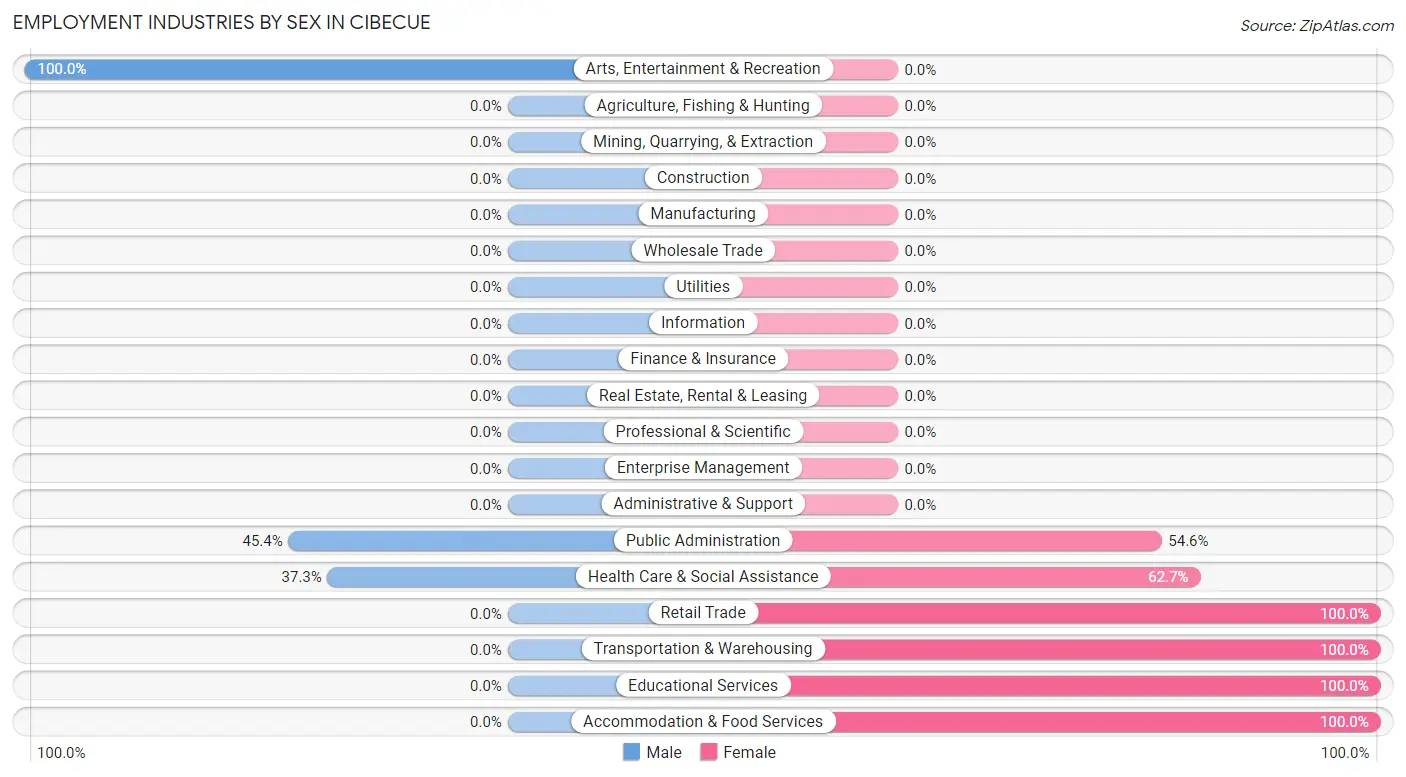
| Industry | Male | Female |
| Agriculture, Fishing & Hunting | 0 (0.0%) | 0 (0.0%) |
| Mining, Quarrying, & Extraction | 0 (0.0%) | 0 (0.0%) |
| Construction | 0 (0.0%) | 0 (0.0%) |
| Manufacturing | 0 (0.0%) | 0 (0.0%) |
| Wholesale Trade | 0 (0.0%) | 0 (0.0%) |
| Retail Trade | 0 (0.0%) | 42 (100.0%) |
| Transportation & Warehousing | 0 (0.0%) | 20 (100.0%) |
| Utilities | 0 (0.0%) | 0 (0.0%) |
| Information | 0 (0.0%) | 0 (0.0%) |
| Finance & Insurance | 0 (0.0%) | 0 (0.0%) |
| Real Estate, Rental & Leasing | 0 (0.0%) | 0 (0.0%) |
| Professional & Scientific | 0 (0.0%) | 0 (0.0%) |
| Enterprise Management | 0 (0.0%) | 0 (0.0%) |
| Administrative & Support | 0 (0.0%) | 0 (0.0%) |
| Educational Services | 0 (0.0%) | 65 (100.0%) |
| Health Care & Social Assistance | 22 (37.3%) | 37 (62.7%) |
| Arts, Entertainment & Recreation | 31 (100.0%) | 0 (0.0%) |
| Accommodation & Food Services | 0 (0.0%) | 14 (100.0%) |
| Public Administration | 49 (45.4%) | 59 (54.6%) |
| Total | 102 (30.1%) | 237 (69.9%) |
Education in Cibecue
School Enrollment in Cibecue
The most common levels of schooling among the 421 students in Cibecue are elementary school (165 | 39.2%), middle school (139 | 33.0%), and high school (90 | 21.4%).
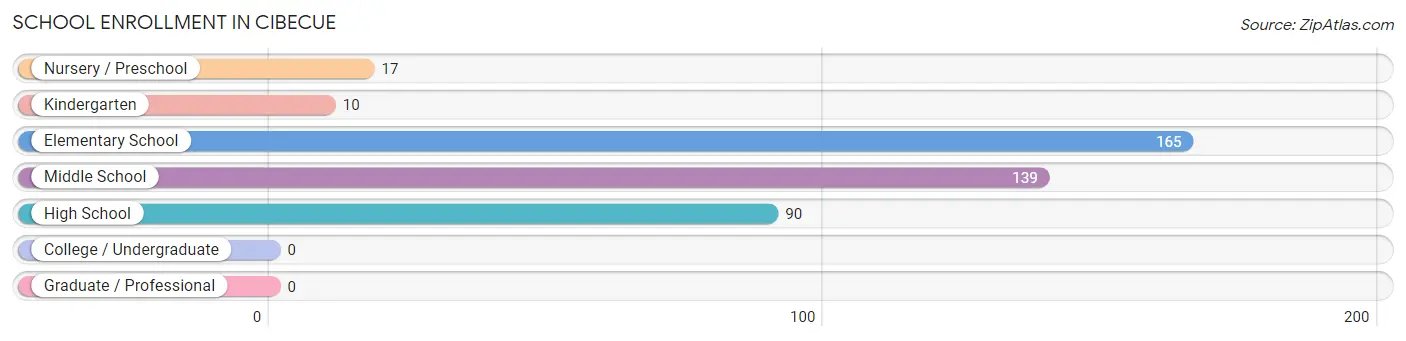
| School Level | # Students | % Students |
| Nursery / Preschool | 17 | 4.0% |
| Kindergarten | 10 | 2.4% |
| Elementary School | 165 | 39.2% |
| Middle School | 139 | 33.0% |
| High School | 90 | 21.4% |
| College / Undergraduate | 0 | 0.0% |
| Graduate / Professional | 0 | 0.0% |
| Total | 421 | 100.0% |
School Enrollment by Age by Funding Source in Cibecue
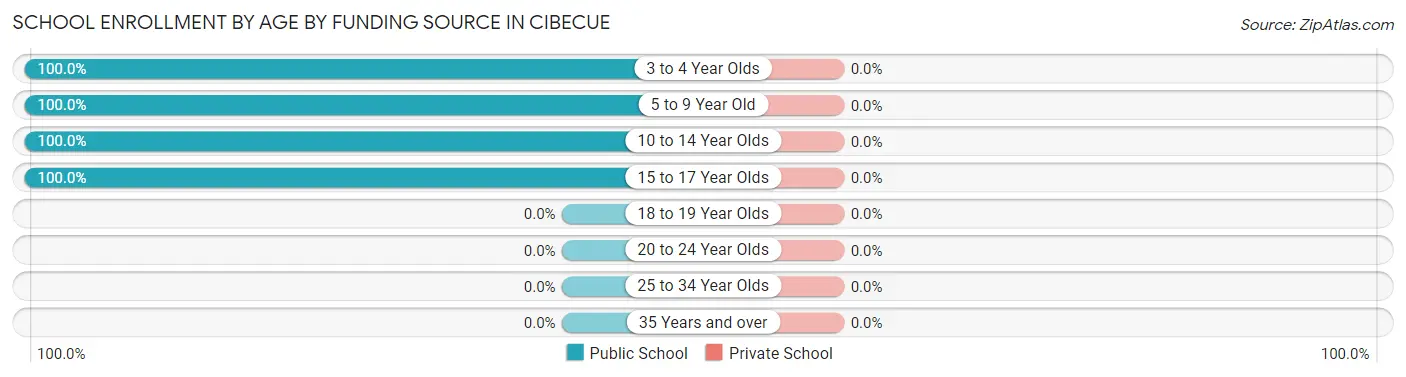
| Age Bracket | Public School | Private School |
| 3 to 4 Year Olds | 17 (100.0%) | 0 (0.0%) |
| 5 to 9 Year Old | 160 (100.0%) | 0 (0.0%) |
| 10 to 14 Year Olds | 170 (100.0%) | 0 (0.0%) |
| 15 to 17 Year Olds | 74 (100.0%) | 0 (0.0%) |
| 18 to 19 Year Olds | 0 (0.0%) | 0 (0.0%) |
| 20 to 24 Year Olds | 0 (0.0%) | 0 (0.0%) |
| 25 to 34 Year Olds | 0 (0.0%) | 0 (0.0%) |
| 35 Years and over | 0 (0.0%) | 0 (0.0%) |
| Total | 421 (100.0%) | 0 (0.0%) |
Educational Attainment by Field of Study in Cibecue
, and business (22 | 100.0%) are the most common fields of study among 22 individuals in Cibecue who have obtained a bachelor's degree or higher.
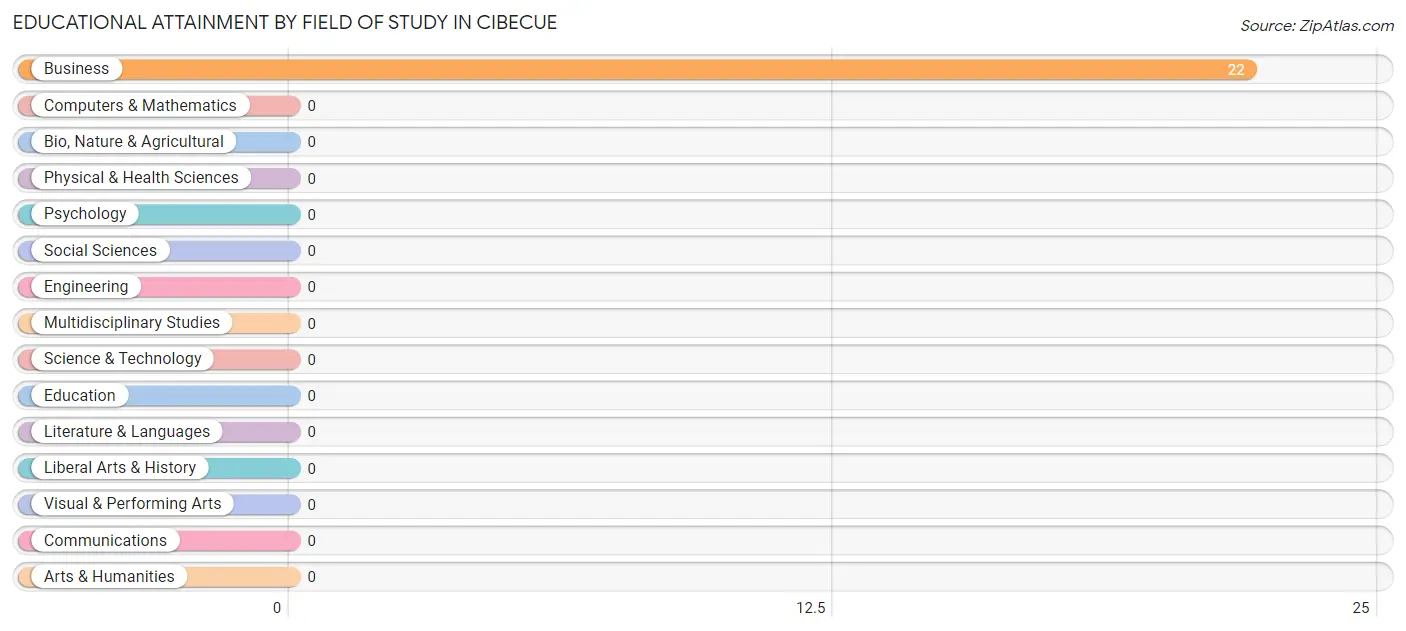
| Field of Study | # Graduates | % Graduates |
| Computers & Mathematics | 0 | 0.0% |
| Bio, Nature & Agricultural | 0 | 0.0% |
| Physical & Health Sciences | 0 | 0.0% |
| Psychology | 0 | 0.0% |
| Social Sciences | 0 | 0.0% |
| Engineering | 0 | 0.0% |
| Multidisciplinary Studies | 0 | 0.0% |
| Science & Technology | 0 | 0.0% |
| Business | 22 | 100.0% |
| Education | 0 | 0.0% |
| Literature & Languages | 0 | 0.0% |
| Liberal Arts & History | 0 | 0.0% |
| Visual & Performing Arts | 0 | 0.0% |
| Communications | 0 | 0.0% |
| Arts & Humanities | 0 | 0.0% |
| Total | 22 | 100.0% |
Transportation & Commute in Cibecue
Vehicle Availability by Sex in Cibecue
The most prevalent vehicle ownership categories in Cibecue are males with 2 vehicles (50, accounting for 49.0%) and females with 2 vehicles (119, making up 21.1%).
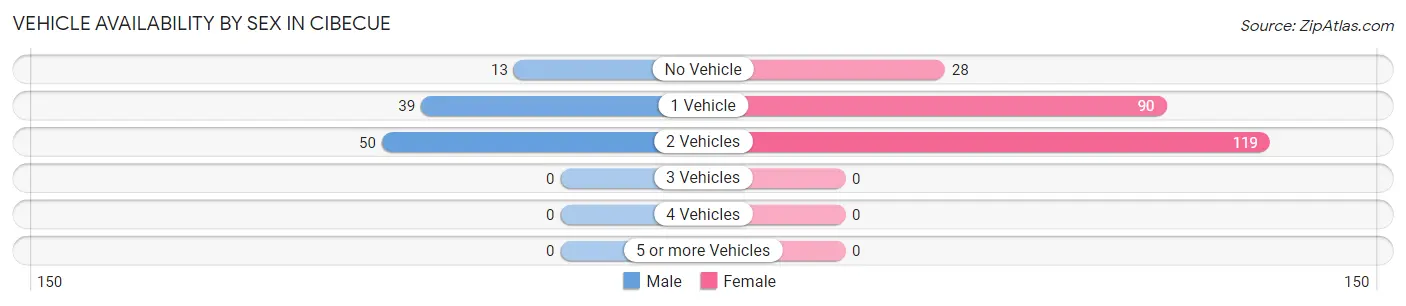
| Vehicles Available | Male | Female |
| No Vehicle | 13 (12.8%) | 28 (11.8%) |
| 1 Vehicle | 39 (38.2%) | 90 (38.0%) |
| 2 Vehicles | 50 (49.0%) | 119 (50.2%) |
| 3 Vehicles | 0 (0.0%) | 0 (0.0%) |
| 4 Vehicles | 0 (0.0%) | 0 (0.0%) |
| 5 or more Vehicles | 0 (0.0%) | 0 (0.0%) |
| Total | 102 (100.0%) | 237 (100.0%) |
Commute Time in Cibecue
The most frequently occuring commute durations in Cibecue are 5 to 9 minutes (96 commuters, 28.3%), 45 to 59 minutes (64 commuters, 18.9%), and 20 to 24 minutes (45 commuters, 13.3%).
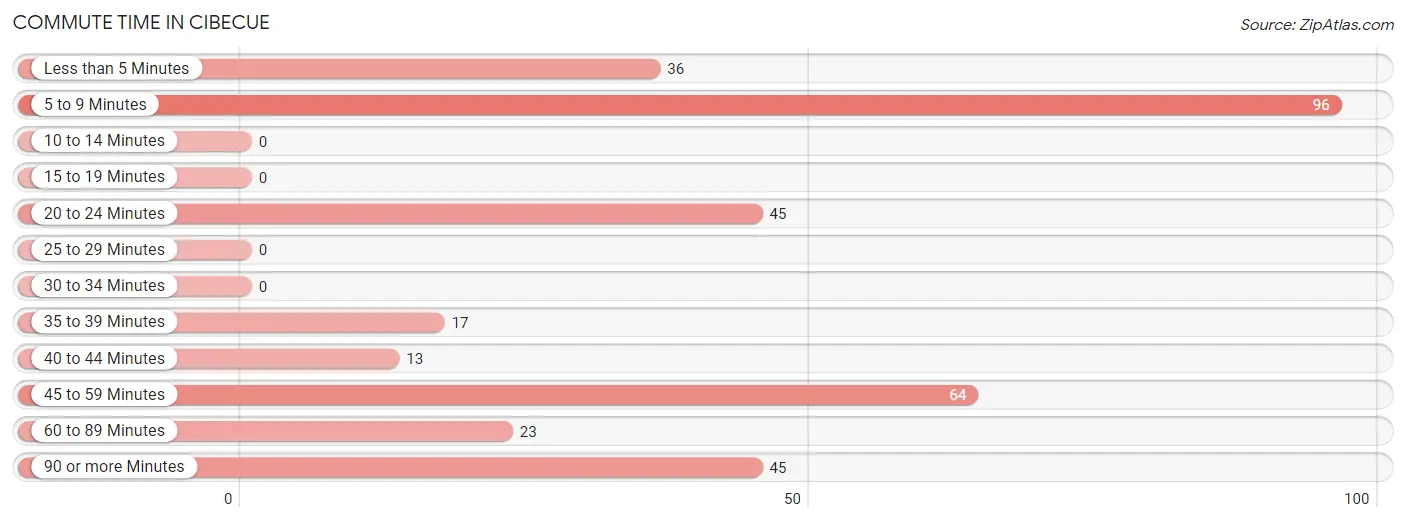
| Commute Time | # Commuters | % Commuters |
| Less than 5 Minutes | 36 | 10.6% |
| 5 to 9 Minutes | 96 | 28.3% |
| 10 to 14 Minutes | 0 | 0.0% |
| 15 to 19 Minutes | 0 | 0.0% |
| 20 to 24 Minutes | 45 | 13.3% |
| 25 to 29 Minutes | 0 | 0.0% |
| 30 to 34 Minutes | 0 | 0.0% |
| 35 to 39 Minutes | 17 | 5.0% |
| 40 to 44 Minutes | 13 | 3.8% |
| 45 to 59 Minutes | 64 | 18.9% |
| 60 to 89 Minutes | 23 | 6.8% |
| 90 or more Minutes | 45 | 13.3% |
Commute Time by Sex in Cibecue
The most common commute times in Cibecue are 5 to 9 minutes (39 commuters, 38.2%) for males and 5 to 9 minutes (57 commuters, 24.0%) for females.
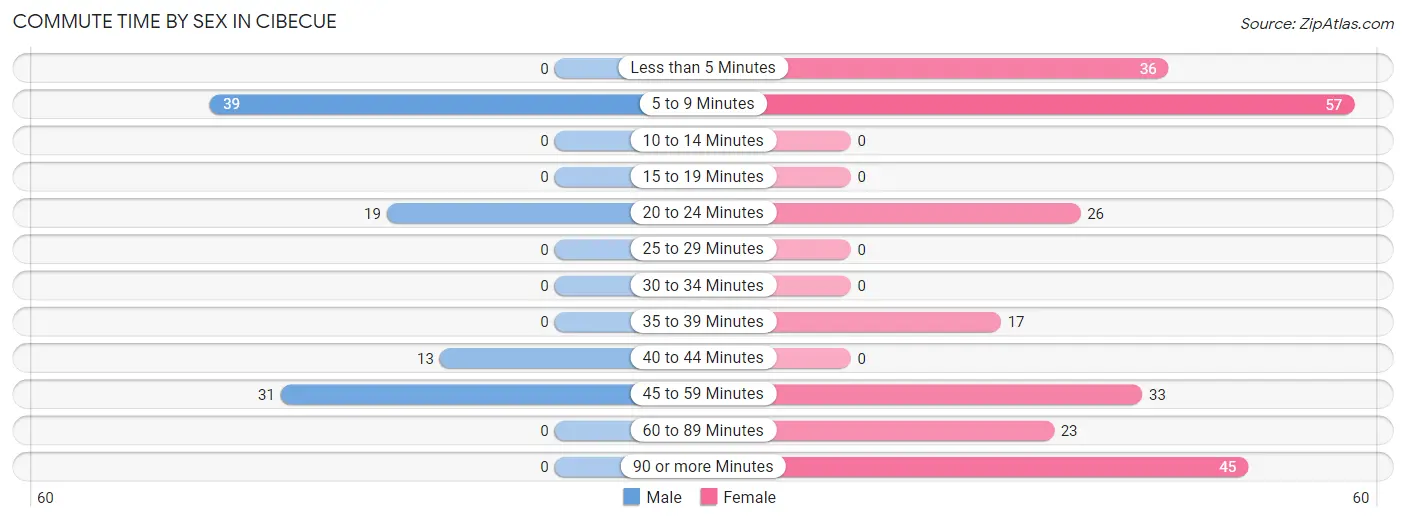
| Commute Time | Male | Female |
| Less than 5 Minutes | 0 (0.0%) | 36 (15.2%) |
| 5 to 9 Minutes | 39 (38.2%) | 57 (24.0%) |
| 10 to 14 Minutes | 0 (0.0%) | 0 (0.0%) |
| 15 to 19 Minutes | 0 (0.0%) | 0 (0.0%) |
| 20 to 24 Minutes | 19 (18.6%) | 26 (11.0%) |
| 25 to 29 Minutes | 0 (0.0%) | 0 (0.0%) |
| 30 to 34 Minutes | 0 (0.0%) | 0 (0.0%) |
| 35 to 39 Minutes | 0 (0.0%) | 17 (7.2%) |
| 40 to 44 Minutes | 13 (12.8%) | 0 (0.0%) |
| 45 to 59 Minutes | 31 (30.4%) | 33 (13.9%) |
| 60 to 89 Minutes | 0 (0.0%) | 23 (9.7%) |
| 90 or more Minutes | 0 (0.0%) | 45 (19.0%) |
Time of Departure to Work by Sex in Cibecue
The most frequent times of departure to work in Cibecue are 7:30 AM to 7:59 AM (41, 40.2%) for males and 8:00 AM to 8:29 AM (87, 36.7%) for females.
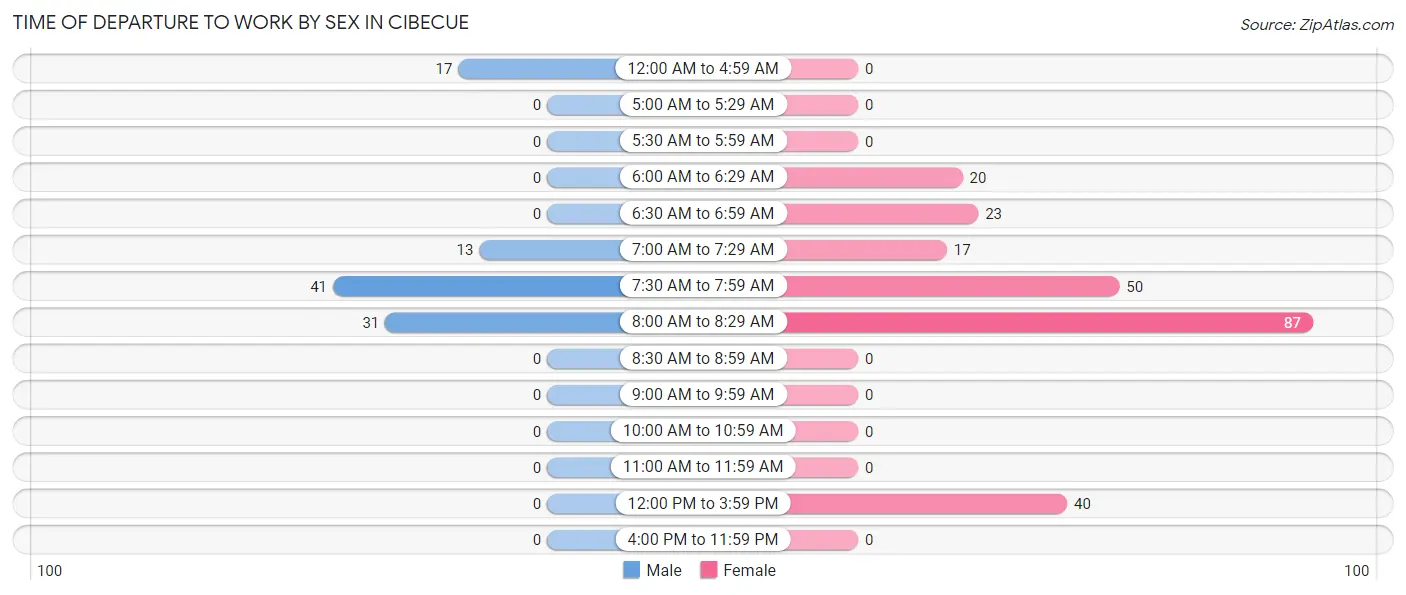
| Time of Departure | Male | Female |
| 12:00 AM to 4:59 AM | 17 (16.7%) | 0 (0.0%) |
| 5:00 AM to 5:29 AM | 0 (0.0%) | 0 (0.0%) |
| 5:30 AM to 5:59 AM | 0 (0.0%) | 0 (0.0%) |
| 6:00 AM to 6:29 AM | 0 (0.0%) | 20 (8.4%) |
| 6:30 AM to 6:59 AM | 0 (0.0%) | 23 (9.7%) |
| 7:00 AM to 7:29 AM | 13 (12.8%) | 17 (7.2%) |
| 7:30 AM to 7:59 AM | 41 (40.2%) | 50 (21.1%) |
| 8:00 AM to 8:29 AM | 31 (30.4%) | 87 (36.7%) |
| 8:30 AM to 8:59 AM | 0 (0.0%) | 0 (0.0%) |
| 9:00 AM to 9:59 AM | 0 (0.0%) | 0 (0.0%) |
| 10:00 AM to 10:59 AM | 0 (0.0%) | 0 (0.0%) |
| 11:00 AM to 11:59 AM | 0 (0.0%) | 0 (0.0%) |
| 12:00 PM to 3:59 PM | 0 (0.0%) | 40 (16.9%) |
| 4:00 PM to 11:59 PM | 0 (0.0%) | 0 (0.0%) |
| Total | 102 (100.0%) | 237 (100.0%) |
Housing Occupancy in Cibecue
Occupancy by Ownership in Cibecue
Of the total 357 dwellings in Cibecue, owner-occupied units account for 163 (45.7%), while renter-occupied units make up 194 (54.3%).
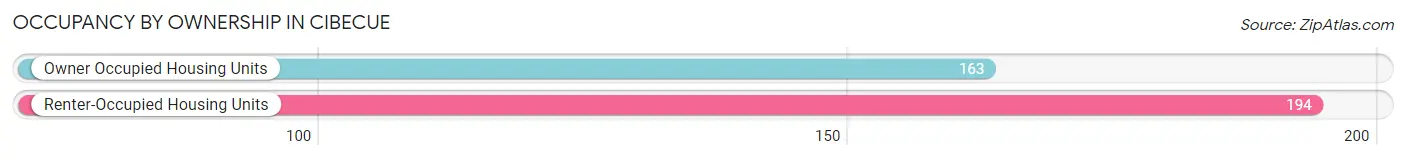
| Occupancy | # Housing Units | % Housing Units |
| Owner Occupied Housing Units | 163 | 45.7% |
| Renter-Occupied Housing Units | 194 | 54.3% |
| Total Occupied Housing Units | 357 | 100.0% |
Occupancy by Household Size in Cibecue
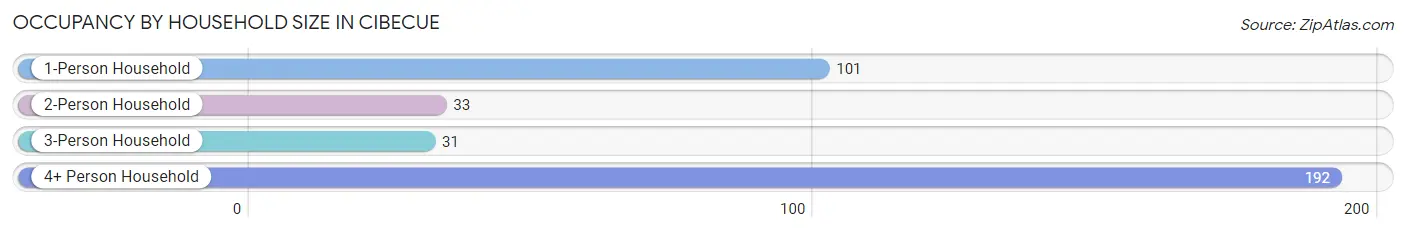
| Household Size | # Housing Units | % Housing Units |
| 1-Person Household | 101 | 28.3% |
| 2-Person Household | 33 | 9.2% |
| 3-Person Household | 31 | 8.7% |
| 4+ Person Household | 192 | 53.8% |
| Total Housing Units | 357 | 100.0% |
Occupancy by Ownership by Household Size in Cibecue
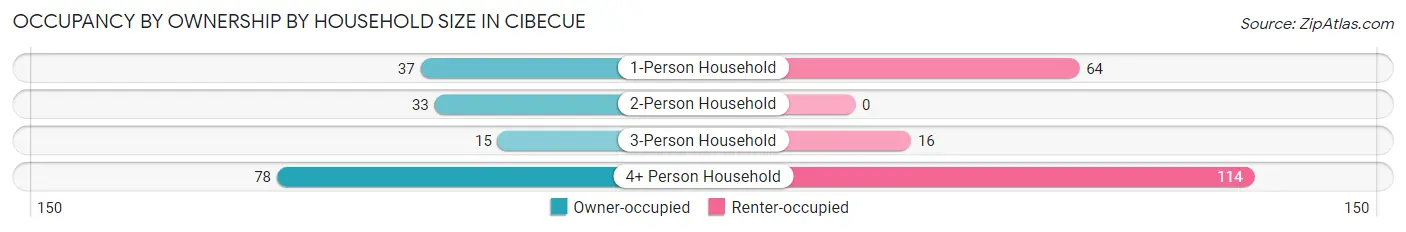
| Household Size | Owner-occupied | Renter-occupied |
| 1-Person Household | 37 (36.6%) | 64 (63.4%) |
| 2-Person Household | 33 (100.0%) | 0 (0.0%) |
| 3-Person Household | 15 (48.4%) | 16 (51.6%) |
| 4+ Person Household | 78 (40.6%) | 114 (59.4%) |
| Total Housing Units | 163 (45.7%) | 194 (54.3%) |
Occupancy by Educational Attainment in Cibecue
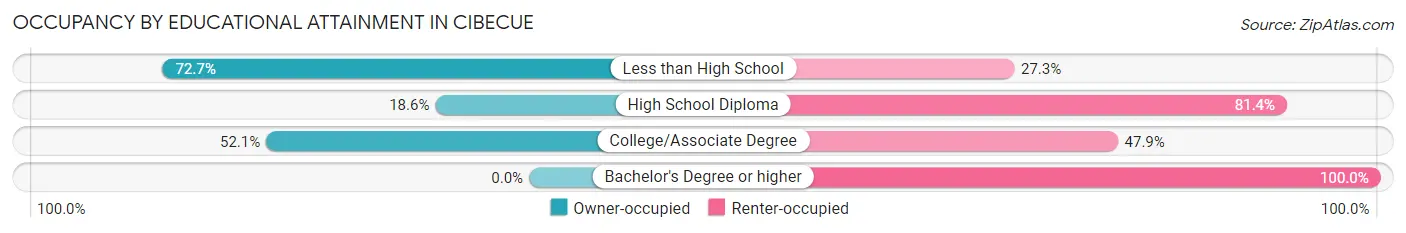
| Household Size | Owner-occupied | Renter-occupied |
| Less than High School | 93 (72.7%) | 35 (27.3%) |
| High School Diploma | 21 (18.6%) | 92 (81.4%) |
| College/Associate Degree | 49 (52.1%) | 45 (47.9%) |
| Bachelor's Degree or higher | 0 (0.0%) | 22 (100.0%) |
Occupancy by Age of Householder in Cibecue
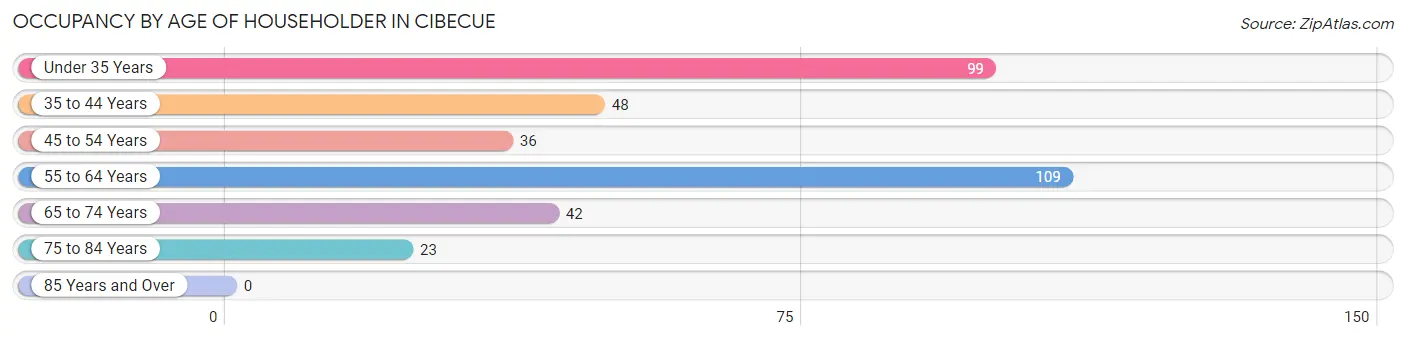
| Age Bracket | # Households | % Households |
| Under 35 Years | 99 | 27.7% |
| 35 to 44 Years | 48 | 13.5% |
| 45 to 54 Years | 36 | 10.1% |
| 55 to 64 Years | 109 | 30.5% |
| 65 to 74 Years | 42 | 11.8% |
| 75 to 84 Years | 23 | 6.4% |
| 85 Years and Over | 0 | 0.0% |
| Total | 357 | 100.0% |
Housing Finances in Cibecue
Median Income by Occupancy in Cibecue
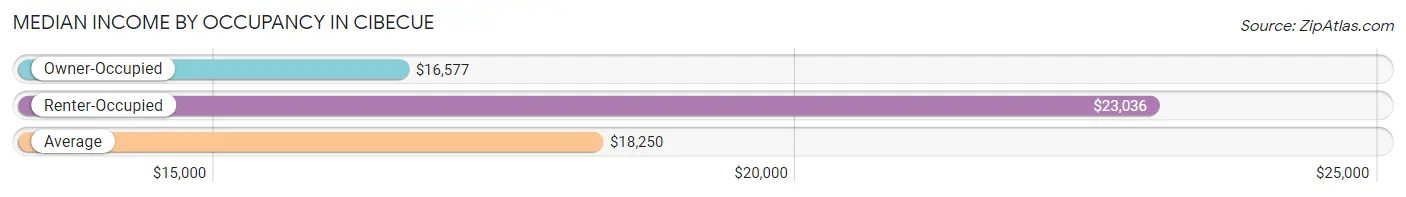
| Occupancy Type | # Households | Median Income |
| Owner-Occupied | 163 (45.7%) | $16,577 |
| Renter-Occupied | 194 (54.3%) | $23,036 |
| Average | 357 (100.0%) | $18,250 |
Occupancy by Householder Income Bracket in Cibecue
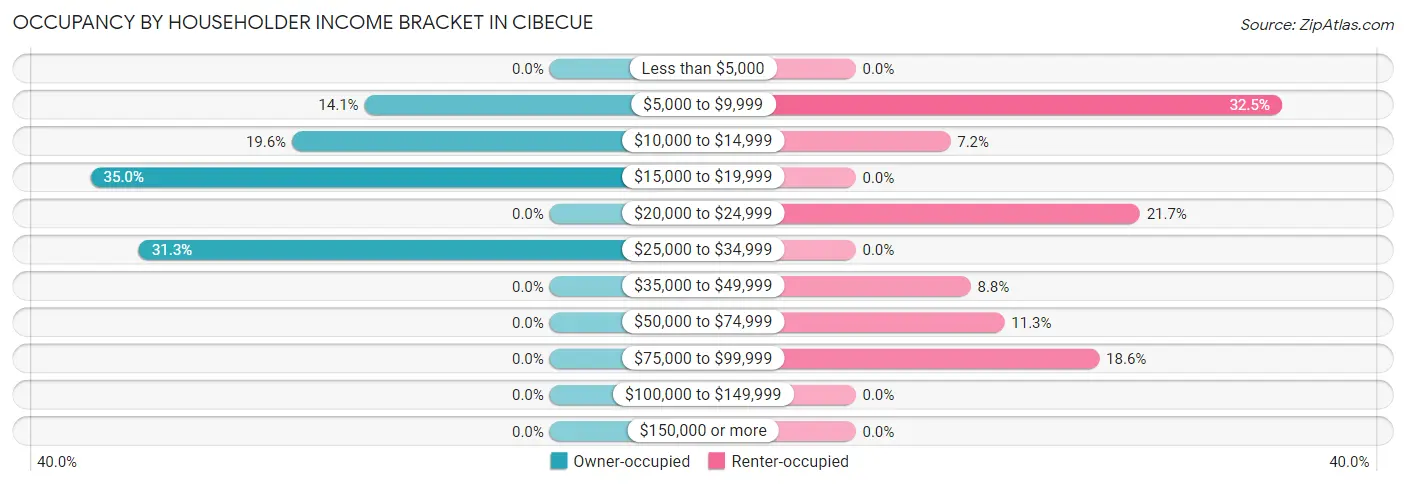
| Income Bracket | Owner-occupied | Renter-occupied |
| Less than $5,000 | 0 (0.0%) | 0 (0.0%) |
| $5,000 to $9,999 | 23 (14.1%) | 63 (32.5%) |
| $10,000 to $14,999 | 32 (19.6%) | 14 (7.2%) |
| $15,000 to $19,999 | 57 (35.0%) | 0 (0.0%) |
| $20,000 to $24,999 | 0 (0.0%) | 42 (21.6%) |
| $25,000 to $34,999 | 51 (31.3%) | 0 (0.0%) |
| $35,000 to $49,999 | 0 (0.0%) | 17 (8.8%) |
| $50,000 to $74,999 | 0 (0.0%) | 22 (11.3%) |
| $75,000 to $99,999 | 0 (0.0%) | 36 (18.6%) |
| $100,000 to $149,999 | 0 (0.0%) | 0 (0.0%) |
| $150,000 or more | 0 (0.0%) | 0 (0.0%) |
| Total | 163 (100.0%) | 194 (100.0%) |
Monthly Housing Cost Tiers in Cibecue
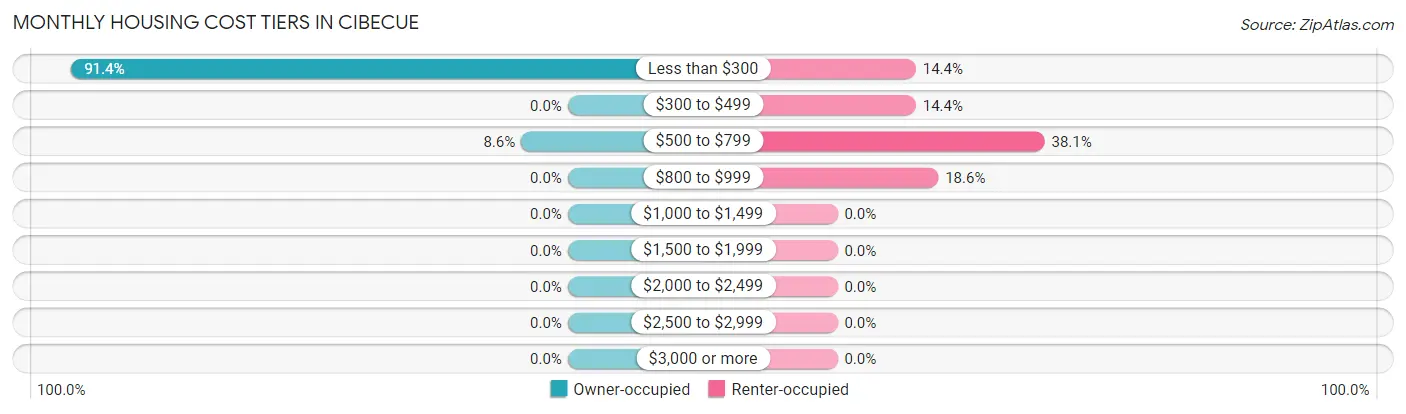
| Monthly Cost | Owner-occupied | Renter-occupied |
| Less than $300 | 149 (91.4%) | 28 (14.4%) |
| $300 to $499 | 0 (0.0%) | 28 (14.4%) |
| $500 to $799 | 14 (8.6%) | 74 (38.1%) |
| $800 to $999 | 0 (0.0%) | 36 (18.6%) |
| $1,000 to $1,499 | 0 (0.0%) | 0 (0.0%) |
| $1,500 to $1,999 | 0 (0.0%) | 0 (0.0%) |
| $2,000 to $2,499 | 0 (0.0%) | 0 (0.0%) |
| $2,500 to $2,999 | 0 (0.0%) | 0 (0.0%) |
| $3,000 or more | 0 (0.0%) | 0 (0.0%) |
| Total | 163 (100.0%) | 194 (100.0%) |
Physical Housing Characteristics in Cibecue
Housing Structures in Cibecue
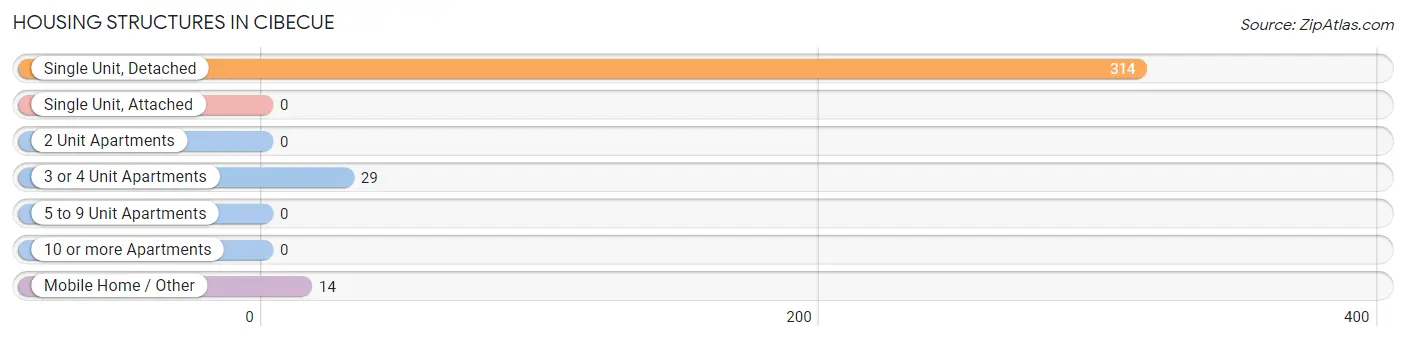
| Structure Type | # Housing Units | % Housing Units |
| Single Unit, Detached | 314 | 88.0% |
| Single Unit, Attached | 0 | 0.0% |
| 2 Unit Apartments | 0 | 0.0% |
| 3 or 4 Unit Apartments | 29 | 8.1% |
| 5 to 9 Unit Apartments | 0 | 0.0% |
| 10 or more Apartments | 0 | 0.0% |
| Mobile Home / Other | 14 | 3.9% |
| Total | 357 | 100.0% |
Housing Structures by Occupancy in Cibecue
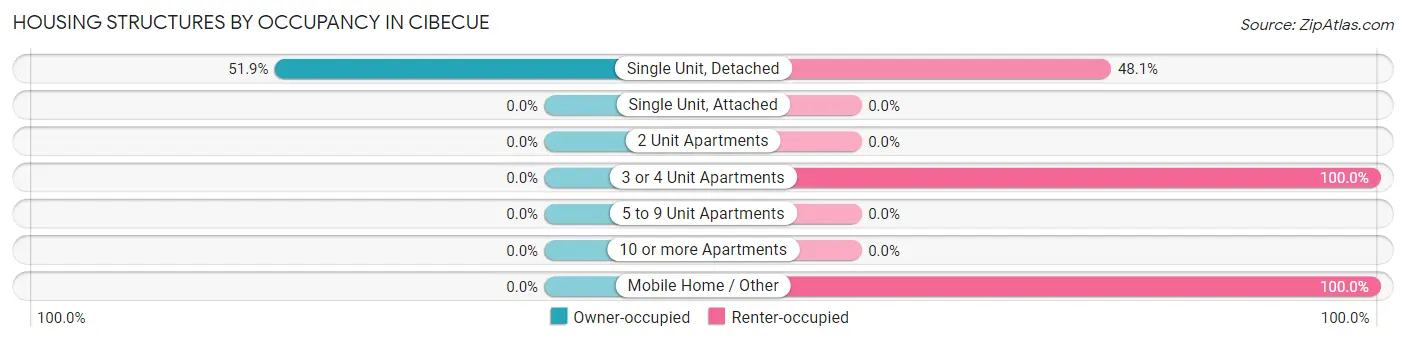
| Structure Type | Owner-occupied | Renter-occupied |
| Single Unit, Detached | 163 (51.9%) | 151 (48.1%) |
| Single Unit, Attached | 0 (0.0%) | 0 (0.0%) |
| 2 Unit Apartments | 0 (0.0%) | 0 (0.0%) |
| 3 or 4 Unit Apartments | 0 (0.0%) | 29 (100.0%) |
| 5 to 9 Unit Apartments | 0 (0.0%) | 0 (0.0%) |
| 10 or more Apartments | 0 (0.0%) | 0 (0.0%) |
| Mobile Home / Other | 0 (0.0%) | 14 (100.0%) |
| Total | 163 (45.7%) | 194 (54.3%) |
Housing Structures by Number of Rooms in Cibecue
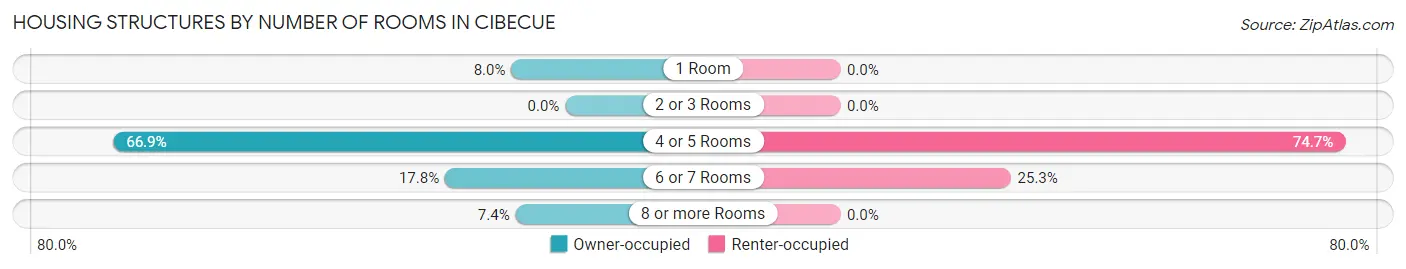
| Number of Rooms | Owner-occupied | Renter-occupied |
| 1 Room | 13 (8.0%) | 0 (0.0%) |
| 2 or 3 Rooms | 0 (0.0%) | 0 (0.0%) |
| 4 or 5 Rooms | 109 (66.9%) | 145 (74.7%) |
| 6 or 7 Rooms | 29 (17.8%) | 49 (25.3%) |
| 8 or more Rooms | 12 (7.4%) | 0 (0.0%) |
| Total | 163 (100.0%) | 194 (100.0%) |
Housing Structure by Heating Type in Cibecue
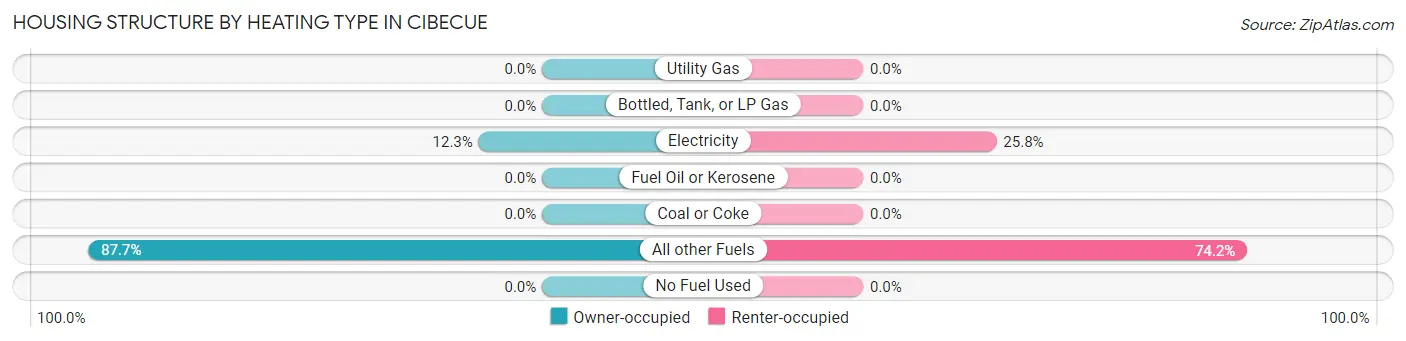
| Heating Type | Owner-occupied | Renter-occupied |
| Utility Gas | 0 (0.0%) | 0 (0.0%) |
| Bottled, Tank, or LP Gas | 0 (0.0%) | 0 (0.0%) |
| Electricity | 20 (12.3%) | 50 (25.8%) |
| Fuel Oil or Kerosene | 0 (0.0%) | 0 (0.0%) |
| Coal or Coke | 0 (0.0%) | 0 (0.0%) |
| All other Fuels | 143 (87.7%) | 144 (74.2%) |
| No Fuel Used | 0 (0.0%) | 0 (0.0%) |
| Total | 163 (100.0%) | 194 (100.0%) |
Household Vehicle Usage in Cibecue
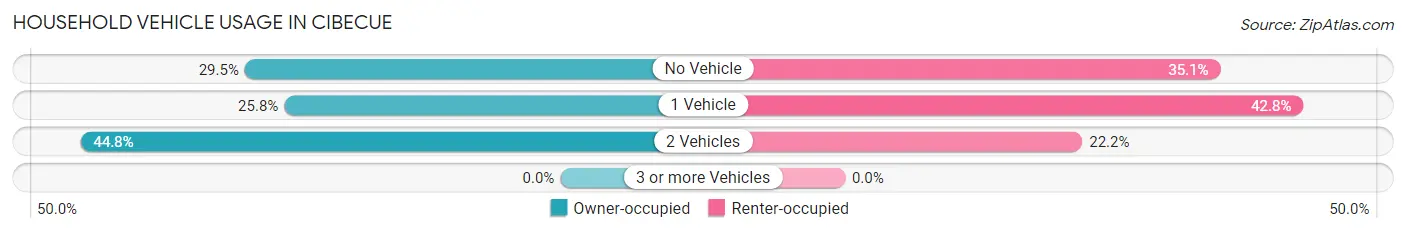
| Vehicles per Household | Owner-occupied | Renter-occupied |
| No Vehicle | 48 (29.4%) | 68 (35.0%) |
| 1 Vehicle | 42 (25.8%) | 83 (42.8%) |
| 2 Vehicles | 73 (44.8%) | 43 (22.2%) |
| 3 or more Vehicles | 0 (0.0%) | 0 (0.0%) |
| Total | 163 (100.0%) | 194 (100.0%) |
Real Estate & Mortgages in Cibecue
Real Estate and Mortgage Overview in Cibecue
| Characteristic | Without Mortgage | With Mortgage |
| Housing Units | 149 | 14 |
| Median Property Value | $75,400 | $0 |
| Median Household Income | $16,741 | $0 |
| Monthly Housing Costs | $202 | $0 |
| Real Estate Taxes | - | - |
Property Value by Mortgage Status in Cibecue
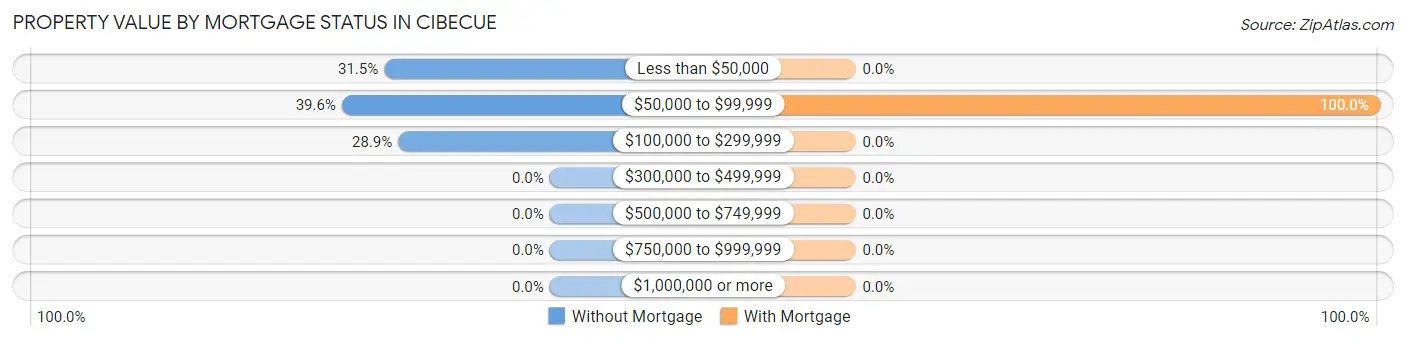
| Property Value | Without Mortgage | With Mortgage |
| Less than $50,000 | 47 (31.5%) | 0 (0.0%) |
| $50,000 to $99,999 | 59 (39.6%) | 14 (100.0%) |
| $100,000 to $299,999 | 43 (28.9%) | 0 (0.0%) |
| $300,000 to $499,999 | 0 (0.0%) | 0 (0.0%) |
| $500,000 to $749,999 | 0 (0.0%) | 0 (0.0%) |
| $750,000 to $999,999 | 0 (0.0%) | 0 (0.0%) |
| $1,000,000 or more | 0 (0.0%) | 0 (0.0%) |
| Total | 149 (100.0%) | 14 (100.0%) |
Household Income by Mortgage Status in Cibecue
| Household Income | Without Mortgage | With Mortgage |
| Less than $10,000 | 23 (15.4%) | 0 (0.0%) |
| $10,000 to $24,999 | 75 (50.3%) | 0 (0.0%) |
| $25,000 to $34,999 | 51 (34.2%) | 14 (100.0%) |
| $35,000 to $49,999 | 0 (0.0%) | 0 (0.0%) |
| $50,000 to $74,999 | 0 (0.0%) | 0 (0.0%) |
| $75,000 to $99,999 | 0 (0.0%) | 0 (0.0%) |
| $100,000 to $149,999 | 0 (0.0%) | 0 (0.0%) |
| $150,000 or more | 0 (0.0%) | 0 (0.0%) |
| Total | 149 (100.0%) | 14 (100.0%) |
Property Value to Household Income Ratio in Cibecue
| Value-to-Income Ratio | Without Mortgage | With Mortgage |
| Less than 2.0x | 20 (13.4%) | 0 (0.0%) |
| 2.0x to 2.9x | 27 (18.1%) | 0 (0.0%) |
| 3.0x to 3.9x | 21 (14.1%) | 0 (0.0%) |
| 4.0x or more | 81 (54.4%) | 14 (100.0%) |
| Total | 149 (100.0%) | 14 (100.0%) |
Real Estate Taxes by Mortgage Status in Cibecue
| Property Taxes | Without Mortgage | With Mortgage |
| Less than $800 | 0 (0.0%) | 0 (0.0%) |
| $800 to $1,499 | 0 (0.0%) | 0 (0.0%) |
| $800 to $1,499 | 0 (0.0%) | 0 (0.0%) |
| Total | 149 (100.0%) | 14 (100.0%) |
Health & Disability in Cibecue
Health Insurance Coverage by Age in Cibecue
| Age Bracket | With Coverage | Without Coverage |
| Under 6 Years | 98 (61.6%) | 61 (38.4%) |
| 6 to 18 Years | 345 (78.9%) | 92 (21.0%) |
| 19 to 25 Years | 121 (69.5%) | 53 (30.5%) |
| 26 to 34 Years | 184 (83.6%) | 36 (16.4%) |
| 35 to 44 Years | 135 (100.0%) | 0 (0.0%) |
| 45 to 54 Years | 61 (78.2%) | 17 (21.8%) |
| 55 to 64 Years | 95 (76.6%) | 29 (23.4%) |
| 65 to 74 Years | 56 (81.2%) | 13 (18.8%) |
| 75 Years and older | 23 (100.0%) | 0 (0.0%) |
| Total | 1,118 (78.8%) | 301 (21.2%) |
Health Insurance Coverage by Citizenship Status in Cibecue
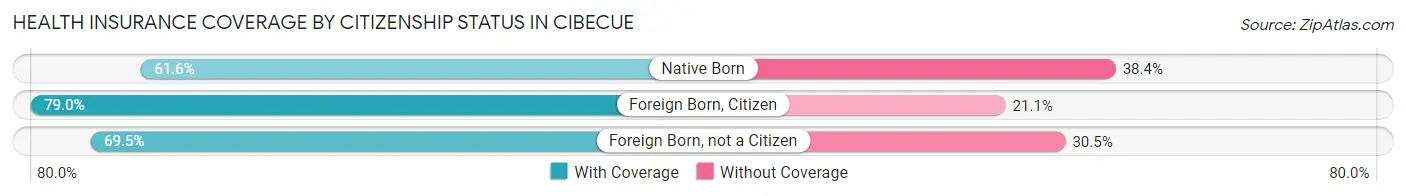
| Citizenship Status | With Coverage | Without Coverage |
| Native Born | 98 (61.6%) | 61 (38.4%) |
| Foreign Born, Citizen | 345 (78.9%) | 92 (21.0%) |
| Foreign Born, not a Citizen | 121 (69.5%) | 53 (30.5%) |
Health Insurance Coverage by Household Income in Cibecue
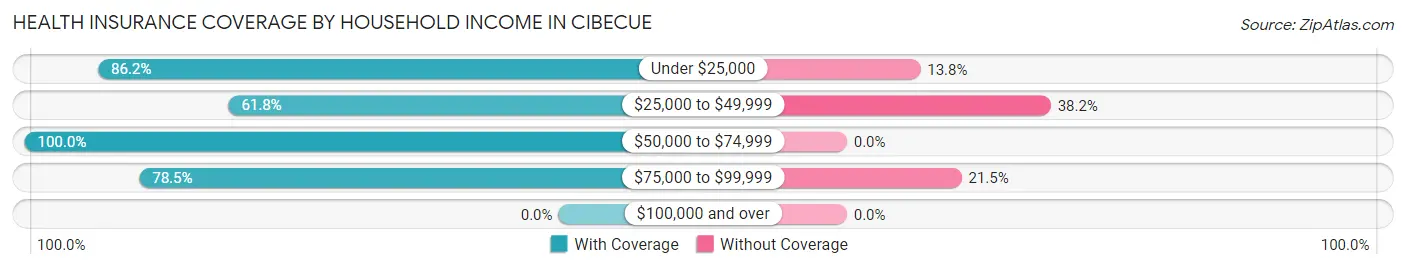
| Household Income | With Coverage | Without Coverage |
| Under $25,000 | 695 (86.2%) | 111 (13.8%) |
| $25,000 to $49,999 | 233 (61.8%) | 144 (38.2%) |
| $50,000 to $74,999 | 22 (100.0%) | 0 (0.0%) |
| $75,000 to $99,999 | 168 (78.5%) | 46 (21.5%) |
| $100,000 and over | 0 (0.0%) | 0 (0.0%) |
Public vs Private Health Insurance Coverage by Age in Cibecue
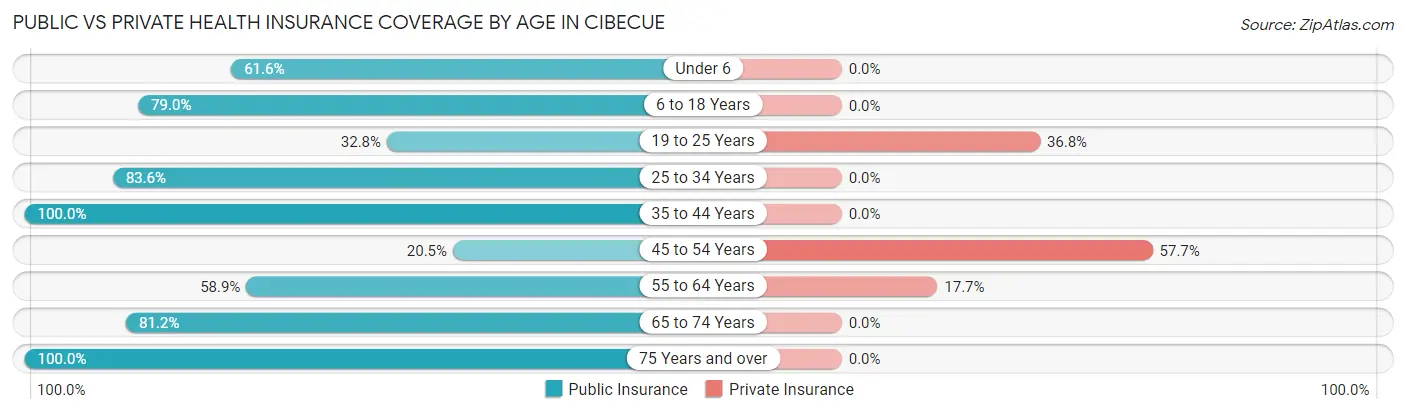
| Age Bracket | Public Insurance | Private Insurance |
| Under 6 | 98 (61.6%) | 0 (0.0%) |
| 6 to 18 Years | 345 (78.9%) | 0 (0.0%) |
| 19 to 25 Years | 57 (32.8%) | 64 (36.8%) |
| 25 to 34 Years | 184 (83.6%) | 0 (0.0%) |
| 35 to 44 Years | 135 (100.0%) | 0 (0.0%) |
| 45 to 54 Years | 16 (20.5%) | 45 (57.7%) |
| 55 to 64 Years | 73 (58.9%) | 22 (17.7%) |
| 65 to 74 Years | 56 (81.2%) | 0 (0.0%) |
| 75 Years and over | 23 (100.0%) | 0 (0.0%) |
| Total | 987 (69.6%) | 131 (9.2%) |
Disability Status by Sex by Age in Cibecue
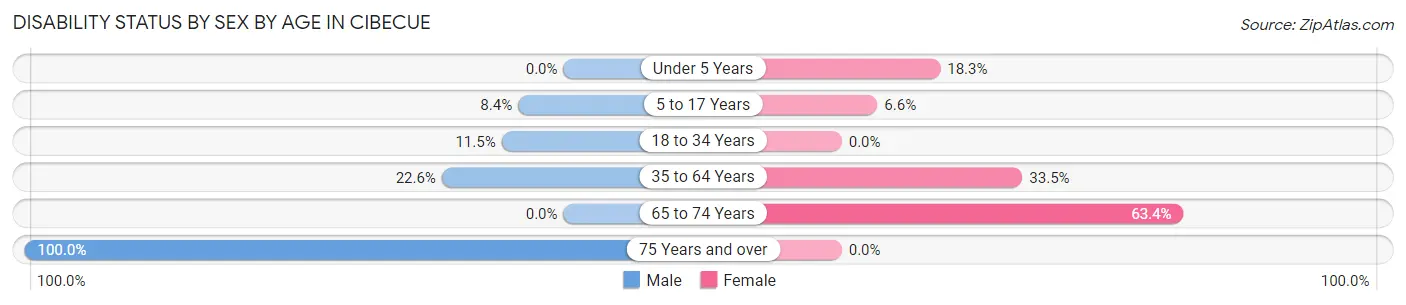
| Age Bracket | Male | Female |
| Under 5 Years | 0 (0.0%) | 17 (18.3%) |
| 5 to 17 Years | 16 (8.4%) | 16 (6.6%) |
| 18 to 34 Years | 24 (11.5%) | 0 (0.0%) |
| 35 to 64 Years | 35 (22.6%) | 61 (33.5%) |
| 65 to 74 Years | 0 (0.0%) | 26 (63.4%) |
| 75 Years and over | 23 (100.0%) | 0 (0.0%) |
Disability Class by Sex by Age in Cibecue
Disability Class: Hearing Difficulty
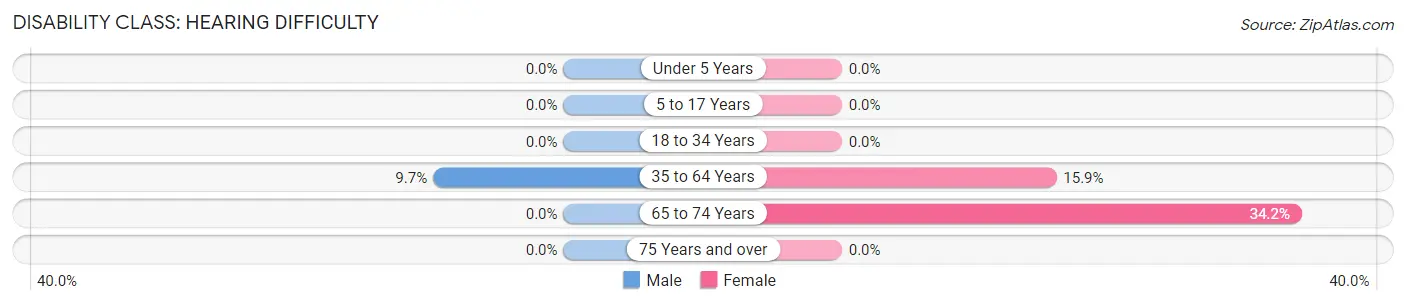
| Age Bracket | Male | Female |
| Under 5 Years | 0 (0.0%) | 0 (0.0%) |
| 5 to 17 Years | 0 (0.0%) | 0 (0.0%) |
| 18 to 34 Years | 0 (0.0%) | 0 (0.0%) |
| 35 to 64 Years | 15 (9.7%) | 29 (15.9%) |
| 65 to 74 Years | 0 (0.0%) | 14 (34.2%) |
| 75 Years and over | 0 (0.0%) | 0 (0.0%) |
Disability Class: Vision Difficulty
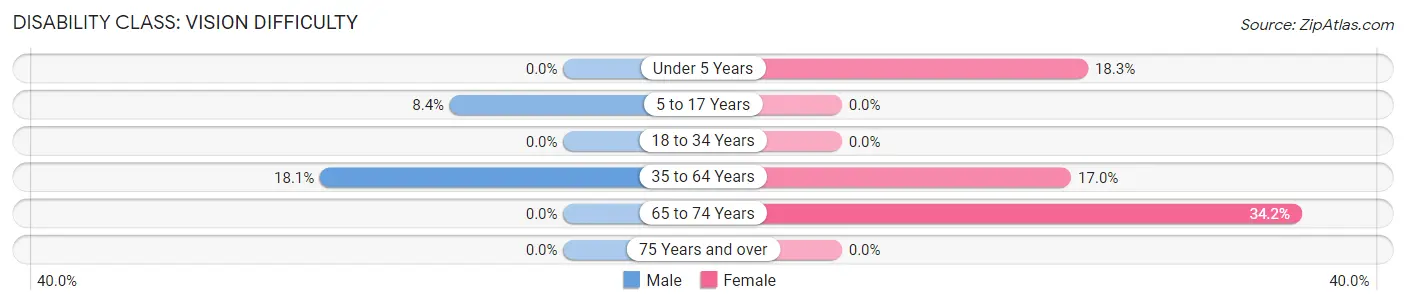
| Age Bracket | Male | Female |
| Under 5 Years | 0 (0.0%) | 17 (18.3%) |
| 5 to 17 Years | 16 (8.4%) | 0 (0.0%) |
| 18 to 34 Years | 0 (0.0%) | 0 (0.0%) |
| 35 to 64 Years | 28 (18.1%) | 31 (17.0%) |
| 65 to 74 Years | 0 (0.0%) | 14 (34.2%) |
| 75 Years and over | 0 (0.0%) | 0 (0.0%) |
Disability Class: Cognitive Difficulty
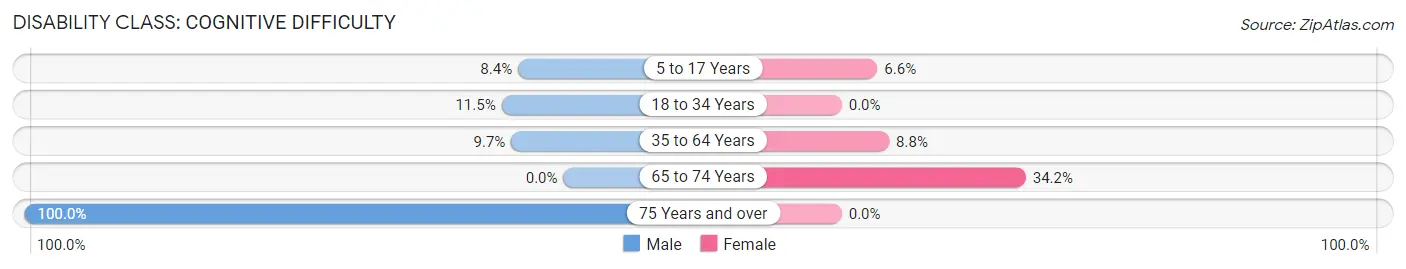
| Age Bracket | Male | Female |
| 5 to 17 Years | 16 (8.4%) | 16 (6.6%) |
| 18 to 34 Years | 24 (11.5%) | 0 (0.0%) |
| 35 to 64 Years | 15 (9.7%) | 16 (8.8%) |
| 65 to 74 Years | 0 (0.0%) | 14 (34.2%) |
| 75 Years and over | 23 (100.0%) | 0 (0.0%) |
Disability Class: Ambulatory Difficulty
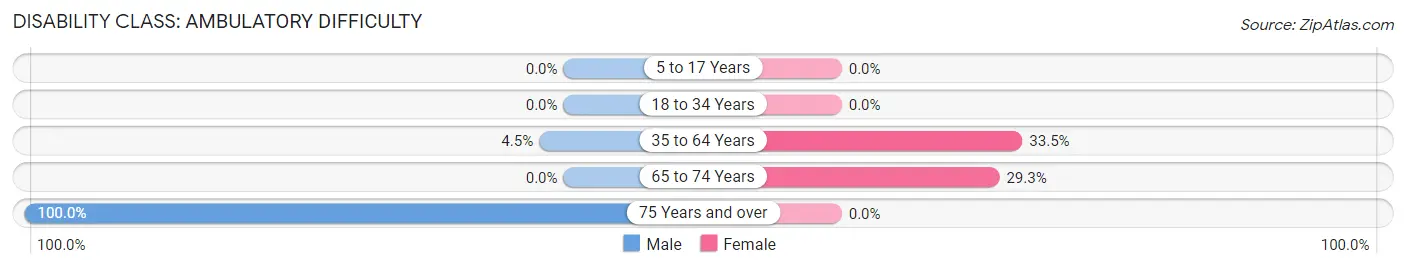
| Age Bracket | Male | Female |
| 5 to 17 Years | 0 (0.0%) | 0 (0.0%) |
| 18 to 34 Years | 0 (0.0%) | 0 (0.0%) |
| 35 to 64 Years | 7 (4.5%) | 61 (33.5%) |
| 65 to 74 Years | 0 (0.0%) | 12 (29.3%) |
| 75 Years and over | 23 (100.0%) | 0 (0.0%) |
Disability Class: Self-Care Difficulty
| Age Bracket | Male | Female |
| 5 to 17 Years | 0 (0.0%) | 0 (0.0%) |
| 18 to 34 Years | 0 (0.0%) | 0 (0.0%) |
| 35 to 64 Years | 15 (9.7%) | 45 (24.7%) |
| 65 to 74 Years | 0 (0.0%) | 0 (0.0%) |
| 75 Years and over | 0 (0.0%) | 0 (0.0%) |
Technology Access in Cibecue
Computing Device Access in Cibecue
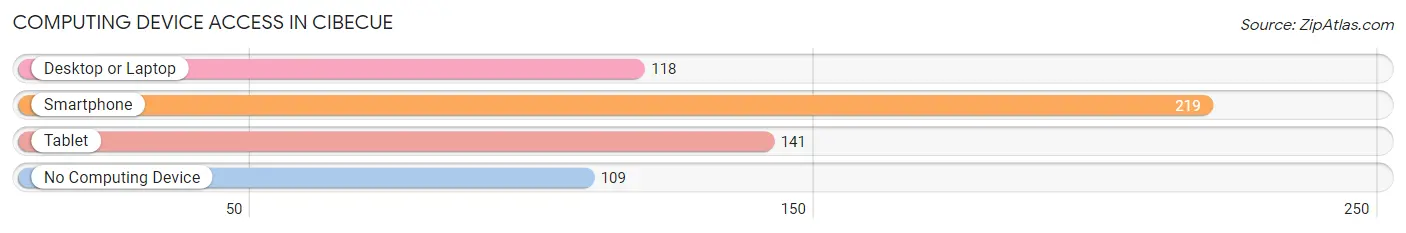
| Device Type | # Households | % Households |
| Desktop or Laptop | 118 | 33.1% |
| Smartphone | 219 | 61.3% |
| Tablet | 141 | 39.5% |
| No Computing Device | 109 | 30.5% |
| Total | 357 | 100.0% |
Internet Access in Cibecue
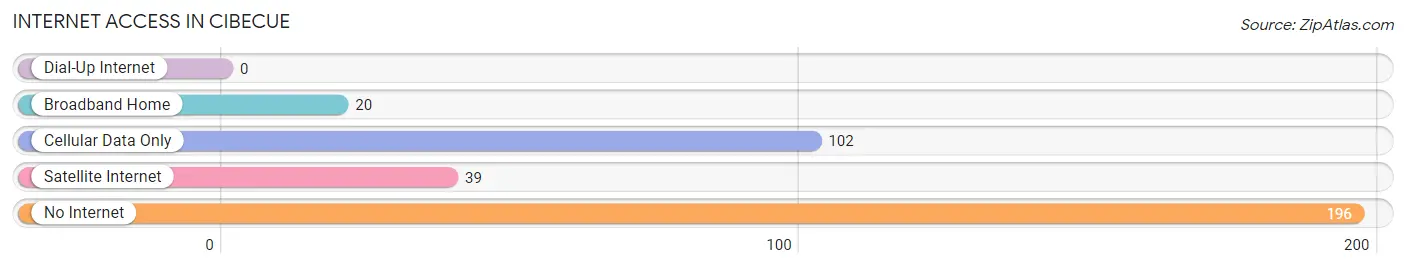
| Internet Type | # Households | % Households |
| Dial-Up Internet | 0 | 0.0% |
| Broadband Home | 20 | 5.6% |
| Cellular Data Only | 102 | 28.6% |
| Satellite Internet | 39 | 10.9% |
| No Internet | 196 | 54.9% |
| Total | 357 | 100.0% |
Cibecue Summary
Cibecue is a small unincorporated community located in the White Mountains of Arizona, United States. It is located in the Fort Apache Indian Reservation, which is home to the White Mountain Apache Tribe. The community is located in the Cibecue Creek Valley, which is a tributary of the Salt River. The population of Cibecue was estimated to be around 500 in 2020.
History
The White Mountain Apache Tribe has lived in the Cibecue Creek Valley for centuries. The tribe has a long history of trading with other tribes in the area, including the Navajo, Hopi, and Zuni. The tribe also had a long history of conflict with the United States government, which led to the establishment of the Fort Apache Indian Reservation in 1871.
The first non-Native American settlers arrived in the Cibecue Creek Valley in the late 1800s. These settlers were mostly ranchers and farmers who were attracted to the area by the fertile soil and abundant water. The first post office in Cibecue was established in 1891.
Geography
Cibecue is located in the White Mountains of Arizona, in the Cibecue Creek Valley. The valley is surrounded by the White Mountain Apache Reservation, which is home to the White Mountain Apache Tribe. The valley is located at an elevation of 5,000 feet and is approximately 30 miles from the nearest town, Show Low.
The climate in Cibecue is semi-arid, with hot summers and cold winters. The average annual temperature is around 50 degrees Fahrenheit. The average annual precipitation is around 12 inches.
Economy
The economy of Cibecue is largely based on agriculture and tourism. The White Mountain Apache Tribe operates a number of businesses in the area, including a casino, a hotel, and a golf course. The tribe also operates a number of tourist attractions, including a museum, a cultural center, and a rodeo.
The White Mountain Apache Tribe also operates a number of businesses in the area, including a lumber mill, a sawmill, and a woodworking shop. The tribe also operates a number of retail stores, including a grocery store, a hardware store, and a clothing store.
Demographics
The population of Cibecue was estimated to be around 500 in 2020. The majority of the population is Native American, with the White Mountain Apache Tribe making up the majority of the population. The median age of the population is around 30 years old. The median household income is around $30,000. The majority of the population is employed in the agricultural and tourism industries.
Common Questions
What is Per Capita Income in Cibecue?
Per Capita income in Cibecue is $7,328.
What is the Median Family Income in Cibecue?
Median Family Income in Cibecue is $20,938.
What is the Median Household income in Cibecue?
Median Household Income in Cibecue is $18,250.
What is Income or Wage Gap in Cibecue?
Income or Wage Gap in Cibecue is 31.0%.
Women in Cibecue earn 69.0 cents for every dollar earned by a man.
What is Inequality or Gini Index in Cibecue?
Inequality or Gini Index in Cibecue is 0.45.
What is the Total Population of Cibecue?
Total Population of Cibecue is 1,419.
What is the Total Male Population of Cibecue?
Total Male Population of Cibecue is 657.
What is the Total Female Population of Cibecue?
Total Female Population of Cibecue is 762.
What is the Ratio of Males per 100 Females in Cibecue?
There are 86.22 Males per 100 Females in Cibecue.
What is the Ratio of Females per 100 Males in Cibecue?
There are 115.98 Females per 100 Males in Cibecue.
What is the Median Population Age in Cibecue?
Median Population Age in Cibecue is 25.1 Years.
What is the Average Family Size in Cibecue
Average Family Size in Cibecue is 5.0 People.
What is the Average Household Size in Cibecue
Average Household Size in Cibecue is 4.0 People.
How Large is the Labor Force in Cibecue?
There are 405 People in the Labor Forcein in Cibecue.
What is the Percentage of People in the Labor Force in Cibecue?
46.8% of People are in the Labor Force in Cibecue.
What is the Unemployment Rate in Cibecue?
Unemployment Rate in Cibecue is 16.3%.