Naco, AZ Map & Demographics
Naco Map
Naco Overview
$16,765
PER CAPITA INCOME
$52,776
AVG FAMILY INCOME
$42,500
AVG HOUSEHOLD INCOME
47.1%
WAGE / INCOME GAP [ % ]
52.9¢/ $1
WAGE / INCOME GAP [ $ ]
0.42
INEQUALITY / GINI INDEX
1,189
TOTAL POPULATION
545
MALE POPULATION
644
FEMALE POPULATION
84.63
MALES / 100 FEMALES
118.17
FEMALES / 100 MALES
29.3
MEDIAN AGE
4.3
AVG FAMILY SIZE
3.1
AVG HOUSEHOLD SIZE
416
LABOR FORCE [ PEOPLE ]
50.9%
PERCENT IN LABOR FORCE
5.0%
UNEMPLOYMENT RATE
Naco Zip Codes
Naco Area Codes
Income in Naco
Income Overview in Naco
Per Capita Income in Naco is $16,765, while median incomes of families and households are $52,776 and $42,500 respectively.
| Characteristic | Number | Measure |
| Per Capita Income | 1,189 | $16,765 |
| Median Family Income | 237 | $52,776 |
| Mean Family Income | 237 | $61,734 |
| Median Household Income | 378 | $42,500 |
| Mean Household Income | 378 | $47,611 |
| Income Deficit | 237 | $0 |
| Wage / Income Gap (%) | 1,189 | 47.06% |
| Wage / Income Gap ($) | 1,189 | 52.94¢ per $1 |
| Gini / Inequality Index | 1,189 | 0.42 |
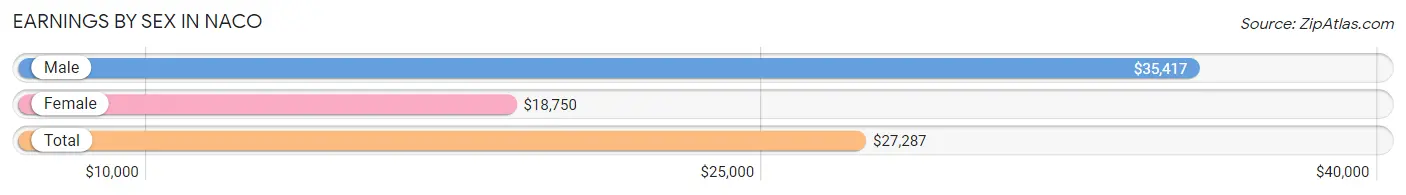
Earnings by Sex in Naco
Average Earnings in Naco are $27,287, $35,417 for men and $18,750 for women, a difference of 47.1%.
| Sex | Number | Average Earnings |
| Male | 269 (63.1%) | $35,417 |
| Female | 157 (36.8%) | $18,750 |
| Total | 426 (100.0%) | $27,287 |
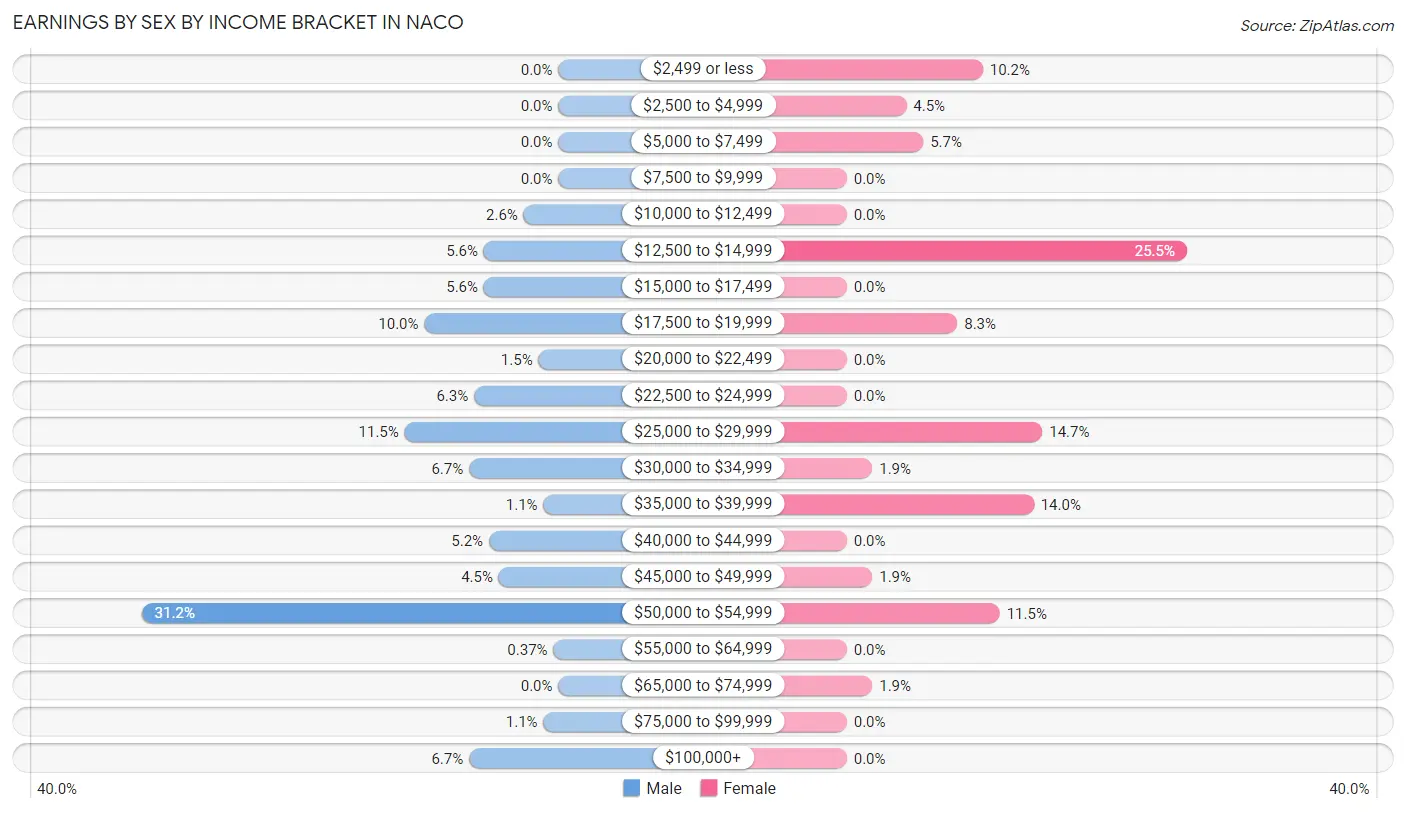
Earnings by Sex by Income Bracket in Naco
The most common earnings brackets in Naco are $50,000 to $54,999 for men (84 | 31.2%) and $12,500 to $14,999 for women (40 | 25.5%).
| Income | Male | Female |
| $2,499 or less | 0 (0.0%) | 16 (10.2%) |
| $2,500 to $4,999 | 0 (0.0%) | 7 (4.5%) |
| $5,000 to $7,499 | 0 (0.0%) | 9 (5.7%) |
| $7,500 to $9,999 | 0 (0.0%) | 0 (0.0%) |
| $10,000 to $12,499 | 7 (2.6%) | 0 (0.0%) |
| $12,500 to $14,999 | 15 (5.6%) | 40 (25.5%) |
| $15,000 to $17,499 | 15 (5.6%) | 0 (0.0%) |
| $17,500 to $19,999 | 27 (10.0%) | 13 (8.3%) |
| $20,000 to $22,499 | 4 (1.5%) | 0 (0.0%) |
| $22,500 to $24,999 | 17 (6.3%) | 0 (0.0%) |
| $25,000 to $29,999 | 31 (11.5%) | 23 (14.6%) |
| $30,000 to $34,999 | 18 (6.7%) | 3 (1.9%) |
| $35,000 to $39,999 | 3 (1.1%) | 22 (14.0%) |
| $40,000 to $44,999 | 14 (5.2%) | 0 (0.0%) |
| $45,000 to $49,999 | 12 (4.5%) | 3 (1.9%) |
| $50,000 to $54,999 | 84 (31.2%) | 18 (11.5%) |
| $55,000 to $64,999 | 1 (0.4%) | 0 (0.0%) |
| $65,000 to $74,999 | 0 (0.0%) | 3 (1.9%) |
| $75,000 to $99,999 | 3 (1.1%) | 0 (0.0%) |
| $100,000+ | 18 (6.7%) | 0 (0.0%) |
| Total | 269 (100.0%) | 157 (100.0%) |
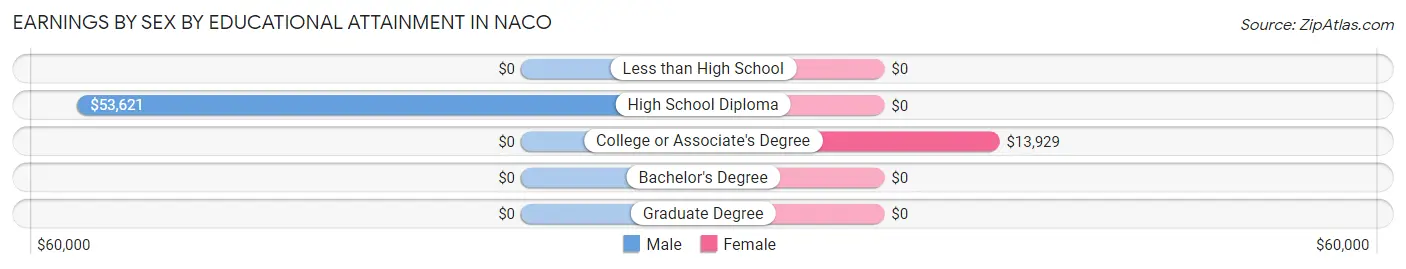
Earnings by Sex by Educational Attainment in Naco
Average earnings in Naco are $51,484 for men and $14,688 for women, a difference of 71.5%. Men with an educational attainment of high school diploma enjoy the highest average annual earnings of $53,621, while those with high school diploma education earn the least with $53,621. Women with an educational attainment of college or associate's degree earn the most with the average annual earnings of $13,929, while those with college or associate's degree education have the smallest earnings of $13,929.
| Educational Attainment | Male Income | Female Income |
| Less than High School | - | - |
| High School Diploma | $53,621 | $0 |
| College or Associate's Degree | - | - |
| Bachelor's Degree | - | - |
| Graduate Degree | - | - |
| Total | $51,484 | $14,688 |
Family Income in Naco
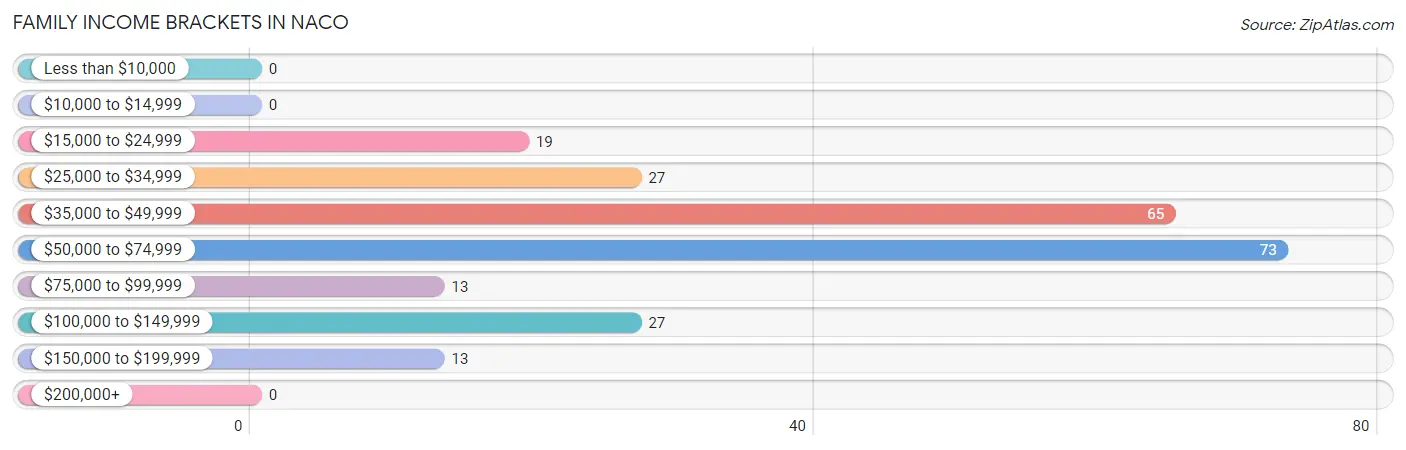
Family Income Brackets in Naco
According to the Naco family income data, there are 73 families falling into the $50,000 to $74,999 income range, which is the most common income bracket and makes up 30.8% of all families.
| Income Bracket | # Families | % Families |
| Less than $10,000 | 0 | 0.0% |
| $10,000 to $14,999 | 0 | 0.0% |
| $15,000 to $24,999 | 19 | 8.0% |
| $25,000 to $34,999 | 27 | 11.4% |
| $35,000 to $49,999 | 65 | 27.4% |
| $50,000 to $74,999 | 73 | 30.8% |
| $75,000 to $99,999 | 13 | 5.5% |
| $100,000 to $149,999 | 27 | 11.4% |
| $150,000 to $199,999 | 13 | 5.5% |
| $200,000+ | 0 | 0.0% |
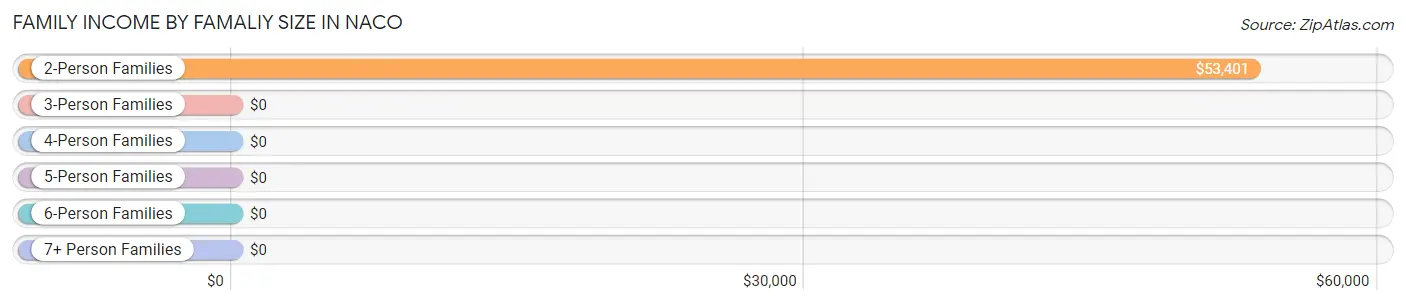
Family Income by Famaliy Size in Naco
2-person families (121 | 51.0%) account for the highest median family income in Naco with $53,401 per family, while 2-person families (121 | 51.0%) have the highest median income of $26,700 per family member.
| Income Bracket | # Families | Median Income |
| 2-Person Families | 121 (51.0%) | $53,401 |
| 3-Person Families | 5 (2.1%) | $0 |
| 4-Person Families | 34 (14.3%) | $0 |
| 5-Person Families | 16 (6.8%) | $0 |
| 6-Person Families | 15 (6.3%) | $0 |
| 7+ Person Families | 46 (19.4%) | $0 |
| Total | 237 (100.0%) | $52,776 |
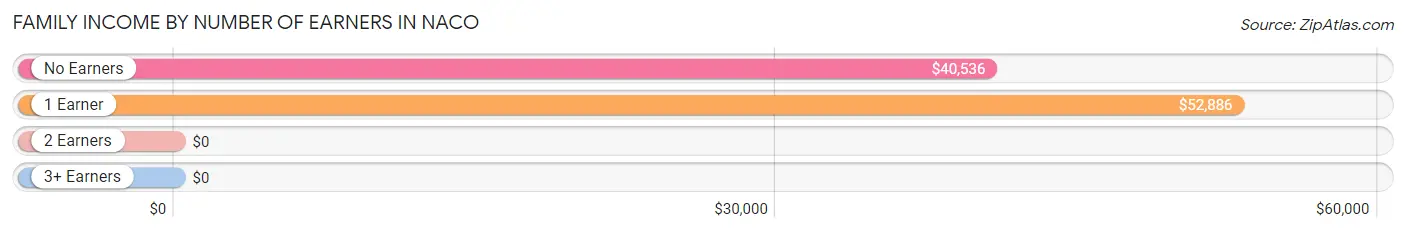
Family Income by Number of Earners in Naco
| Number of Earners | # Families | Median Income |
| No Earners | 27 (11.4%) | $40,536 |
| 1 Earner | 137 (57.8%) | $52,886 |
| 2 Earners | 39 (16.5%) | $0 |
| 3+ Earners | 34 (14.3%) | $0 |
| Total | 237 (100.0%) | $52,776 |
Household Income in Naco
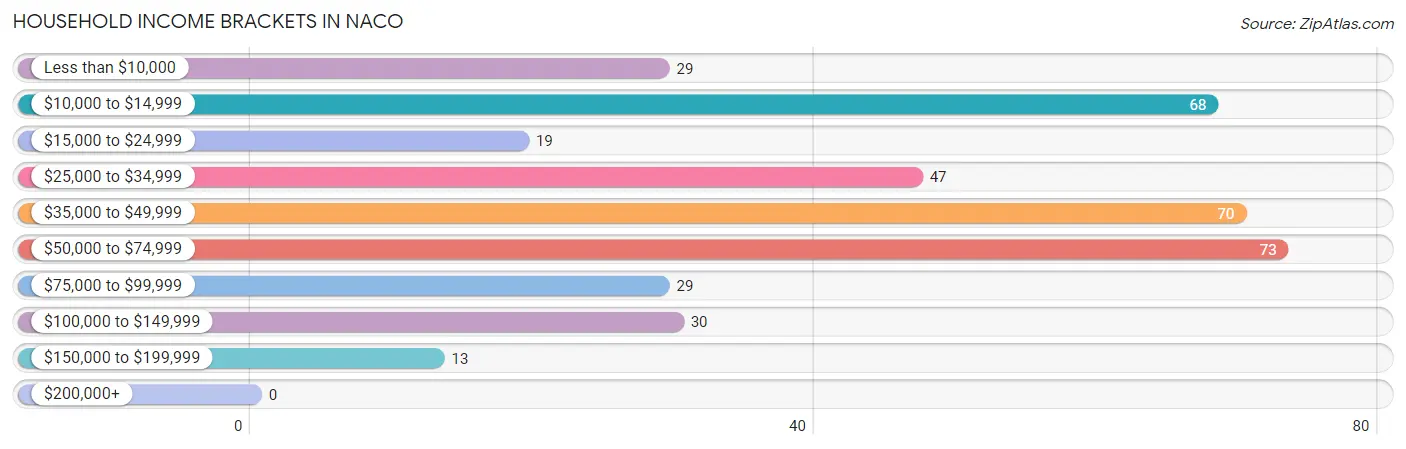
Household Income Brackets in Naco
With 73 households falling in the category, the $50,000 to $74,999 income range is the most frequent in Naco, accounting for 19.3% of all households.
| Income Bracket | # Households | % Households |
| Less than $10,000 | 29 | 7.7% |
| $10,000 to $14,999 | 68 | 18.0% |
| $15,000 to $24,999 | 19 | 5.0% |
| $25,000 to $34,999 | 47 | 12.4% |
| $35,000 to $49,999 | 70 | 18.5% |
| $50,000 to $74,999 | 73 | 19.3% |
| $75,000 to $99,999 | 29 | 7.7% |
| $100,000 to $149,999 | 30 | 7.9% |
| $150,000 to $199,999 | 13 | 3.4% |
| $200,000+ | 0 | 0.0% |
Household Income by Householder Age in Naco
The median household income in Naco is $42,500, with the highest median household income of $53,529 found in the 25 to 44 years age bracket for the primary householder. A total of 128 households (33.9%) fall into this category. Meanwhile, the 15 to 24 years age bracket for the primary householder has the lowest median household income of $0, with 23 households (6.1%) in this group.
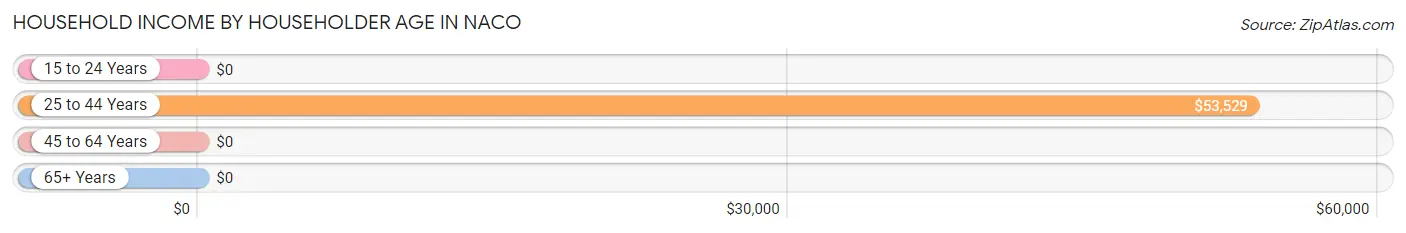
| Income Bracket | # Households | Median Income |
| 15 to 24 Years | 23 (6.1%) | $0 |
| 25 to 44 Years | 128 (33.9%) | $53,529 |
| 45 to 64 Years | 76 (20.1%) | $0 |
| 65+ Years | 151 (40.0%) | $0 |
| Total | 378 (100.0%) | $42,500 |
Poverty in Naco
Income Below Poverty by Sex and Age in Naco
With 26.8% poverty level for males and 36.4% for females among the residents of Naco, under 5 year old males and under 5 year old females are the most vulnerable to poverty, with 35 males (100.0%) and 13 females (100.0%) in their respective age groups living below the poverty level.
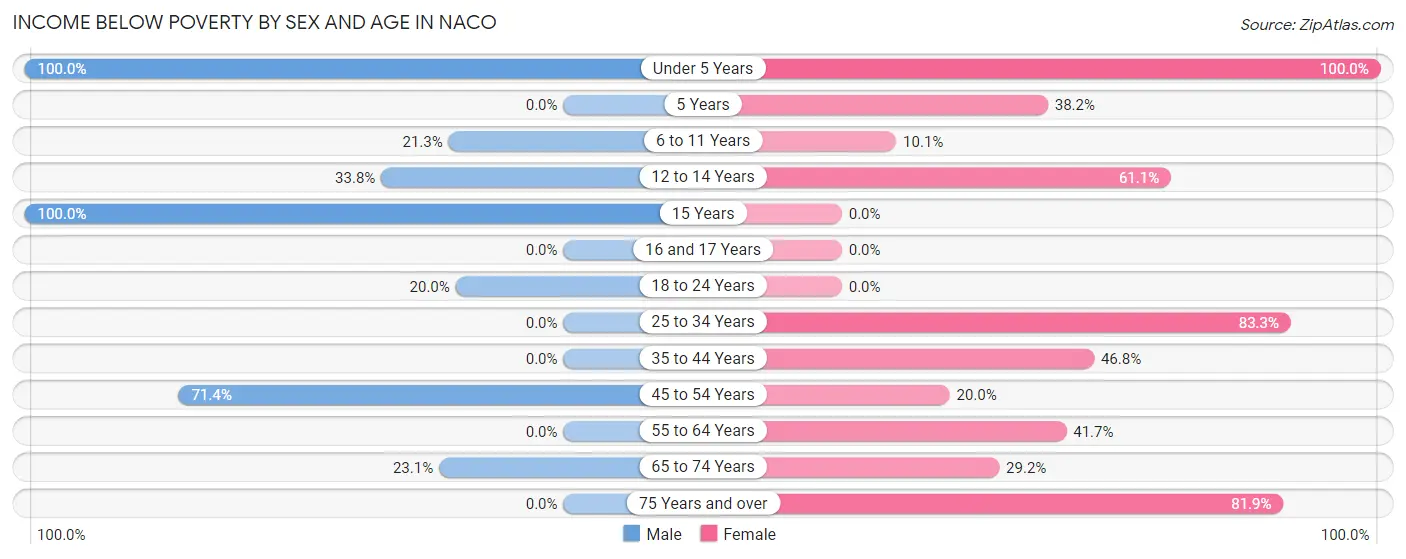
| Age Bracket | Male | Female |
| Under 5 Years | 35 (100.0%) | 13 (100.0%) |
| 5 Years | 0 (0.0%) | 13 (38.2%) |
| 6 to 11 Years | 13 (21.3%) | 11 (10.1%) |
| 12 to 14 Years | 23 (33.8%) | 11 (61.1%) |
| 15 Years | 27 (100.0%) | 0 (0.0%) |
| 16 and 17 Years | 0 (0.0%) | 0 (0.0%) |
| 18 to 24 Years | 20 (20.0%) | 0 (0.0%) |
| 25 to 34 Years | 0 (0.0%) | 40 (83.3%) |
| 35 to 44 Years | 0 (0.0%) | 22 (46.8%) |
| 45 to 54 Years | 10 (71.4%) | 12 (20.0%) |
| 55 to 64 Years | 0 (0.0%) | 25 (41.7%) |
| 65 to 74 Years | 18 (23.1%) | 26 (29.2%) |
| 75 Years and over | 0 (0.0%) | 59 (81.9%) |
| Total | 146 (26.8%) | 232 (36.4%) |
Income Above Poverty by Sex and Age in Naco
According to the poverty statistics in Naco, males aged 16 and 17 years and females aged 16 and 17 years are the age groups that are most secure financially, with 100.0% of males and 100.0% of females in these age groups living above the poverty line.
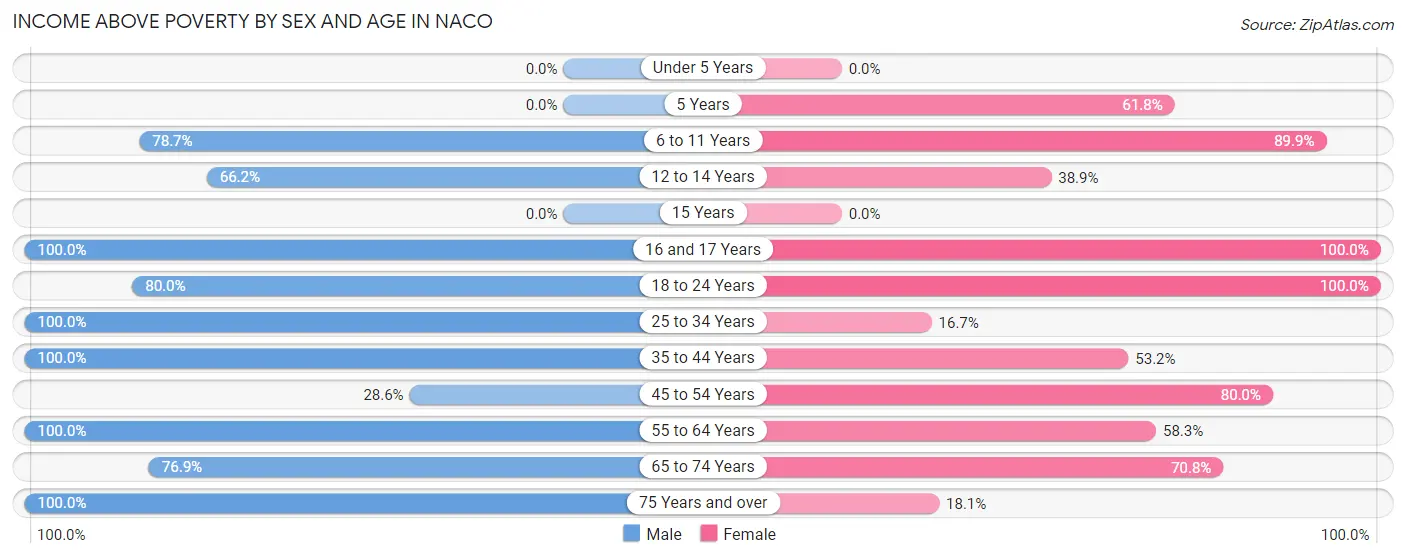
| Age Bracket | Male | Female |
| Under 5 Years | 0 (0.0%) | 0 (0.0%) |
| 5 Years | 0 (0.0%) | 21 (61.8%) |
| 6 to 11 Years | 48 (78.7%) | 98 (89.9%) |
| 12 to 14 Years | 45 (66.2%) | 7 (38.9%) |
| 15 Years | 0 (0.0%) | 0 (0.0%) |
| 16 and 17 Years | 9 (100.0%) | 12 (100.0%) |
| 18 to 24 Years | 80 (80.0%) | 75 (100.0%) |
| 25 to 34 Years | 90 (100.0%) | 8 (16.7%) |
| 35 to 44 Years | 1 (100.0%) | 25 (53.2%) |
| 45 to 54 Years | 4 (28.6%) | 48 (80.0%) |
| 55 to 64 Years | 51 (100.0%) | 35 (58.3%) |
| 65 to 74 Years | 60 (76.9%) | 63 (70.8%) |
| 75 Years and over | 11 (100.0%) | 13 (18.1%) |
| Total | 399 (73.2%) | 405 (63.6%) |
Income Below Poverty Among Married-Couple Families in Naco
The poverty statistics for married-couple families in Naco show that 10.6% or 12 of the total 113 families live below the poverty line. Families with 5 or more children have the highest poverty rate of 100.0%, comprising of 12 families. On the other hand, families with no children have the lowest poverty rate of 0.0%, which includes 0 families.
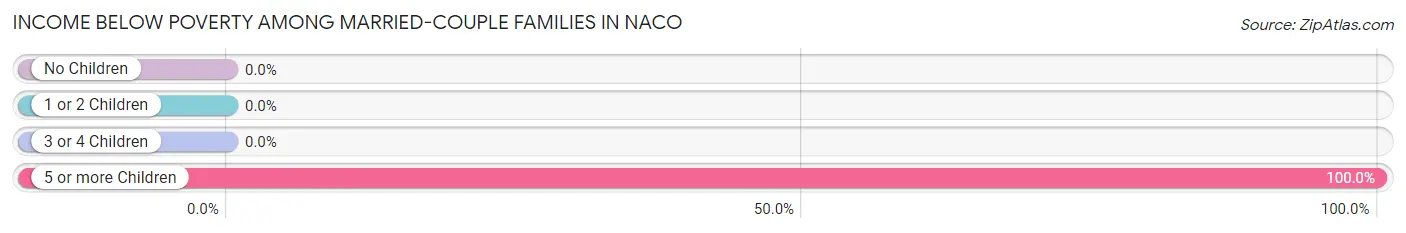
| Children | Above Poverty | Below Poverty |
| No Children | 50 (100.0%) | 0 (0.0%) |
| 1 or 2 Children | 32 (100.0%) | 0 (0.0%) |
| 3 or 4 Children | 19 (100.0%) | 0 (0.0%) |
| 5 or more Children | 0 (0.0%) | 12 (100.0%) |
| Total | 101 (89.4%) | 12 (10.6%) |
Income Below Poverty Among Single-Parent Households in Naco
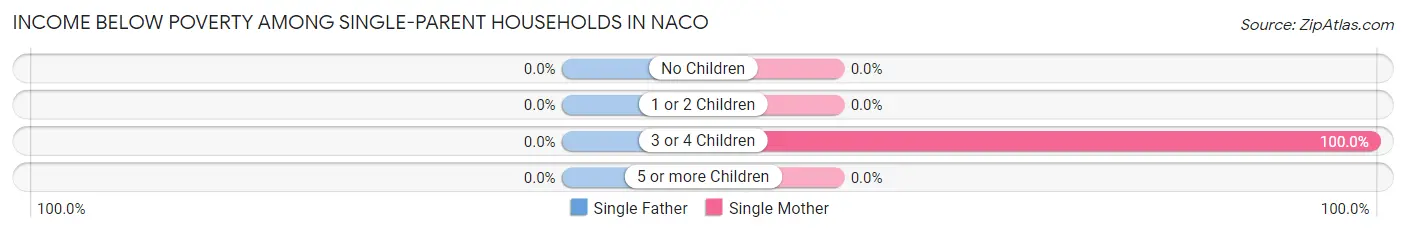
| Children | Single Father | Single Mother |
| No Children | 0 (0.0%) | 0 (0.0%) |
| 1 or 2 Children | 0 (0.0%) | 0 (0.0%) |
| 3 or 4 Children | 0 (0.0%) | 27 (100.0%) |
| 5 or more Children | 0 (0.0%) | 0 (0.0%) |
| Total | 0 (0.0%) | 27 (55.1%) |
Income Below Poverty Among Married-Couple vs Single-Parent Households in Naco
The poverty data for Naco shows that 12 of the married-couple family households (10.6%) and 27 of the single-parent households (21.8%) are living below the poverty level. Within the married-couple family households, those with 5 or more children have the highest poverty rate, with 12 households (100.0%) falling below the poverty line. Among the single-parent households, those with 3 or 4 children have the highest poverty rate, with 27 household (100.0%) living below poverty.
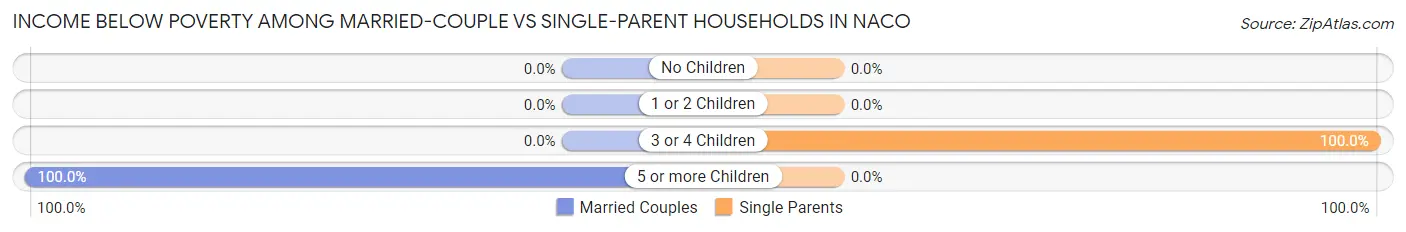
| Children | Married-Couple Families | Single-Parent Households |
| No Children | 0 (0.0%) | 0 (0.0%) |
| 1 or 2 Children | 0 (0.0%) | 0 (0.0%) |
| 3 or 4 Children | 0 (0.0%) | 27 (100.0%) |
| 5 or more Children | 12 (100.0%) | 0 (0.0%) |
| Total | 12 (10.6%) | 27 (21.8%) |
Race in Naco
The most populous races in Naco are Hispanic or Latino (1,102 | 92.7%), Two or more Races (609 | 51.2%), and White / Caucasian (531 | 44.7%).
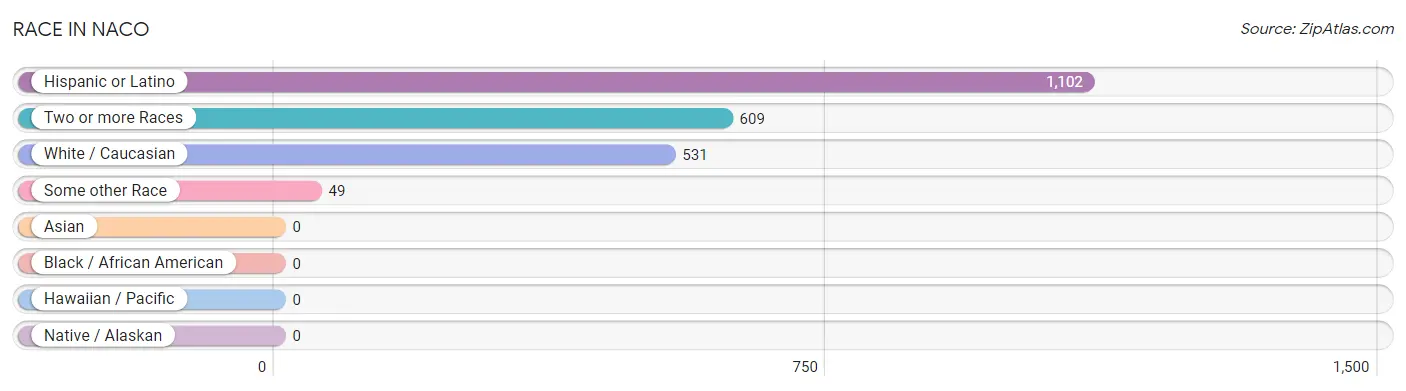
| Race | # Population | % Population |
| Asian | 0 | 0.0% |
| Black / African American | 0 | 0.0% |
| Hawaiian / Pacific | 0 | 0.0% |
| Hispanic or Latino | 1,102 | 92.7% |
| Native / Alaskan | 0 | 0.0% |
| White / Caucasian | 531 | 44.7% |
| Two or more Races | 609 | 51.2% |
| Some other Race | 49 | 4.1% |
| Total | 1,189 | 100.0% |
Ancestry in Naco
The most populous ancestries reported in Naco are Mexican (1,093 | 91.9%), German (36 | 3.0%), Irish (34 | 2.9%), Norwegian (27 | 2.3%), and English (11 | 0.9%), together accounting for 101.0% of all Naco residents.
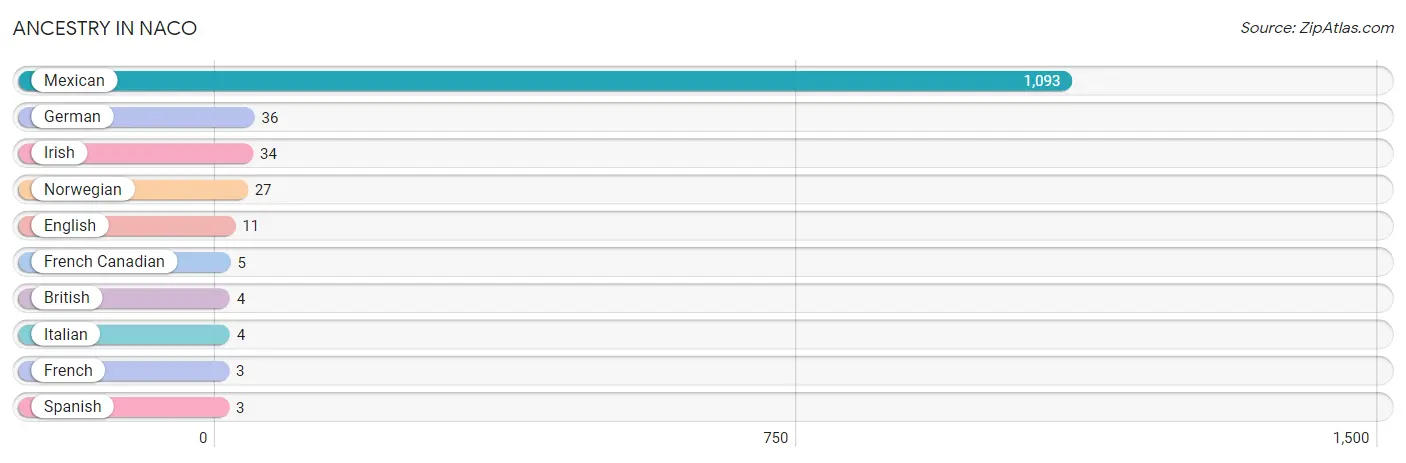
| Ancestry | # Population | % Population |
| British | 4 | 0.3% |
| English | 11 | 0.9% |
| French | 3 | 0.3% |
| French Canadian | 5 | 0.4% |
| German | 36 | 3.0% |
| Irish | 34 | 2.9% |
| Italian | 4 | 0.3% |
| Mexican | 1,093 | 91.9% |
| Norwegian | 27 | 2.3% |
| Spanish | 3 | 0.3% | View All 10 Rows |
Immigrants in Naco
The most numerous immigrant groups reported in Naco came from Central America (323 | 27.2%), Latin America (323 | 27.2%), Mexico (323 | 27.2%), Canada (12 | 1.0%), and Europe (3 | 0.3%), together accounting for 82.8% of all Naco residents.
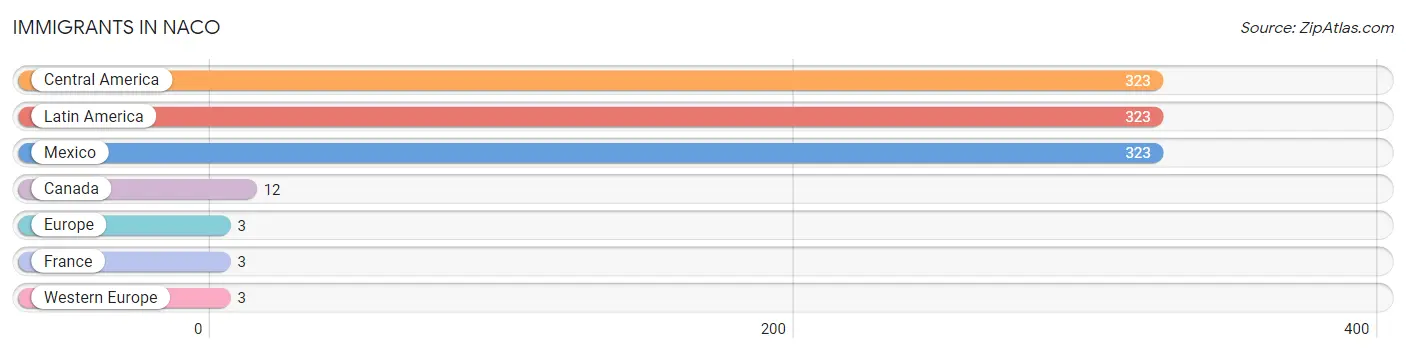
| Immigration Origin | # Population | % Population |
| Canada | 12 | 1.0% |
| Central America | 323 | 27.2% |
| Europe | 3 | 0.3% |
| France | 3 | 0.3% |
| Latin America | 323 | 27.2% |
| Mexico | 323 | 27.2% |
| Western Europe | 3 | 0.3% | View All 7 Rows |
Sex and Age in Naco
Sex and Age in Naco
The most populous age groups in Naco are 10 to 14 Years (103 | 18.9%) for men and 5 to 9 Years (139 | 21.6%) for women.
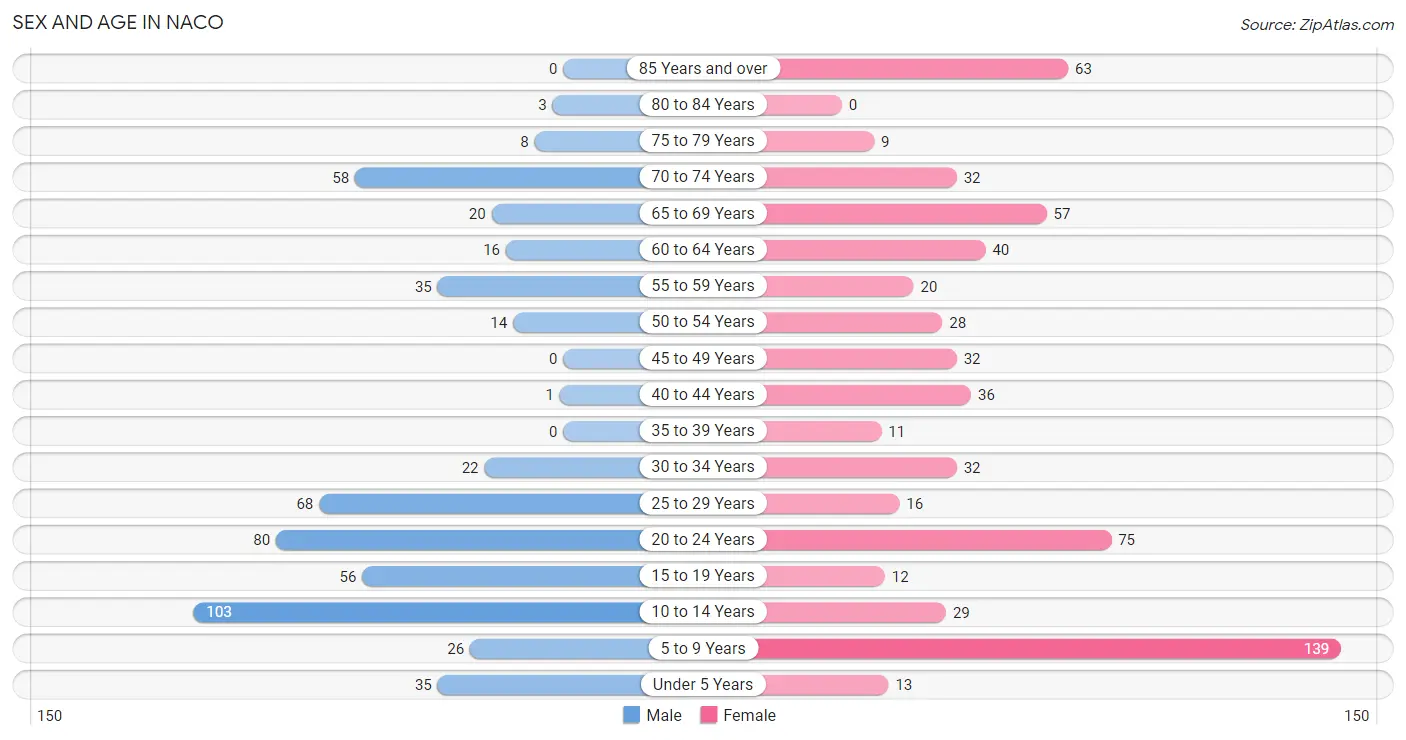
| Age Bracket | Male | Female |
| Under 5 Years | 35 (6.4%) | 13 (2.0%) |
| 5 to 9 Years | 26 (4.8%) | 139 (21.6%) |
| 10 to 14 Years | 103 (18.9%) | 29 (4.5%) |
| 15 to 19 Years | 56 (10.3%) | 12 (1.9%) |
| 20 to 24 Years | 80 (14.7%) | 75 (11.7%) |
| 25 to 29 Years | 68 (12.5%) | 16 (2.5%) |
| 30 to 34 Years | 22 (4.0%) | 32 (5.0%) |
| 35 to 39 Years | 0 (0.0%) | 11 (1.7%) |
| 40 to 44 Years | 1 (0.2%) | 36 (5.6%) |
| 45 to 49 Years | 0 (0.0%) | 32 (5.0%) |
| 50 to 54 Years | 14 (2.6%) | 28 (4.3%) |
| 55 to 59 Years | 35 (6.4%) | 20 (3.1%) |
| 60 to 64 Years | 16 (2.9%) | 40 (6.2%) |
| 65 to 69 Years | 20 (3.7%) | 57 (8.8%) |
| 70 to 74 Years | 58 (10.6%) | 32 (5.0%) |
| 75 to 79 Years | 8 (1.5%) | 9 (1.4%) |
| 80 to 84 Years | 3 (0.5%) | 0 (0.0%) |
| 85 Years and over | 0 (0.0%) | 63 (9.8%) |
| Total | 545 (100.0%) | 644 (100.0%) |
Families and Households in Naco
Median Family Size in Naco
The median family size in Naco is 4.28 persons per family, with single female/mother families (49 | 20.7%) accounting for the largest median family size of 6.27 persons per family. On the other hand, single male/father families (75 | 31.7%) represent the smallest median family size with 2.09 persons per family.
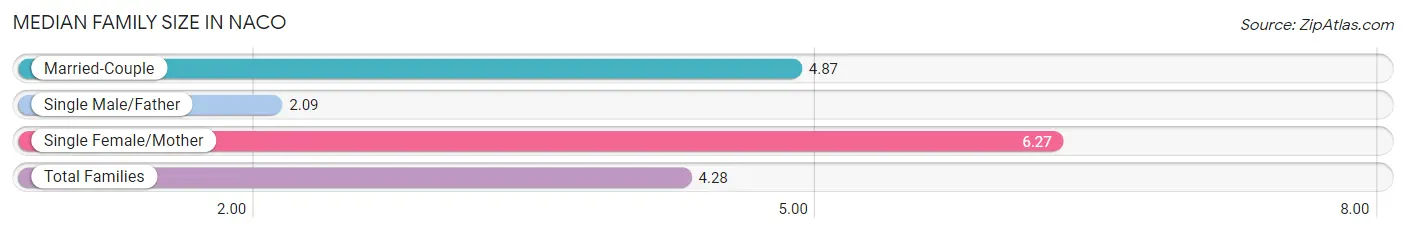
| Family Type | # Families | Family Size |
| Married-Couple | 113 (47.7%) | 4.87 |
| Single Male/Father | 75 (31.7%) | 2.09 |
| Single Female/Mother | 49 (20.7%) | 6.27 |
| Total Families | 237 (100.0%) | 4.28 |
Median Household Size in Naco
The median household size in Naco is 3.15 persons per household, with single female/mother households (49 | 13.0%) accounting for the largest median household size of 6.59 persons per household. non-family households (141 | 37.3%) represent the smallest median household size with 1.08 persons per household.
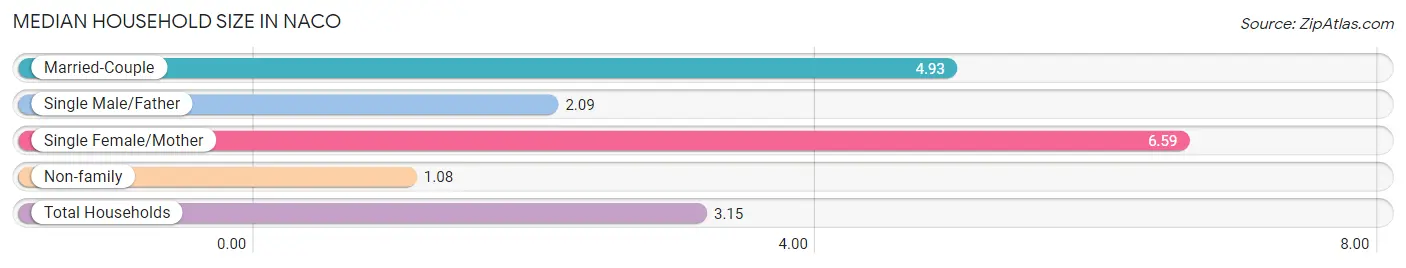
| Household Type | # Households | Household Size |
| Married-Couple | 113 (29.9%) | 4.93 |
| Single Male/Father | 75 (19.8%) | 2.09 |
| Single Female/Mother | 49 (13.0%) | 6.59 |
| Non-family | 141 (37.3%) | 1.08 |
| Total Households | 378 (100.0%) | 3.15 |
Household Size by Marriage Status in Naco
Out of a total of 378 households in Naco, 237 (62.7%) are family households, while 141 (37.3%) are nonfamily households. The most numerous type of family households are 2-person households, comprising 121, and the most common type of nonfamily households are 1-person households, comprising 132.
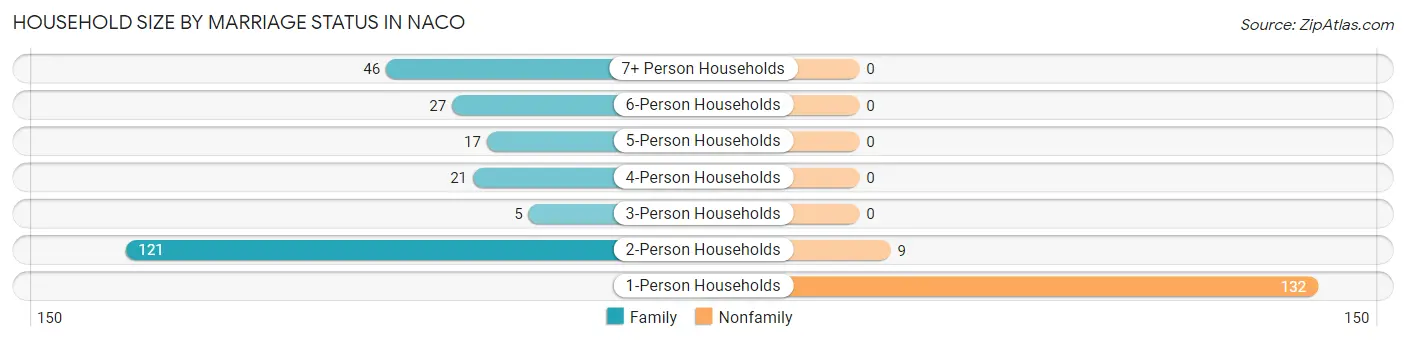
| Household Size | Family Households | Nonfamily Households |
| 1-Person Households | - | 132 (34.9%) |
| 2-Person Households | 121 (32.0%) | 9 (2.4%) |
| 3-Person Households | 5 (1.3%) | 0 (0.0%) |
| 4-Person Households | 21 (5.6%) | 0 (0.0%) |
| 5-Person Households | 17 (4.5%) | 0 (0.0%) |
| 6-Person Households | 27 (7.1%) | 0 (0.0%) |
| 7+ Person Households | 46 (12.2%) | 0 (0.0%) |
| Total | 237 (62.7%) | 141 (37.3%) |
Female Fertility in Naco
Fertility by Age in Naco
| Age Bracket | Women with Births | Births / 1,000 Women |
| 15 to 19 years | 0 (0.0%) | 0.0 |
| 20 to 34 years | 0 (0.0%) | 0.0 |
| 35 to 50 years | 0 (0.0%) | 0.0 |
| Total | 0 (0.0%) | 0.0 |
Fertility by Age by Marriage Status in Naco
| Age Bracket | Married | Unmarried |
| 15 to 19 years | 0 (0.0%) | 0 (0.0%) |
| 20 to 34 years | 0 (0.0%) | 0 (0.0%) |
| 35 to 50 years | 0 (0.0%) | 0 (0.0%) |
| Total | 0 (0.0%) | 0 (0.0%) |
Fertility by Education in Naco
| Educational Attainment | Women with Births | Births / 1,000 Women |
| Less than High School | 0 (0.0%) | 0.0 |
| High School Diploma | 0 (0.0%) | 0.0 |
| College or Associate's Degree | 0 (0.0%) | 0.0 |
| Bachelor's Degree | 0 (0.0%) | 0.0 |
| Graduate Degree | 0 (0.0%) | 0.0 |
| Total | 0 (0.0%) | 0.0 |
Fertility by Education by Marriage Status in Naco
| Educational Attainment | Married | Unmarried |
| Less than High School | 0 (0.0%) | 0 (0.0%) |
| High School Diploma | 0 (0.0%) | 0 (0.0%) |
| College or Associate's Degree | 0 (0.0%) | 0 (0.0%) |
| Bachelor's Degree | 0 (0.0%) | 0 (0.0%) |
| Graduate Degree | 0 (0.0%) | 0 (0.0%) |
| Total | 0 (0.0%) | 0 (0.0%) |
Employment Characteristics in Naco
Employment by Class of Employer in Naco
Among the 395 employed individuals in Naco, private company employees (263 | 66.6%), federal government employees (33 | 8.4%), and not-for-profit organizations (29 | 7.3%) make up the most common classes of employment.
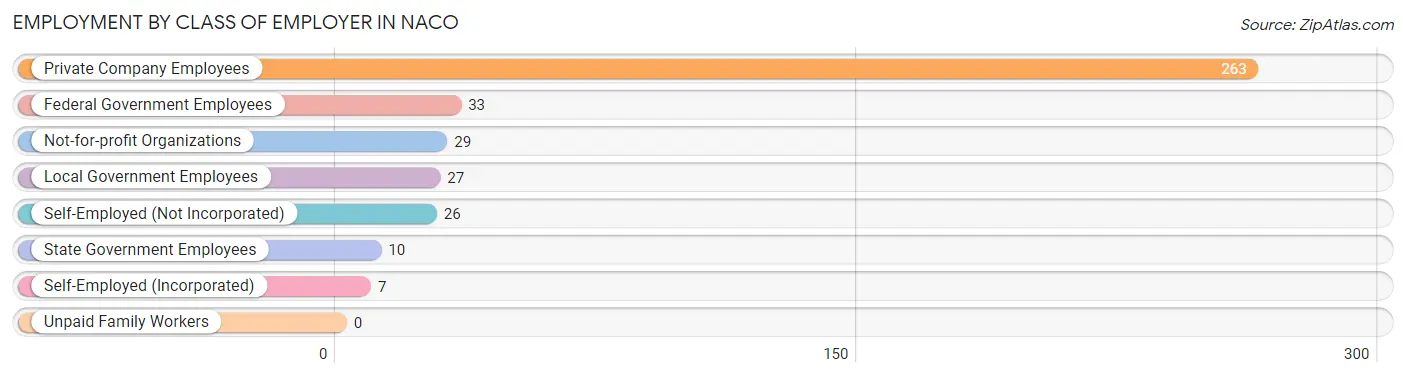
| Employer Class | # Employees | % Employees |
| Private Company Employees | 263 | 66.6% |
| Self-Employed (Incorporated) | 7 | 1.8% |
| Self-Employed (Not Incorporated) | 26 | 6.6% |
| Not-for-profit Organizations | 29 | 7.3% |
| Local Government Employees | 27 | 6.8% |
| State Government Employees | 10 | 2.5% |
| Federal Government Employees | 33 | 8.4% |
| Unpaid Family Workers | 0 | 0.0% |
| Total | 395 | 100.0% |
Employment Status by Age in Naco
According to the labor force statistics for Naco, out of the total population over 16 years of age (817), 50.9% or 416 individuals are in the labor force, with 5.0% or 21 of them unemployed. The age group with the highest labor force participation rate is 25 to 29 years, with 100.0% or 84 individuals in the labor force. Within the labor force, the 20 to 24 years age range has the highest percentage of unemployed individuals, with 18.2% or 18 of them being unemployed.
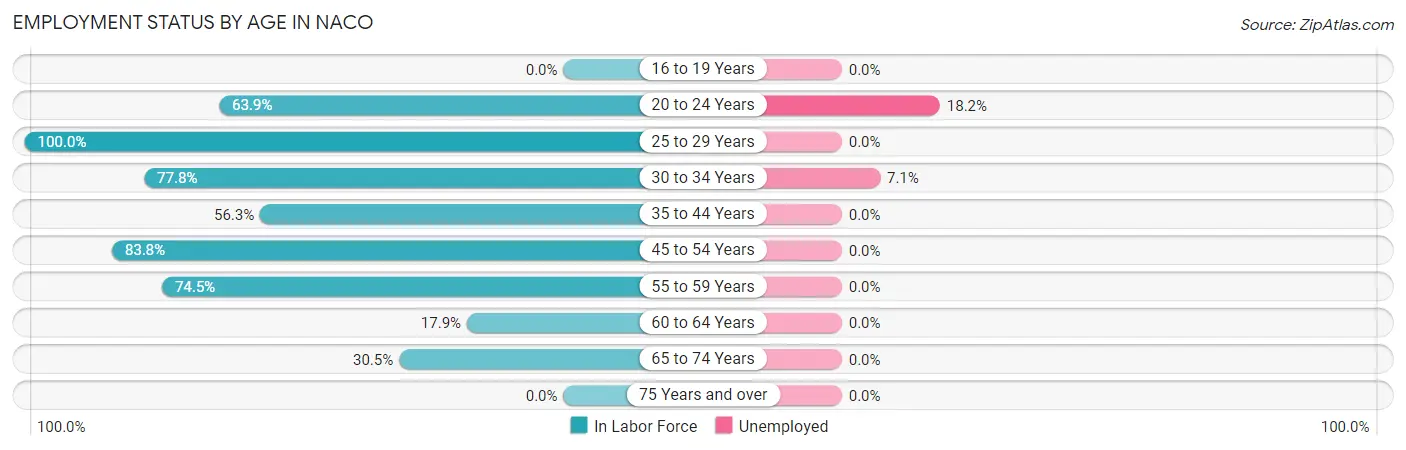
| Age Bracket | In Labor Force | Unemployed |
| 16 to 19 Years | 0 (0.0%) | 0 (0.0%) |
| 20 to 24 Years | 99 (63.9%) | 18 (18.2%) |
| 25 to 29 Years | 84 (100.0%) | 0 (0.0%) |
| 30 to 34 Years | 42 (77.8%) | 3 (7.1%) |
| 35 to 44 Years | 27 (56.3%) | 0 (0.0%) |
| 45 to 54 Years | 62 (83.8%) | 0 (0.0%) |
| 55 to 59 Years | 41 (74.5%) | 0 (0.0%) |
| 60 to 64 Years | 10 (17.9%) | 0 (0.0%) |
| 65 to 74 Years | 51 (30.5%) | 0 (0.0%) |
| 75 Years and over | 0 (0.0%) | 0 (0.0%) |
| Total | 416 (50.9%) | 21 (5.0%) |
Employment Status by Educational Attainment in Naco
According to labor force statistics for Naco, 71.7% of individuals (266) out of the total population between 25 and 64 years of age (371) are in the labor force, with 1.1% or 3 of them being unemployed. The group with the highest labor force participation rate are those with the educational attainment of high school diploma, with 100.0% or 111 individuals in the labor force. Within the labor force, individuals with high school diploma education have the highest percentage of unemployment, with 2.7% or 3 of them being unemployed.
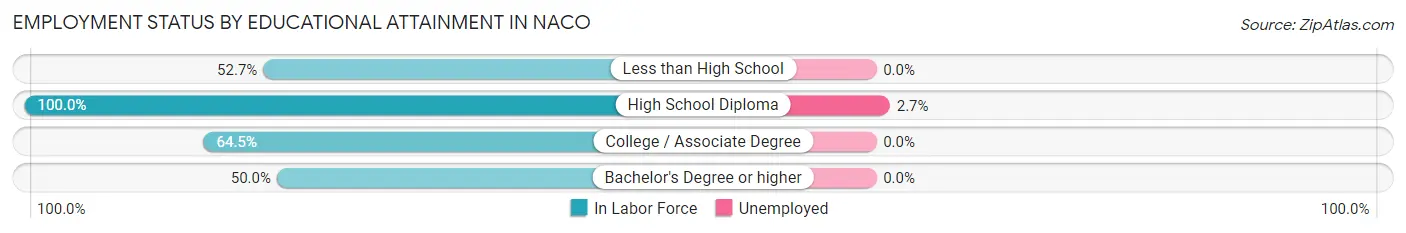
| Educational Attainment | In Labor Force | Unemployed |
| Less than High School | 48 (52.7%) | 0 (0.0%) |
| High School Diploma | 111 (100.0%) | 3 (2.7%) |
| College / Associate Degree | 100 (64.5%) | 0 (0.0%) |
| Bachelor's Degree or higher | 7 (50.0%) | 0 (0.0%) |
| Total | 266 (71.7%) | 4 (1.1%) |
Employment Occupations by Sex in Naco
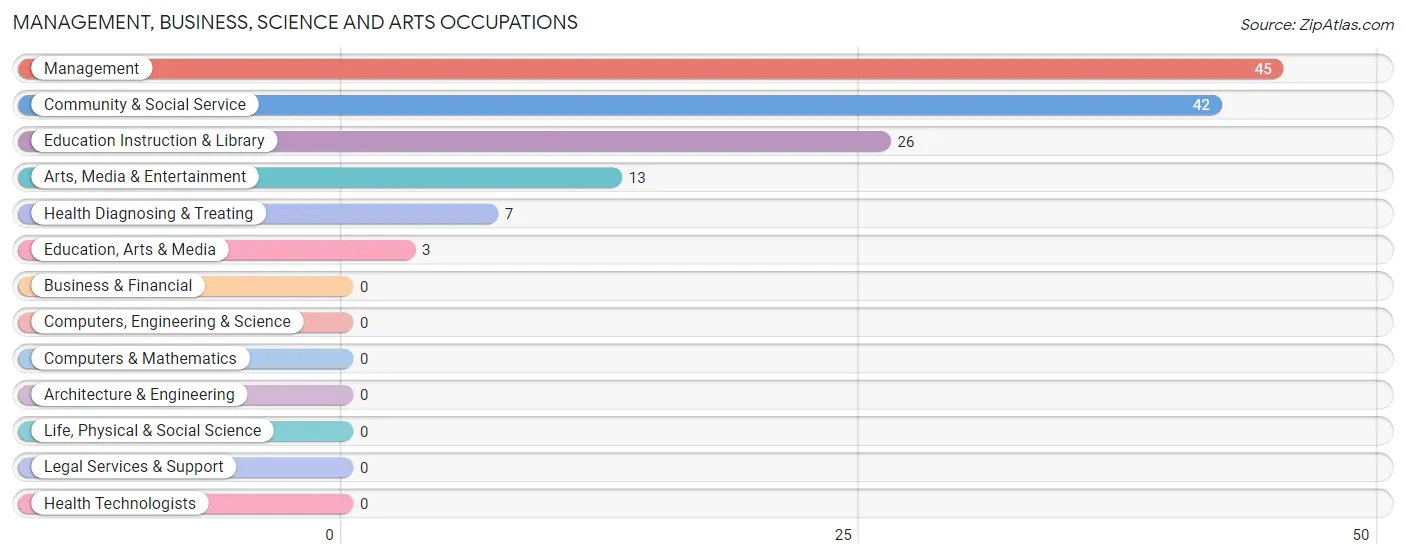
Management, Business, Science and Arts Occupations
The most common Management, Business, Science and Arts occupations in Naco are Management (45 | 11.4%), Community & Social Service (42 | 10.6%), Education Instruction & Library (26 | 6.6%), Arts, Media & Entertainment (13 | 3.3%), and Health Diagnosing & Treating (7 | 1.8%).
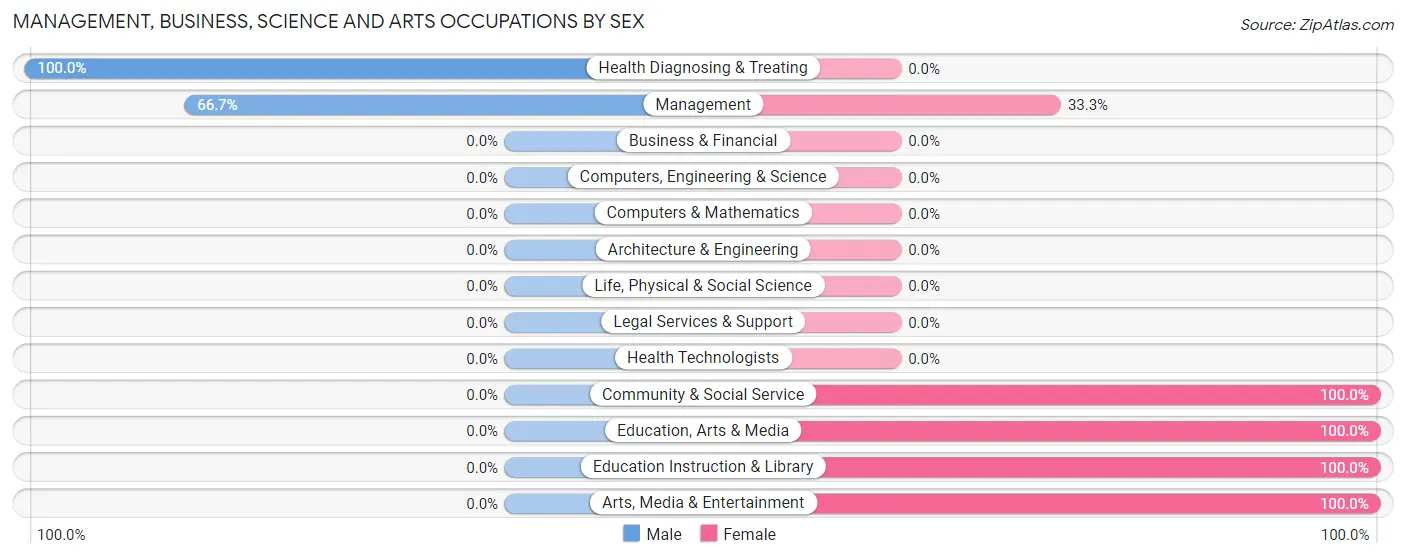
Management, Business, Science and Arts Occupations by Sex
Within the Management, Business, Science and Arts occupations in Naco, the most male-oriented occupations are Health Diagnosing & Treating (100.0%), and Management (66.7%), while the most female-oriented occupations are Community & Social Service (100.0%), Education, Arts & Media (100.0%), and Education Instruction & Library (100.0%).
| Occupation | Male | Female |
| Management | 30 (66.7%) | 15 (33.3%) |
| Business & Financial | 0 (0.0%) | 0 (0.0%) |
| Computers, Engineering & Science | 0 (0.0%) | 0 (0.0%) |
| Computers & Mathematics | 0 (0.0%) | 0 (0.0%) |
| Architecture & Engineering | 0 (0.0%) | 0 (0.0%) |
| Life, Physical & Social Science | 0 (0.0%) | 0 (0.0%) |
| Community & Social Service | 0 (0.0%) | 42 (100.0%) |
| Education, Arts & Media | 0 (0.0%) | 3 (100.0%) |
| Legal Services & Support | 0 (0.0%) | 0 (0.0%) |
| Education Instruction & Library | 0 (0.0%) | 26 (100.0%) |
| Arts, Media & Entertainment | 0 (0.0%) | 13 (100.0%) |
| Health Diagnosing & Treating | 7 (100.0%) | 0 (0.0%) |
| Health Technologists | 0 (0.0%) | 0 (0.0%) |
| Total (Category) | 37 (39.4%) | 57 (60.6%) |
| Total (Overall) | 251 (63.5%) | 144 (36.5%) |
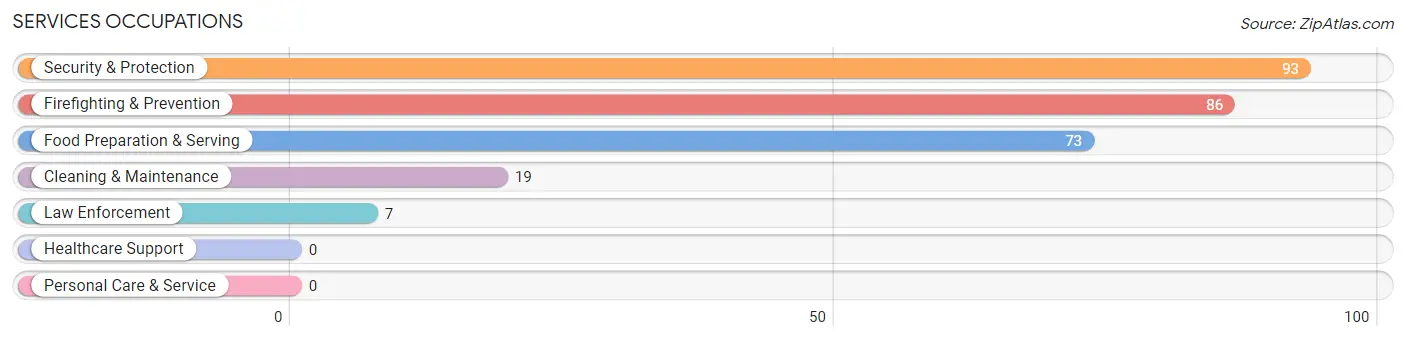
Services Occupations
The most common Services occupations in Naco are Security & Protection (93 | 23.5%), Firefighting & Prevention (86 | 21.8%), Food Preparation & Serving (73 | 18.5%), Cleaning & Maintenance (19 | 4.8%), and Law Enforcement (7 | 1.8%).
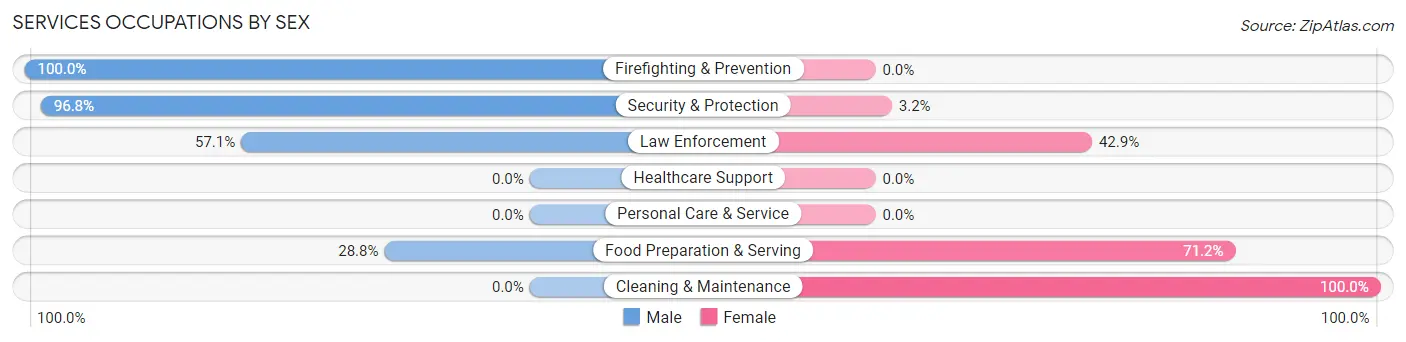
Services Occupations by Sex
Within the Services occupations in Naco, the most male-oriented occupations are Firefighting & Prevention (100.0%), Security & Protection (96.8%), and Law Enforcement (57.1%), while the most female-oriented occupations are Cleaning & Maintenance (100.0%), Food Preparation & Serving (71.2%), and Law Enforcement (42.9%).
| Occupation | Male | Female |
| Healthcare Support | 0 (0.0%) | 0 (0.0%) |
| Security & Protection | 90 (96.8%) | 3 (3.2%) |
| Firefighting & Prevention | 86 (100.0%) | 0 (0.0%) |
| Law Enforcement | 4 (57.1%) | 3 (42.9%) |
| Food Preparation & Serving | 21 (28.8%) | 52 (71.2%) |
| Cleaning & Maintenance | 0 (0.0%) | 19 (100.0%) |
| Personal Care & Service | 0 (0.0%) | 0 (0.0%) |
| Total (Category) | 111 (60.0%) | 74 (40.0%) |
| Total (Overall) | 251 (63.5%) | 144 (36.5%) |
Sales and Office Occupations
The most common Sales and Office occupations in Naco are Sales & Related (4 | 1.0%), and Office & Administration (3 | 0.8%).
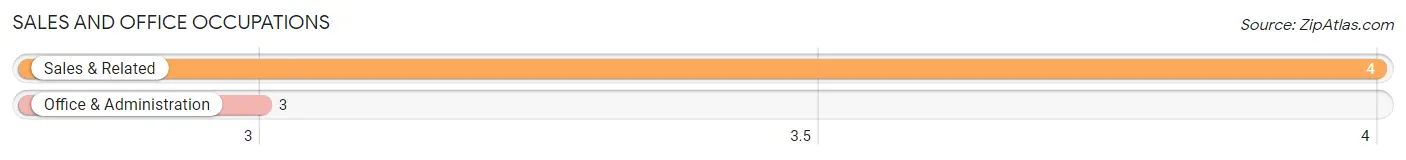
Sales and Office Occupations by Sex

| Occupation | Male | Female |
| Sales & Related | 4 (100.0%) | 0 (0.0%) |
| Office & Administration | 0 (0.0%) | 3 (100.0%) |
| Total (Category) | 4 (57.1%) | 3 (42.9%) |
| Total (Overall) | 251 (63.5%) | 144 (36.5%) |
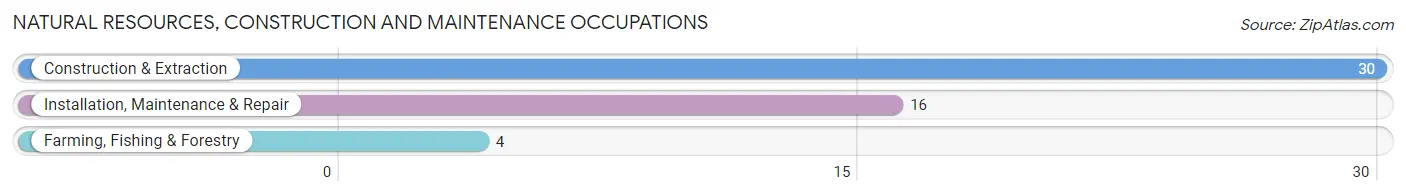
Natural Resources, Construction and Maintenance Occupations
The most common Natural Resources, Construction and Maintenance occupations in Naco are Construction & Extraction (30 | 7.6%), Installation, Maintenance & Repair (16 | 4.1%), and Farming, Fishing & Forestry (4 | 1.0%).
Natural Resources, Construction and Maintenance Occupations by Sex
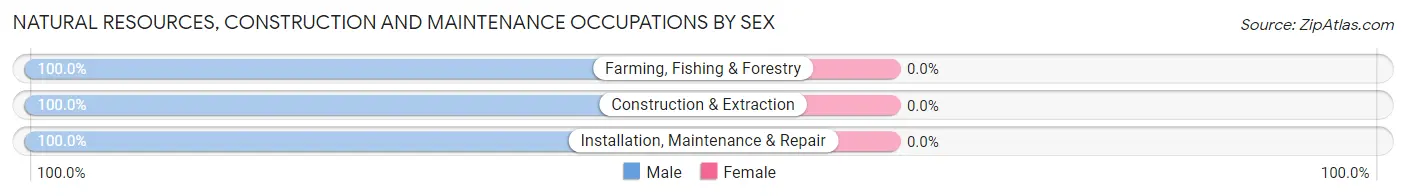
| Occupation | Male | Female |
| Farming, Fishing & Forestry | 4 (100.0%) | 0 (0.0%) |
| Construction & Extraction | 30 (100.0%) | 0 (0.0%) |
| Installation, Maintenance & Repair | 16 (100.0%) | 0 (0.0%) |
| Total (Category) | 50 (100.0%) | 0 (0.0%) |
| Total (Overall) | 251 (63.5%) | 144 (36.5%) |
Production, Transportation and Moving Occupations
The most common Production, Transportation and Moving occupations in Naco are Transportation (31 | 7.9%), Production (25 | 6.3%), and Material Moving (3 | 0.8%).
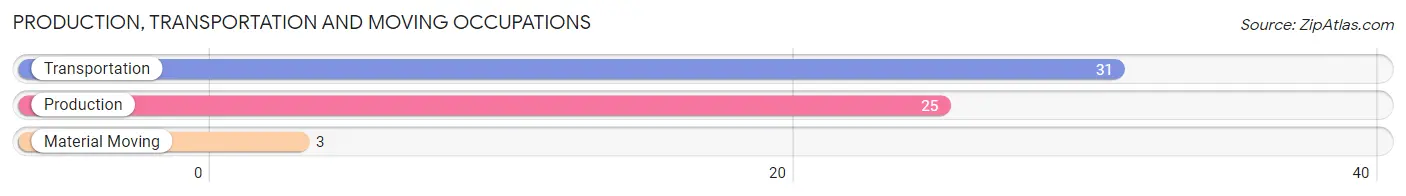
Production, Transportation and Moving Occupations by Sex
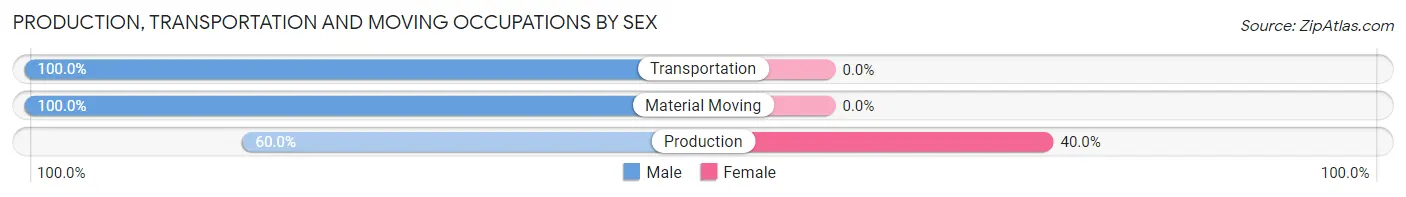
| Occupation | Male | Female |
| Production | 15 (60.0%) | 10 (40.0%) |
| Transportation | 31 (100.0%) | 0 (0.0%) |
| Material Moving | 3 (100.0%) | 0 (0.0%) |
| Total (Category) | 49 (83.1%) | 10 (17.0%) |
| Total (Overall) | 251 (63.5%) | 144 (36.5%) |
Employment Industries by Sex in Naco
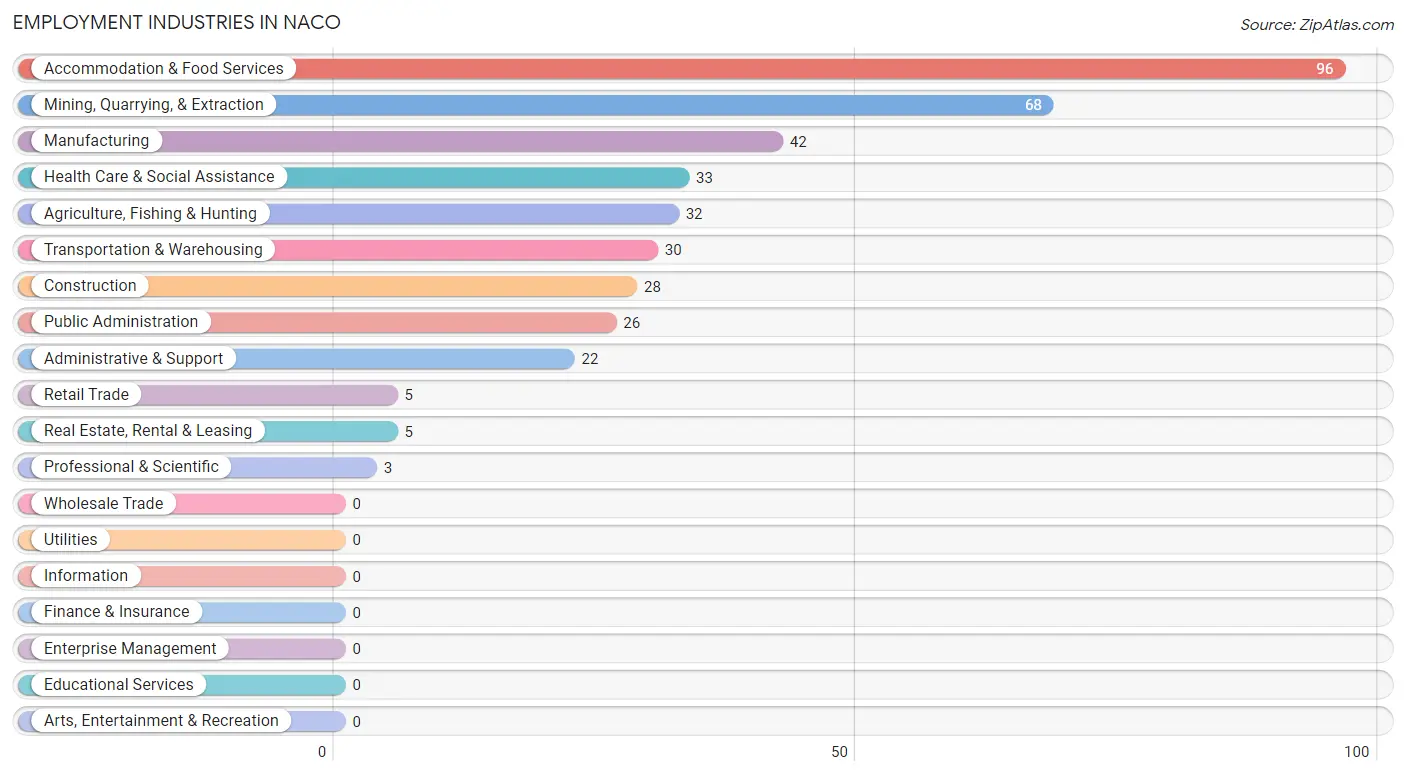
Employment Industries in Naco
The major employment industries in Naco include Accommodation & Food Services (96 | 24.3%), Mining, Quarrying, & Extraction (68 | 17.2%), Manufacturing (42 | 10.6%), Health Care & Social Assistance (33 | 8.4%), and Agriculture, Fishing & Hunting (32 | 8.1%).
Employment Industries by Sex in Naco
The Naco industries that see more men than women are Mining, Quarrying, & Extraction (100.0%), Construction (100.0%), and Retail Trade (100.0%), whereas the industries that tend to have a higher number of women are Real Estate, Rental & Leasing (100.0%), Professional & Scientific (100.0%), and Administrative & Support (86.4%).
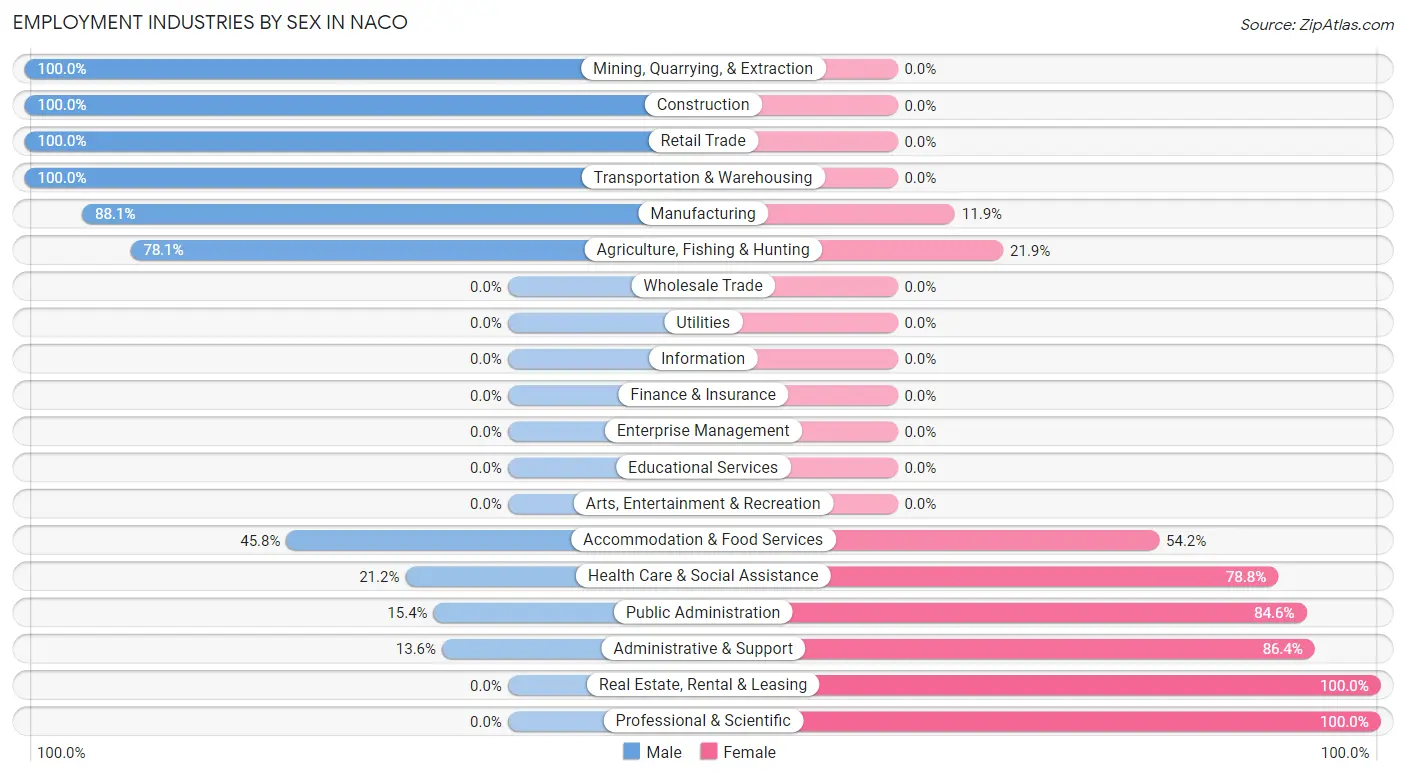
| Industry | Male | Female |
| Agriculture, Fishing & Hunting | 25 (78.1%) | 7 (21.9%) |
| Mining, Quarrying, & Extraction | 68 (100.0%) | 0 (0.0%) |
| Construction | 28 (100.0%) | 0 (0.0%) |
| Manufacturing | 37 (88.1%) | 5 (11.9%) |
| Wholesale Trade | 0 (0.0%) | 0 (0.0%) |
| Retail Trade | 5 (100.0%) | 0 (0.0%) |
| Transportation & Warehousing | 30 (100.0%) | 0 (0.0%) |
| Utilities | 0 (0.0%) | 0 (0.0%) |
| Information | 0 (0.0%) | 0 (0.0%) |
| Finance & Insurance | 0 (0.0%) | 0 (0.0%) |
| Real Estate, Rental & Leasing | 0 (0.0%) | 5 (100.0%) |
| Professional & Scientific | 0 (0.0%) | 3 (100.0%) |
| Enterprise Management | 0 (0.0%) | 0 (0.0%) |
| Administrative & Support | 3 (13.6%) | 19 (86.4%) |
| Educational Services | 0 (0.0%) | 0 (0.0%) |
| Health Care & Social Assistance | 7 (21.2%) | 26 (78.8%) |
| Arts, Entertainment & Recreation | 0 (0.0%) | 0 (0.0%) |
| Accommodation & Food Services | 44 (45.8%) | 52 (54.2%) |
| Public Administration | 4 (15.4%) | 22 (84.6%) |
| Total | 251 (63.5%) | 144 (36.5%) |
Education in Naco
School Enrollment in Naco
The most common levels of schooling among the 449 students in Naco are middle school (132 | 29.4%), elementary school (131 | 29.2%), and college / undergraduate (86 | 19.2%).
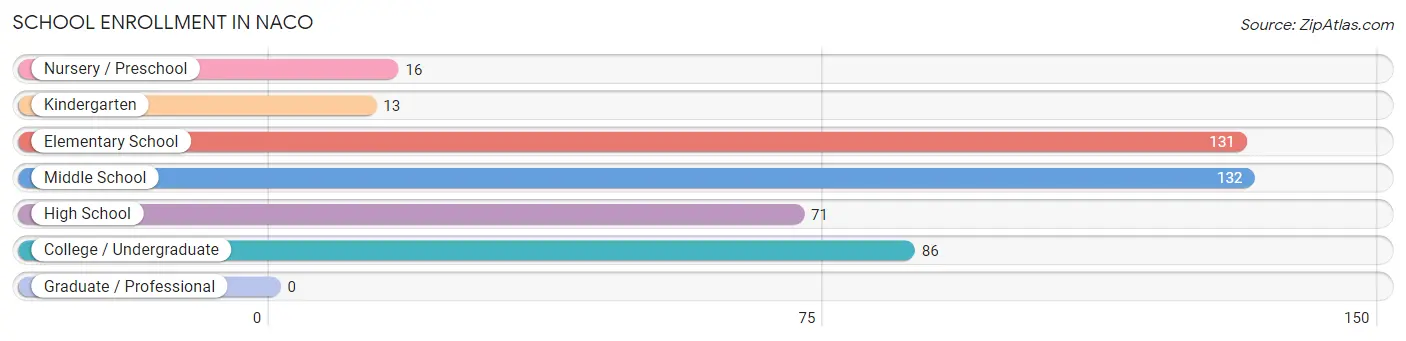
| School Level | # Students | % Students |
| Nursery / Preschool | 16 | 3.6% |
| Kindergarten | 13 | 2.9% |
| Elementary School | 131 | 29.2% |
| Middle School | 132 | 29.4% |
| High School | 71 | 15.8% |
| College / Undergraduate | 86 | 19.2% |
| Graduate / Professional | 0 | 0.0% |
| Total | 449 | 100.0% |
School Enrollment by Age by Funding Source in Naco
Out of a total of 449 students who are enrolled in schools in Naco, 5 (1.1%) attend a private institution, while the remaining 444 (98.9%) are enrolled in public schools. The age group of 5 to 9 year old has the highest likelihood of being enrolled in private schools, with 5 (3.1% in the age bracket) enrolled. Conversely, the age group of 10 to 14 year olds has the lowest likelihood of being enrolled in a private school, with 132 (100.0% in the age bracket) attending a public institution.
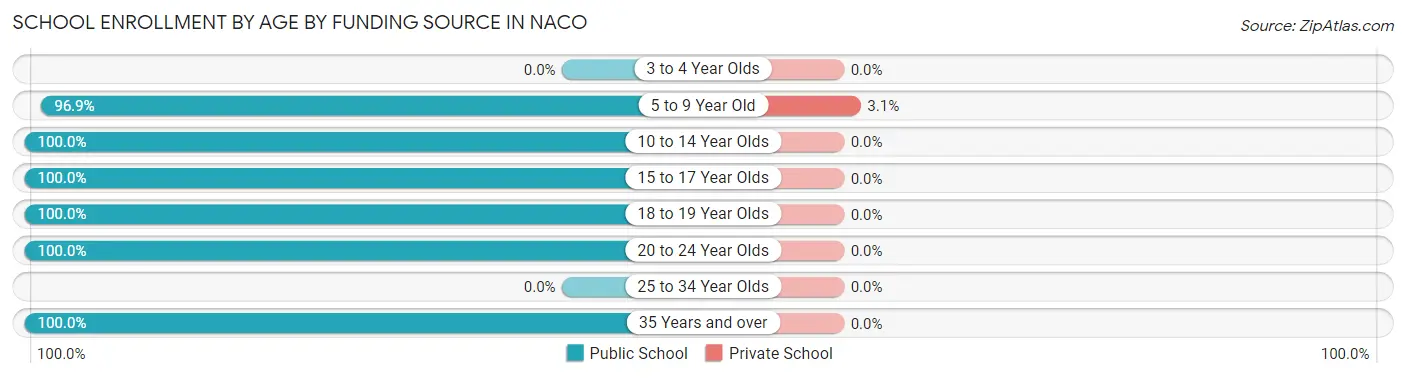
| Age Bracket | Public School | Private School |
| 3 to 4 Year Olds | 0 (0.0%) | 0 (0.0%) |
| 5 to 9 Year Old | 155 (96.9%) | 5 (3.1%) |
| 10 to 14 Year Olds | 132 (100.0%) | 0 (0.0%) |
| 15 to 17 Year Olds | 48 (100.0%) | 0 (0.0%) |
| 18 to 19 Year Olds | 20 (100.0%) | 0 (0.0%) |
| 20 to 24 Year Olds | 81 (100.0%) | 0 (0.0%) |
| 25 to 34 Year Olds | 0 (0.0%) | 0 (0.0%) |
| 35 Years and over | 8 (100.0%) | 0 (0.0%) |
| Total | 444 (98.9%) | 5 (1.1%) |
Educational Attainment by Field of Study in Naco
Education (17 | 37.0%), literature & languages (15 | 32.6%), computers & mathematics (7 | 15.2%), and science & technology (7 | 15.2%) are the most common fields of study among 46 individuals in Naco who have obtained a bachelor's degree or higher.
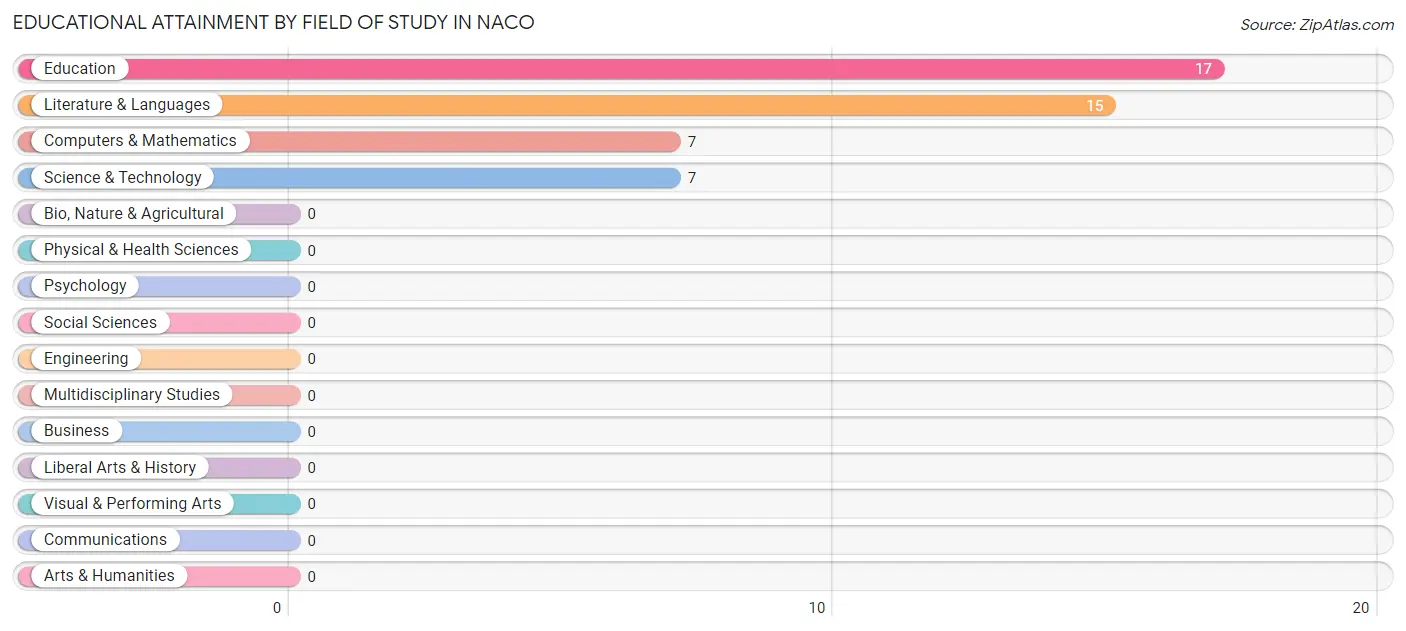
| Field of Study | # Graduates | % Graduates |
| Computers & Mathematics | 7 | 15.2% |
| Bio, Nature & Agricultural | 0 | 0.0% |
| Physical & Health Sciences | 0 | 0.0% |
| Psychology | 0 | 0.0% |
| Social Sciences | 0 | 0.0% |
| Engineering | 0 | 0.0% |
| Multidisciplinary Studies | 0 | 0.0% |
| Science & Technology | 7 | 15.2% |
| Business | 0 | 0.0% |
| Education | 17 | 37.0% |
| Literature & Languages | 15 | 32.6% |
| Liberal Arts & History | 0 | 0.0% |
| Visual & Performing Arts | 0 | 0.0% |
| Communications | 0 | 0.0% |
| Arts & Humanities | 0 | 0.0% |
| Total | 46 | 100.0% |
Transportation & Commute in Naco
Vehicle Availability by Sex in Naco
The most prevalent vehicle ownership categories in Naco are males with 2 vehicles (104, accounting for 41.4%) and females with 2 vehicles (33, making up 72.2%).
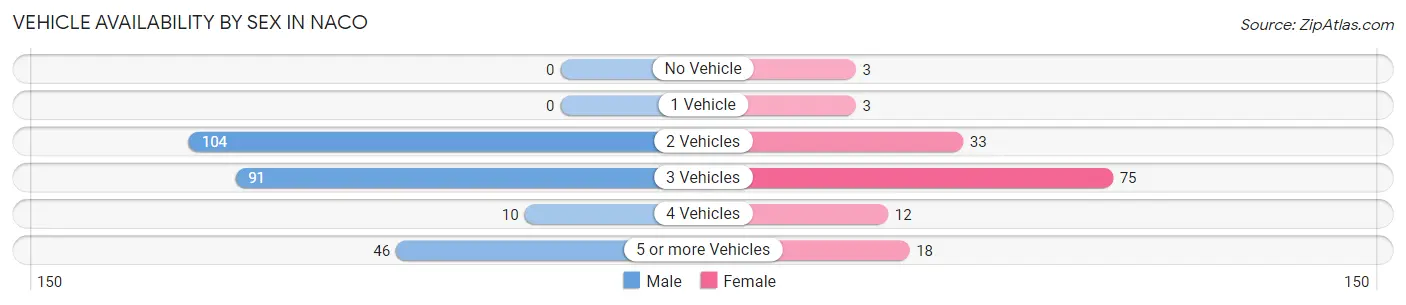
| Vehicles Available | Male | Female |
| No Vehicle | 0 (0.0%) | 3 (2.1%) |
| 1 Vehicle | 0 (0.0%) | 3 (2.1%) |
| 2 Vehicles | 104 (41.4%) | 33 (22.9%) |
| 3 Vehicles | 91 (36.2%) | 75 (52.1%) |
| 4 Vehicles | 10 (4.0%) | 12 (8.3%) |
| 5 or more Vehicles | 46 (18.3%) | 18 (12.5%) |
| Total | 251 (100.0%) | 144 (100.0%) |
Commute Time in Naco
The most frequently occuring commute durations in Naco are 45 to 59 minutes (112 commuters, 28.6%), 10 to 14 minutes (105 commuters, 26.8%), and 15 to 19 minutes (47 commuters, 12.0%).
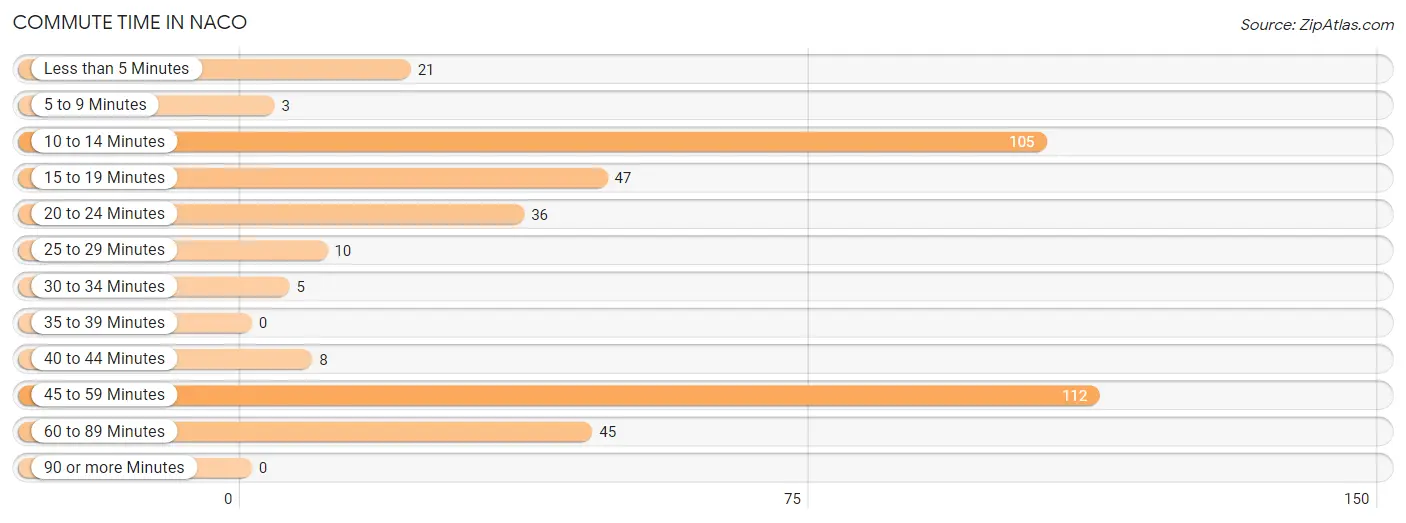
| Commute Time | # Commuters | % Commuters |
| Less than 5 Minutes | 21 | 5.4% |
| 5 to 9 Minutes | 3 | 0.8% |
| 10 to 14 Minutes | 105 | 26.8% |
| 15 to 19 Minutes | 47 | 12.0% |
| 20 to 24 Minutes | 36 | 9.2% |
| 25 to 29 Minutes | 10 | 2.5% |
| 30 to 34 Minutes | 5 | 1.3% |
| 35 to 39 Minutes | 0 | 0.0% |
| 40 to 44 Minutes | 8 | 2.0% |
| 45 to 59 Minutes | 112 | 28.6% |
| 60 to 89 Minutes | 45 | 11.5% |
| 90 or more Minutes | 0 | 0.0% |
Commute Time by Sex in Naco
The most common commute times in Naco are 10 to 14 minutes (105 commuters, 41.8%) for males and 45 to 59 minutes (47 commuters, 33.3%) for females.
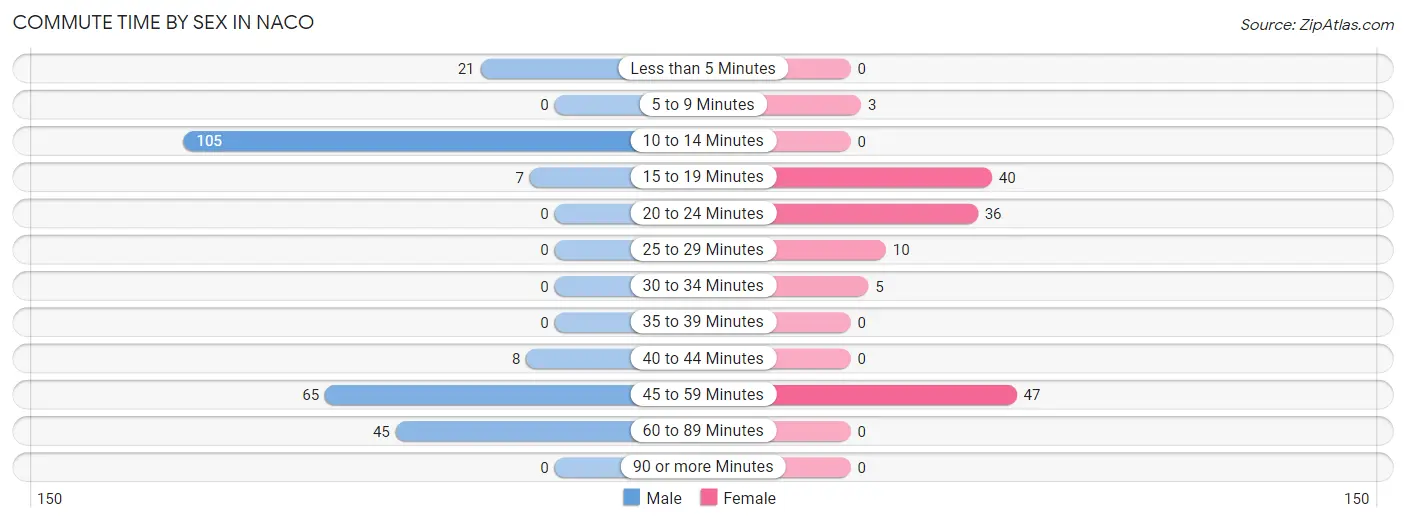
| Commute Time | Male | Female |
| Less than 5 Minutes | 21 (8.4%) | 0 (0.0%) |
| 5 to 9 Minutes | 0 (0.0%) | 3 (2.1%) |
| 10 to 14 Minutes | 105 (41.8%) | 0 (0.0%) |
| 15 to 19 Minutes | 7 (2.8%) | 40 (28.4%) |
| 20 to 24 Minutes | 0 (0.0%) | 36 (25.5%) |
| 25 to 29 Minutes | 0 (0.0%) | 10 (7.1%) |
| 30 to 34 Minutes | 0 (0.0%) | 5 (3.5%) |
| 35 to 39 Minutes | 0 (0.0%) | 0 (0.0%) |
| 40 to 44 Minutes | 8 (3.2%) | 0 (0.0%) |
| 45 to 59 Minutes | 65 (25.9%) | 47 (33.3%) |
| 60 to 89 Minutes | 45 (17.9%) | 0 (0.0%) |
| 90 or more Minutes | 0 (0.0%) | 0 (0.0%) |
Time of Departure to Work by Sex in Naco
The most frequent times of departure to work in Naco are 5:00 AM to 5:29 AM (96, 38.3%) for males and 11:00 AM to 11:59 AM (39, 27.7%) for females.
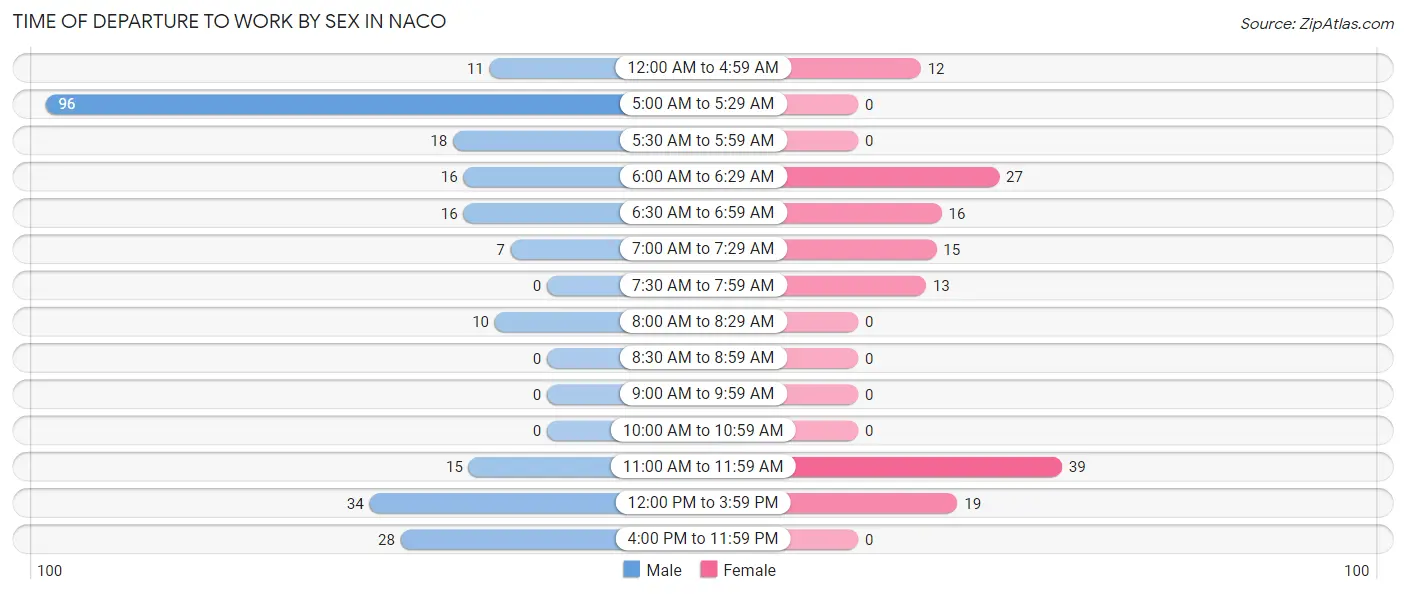
| Time of Departure | Male | Female |
| 12:00 AM to 4:59 AM | 11 (4.4%) | 12 (8.5%) |
| 5:00 AM to 5:29 AM | 96 (38.3%) | 0 (0.0%) |
| 5:30 AM to 5:59 AM | 18 (7.2%) | 0 (0.0%) |
| 6:00 AM to 6:29 AM | 16 (6.4%) | 27 (19.2%) |
| 6:30 AM to 6:59 AM | 16 (6.4%) | 16 (11.4%) |
| 7:00 AM to 7:29 AM | 7 (2.8%) | 15 (10.6%) |
| 7:30 AM to 7:59 AM | 0 (0.0%) | 13 (9.2%) |
| 8:00 AM to 8:29 AM | 10 (4.0%) | 0 (0.0%) |
| 8:30 AM to 8:59 AM | 0 (0.0%) | 0 (0.0%) |
| 9:00 AM to 9:59 AM | 0 (0.0%) | 0 (0.0%) |
| 10:00 AM to 10:59 AM | 0 (0.0%) | 0 (0.0%) |
| 11:00 AM to 11:59 AM | 15 (6.0%) | 39 (27.7%) |
| 12:00 PM to 3:59 PM | 34 (13.6%) | 19 (13.5%) |
| 4:00 PM to 11:59 PM | 28 (11.2%) | 0 (0.0%) |
| Total | 251 (100.0%) | 141 (100.0%) |
Housing Occupancy in Naco
Occupancy by Ownership in Naco
Of the total 378 dwellings in Naco, owner-occupied units account for 300 (79.4%), while renter-occupied units make up 78 (20.6%).
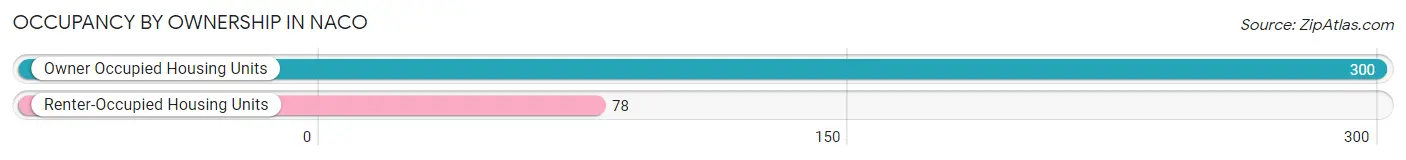
| Occupancy | # Housing Units | % Housing Units |
| Owner Occupied Housing Units | 300 | 79.4% |
| Renter-Occupied Housing Units | 78 | 20.6% |
| Total Occupied Housing Units | 378 | 100.0% |
Occupancy by Household Size in Naco
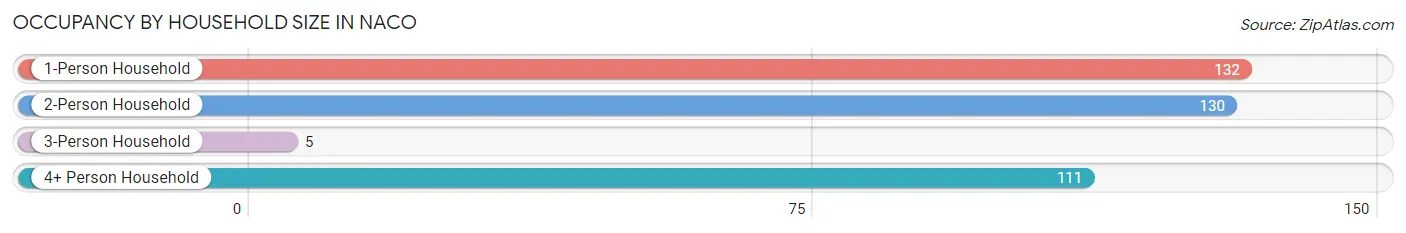
| Household Size | # Housing Units | % Housing Units |
| 1-Person Household | 132 | 34.9% |
| 2-Person Household | 130 | 34.4% |
| 3-Person Household | 5 | 1.3% |
| 4+ Person Household | 111 | 29.4% |
| Total Housing Units | 378 | 100.0% |
Occupancy by Ownership by Household Size in Naco
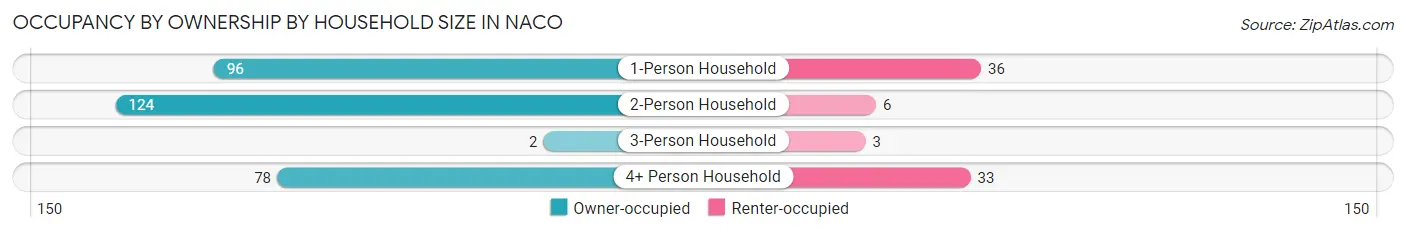
| Household Size | Owner-occupied | Renter-occupied |
| 1-Person Household | 96 (72.7%) | 36 (27.3%) |
| 2-Person Household | 124 (95.4%) | 6 (4.6%) |
| 3-Person Household | 2 (40.0%) | 3 (60.0%) |
| 4+ Person Household | 78 (70.3%) | 33 (29.7%) |
| Total Housing Units | 300 (79.4%) | 78 (20.6%) |
Occupancy by Educational Attainment in Naco
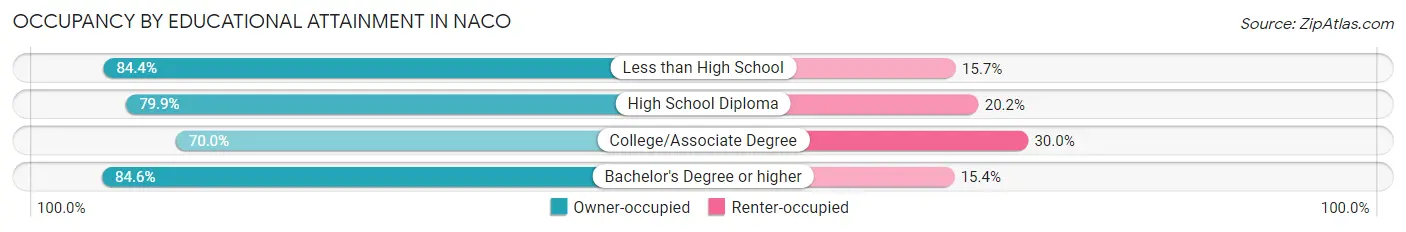
| Household Size | Owner-occupied | Renter-occupied |
| Less than High School | 97 (84.4%) | 18 (15.7%) |
| High School Diploma | 107 (79.8%) | 27 (20.2%) |
| College/Associate Degree | 63 (70.0%) | 27 (30.0%) |
| Bachelor's Degree or higher | 33 (84.6%) | 6 (15.4%) |
Occupancy by Age of Householder in Naco
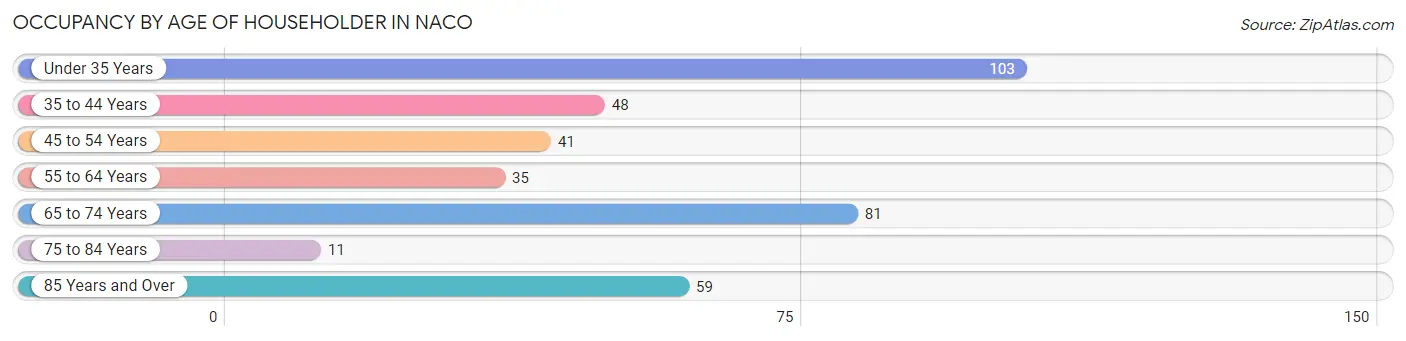
| Age Bracket | # Households | % Households |
| Under 35 Years | 103 | 27.3% |
| 35 to 44 Years | 48 | 12.7% |
| 45 to 54 Years | 41 | 10.8% |
| 55 to 64 Years | 35 | 9.3% |
| 65 to 74 Years | 81 | 21.4% |
| 75 to 84 Years | 11 | 2.9% |
| 85 Years and Over | 59 | 15.6% |
| Total | 378 | 100.0% |
Housing Finances in Naco
Median Income by Occupancy in Naco
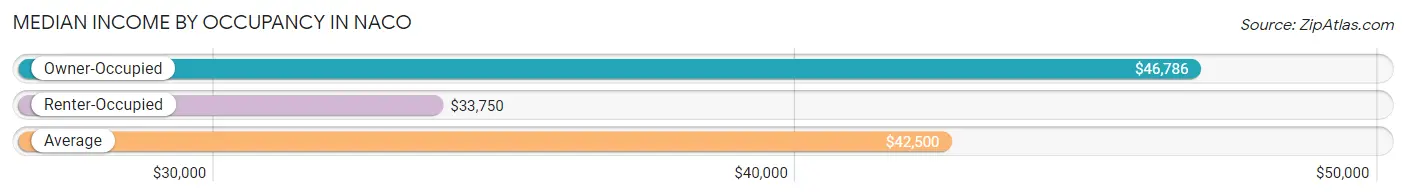
| Occupancy Type | # Households | Median Income |
| Owner-Occupied | 300 (79.4%) | $46,786 |
| Renter-Occupied | 78 (20.6%) | $33,750 |
| Average | 378 (100.0%) | $42,500 |
Occupancy by Householder Income Bracket in Naco
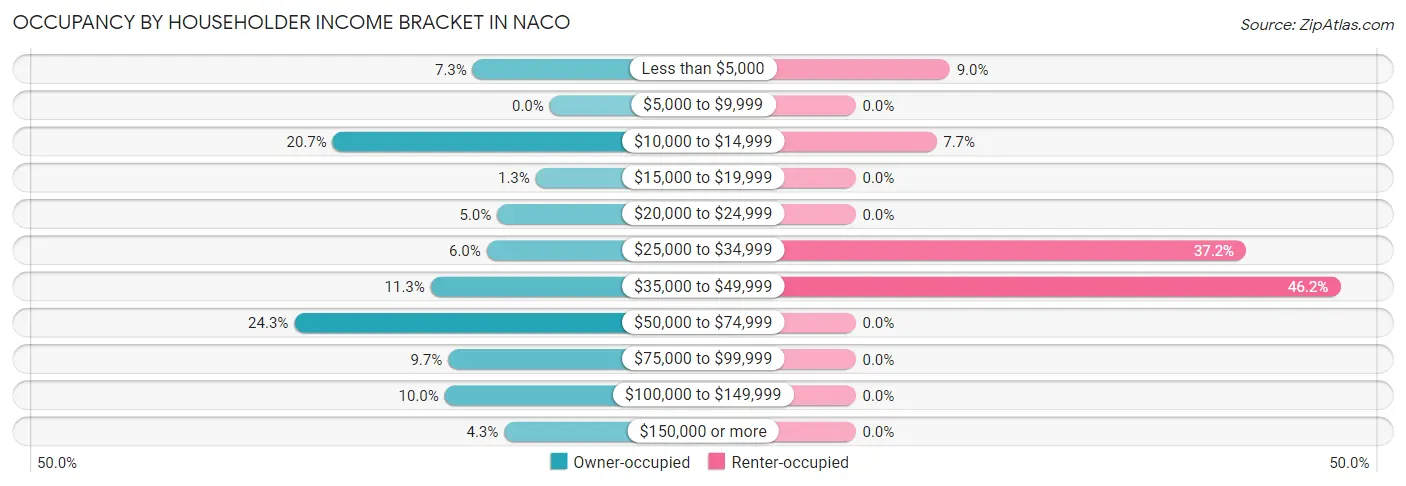
| Income Bracket | Owner-occupied | Renter-occupied |
| Less than $5,000 | 22 (7.3%) | 7 (9.0%) |
| $5,000 to $9,999 | 0 (0.0%) | 0 (0.0%) |
| $10,000 to $14,999 | 62 (20.7%) | 6 (7.7%) |
| $15,000 to $19,999 | 4 (1.3%) | 0 (0.0%) |
| $20,000 to $24,999 | 15 (5.0%) | 0 (0.0%) |
| $25,000 to $34,999 | 18 (6.0%) | 29 (37.2%) |
| $35,000 to $49,999 | 34 (11.3%) | 36 (46.2%) |
| $50,000 to $74,999 | 73 (24.3%) | 0 (0.0%) |
| $75,000 to $99,999 | 29 (9.7%) | 0 (0.0%) |
| $100,000 to $149,999 | 30 (10.0%) | 0 (0.0%) |
| $150,000 or more | 13 (4.3%) | 0 (0.0%) |
| Total | 300 (100.0%) | 78 (100.0%) |
Monthly Housing Cost Tiers in Naco
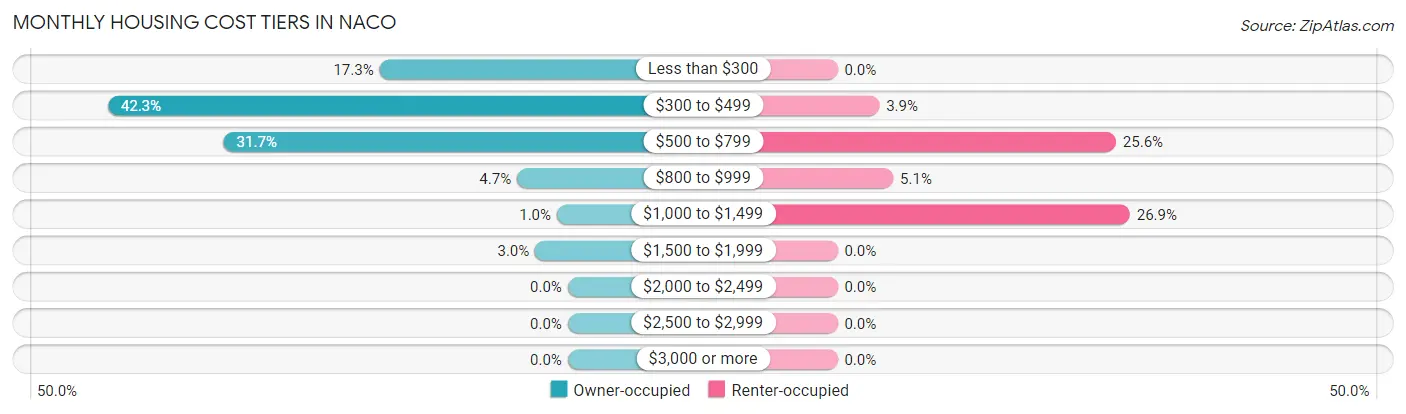
| Monthly Cost | Owner-occupied | Renter-occupied |
| Less than $300 | 52 (17.3%) | 0 (0.0%) |
| $300 to $499 | 127 (42.3%) | 3 (3.8%) |
| $500 to $799 | 95 (31.7%) | 20 (25.6%) |
| $800 to $999 | 14 (4.7%) | 4 (5.1%) |
| $1,000 to $1,499 | 3 (1.0%) | 21 (26.9%) |
| $1,500 to $1,999 | 9 (3.0%) | 0 (0.0%) |
| $2,000 to $2,499 | 0 (0.0%) | 0 (0.0%) |
| $2,500 to $2,999 | 0 (0.0%) | 0 (0.0%) |
| $3,000 or more | 0 (0.0%) | 0 (0.0%) |
| Total | 300 (100.0%) | 78 (100.0%) |
Physical Housing Characteristics in Naco
Housing Structures in Naco
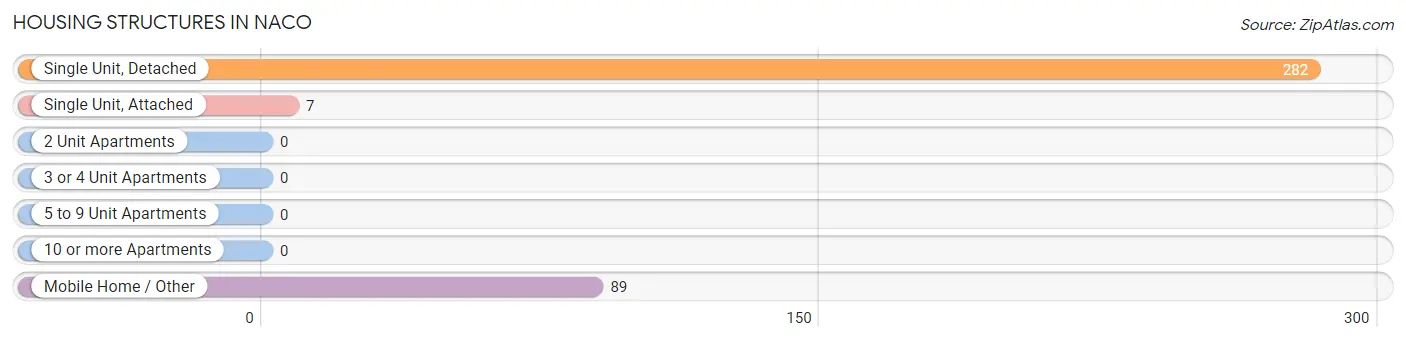
| Structure Type | # Housing Units | % Housing Units |
| Single Unit, Detached | 282 | 74.6% |
| Single Unit, Attached | 7 | 1.8% |
| 2 Unit Apartments | 0 | 0.0% |
| 3 or 4 Unit Apartments | 0 | 0.0% |
| 5 to 9 Unit Apartments | 0 | 0.0% |
| 10 or more Apartments | 0 | 0.0% |
| Mobile Home / Other | 89 | 23.5% |
| Total | 378 | 100.0% |
Housing Structures by Occupancy in Naco
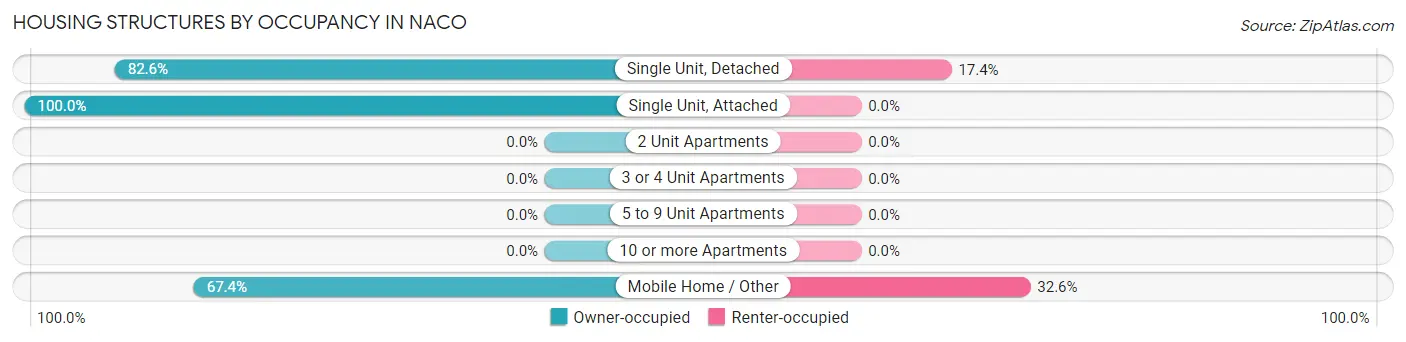
| Structure Type | Owner-occupied | Renter-occupied |
| Single Unit, Detached | 233 (82.6%) | 49 (17.4%) |
| Single Unit, Attached | 7 (100.0%) | 0 (0.0%) |
| 2 Unit Apartments | 0 (0.0%) | 0 (0.0%) |
| 3 or 4 Unit Apartments | 0 (0.0%) | 0 (0.0%) |
| 5 to 9 Unit Apartments | 0 (0.0%) | 0 (0.0%) |
| 10 or more Apartments | 0 (0.0%) | 0 (0.0%) |
| Mobile Home / Other | 60 (67.4%) | 29 (32.6%) |
| Total | 300 (79.4%) | 78 (20.6%) |
Housing Structures by Number of Rooms in Naco
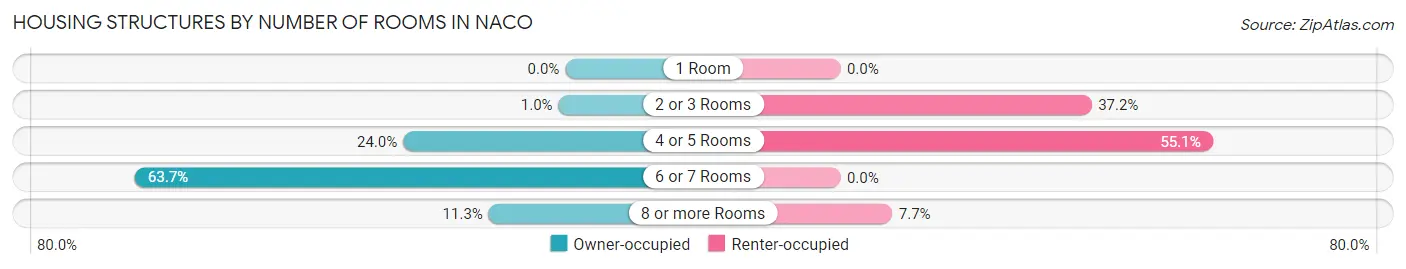
| Number of Rooms | Owner-occupied | Renter-occupied |
| 1 Room | 0 (0.0%) | 0 (0.0%) |
| 2 or 3 Rooms | 3 (1.0%) | 29 (37.2%) |
| 4 or 5 Rooms | 72 (24.0%) | 43 (55.1%) |
| 6 or 7 Rooms | 191 (63.7%) | 0 (0.0%) |
| 8 or more Rooms | 34 (11.3%) | 6 (7.7%) |
| Total | 300 (100.0%) | 78 (100.0%) |
Housing Structure by Heating Type in Naco
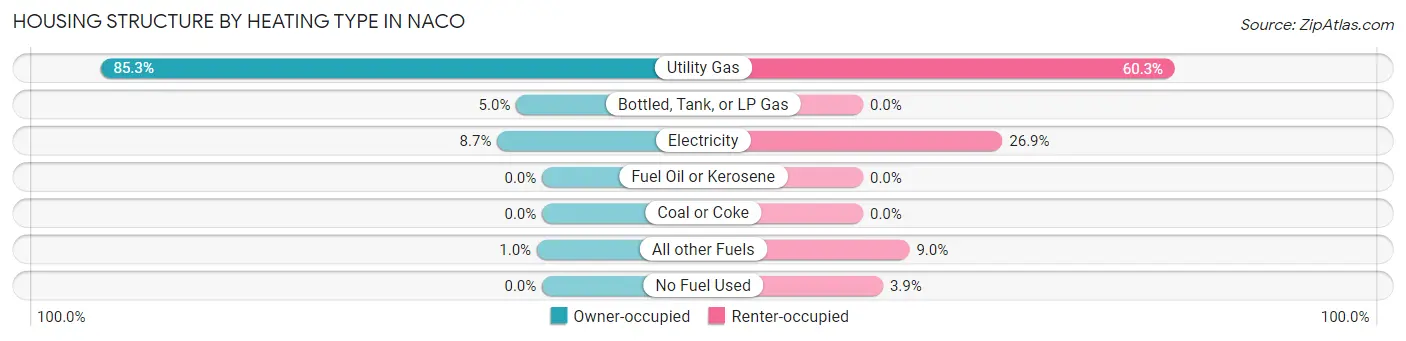
| Heating Type | Owner-occupied | Renter-occupied |
| Utility Gas | 256 (85.3%) | 47 (60.3%) |
| Bottled, Tank, or LP Gas | 15 (5.0%) | 0 (0.0%) |
| Electricity | 26 (8.7%) | 21 (26.9%) |
| Fuel Oil or Kerosene | 0 (0.0%) | 0 (0.0%) |
| Coal or Coke | 0 (0.0%) | 0 (0.0%) |
| All other Fuels | 3 (1.0%) | 7 (9.0%) |
| No Fuel Used | 0 (0.0%) | 3 (3.8%) |
| Total | 300 (100.0%) | 78 (100.0%) |
Household Vehicle Usage in Naco
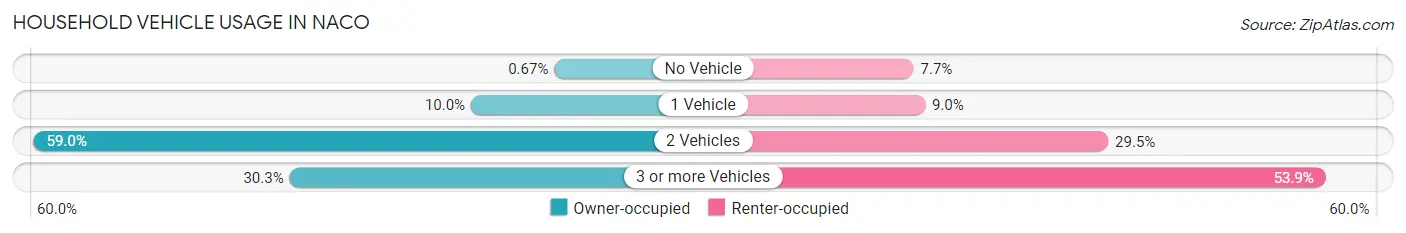
| Vehicles per Household | Owner-occupied | Renter-occupied |
| No Vehicle | 2 (0.7%) | 6 (7.7%) |
| 1 Vehicle | 30 (10.0%) | 7 (9.0%) |
| 2 Vehicles | 177 (59.0%) | 23 (29.5%) |
| 3 or more Vehicles | 91 (30.3%) | 42 (53.8%) |
| Total | 300 (100.0%) | 78 (100.0%) |
Real Estate & Mortgages in Naco
Real Estate and Mortgage Overview in Naco
| Characteristic | Without Mortgage | With Mortgage |
| Housing Units | 203 | 97 |
| Median Property Value | $68,800 | $0 |
| Median Household Income | - | - |
| Monthly Housing Costs | $362 | $0 |
| Real Estate Taxes | $816 | $0 |
Property Value by Mortgage Status in Naco
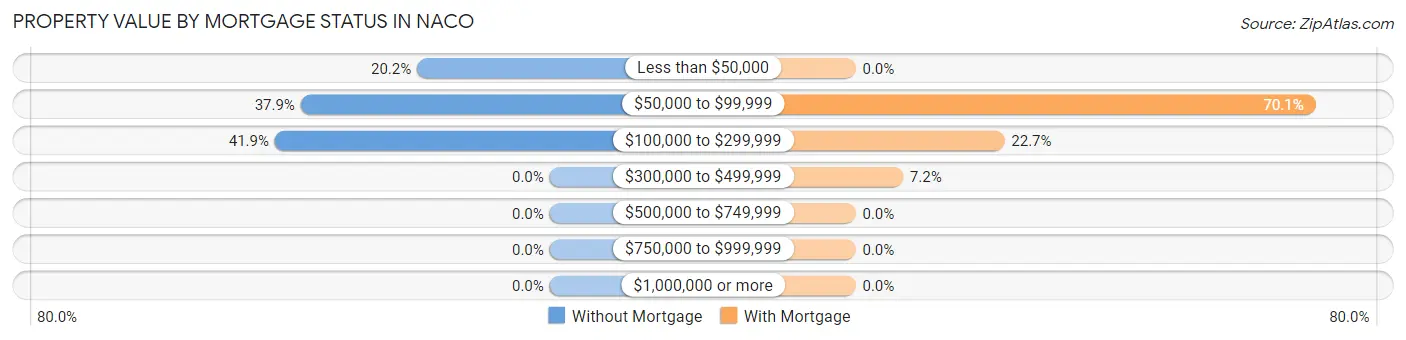
| Property Value | Without Mortgage | With Mortgage |
| Less than $50,000 | 41 (20.2%) | 0 (0.0%) |
| $50,000 to $99,999 | 77 (37.9%) | 68 (70.1%) |
| $100,000 to $299,999 | 85 (41.9%) | 22 (22.7%) |
| $300,000 to $499,999 | 0 (0.0%) | 7 (7.2%) |
| $500,000 to $749,999 | 0 (0.0%) | 0 (0.0%) |
| $750,000 to $999,999 | 0 (0.0%) | 0 (0.0%) |
| $1,000,000 or more | 0 (0.0%) | 0 (0.0%) |
| Total | 203 (100.0%) | 97 (100.0%) |
Household Income by Mortgage Status in Naco
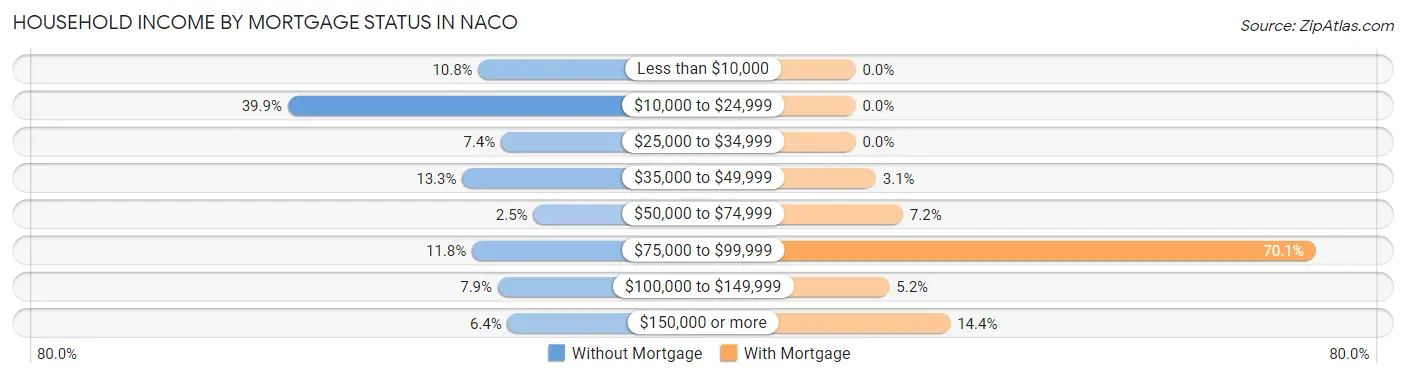
| Household Income | Without Mortgage | With Mortgage |
| Less than $10,000 | 22 (10.8%) | 0 (0.0%) |
| $10,000 to $24,999 | 81 (39.9%) | 0 (0.0%) |
| $25,000 to $34,999 | 15 (7.4%) | 0 (0.0%) |
| $35,000 to $49,999 | 27 (13.3%) | 3 (3.1%) |
| $50,000 to $74,999 | 5 (2.5%) | 7 (7.2%) |
| $75,000 to $99,999 | 24 (11.8%) | 68 (70.1%) |
| $100,000 to $149,999 | 16 (7.9%) | 5 (5.1%) |
| $150,000 or more | 13 (6.4%) | 14 (14.4%) |
| Total | 203 (100.0%) | 97 (100.0%) |
Property Value to Household Income Ratio in Naco
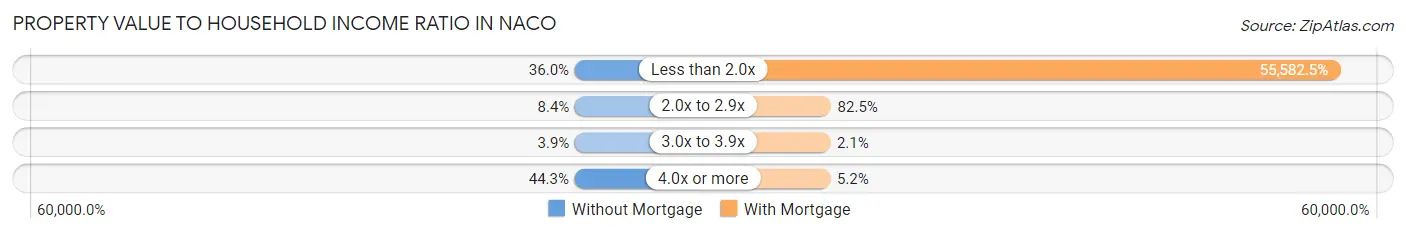
| Value-to-Income Ratio | Without Mortgage | With Mortgage |
| Less than 2.0x | 73 (36.0%) | 53,915 (55,582.5%) |
| 2.0x to 2.9x | 17 (8.4%) | 80 (82.5%) |
| 3.0x to 3.9x | 8 (3.9%) | 2 (2.1%) |
| 4.0x or more | 90 (44.3%) | 5 (5.1%) |
| Total | 203 (100.0%) | 97 (100.0%) |
Real Estate Taxes by Mortgage Status in Naco
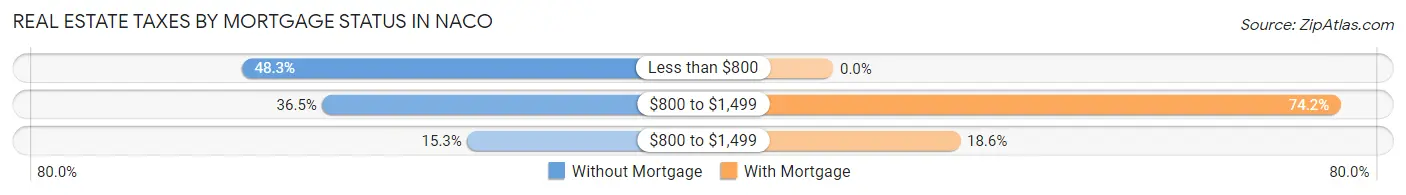
| Property Taxes | Without Mortgage | With Mortgage |
| Less than $800 | 98 (48.3%) | 0 (0.0%) |
| $800 to $1,499 | 74 (36.4%) | 72 (74.2%) |
| $800 to $1,499 | 31 (15.3%) | 18 (18.6%) |
| Total | 203 (100.0%) | 97 (100.0%) |
Health & Disability in Naco
Health Insurance Coverage by Age in Naco
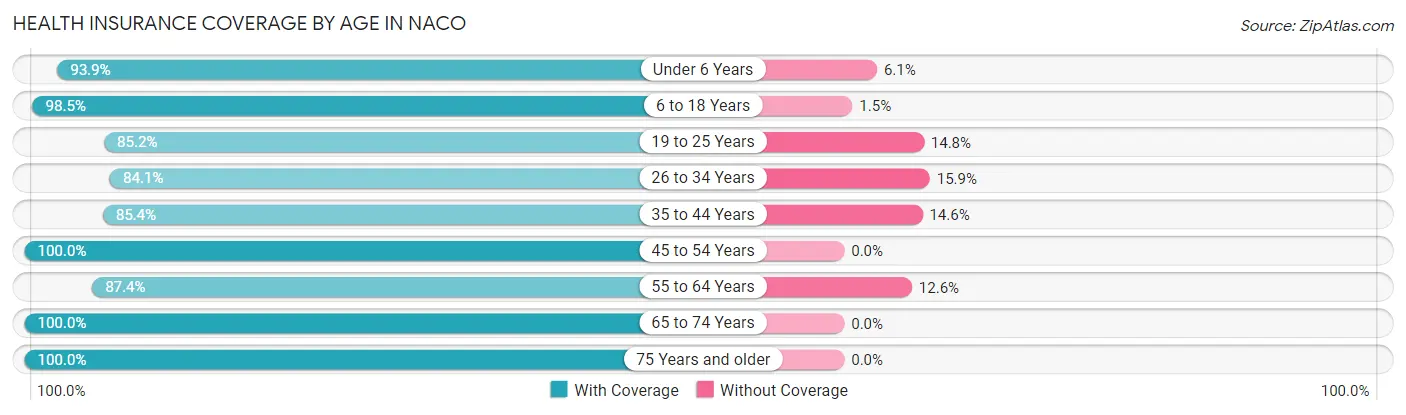
| Age Bracket | With Coverage | Without Coverage |
| Under 6 Years | 77 (93.9%) | 5 (6.1%) |
| 6 to 18 Years | 326 (98.5%) | 5 (1.5%) |
| 19 to 25 Years | 132 (85.2%) | 23 (14.8%) |
| 26 to 34 Years | 116 (84.1%) | 22 (15.9%) |
| 35 to 44 Years | 41 (85.4%) | 7 (14.6%) |
| 45 to 54 Years | 74 (100.0%) | 0 (0.0%) |
| 55 to 64 Years | 97 (87.4%) | 14 (12.6%) |
| 65 to 74 Years | 167 (100.0%) | 0 (0.0%) |
| 75 Years and older | 83 (100.0%) | 0 (0.0%) |
| Total | 1,113 (93.6%) | 76 (6.4%) |
Health Insurance Coverage by Citizenship Status in Naco

| Citizenship Status | With Coverage | Without Coverage |
| Native Born | 77 (93.9%) | 5 (6.1%) |
| Foreign Born, Citizen | 326 (98.5%) | 5 (1.5%) |
| Foreign Born, not a Citizen | 132 (85.2%) | 23 (14.8%) |
Health Insurance Coverage by Household Income in Naco
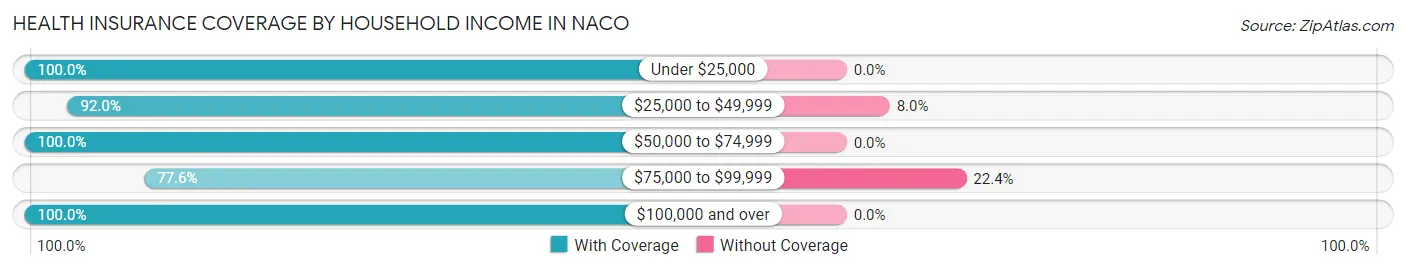
| Household Income | With Coverage | Without Coverage |
| Under $25,000 | 208 (100.0%) | 0 (0.0%) |
| $25,000 to $49,999 | 423 (92.0%) | 37 (8.0%) |
| $50,000 to $74,999 | 157 (100.0%) | 0 (0.0%) |
| $75,000 to $99,999 | 135 (77.6%) | 39 (22.4%) |
| $100,000 and over | 190 (100.0%) | 0 (0.0%) |
Public vs Private Health Insurance Coverage by Age in Naco
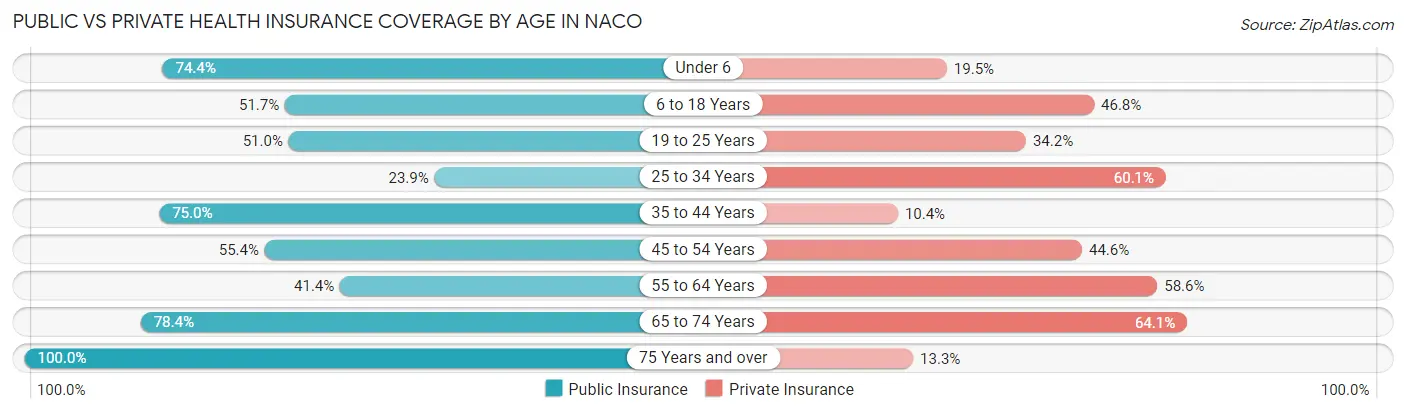
| Age Bracket | Public Insurance | Private Insurance |
| Under 6 | 61 (74.4%) | 16 (19.5%) |
| 6 to 18 Years | 171 (51.7%) | 155 (46.8%) |
| 19 to 25 Years | 79 (51.0%) | 53 (34.2%) |
| 25 to 34 Years | 33 (23.9%) | 83 (60.1%) |
| 35 to 44 Years | 36 (75.0%) | 5 (10.4%) |
| 45 to 54 Years | 41 (55.4%) | 33 (44.6%) |
| 55 to 64 Years | 46 (41.4%) | 65 (58.6%) |
| 65 to 74 Years | 131 (78.4%) | 107 (64.1%) |
| 75 Years and over | 83 (100.0%) | 11 (13.3%) |
| Total | 681 (57.3%) | 528 (44.4%) |
Disability Status by Sex by Age in Naco
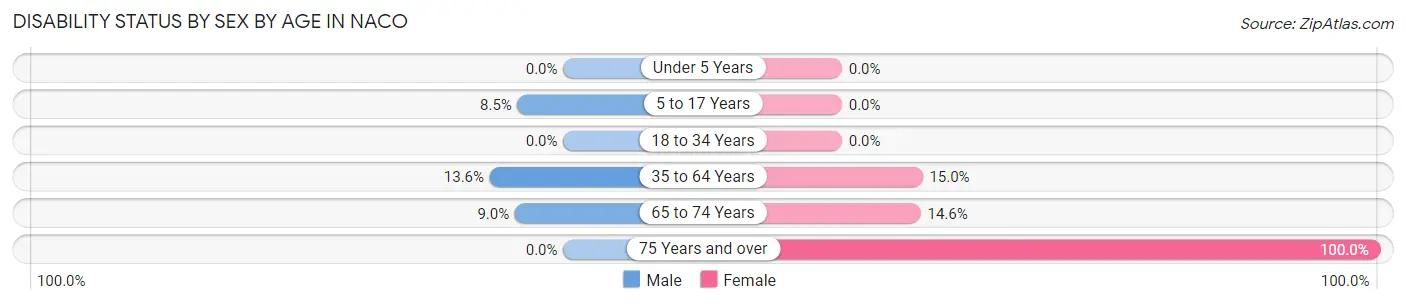
| Age Bracket | Male | Female |
| Under 5 Years | 0 (0.0%) | 0 (0.0%) |
| 5 to 17 Years | 14 (8.5%) | 0 (0.0%) |
| 18 to 34 Years | 0 (0.0%) | 0 (0.0%) |
| 35 to 64 Years | 9 (13.6%) | 25 (15.0%) |
| 65 to 74 Years | 7 (9.0%) | 13 (14.6%) |
| 75 Years and over | 0 (0.0%) | 72 (100.0%) |
Disability Class by Sex by Age in Naco
Disability Class: Hearing Difficulty
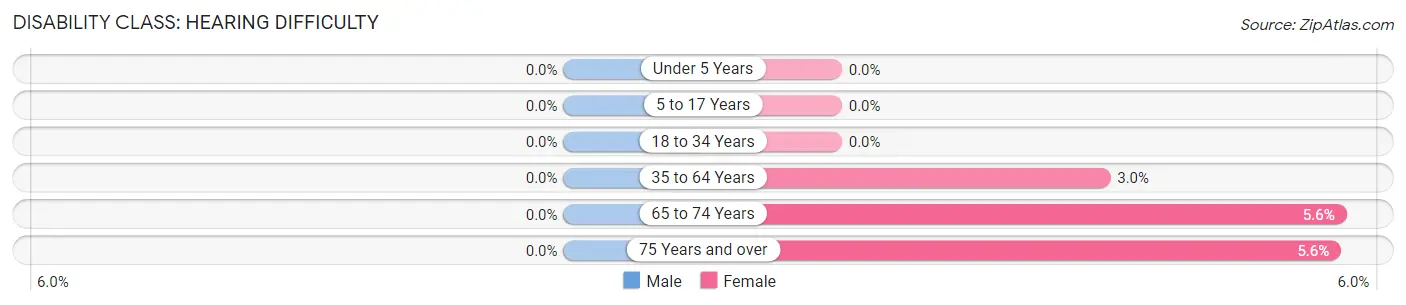
| Age Bracket | Male | Female |
| Under 5 Years | 0 (0.0%) | 0 (0.0%) |
| 5 to 17 Years | 0 (0.0%) | 0 (0.0%) |
| 18 to 34 Years | 0 (0.0%) | 0 (0.0%) |
| 35 to 64 Years | 0 (0.0%) | 5 (3.0%) |
| 65 to 74 Years | 0 (0.0%) | 5 (5.6%) |
| 75 Years and over | 0 (0.0%) | 4 (5.6%) |
Disability Class: Vision Difficulty
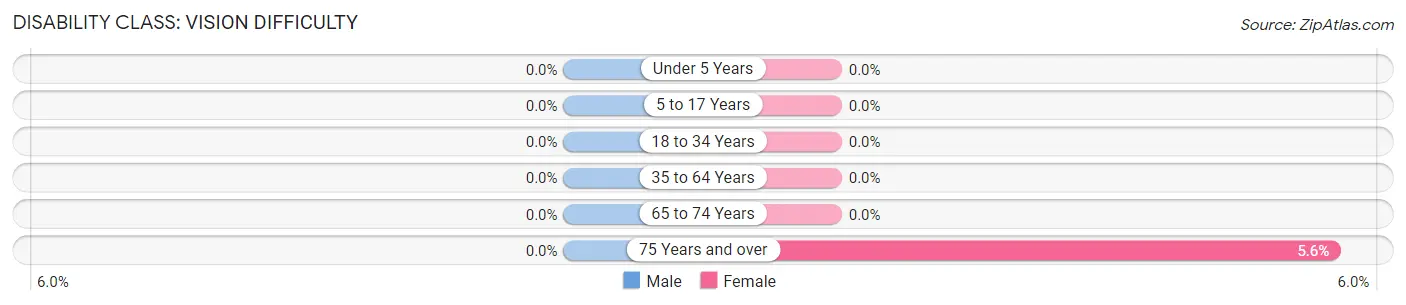
| Age Bracket | Male | Female |
| Under 5 Years | 0 (0.0%) | 0 (0.0%) |
| 5 to 17 Years | 0 (0.0%) | 0 (0.0%) |
| 18 to 34 Years | 0 (0.0%) | 0 (0.0%) |
| 35 to 64 Years | 0 (0.0%) | 0 (0.0%) |
| 65 to 74 Years | 0 (0.0%) | 0 (0.0%) |
| 75 Years and over | 0 (0.0%) | 4 (5.6%) |
Disability Class: Cognitive Difficulty
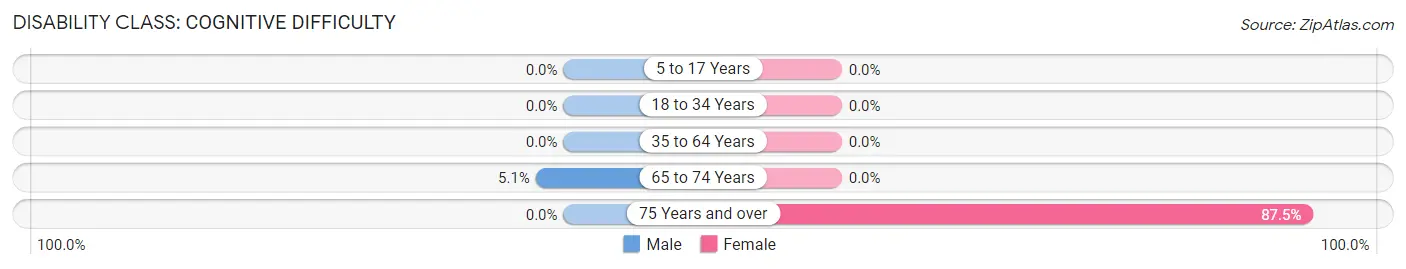
| Age Bracket | Male | Female |
| 5 to 17 Years | 0 (0.0%) | 0 (0.0%) |
| 18 to 34 Years | 0 (0.0%) | 0 (0.0%) |
| 35 to 64 Years | 0 (0.0%) | 0 (0.0%) |
| 65 to 74 Years | 4 (5.1%) | 0 (0.0%) |
| 75 Years and over | 0 (0.0%) | 63 (87.5%) |
Disability Class: Ambulatory Difficulty
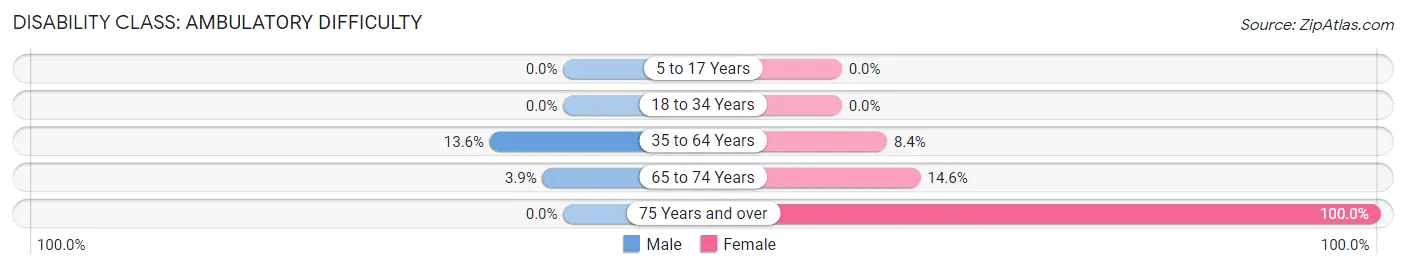
| Age Bracket | Male | Female |
| 5 to 17 Years | 0 (0.0%) | 0 (0.0%) |
| 18 to 34 Years | 0 (0.0%) | 0 (0.0%) |
| 35 to 64 Years | 9 (13.6%) | 14 (8.4%) |
| 65 to 74 Years | 3 (3.8%) | 13 (14.6%) |
| 75 Years and over | 0 (0.0%) | 72 (100.0%) |
Disability Class: Self-Care Difficulty
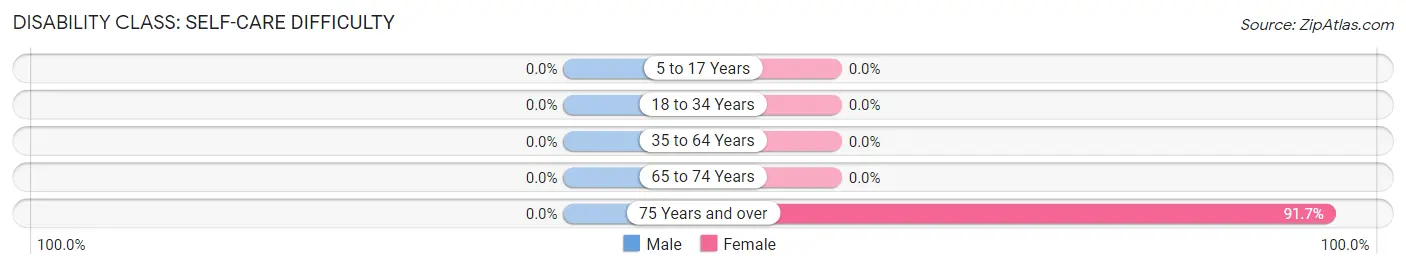
| Age Bracket | Male | Female |
| 5 to 17 Years | 0 (0.0%) | 0 (0.0%) |
| 18 to 34 Years | 0 (0.0%) | 0 (0.0%) |
| 35 to 64 Years | 0 (0.0%) | 0 (0.0%) |
| 65 to 74 Years | 0 (0.0%) | 0 (0.0%) |
| 75 Years and over | 0 (0.0%) | 66 (91.7%) |
Technology Access in Naco
Computing Device Access in Naco
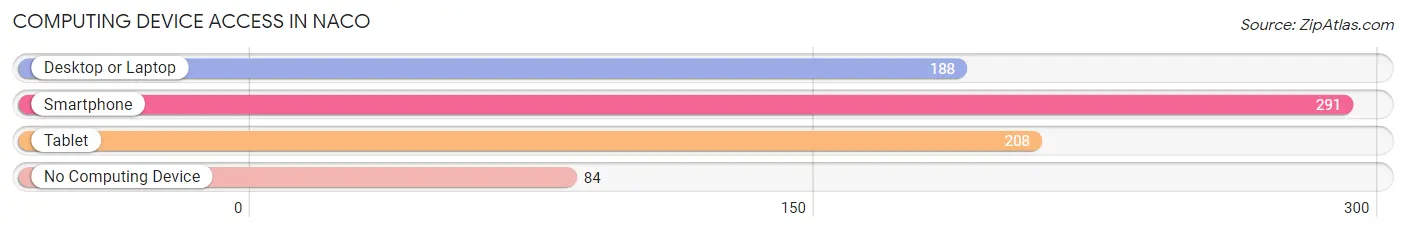
| Device Type | # Households | % Households |
| Desktop or Laptop | 188 | 49.7% |
| Smartphone | 291 | 77.0% |
| Tablet | 208 | 55.0% |
| No Computing Device | 84 | 22.2% |
| Total | 378 | 100.0% |
Internet Access in Naco
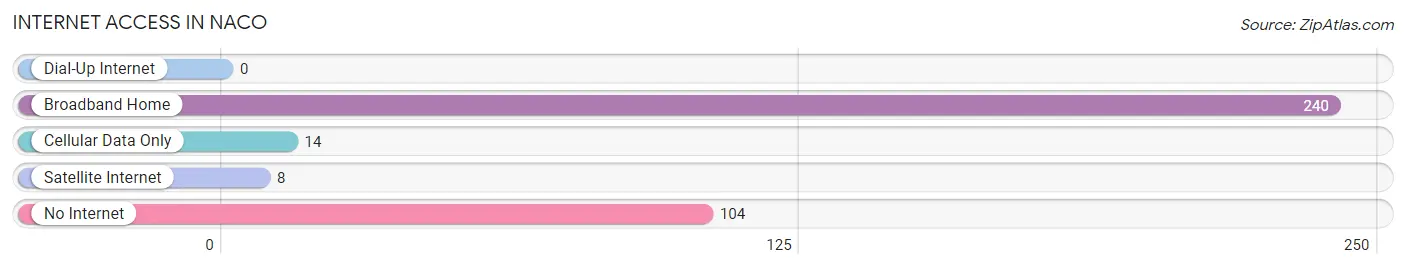
| Internet Type | # Households | % Households |
| Dial-Up Internet | 0 | 0.0% |
| Broadband Home | 240 | 63.5% |
| Cellular Data Only | 14 | 3.7% |
| Satellite Internet | 8 | 2.1% |
| No Internet | 104 | 27.5% |
| Total | 378 | 100.0% |
Naco Summary
Naco, Arizona is a small town located in Cochise County, Arizona, United States. It is situated on the U.S.-Mexico border, just south of the city of Bisbee. The town is home to a population of approximately 1,000 people, and is known for its unique history and culture.
Geography
Naco is located in the southeastern corner of Arizona, in the San Pedro Valley. It is situated on the U.S.-Mexico border, just south of the city of Bisbee. The town is surrounded by the Coronado National Forest, and is located at an elevation of 4,000 feet. The climate in Naco is semi-arid, with hot summers and mild winters.
History
Naco was founded in 1901 by a group of miners from Bisbee. The town was originally named “Nacoochee”, after a Native American chief who lived in the area. The name was later changed to “Naco”, which is derived from the Spanish word for “naked”.
The town quickly grew in size and importance, and by 1910 it had become a major trading center for the region. During the Mexican Revolution, Naco was a major staging area for the Mexican Army. In 1916, the town was the site of a major battle between the Mexican and U.S. forces.
In the 1920s, Naco became a popular tourist destination, and the town was home to several hotels and resorts. The town also became a popular destination for Hollywood stars, who would come to the area to film westerns.
In the 1950s, Naco was the site of a major border dispute between the U.S. and Mexico. The dispute was eventually resolved, and the town has since become a major port of entry for both countries.
Economy
Naco’s economy is largely based on tourism and border trade. The town is home to several hotels and resorts, as well as a number of restaurants and shops. The town is also home to a number of manufacturing and agricultural businesses.
Demographics
As of the 2010 census, Naco had a population of 1,006 people. The racial makeup of the town was 75.3% White, 0.7% African American, 0.3% Native American, 0.2% Asian, 0.1% Pacific Islander, and 22.5% from other races. Hispanic or Latino of any race were 98.2% of the population.
The median household income in Naco was $25,000, and the median family income was $27,000. The per capita income was $13,000. About 24.3% of the population was below the poverty line.
Conclusion
Naco, Arizona is a small town located in Cochise County, Arizona, United States. It is situated on the U.S.-Mexico border, just south of the city of Bisbee. The town is home to a population of approximately 1,000 people, and is known for its unique history and culture. The town’s economy is largely based on tourism and border trade, and the town is home to several hotels and resorts, as well as a number of restaurants and shops. The racial makeup of the town is largely Hispanic or Latino, and the median household income is $25,000.
Common Questions
What is Per Capita Income in Naco?
Per Capita income in Naco is $16,765.
What is the Median Family Income in Naco?
Median Family Income in Naco is $52,776.
What is the Median Household income in Naco?
Median Household Income in Naco is $42,500.
What is Income or Wage Gap in Naco?
Income or Wage Gap in Naco is 47.1%.
Women in Naco earn 52.9 cents for every dollar earned by a man.
What is Inequality or Gini Index in Naco?
Inequality or Gini Index in Naco is 0.42.
What is the Total Population of Naco?
Total Population of Naco is 1,189.
What is the Total Male Population of Naco?
Total Male Population of Naco is 545.
What is the Total Female Population of Naco?
Total Female Population of Naco is 644.
What is the Ratio of Males per 100 Females in Naco?
There are 84.63 Males per 100 Females in Naco.
What is the Ratio of Females per 100 Males in Naco?
There are 118.17 Females per 100 Males in Naco.
What is the Median Population Age in Naco?
Median Population Age in Naco is 29.3 Years.
What is the Average Family Size in Naco
Average Family Size in Naco is 4.3 People.
What is the Average Household Size in Naco
Average Household Size in Naco is 3.1 People.
How Large is the Labor Force in Naco?
There are 416 People in the Labor Forcein in Naco.
What is the Percentage of People in the Labor Force in Naco?
50.9% of People are in the Labor Force in Naco.
What is the Unemployment Rate in Naco?
Unemployment Rate in Naco is 5.0%.