Zip Codes with the Highest Percentage of Population Employed in Food Preparation & Serving in San Luis, AZ
RELATED REPORTS & OPTIONS
Food Preparation & Serving
San Luis
Compare Zip Codes
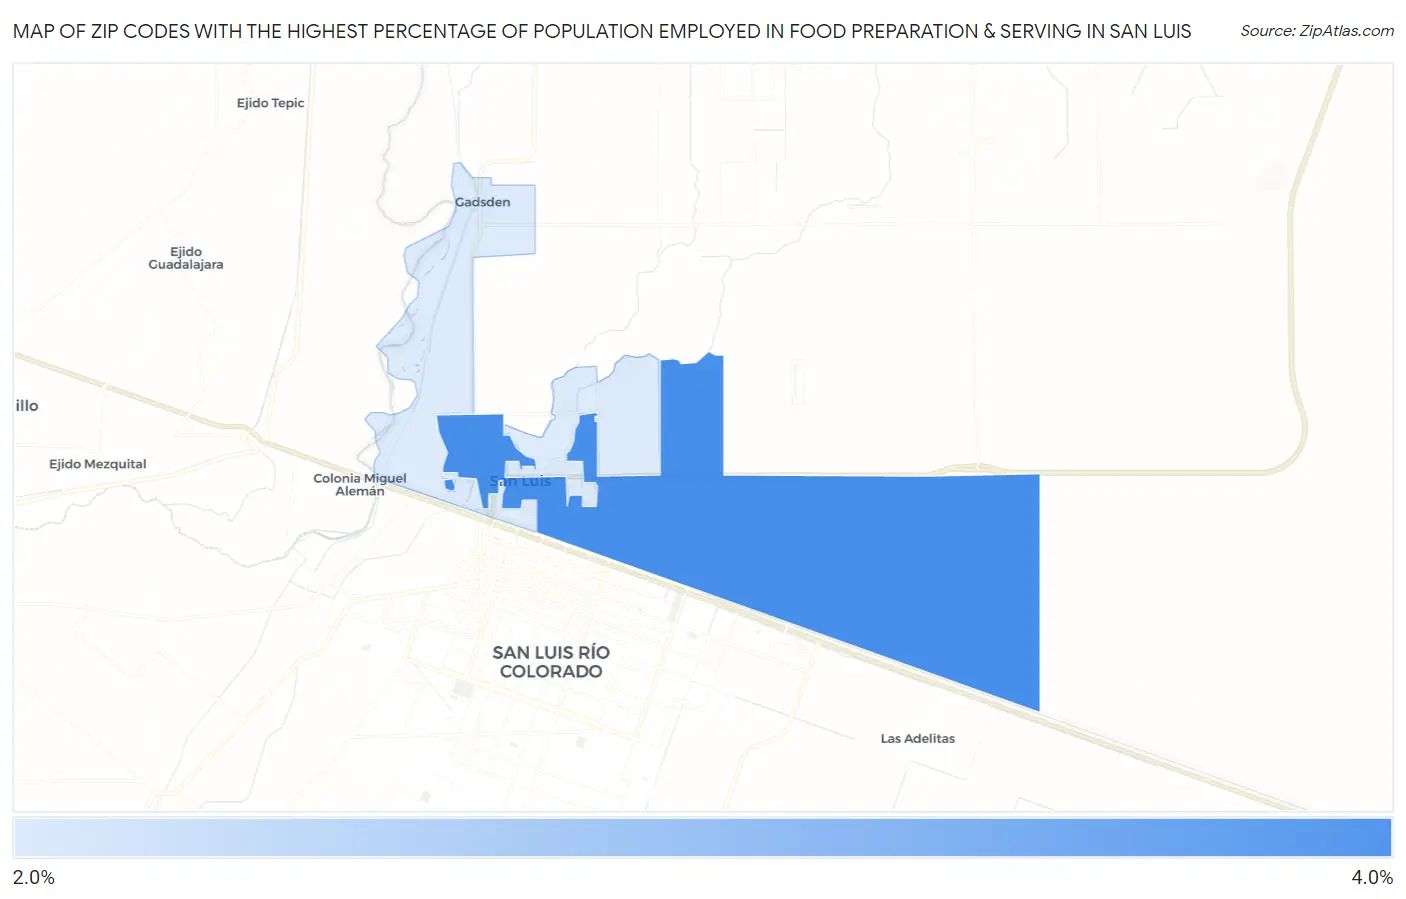
Map of Zip Codes with the Highest Percentage of Population Employed in Food Preparation & Serving in San Luis
2.9%
3.7%
Zip Codes with the Highest Percentage of Population Employed in Food Preparation & Serving in San Luis, AZ
| Zip Code | % Employed | vs State | vs National | |
| 1. | 85349 | 3.7% | 5.7%(-1.92)#256 | 5.3%(-1.54)#18,147 |
| 2. | 85336 | 2.9% | 5.7%(-2.81)#303 | 5.3%(-2.43)#21,840 |
1
Common Questions
What are the Top Zip Codes with the Highest Percentage of Population Employed in Food Preparation & Serving in San Luis, AZ?
Top Zip Codes with the Highest Percentage of Population Employed in Food Preparation & Serving in San Luis, AZ are:
What zip code has the Highest Percentage of Population Employed in Food Preparation & Serving in San Luis, AZ?
85349 has the Highest Percentage of Population Employed in Food Preparation & Serving in San Luis, AZ with 3.7%.
What is the Percentage of Population Employed in Food Preparation & Serving in San Luis, AZ?
Percentage of Population Employed in Food Preparation & Serving in San Luis is 3.6%.
What is the Percentage of Population Employed in Food Preparation & Serving in Arizona?
Percentage of Population Employed in Food Preparation & Serving in Arizona is 5.7%.
What is the Percentage of Population Employed in Food Preparation & Serving in the United States?
Percentage of Population Employed in Food Preparation & Serving in the United States is 5.3%.