Sehili, AZ Map & Demographics
Sehili Map
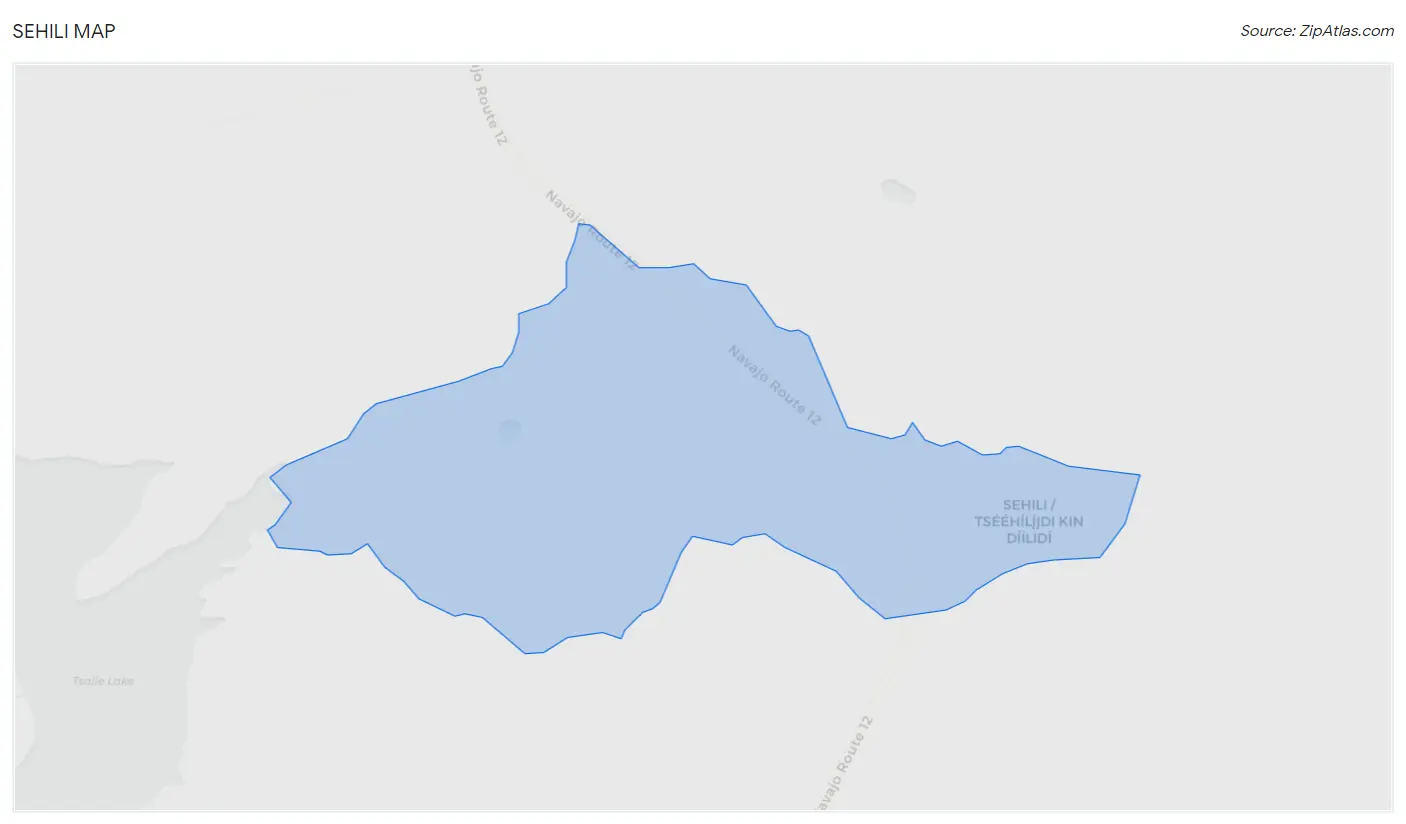
Sehili Overview
$3,814
PER CAPITA INCOME
$15,750
AVG HOUSEHOLD INCOME
$20,647
FAMILY INCOME DEFICIT
0.38
INEQUALITY / GINI INDEX
156
TOTAL POPULATION
80
MALE POPULATION
76
FEMALE POPULATION
105.26
MALES / 100 FEMALES
95.00
FEMALES / 100 MALES
30.4
MEDIAN AGE
7.6
AVG FAMILY SIZE
4.0
AVG HOUSEHOLD SIZE
43
LABOR FORCE [ PEOPLE ]
33.6%
PERCENT IN LABOR FORCE
41.9%
UNEMPLOYMENT RATE
Income in Sehili
Income Overview in Sehili
| Characteristic | Number | Measure |
| Per Capita Income | 156 | $3,814 |
| Median Family Income | 17 | $0 |
| Mean Family Income | 17 | $15,541 |
| Median Household Income | 39 | $15,750 |
| Mean Household Income | 39 | $13,500 |
| Income Deficit | 17 | $20,647 |
| Wage / Income Gap (%) | 156 | 0.00% |
| Wage / Income Gap ($) | 156 | 100.00¢ per $1 |
| Gini / Inequality Index | 156 | 0.38 |
Earnings by Sex in Sehili
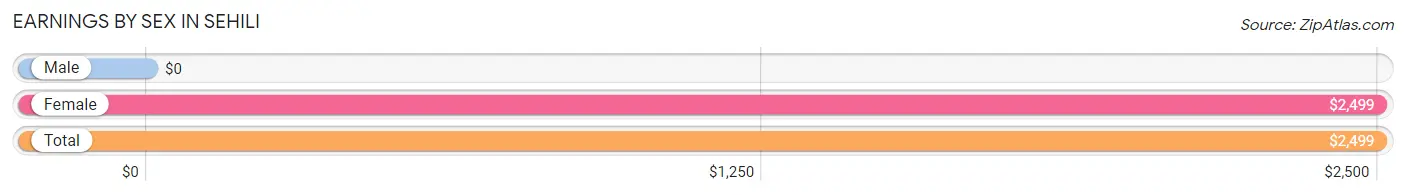
| Sex | Number | Average Earnings |
| Male | 0 (0.0%) | $0 |
| Female | 25 (100.0%) | $2,499 |
| Total | 25 (100.0%) | $2,499 |
Earnings by Sex by Income Bracket in Sehili
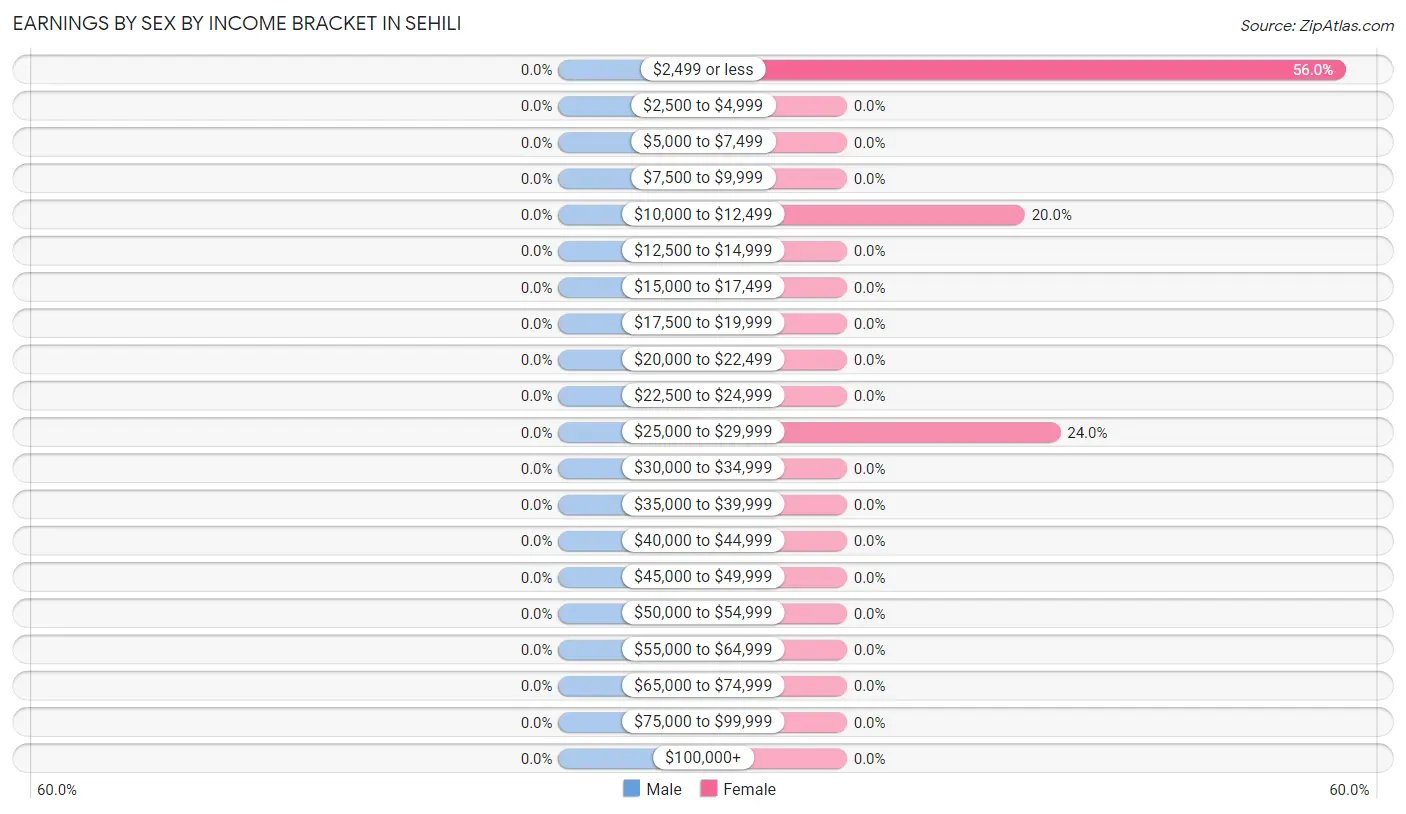
| Income | Male | Female |
| $2,499 or less | 0 (0.0%) | 14 (56.0%) |
| $2,500 to $4,999 | 0 (0.0%) | 0 (0.0%) |
| $5,000 to $7,499 | 0 (0.0%) | 0 (0.0%) |
| $7,500 to $9,999 | 0 (0.0%) | 0 (0.0%) |
| $10,000 to $12,499 | 0 (0.0%) | 5 (20.0%) |
| $12,500 to $14,999 | 0 (0.0%) | 0 (0.0%) |
| $15,000 to $17,499 | 0 (0.0%) | 0 (0.0%) |
| $17,500 to $19,999 | 0 (0.0%) | 0 (0.0%) |
| $20,000 to $22,499 | 0 (0.0%) | 0 (0.0%) |
| $22,500 to $24,999 | 0 (0.0%) | 0 (0.0%) |
| $25,000 to $29,999 | 0 (0.0%) | 6 (24.0%) |
| $30,000 to $34,999 | 0 (0.0%) | 0 (0.0%) |
| $35,000 to $39,999 | 0 (0.0%) | 0 (0.0%) |
| $40,000 to $44,999 | 0 (0.0%) | 0 (0.0%) |
| $45,000 to $49,999 | 0 (0.0%) | 0 (0.0%) |
| $50,000 to $54,999 | 0 (0.0%) | 0 (0.0%) |
| $55,000 to $64,999 | 0 (0.0%) | 0 (0.0%) |
| $65,000 to $74,999 | 0 (0.0%) | 0 (0.0%) |
| $75,000 to $99,999 | 0 (0.0%) | 0 (0.0%) |
| $100,000+ | 0 (0.0%) | 0 (0.0%) |
| Total | 0 (0.0%) | 25 (100.0%) |
Earnings by Sex by Educational Attainment in Sehili
| Educational Attainment | Male Income | Female Income |
| Less than High School | - | - |
| High School Diploma | - | - |
| College or Associate's Degree | - | - |
| Bachelor's Degree | - | - |
| Graduate Degree | - | - |
| Total | - | - |
Family Income in Sehili
Family Income Brackets in Sehili
According to the Sehili family income data, there are 6 families falling into the less than $10,000 income range, which is the most common income bracket and makes up 35.3% of all families.
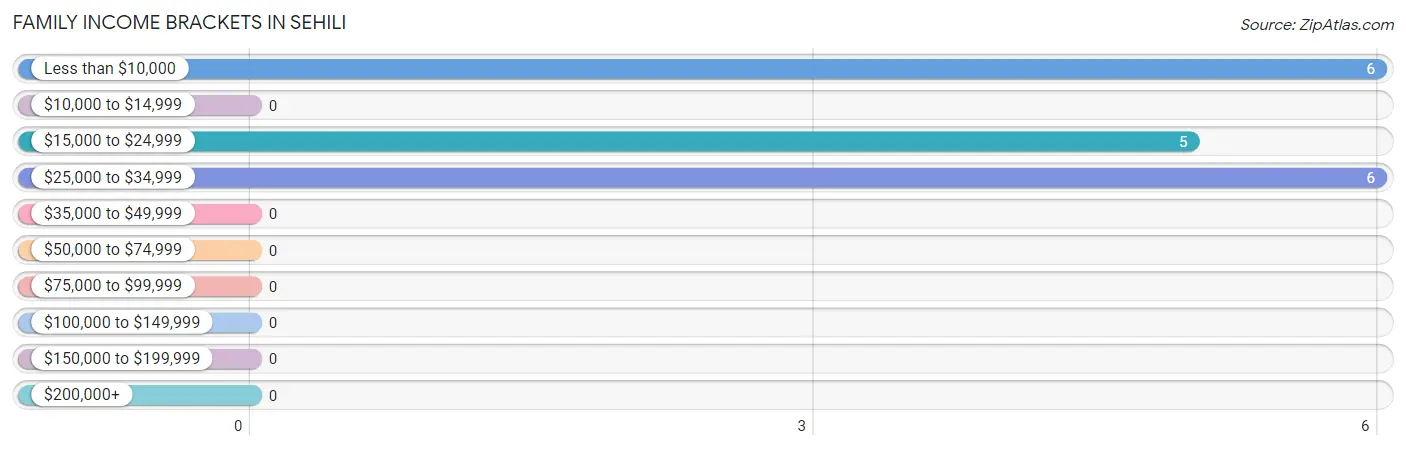
| Income Bracket | # Families | % Families |
| Less than $10,000 | 6 | 35.3% |
| $10,000 to $14,999 | 0 | 0.0% |
| $15,000 to $24,999 | 5 | 29.4% |
| $25,000 to $34,999 | 6 | 35.3% |
| $35,000 to $49,999 | 0 | 0.0% |
| $50,000 to $74,999 | 0 | 0.0% |
| $75,000 to $99,999 | 0 | 0.0% |
| $100,000 to $149,999 | 0 | 0.0% |
| $150,000 to $199,999 | 0 | 0.0% |
| $200,000+ | 0 | 0.0% |
Family Income by Famaliy Size in Sehili
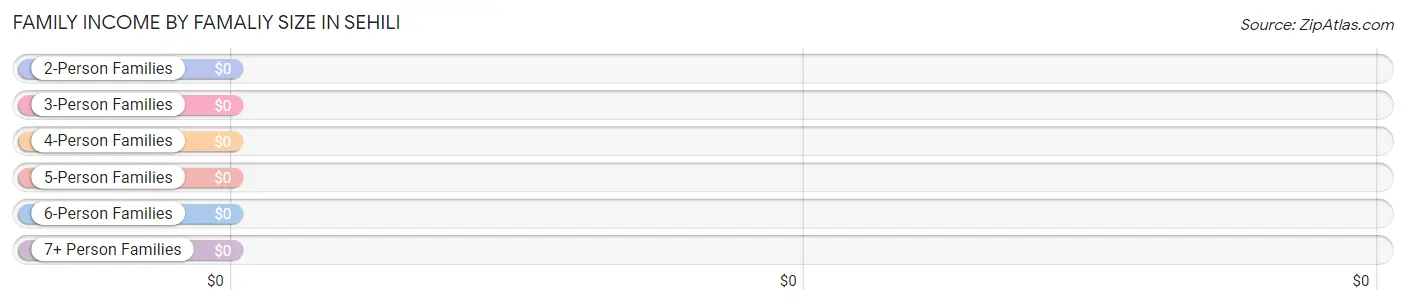
| Income Bracket | # Families | Median Income |
| 2-Person Families | 0 (0.0%) | $0 |
| 3-Person Families | 0 (0.0%) | $0 |
| 4-Person Families | 0 (0.0%) | $0 |
| 5-Person Families | 11 (64.7%) | $0 |
| 6-Person Families | 6 (35.3%) | $0 |
| 7+ Person Families | 0 (0.0%) | $0 |
| Total | 17 (100.0%) | $0 |
Family Income by Number of Earners in Sehili
| Number of Earners | # Families | Median Income |
| No Earners | 0 (0.0%) | $0 |
| 1 Earner | 17 (100.0%) | $0 |
| 2 Earners | 0 (0.0%) | $0 |
| 3+ Earners | 0 (0.0%) | $0 |
| Total | 17 (100.0%) | $0 |
Household Income in Sehili
Household Income Brackets in Sehili
With 15 households falling in the category, the $15,000 to $24,999 income range is the most frequent in Sehili, accounting for 38.5% of all households.
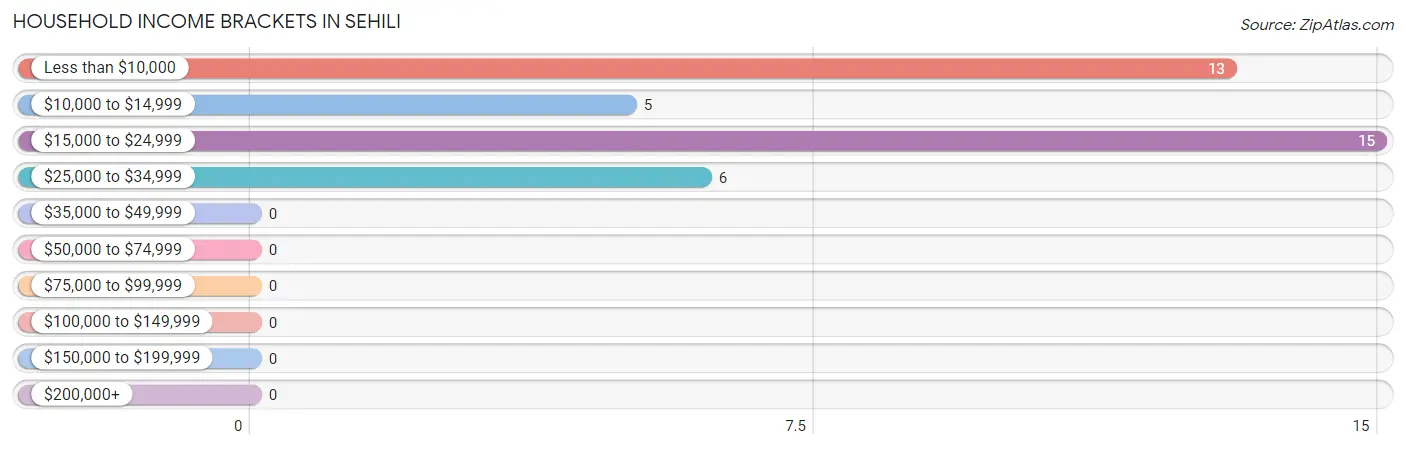
| Income Bracket | # Households | % Households |
| Less than $10,000 | 13 | 33.3% |
| $10,000 to $14,999 | 5 | 12.8% |
| $15,000 to $24,999 | 15 | 38.5% |
| $25,000 to $34,999 | 6 | 15.4% |
| $35,000 to $49,999 | 0 | 0.0% |
| $50,000 to $74,999 | 0 | 0.0% |
| $75,000 to $99,999 | 0 | 0.0% |
| $100,000 to $149,999 | 0 | 0.0% |
| $150,000 to $199,999 | 0 | 0.0% |
| $200,000+ | 0 | 0.0% |
Household Income by Householder Age in Sehili
The median household income in Sehili is $15,750, with the highest median household income of $21,250 found in the 45 to 64 years age bracket for the primary householder. A total of 22 households (56.4%) fall into this category. Meanwhile, the 15 to 24 years age bracket for the primary householder has the lowest median household income of $0, with 3 households (7.7%) in this group.
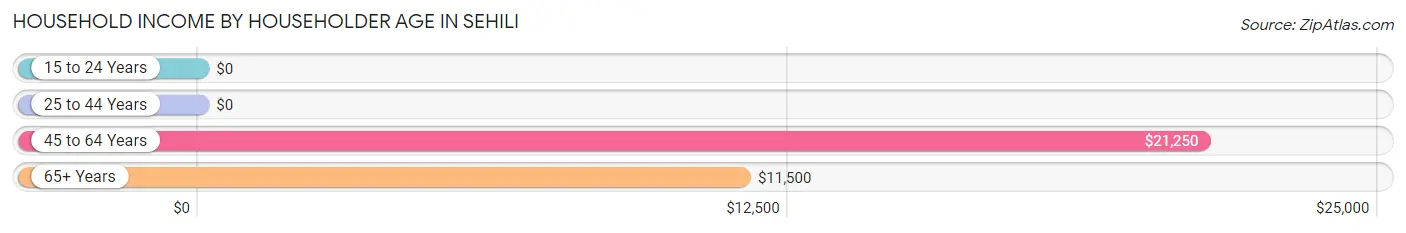
| Income Bracket | # Households | Median Income |
| 15 to 24 Years | 3 (7.7%) | $0 |
| 25 to 44 Years | 0 (0.0%) | $0 |
| 45 to 64 Years | 22 (56.4%) | $21,250 |
| 65+ Years | 14 (35.9%) | $11,500 |
| Total | 39 (100.0%) | $15,750 |
Poverty in Sehili
Income Below Poverty by Sex and Age in Sehili
With 100.0% poverty level for males and 93.4% for females among the residents of Sehili, 12 to 14 year old males and under 5 year old females are the most vulnerable to poverty, with 14 males (100.0%) and 8 females (100.0%) in their respective age groups living below the poverty level.
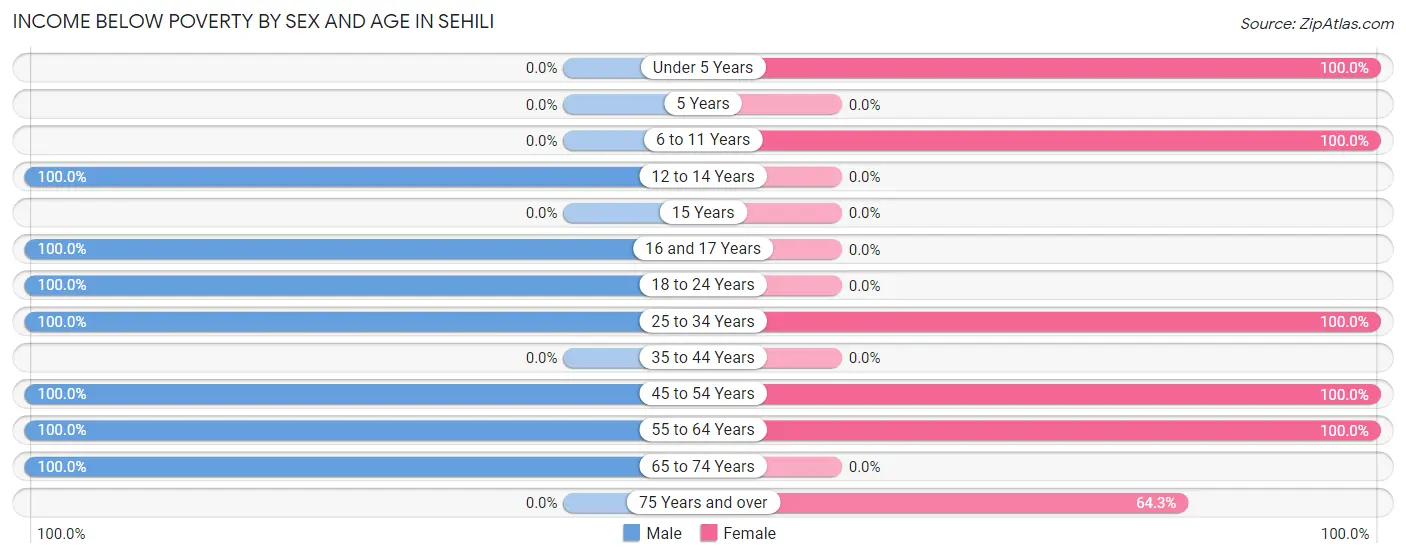
| Age Bracket | Male | Female |
| Under 5 Years | 0 (0.0%) | 8 (100.0%) |
| 5 Years | 0 (0.0%) | 0 (0.0%) |
| 6 to 11 Years | 0 (0.0%) | 6 (100.0%) |
| 12 to 14 Years | 14 (100.0%) | 0 (0.0%) |
| 15 Years | 0 (0.0%) | 0 (0.0%) |
| 16 and 17 Years | 3 (100.0%) | 0 (0.0%) |
| 18 to 24 Years | 8 (100.0%) | 0 (0.0%) |
| 25 to 34 Years | 33 (100.0%) | 26 (100.0%) |
| 35 to 44 Years | 0 (0.0%) | 0 (0.0%) |
| 45 to 54 Years | 6 (100.0%) | 10 (100.0%) |
| 55 to 64 Years | 11 (100.0%) | 12 (100.0%) |
| 65 to 74 Years | 5 (100.0%) | 0 (0.0%) |
| 75 Years and over | 0 (0.0%) | 9 (64.3%) |
| Total | 80 (100.0%) | 71 (93.4%) |
Income Above Poverty by Sex and Age in Sehili
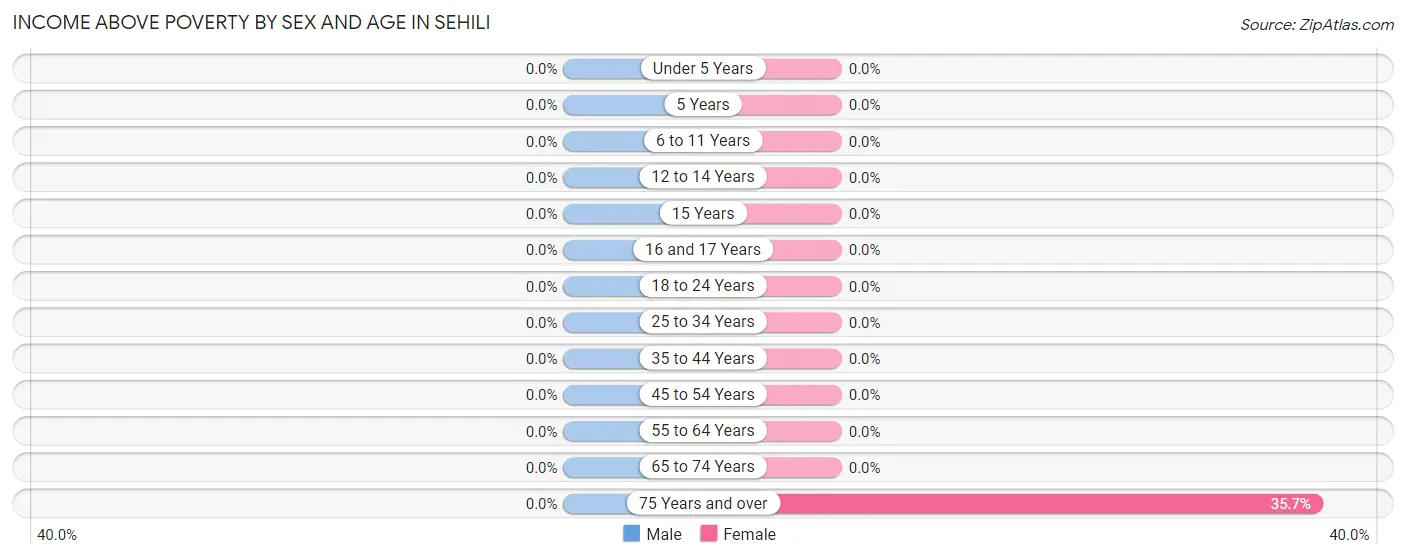
| Age Bracket | Male | Female |
| Under 5 Years | 0 (0.0%) | 0 (0.0%) |
| 5 Years | 0 (0.0%) | 0 (0.0%) |
| 6 to 11 Years | 0 (0.0%) | 0 (0.0%) |
| 12 to 14 Years | 0 (0.0%) | 0 (0.0%) |
| 15 Years | 0 (0.0%) | 0 (0.0%) |
| 16 and 17 Years | 0 (0.0%) | 0 (0.0%) |
| 18 to 24 Years | 0 (0.0%) | 0 (0.0%) |
| 25 to 34 Years | 0 (0.0%) | 0 (0.0%) |
| 35 to 44 Years | 0 (0.0%) | 0 (0.0%) |
| 45 to 54 Years | 0 (0.0%) | 0 (0.0%) |
| 55 to 64 Years | 0 (0.0%) | 0 (0.0%) |
| 65 to 74 Years | 0 (0.0%) | 0 (0.0%) |
| 75 Years and over | 0 (0.0%) | 5 (35.7%) |
| Total | 0 (0.0%) | 5 (6.6%) |
Income Below Poverty Among Married-Couple Families in Sehili
The poverty statistics for married-couple families in Sehili show that 100.0% or 17 of the total 17 families live below the poverty line. Families with 1 or 2 children have the highest poverty rate of 100.0%, comprising of 17 families. On the other hand, families with 1 or 2 children have the lowest poverty rate of 100.0%, which includes 17 families.
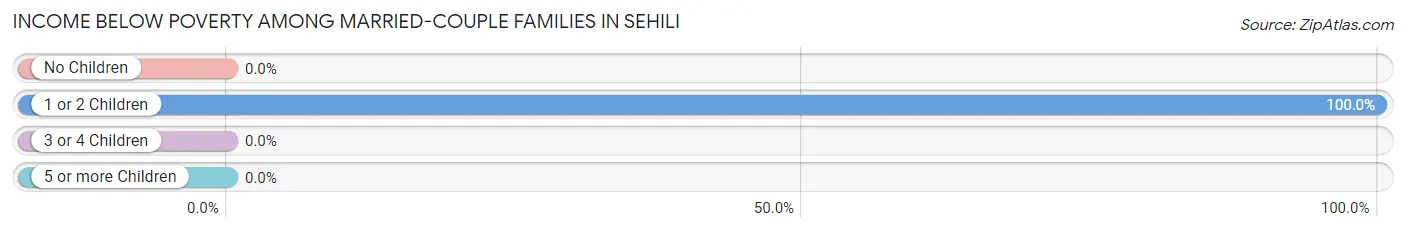
| Children | Above Poverty | Below Poverty |
| No Children | 0 (0.0%) | 0 (0.0%) |
| 1 or 2 Children | 0 (0.0%) | 17 (100.0%) |
| 3 or 4 Children | 0 (0.0%) | 0 (0.0%) |
| 5 or more Children | 0 (0.0%) | 0 (0.0%) |
| Total | 0 (0.0%) | 17 (100.0%) |
Income Below Poverty Among Single-Parent Households in Sehili
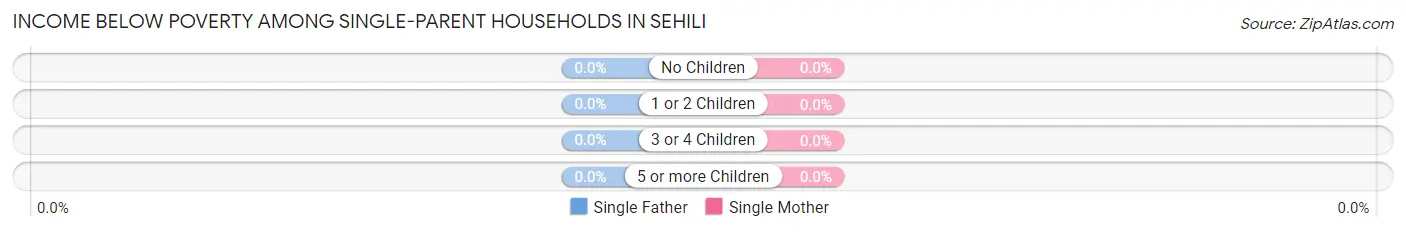
| Children | Single Father | Single Mother |
| No Children | 0 (0.0%) | 0 (0.0%) |
| 1 or 2 Children | 0 (0.0%) | 0 (0.0%) |
| 3 or 4 Children | 0 (0.0%) | 0 (0.0%) |
| 5 or more Children | 0 (0.0%) | 0 (0.0%) |
| Total | 0 (0.0%) | 0 (0.0%) |
Income Below Poverty Among Married-Couple vs Single-Parent Households in Sehili
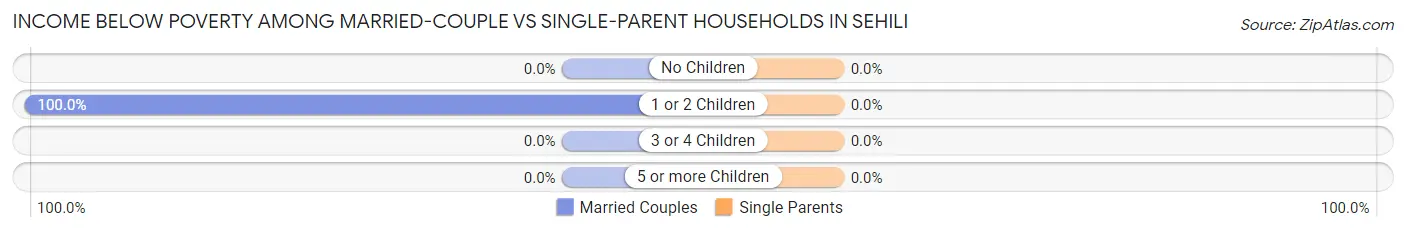
| Children | Married-Couple Families | Single-Parent Households |
| No Children | 0 (0.0%) | 0 (0.0%) |
| 1 or 2 Children | 17 (100.0%) | 0 (0.0%) |
| 3 or 4 Children | 0 (0.0%) | 0 (0.0%) |
| 5 or more Children | 0 (0.0%) | 0 (0.0%) |
| Total | 17 (100.0%) | 0 (0.0%) |
Race in Sehili
The most populous races in Sehili are , and Native / Alaskan (156 | 100.0%).
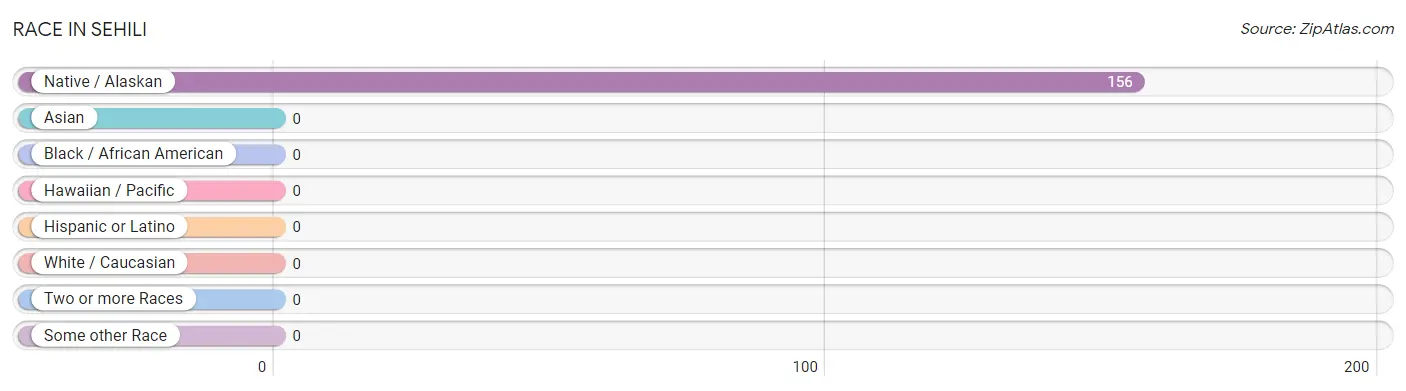
| Race | # Population | % Population |
| Asian | 0 | 0.0% |
| Black / African American | 0 | 0.0% |
| Hawaiian / Pacific | 0 | 0.0% |
| Hispanic or Latino | 0 | 0.0% |
| Native / Alaskan | 156 | 100.0% |
| White / Caucasian | 0 | 0.0% |
| Two or more Races | 0 | 0.0% |
| Some other Race | 0 | 0.0% |
| Total | 156 | 100.0% |
Ancestry in Sehili
The most populous ancestries reported in Sehili are , and Navajo (156 | 100.0%), together accounting for 100.0% of all Sehili residents.

| Ancestry | # Population | % Population |
| Navajo | 156 | 100.0% | View All 1 Rows |
Immigrants in Sehili

| Immigration Origin | # Population | % Population | View All 0 Rows |
Sex and Age in Sehili
Sex and Age in Sehili
The most populous age groups in Sehili are 25 to 29 Years (20 | 25.0%) for men and 25 to 29 Years (14 | 18.4%) for women.
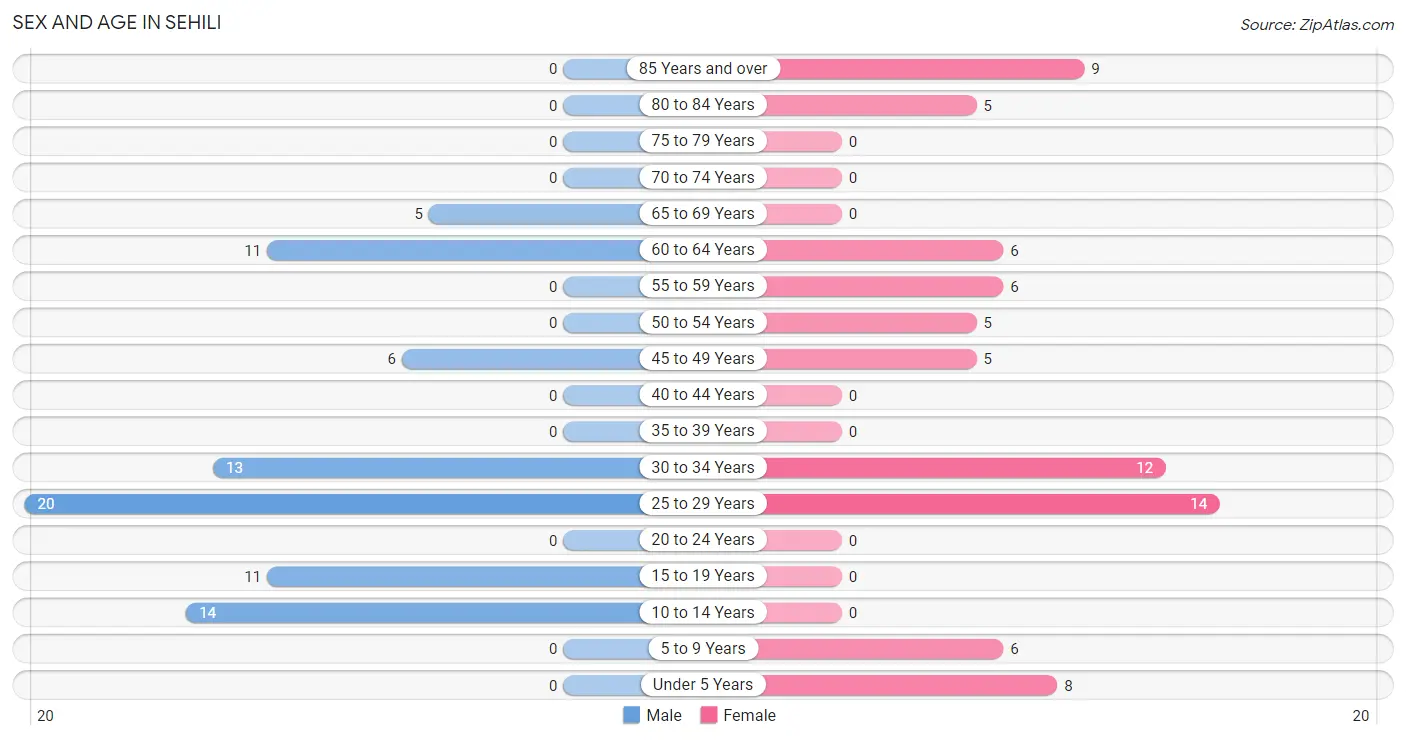
| Age Bracket | Male | Female |
| Under 5 Years | 0 (0.0%) | 8 (10.5%) |
| 5 to 9 Years | 0 (0.0%) | 6 (7.9%) |
| 10 to 14 Years | 14 (17.5%) | 0 (0.0%) |
| 15 to 19 Years | 11 (13.8%) | 0 (0.0%) |
| 20 to 24 Years | 0 (0.0%) | 0 (0.0%) |
| 25 to 29 Years | 20 (25.0%) | 14 (18.4%) |
| 30 to 34 Years | 13 (16.3%) | 12 (15.8%) |
| 35 to 39 Years | 0 (0.0%) | 0 (0.0%) |
| 40 to 44 Years | 0 (0.0%) | 0 (0.0%) |
| 45 to 49 Years | 6 (7.5%) | 5 (6.6%) |
| 50 to 54 Years | 0 (0.0%) | 5 (6.6%) |
| 55 to 59 Years | 0 (0.0%) | 6 (7.9%) |
| 60 to 64 Years | 11 (13.8%) | 6 (7.9%) |
| 65 to 69 Years | 5 (6.2%) | 0 (0.0%) |
| 70 to 74 Years | 0 (0.0%) | 0 (0.0%) |
| 75 to 79 Years | 0 (0.0%) | 0 (0.0%) |
| 80 to 84 Years | 0 (0.0%) | 5 (6.6%) |
| 85 Years and over | 0 (0.0%) | 9 (11.8%) |
| Total | 80 (100.0%) | 76 (100.0%) |
Families and Households in Sehili
Median Family Size in Sehili
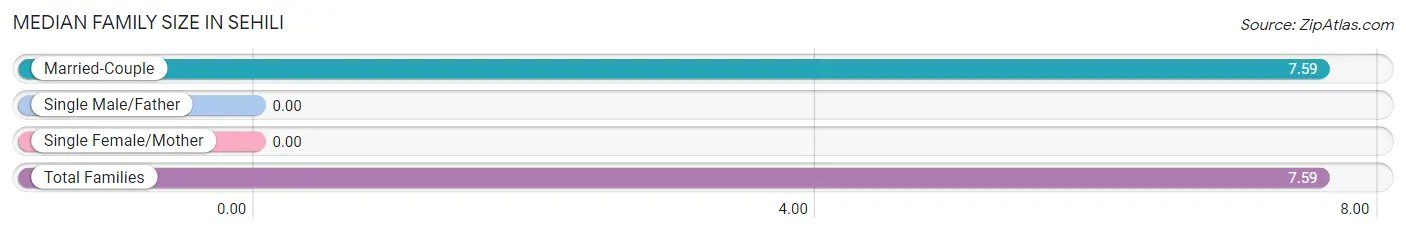
| Family Type | # Families | Family Size |
| Married-Couple | 17 (100.0%) | 7.59 |
| Single Male/Father | 0 (0.0%) | - |
| Single Female/Mother | 0 (0.0%) | - |
| Total Families | 17 (100.0%) | 7.59 |
Median Household Size in Sehili
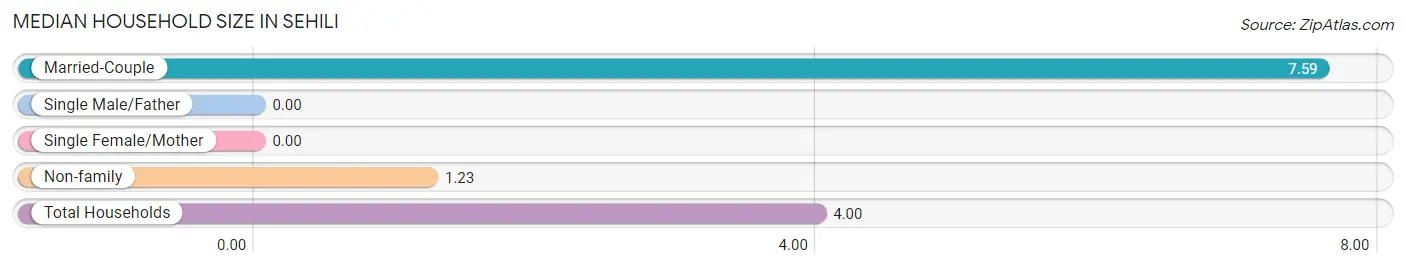
| Household Type | # Households | Household Size |
| Married-Couple | 17 (43.6%) | 7.59 |
| Single Male/Father | 0 (0.0%) | - |
| Single Female/Mother | 0 (0.0%) | - |
| Non-family | 22 (56.4%) | 1.23 |
| Total Households | 39 (100.0%) | 4.00 |
Household Size by Marriage Status in Sehili
Out of a total of 39 households in Sehili, 17 (43.6%) are family households, while 22 (56.4%) are nonfamily households. The most numerous type of family households are 5-person households, comprising 11, and the most common type of nonfamily households are 1-person households, comprising 17.
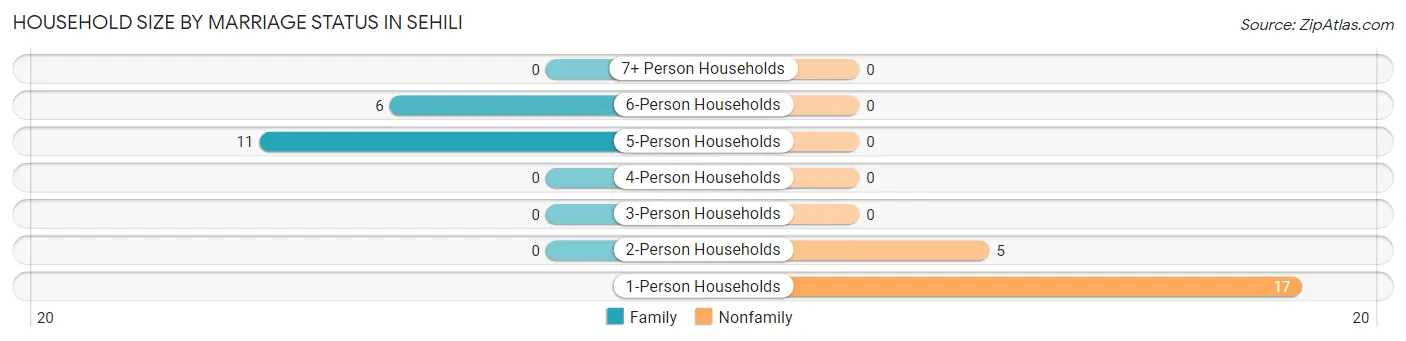
| Household Size | Family Households | Nonfamily Households |
| 1-Person Households | - | 17 (43.6%) |
| 2-Person Households | 0 (0.0%) | 5 (12.8%) |
| 3-Person Households | 0 (0.0%) | 0 (0.0%) |
| 4-Person Households | 0 (0.0%) | 0 (0.0%) |
| 5-Person Households | 11 (28.2%) | 0 (0.0%) |
| 6-Person Households | 6 (15.4%) | 0 (0.0%) |
| 7+ Person Households | 0 (0.0%) | 0 (0.0%) |
| Total | 17 (43.6%) | 22 (56.4%) |
Female Fertility in Sehili
Fertility by Age in Sehili
| Age Bracket | Women with Births | Births / 1,000 Women |
| 15 to 19 years | 0 (0.0%) | 0.0 |
| 20 to 34 years | 0 (0.0%) | 0.0 |
| 35 to 50 years | 0 (0.0%) | 0.0 |
| Total | 0 (0.0%) | 0.0 |
Fertility by Age by Marriage Status in Sehili
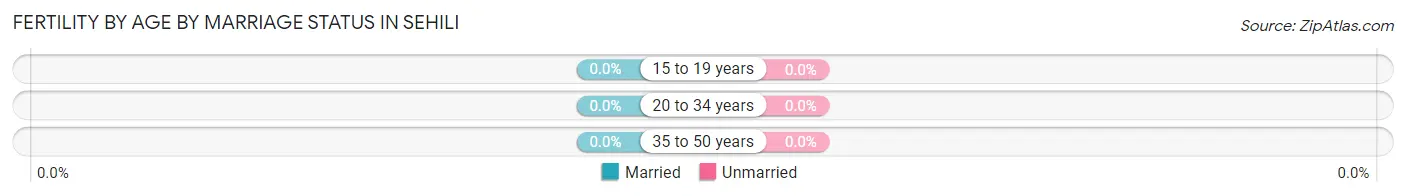
| Age Bracket | Married | Unmarried |
| 15 to 19 years | 0 (0.0%) | 0 (0.0%) |
| 20 to 34 years | 0 (0.0%) | 0 (0.0%) |
| 35 to 50 years | 0 (0.0%) | 0 (0.0%) |
| Total | 0 (0.0%) | 0 (0.0%) |
Fertility by Education in Sehili
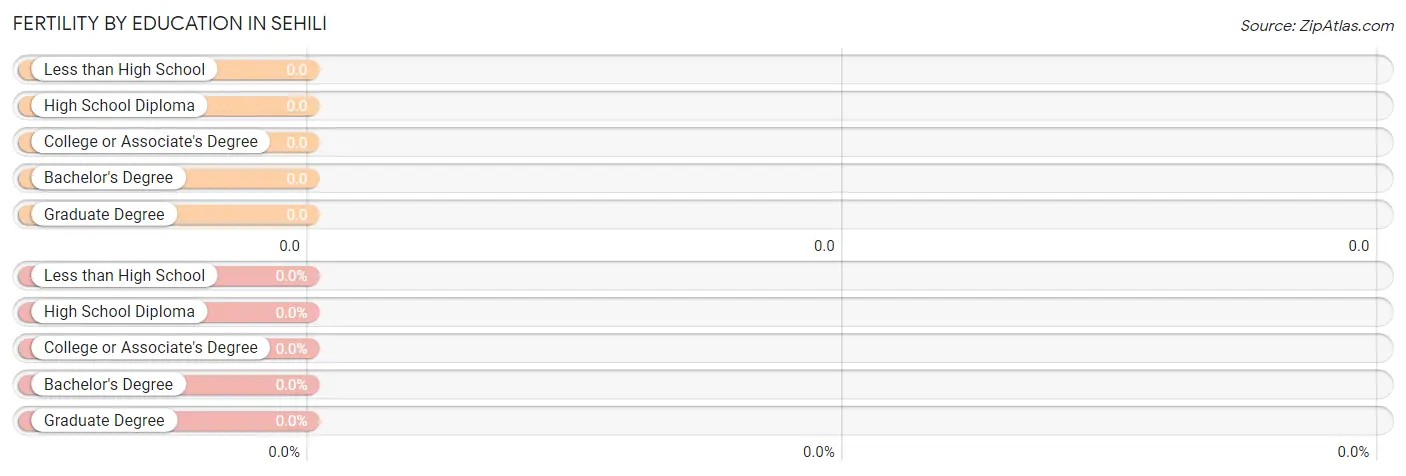
| Educational Attainment | Women with Births | Births / 1,000 Women |
| Less than High School | 0 (0.0%) | 0.0 |
| High School Diploma | 0 (0.0%) | 0.0 |
| College or Associate's Degree | 0 (0.0%) | 0.0 |
| Bachelor's Degree | 0 (0.0%) | 0.0 |
| Graduate Degree | 0 (0.0%) | 0.0 |
| Total | 0 (0.0%) | 0.0 |
Fertility by Education by Marriage Status in Sehili
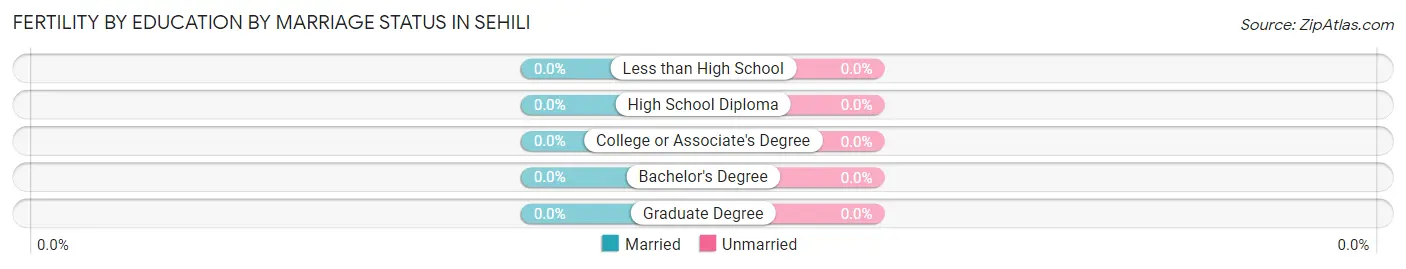
| Educational Attainment | Married | Unmarried |
| Less than High School | 0 (0.0%) | 0 (0.0%) |
| High School Diploma | 0 (0.0%) | 0 (0.0%) |
| College or Associate's Degree | 0 (0.0%) | 0 (0.0%) |
| Bachelor's Degree | 0 (0.0%) | 0 (0.0%) |
| Graduate Degree | 0 (0.0%) | 0 (0.0%) |
| Total | 0 (0.0%) | 0 (0.0%) |
Employment Characteristics in Sehili
Employment by Class of Employer in Sehili
Among the 25 employed individuals in Sehili, federal government employees (14 | 56.0%), state government employees (6 | 24.0%), and private company employees (5 | 20.0%) make up the most common classes of employment.
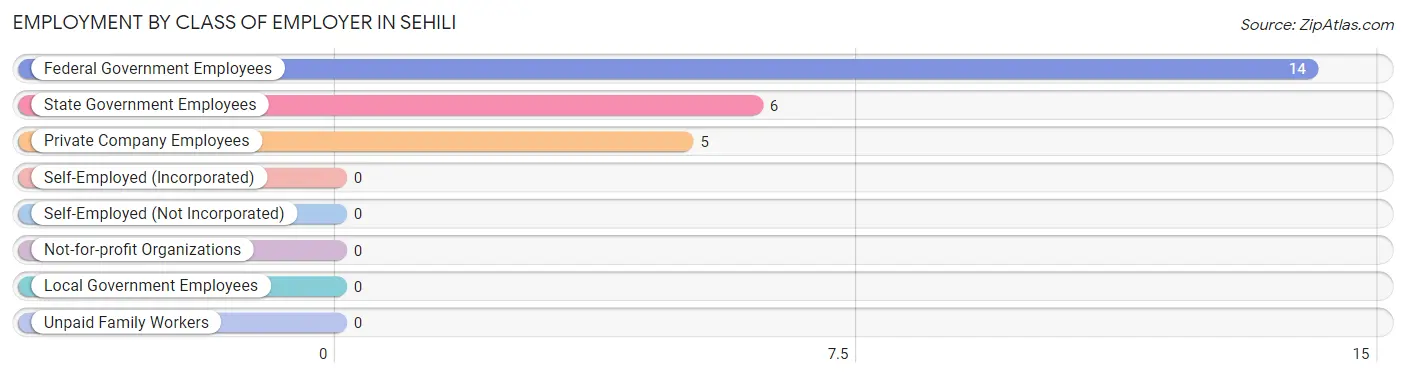
| Employer Class | # Employees | % Employees |
| Private Company Employees | 5 | 20.0% |
| Self-Employed (Incorporated) | 0 | 0.0% |
| Self-Employed (Not Incorporated) | 0 | 0.0% |
| Not-for-profit Organizations | 0 | 0.0% |
| Local Government Employees | 0 | 0.0% |
| State Government Employees | 6 | 24.0% |
| Federal Government Employees | 14 | 56.0% |
| Unpaid Family Workers | 0 | 0.0% |
| Total | 25 | 100.0% |
Employment Status by Age in Sehili
According to the labor force statistics for Sehili, out of the total population over 16 years of age (128), 33.6% or 43 individuals are in the labor force, with 41.9% or 18 of them unemployed. The age group with the highest labor force participation rate is 55 to 59 years, with 100.0% or 6 individuals in the labor force. Within the labor force, the 16 to 19 years age range has the highest percentage of unemployed individuals, with 100.0% or 3 of them being unemployed.
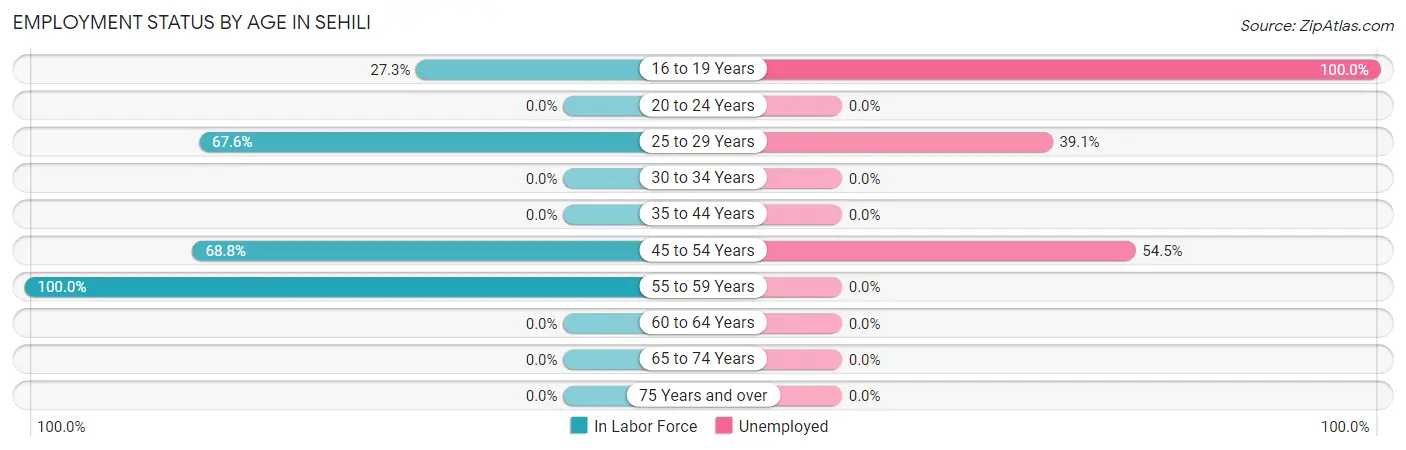
| Age Bracket | In Labor Force | Unemployed |
| 16 to 19 Years | 3 (27.3%) | 3 (100.0%) |
| 20 to 24 Years | 0 (0.0%) | 0 (0.0%) |
| 25 to 29 Years | 23 (67.6%) | 9 (39.1%) |
| 30 to 34 Years | 0 (0.0%) | 0 (0.0%) |
| 35 to 44 Years | 0 (0.0%) | 0 (0.0%) |
| 45 to 54 Years | 11 (68.8%) | 6 (54.5%) |
| 55 to 59 Years | 6 (100.0%) | 0 (0.0%) |
| 60 to 64 Years | 0 (0.0%) | 0 (0.0%) |
| 65 to 74 Years | 0 (0.0%) | 0 (0.0%) |
| 75 Years and over | 0 (0.0%) | 0 (0.0%) |
| Total | 43 (33.6%) | 18 (41.9%) |
Employment Status by Educational Attainment in Sehili
According to labor force statistics for Sehili, 40.8% of individuals (40) out of the total population between 25 and 64 years of age (98) are in the labor force, with 37.5% or 15 of them being unemployed. The group with the highest labor force participation rate are those with the educational attainment of college / associate degree, with 53.8% or 14 individuals in the labor force. Within the labor force, individuals with high school diploma education have the highest percentage of unemployment, with 57.7% or 15 of them being unemployed.
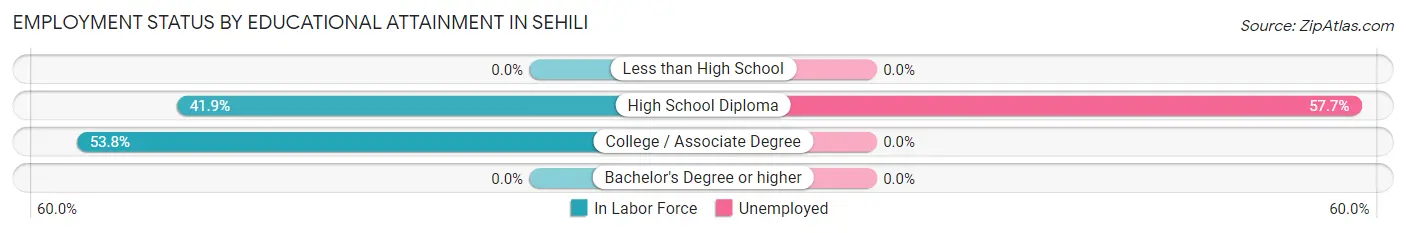
| Educational Attainment | In Labor Force | Unemployed |
| Less than High School | 0 (0.0%) | 0 (0.0%) |
| High School Diploma | 26 (41.9%) | 36 (57.7%) |
| College / Associate Degree | 14 (53.8%) | 0 (0.0%) |
| Bachelor's Degree or higher | 0 (0.0%) | 0 (0.0%) |
| Total | 40 (40.8%) | 37 (37.5%) |
Employment Occupations by Sex in Sehili
Management, Business, Science and Arts Occupations
Management, Business, Science and Arts Occupations by Sex
| Occupation | Male | Female |
| Management | 0 (0.0%) | 0 (0.0%) |
| Business & Financial | 0 (0.0%) | 0 (0.0%) |
| Computers, Engineering & Science | 0 (0.0%) | 0 (0.0%) |
| Computers & Mathematics | 0 (0.0%) | 0 (0.0%) |
| Architecture & Engineering | 0 (0.0%) | 0 (0.0%) |
| Life, Physical & Social Science | 0 (0.0%) | 0 (0.0%) |
| Community & Social Service | 0 (0.0%) | 0 (0.0%) |
| Education, Arts & Media | 0 (0.0%) | 0 (0.0%) |
| Legal Services & Support | 0 (0.0%) | 0 (0.0%) |
| Education Instruction & Library | 0 (0.0%) | 0 (0.0%) |
| Arts, Media & Entertainment | 0 (0.0%) | 0 (0.0%) |
| Health Diagnosing & Treating | 0 (0.0%) | 0 (0.0%) |
| Health Technologists | 0 (0.0%) | 0 (0.0%) |
| Total (Category) | 0 (0.0%) | 0 (0.0%) |
| Total (Overall) | 0 (0.0%) | 25 (100.0%) |
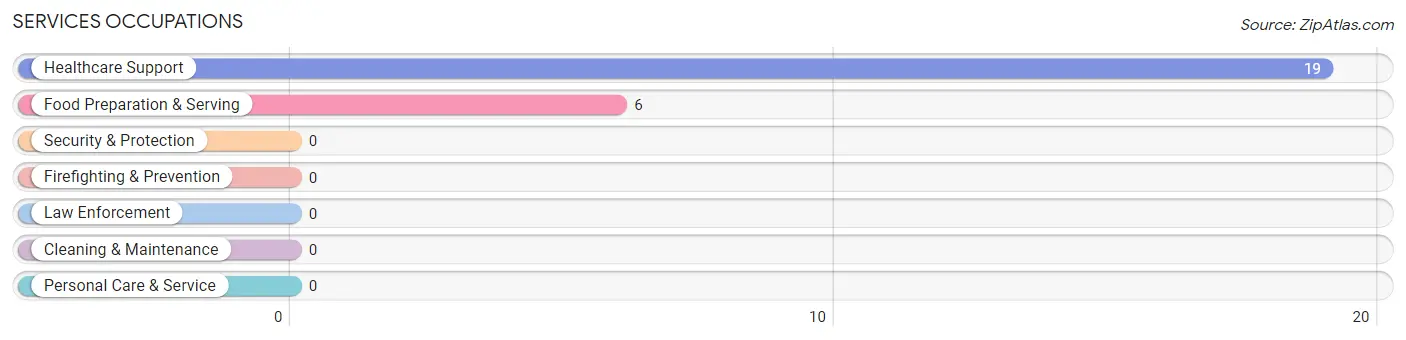
Services Occupations
The most common Services occupations in Sehili are Healthcare Support (19 | 76.0%), and Food Preparation & Serving (6 | 24.0%).
Services Occupations by Sex
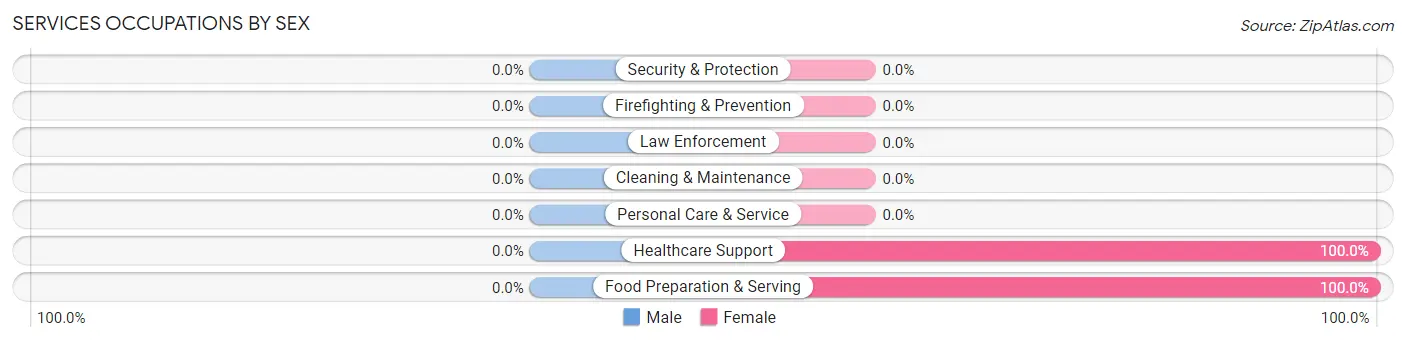
| Occupation | Male | Female |
| Healthcare Support | 0 (0.0%) | 19 (100.0%) |
| Security & Protection | 0 (0.0%) | 0 (0.0%) |
| Firefighting & Prevention | 0 (0.0%) | 0 (0.0%) |
| Law Enforcement | 0 (0.0%) | 0 (0.0%) |
| Food Preparation & Serving | 0 (0.0%) | 6 (100.0%) |
| Cleaning & Maintenance | 0 (0.0%) | 0 (0.0%) |
| Personal Care & Service | 0 (0.0%) | 0 (0.0%) |
| Total (Category) | 0 (0.0%) | 25 (100.0%) |
| Total (Overall) | 0 (0.0%) | 25 (100.0%) |
Sales and Office Occupations
Sales and Office Occupations by Sex
| Occupation | Male | Female |
| Sales & Related | 0 (0.0%) | 0 (0.0%) |
| Office & Administration | 0 (0.0%) | 0 (0.0%) |
| Total (Category) | 0 (0.0%) | 0 (0.0%) |
| Total (Overall) | 0 (0.0%) | 25 (100.0%) |
Natural Resources, Construction and Maintenance Occupations
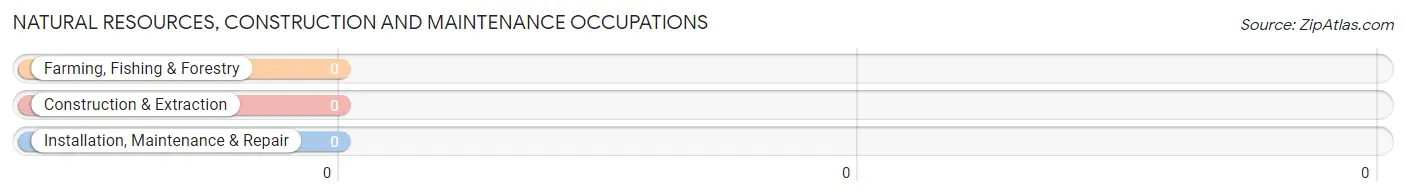
Natural Resources, Construction and Maintenance Occupations by Sex
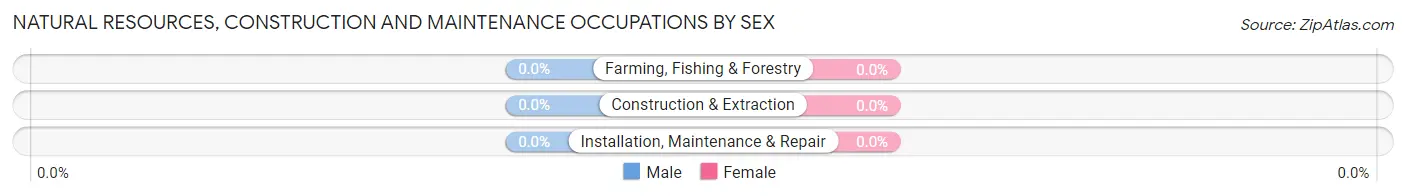
| Occupation | Male | Female |
| Farming, Fishing & Forestry | 0 (0.0%) | 0 (0.0%) |
| Construction & Extraction | 0 (0.0%) | 0 (0.0%) |
| Installation, Maintenance & Repair | 0 (0.0%) | 0 (0.0%) |
| Total (Category) | 0 (0.0%) | 0 (0.0%) |
| Total (Overall) | 0 (0.0%) | 25 (100.0%) |
Production, Transportation and Moving Occupations
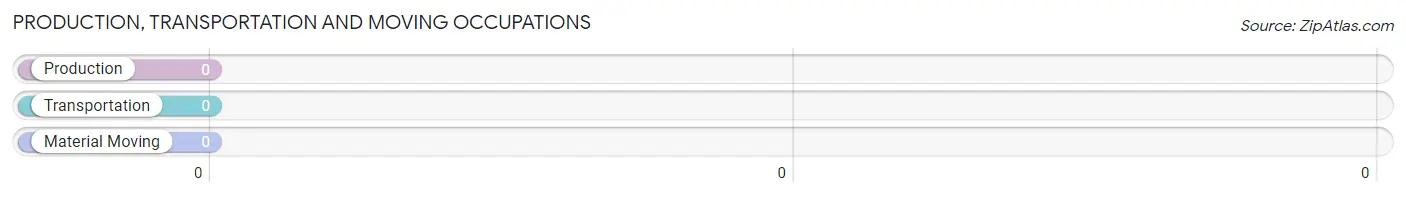
Production, Transportation and Moving Occupations by Sex
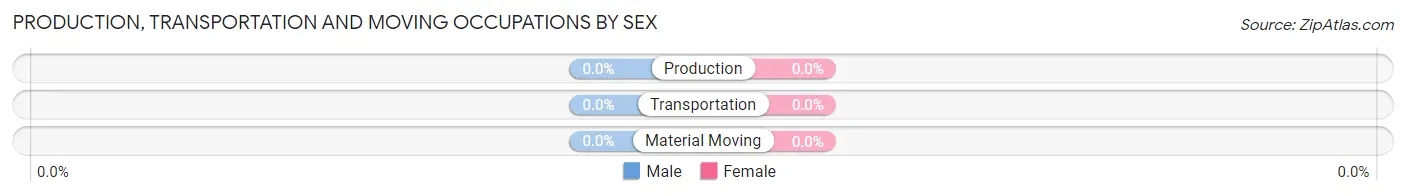
| Occupation | Male | Female |
| Production | 0 (0.0%) | 0 (0.0%) |
| Transportation | 0 (0.0%) | 0 (0.0%) |
| Material Moving | 0 (0.0%) | 0 (0.0%) |
| Total (Category) | 0 (0.0%) | 0 (0.0%) |
| Total (Overall) | 0 (0.0%) | 25 (100.0%) |
Employment Industries by Sex in Sehili
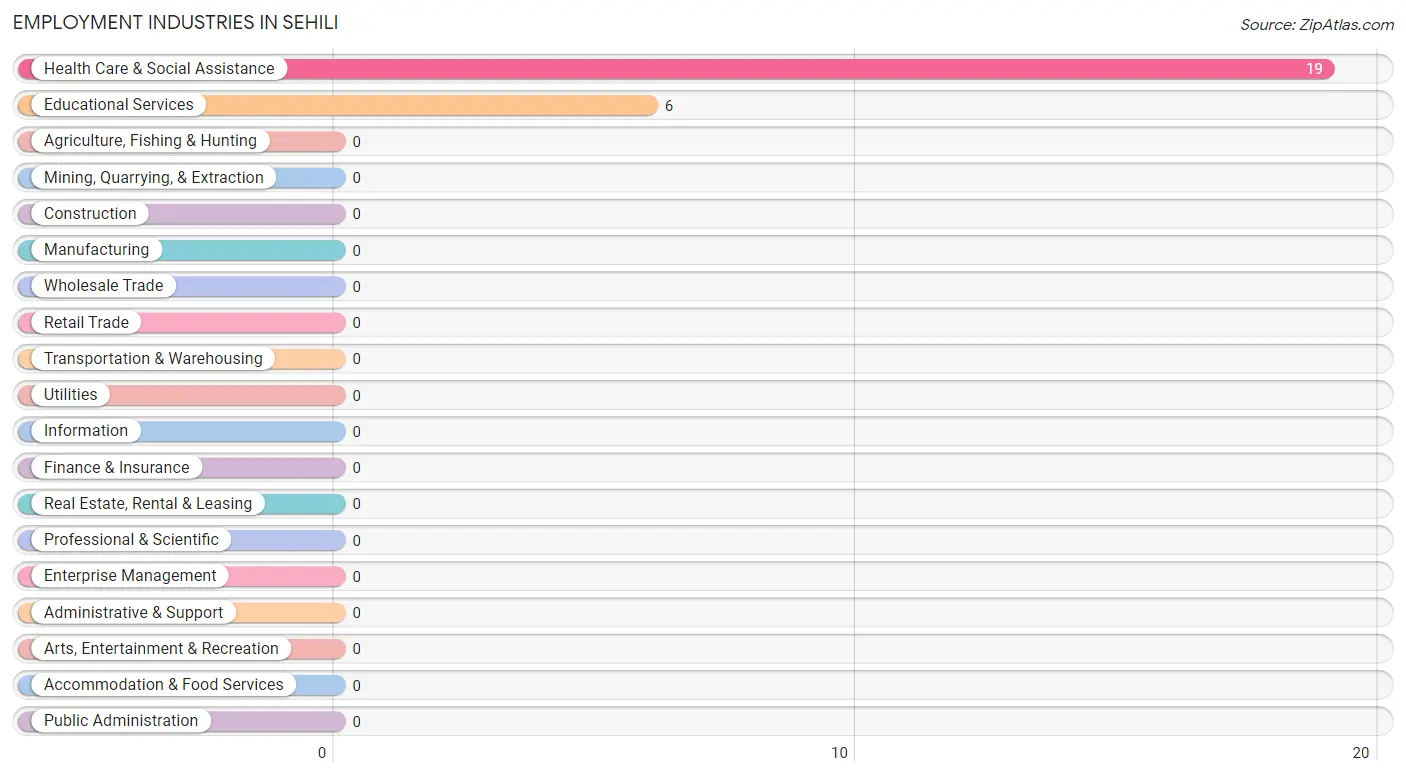
Employment Industries in Sehili
The major employment industries in Sehili include Health Care & Social Assistance (19 | 76.0%), and Educational Services (6 | 24.0%).
Employment Industries by Sex in Sehili
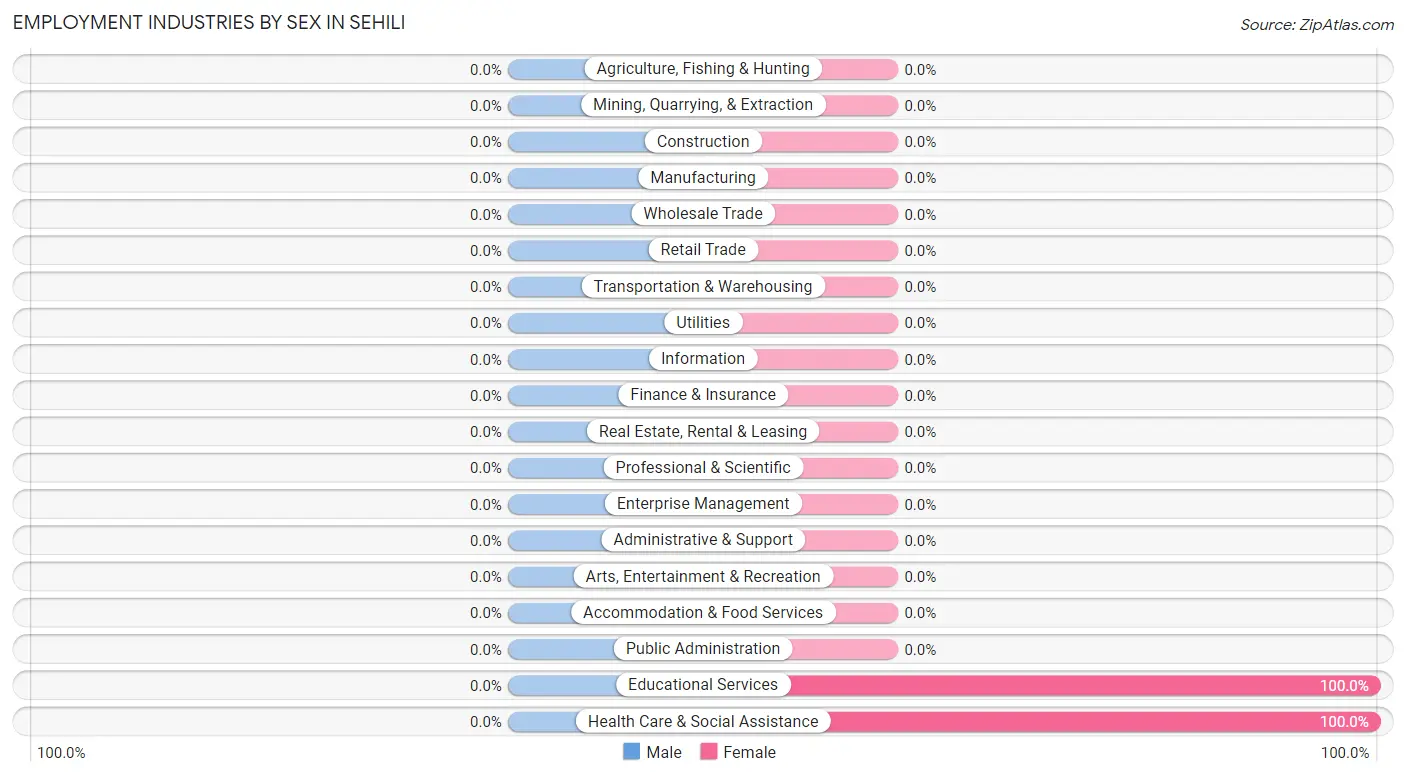
| Industry | Male | Female |
| Agriculture, Fishing & Hunting | 0 (0.0%) | 0 (0.0%) |
| Mining, Quarrying, & Extraction | 0 (0.0%) | 0 (0.0%) |
| Construction | 0 (0.0%) | 0 (0.0%) |
| Manufacturing | 0 (0.0%) | 0 (0.0%) |
| Wholesale Trade | 0 (0.0%) | 0 (0.0%) |
| Retail Trade | 0 (0.0%) | 0 (0.0%) |
| Transportation & Warehousing | 0 (0.0%) | 0 (0.0%) |
| Utilities | 0 (0.0%) | 0 (0.0%) |
| Information | 0 (0.0%) | 0 (0.0%) |
| Finance & Insurance | 0 (0.0%) | 0 (0.0%) |
| Real Estate, Rental & Leasing | 0 (0.0%) | 0 (0.0%) |
| Professional & Scientific | 0 (0.0%) | 0 (0.0%) |
| Enterprise Management | 0 (0.0%) | 0 (0.0%) |
| Administrative & Support | 0 (0.0%) | 0 (0.0%) |
| Educational Services | 0 (0.0%) | 6 (100.0%) |
| Health Care & Social Assistance | 0 (0.0%) | 19 (100.0%) |
| Arts, Entertainment & Recreation | 0 (0.0%) | 0 (0.0%) |
| Accommodation & Food Services | 0 (0.0%) | 0 (0.0%) |
| Public Administration | 0 (0.0%) | 0 (0.0%) |
| Total | 0 (0.0%) | 25 (100.0%) |
Education in Sehili
School Enrollment in Sehili
The most common levels of schooling among the 23 students in Sehili are middle school (14 | 60.9%), elementary school (6 | 26.1%), and high school (3 | 13.0%).
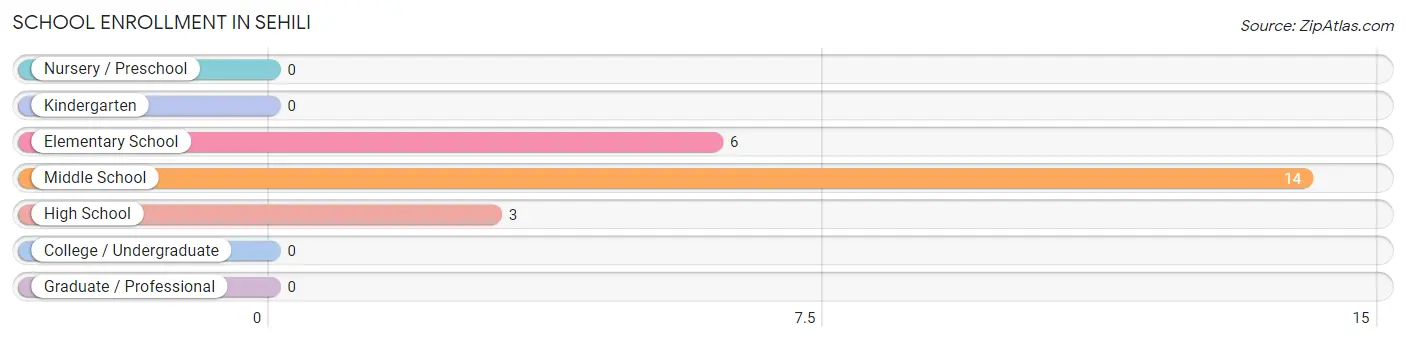
| School Level | # Students | % Students |
| Nursery / Preschool | 0 | 0.0% |
| Kindergarten | 0 | 0.0% |
| Elementary School | 6 | 26.1% |
| Middle School | 14 | 60.9% |
| High School | 3 | 13.0% |
| College / Undergraduate | 0 | 0.0% |
| Graduate / Professional | 0 | 0.0% |
| Total | 23 | 100.0% |
School Enrollment by Age by Funding Source in Sehili
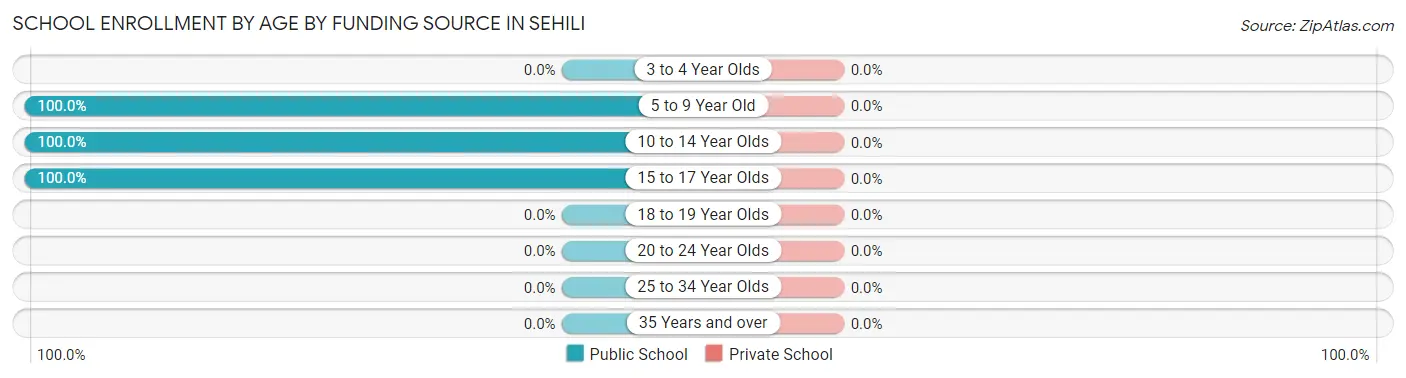
| Age Bracket | Public School | Private School |
| 3 to 4 Year Olds | 0 (0.0%) | 0 (0.0%) |
| 5 to 9 Year Old | 6 (100.0%) | 0 (0.0%) |
| 10 to 14 Year Olds | 14 (100.0%) | 0 (0.0%) |
| 15 to 17 Year Olds | 3 (100.0%) | 0 (0.0%) |
| 18 to 19 Year Olds | 0 (0.0%) | 0 (0.0%) |
| 20 to 24 Year Olds | 0 (0.0%) | 0 (0.0%) |
| 25 to 34 Year Olds | 0 (0.0%) | 0 (0.0%) |
| 35 Years and over | 0 (0.0%) | 0 (0.0%) |
| Total | 23 (100.0%) | 0 (0.0%) |
Educational Attainment by Field of Study in Sehili
| Field of Study | # Graduates | % Graduates |
| Computers & Mathematics | 0 | 0.0% |
| Bio, Nature & Agricultural | 0 | 0.0% |
| Physical & Health Sciences | 0 | 0.0% |
| Psychology | 0 | 0.0% |
| Social Sciences | 0 | 0.0% |
| Engineering | 0 | 0.0% |
| Multidisciplinary Studies | 0 | 0.0% |
| Science & Technology | 0 | 0.0% |
| Business | 0 | 0.0% |
| Education | 0 | 0.0% |
| Literature & Languages | 0 | 0.0% |
| Liberal Arts & History | 0 | 0.0% |
| Visual & Performing Arts | 0 | 0.0% |
| Communications | 0 | 0.0% |
| Arts & Humanities | 0 | 0.0% |
| Total | 0 | 0.0% |
Transportation & Commute in Sehili
Vehicle Availability by Sex in Sehili
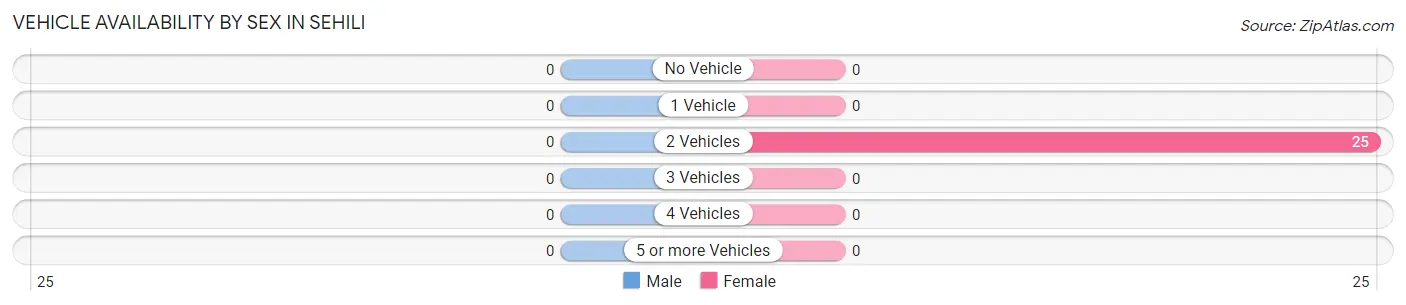
| Vehicles Available | Male | Female |
| No Vehicle | 0 (0.0%) | 0 (0.0%) |
| 1 Vehicle | 0 (0.0%) | 0 (0.0%) |
| 2 Vehicles | 0 (0.0%) | 25 (100.0%) |
| 3 Vehicles | 0 (0.0%) | 0 (0.0%) |
| 4 Vehicles | 0 (0.0%) | 0 (0.0%) |
| 5 or more Vehicles | 0 (0.0%) | 0 (0.0%) |
| Total | 0 (0.0%) | 25 (100.0%) |
Commute Time in Sehili
The most frequently occuring commute durations in Sehili are 15 to 19 minutes (14 commuters, 70.0%), 30 to 34 minutes (6 commuters, 30.0%), and less than 5 minutes (0 commuters, 0.0%).
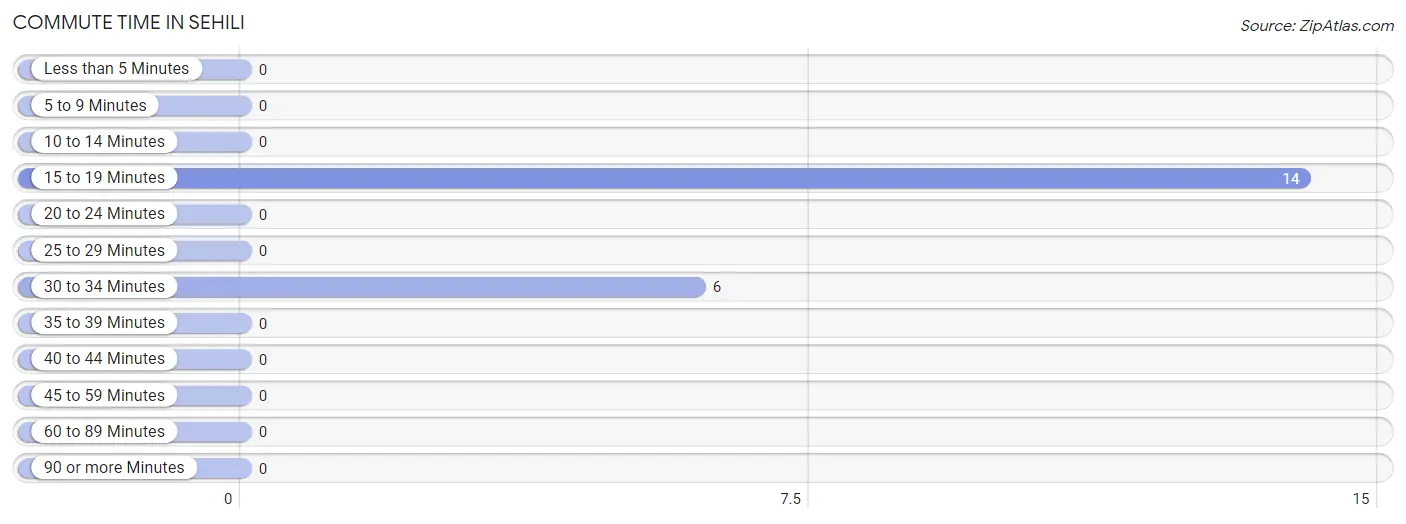
| Commute Time | # Commuters | % Commuters |
| Less than 5 Minutes | 0 | 0.0% |
| 5 to 9 Minutes | 0 | 0.0% |
| 10 to 14 Minutes | 0 | 0.0% |
| 15 to 19 Minutes | 14 | 70.0% |
| 20 to 24 Minutes | 0 | 0.0% |
| 25 to 29 Minutes | 0 | 0.0% |
| 30 to 34 Minutes | 6 | 30.0% |
| 35 to 39 Minutes | 0 | 0.0% |
| 40 to 44 Minutes | 0 | 0.0% |
| 45 to 59 Minutes | 0 | 0.0% |
| 60 to 89 Minutes | 0 | 0.0% |
| 90 or more Minutes | 0 | 0.0% |
Commute Time by Sex in Sehili
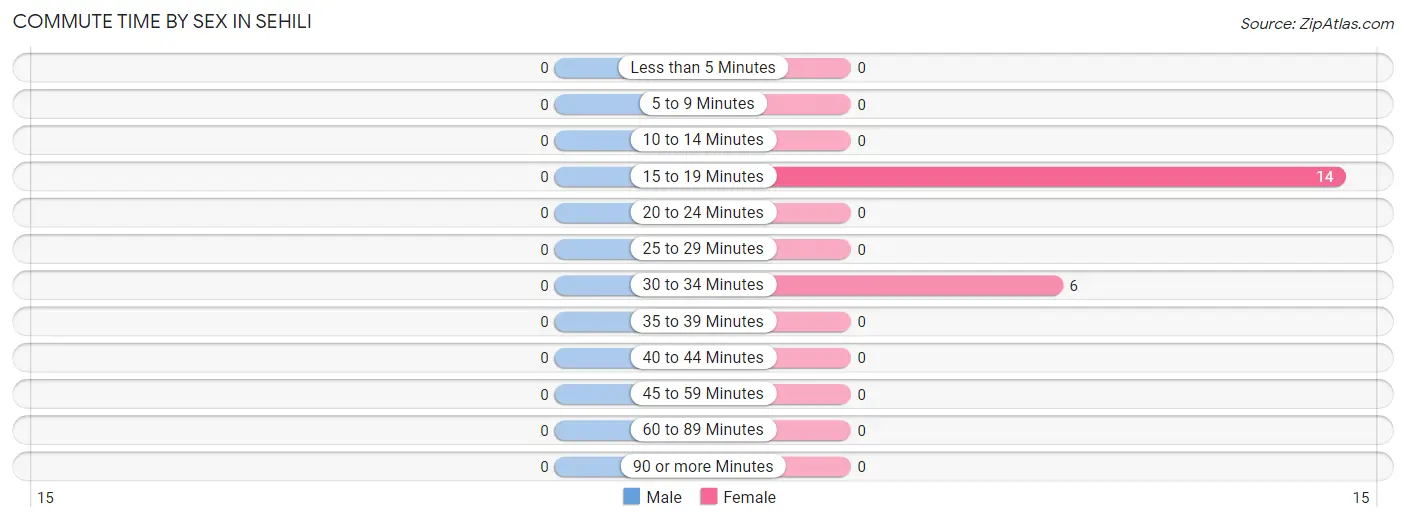
| Commute Time | Male | Female |
| Less than 5 Minutes | 0 (0.0%) | 0 (0.0%) |
| 5 to 9 Minutes | 0 (0.0%) | 0 (0.0%) |
| 10 to 14 Minutes | 0 (0.0%) | 0 (0.0%) |
| 15 to 19 Minutes | 0 (0.0%) | 14 (70.0%) |
| 20 to 24 Minutes | 0 (0.0%) | 0 (0.0%) |
| 25 to 29 Minutes | 0 (0.0%) | 0 (0.0%) |
| 30 to 34 Minutes | 0 (0.0%) | 6 (30.0%) |
| 35 to 39 Minutes | 0 (0.0%) | 0 (0.0%) |
| 40 to 44 Minutes | 0 (0.0%) | 0 (0.0%) |
| 45 to 59 Minutes | 0 (0.0%) | 0 (0.0%) |
| 60 to 89 Minutes | 0 (0.0%) | 0 (0.0%) |
| 90 or more Minutes | 0 (0.0%) | 0 (0.0%) |
Time of Departure to Work by Sex in Sehili
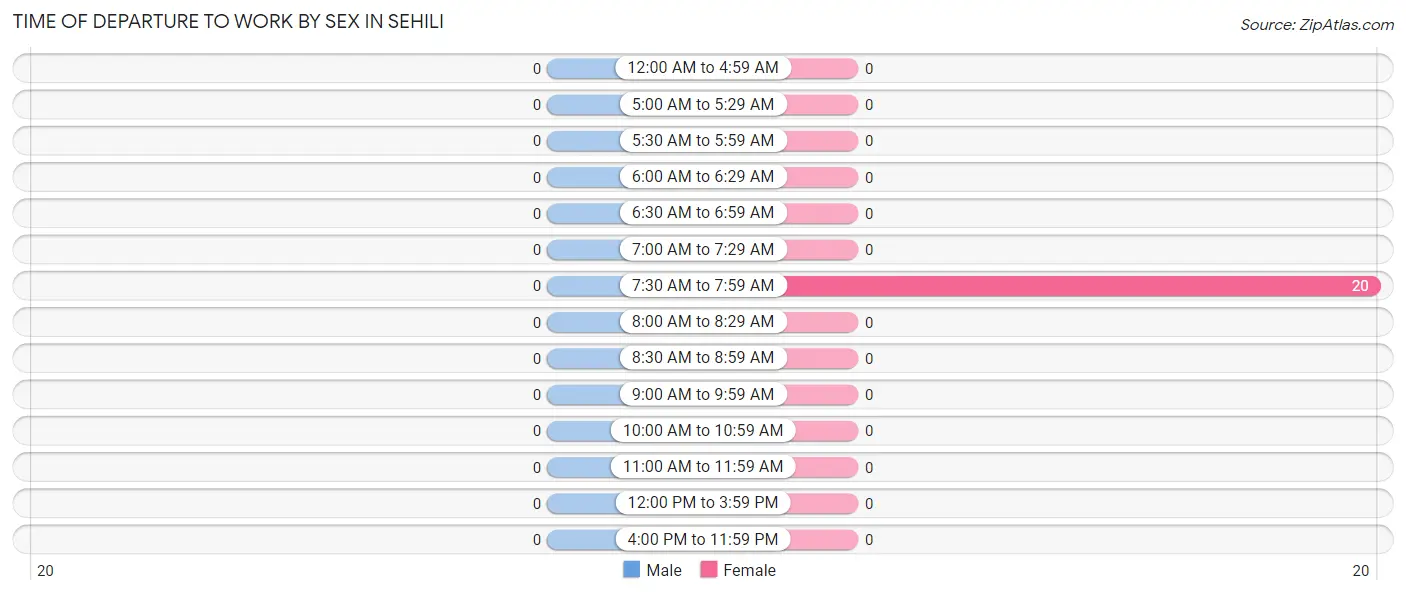
| Time of Departure | Male | Female |
| 12:00 AM to 4:59 AM | 0 (0.0%) | 0 (0.0%) |
| 5:00 AM to 5:29 AM | 0 (0.0%) | 0 (0.0%) |
| 5:30 AM to 5:59 AM | 0 (0.0%) | 0 (0.0%) |
| 6:00 AM to 6:29 AM | 0 (0.0%) | 0 (0.0%) |
| 6:30 AM to 6:59 AM | 0 (0.0%) | 0 (0.0%) |
| 7:00 AM to 7:29 AM | 0 (0.0%) | 0 (0.0%) |
| 7:30 AM to 7:59 AM | 0 (0.0%) | 20 (100.0%) |
| 8:00 AM to 8:29 AM | 0 (0.0%) | 0 (0.0%) |
| 8:30 AM to 8:59 AM | 0 (0.0%) | 0 (0.0%) |
| 9:00 AM to 9:59 AM | 0 (0.0%) | 0 (0.0%) |
| 10:00 AM to 10:59 AM | 0 (0.0%) | 0 (0.0%) |
| 11:00 AM to 11:59 AM | 0 (0.0%) | 0 (0.0%) |
| 12:00 PM to 3:59 PM | 0 (0.0%) | 0 (0.0%) |
| 4:00 PM to 11:59 PM | 0 (0.0%) | 0 (0.0%) |
| Total | 0 (0.0%) | 20 (100.0%) |
Housing Occupancy in Sehili
Occupancy by Ownership in Sehili
Of the total 39 dwellings in Sehili, owner-occupied units account for 39 (100.0%), while renter-occupied units make up 0 (0.0%).
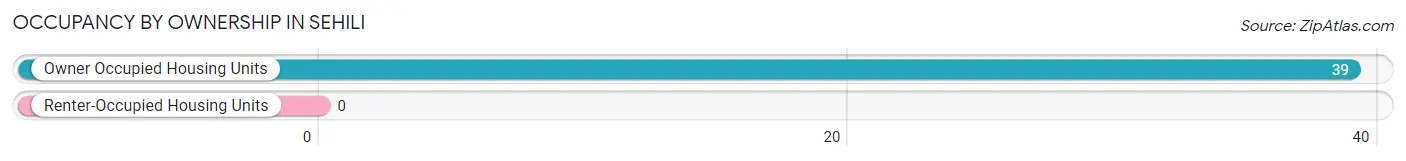
| Occupancy | # Housing Units | % Housing Units |
| Owner Occupied Housing Units | 39 | 100.0% |
| Renter-Occupied Housing Units | 0 | 0.0% |
| Total Occupied Housing Units | 39 | 100.0% |
Occupancy by Household Size in Sehili
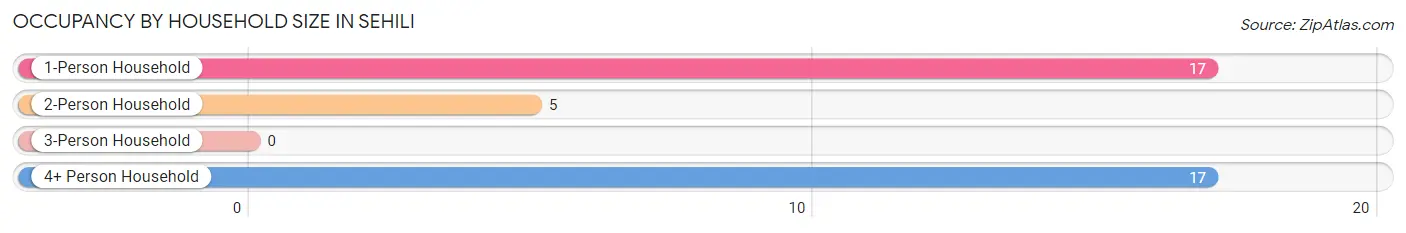
| Household Size | # Housing Units | % Housing Units |
| 1-Person Household | 17 | 43.6% |
| 2-Person Household | 5 | 12.8% |
| 3-Person Household | 0 | 0.0% |
| 4+ Person Household | 17 | 43.6% |
| Total Housing Units | 39 | 100.0% |
Occupancy by Ownership by Household Size in Sehili
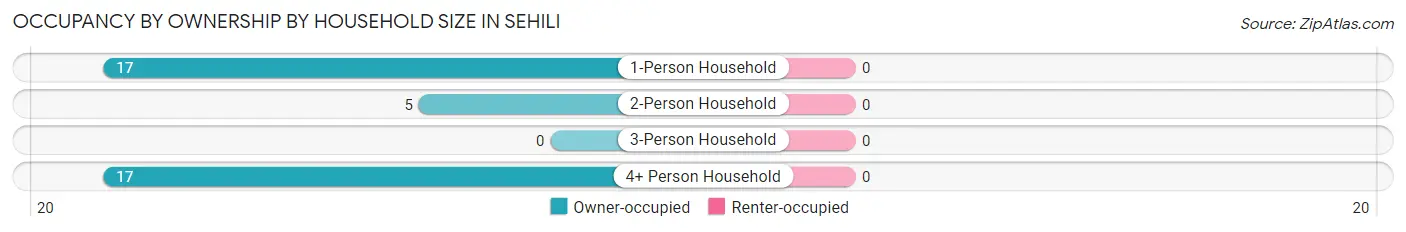
| Household Size | Owner-occupied | Renter-occupied |
| 1-Person Household | 17 (100.0%) | 0 (0.0%) |
| 2-Person Household | 5 (100.0%) | 0 (0.0%) |
| 3-Person Household | 0 (0.0%) | 0 (0.0%) |
| 4+ Person Household | 17 (100.0%) | 0 (0.0%) |
| Total Housing Units | 39 (100.0%) | 0 (0.0%) |
Occupancy by Educational Attainment in Sehili
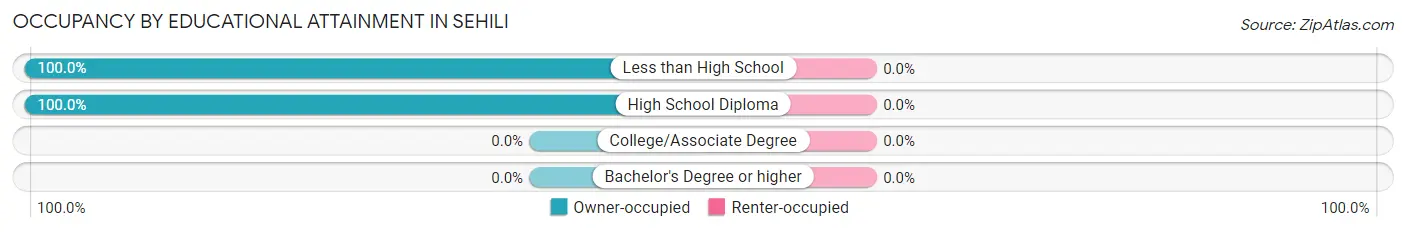
| Household Size | Owner-occupied | Renter-occupied |
| Less than High School | 19 (100.0%) | 0 (0.0%) |
| High School Diploma | 20 (100.0%) | 0 (0.0%) |
| College/Associate Degree | 0 (0.0%) | 0 (0.0%) |
| Bachelor's Degree or higher | 0 (0.0%) | 0 (0.0%) |
Occupancy by Age of Householder in Sehili
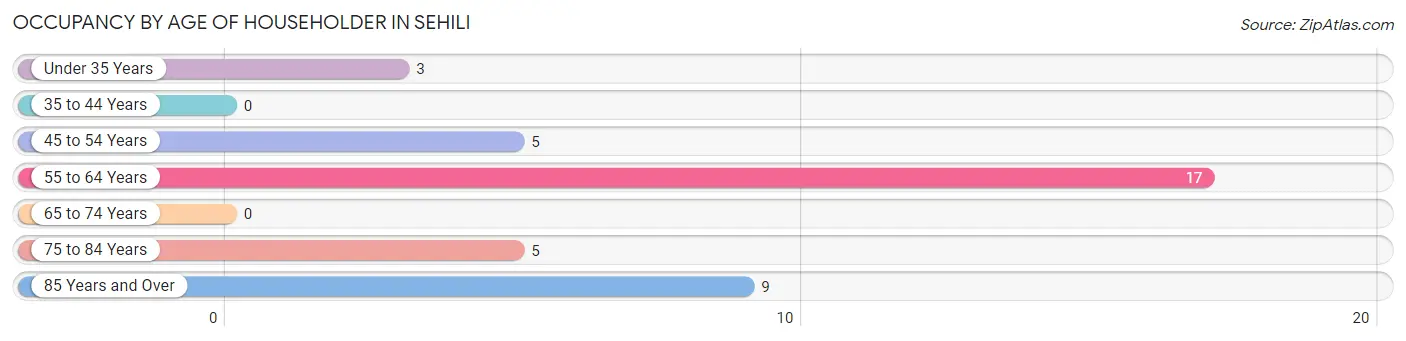
| Age Bracket | # Households | % Households |
| Under 35 Years | 3 | 7.7% |
| 35 to 44 Years | 0 | 0.0% |
| 45 to 54 Years | 5 | 12.8% |
| 55 to 64 Years | 17 | 43.6% |
| 65 to 74 Years | 0 | 0.0% |
| 75 to 84 Years | 5 | 12.8% |
| 85 Years and Over | 9 | 23.1% |
| Total | 39 | 100.0% |
Housing Finances in Sehili
Median Income by Occupancy in Sehili
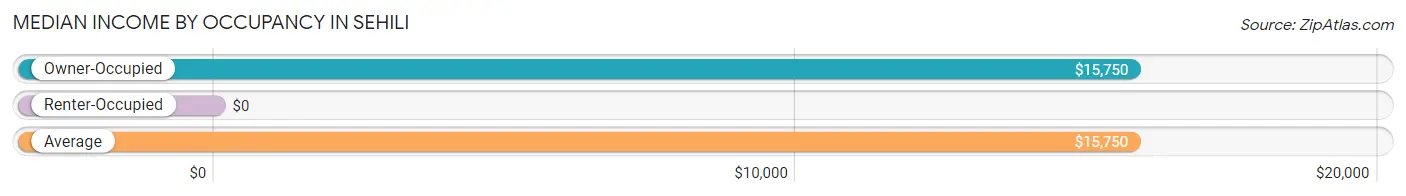
| Occupancy Type | # Households | Median Income |
| Owner-Occupied | 39 (100.0%) | $15,750 |
| Renter-Occupied | 0 (0.0%) | $0 |
| Average | 39 (100.0%) | $15,750 |
Occupancy by Householder Income Bracket in Sehili
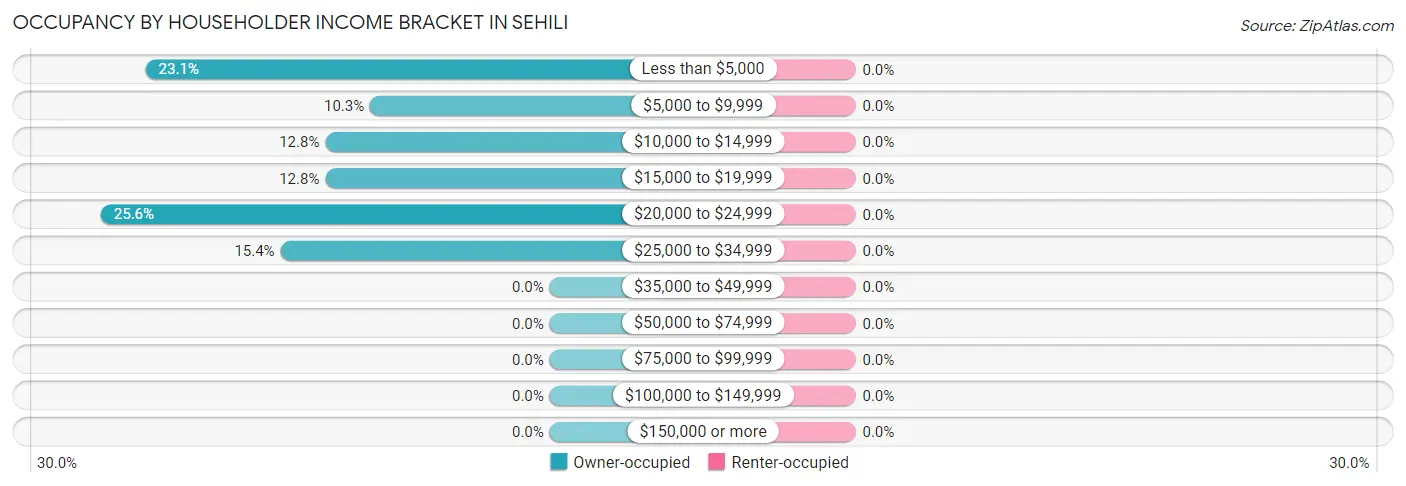
| Income Bracket | Owner-occupied | Renter-occupied |
| Less than $5,000 | 9 (23.1%) | 0 (0.0%) |
| $5,000 to $9,999 | 4 (10.3%) | 0 (0.0%) |
| $10,000 to $14,999 | 5 (12.8%) | 0 (0.0%) |
| $15,000 to $19,999 | 5 (12.8%) | 0 (0.0%) |
| $20,000 to $24,999 | 10 (25.6%) | 0 (0.0%) |
| $25,000 to $34,999 | 6 (15.4%) | 0 (0.0%) |
| $35,000 to $49,999 | 0 (0.0%) | 0 (0.0%) |
| $50,000 to $74,999 | 0 (0.0%) | 0 (0.0%) |
| $75,000 to $99,999 | 0 (0.0%) | 0 (0.0%) |
| $100,000 to $149,999 | 0 (0.0%) | 0 (0.0%) |
| $150,000 or more | 0 (0.0%) | 0 (0.0%) |
| Total | 39 (100.0%) | 0 (0.0%) |
Monthly Housing Cost Tiers in Sehili
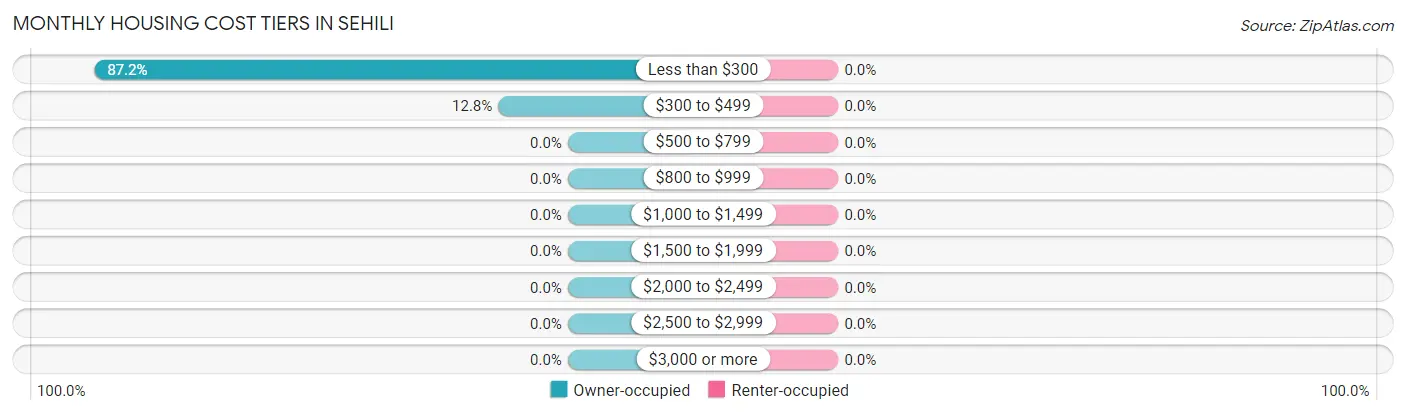
| Monthly Cost | Owner-occupied | Renter-occupied |
| Less than $300 | 34 (87.2%) | 0 (0.0%) |
| $300 to $499 | 5 (12.8%) | 0 (0.0%) |
| $500 to $799 | 0 (0.0%) | 0 (0.0%) |
| $800 to $999 | 0 (0.0%) | 0 (0.0%) |
| $1,000 to $1,499 | 0 (0.0%) | 0 (0.0%) |
| $1,500 to $1,999 | 0 (0.0%) | 0 (0.0%) |
| $2,000 to $2,499 | 0 (0.0%) | 0 (0.0%) |
| $2,500 to $2,999 | 0 (0.0%) | 0 (0.0%) |
| $3,000 or more | 0 (0.0%) | 0 (0.0%) |
| Total | 39 (100.0%) | 0 (0.0%) |
Physical Housing Characteristics in Sehili
Housing Structures in Sehili
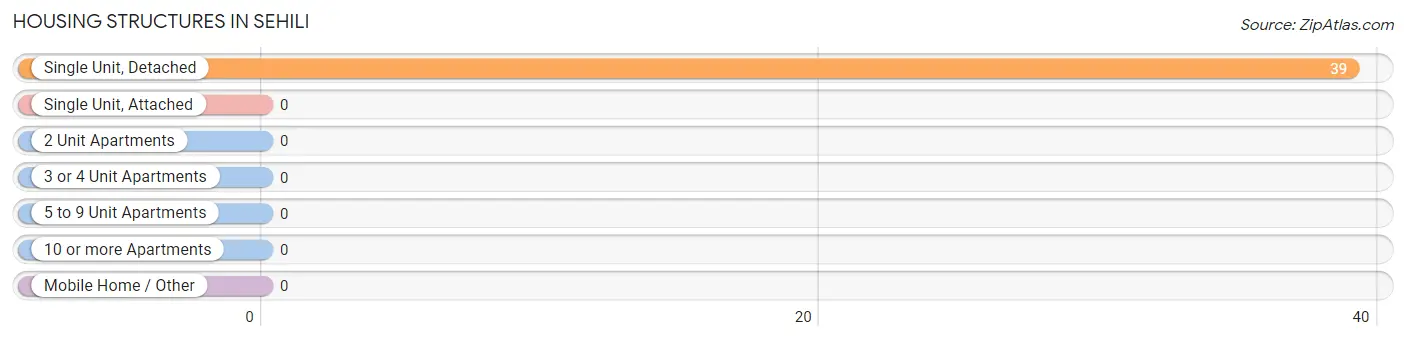
| Structure Type | # Housing Units | % Housing Units |
| Single Unit, Detached | 39 | 100.0% |
| Single Unit, Attached | 0 | 0.0% |
| 2 Unit Apartments | 0 | 0.0% |
| 3 or 4 Unit Apartments | 0 | 0.0% |
| 5 to 9 Unit Apartments | 0 | 0.0% |
| 10 or more Apartments | 0 | 0.0% |
| Mobile Home / Other | 0 | 0.0% |
| Total | 39 | 100.0% |
Housing Structures by Occupancy in Sehili
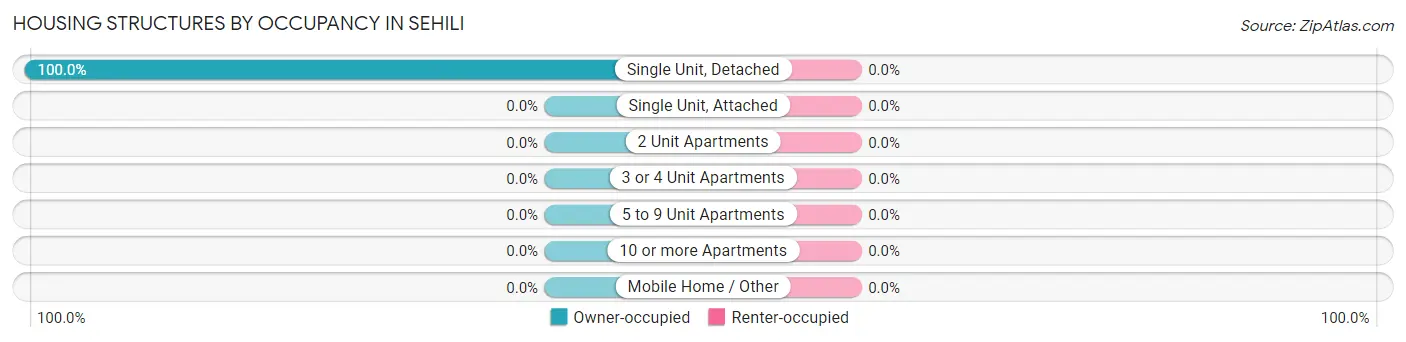
| Structure Type | Owner-occupied | Renter-occupied |
| Single Unit, Detached | 39 (100.0%) | 0 (0.0%) |
| Single Unit, Attached | 0 (0.0%) | 0 (0.0%) |
| 2 Unit Apartments | 0 (0.0%) | 0 (0.0%) |
| 3 or 4 Unit Apartments | 0 (0.0%) | 0 (0.0%) |
| 5 to 9 Unit Apartments | 0 (0.0%) | 0 (0.0%) |
| 10 or more Apartments | 0 (0.0%) | 0 (0.0%) |
| Mobile Home / Other | 0 (0.0%) | 0 (0.0%) |
| Total | 39 (100.0%) | 0 (0.0%) |
Housing Structures by Number of Rooms in Sehili
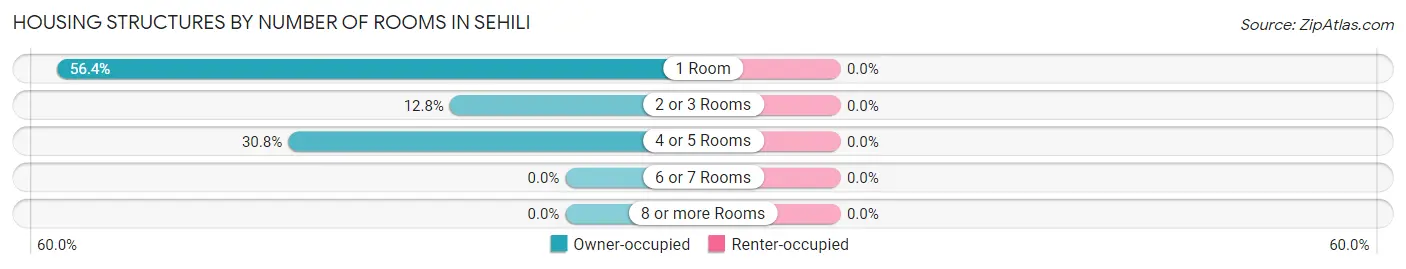
| Number of Rooms | Owner-occupied | Renter-occupied |
| 1 Room | 22 (56.4%) | 0 (0.0%) |
| 2 or 3 Rooms | 5 (12.8%) | 0 (0.0%) |
| 4 or 5 Rooms | 12 (30.8%) | 0 (0.0%) |
| 6 or 7 Rooms | 0 (0.0%) | 0 (0.0%) |
| 8 or more Rooms | 0 (0.0%) | 0 (0.0%) |
| Total | 39 (100.0%) | 0 (0.0%) |
Housing Structure by Heating Type in Sehili
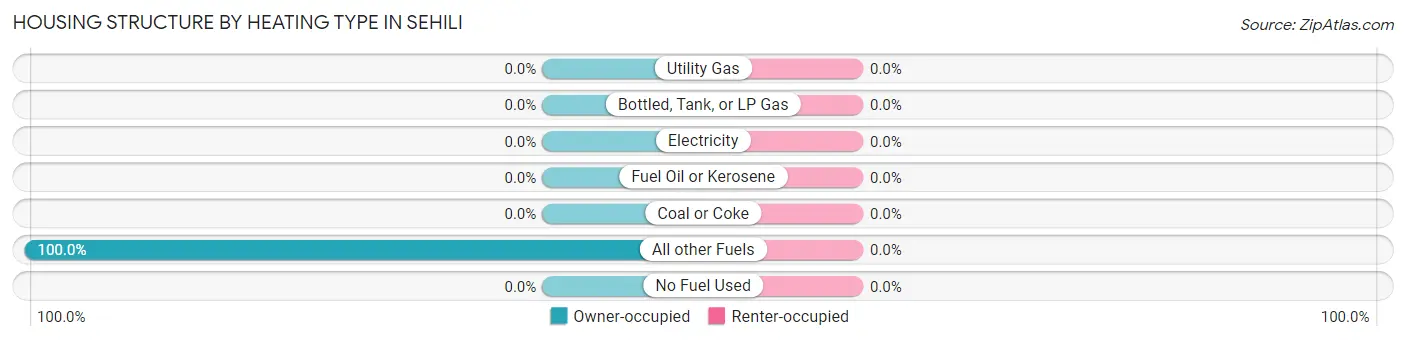
| Heating Type | Owner-occupied | Renter-occupied |
| Utility Gas | 0 (0.0%) | 0 (0.0%) |
| Bottled, Tank, or LP Gas | 0 (0.0%) | 0 (0.0%) |
| Electricity | 0 (0.0%) | 0 (0.0%) |
| Fuel Oil or Kerosene | 0 (0.0%) | 0 (0.0%) |
| Coal or Coke | 0 (0.0%) | 0 (0.0%) |
| All other Fuels | 39 (100.0%) | 0 (0.0%) |
| No Fuel Used | 0 (0.0%) | 0 (0.0%) |
| Total | 39 (100.0%) | 0 (0.0%) |
Household Vehicle Usage in Sehili
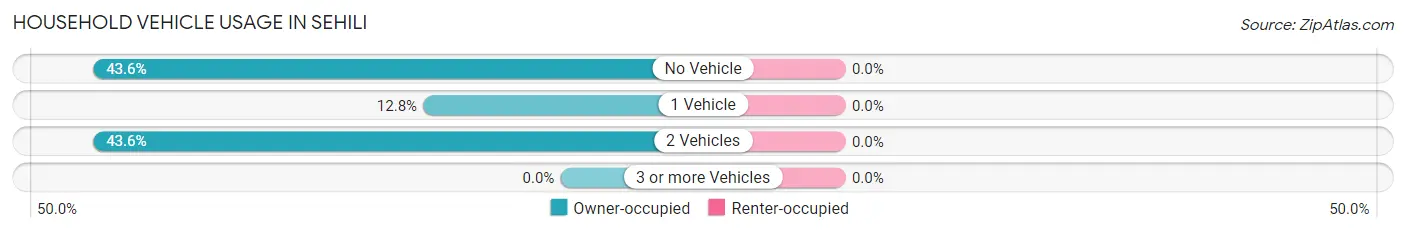
| Vehicles per Household | Owner-occupied | Renter-occupied |
| No Vehicle | 17 (43.6%) | 0 (0.0%) |
| 1 Vehicle | 5 (12.8%) | 0 (0.0%) |
| 2 Vehicles | 17 (43.6%) | 0 (0.0%) |
| 3 or more Vehicles | 0 (0.0%) | 0 (0.0%) |
| Total | 39 (100.0%) | 0 (0.0%) |
Real Estate & Mortgages in Sehili
Real Estate and Mortgage Overview in Sehili
| Characteristic | Without Mortgage | With Mortgage |
| Housing Units | 39 | 0 |
| Median Property Value | $22,500 | $0 |
| Median Household Income | $15,750 | $0 |
| Monthly Housing Costs | $200 | $0 |
| Real Estate Taxes | - | - |
Property Value by Mortgage Status in Sehili
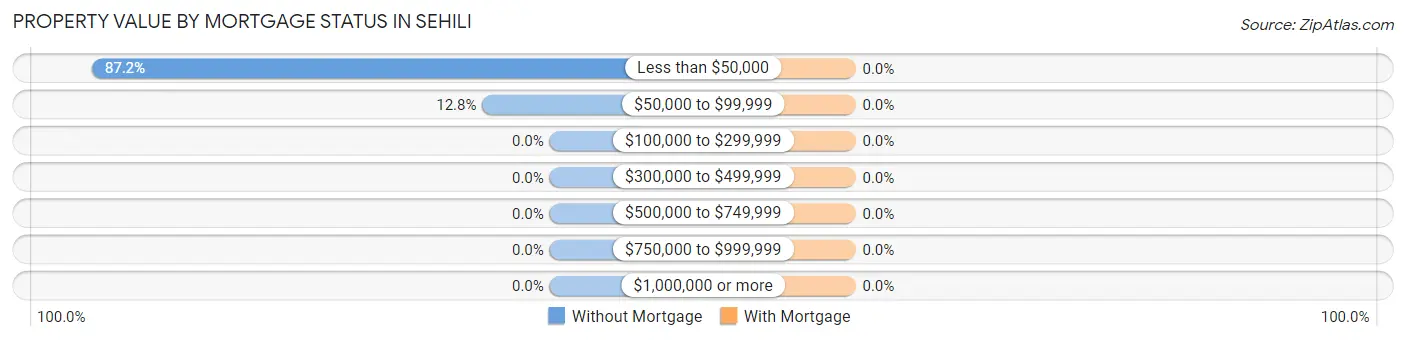
| Property Value | Without Mortgage | With Mortgage |
| Less than $50,000 | 34 (87.2%) | 0 (0.0%) |
| $50,000 to $99,999 | 5 (12.8%) | 0 (0.0%) |
| $100,000 to $299,999 | 0 (0.0%) | 0 (0.0%) |
| $300,000 to $499,999 | 0 (0.0%) | 0 (0.0%) |
| $500,000 to $749,999 | 0 (0.0%) | 0 (0.0%) |
| $750,000 to $999,999 | 0 (0.0%) | 0 (0.0%) |
| $1,000,000 or more | 0 (0.0%) | 0 (0.0%) |
| Total | 39 (100.0%) | 0 (0.0%) |
Household Income by Mortgage Status in Sehili
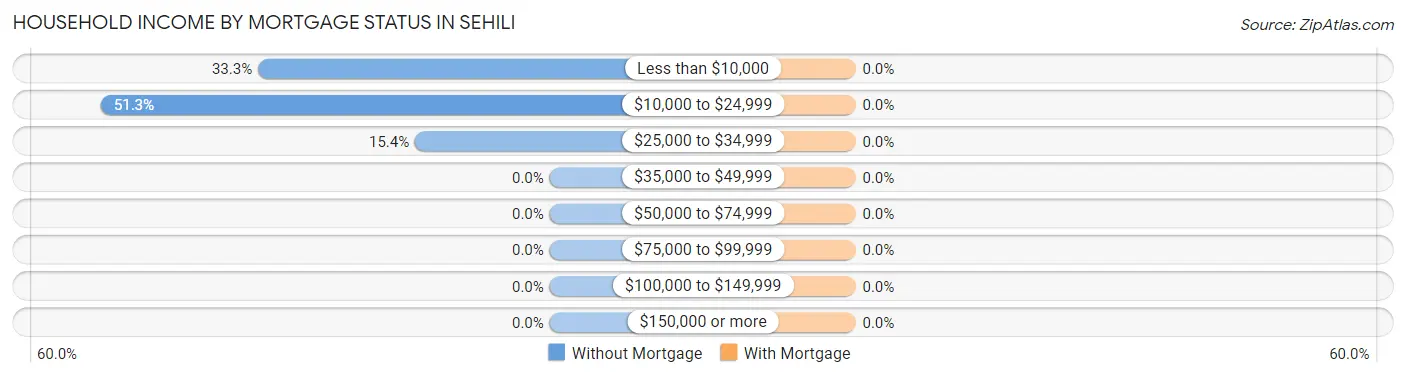
| Household Income | Without Mortgage | With Mortgage |
| Less than $10,000 | 13 (33.3%) | 0 (0.0%) |
| $10,000 to $24,999 | 20 (51.3%) | 0 (0.0%) |
| $25,000 to $34,999 | 6 (15.4%) | 0 (0.0%) |
| $35,000 to $49,999 | 0 (0.0%) | 0 (0.0%) |
| $50,000 to $74,999 | 0 (0.0%) | 0 (0.0%) |
| $75,000 to $99,999 | 0 (0.0%) | 0 (0.0%) |
| $100,000 to $149,999 | 0 (0.0%) | 0 (0.0%) |
| $150,000 or more | 0 (0.0%) | 0 (0.0%) |
| Total | 39 (100.0%) | 0 (0.0%) |
Property Value to Household Income Ratio in Sehili
| Value-to-Income Ratio | Without Mortgage | With Mortgage |
| Less than 2.0x | 20 (51.3%) | 0 (0.0%) |
| 2.0x to 2.9x | 5 (12.8%) | 0 (0.0%) |
| 3.0x to 3.9x | 0 (0.0%) | 0 (0.0%) |
| 4.0x or more | 11 (28.2%) | 0 (0.0%) |
| Total | 39 (100.0%) | 0 (0.0%) |
Real Estate Taxes by Mortgage Status in Sehili
| Property Taxes | Without Mortgage | With Mortgage |
| Less than $800 | 0 (0.0%) | 0 (0.0%) |
| $800 to $1,499 | 0 (0.0%) | 0 (0.0%) |
| $800 to $1,499 | 0 (0.0%) | 0 (0.0%) |
| Total | 39 (100.0%) | 0 (0.0%) |
Health & Disability in Sehili
Health Insurance Coverage by Age in Sehili
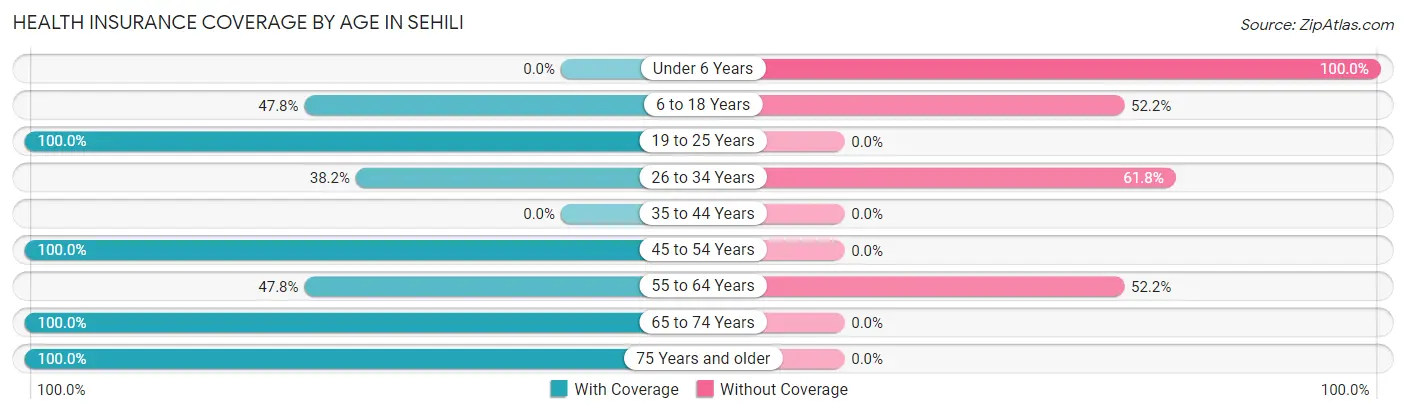
| Age Bracket | With Coverage | Without Coverage |
| Under 6 Years | 0 (0.0%) | 8 (100.0%) |
| 6 to 18 Years | 11 (47.8%) | 12 (52.2%) |
| 19 to 25 Years | 33 (100.0%) | 0 (0.0%) |
| 26 to 34 Years | 13 (38.2%) | 21 (61.8%) |
| 35 to 44 Years | 0 (0.0%) | 0 (0.0%) |
| 45 to 54 Years | 16 (100.0%) | 0 (0.0%) |
| 55 to 64 Years | 11 (47.8%) | 12 (52.2%) |
| 65 to 74 Years | 5 (100.0%) | 0 (0.0%) |
| 75 Years and older | 14 (100.0%) | 0 (0.0%) |
| Total | 103 (66.0%) | 53 (34.0%) |
Health Insurance Coverage by Citizenship Status in Sehili
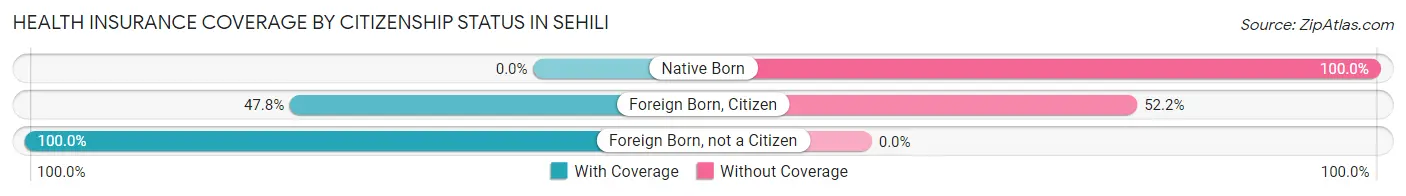
| Citizenship Status | With Coverage | Without Coverage |
| Native Born | 0 (0.0%) | 8 (100.0%) |
| Foreign Born, Citizen | 11 (47.8%) | 12 (52.2%) |
| Foreign Born, not a Citizen | 33 (100.0%) | 0 (0.0%) |
Health Insurance Coverage by Household Income in Sehili
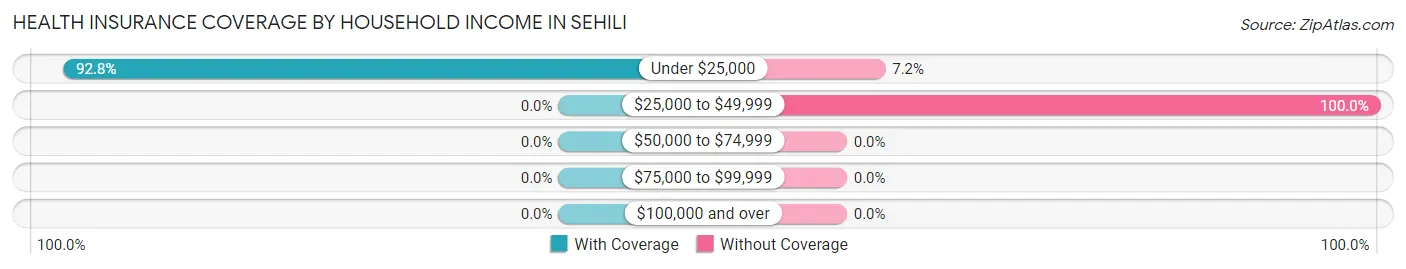
| Household Income | With Coverage | Without Coverage |
| Under $25,000 | 103 (92.8%) | 8 (7.2%) |
| $25,000 to $49,999 | 0 (0.0%) | 45 (100.0%) |
| $50,000 to $74,999 | 0 (0.0%) | 0 (0.0%) |
| $75,000 to $99,999 | 0 (0.0%) | 0 (0.0%) |
| $100,000 and over | 0 (0.0%) | 0 (0.0%) |
Public vs Private Health Insurance Coverage by Age in Sehili
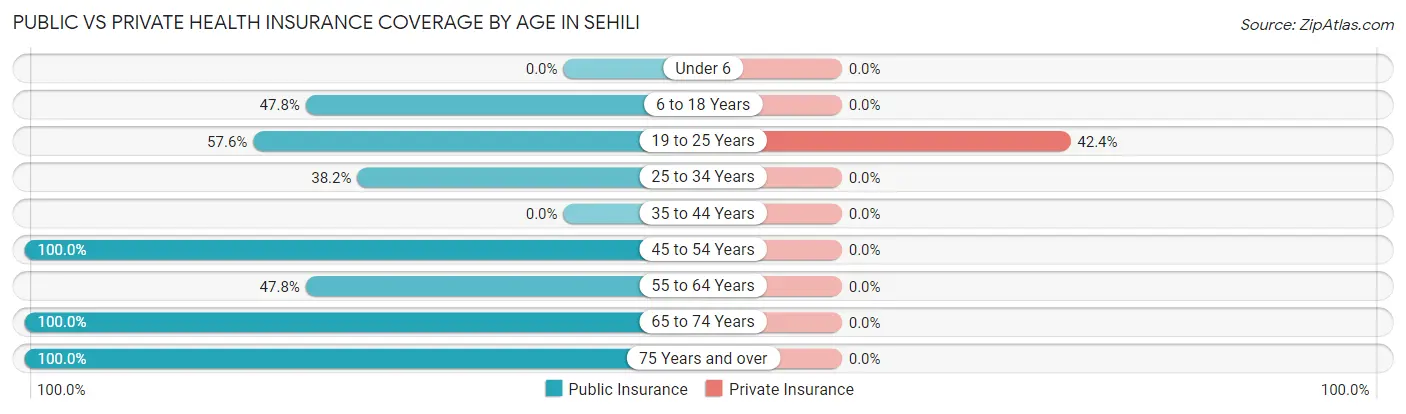
| Age Bracket | Public Insurance | Private Insurance |
| Under 6 | 0 (0.0%) | 0 (0.0%) |
| 6 to 18 Years | 11 (47.8%) | 0 (0.0%) |
| 19 to 25 Years | 19 (57.6%) | 14 (42.4%) |
| 25 to 34 Years | 13 (38.2%) | 0 (0.0%) |
| 35 to 44 Years | 0 (0.0%) | 0 (0.0%) |
| 45 to 54 Years | 16 (100.0%) | 0 (0.0%) |
| 55 to 64 Years | 11 (47.8%) | 0 (0.0%) |
| 65 to 74 Years | 5 (100.0%) | 0 (0.0%) |
| 75 Years and over | 14 (100.0%) | 0 (0.0%) |
| Total | 89 (57.1%) | 14 (9.0%) |
Disability Status by Sex by Age in Sehili
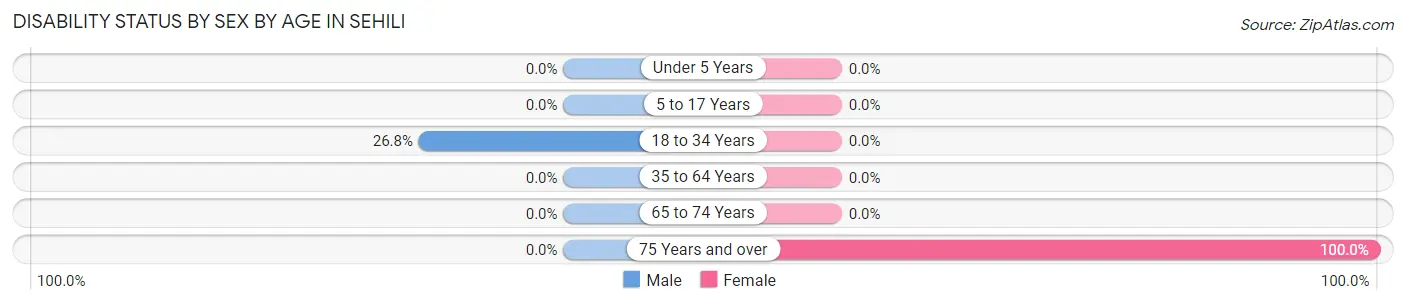
| Age Bracket | Male | Female |
| Under 5 Years | 0 (0.0%) | 0 (0.0%) |
| 5 to 17 Years | 0 (0.0%) | 0 (0.0%) |
| 18 to 34 Years | 11 (26.8%) | 0 (0.0%) |
| 35 to 64 Years | 0 (0.0%) | 0 (0.0%) |
| 65 to 74 Years | 0 (0.0%) | 0 (0.0%) |
| 75 Years and over | 0 (0.0%) | 14 (100.0%) |
Disability Class by Sex by Age in Sehili
Disability Class: Hearing Difficulty
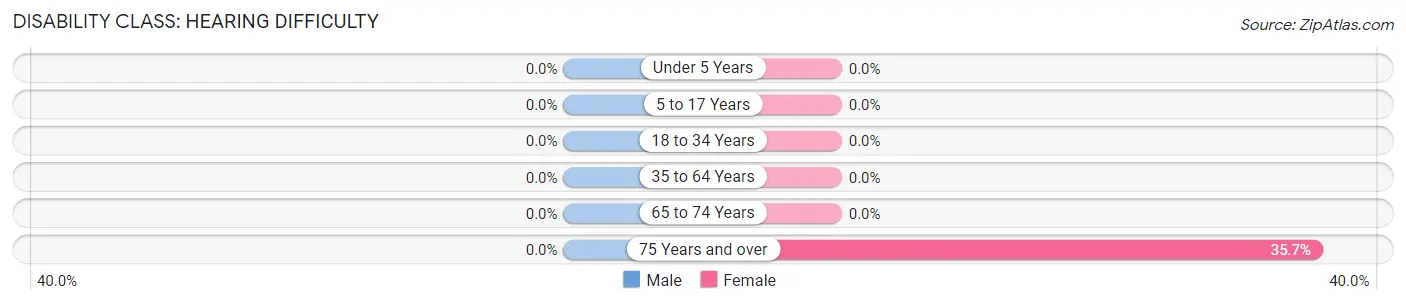
| Age Bracket | Male | Female |
| Under 5 Years | 0 (0.0%) | 0 (0.0%) |
| 5 to 17 Years | 0 (0.0%) | 0 (0.0%) |
| 18 to 34 Years | 0 (0.0%) | 0 (0.0%) |
| 35 to 64 Years | 0 (0.0%) | 0 (0.0%) |
| 65 to 74 Years | 0 (0.0%) | 0 (0.0%) |
| 75 Years and over | 0 (0.0%) | 5 (35.7%) |
Disability Class: Vision Difficulty
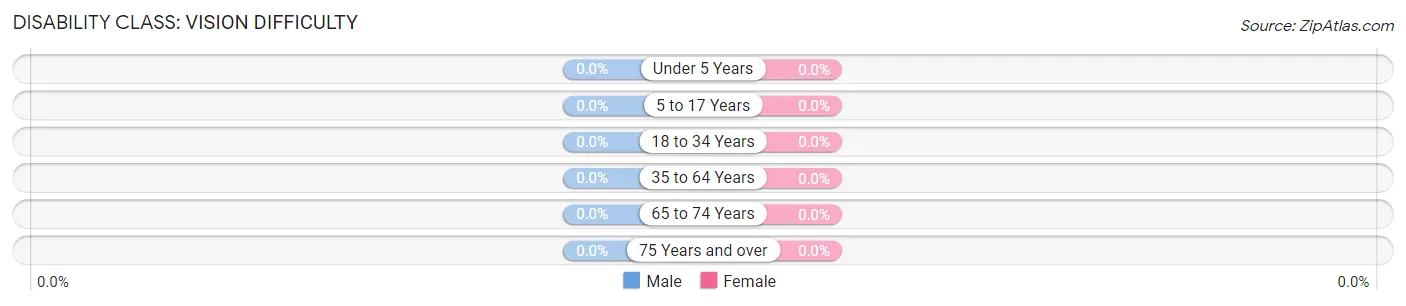
| Age Bracket | Male | Female |
| Under 5 Years | 0 (0.0%) | 0 (0.0%) |
| 5 to 17 Years | 0 (0.0%) | 0 (0.0%) |
| 18 to 34 Years | 0 (0.0%) | 0 (0.0%) |
| 35 to 64 Years | 0 (0.0%) | 0 (0.0%) |
| 65 to 74 Years | 0 (0.0%) | 0 (0.0%) |
| 75 Years and over | 0 (0.0%) | 0 (0.0%) |
Disability Class: Cognitive Difficulty
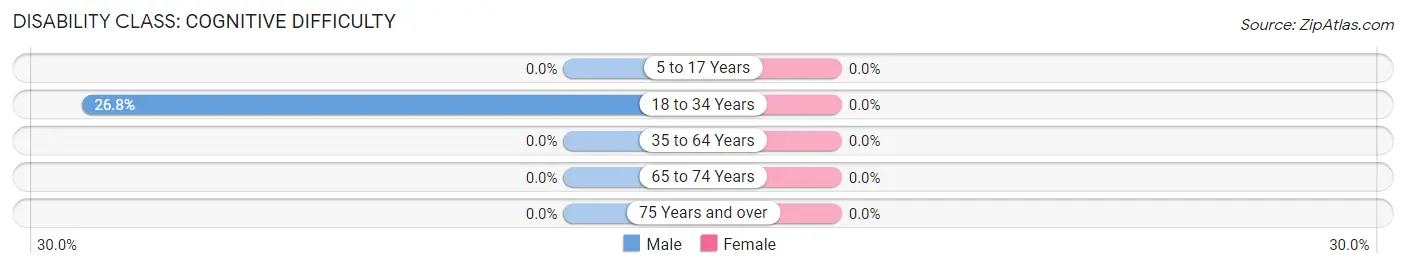
| Age Bracket | Male | Female |
| 5 to 17 Years | 0 (0.0%) | 0 (0.0%) |
| 18 to 34 Years | 11 (26.8%) | 0 (0.0%) |
| 35 to 64 Years | 0 (0.0%) | 0 (0.0%) |
| 65 to 74 Years | 0 (0.0%) | 0 (0.0%) |
| 75 Years and over | 0 (0.0%) | 0 (0.0%) |
Disability Class: Ambulatory Difficulty
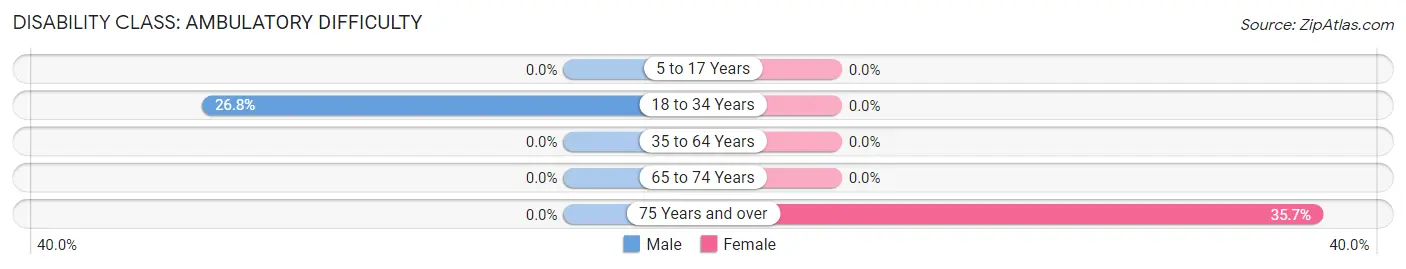
| Age Bracket | Male | Female |
| 5 to 17 Years | 0 (0.0%) | 0 (0.0%) |
| 18 to 34 Years | 11 (26.8%) | 0 (0.0%) |
| 35 to 64 Years | 0 (0.0%) | 0 (0.0%) |
| 65 to 74 Years | 0 (0.0%) | 0 (0.0%) |
| 75 Years and over | 0 (0.0%) | 5 (35.7%) |
Disability Class: Self-Care Difficulty
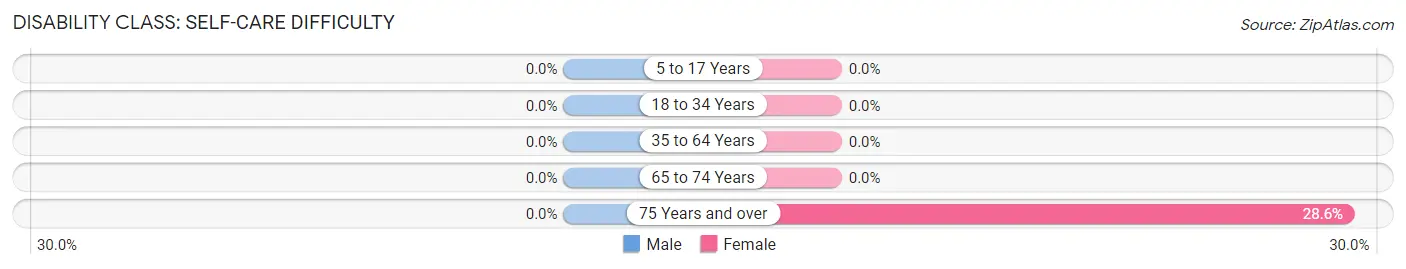
| Age Bracket | Male | Female |
| 5 to 17 Years | 0 (0.0%) | 0 (0.0%) |
| 18 to 34 Years | 0 (0.0%) | 0 (0.0%) |
| 35 to 64 Years | 0 (0.0%) | 0 (0.0%) |
| 65 to 74 Years | 0 (0.0%) | 0 (0.0%) |
| 75 Years and over | 0 (0.0%) | 4 (28.6%) |
Technology Access in Sehili
Computing Device Access in Sehili
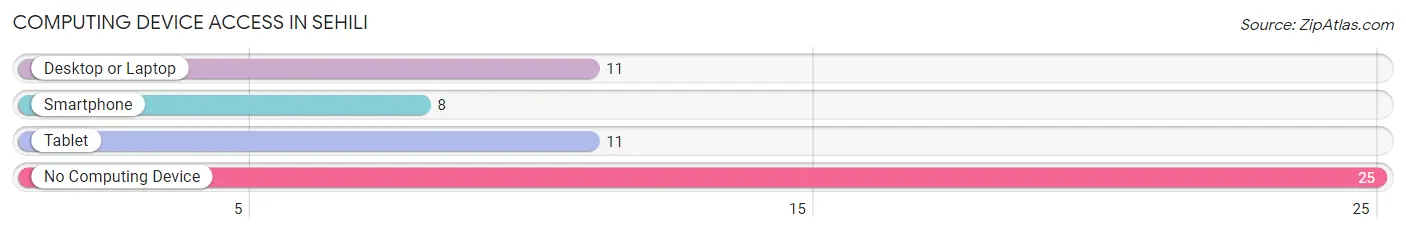
| Device Type | # Households | % Households |
| Desktop or Laptop | 11 | 28.2% |
| Smartphone | 8 | 20.5% |
| Tablet | 11 | 28.2% |
| No Computing Device | 25 | 64.1% |
| Total | 39 | 100.0% |
Internet Access in Sehili
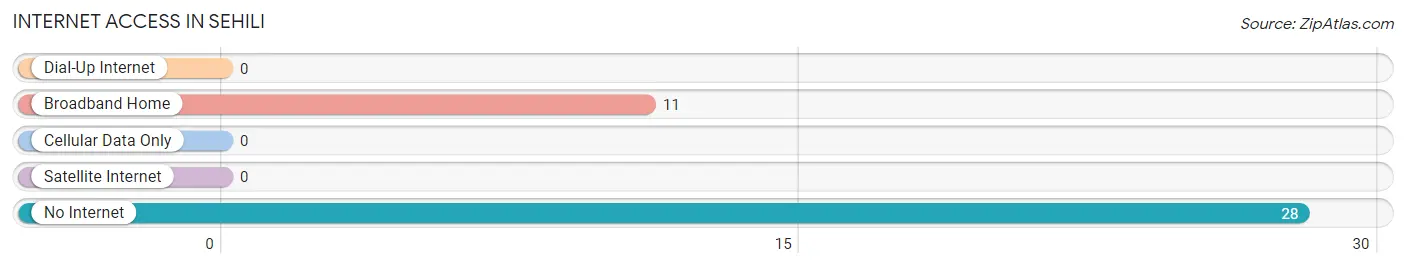
| Internet Type | # Households | % Households |
| Dial-Up Internet | 0 | 0.0% |
| Broadband Home | 11 | 28.2% |
| Cellular Data Only | 0 | 0.0% |
| Satellite Internet | 0 | 0.0% |
| No Internet | 28 | 71.8% |
| Total | 39 | 100.0% |
Sehili Summary
Sehili is a small town located in the northern part of Azerbaijan. It is situated in the foothills of the Greater Caucasus Mountains, and is bordered by the Republic of Georgia to the north and the Republic of Armenia to the east. Sehili is a rural area with a population of approximately 5,000 people.
History
The history of Sehili dates back to the early 19th century, when it was part of the Russian Empire. During this period, the town was known as Sehiliyevka and was part of the Tiflis Governorate. In the late 19th century, the town was part of the Elisabethpol Governorate. After the Russian Revolution of 1917, Sehili became part of the newly formed Azerbaijan Democratic Republic. In 1920, the town was occupied by the Red Army and became part of the Soviet Union.
During the Soviet period, Sehili was part of the Nagorno-Karabakh Autonomous Oblast. In 1991, after the dissolution of the Soviet Union, Sehili became part of the newly independent Republic of Azerbaijan.
Geography
Sehili is located in the northern part of Azerbaijan, in the foothills of the Greater Caucasus Mountains. The town is situated at an elevation of 1,400 meters above sea level. The climate in Sehili is continental, with cold winters and hot summers. The average annual temperature is 8.5°C.
The town is surrounded by mountains and forests, and is located near the Kura River. The nearest major cities are Tbilisi, the capital of Georgia, and Yerevan, the capital of Armenia.
Economy
The economy of Sehili is largely based on agriculture. The main crops grown in the area are wheat, barley, corn, potatoes, and vegetables. Livestock farming is also an important part of the local economy.
The town is also home to several small industries, including food processing, textiles, and furniture manufacturing. There are also several small shops and restaurants in the town.
Demographics
As of 2020, the population of Sehili is estimated to be around 5,000 people. The majority of the population is ethnic Azerbaijani, with a small minority of Armenians and Georgians. The town is predominantly Muslim, with a small Christian minority. The official language is Azerbaijani, although Russian and Armenian are also spoken.
Sehili is a small but vibrant town, with a rich cultural heritage. The town is home to several historical monuments, including a 19th century mosque and a 19th century church. The town is also home to several traditional festivals, such as the Sehili Spring Festival and the Sehili Summer Festival.
Common Questions
What is Per Capita Income in Sehili?
Per Capita income in Sehili is $3,814.
What is the Median Household income in Sehili?
Median Household Income in Sehili is $15,750.
What is Family Income Deficit in Sehili?
Family Income Deficit in Sehili is $20,647.
Families that are below poverty line in Sehili earn $20,647 less on average than the poverty threshold level.
What is Inequality or Gini Index in Sehili?
Inequality or Gini Index in Sehili is 0.38.
What is the Total Population of Sehili?
Total Population of Sehili is 156.
What is the Total Male Population of Sehili?
Total Male Population of Sehili is 80.
What is the Total Female Population of Sehili?
Total Female Population of Sehili is 76.
What is the Ratio of Males per 100 Females in Sehili?
There are 105.26 Males per 100 Females in Sehili.
What is the Ratio of Females per 100 Males in Sehili?
There are 95.00 Females per 100 Males in Sehili.
What is the Median Population Age in Sehili?
Median Population Age in Sehili is 30.4 Years.
What is the Average Family Size in Sehili
Average Family Size in Sehili is 7.6 People.
What is the Average Household Size in Sehili
Average Household Size in Sehili is 4.0 People.
How Large is the Labor Force in Sehili?
There are 43 People in the Labor Forcein in Sehili.
What is the Percentage of People in the Labor Force in Sehili?
33.6% of People are in the Labor Force in Sehili.
What is the Unemployment Rate in Sehili?
Unemployment Rate in Sehili is 41.9%.