Miracle Valley, AZ Map & Demographics
Miracle Valley Map
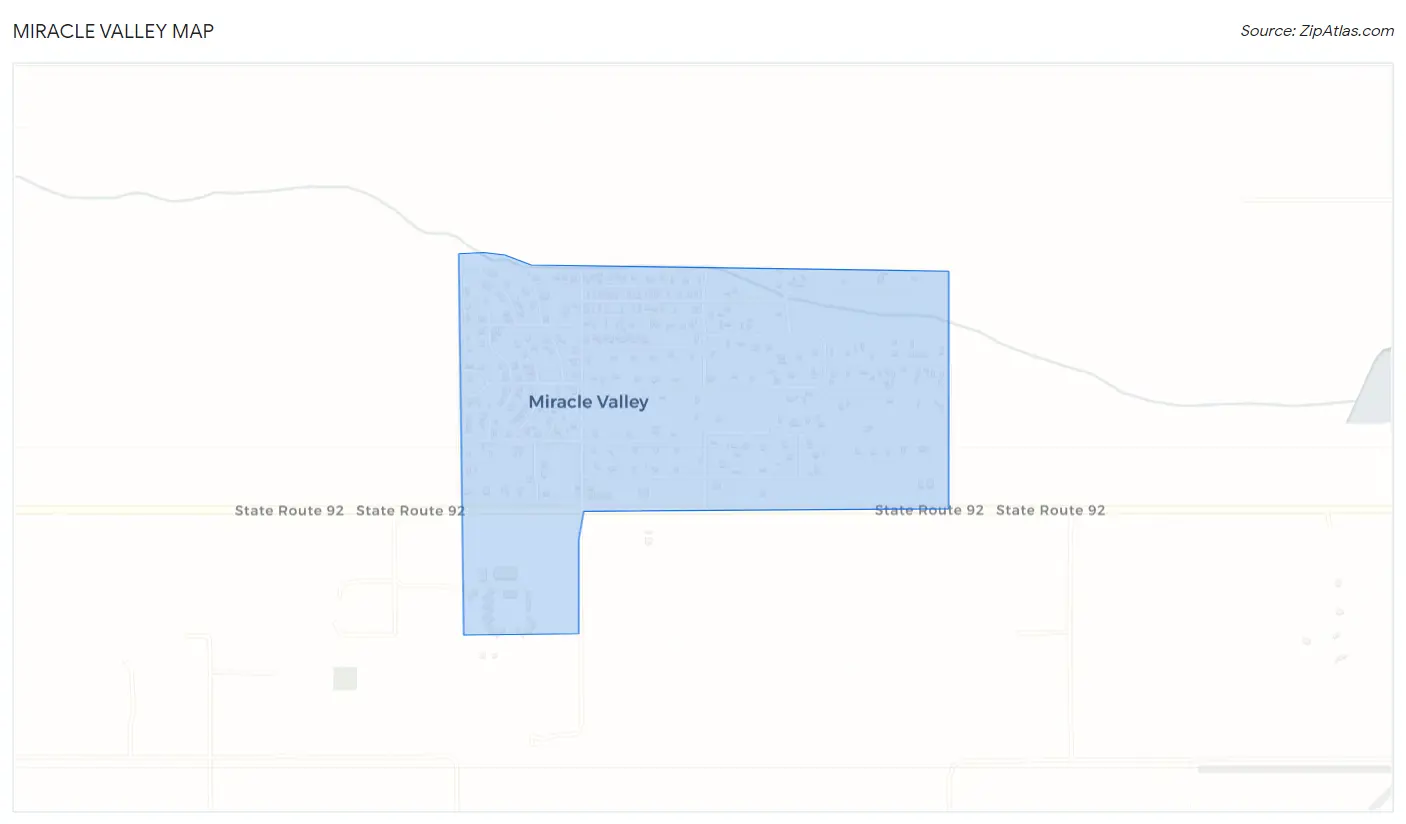
Miracle Valley Overview
$34,317
PER CAPITA INCOME
$61,701
AVG FAMILY INCOME
$54,107
AVG HOUSEHOLD INCOME
51.0%
WAGE / INCOME GAP [ % ]
49.0¢/ $1
WAGE / INCOME GAP [ $ ]
0.41
INEQUALITY / GINI INDEX
704
TOTAL POPULATION
386
MALE POPULATION
318
FEMALE POPULATION
121.38
MALES / 100 FEMALES
82.38
FEMALES / 100 MALES
55.5
MEDIAN AGE
2.9
AVG FAMILY SIZE
2.9
AVG HOUSEHOLD SIZE
246
LABOR FORCE [ PEOPLE ]
46.9%
PERCENT IN LABOR FORCE
Income in Miracle Valley
Income Overview in Miracle Valley
Per Capita Income in Miracle Valley is $34,317, while median incomes of families and households are $61,701 and $54,107 respectively.
| Characteristic | Number | Measure |
| Per Capita Income | 704 | $34,317 |
| Median Family Income | 183 | $61,701 |
| Mean Family Income | 183 | $87,752 |
| Median Household Income | 242 | $54,107 |
| Mean Household Income | 242 | $80,934 |
| Income Deficit | 183 | $0 |
| Wage / Income Gap (%) | 704 | 51.03% |
| Wage / Income Gap ($) | 704 | 48.97¢ per $1 |
| Gini / Inequality Index | 704 | 0.41 |
Earnings by Sex in Miracle Valley
Average Earnings in Miracle Valley are $48,438, $77,798 for men and $38,098 for women, a difference of 51.0%.
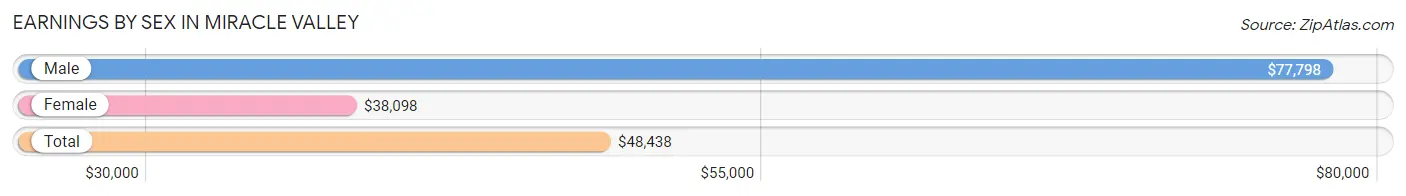
| Sex | Number | Average Earnings |
| Male | 148 (60.2%) | $77,798 |
| Female | 98 (39.8%) | $38,098 |
| Total | 246 (100.0%) | $48,438 |
Earnings by Sex by Income Bracket in Miracle Valley
The most common earnings brackets in Miracle Valley are $75,000 to $99,999 for men (84 | 56.8%) and $35,000 to $39,999 for women (46 | 46.9%).
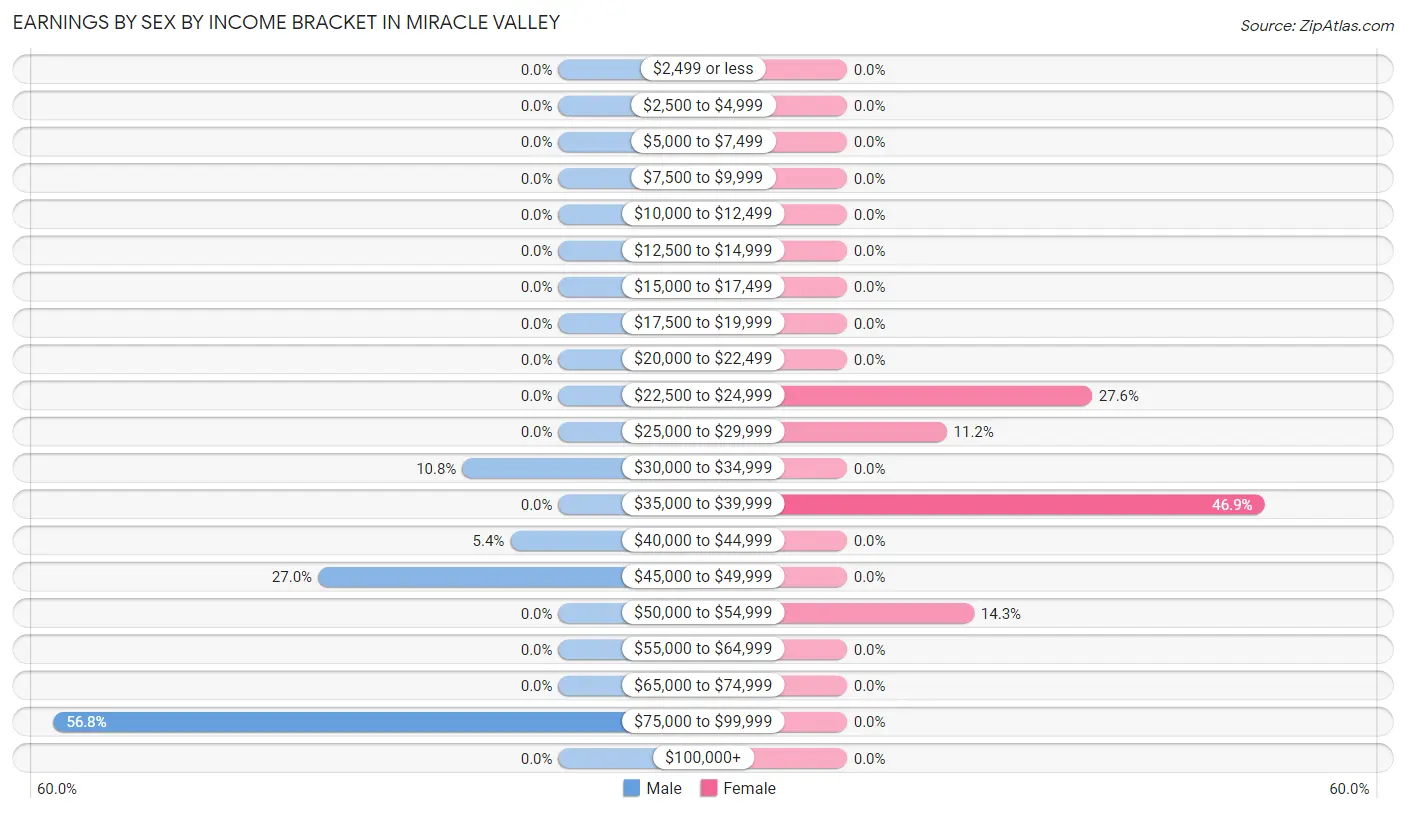
| Income | Male | Female |
| $2,499 or less | 0 (0.0%) | 0 (0.0%) |
| $2,500 to $4,999 | 0 (0.0%) | 0 (0.0%) |
| $5,000 to $7,499 | 0 (0.0%) | 0 (0.0%) |
| $7,500 to $9,999 | 0 (0.0%) | 0 (0.0%) |
| $10,000 to $12,499 | 0 (0.0%) | 0 (0.0%) |
| $12,500 to $14,999 | 0 (0.0%) | 0 (0.0%) |
| $15,000 to $17,499 | 0 (0.0%) | 0 (0.0%) |
| $17,500 to $19,999 | 0 (0.0%) | 0 (0.0%) |
| $20,000 to $22,499 | 0 (0.0%) | 0 (0.0%) |
| $22,500 to $24,999 | 0 (0.0%) | 27 (27.6%) |
| $25,000 to $29,999 | 0 (0.0%) | 11 (11.2%) |
| $30,000 to $34,999 | 16 (10.8%) | 0 (0.0%) |
| $35,000 to $39,999 | 0 (0.0%) | 46 (46.9%) |
| $40,000 to $44,999 | 8 (5.4%) | 0 (0.0%) |
| $45,000 to $49,999 | 40 (27.0%) | 0 (0.0%) |
| $50,000 to $54,999 | 0 (0.0%) | 14 (14.3%) |
| $55,000 to $64,999 | 0 (0.0%) | 0 (0.0%) |
| $65,000 to $74,999 | 0 (0.0%) | 0 (0.0%) |
| $75,000 to $99,999 | 84 (56.8%) | 0 (0.0%) |
| $100,000+ | 0 (0.0%) | 0 (0.0%) |
| Total | 148 (100.0%) | 98 (100.0%) |
Earnings by Sex by Educational Attainment in Miracle Valley
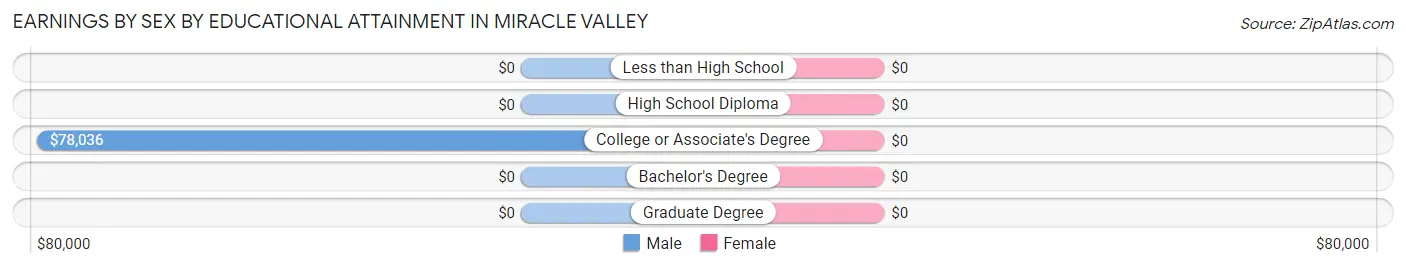
| Educational Attainment | Male Income | Female Income |
| Less than High School | - | - |
| High School Diploma | - | - |
| College or Associate's Degree | $78,036 | $0 |
| Bachelor's Degree | - | - |
| Graduate Degree | - | - |
| Total | $77,798 | $38,098 |
Family Income in Miracle Valley
Family Income Brackets in Miracle Valley
According to the Miracle Valley family income data, there are 46 families falling into the $100,000 to $149,999 income range, which is the most common income bracket and makes up 25.1% of all families.
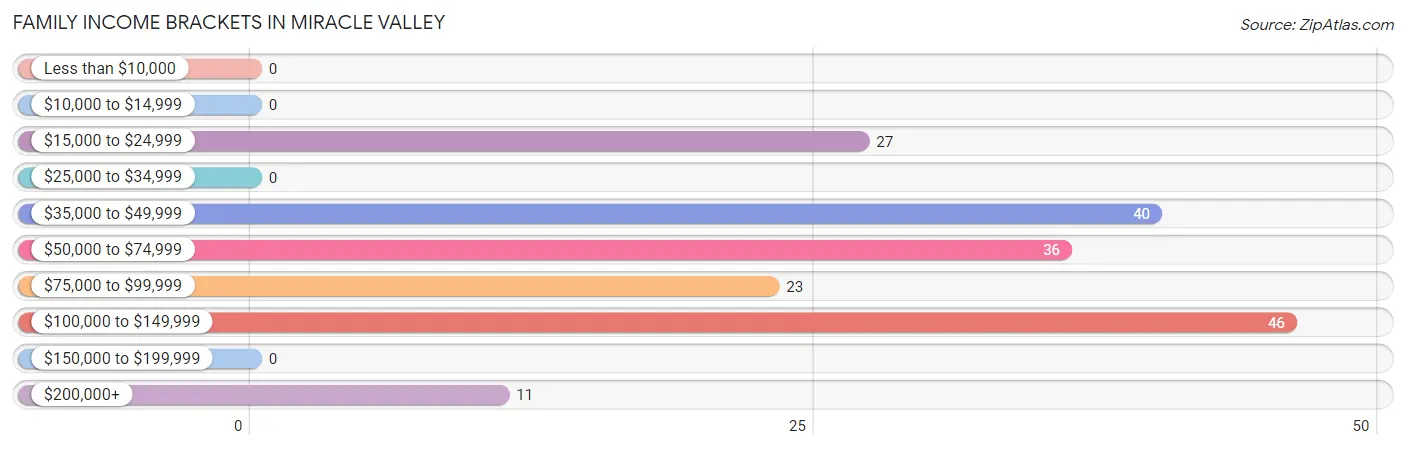
| Income Bracket | # Families | % Families |
| Less than $10,000 | 0 | 0.0% |
| $10,000 to $14,999 | 0 | 0.0% |
| $15,000 to $24,999 | 27 | 14.8% |
| $25,000 to $34,999 | 0 | 0.0% |
| $35,000 to $49,999 | 40 | 21.9% |
| $50,000 to $74,999 | 36 | 19.7% |
| $75,000 to $99,999 | 23 | 12.6% |
| $100,000 to $149,999 | 46 | 25.1% |
| $150,000 to $199,999 | 0 | 0.0% |
| $200,000+ | 11 | 6.0% |
Family Income by Famaliy Size in Miracle Valley
| Income Bracket | # Families | Median Income |
| 2-Person Families | 132 (72.1%) | $0 |
| 3-Person Families | 11 (6.0%) | $0 |
| 4-Person Families | 0 (0.0%) | $0 |
| 5-Person Families | 40 (21.9%) | $0 |
| 6-Person Families | 0 (0.0%) | $0 |
| 7+ Person Families | 0 (0.0%) | $0 |
| Total | 183 (100.0%) | $61,701 |
Family Income by Number of Earners in Miracle Valley
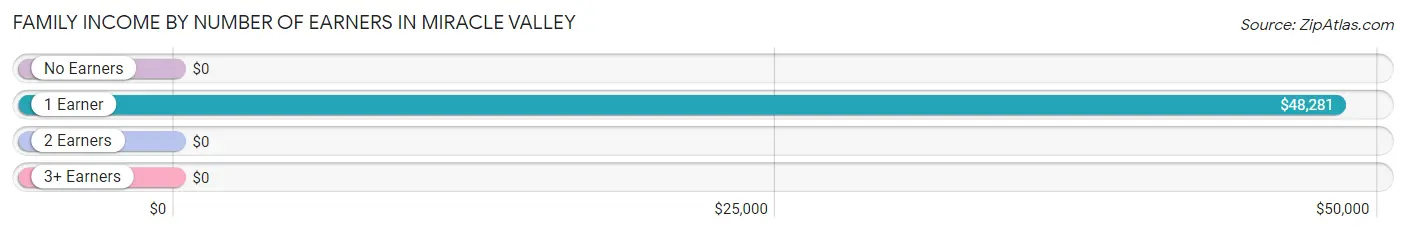
| Number of Earners | # Families | Median Income |
| No Earners | 47 (25.7%) | $0 |
| 1 Earner | 79 (43.2%) | $48,281 |
| 2 Earners | 57 (31.1%) | $0 |
| 3+ Earners | 0 (0.0%) | $0 |
| Total | 183 (100.0%) | $61,701 |
Household Income in Miracle Valley
Household Income Brackets in Miracle Valley
With 62 households falling in the category, the $35,000 to $49,999 income range is the most frequent in Miracle Valley, accounting for 25.6% of all households.
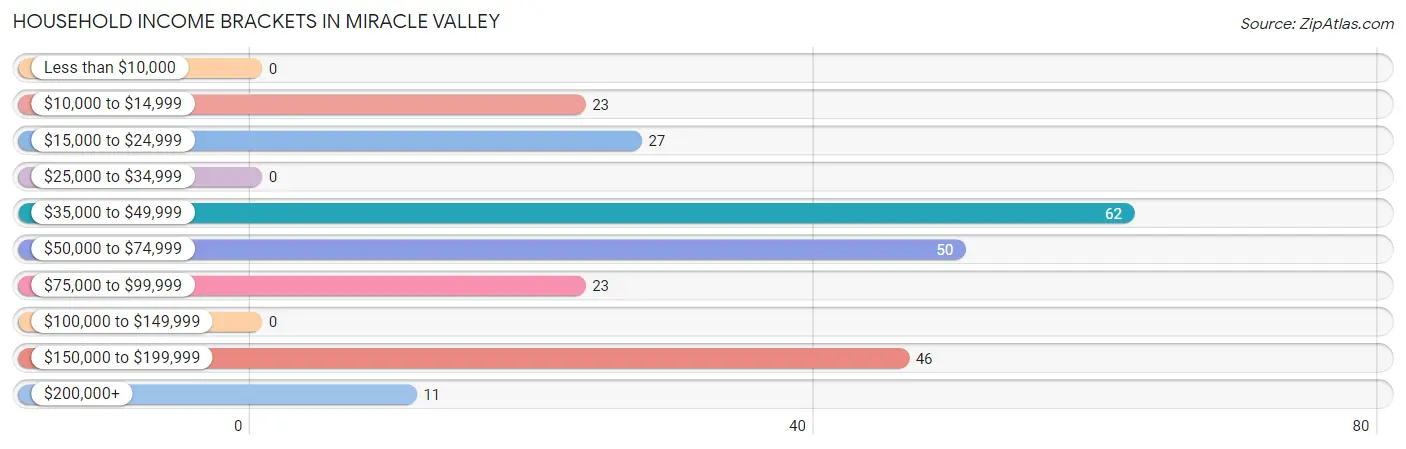
| Income Bracket | # Households | % Households |
| Less than $10,000 | 0 | 0.0% |
| $10,000 to $14,999 | 23 | 9.5% |
| $15,000 to $24,999 | 27 | 11.2% |
| $25,000 to $34,999 | 0 | 0.0% |
| $35,000 to $49,999 | 62 | 25.6% |
| $50,000 to $74,999 | 50 | 20.7% |
| $75,000 to $99,999 | 23 | 9.5% |
| $100,000 to $149,999 | 0 | 0.0% |
| $150,000 to $199,999 | 46 | 19.0% |
| $200,000+ | 11 | 4.5% |
Household Income by Householder Age in Miracle Valley
| Income Bracket | # Households | Median Income |
| 15 to 24 Years | 0 (0.0%) | $0 |
| 25 to 44 Years | 67 (27.7%) | $0 |
| 45 to 64 Years | 14 (5.8%) | $0 |
| 65+ Years | 161 (66.5%) | $0 |
| Total | 242 (100.0%) | $54,107 |
Poverty in Miracle Valley
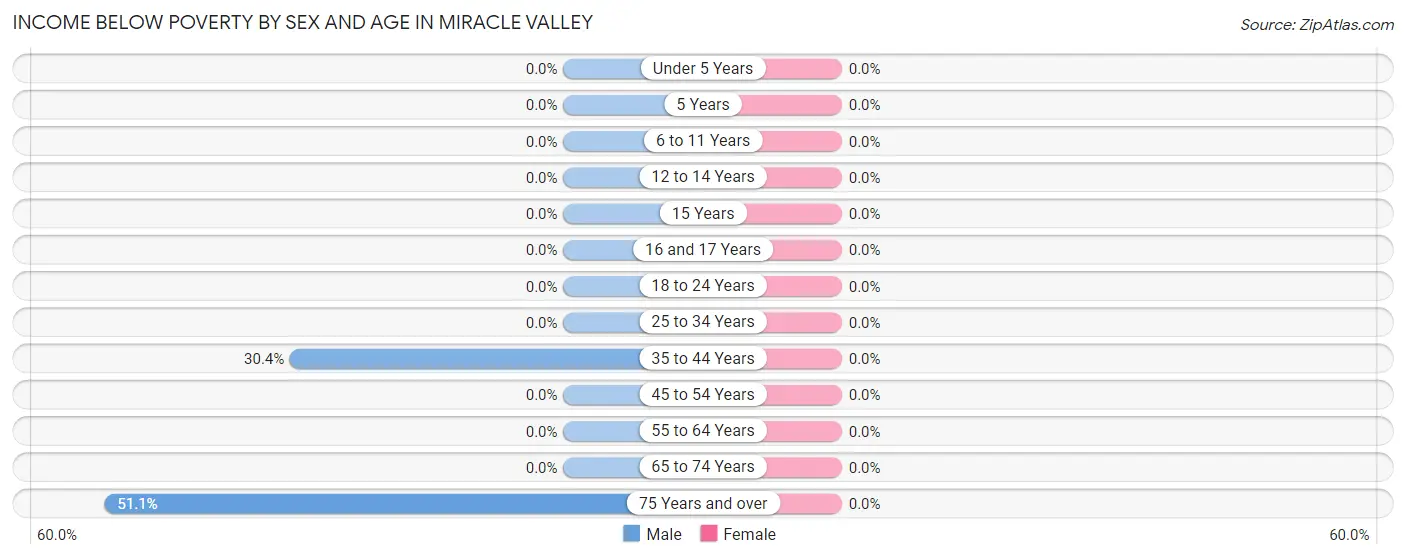
Income Below Poverty by Sex and Age in Miracle Valley
| Age Bracket | Male | Female |
| Under 5 Years | 0 (0.0%) | 0 (0.0%) |
| 5 Years | 0 (0.0%) | 0 (0.0%) |
| 6 to 11 Years | 0 (0.0%) | 0 (0.0%) |
| 12 to 14 Years | 0 (0.0%) | 0 (0.0%) |
| 15 Years | 0 (0.0%) | 0 (0.0%) |
| 16 and 17 Years | 0 (0.0%) | 0 (0.0%) |
| 18 to 24 Years | 0 (0.0%) | 0 (0.0%) |
| 25 to 34 Years | 0 (0.0%) | 0 (0.0%) |
| 35 to 44 Years | 28 (30.4%) | 0 (0.0%) |
| 45 to 54 Years | 0 (0.0%) | 0 (0.0%) |
| 55 to 64 Years | 0 (0.0%) | 0 (0.0%) |
| 65 to 74 Years | 0 (0.0%) | 0 (0.0%) |
| 75 Years and over | 23 (51.1%) | 0 (0.0%) |
| Total | 51 (13.2%) | 0 (0.0%) |
Income Above Poverty by Sex and Age in Miracle Valley
According to the poverty statistics in Miracle Valley, males aged 6 to 11 years and females aged 5 years are the age groups that are most secure financially, with 100.0% of males and 100.0% of females in these age groups living above the poverty line.
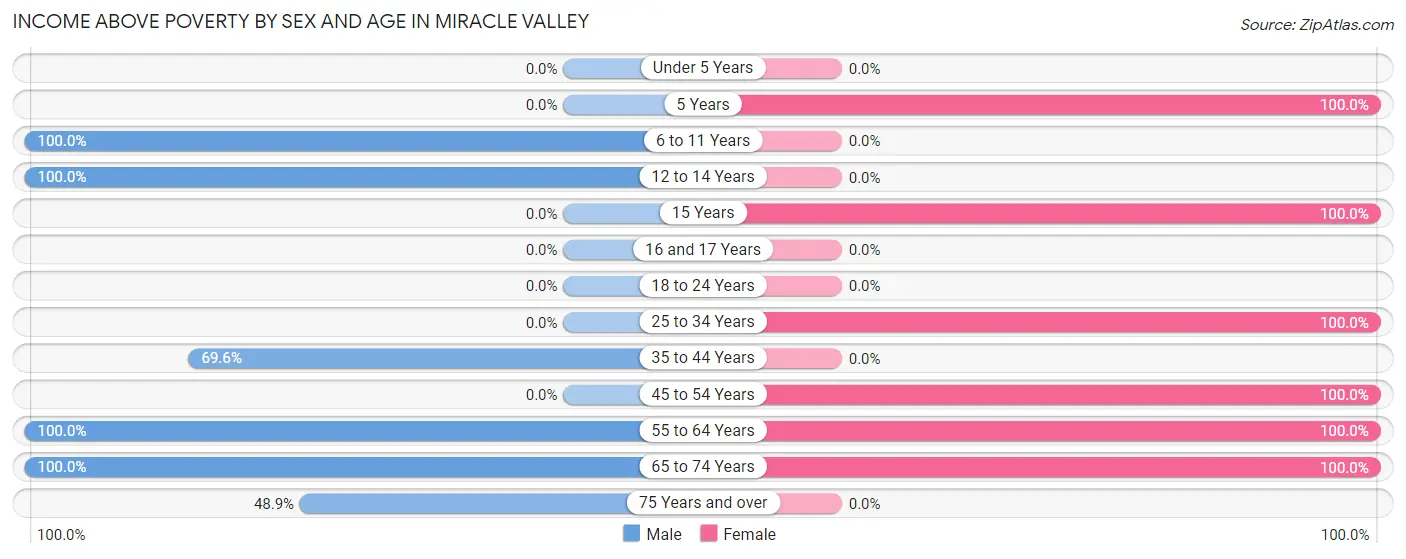
| Age Bracket | Male | Female |
| Under 5 Years | 0 (0.0%) | 0 (0.0%) |
| 5 Years | 0 (0.0%) | 26 (100.0%) |
| 6 to 11 Years | 78 (100.0%) | 0 (0.0%) |
| 12 to 14 Years | 39 (100.0%) | 0 (0.0%) |
| 15 Years | 0 (0.0%) | 37 (100.0%) |
| 16 and 17 Years | 0 (0.0%) | 0 (0.0%) |
| 18 to 24 Years | 0 (0.0%) | 0 (0.0%) |
| 25 to 34 Years | 0 (0.0%) | 27 (100.0%) |
| 35 to 44 Years | 64 (69.6%) | 0 (0.0%) |
| 45 to 54 Years | 0 (0.0%) | 14 (100.0%) |
| 55 to 64 Years | 96 (100.0%) | 101 (100.0%) |
| 65 to 74 Years | 36 (100.0%) | 113 (100.0%) |
| 75 Years and over | 22 (48.9%) | 0 (0.0%) |
| Total | 335 (86.8%) | 318 (100.0%) |
Income Below Poverty Among Married-Couple Families in Miracle Valley
| Children | Above Poverty | Below Poverty |
| No Children | 47 (100.0%) | 0 (0.0%) |
| 1 or 2 Children | 0 (0.0%) | 0 (0.0%) |
| 3 or 4 Children | 0 (0.0%) | 0 (0.0%) |
| 5 or more Children | 0 (0.0%) | 0 (0.0%) |
| Total | 47 (100.0%) | 0 (0.0%) |
Income Below Poverty Among Single-Parent Households in Miracle Valley
| Children | Single Father | Single Mother |
| No Children | 0 (0.0%) | 0 (0.0%) |
| 1 or 2 Children | 0 (0.0%) | 0 (0.0%) |
| 3 or 4 Children | 0 (0.0%) | 0 (0.0%) |
| 5 or more Children | 0 (0.0%) | 0 (0.0%) |
| Total | 0 (0.0%) | 0 (0.0%) |
Income Below Poverty Among Married-Couple vs Single-Parent Households in Miracle Valley
| Children | Married-Couple Families | Single-Parent Households |
| No Children | 0 (0.0%) | 0 (0.0%) |
| 1 or 2 Children | 0 (0.0%) | 0 (0.0%) |
| 3 or 4 Children | 0 (0.0%) | 0 (0.0%) |
| 5 or more Children | 0 (0.0%) | 0 (0.0%) |
| Total | 0 (0.0%) | 0 (0.0%) |
Race in Miracle Valley
The most populous races in Miracle Valley are White / Caucasian (684 | 97.2%), Some other Race (20 | 2.8%), and Hispanic or Latino (12 | 1.7%).
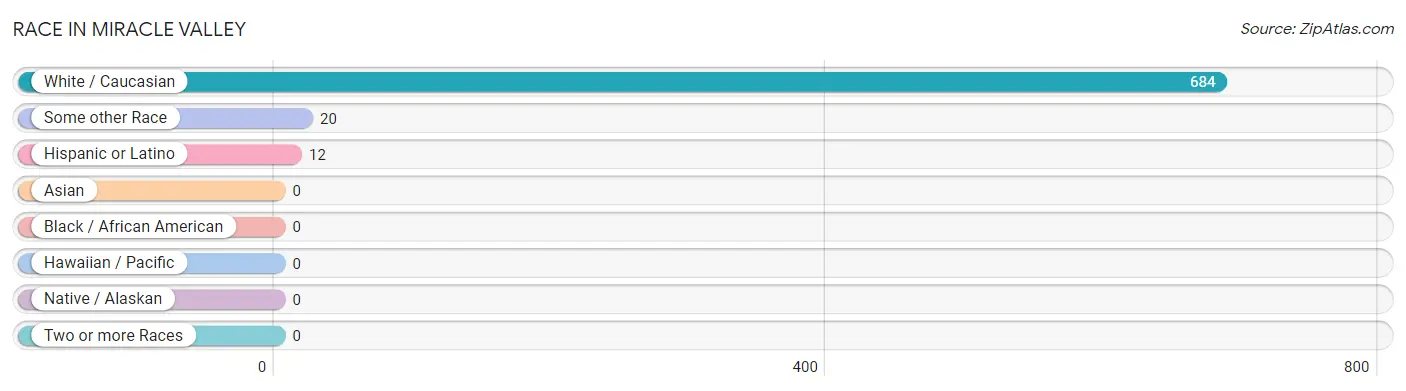
| Race | # Population | % Population |
| Asian | 0 | 0.0% |
| Black / African American | 0 | 0.0% |
| Hawaiian / Pacific | 0 | 0.0% |
| Hispanic or Latino | 12 | 1.7% |
| Native / Alaskan | 0 | 0.0% |
| White / Caucasian | 684 | 97.2% |
| Two or more Races | 0 | 0.0% |
| Some other Race | 20 | 2.8% |
| Total | 704 | 100.0% |
Ancestry in Miracle Valley
The most populous ancestries reported in Miracle Valley are Irish (163 | 23.2%), English (114 | 16.2%), Croatian (41 | 5.8%), Polish (41 | 5.8%), and Greek (40 | 5.7%), together accounting for 56.7% of all Miracle Valley residents.

| Ancestry | # Population | % Population |
| American | 22 | 3.1% |
| Central American | 12 | 1.7% |
| Croatian | 41 | 5.8% |
| English | 114 | 16.2% |
| French | 22 | 3.1% |
| German | 36 | 5.1% |
| Greek | 40 | 5.7% |
| Irish | 163 | 23.2% |
| Panamanian | 12 | 1.7% |
| Polish | 41 | 5.8% | View All 10 Rows |
Immigrants in Miracle Valley
The most numerous immigrant groups reported in Miracle Valley came from Central America (12 | 1.7%), Latin America (12 | 1.7%), and Panama (12 | 1.7%), together accounting for 5.1% of all Miracle Valley residents.
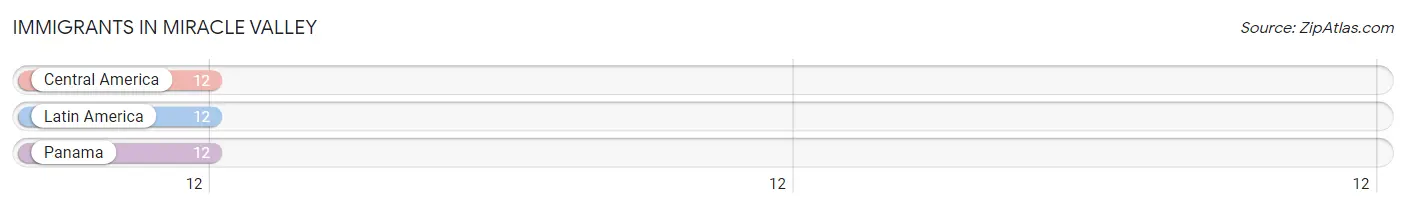
| Immigration Origin | # Population | % Population |
| Central America | 12 | 1.7% |
| Latin America | 12 | 1.7% |
| Panama | 12 | 1.7% | View All 3 Rows |
Sex and Age in Miracle Valley
Sex and Age in Miracle Valley
The most populous age groups in Miracle Valley are 40 to 44 Years (84 | 21.8%) for men and 60 to 64 Years (101 | 31.8%) for women.
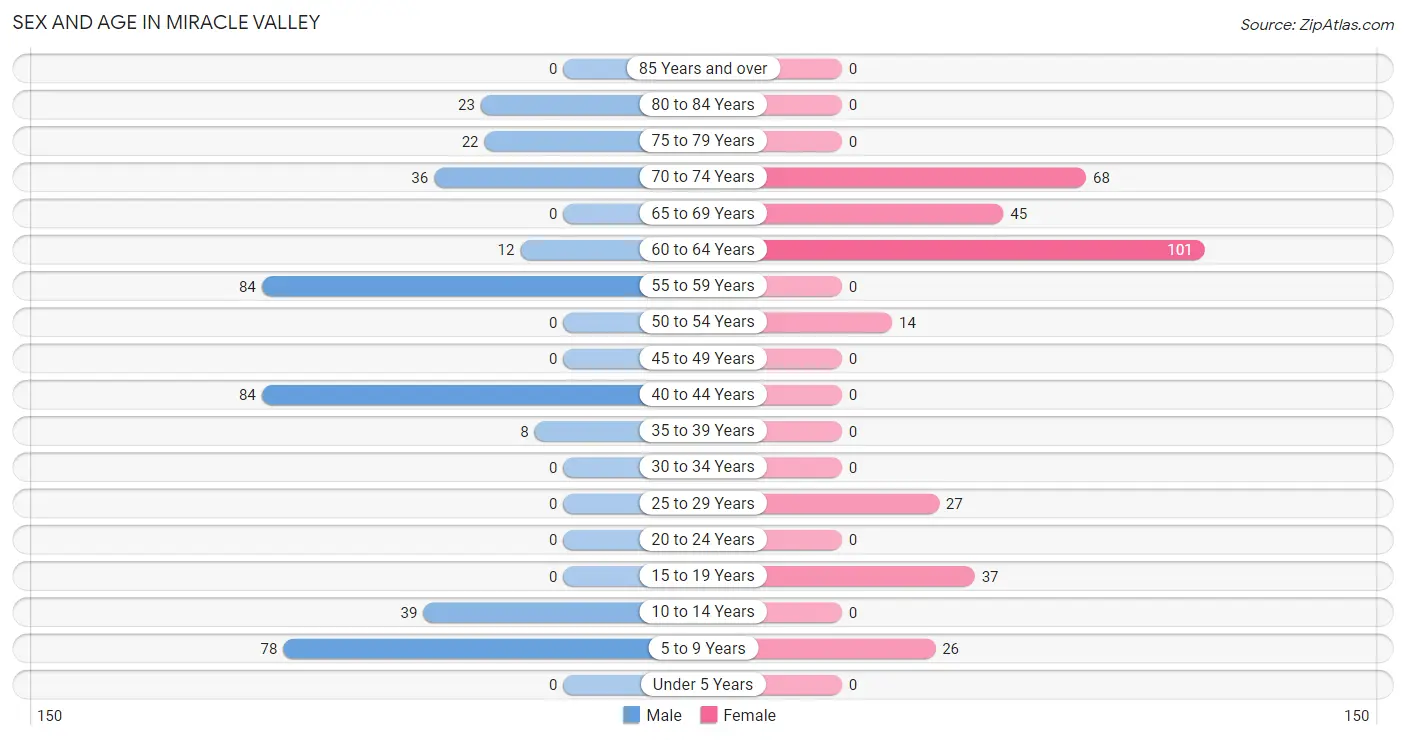
| Age Bracket | Male | Female |
| Under 5 Years | 0 (0.0%) | 0 (0.0%) |
| 5 to 9 Years | 78 (20.2%) | 26 (8.2%) |
| 10 to 14 Years | 39 (10.1%) | 0 (0.0%) |
| 15 to 19 Years | 0 (0.0%) | 37 (11.6%) |
| 20 to 24 Years | 0 (0.0%) | 0 (0.0%) |
| 25 to 29 Years | 0 (0.0%) | 27 (8.5%) |
| 30 to 34 Years | 0 (0.0%) | 0 (0.0%) |
| 35 to 39 Years | 8 (2.1%) | 0 (0.0%) |
| 40 to 44 Years | 84 (21.8%) | 0 (0.0%) |
| 45 to 49 Years | 0 (0.0%) | 0 (0.0%) |
| 50 to 54 Years | 0 (0.0%) | 14 (4.4%) |
| 55 to 59 Years | 84 (21.8%) | 0 (0.0%) |
| 60 to 64 Years | 12 (3.1%) | 101 (31.8%) |
| 65 to 69 Years | 0 (0.0%) | 45 (14.1%) |
| 70 to 74 Years | 36 (9.3%) | 68 (21.4%) |
| 75 to 79 Years | 22 (5.7%) | 0 (0.0%) |
| 80 to 84 Years | 23 (6.0%) | 0 (0.0%) |
| 85 Years and over | 0 (0.0%) | 0 (0.0%) |
| Total | 386 (100.0%) | 318 (100.0%) |
Families and Households in Miracle Valley
Median Family Size in Miracle Valley
The median family size in Miracle Valley is 2.90 persons per family, with single male/father families (40 | 21.9%) accounting for the largest median family size of 4.85 persons per family. On the other hand, married-couple families (47 | 25.7%) represent the smallest median family size with 1.96 persons per family.
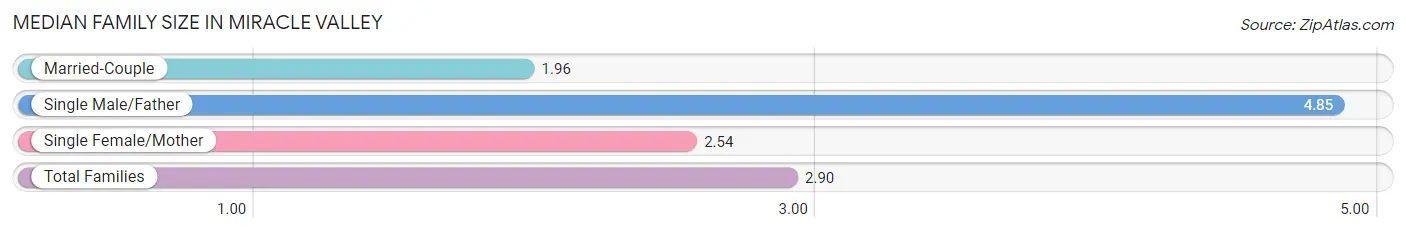
| Family Type | # Families | Family Size |
| Married-Couple | 47 (25.7%) | 1.96 |
| Single Male/Father | 40 (21.9%) | 4.85 |
| Single Female/Mother | 96 (52.5%) | 2.54 |
| Total Families | 183 (100.0%) | 2.90 |
Median Household Size in Miracle Valley
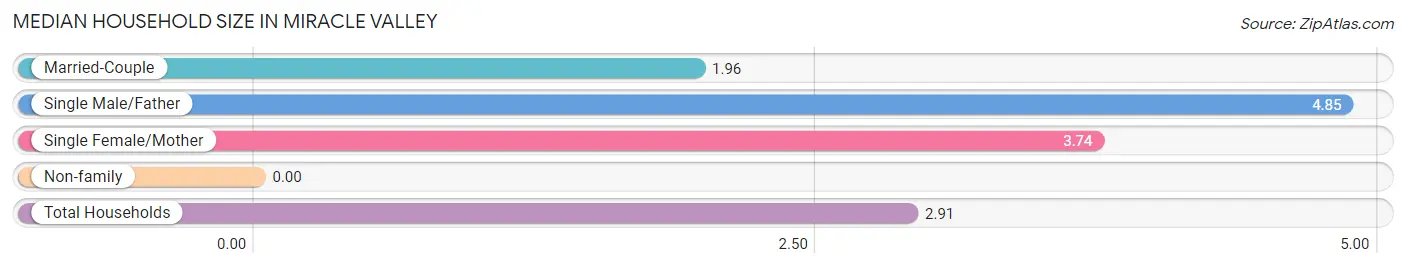
| Household Type | # Households | Household Size |
| Married-Couple | 47 (19.4%) | 1.96 |
| Single Male/Father | 40 (16.5%) | 4.85 |
| Single Female/Mother | 96 (39.7%) | 3.74 |
| Non-family | 59 (24.4%) | - |
| Total Households | 242 (100.0%) | 2.91 |
Household Size by Marriage Status in Miracle Valley
Out of a total of 242 households in Miracle Valley, 183 (75.6%) are family households, while 59 (24.4%) are nonfamily households. The most numerous type of family households are 3-person households, comprising 84, and the most common type of nonfamily households are 1-person households, comprising 59.
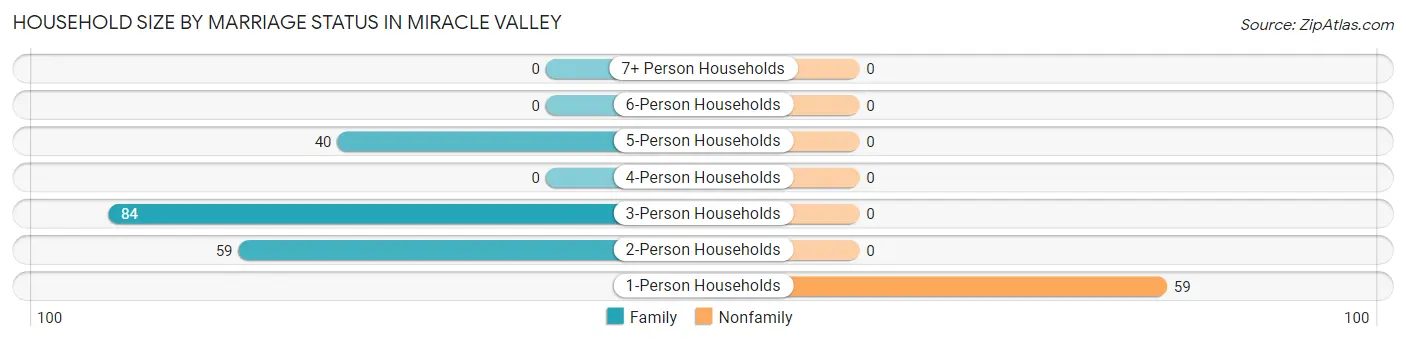
| Household Size | Family Households | Nonfamily Households |
| 1-Person Households | - | 59 (24.4%) |
| 2-Person Households | 59 (24.4%) | 0 (0.0%) |
| 3-Person Households | 84 (34.7%) | 0 (0.0%) |
| 4-Person Households | 0 (0.0%) | 0 (0.0%) |
| 5-Person Households | 40 (16.5%) | 0 (0.0%) |
| 6-Person Households | 0 (0.0%) | 0 (0.0%) |
| 7+ Person Households | 0 (0.0%) | 0 (0.0%) |
| Total | 183 (75.6%) | 59 (24.4%) |
Female Fertility in Miracle Valley
Fertility by Age in Miracle Valley
| Age Bracket | Women with Births | Births / 1,000 Women |
| 15 to 19 years | 0 (0.0%) | 0.0 |
| 20 to 34 years | 0 (0.0%) | 0.0 |
| 35 to 50 years | 0 (0.0%) | 0.0 |
| Total | 0 (0.0%) | 0.0 |
Fertility by Age by Marriage Status in Miracle Valley
| Age Bracket | Married | Unmarried |
| 15 to 19 years | 0 (0.0%) | 0 (0.0%) |
| 20 to 34 years | 0 (0.0%) | 0 (0.0%) |
| 35 to 50 years | 0 (0.0%) | 0 (0.0%) |
| Total | 0 (0.0%) | 0 (0.0%) |
Fertility by Education in Miracle Valley
| Educational Attainment | Women with Births | Births / 1,000 Women |
| Less than High School | 0 (0.0%) | 0.0 |
| High School Diploma | 0 (0.0%) | 0.0 |
| College or Associate's Degree | 0 (0.0%) | 0.0 |
| Bachelor's Degree | 0 (0.0%) | 0.0 |
| Graduate Degree | 0 (0.0%) | 0.0 |
| Total | 0 (0.0%) | 0.0 |
Fertility by Education by Marriage Status in Miracle Valley
| Educational Attainment | Married | Unmarried |
| Less than High School | 0 (0.0%) | 0 (0.0%) |
| High School Diploma | 0 (0.0%) | 0 (0.0%) |
| College or Associate's Degree | 0 (0.0%) | 0 (0.0%) |
| Bachelor's Degree | 0 (0.0%) | 0 (0.0%) |
| Graduate Degree | 0 (0.0%) | 0 (0.0%) |
| Total | 0 (0.0%) | 0 (0.0%) |
Employment Characteristics in Miracle Valley
Employment by Class of Employer in Miracle Valley
Among the 246 employed individuals in Miracle Valley, private company employees (167 | 67.9%), not-for-profit organizations (46 | 18.7%), and local government employees (19 | 7.7%) make up the most common classes of employment.
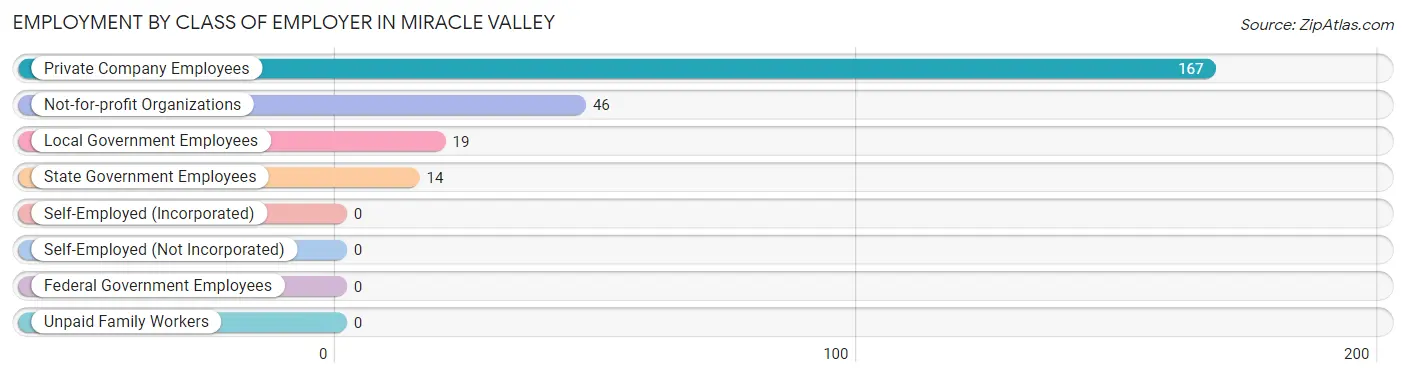
| Employer Class | # Employees | % Employees |
| Private Company Employees | 167 | 67.9% |
| Self-Employed (Incorporated) | 0 | 0.0% |
| Self-Employed (Not Incorporated) | 0 | 0.0% |
| Not-for-profit Organizations | 46 | 18.7% |
| Local Government Employees | 19 | 7.7% |
| State Government Employees | 14 | 5.7% |
| Federal Government Employees | 0 | 0.0% |
| Unpaid Family Workers | 0 | 0.0% |
| Total | 246 | 100.0% |
Employment Status by Age in Miracle Valley
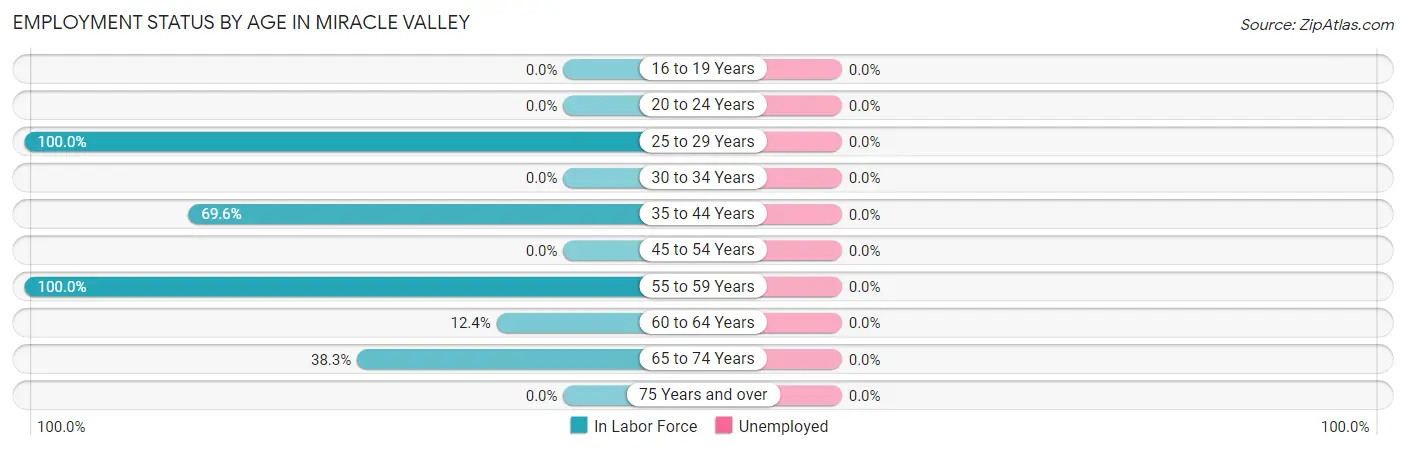
| Age Bracket | In Labor Force | Unemployed |
| 16 to 19 Years | 0 (0.0%) | 0 (0.0%) |
| 20 to 24 Years | 0 (0.0%) | 0 (0.0%) |
| 25 to 29 Years | 27 (100.0%) | 0 (0.0%) |
| 30 to 34 Years | 0 (0.0%) | 0 (0.0%) |
| 35 to 44 Years | 64 (69.6%) | 0 (0.0%) |
| 45 to 54 Years | 0 (0.0%) | 0 (0.0%) |
| 55 to 59 Years | 84 (100.0%) | 0 (0.0%) |
| 60 to 64 Years | 14 (12.4%) | 0 (0.0%) |
| 65 to 74 Years | 57 (38.3%) | 0 (0.0%) |
| 75 Years and over | 0 (0.0%) | 0 (0.0%) |
| Total | 246 (46.9%) | 0 (0.0%) |
Employment Status by Educational Attainment in Miracle Valley
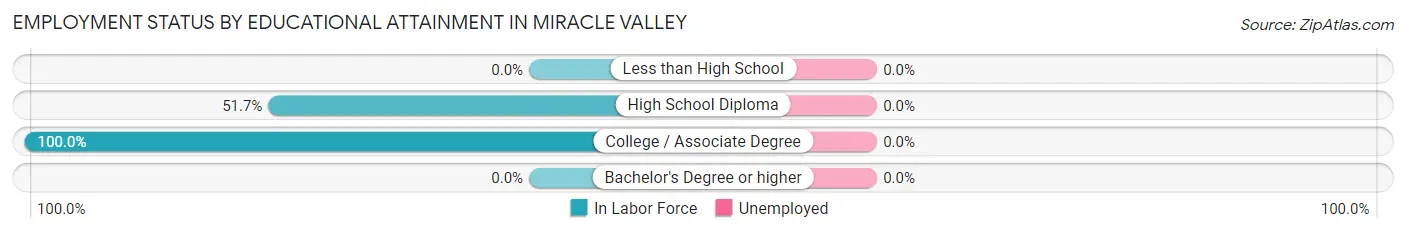
| Educational Attainment | In Labor Force | Unemployed |
| Less than High School | 0 (0.0%) | 0 (0.0%) |
| High School Diploma | 30 (51.7%) | 0 (0.0%) |
| College / Associate Degree | 159 (100.0%) | 0 (0.0%) |
| Bachelor's Degree or higher | 0 (0.0%) | 0 (0.0%) |
| Total | 189 (57.3%) | 0 (0.0%) |
Employment Occupations by Sex in Miracle Valley
Management, Business, Science and Arts Occupations
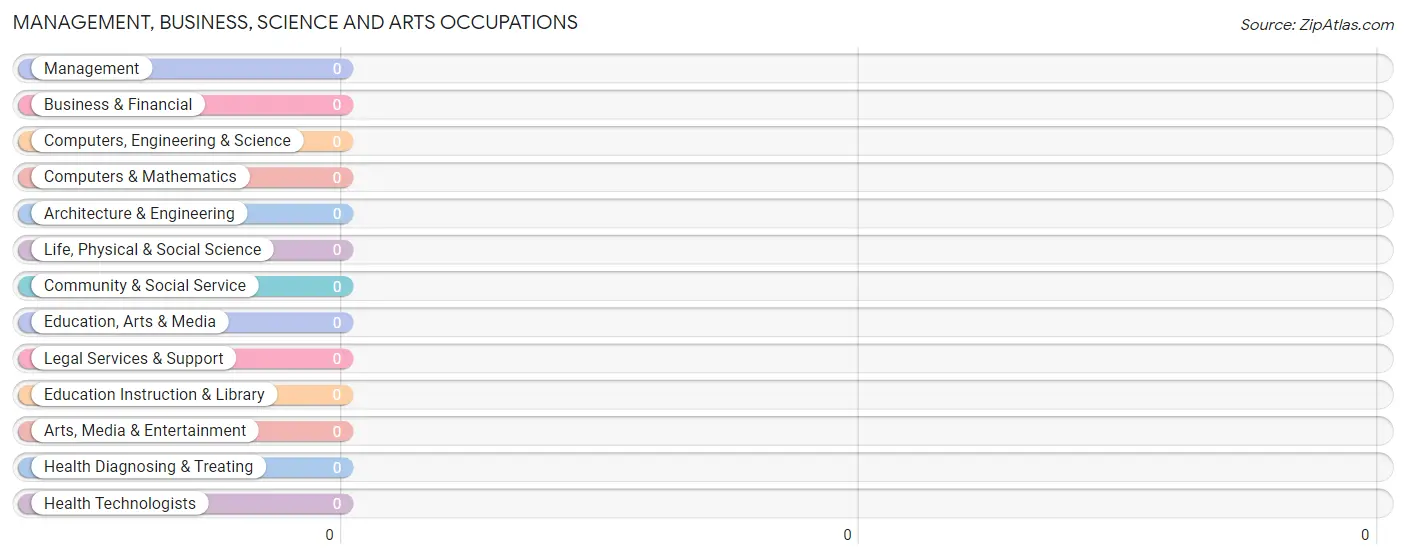
Management, Business, Science and Arts Occupations by Sex
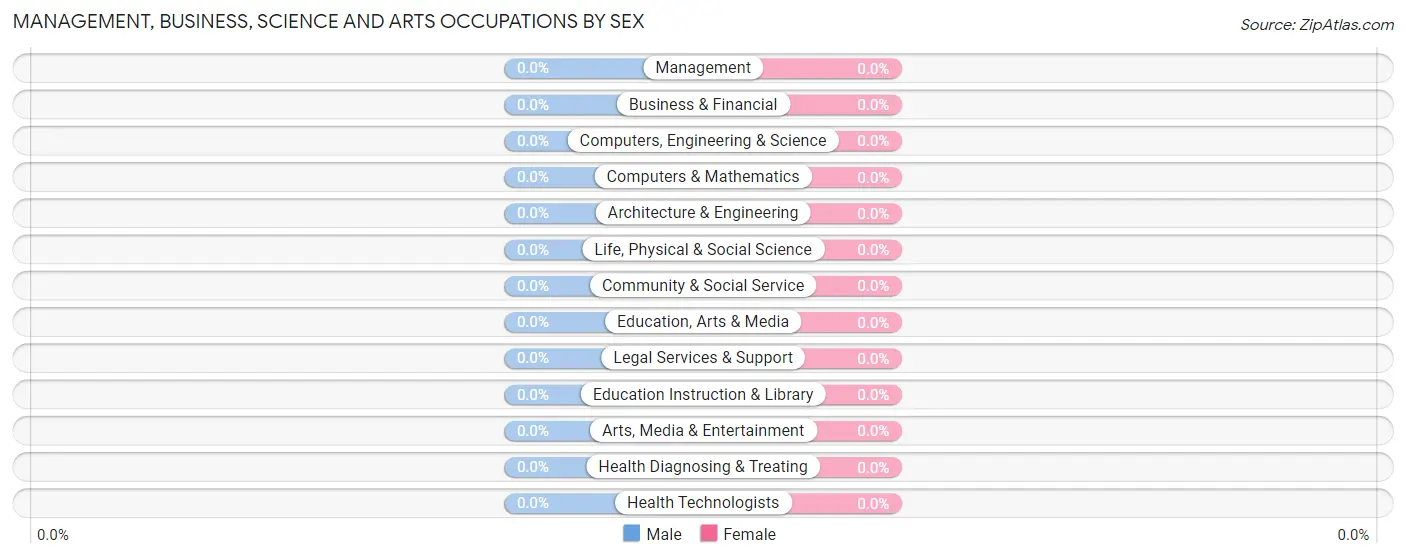
| Occupation | Male | Female |
| Management | 0 (0.0%) | 0 (0.0%) |
| Business & Financial | 0 (0.0%) | 0 (0.0%) |
| Computers, Engineering & Science | 0 (0.0%) | 0 (0.0%) |
| Computers & Mathematics | 0 (0.0%) | 0 (0.0%) |
| Architecture & Engineering | 0 (0.0%) | 0 (0.0%) |
| Life, Physical & Social Science | 0 (0.0%) | 0 (0.0%) |
| Community & Social Service | 0 (0.0%) | 0 (0.0%) |
| Education, Arts & Media | 0 (0.0%) | 0 (0.0%) |
| Legal Services & Support | 0 (0.0%) | 0 (0.0%) |
| Education Instruction & Library | 0 (0.0%) | 0 (0.0%) |
| Arts, Media & Entertainment | 0 (0.0%) | 0 (0.0%) |
| Health Diagnosing & Treating | 0 (0.0%) | 0 (0.0%) |
| Health Technologists | 0 (0.0%) | 0 (0.0%) |
| Total (Category) | 0 (0.0%) | 0 (0.0%) |
| Total (Overall) | 148 (60.2%) | 98 (39.8%) |
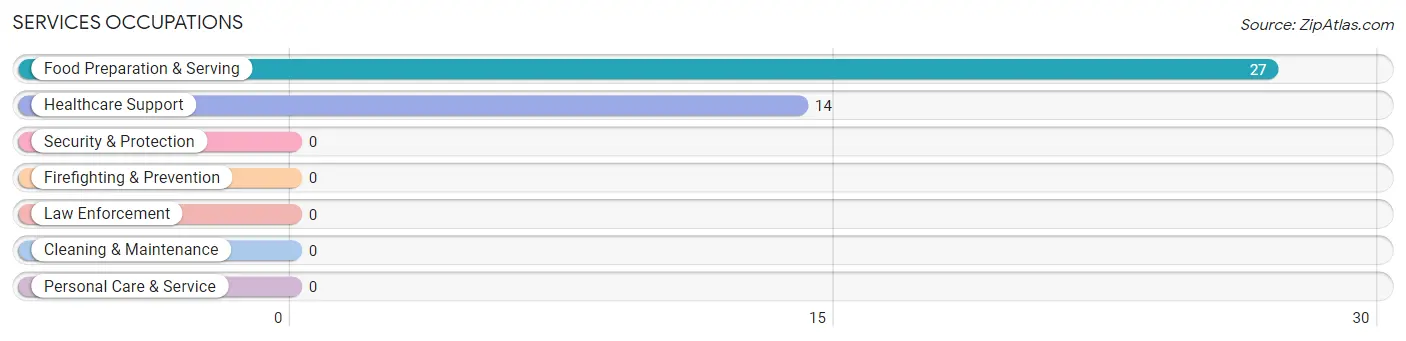
Services Occupations
The most common Services occupations in Miracle Valley are Food Preparation & Serving (27 | 11.0%), and Healthcare Support (14 | 5.7%).
Services Occupations by Sex
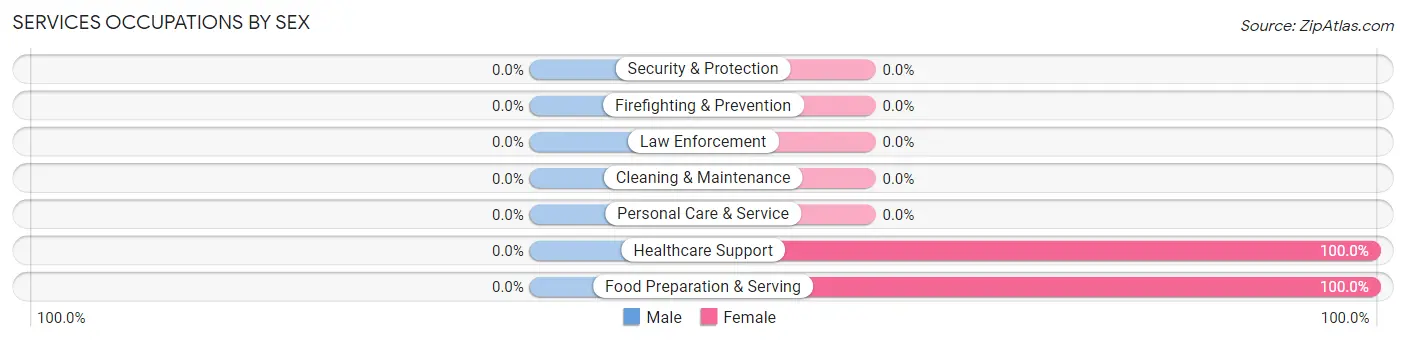
| Occupation | Male | Female |
| Healthcare Support | 0 (0.0%) | 14 (100.0%) |
| Security & Protection | 0 (0.0%) | 0 (0.0%) |
| Firefighting & Prevention | 0 (0.0%) | 0 (0.0%) |
| Law Enforcement | 0 (0.0%) | 0 (0.0%) |
| Food Preparation & Serving | 0 (0.0%) | 27 (100.0%) |
| Cleaning & Maintenance | 0 (0.0%) | 0 (0.0%) |
| Personal Care & Service | 0 (0.0%) | 0 (0.0%) |
| Total (Category) | 0 (0.0%) | 41 (100.0%) |
| Total (Overall) | 148 (60.2%) | 98 (39.8%) |
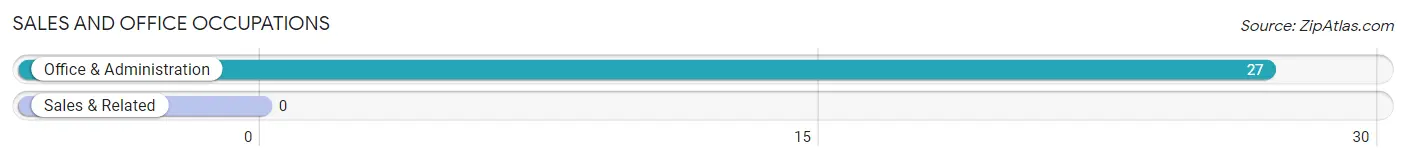
Sales and Office Occupations
The most common Sales and Office occupations in Miracle Valley are , and Office & Administration (27 | 11.0%).
Sales and Office Occupations by Sex
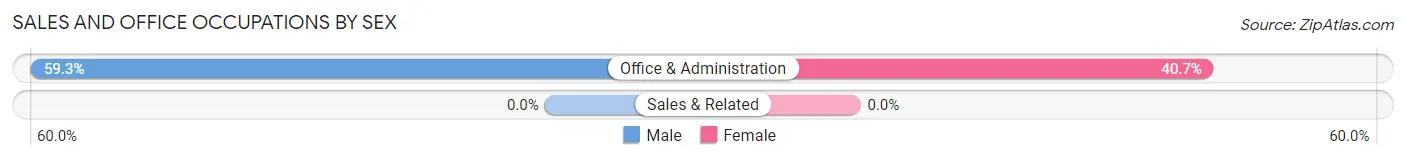
| Occupation | Male | Female |
| Sales & Related | 0 (0.0%) | 0 (0.0%) |
| Office & Administration | 16 (59.3%) | 11 (40.7%) |
| Total (Category) | 16 (59.3%) | 11 (40.7%) |
| Total (Overall) | 148 (60.2%) | 98 (39.8%) |
Natural Resources, Construction and Maintenance Occupations
The most common Natural Resources, Construction and Maintenance occupations in Miracle Valley are Construction & Extraction (40 | 16.3%), and Installation, Maintenance & Repair (8 | 3.3%).
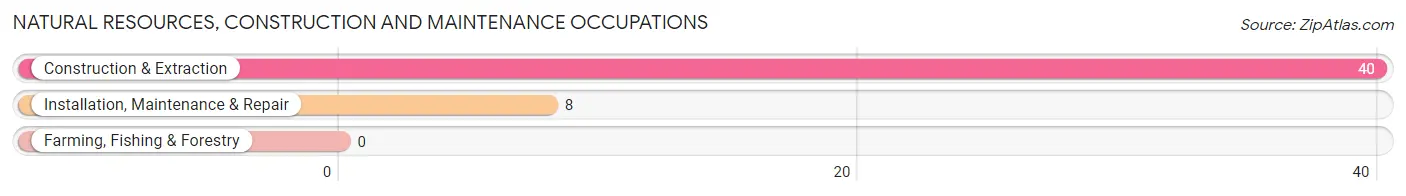
Natural Resources, Construction and Maintenance Occupations by Sex
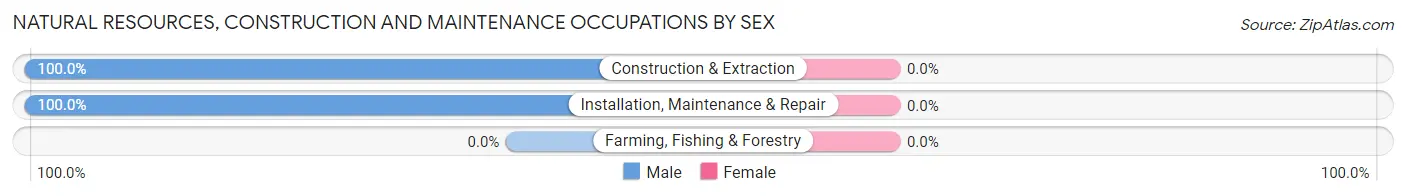
| Occupation | Male | Female |
| Farming, Fishing & Forestry | 0 (0.0%) | 0 (0.0%) |
| Construction & Extraction | 40 (100.0%) | 0 (0.0%) |
| Installation, Maintenance & Repair | 8 (100.0%) | 0 (0.0%) |
| Total (Category) | 48 (100.0%) | 0 (0.0%) |
| Total (Overall) | 148 (60.2%) | 98 (39.8%) |
Production, Transportation and Moving Occupations
The most common Production, Transportation and Moving occupations in Miracle Valley are Production (84 | 34.2%), and Transportation (46 | 18.7%).
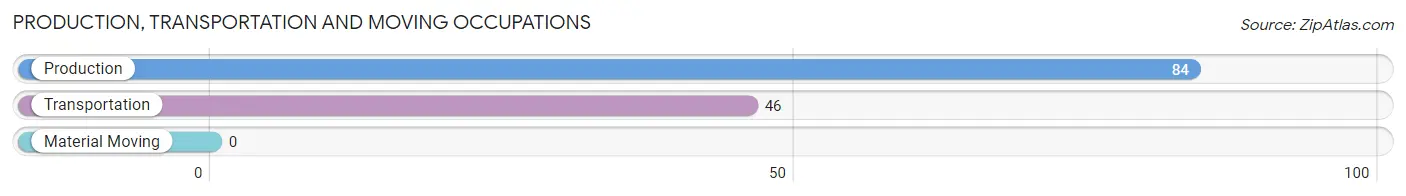
Production, Transportation and Moving Occupations by Sex
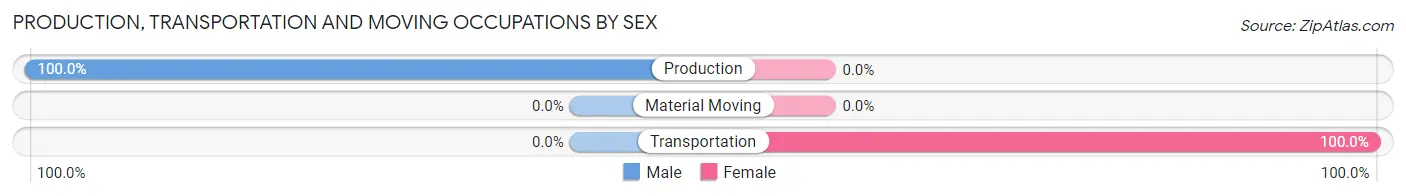
| Occupation | Male | Female |
| Production | 84 (100.0%) | 0 (0.0%) |
| Transportation | 0 (0.0%) | 46 (100.0%) |
| Material Moving | 0 (0.0%) | 0 (0.0%) |
| Total (Category) | 84 (64.6%) | 46 (35.4%) |
| Total (Overall) | 148 (60.2%) | 98 (39.8%) |
Employment Industries by Sex in Miracle Valley
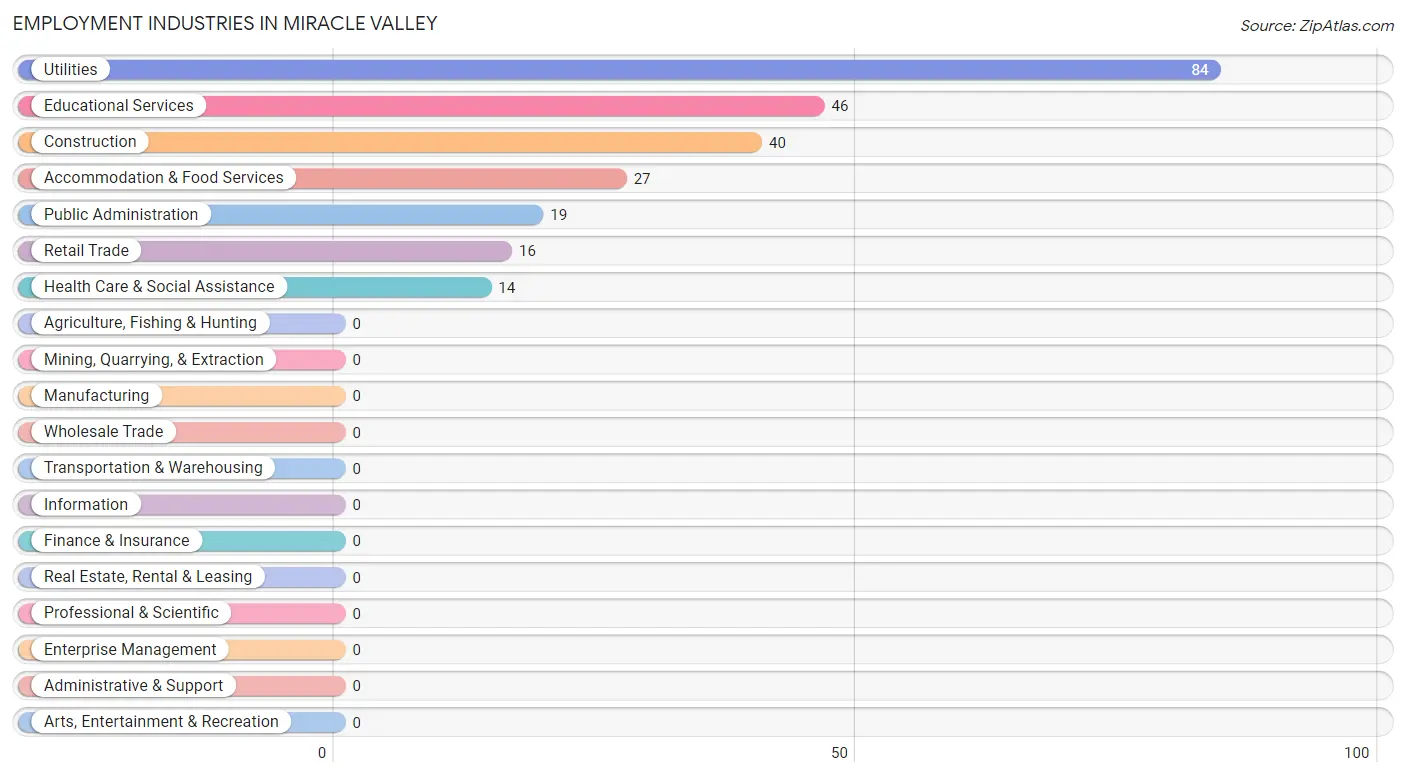
Employment Industries in Miracle Valley
The major employment industries in Miracle Valley include Utilities (84 | 34.2%), Educational Services (46 | 18.7%), Construction (40 | 16.3%), Accommodation & Food Services (27 | 11.0%), and Public Administration (19 | 7.7%).
Employment Industries by Sex in Miracle Valley
The Miracle Valley industries that see more men than women are Construction (100.0%), Retail Trade (100.0%), and Utilities (100.0%), whereas the industries that tend to have a higher number of women are Educational Services (100.0%), Health Care & Social Assistance (100.0%), and Accommodation & Food Services (100.0%).
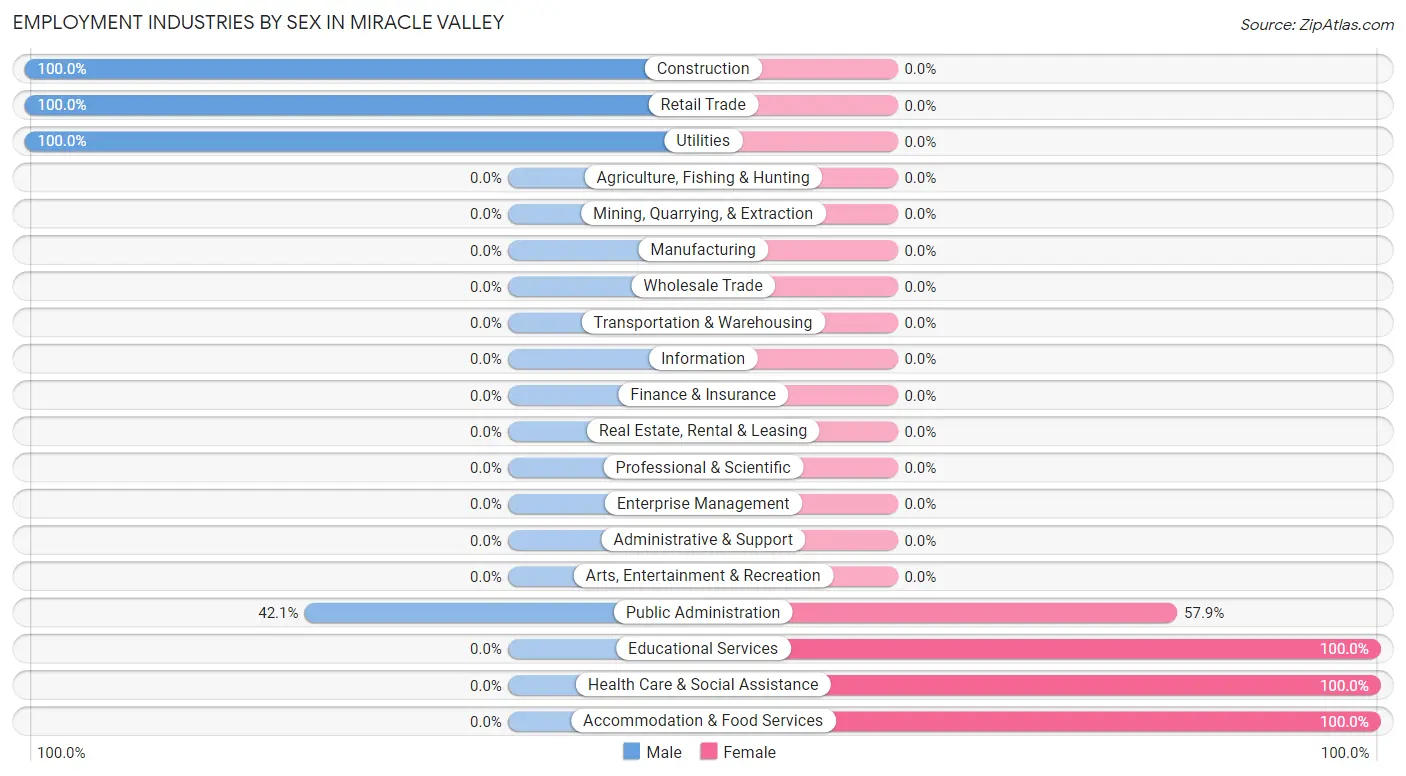
| Industry | Male | Female |
| Agriculture, Fishing & Hunting | 0 (0.0%) | 0 (0.0%) |
| Mining, Quarrying, & Extraction | 0 (0.0%) | 0 (0.0%) |
| Construction | 40 (100.0%) | 0 (0.0%) |
| Manufacturing | 0 (0.0%) | 0 (0.0%) |
| Wholesale Trade | 0 (0.0%) | 0 (0.0%) |
| Retail Trade | 16 (100.0%) | 0 (0.0%) |
| Transportation & Warehousing | 0 (0.0%) | 0 (0.0%) |
| Utilities | 84 (100.0%) | 0 (0.0%) |
| Information | 0 (0.0%) | 0 (0.0%) |
| Finance & Insurance | 0 (0.0%) | 0 (0.0%) |
| Real Estate, Rental & Leasing | 0 (0.0%) | 0 (0.0%) |
| Professional & Scientific | 0 (0.0%) | 0 (0.0%) |
| Enterprise Management | 0 (0.0%) | 0 (0.0%) |
| Administrative & Support | 0 (0.0%) | 0 (0.0%) |
| Educational Services | 0 (0.0%) | 46 (100.0%) |
| Health Care & Social Assistance | 0 (0.0%) | 14 (100.0%) |
| Arts, Entertainment & Recreation | 0 (0.0%) | 0 (0.0%) |
| Accommodation & Food Services | 0 (0.0%) | 27 (100.0%) |
| Public Administration | 8 (42.1%) | 11 (57.9%) |
| Total | 148 (60.2%) | 98 (39.8%) |
Education in Miracle Valley
School Enrollment in Miracle Valley
The most common levels of schooling among the 215 students in Miracle Valley are elementary school (78 | 36.3%), high school (76 | 35.3%), and college / undergraduate (35 | 16.3%).
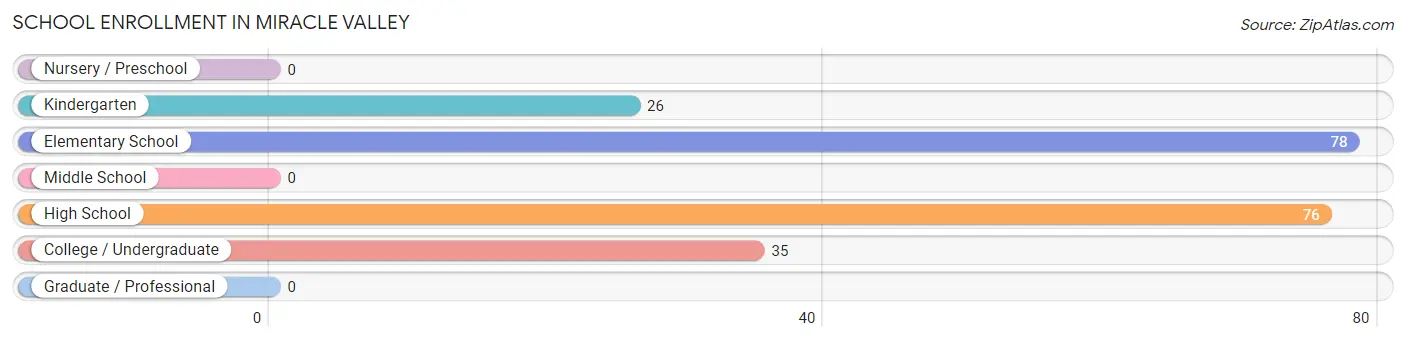
| School Level | # Students | % Students |
| Nursery / Preschool | 0 | 0.0% |
| Kindergarten | 26 | 12.1% |
| Elementary School | 78 | 36.3% |
| Middle School | 0 | 0.0% |
| High School | 76 | 35.3% |
| College / Undergraduate | 35 | 16.3% |
| Graduate / Professional | 0 | 0.0% |
| Total | 215 | 100.0% |
School Enrollment by Age by Funding Source in Miracle Valley
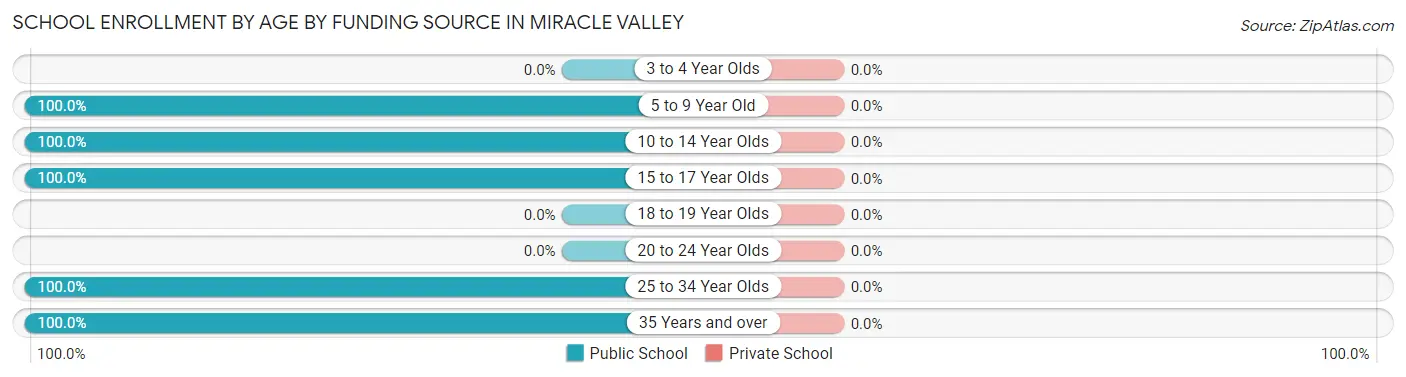
| Age Bracket | Public School | Private School |
| 3 to 4 Year Olds | 0 (0.0%) | 0 (0.0%) |
| 5 to 9 Year Old | 104 (100.0%) | 0 (0.0%) |
| 10 to 14 Year Olds | 39 (100.0%) | 0 (0.0%) |
| 15 to 17 Year Olds | 37 (100.0%) | 0 (0.0%) |
| 18 to 19 Year Olds | 0 (0.0%) | 0 (0.0%) |
| 20 to 24 Year Olds | 0 (0.0%) | 0 (0.0%) |
| 25 to 34 Year Olds | 27 (100.0%) | 0 (0.0%) |
| 35 Years and over | 8 (100.0%) | 0 (0.0%) |
| Total | 215 (100.0%) | 0 (0.0%) |
Educational Attainment by Field of Study in Miracle Valley
Education (87 | 56.1%), business (46 | 29.7%), and social sciences (22 | 14.2%) are the most common fields of study among 155 individuals in Miracle Valley who have obtained a bachelor's degree or higher.
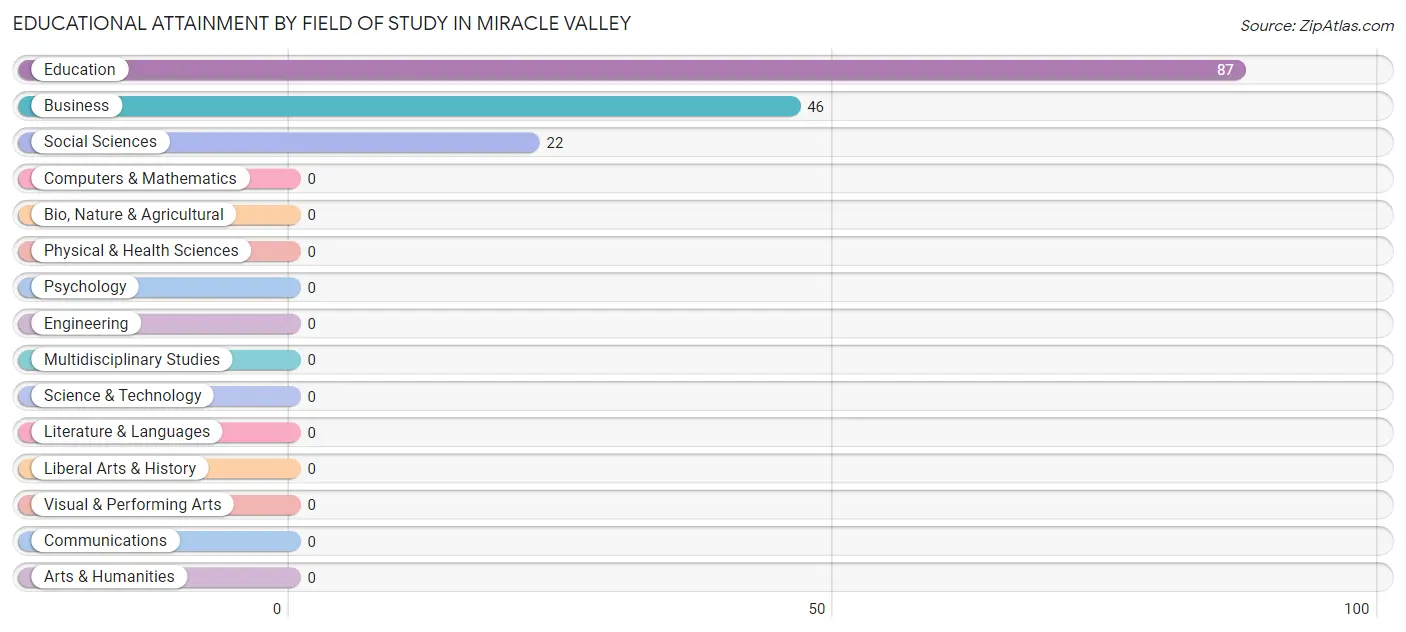
| Field of Study | # Graduates | % Graduates |
| Computers & Mathematics | 0 | 0.0% |
| Bio, Nature & Agricultural | 0 | 0.0% |
| Physical & Health Sciences | 0 | 0.0% |
| Psychology | 0 | 0.0% |
| Social Sciences | 22 | 14.2% |
| Engineering | 0 | 0.0% |
| Multidisciplinary Studies | 0 | 0.0% |
| Science & Technology | 0 | 0.0% |
| Business | 46 | 29.7% |
| Education | 87 | 56.1% |
| Literature & Languages | 0 | 0.0% |
| Liberal Arts & History | 0 | 0.0% |
| Visual & Performing Arts | 0 | 0.0% |
| Communications | 0 | 0.0% |
| Arts & Humanities | 0 | 0.0% |
| Total | 155 | 100.0% |
Transportation & Commute in Miracle Valley
Vehicle Availability by Sex in Miracle Valley
The most prevalent vehicle ownership categories in Miracle Valley are males with 5 or more vehicles (84, accounting for 56.8%) and females with 5 or more vehicles (46, making up 85.7%).
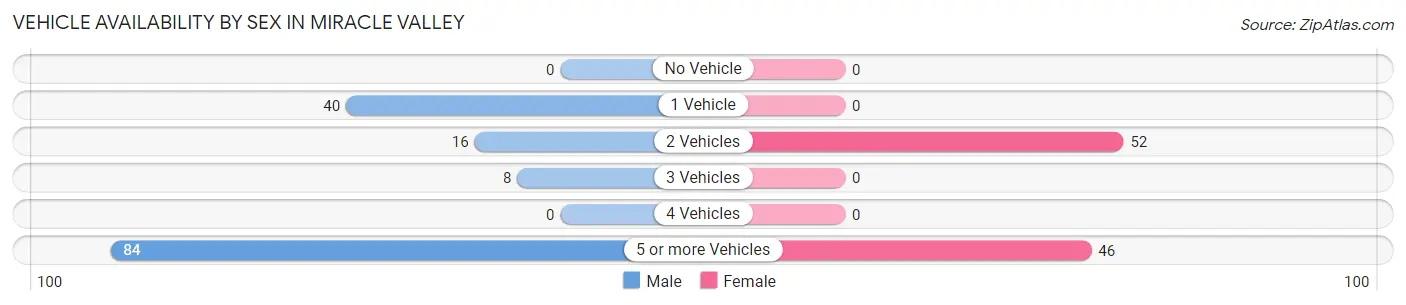
| Vehicles Available | Male | Female |
| No Vehicle | 0 (0.0%) | 0 (0.0%) |
| 1 Vehicle | 40 (27.0%) | 0 (0.0%) |
| 2 Vehicles | 16 (10.8%) | 52 (53.1%) |
| 3 Vehicles | 8 (5.4%) | 0 (0.0%) |
| 4 Vehicles | 0 (0.0%) | 0 (0.0%) |
| 5 or more Vehicles | 84 (56.8%) | 46 (46.9%) |
| Total | 148 (100.0%) | 98 (100.0%) |
Commute Time in Miracle Valley
The most frequently occuring commute durations in Miracle Valley are 20 to 24 minutes (95 commuters, 38.6%), 30 to 34 minutes (57 commuters, 23.2%), and 25 to 29 minutes (46 commuters, 18.7%).
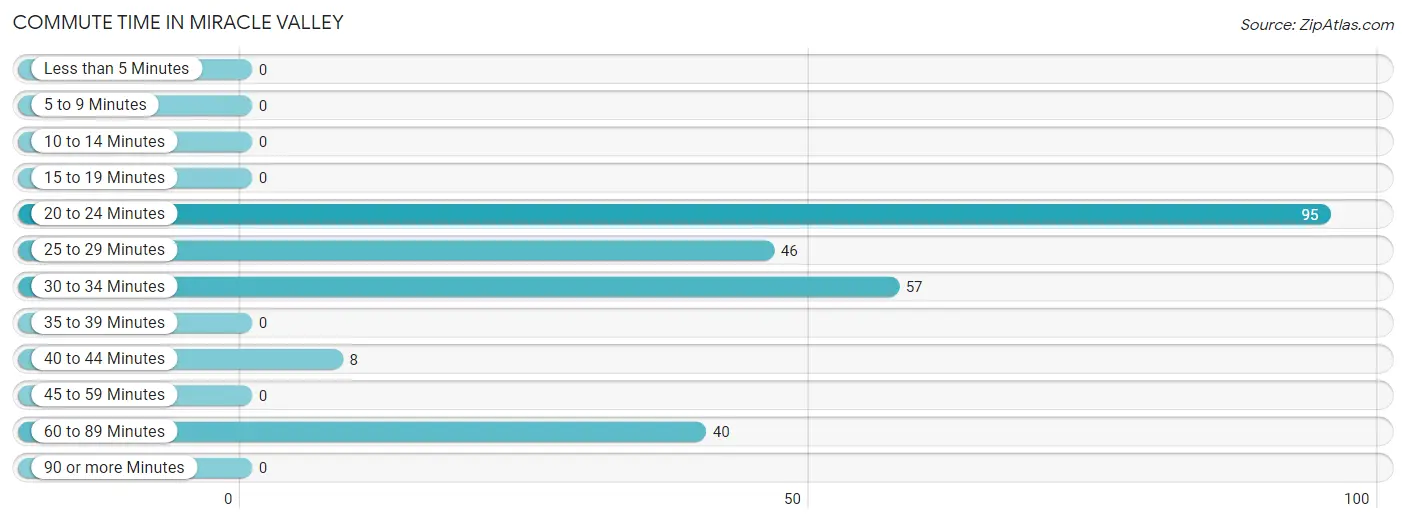
| Commute Time | # Commuters | % Commuters |
| Less than 5 Minutes | 0 | 0.0% |
| 5 to 9 Minutes | 0 | 0.0% |
| 10 to 14 Minutes | 0 | 0.0% |
| 15 to 19 Minutes | 0 | 0.0% |
| 20 to 24 Minutes | 95 | 38.6% |
| 25 to 29 Minutes | 46 | 18.7% |
| 30 to 34 Minutes | 57 | 23.2% |
| 35 to 39 Minutes | 0 | 0.0% |
| 40 to 44 Minutes | 8 | 3.3% |
| 45 to 59 Minutes | 0 | 0.0% |
| 60 to 89 Minutes | 40 | 16.3% |
| 90 or more Minutes | 0 | 0.0% |
Commute Time by Sex in Miracle Valley
The most common commute times in Miracle Valley are 20 to 24 minutes (84 commuters, 56.8%) for males and 25 to 29 minutes (46 commuters, 46.9%) for females.
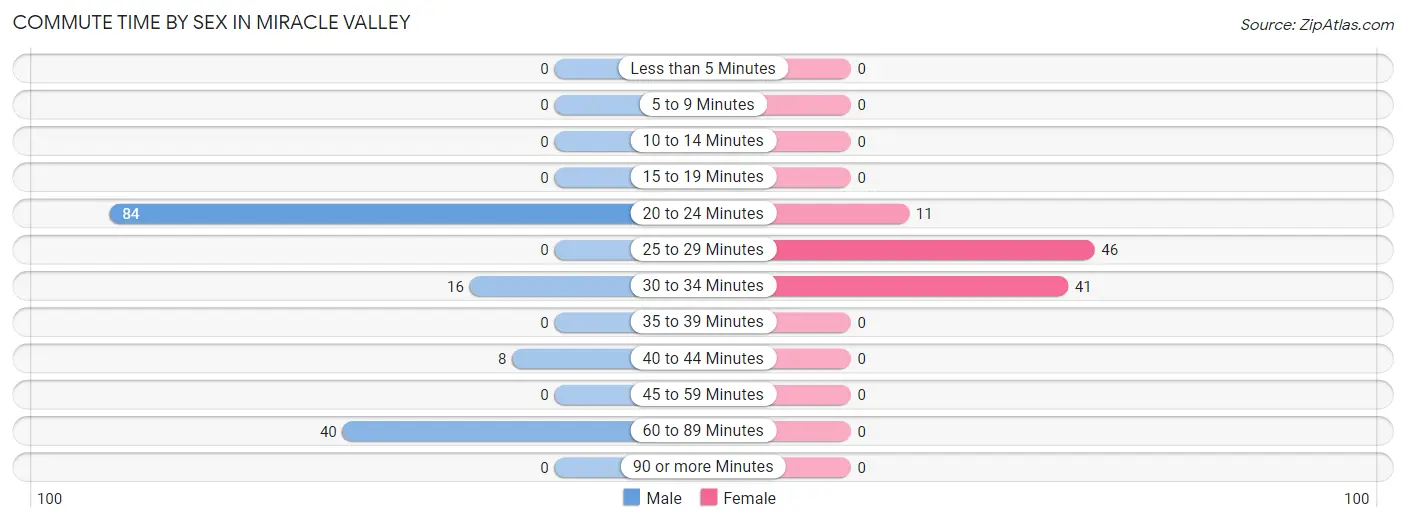
| Commute Time | Male | Female |
| Less than 5 Minutes | 0 (0.0%) | 0 (0.0%) |
| 5 to 9 Minutes | 0 (0.0%) | 0 (0.0%) |
| 10 to 14 Minutes | 0 (0.0%) | 0 (0.0%) |
| 15 to 19 Minutes | 0 (0.0%) | 0 (0.0%) |
| 20 to 24 Minutes | 84 (56.8%) | 11 (11.2%) |
| 25 to 29 Minutes | 0 (0.0%) | 46 (46.9%) |
| 30 to 34 Minutes | 16 (10.8%) | 41 (41.8%) |
| 35 to 39 Minutes | 0 (0.0%) | 0 (0.0%) |
| 40 to 44 Minutes | 8 (5.4%) | 0 (0.0%) |
| 45 to 59 Minutes | 0 (0.0%) | 0 (0.0%) |
| 60 to 89 Minutes | 40 (27.0%) | 0 (0.0%) |
| 90 or more Minutes | 0 (0.0%) | 0 (0.0%) |
Time of Departure to Work by Sex in Miracle Valley
The most frequent times of departure to work in Miracle Valley are 7:30 AM to 7:59 AM (84, 56.8%) for males and 8:30 AM to 8:59 AM (46, 46.9%) for females.
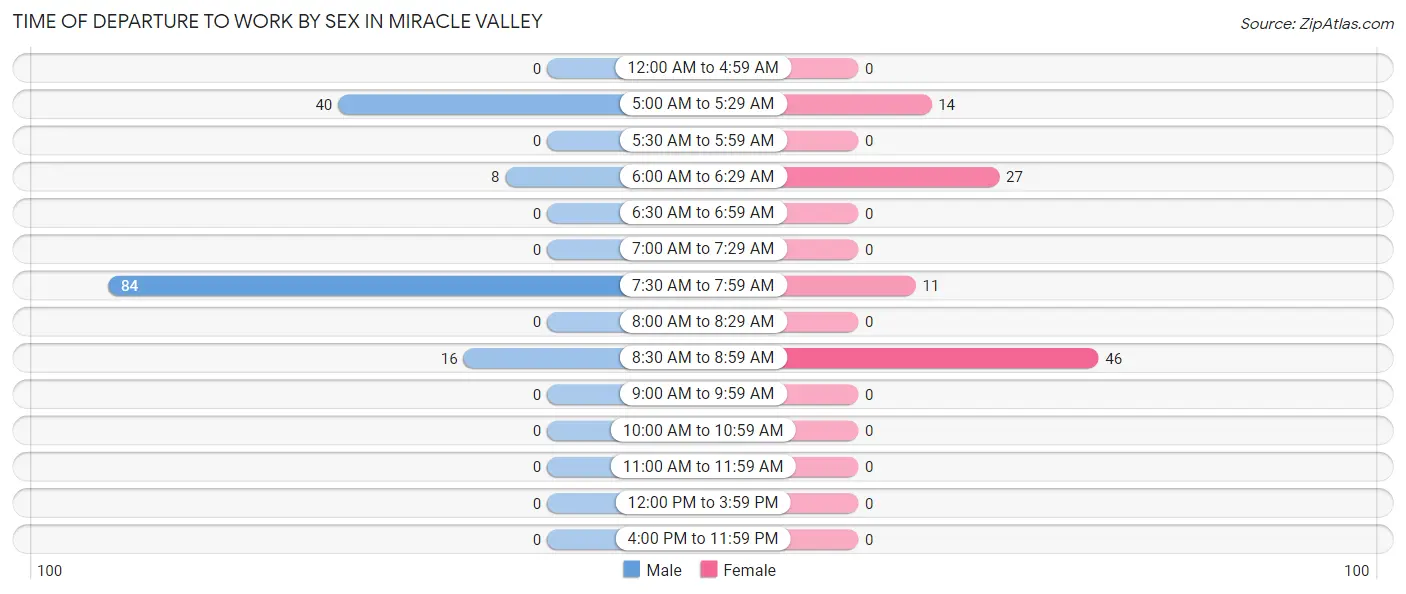
| Time of Departure | Male | Female |
| 12:00 AM to 4:59 AM | 0 (0.0%) | 0 (0.0%) |
| 5:00 AM to 5:29 AM | 40 (27.0%) | 14 (14.3%) |
| 5:30 AM to 5:59 AM | 0 (0.0%) | 0 (0.0%) |
| 6:00 AM to 6:29 AM | 8 (5.4%) | 27 (27.6%) |
| 6:30 AM to 6:59 AM | 0 (0.0%) | 0 (0.0%) |
| 7:00 AM to 7:29 AM | 0 (0.0%) | 0 (0.0%) |
| 7:30 AM to 7:59 AM | 84 (56.8%) | 11 (11.2%) |
| 8:00 AM to 8:29 AM | 0 (0.0%) | 0 (0.0%) |
| 8:30 AM to 8:59 AM | 16 (10.8%) | 46 (46.9%) |
| 9:00 AM to 9:59 AM | 0 (0.0%) | 0 (0.0%) |
| 10:00 AM to 10:59 AM | 0 (0.0%) | 0 (0.0%) |
| 11:00 AM to 11:59 AM | 0 (0.0%) | 0 (0.0%) |
| 12:00 PM to 3:59 PM | 0 (0.0%) | 0 (0.0%) |
| 4:00 PM to 11:59 PM | 0 (0.0%) | 0 (0.0%) |
| Total | 148 (100.0%) | 98 (100.0%) |
Housing Occupancy in Miracle Valley
Occupancy by Ownership in Miracle Valley
Of the total 242 dwellings in Miracle Valley, owner-occupied units account for 202 (83.5%), while renter-occupied units make up 40 (16.5%).
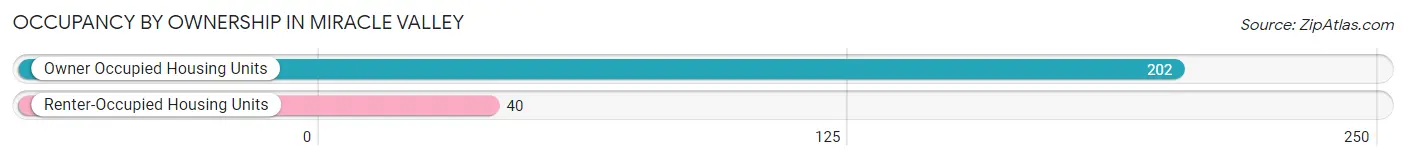
| Occupancy | # Housing Units | % Housing Units |
| Owner Occupied Housing Units | 202 | 83.5% |
| Renter-Occupied Housing Units | 40 | 16.5% |
| Total Occupied Housing Units | 242 | 100.0% |
Occupancy by Household Size in Miracle Valley
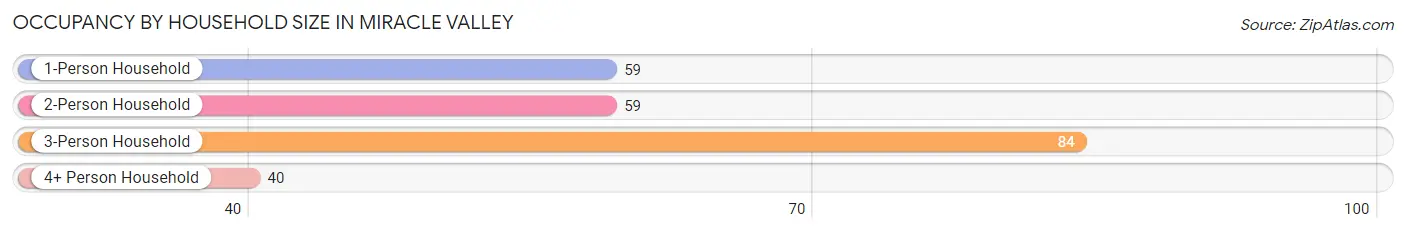
| Household Size | # Housing Units | % Housing Units |
| 1-Person Household | 59 | 24.4% |
| 2-Person Household | 59 | 24.4% |
| 3-Person Household | 84 | 34.7% |
| 4+ Person Household | 40 | 16.5% |
| Total Housing Units | 242 | 100.0% |
Occupancy by Ownership by Household Size in Miracle Valley
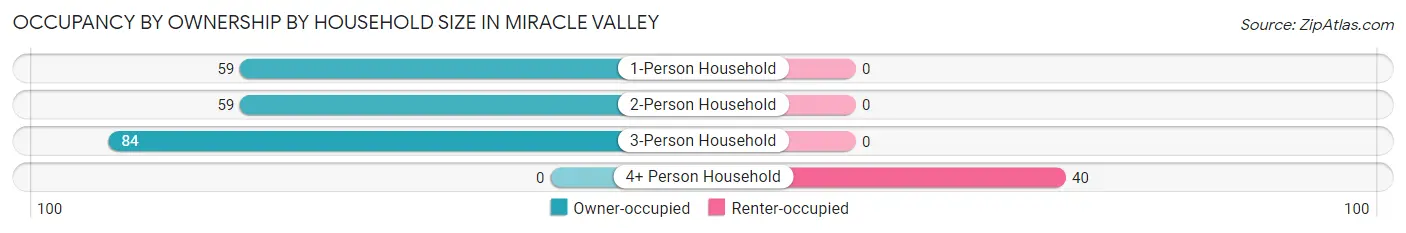
| Household Size | Owner-occupied | Renter-occupied |
| 1-Person Household | 59 (100.0%) | 0 (0.0%) |
| 2-Person Household | 59 (100.0%) | 0 (0.0%) |
| 3-Person Household | 84 (100.0%) | 0 (0.0%) |
| 4+ Person Household | 0 (0.0%) | 40 (100.0%) |
| Total Housing Units | 202 (83.5%) | 40 (16.5%) |
Occupancy by Educational Attainment in Miracle Valley
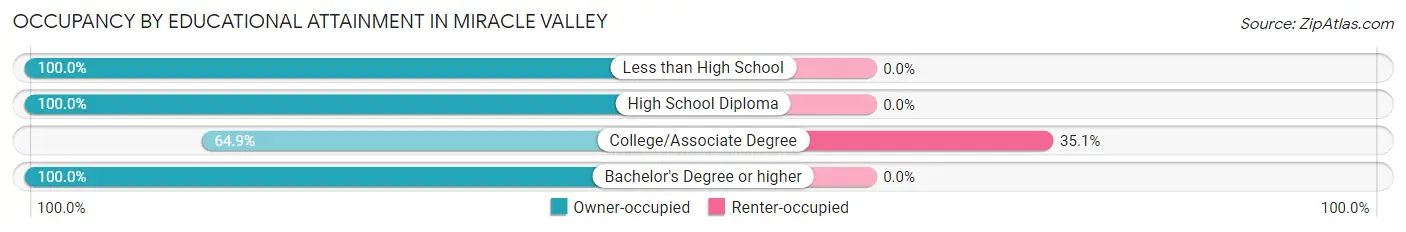
| Household Size | Owner-occupied | Renter-occupied |
| Less than High School | 12 (100.0%) | 0 (0.0%) |
| High School Diploma | 48 (100.0%) | 0 (0.0%) |
| College/Associate Degree | 74 (64.9%) | 40 (35.1%) |
| Bachelor's Degree or higher | 68 (100.0%) | 0 (0.0%) |
Occupancy by Age of Householder in Miracle Valley
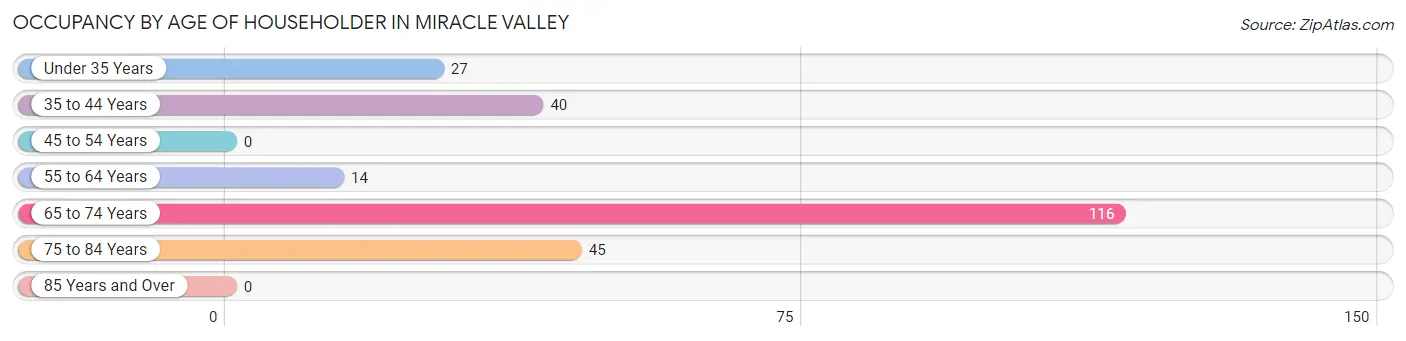
| Age Bracket | # Households | % Households |
| Under 35 Years | 27 | 11.2% |
| 35 to 44 Years | 40 | 16.5% |
| 45 to 54 Years | 0 | 0.0% |
| 55 to 64 Years | 14 | 5.8% |
| 65 to 74 Years | 116 | 47.9% |
| 75 to 84 Years | 45 | 18.6% |
| 85 Years and Over | 0 | 0.0% |
| Total | 242 | 100.0% |
Housing Finances in Miracle Valley
Median Income by Occupancy in Miracle Valley
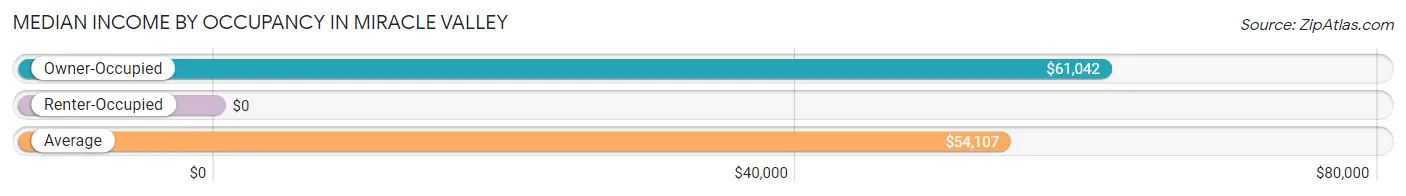
| Occupancy Type | # Households | Median Income |
| Owner-Occupied | 202 (83.5%) | $61,042 |
| Renter-Occupied | 40 (16.5%) | $0 |
| Average | 242 (100.0%) | $54,107 |
Occupancy by Householder Income Bracket in Miracle Valley
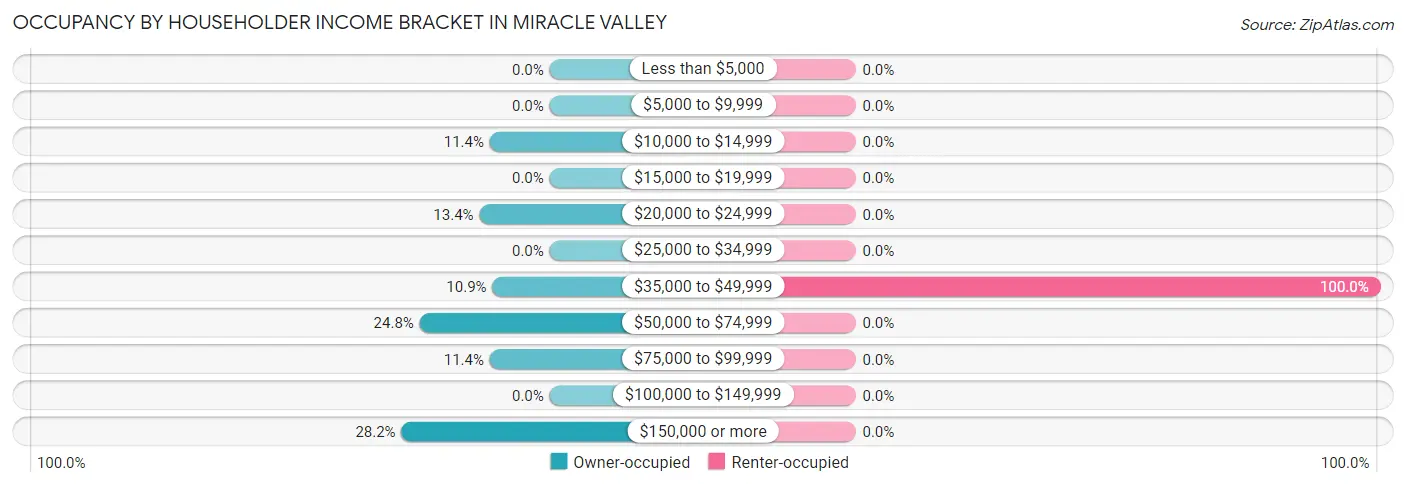
| Income Bracket | Owner-occupied | Renter-occupied |
| Less than $5,000 | 0 (0.0%) | 0 (0.0%) |
| $5,000 to $9,999 | 0 (0.0%) | 0 (0.0%) |
| $10,000 to $14,999 | 23 (11.4%) | 0 (0.0%) |
| $15,000 to $19,999 | 0 (0.0%) | 0 (0.0%) |
| $20,000 to $24,999 | 27 (13.4%) | 0 (0.0%) |
| $25,000 to $34,999 | 0 (0.0%) | 0 (0.0%) |
| $35,000 to $49,999 | 22 (10.9%) | 40 (100.0%) |
| $50,000 to $74,999 | 50 (24.7%) | 0 (0.0%) |
| $75,000 to $99,999 | 23 (11.4%) | 0 (0.0%) |
| $100,000 to $149,999 | 0 (0.0%) | 0 (0.0%) |
| $150,000 or more | 57 (28.2%) | 0 (0.0%) |
| Total | 202 (100.0%) | 40 (100.0%) |
Monthly Housing Cost Tiers in Miracle Valley
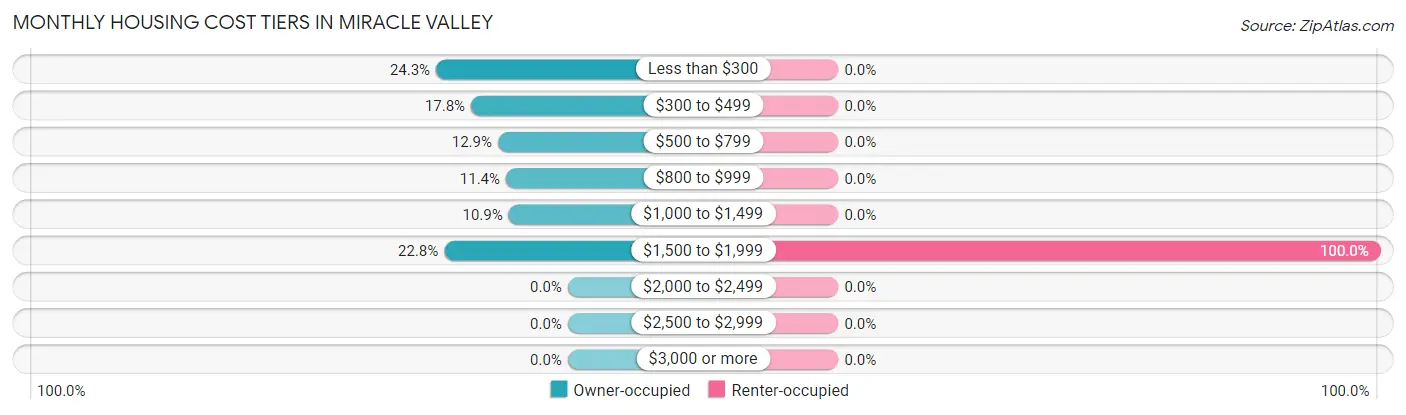
| Monthly Cost | Owner-occupied | Renter-occupied |
| Less than $300 | 49 (24.3%) | 0 (0.0%) |
| $300 to $499 | 36 (17.8%) | 0 (0.0%) |
| $500 to $799 | 26 (12.9%) | 0 (0.0%) |
| $800 to $999 | 23 (11.4%) | 0 (0.0%) |
| $1,000 to $1,499 | 22 (10.9%) | 0 (0.0%) |
| $1,500 to $1,999 | 46 (22.8%) | 40 (100.0%) |
| $2,000 to $2,499 | 0 (0.0%) | 0 (0.0%) |
| $2,500 to $2,999 | 0 (0.0%) | 0 (0.0%) |
| $3,000 or more | 0 (0.0%) | 0 (0.0%) |
| Total | 202 (100.0%) | 40 (100.0%) |
Physical Housing Characteristics in Miracle Valley
Housing Structures in Miracle Valley
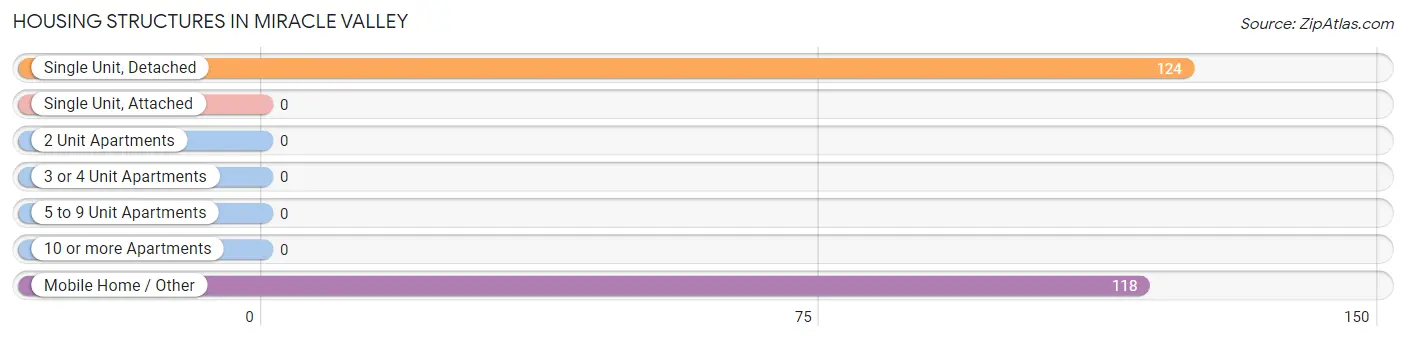
| Structure Type | # Housing Units | % Housing Units |
| Single Unit, Detached | 124 | 51.2% |
| Single Unit, Attached | 0 | 0.0% |
| 2 Unit Apartments | 0 | 0.0% |
| 3 or 4 Unit Apartments | 0 | 0.0% |
| 5 to 9 Unit Apartments | 0 | 0.0% |
| 10 or more Apartments | 0 | 0.0% |
| Mobile Home / Other | 118 | 48.8% |
| Total | 242 | 100.0% |
Housing Structures by Occupancy in Miracle Valley
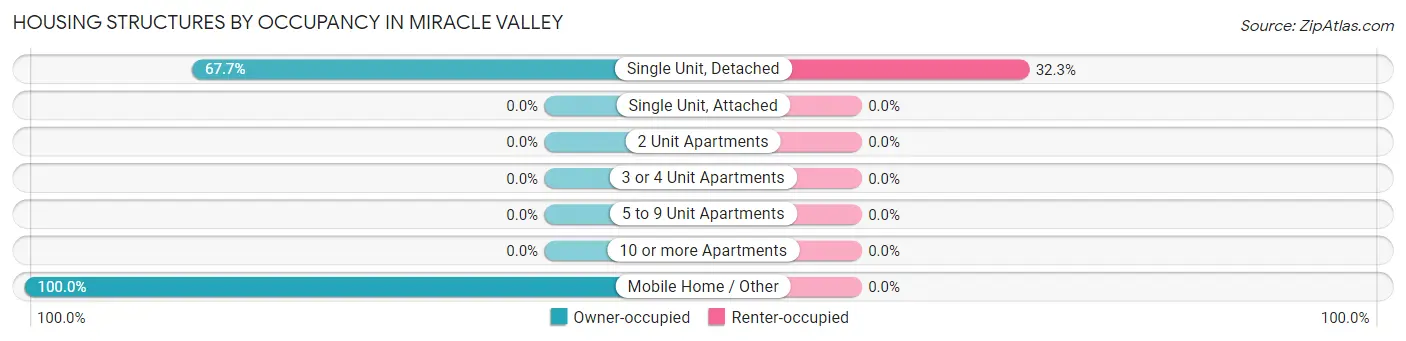
| Structure Type | Owner-occupied | Renter-occupied |
| Single Unit, Detached | 84 (67.7%) | 40 (32.3%) |
| Single Unit, Attached | 0 (0.0%) | 0 (0.0%) |
| 2 Unit Apartments | 0 (0.0%) | 0 (0.0%) |
| 3 or 4 Unit Apartments | 0 (0.0%) | 0 (0.0%) |
| 5 to 9 Unit Apartments | 0 (0.0%) | 0 (0.0%) |
| 10 or more Apartments | 0 (0.0%) | 0 (0.0%) |
| Mobile Home / Other | 118 (100.0%) | 0 (0.0%) |
| Total | 202 (83.5%) | 40 (16.5%) |
Housing Structures by Number of Rooms in Miracle Valley
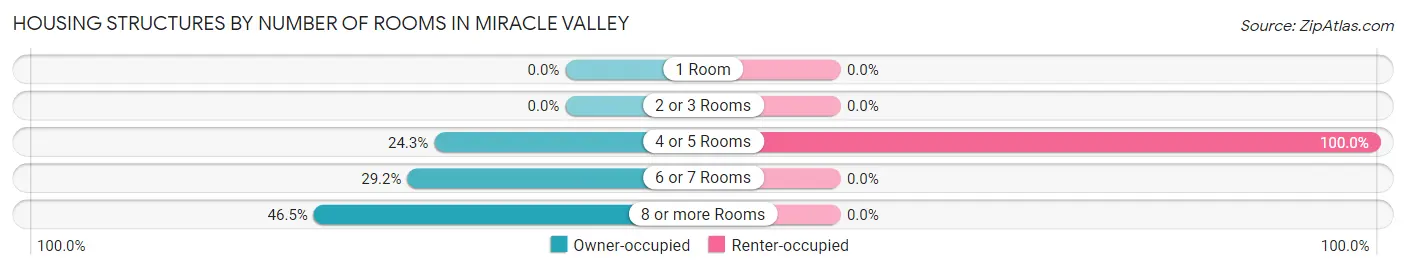
| Number of Rooms | Owner-occupied | Renter-occupied |
| 1 Room | 0 (0.0%) | 0 (0.0%) |
| 2 or 3 Rooms | 0 (0.0%) | 0 (0.0%) |
| 4 or 5 Rooms | 49 (24.3%) | 40 (100.0%) |
| 6 or 7 Rooms | 59 (29.2%) | 0 (0.0%) |
| 8 or more Rooms | 94 (46.5%) | 0 (0.0%) |
| Total | 202 (100.0%) | 40 (100.0%) |
Housing Structure by Heating Type in Miracle Valley
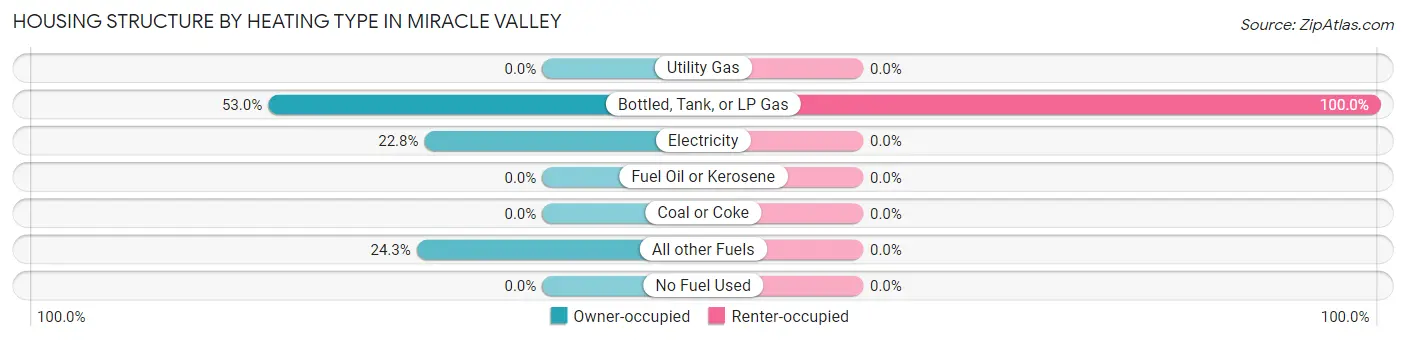
| Heating Type | Owner-occupied | Renter-occupied |
| Utility Gas | 0 (0.0%) | 0 (0.0%) |
| Bottled, Tank, or LP Gas | 107 (53.0%) | 40 (100.0%) |
| Electricity | 46 (22.8%) | 0 (0.0%) |
| Fuel Oil or Kerosene | 0 (0.0%) | 0 (0.0%) |
| Coal or Coke | 0 (0.0%) | 0 (0.0%) |
| All other Fuels | 49 (24.3%) | 0 (0.0%) |
| No Fuel Used | 0 (0.0%) | 0 (0.0%) |
| Total | 202 (100.0%) | 40 (100.0%) |
Household Vehicle Usage in Miracle Valley
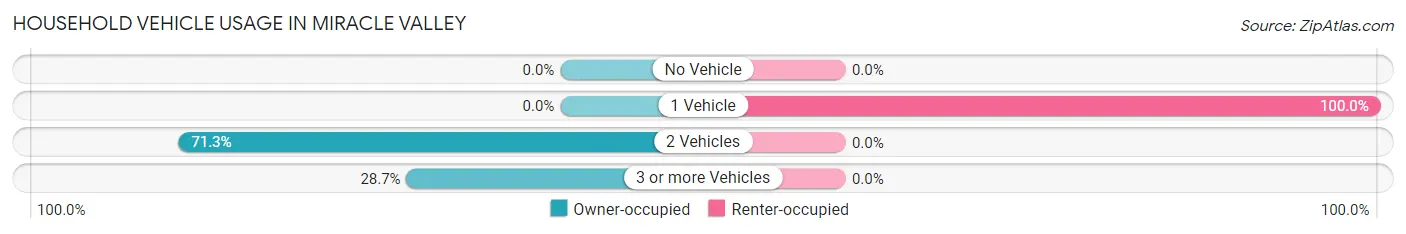
| Vehicles per Household | Owner-occupied | Renter-occupied |
| No Vehicle | 0 (0.0%) | 0 (0.0%) |
| 1 Vehicle | 0 (0.0%) | 40 (100.0%) |
| 2 Vehicles | 144 (71.3%) | 0 (0.0%) |
| 3 or more Vehicles | 58 (28.7%) | 0 (0.0%) |
| Total | 202 (100.0%) | 40 (100.0%) |
Real Estate & Mortgages in Miracle Valley
Real Estate and Mortgage Overview in Miracle Valley
| Characteristic | Without Mortgage | With Mortgage |
| Housing Units | 120 | 82 |
| Median Property Value | $69,700 | $111,800 |
| Median Household Income | $43,636 | $57 |
| Monthly Housing Costs | $431 | $0 |
| Real Estate Taxes | $306 | $14 |
Property Value by Mortgage Status in Miracle Valley
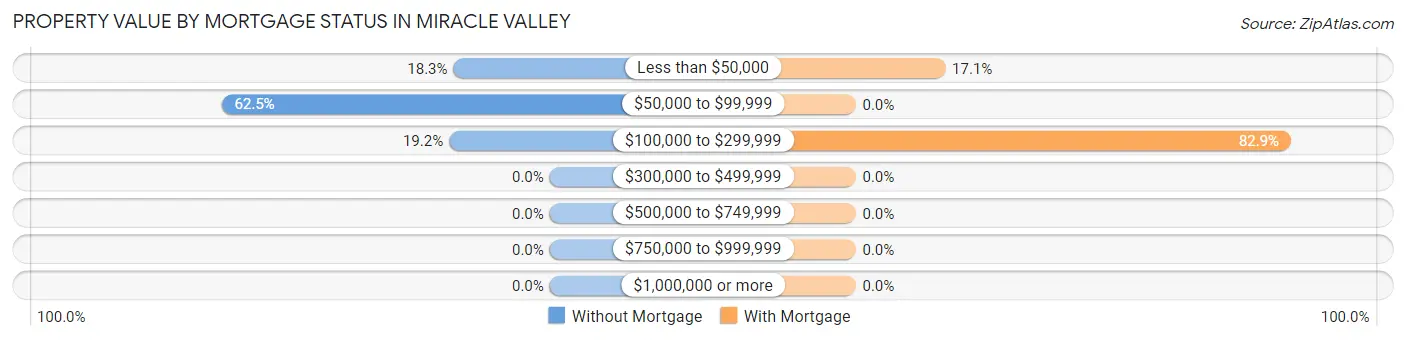
| Property Value | Without Mortgage | With Mortgage |
| Less than $50,000 | 22 (18.3%) | 14 (17.1%) |
| $50,000 to $99,999 | 75 (62.5%) | 0 (0.0%) |
| $100,000 to $299,999 | 23 (19.2%) | 68 (82.9%) |
| $300,000 to $499,999 | 0 (0.0%) | 0 (0.0%) |
| $500,000 to $749,999 | 0 (0.0%) | 0 (0.0%) |
| $750,000 to $999,999 | 0 (0.0%) | 0 (0.0%) |
| $1,000,000 or more | 0 (0.0%) | 0 (0.0%) |
| Total | 120 (100.0%) | 82 (100.0%) |
Household Income by Mortgage Status in Miracle Valley
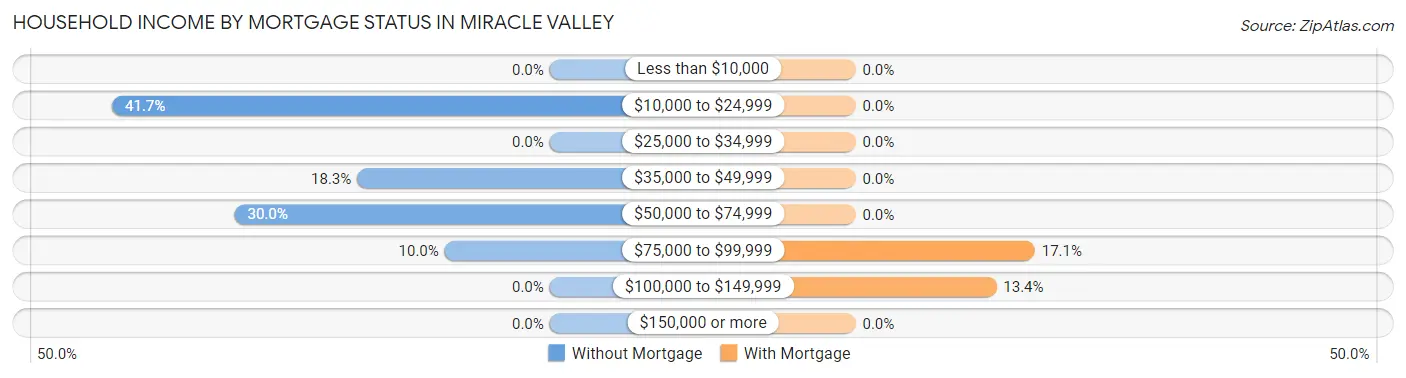
| Household Income | Without Mortgage | With Mortgage |
| Less than $10,000 | 0 (0.0%) | 0 (0.0%) |
| $10,000 to $24,999 | 50 (41.7%) | 0 (0.0%) |
| $25,000 to $34,999 | 0 (0.0%) | 0 (0.0%) |
| $35,000 to $49,999 | 22 (18.3%) | 0 (0.0%) |
| $50,000 to $74,999 | 36 (30.0%) | 0 (0.0%) |
| $75,000 to $99,999 | 12 (10.0%) | 14 (17.1%) |
| $100,000 to $149,999 | 0 (0.0%) | 11 (13.4%) |
| $150,000 or more | 0 (0.0%) | 0 (0.0%) |
| Total | 120 (100.0%) | 82 (100.0%) |
Property Value to Household Income Ratio in Miracle Valley
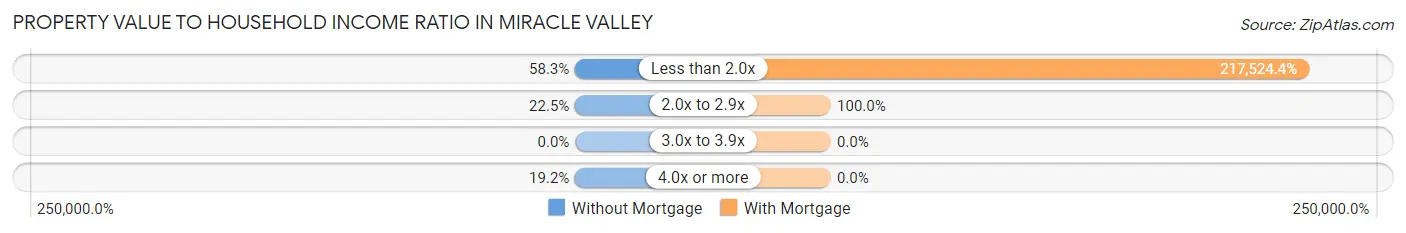
| Value-to-Income Ratio | Without Mortgage | With Mortgage |
| Less than 2.0x | 70 (58.3%) | 178,370 (217,524.4%) |
| 2.0x to 2.9x | 27 (22.5%) | 82 (100.0%) |
| 3.0x to 3.9x | 0 (0.0%) | 0 (0.0%) |
| 4.0x or more | 23 (19.2%) | 0 (0.0%) |
| Total | 120 (100.0%) | 82 (100.0%) |
Real Estate Taxes by Mortgage Status in Miracle Valley
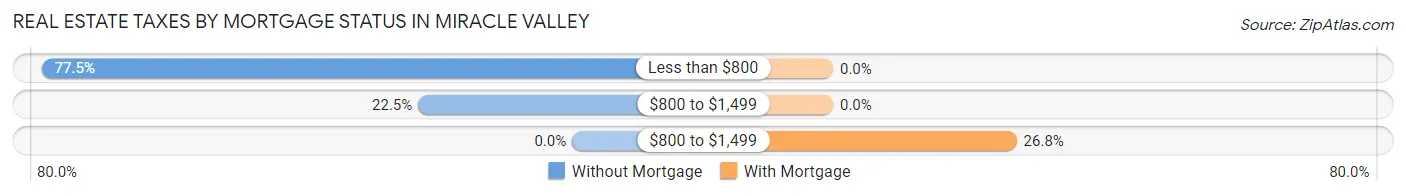
| Property Taxes | Without Mortgage | With Mortgage |
| Less than $800 | 93 (77.5%) | 0 (0.0%) |
| $800 to $1,499 | 27 (22.5%) | 0 (0.0%) |
| $800 to $1,499 | 0 (0.0%) | 22 (26.8%) |
| Total | 120 (100.0%) | 82 (100.0%) |
Health & Disability in Miracle Valley
Health Insurance Coverage by Age in Miracle Valley
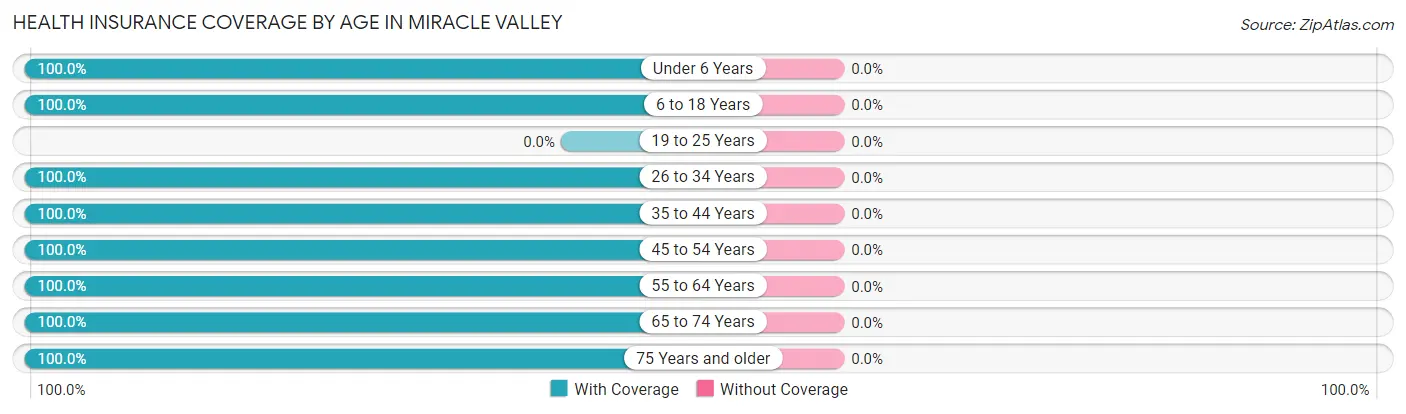
| Age Bracket | With Coverage | Without Coverage |
| Under 6 Years | 26 (100.0%) | 0 (0.0%) |
| 6 to 18 Years | 154 (100.0%) | 0 (0.0%) |
| 19 to 25 Years | 0 (0.0%) | 0 (0.0%) |
| 26 to 34 Years | 27 (100.0%) | 0 (0.0%) |
| 35 to 44 Years | 92 (100.0%) | 0 (0.0%) |
| 45 to 54 Years | 14 (100.0%) | 0 (0.0%) |
| 55 to 64 Years | 197 (100.0%) | 0 (0.0%) |
| 65 to 74 Years | 149 (100.0%) | 0 (0.0%) |
| 75 Years and older | 45 (100.0%) | 0 (0.0%) |
| Total | 704 (100.0%) | 0 (0.0%) |
Health Insurance Coverage by Citizenship Status in Miracle Valley
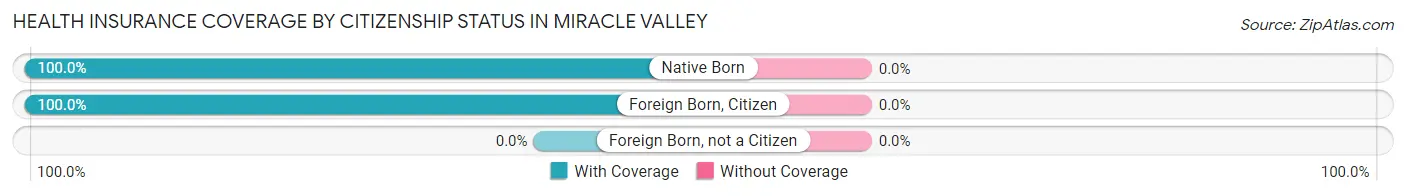
| Citizenship Status | With Coverage | Without Coverage |
| Native Born | 26 (100.0%) | 0 (0.0%) |
| Foreign Born, Citizen | 154 (100.0%) | 0 (0.0%) |
| Foreign Born, not a Citizen | 0 (0.0%) | 0 (0.0%) |
Health Insurance Coverage by Household Income in Miracle Valley
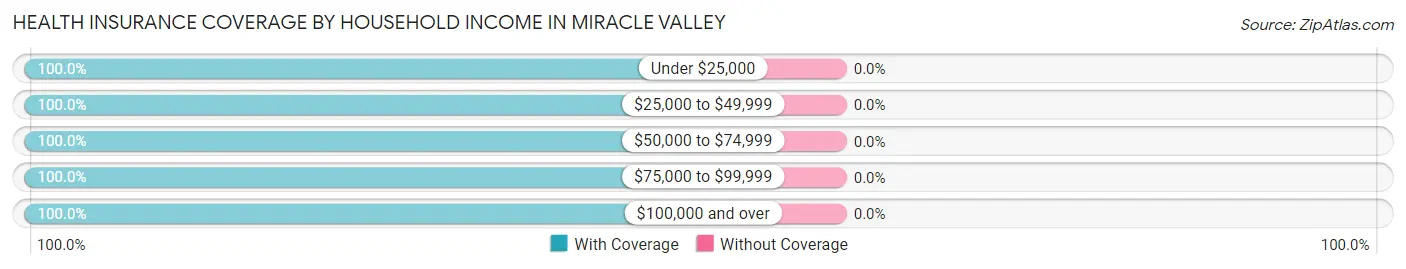
| Household Income | With Coverage | Without Coverage |
| Under $25,000 | 104 (100.0%) | 0 (0.0%) |
| $25,000 to $49,999 | 216 (100.0%) | 0 (0.0%) |
| $50,000 to $74,999 | 83 (100.0%) | 0 (0.0%) |
| $75,000 to $99,999 | 61 (100.0%) | 0 (0.0%) |
| $100,000 and over | 240 (100.0%) | 0 (0.0%) |
Public vs Private Health Insurance Coverage by Age in Miracle Valley
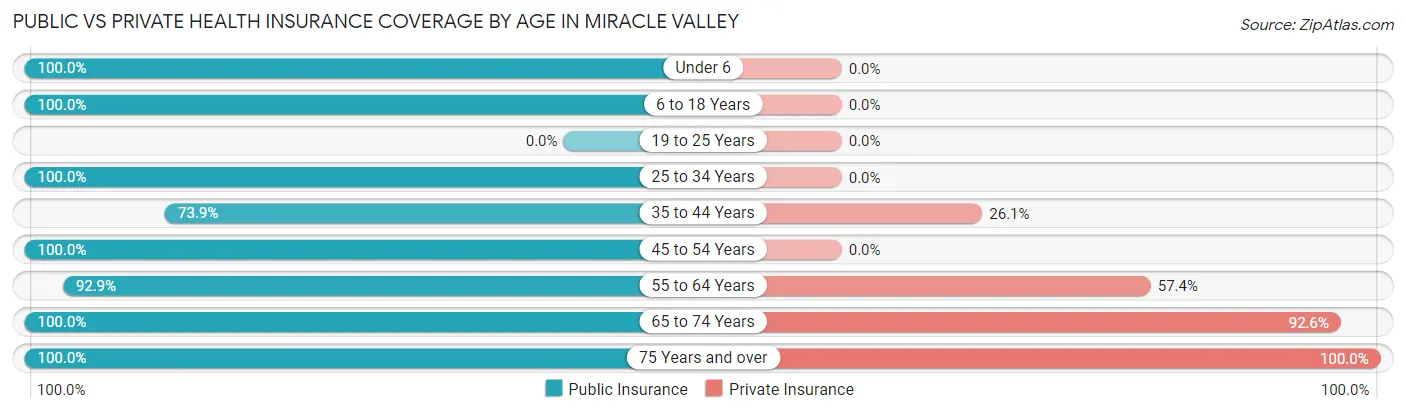
| Age Bracket | Public Insurance | Private Insurance |
| Under 6 | 26 (100.0%) | 0 (0.0%) |
| 6 to 18 Years | 154 (100.0%) | 0 (0.0%) |
| 19 to 25 Years | 0 (0.0%) | 0 (0.0%) |
| 25 to 34 Years | 27 (100.0%) | 0 (0.0%) |
| 35 to 44 Years | 68 (73.9%) | 24 (26.1%) |
| 45 to 54 Years | 14 (100.0%) | 0 (0.0%) |
| 55 to 64 Years | 183 (92.9%) | 113 (57.4%) |
| 65 to 74 Years | 149 (100.0%) | 138 (92.6%) |
| 75 Years and over | 45 (100.0%) | 45 (100.0%) |
| Total | 666 (94.6%) | 320 (45.5%) |
Disability Status by Sex by Age in Miracle Valley
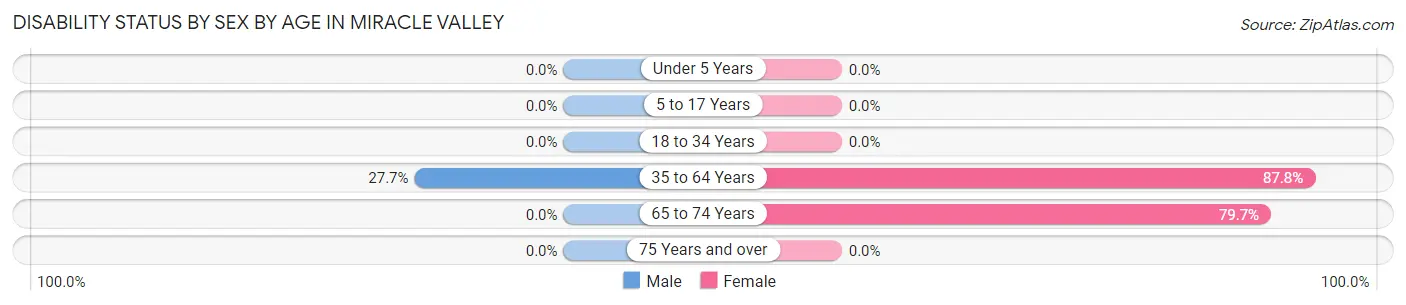
| Age Bracket | Male | Female |
| Under 5 Years | 0 (0.0%) | 0 (0.0%) |
| 5 to 17 Years | 0 (0.0%) | 0 (0.0%) |
| 18 to 34 Years | 0 (0.0%) | 0 (0.0%) |
| 35 to 64 Years | 52 (27.7%) | 101 (87.8%) |
| 65 to 74 Years | 0 (0.0%) | 90 (79.6%) |
| 75 Years and over | 0 (0.0%) | 0 (0.0%) |
Disability Class by Sex by Age in Miracle Valley
Disability Class: Hearing Difficulty
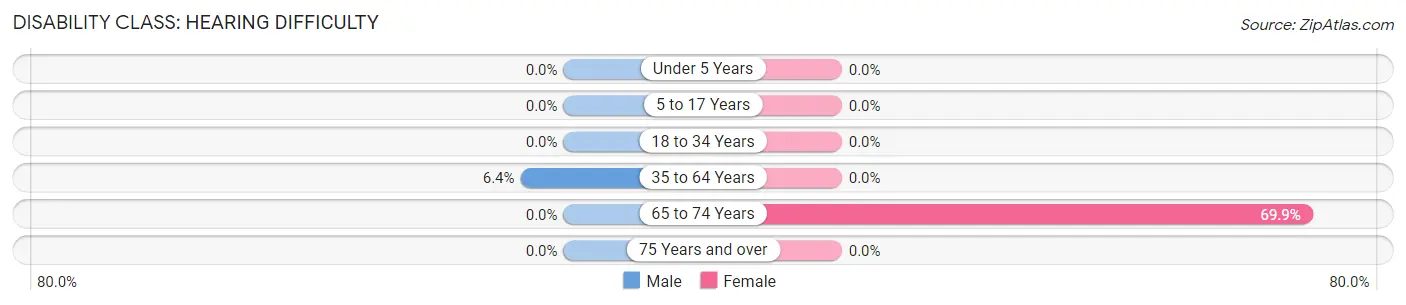
| Age Bracket | Male | Female |
| Under 5 Years | 0 (0.0%) | 0 (0.0%) |
| 5 to 17 Years | 0 (0.0%) | 0 (0.0%) |
| 18 to 34 Years | 0 (0.0%) | 0 (0.0%) |
| 35 to 64 Years | 12 (6.4%) | 0 (0.0%) |
| 65 to 74 Years | 0 (0.0%) | 79 (69.9%) |
| 75 Years and over | 0 (0.0%) | 0 (0.0%) |
Disability Class: Vision Difficulty
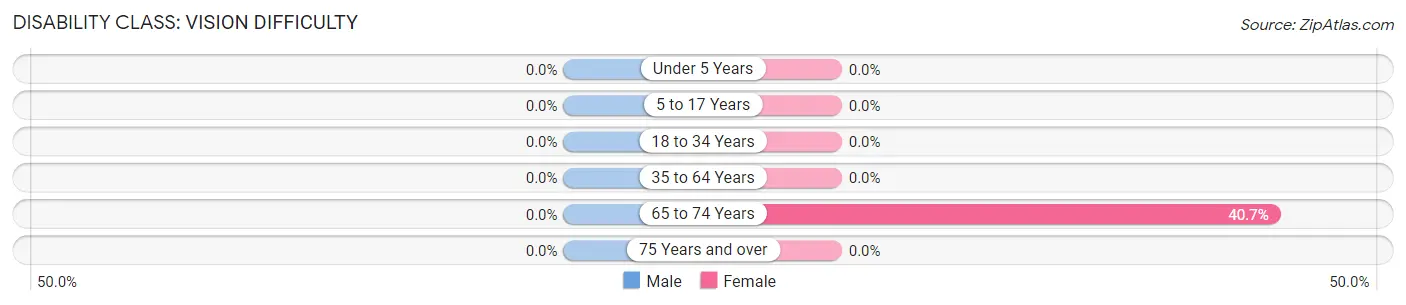
| Age Bracket | Male | Female |
| Under 5 Years | 0 (0.0%) | 0 (0.0%) |
| 5 to 17 Years | 0 (0.0%) | 0 (0.0%) |
| 18 to 34 Years | 0 (0.0%) | 0 (0.0%) |
| 35 to 64 Years | 0 (0.0%) | 0 (0.0%) |
| 65 to 74 Years | 0 (0.0%) | 46 (40.7%) |
| 75 Years and over | 0 (0.0%) | 0 (0.0%) |
Disability Class: Cognitive Difficulty
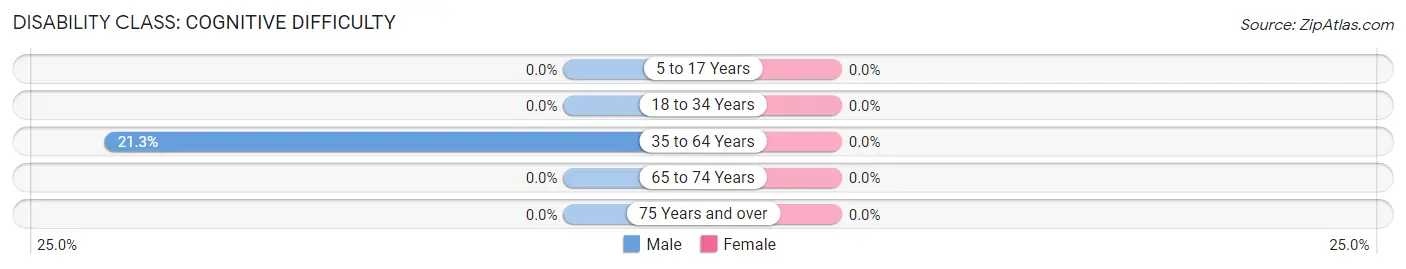
| Age Bracket | Male | Female |
| 5 to 17 Years | 0 (0.0%) | 0 (0.0%) |
| 18 to 34 Years | 0 (0.0%) | 0 (0.0%) |
| 35 to 64 Years | 40 (21.3%) | 0 (0.0%) |
| 65 to 74 Years | 0 (0.0%) | 0 (0.0%) |
| 75 Years and over | 0 (0.0%) | 0 (0.0%) |
Disability Class: Ambulatory Difficulty
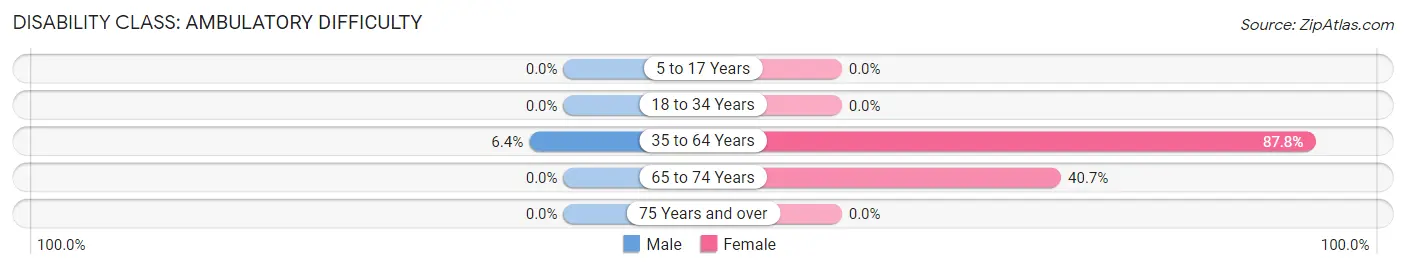
| Age Bracket | Male | Female |
| 5 to 17 Years | 0 (0.0%) | 0 (0.0%) |
| 18 to 34 Years | 0 (0.0%) | 0 (0.0%) |
| 35 to 64 Years | 12 (6.4%) | 101 (87.8%) |
| 65 to 74 Years | 0 (0.0%) | 46 (40.7%) |
| 75 Years and over | 0 (0.0%) | 0 (0.0%) |
Disability Class: Self-Care Difficulty
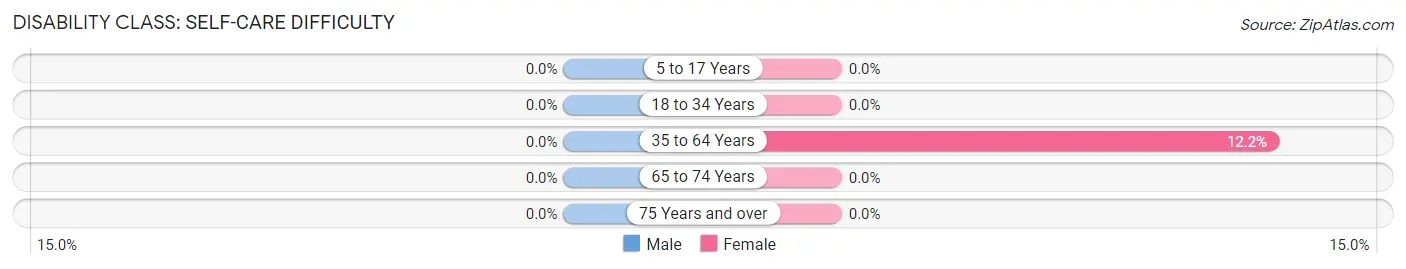
| Age Bracket | Male | Female |
| 5 to 17 Years | 0 (0.0%) | 0 (0.0%) |
| 18 to 34 Years | 0 (0.0%) | 0 (0.0%) |
| 35 to 64 Years | 0 (0.0%) | 14 (12.2%) |
| 65 to 74 Years | 0 (0.0%) | 0 (0.0%) |
| 75 Years and over | 0 (0.0%) | 0 (0.0%) |
Technology Access in Miracle Valley
Computing Device Access in Miracle Valley
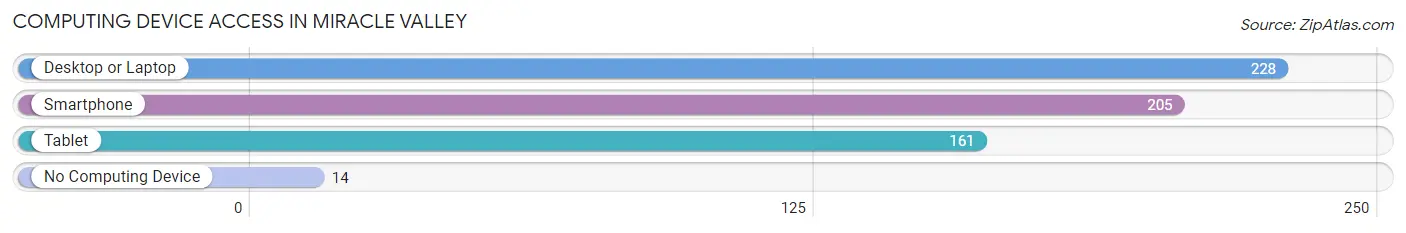
| Device Type | # Households | % Households |
| Desktop or Laptop | 228 | 94.2% |
| Smartphone | 205 | 84.7% |
| Tablet | 161 | 66.5% |
| No Computing Device | 14 | 5.8% |
| Total | 242 | 100.0% |
Internet Access in Miracle Valley
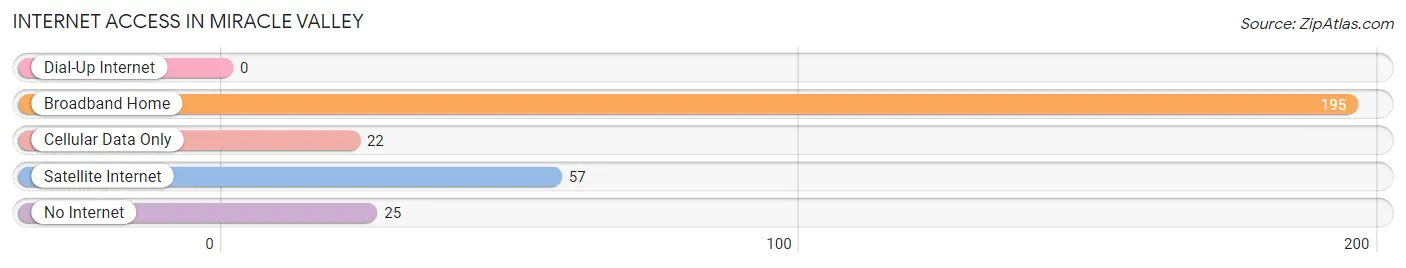
| Internet Type | # Households | % Households |
| Dial-Up Internet | 0 | 0.0% |
| Broadband Home | 195 | 80.6% |
| Cellular Data Only | 22 | 9.1% |
| Satellite Internet | 57 | 23.5% |
| No Internet | 25 | 10.3% |
| Total | 242 | 100.0% |
Miracle Valley Summary
Miracle Valley, Arizona is a small unincorporated community located in Cochise County, Arizona. It is situated in the San Pedro Valley, approximately 25 miles southeast of Sierra Vista. The population of Miracle Valley was estimated to be around 200 people in 2000.
History
Miracle Valley was founded in the late 1950s by a group of Pentecostal Christians led by the Reverend Charles E. Green. The group had previously been living in a tent city in the nearby town of St. David, Arizona. Green and his followers were looking for a place to practice their faith without interference from the outside world. They chose Miracle Valley because of its remote location and its proximity to the Mexican border.
The group built a church, a school, and several homes in the area. They also established a small farm and ranching operation. The community was largely self-sufficient, relying on the land for food and other necessities.
In the early 1980s, the community was rocked by a series of violent incidents. In 1982, a shootout between members of the community and law enforcement resulted in the death of two people. In 1983, a group of armed men stormed the church and took hostages. The incident ended without any fatalities, but it caused a rift between the community and the outside world.
In the late 1980s, the community began to decline. Many of the original members had died or moved away, and the younger generation had little interest in the lifestyle of their parents. By the early 1990s, the population had dwindled to around 200 people.
Geography
Miracle Valley is located in the San Pedro Valley, approximately 25 miles southeast of Sierra Vista. The valley is surrounded by the Huachuca Mountains to the north and the Chiricahua Mountains to the south. The valley is home to a variety of wildlife, including deer, javelina, and coyotes.
The climate in Miracle Valley is arid, with hot summers and mild winters. The average annual temperature is around 70 degrees Fahrenheit. The average annual precipitation is around 12 inches.
Economy
The economy of Miracle Valley is largely based on ranching and farming. The community is home to several small farms and ranches, which produce a variety of crops and livestock. The community also relies on tourism for additional income.
Demographics
The population of Miracle Valley was estimated to be around 200 people in 2000. The majority of the population is white, with a small Hispanic minority. The median household income is around $30,000. The median age is around 40 years old.
Conclusion
Miracle Valley, Arizona is a small unincorporated community located in Cochise County, Arizona. It was founded in the late 1950s by a group of Pentecostal Christians led by the Reverend Charles E. Green. The economy of Miracle Valley is largely based on ranching and farming, and the population was estimated to be around 200 people in 2000. The majority of the population is white, with a small Hispanic minority. The median household income is around $30,000. The climate in Miracle Valley is arid, with hot summers and mild winters. The valley is home to a variety of wildlife, including deer, javelina, and coyotes.
Common Questions
What is Per Capita Income in Miracle Valley?
Per Capita income in Miracle Valley is $34,317.
What is the Median Family Income in Miracle Valley?
Median Family Income in Miracle Valley is $61,701.
What is the Median Household income in Miracle Valley?
Median Household Income in Miracle Valley is $54,107.
What is Income or Wage Gap in Miracle Valley?
Income or Wage Gap in Miracle Valley is 51.0%.
Women in Miracle Valley earn 49.0 cents for every dollar earned by a man.
What is Inequality or Gini Index in Miracle Valley?
Inequality or Gini Index in Miracle Valley is 0.41.
What is the Total Population of Miracle Valley?
Total Population of Miracle Valley is 704.
What is the Total Male Population of Miracle Valley?
Total Male Population of Miracle Valley is 386.
What is the Total Female Population of Miracle Valley?
Total Female Population of Miracle Valley is 318.
What is the Ratio of Males per 100 Females in Miracle Valley?
There are 121.38 Males per 100 Females in Miracle Valley.
What is the Ratio of Females per 100 Males in Miracle Valley?
There are 82.38 Females per 100 Males in Miracle Valley.
What is the Median Population Age in Miracle Valley?
Median Population Age in Miracle Valley is 55.5 Years.
What is the Average Family Size in Miracle Valley
Average Family Size in Miracle Valley is 2.9 People.
What is the Average Household Size in Miracle Valley
Average Household Size in Miracle Valley is 2.9 People.
How Large is the Labor Force in Miracle Valley?
There are 246 People in the Labor Forcein in Miracle Valley.
What is the Percentage of People in the Labor Force in Miracle Valley?
46.9% of People are in the Labor Force in Miracle Valley.