Payson, AZ Map & Demographics
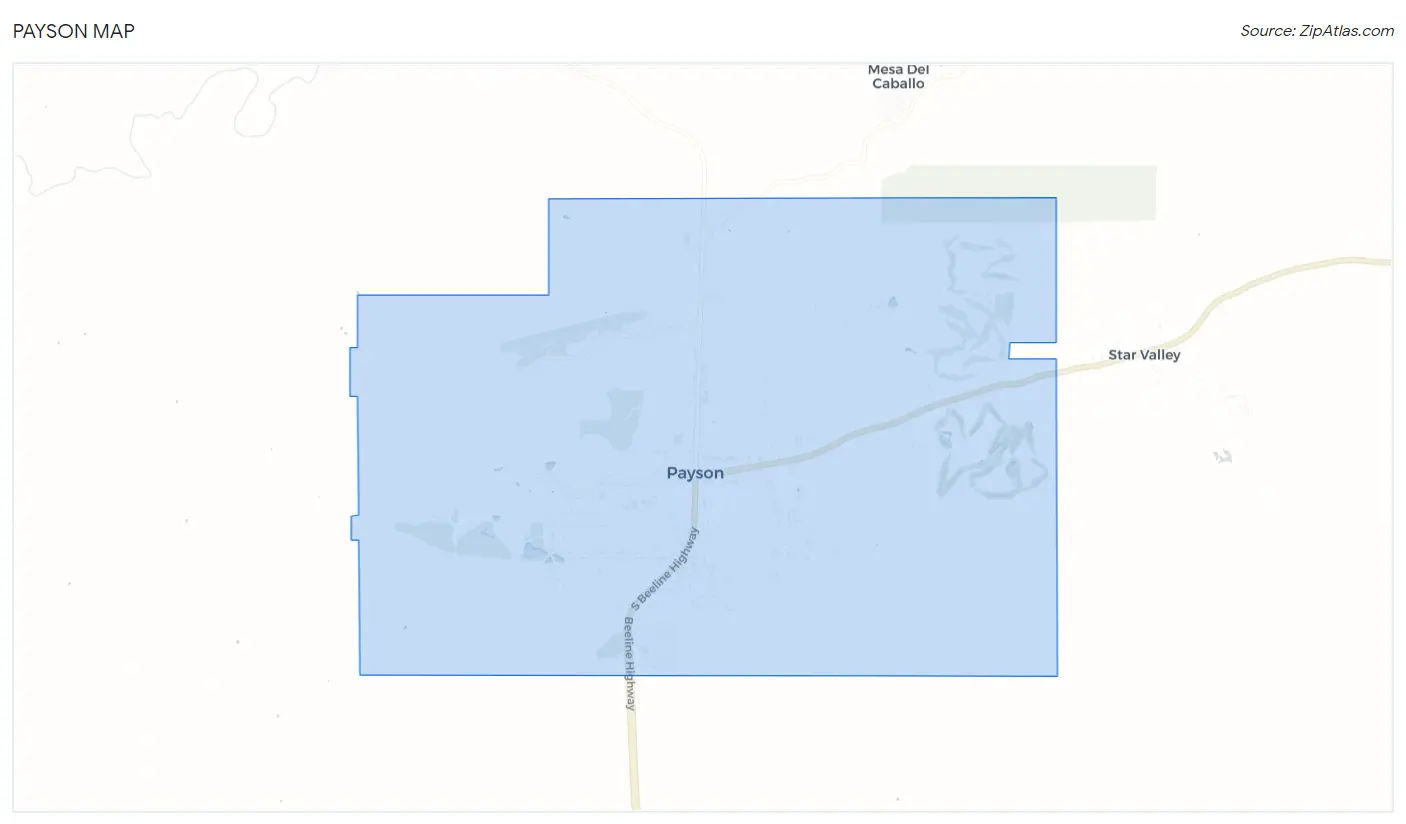
Payson Map
Payson Overview
$36,705
PER CAPITA INCOME
$73,812
AVG FAMILY INCOME
$60,095
AVG HOUSEHOLD INCOME
31.2%
WAGE / INCOME GAP [ % ]
68.8¢/ $1
WAGE / INCOME GAP [ $ ]
0.42
INEQUALITY / GINI INDEX
16,363
TOTAL POPULATION
7,788
MALE POPULATION
8,575
FEMALE POPULATION
90.82
MALES / 100 FEMALES
110.11
FEMALES / 100 MALES
59.0
MEDIAN AGE
2.7
AVG FAMILY SIZE
2.1
AVG HOUSEHOLD SIZE
6,252
LABOR FORCE [ PEOPLE ]
44.6%
PERCENT IN LABOR FORCE
7.0%
UNEMPLOYMENT RATE
Payson Zip Codes
Payson Area Codes
Income in Payson
Income Overview in Payson
Per Capita Income in Payson is $36,705, while median incomes of families and households are $73,812 and $60,095 respectively.
| Characteristic | Number | Measure |
| Per Capita Income | 16,363 | $36,705 |
| Median Family Income | 4,474 | $73,812 |
| Mean Family Income | 4,474 | $94,096 |
| Median Household Income | 7,558 | $60,095 |
| Mean Household Income | 7,558 | $77,971 |
| Income Deficit | 4,474 | $0 |
| Wage / Income Gap (%) | 16,363 | 31.19% |
| Wage / Income Gap ($) | 16,363 | 68.81¢ per $1 |
| Gini / Inequality Index | 16,363 | 0.42 |
Earnings by Sex in Payson
Average Earnings in Payson are $36,025, $44,735 for men and $30,781 for women, a difference of 31.2%.
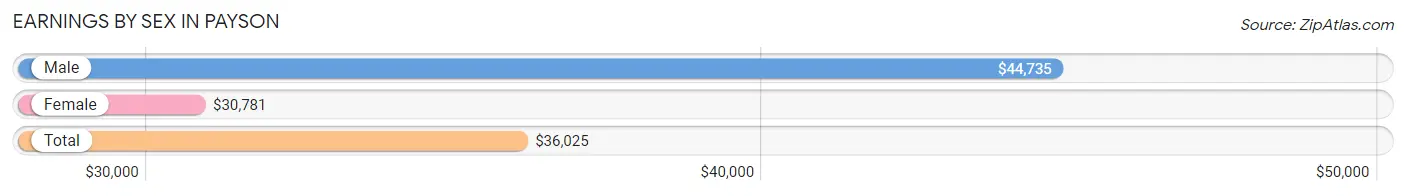
| Sex | Number | Average Earnings |
| Male | 3,219 (48.5%) | $44,735 |
| Female | 3,422 (51.5%) | $30,781 |
| Total | 6,641 (100.0%) | $36,025 |
Earnings by Sex by Income Bracket in Payson
The most common earnings brackets in Payson are $100,000+ for men (633 | 19.7%) and $2,499 or less for women (375 | 11.0%).
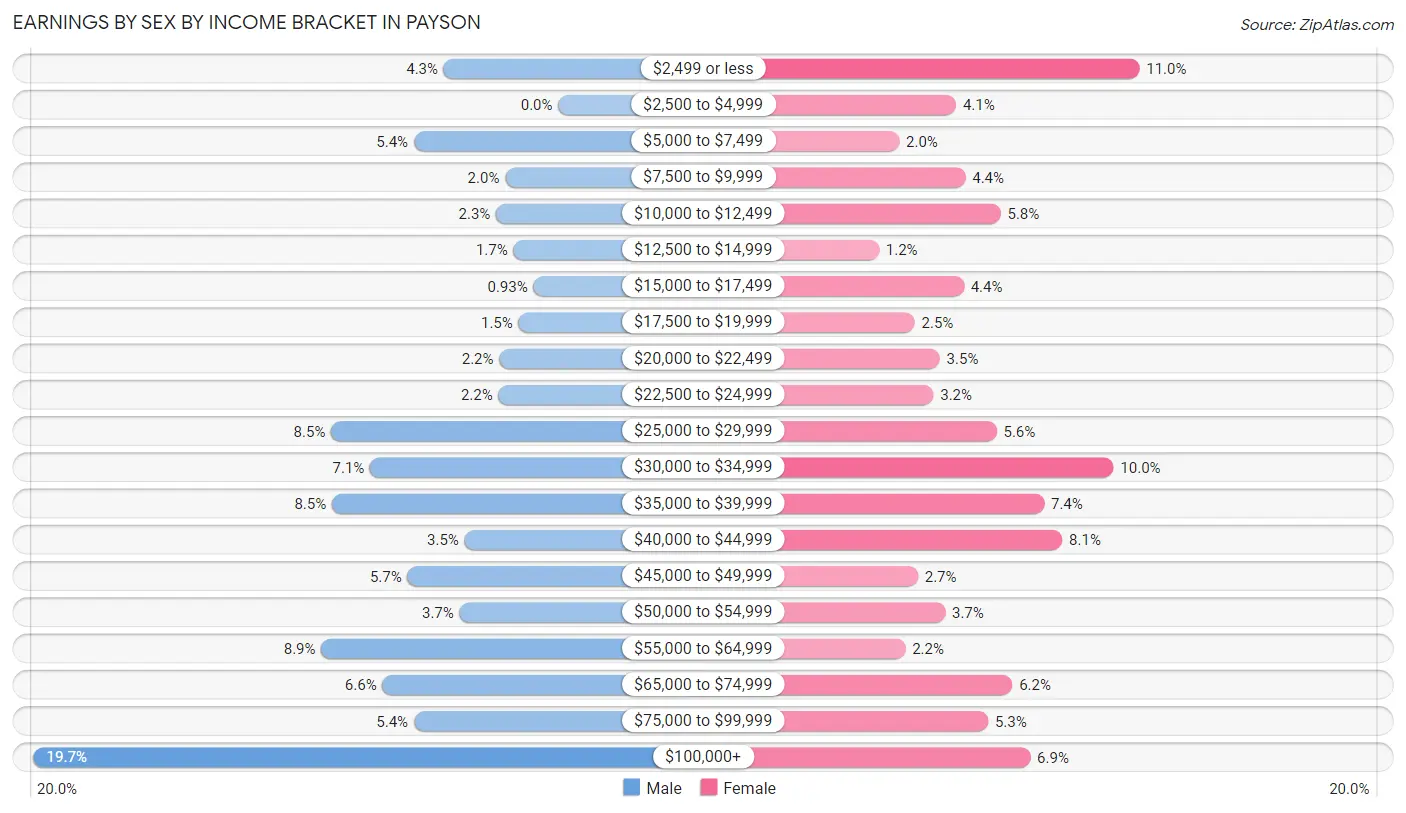
| Income | Male | Female |
| $2,499 or less | 138 (4.3%) | 375 (11.0%) |
| $2,500 to $4,999 | 0 (0.0%) | 140 (4.1%) |
| $5,000 to $7,499 | 174 (5.4%) | 67 (2.0%) |
| $7,500 to $9,999 | 64 (2.0%) | 152 (4.4%) |
| $10,000 to $12,499 | 75 (2.3%) | 197 (5.8%) |
| $12,500 to $14,999 | 54 (1.7%) | 41 (1.2%) |
| $15,000 to $17,499 | 30 (0.9%) | 150 (4.4%) |
| $17,500 to $19,999 | 48 (1.5%) | 87 (2.5%) |
| $20,000 to $22,499 | 71 (2.2%) | 119 (3.5%) |
| $22,500 to $24,999 | 72 (2.2%) | 111 (3.2%) |
| $25,000 to $29,999 | 274 (8.5%) | 192 (5.6%) |
| $30,000 to $34,999 | 227 (7.0%) | 342 (10.0%) |
| $35,000 to $39,999 | 273 (8.5%) | 253 (7.4%) |
| $40,000 to $44,999 | 113 (3.5%) | 276 (8.1%) |
| $45,000 to $49,999 | 182 (5.7%) | 91 (2.7%) |
| $50,000 to $54,999 | 119 (3.7%) | 126 (3.7%) |
| $55,000 to $64,999 | 286 (8.9%) | 75 (2.2%) |
| $65,000 to $74,999 | 212 (6.6%) | 212 (6.2%) |
| $75,000 to $99,999 | 174 (5.4%) | 181 (5.3%) |
| $100,000+ | 633 (19.7%) | 235 (6.9%) |
| Total | 3,219 (100.0%) | 3,422 (100.0%) |
Earnings by Sex by Educational Attainment in Payson
Average earnings in Payson are $47,060 for men and $31,099 for women, a difference of 33.9%. Men with an educational attainment of graduate degree enjoy the highest average annual earnings of $93,365, while those with high school diploma education earn the least with $39,332. Women with an educational attainment of graduate degree earn the most with the average annual earnings of $70,313, while those with less than high school education have the smallest earnings of $10,754.
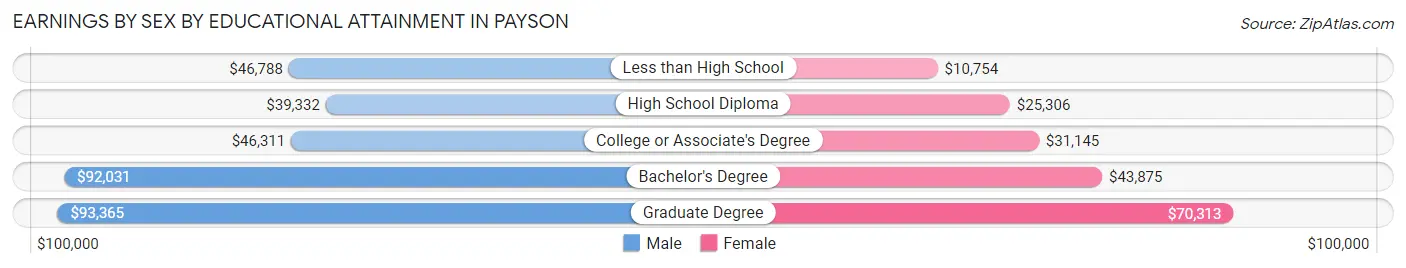
| Educational Attainment | Male Income | Female Income |
| Less than High School | $46,788 | $10,754 |
| High School Diploma | $39,332 | $25,306 |
| College or Associate's Degree | $46,311 | $31,145 |
| Bachelor's Degree | $92,031 | $43,875 |
| Graduate Degree | $93,365 | $70,313 |
| Total | $47,060 | $31,099 |
Family Income in Payson
Family Income Brackets in Payson
According to the Payson family income data, there are 890 families falling into the $50,000 to $74,999 income range, which is the most common income bracket and makes up 19.9% of all families. Conversely, the $10,000 to $14,999 income bracket is the least frequent group with only 31 families (0.7%) belonging to this category.
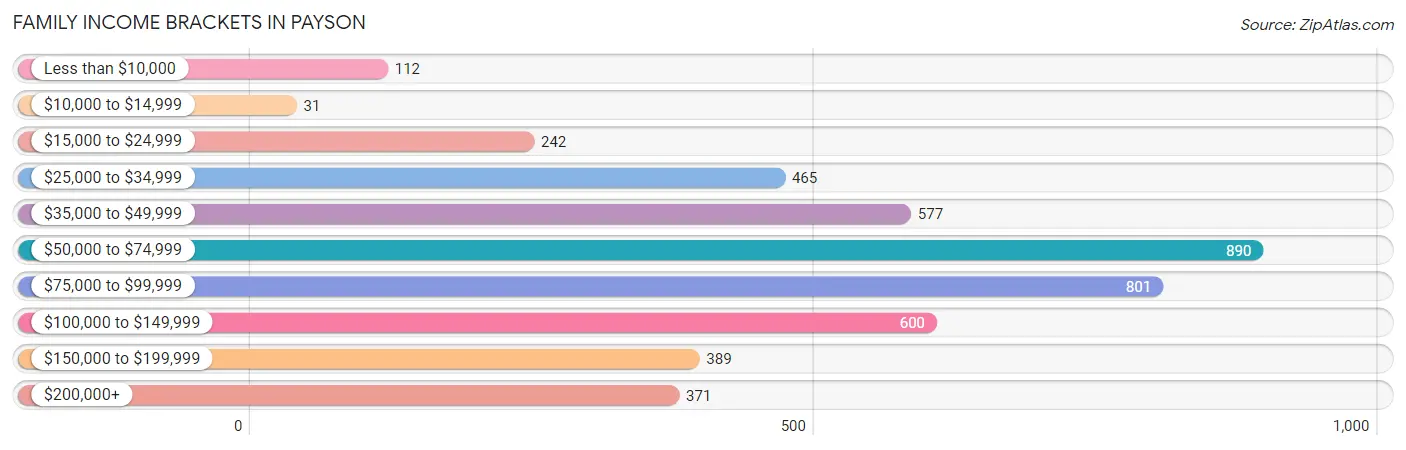
| Income Bracket | # Families | % Families |
| Less than $10,000 | 112 | 2.5% |
| $10,000 to $14,999 | 31 | 0.7% |
| $15,000 to $24,999 | 242 | 5.4% |
| $25,000 to $34,999 | 465 | 10.4% |
| $35,000 to $49,999 | 577 | 12.9% |
| $50,000 to $74,999 | 890 | 19.9% |
| $75,000 to $99,999 | 801 | 17.9% |
| $100,000 to $149,999 | 600 | 13.4% |
| $150,000 to $199,999 | 389 | 8.7% |
| $200,000+ | 371 | 8.3% |
Family Income by Famaliy Size in Payson
5-person families (158 | 3.5%) account for the highest median family income in Payson with $108,421 per family, while 2-person families (2,763 | 61.8%) have the highest median income of $36,814 per family member.
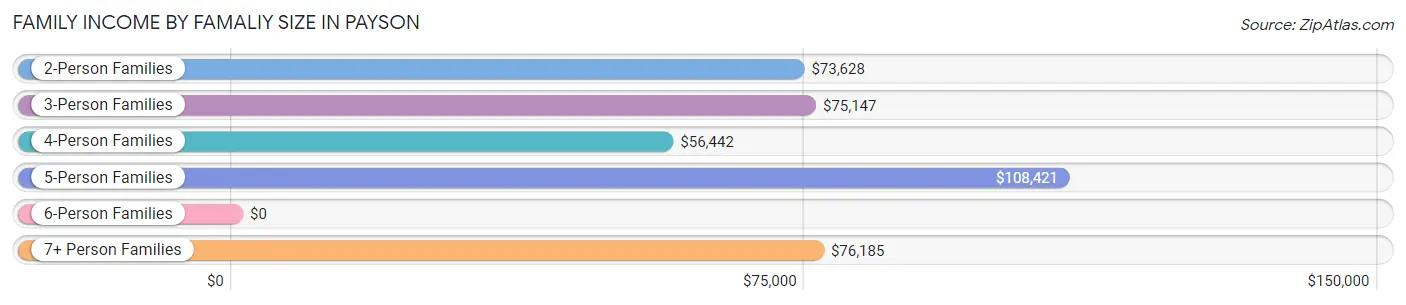
| Income Bracket | # Families | Median Income |
| 2-Person Families | 2,763 (61.8%) | $73,628 |
| 3-Person Families | 686 (15.3%) | $75,147 |
| 4-Person Families | 730 (16.3%) | $56,442 |
| 5-Person Families | 158 (3.5%) | $108,421 |
| 6-Person Families | 18 (0.4%) | $0 |
| 7+ Person Families | 119 (2.7%) | $76,185 |
| Total | 4,474 (100.0%) | $73,812 |
Family Income by Number of Earners in Payson
The median family income in Payson is $73,812, with families comprising 3+ earners (220) having the highest median family income of $157,143, while families with no earners (1,420) have the lowest median family income of $55,991, accounting for 4.9% and 31.7% of families, respectively.
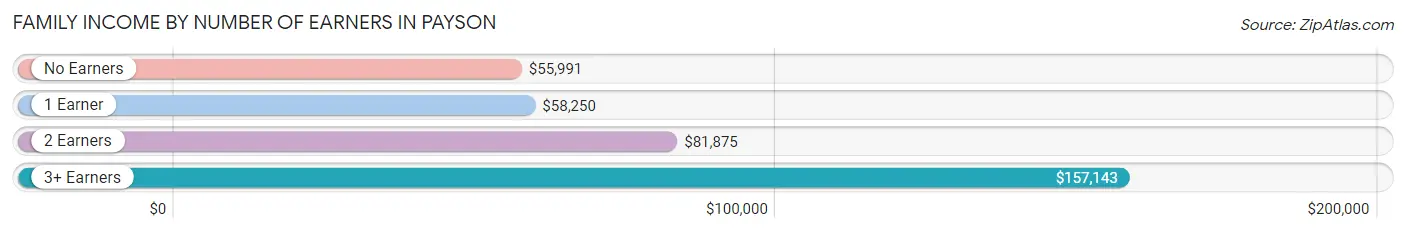
| Number of Earners | # Families | Median Income |
| No Earners | 1,420 (31.7%) | $55,991 |
| 1 Earner | 1,378 (30.8%) | $58,250 |
| 2 Earners | 1,456 (32.5%) | $81,875 |
| 3+ Earners | 220 (4.9%) | $157,143 |
| Total | 4,474 (100.0%) | $73,812 |
Household Income in Payson
Household Income Brackets in Payson
With 1,474 households falling in the category, the $50,000 to $74,999 income range is the most frequent in Payson, accounting for 19.5% of all households. In contrast, only 212 households (2.8%) fall into the $10,000 to $14,999 income bracket, making it the least populous group.
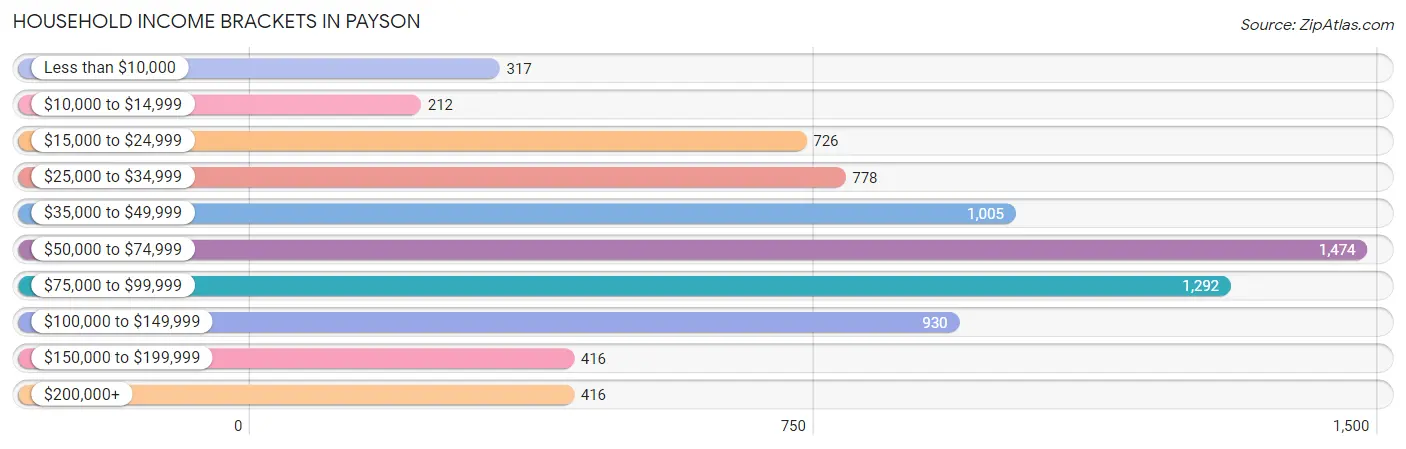
| Income Bracket | # Households | % Households |
| Less than $10,000 | 317 | 4.2% |
| $10,000 to $14,999 | 212 | 2.8% |
| $15,000 to $24,999 | 726 | 9.6% |
| $25,000 to $34,999 | 778 | 10.3% |
| $35,000 to $49,999 | 1,005 | 13.3% |
| $50,000 to $74,999 | 1,474 | 19.5% |
| $75,000 to $99,999 | 1,292 | 17.1% |
| $100,000 to $149,999 | 930 | 12.3% |
| $150,000 to $199,999 | 416 | 5.5% |
| $200,000+ | 416 | 5.5% |
Household Income by Householder Age in Payson
The median household income in Payson is $60,095, with the highest median household income of $80,527 found in the 15 to 24 years age bracket for the primary householder. A total of 191 households (2.5%) fall into this category. Meanwhile, the 65+ years age bracket for the primary householder has the lowest median household income of $51,182, with 4,053 households (53.6%) in this group.
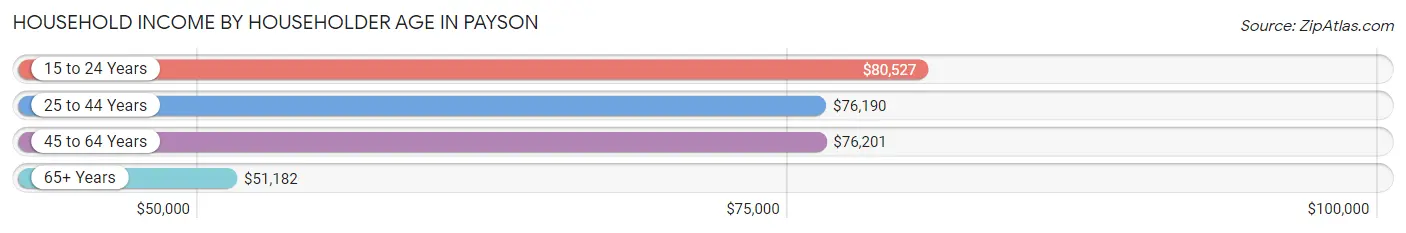
| Income Bracket | # Households | Median Income |
| 15 to 24 Years | 191 (2.5%) | $80,527 |
| 25 to 44 Years | 1,309 (17.3%) | $76,190 |
| 45 to 64 Years | 2,005 (26.5%) | $76,201 |
| 65+ Years | 4,053 (53.6%) | $51,182 |
| Total | 7,558 (100.0%) | $60,095 |
Poverty in Payson
Income Below Poverty by Sex and Age in Payson
With 7.8% poverty level for males and 10.8% for females among the residents of Payson, 16 and 17 year old males and 16 and 17 year old females are the most vulnerable to poverty, with 41 males (24.3%) and 45 females (36.3%) in their respective age groups living below the poverty level.
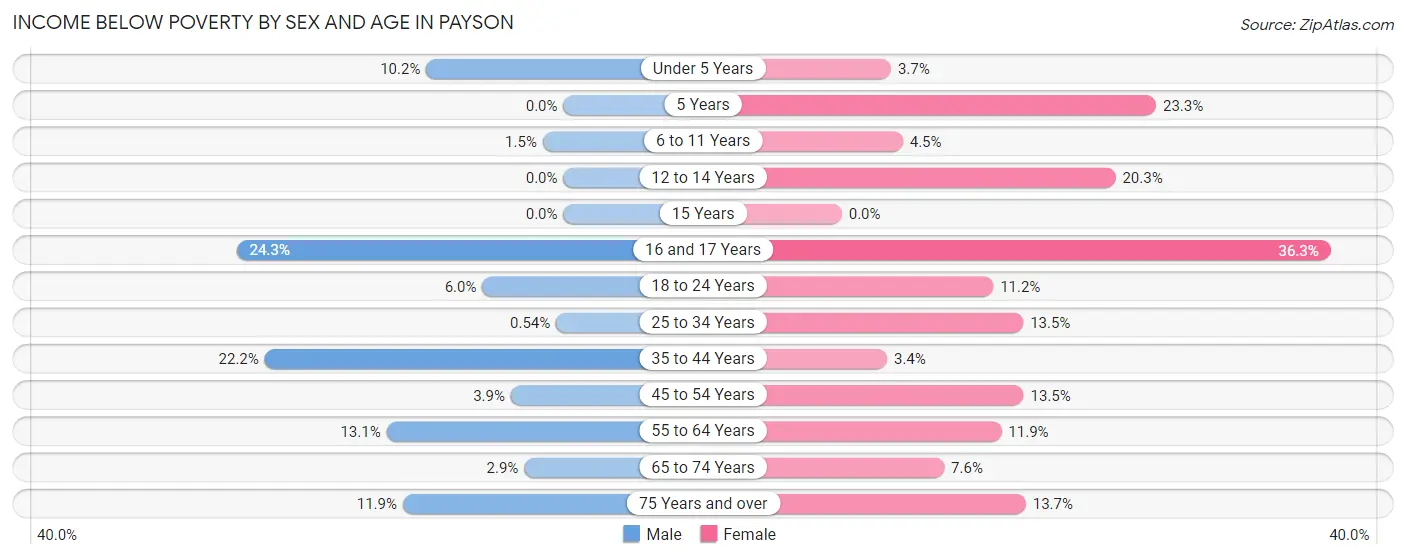
| Age Bracket | Male | Female |
| Under 5 Years | 29 (10.2%) | 10 (3.6%) |
| 5 Years | 0 (0.0%) | 21 (23.3%) |
| 6 to 11 Years | 10 (1.5%) | 21 (4.5%) |
| 12 to 14 Years | 0 (0.0%) | 38 (20.3%) |
| 15 Years | 0 (0.0%) | 0 (0.0%) |
| 16 and 17 Years | 41 (24.3%) | 45 (36.3%) |
| 18 to 24 Years | 20 (6.0%) | 49 (11.2%) |
| 25 to 34 Years | 4 (0.5%) | 113 (13.5%) |
| 35 to 44 Years | 116 (22.2%) | 19 (3.4%) |
| 45 to 54 Years | 24 (3.9%) | 76 (13.5%) |
| 55 to 64 Years | 171 (13.1%) | 184 (11.8%) |
| 65 to 74 Years | 47 (2.9%) | 134 (7.6%) |
| 75 Years and over | 131 (11.9%) | 205 (13.7%) |
| Total | 593 (7.8%) | 915 (10.8%) |
Income Above Poverty by Sex and Age in Payson
According to the poverty statistics in Payson, males aged 5 years and females aged 15 years are the age groups that are most secure financially, with 100.0% of males and 100.0% of females in these age groups living above the poverty line.
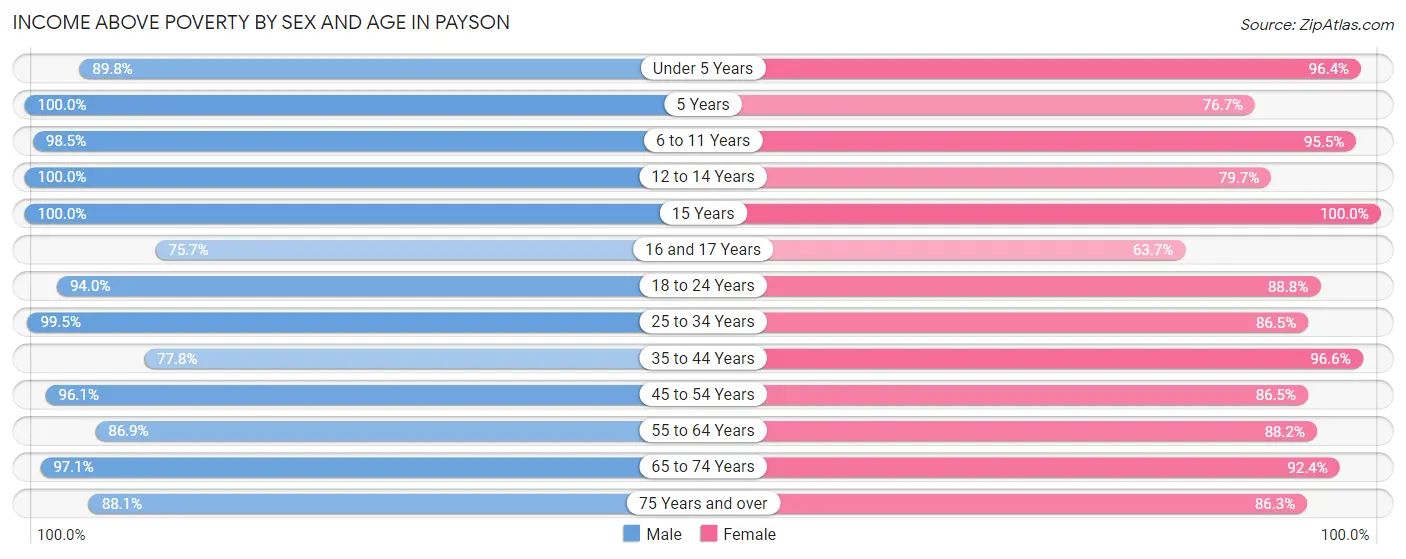
| Age Bracket | Male | Female |
| Under 5 Years | 256 (89.8%) | 264 (96.4%) |
| 5 Years | 13 (100.0%) | 69 (76.7%) |
| 6 to 11 Years | 643 (98.5%) | 443 (95.5%) |
| 12 to 14 Years | 218 (100.0%) | 149 (79.7%) |
| 15 Years | 34 (100.0%) | 94 (100.0%) |
| 16 and 17 Years | 128 (75.7%) | 79 (63.7%) |
| 18 to 24 Years | 312 (94.0%) | 387 (88.8%) |
| 25 to 34 Years | 740 (99.5%) | 726 (86.5%) |
| 35 to 44 Years | 407 (77.8%) | 547 (96.6%) |
| 45 to 54 Years | 591 (96.1%) | 487 (86.5%) |
| 55 to 64 Years | 1,131 (86.9%) | 1,369 (88.1%) |
| 65 to 74 Years | 1,566 (97.1%) | 1,628 (92.4%) |
| 75 Years and over | 968 (88.1%) | 1,296 (86.3%) |
| Total | 7,007 (92.2%) | 7,538 (89.2%) |
Income Below Poverty Among Married-Couple Families in Payson
The poverty statistics for married-couple families in Payson show that 4.6% or 175 of the total 3,812 families live below the poverty line. Families with no children have the highest poverty rate of 4.9%, comprising of 135 families. On the other hand, families with 3 or 4 children have the lowest poverty rate of 0.0%, which includes 0 families.
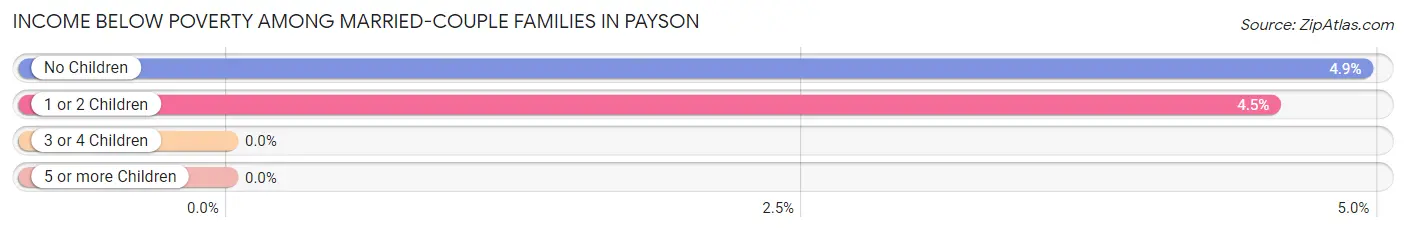
| Children | Above Poverty | Below Poverty |
| No Children | 2,598 (95.1%) | 135 (4.9%) |
| 1 or 2 Children | 842 (95.5%) | 40 (4.5%) |
| 3 or 4 Children | 137 (100.0%) | 0 (0.0%) |
| 5 or more Children | 60 (100.0%) | 0 (0.0%) |
| Total | 3,637 (95.4%) | 175 (4.6%) |
Income Below Poverty Among Single-Parent Households in Payson
According to the poverty data in Payson, 26.3% or 45 single-father households and 15.9% or 78 single-mother households are living below the poverty line. Among single-father households, those with no children have the highest poverty rate, with 45 households (30.0%) experiencing poverty. Likewise, among single-mother households, those with 3 or 4 children have the highest poverty rate, with 37 households (74.0%) falling below the poverty line.
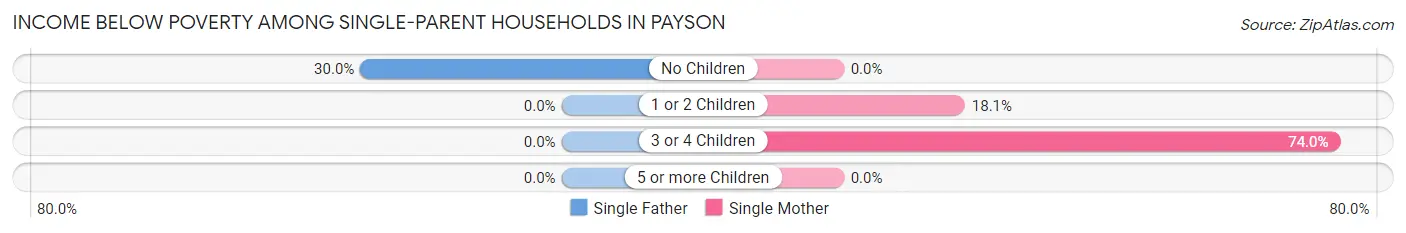
| Children | Single Father | Single Mother |
| No Children | 45 (30.0%) | 0 (0.0%) |
| 1 or 2 Children | 0 (0.0%) | 41 (18.1%) |
| 3 or 4 Children | 0 (0.0%) | 37 (74.0%) |
| 5 or more Children | 0 (0.0%) | 0 (0.0%) |
| Total | 45 (26.3%) | 78 (15.9%) |
Income Below Poverty Among Married-Couple vs Single-Parent Households in Payson
The poverty data for Payson shows that 175 of the married-couple family households (4.6%) and 123 of the single-parent households (18.6%) are living below the poverty level. Within the married-couple family households, those with no children have the highest poverty rate, with 135 households (4.9%) falling below the poverty line. Among the single-parent households, those with 3 or 4 children have the highest poverty rate, with 37 household (74.0%) living below poverty.
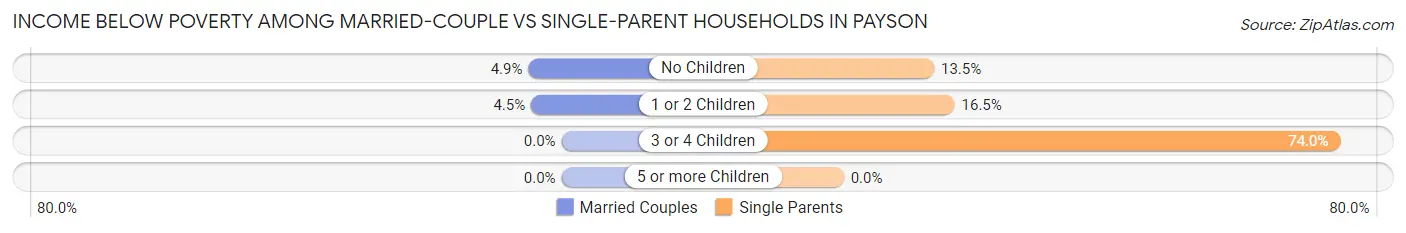
| Children | Married-Couple Families | Single-Parent Households |
| No Children | 135 (4.9%) | 45 (13.5%) |
| 1 or 2 Children | 40 (4.5%) | 41 (16.5%) |
| 3 or 4 Children | 0 (0.0%) | 37 (74.0%) |
| 5 or more Children | 0 (0.0%) | 0 (0.0%) |
| Total | 175 (4.6%) | 123 (18.6%) |
Race in Payson
The most populous races in Payson are White / Caucasian (14,543 | 88.9%), Hispanic or Latino (2,122 | 13.0%), and Two or more Races (782 | 4.8%).
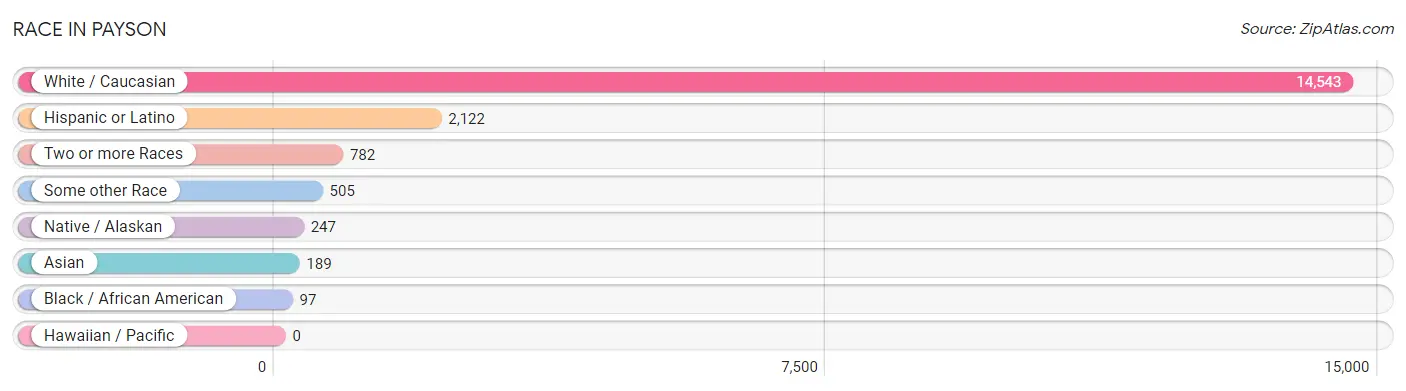
| Race | # Population | % Population |
| Asian | 189 | 1.2% |
| Black / African American | 97 | 0.6% |
| Hawaiian / Pacific | 0 | 0.0% |
| Hispanic or Latino | 2,122 | 13.0% |
| Native / Alaskan | 247 | 1.5% |
| White / Caucasian | 14,543 | 88.9% |
| Two or more Races | 782 | 4.8% |
| Some other Race | 505 | 3.1% |
| Total | 16,363 | 100.0% |
Ancestry in Payson
The most populous ancestries reported in Payson are German (3,002 | 18.3%), English (2,307 | 14.1%), Irish (2,071 | 12.7%), Mexican (1,842 | 11.3%), and American (982 | 6.0%), together accounting for 62.4% of all Payson residents.
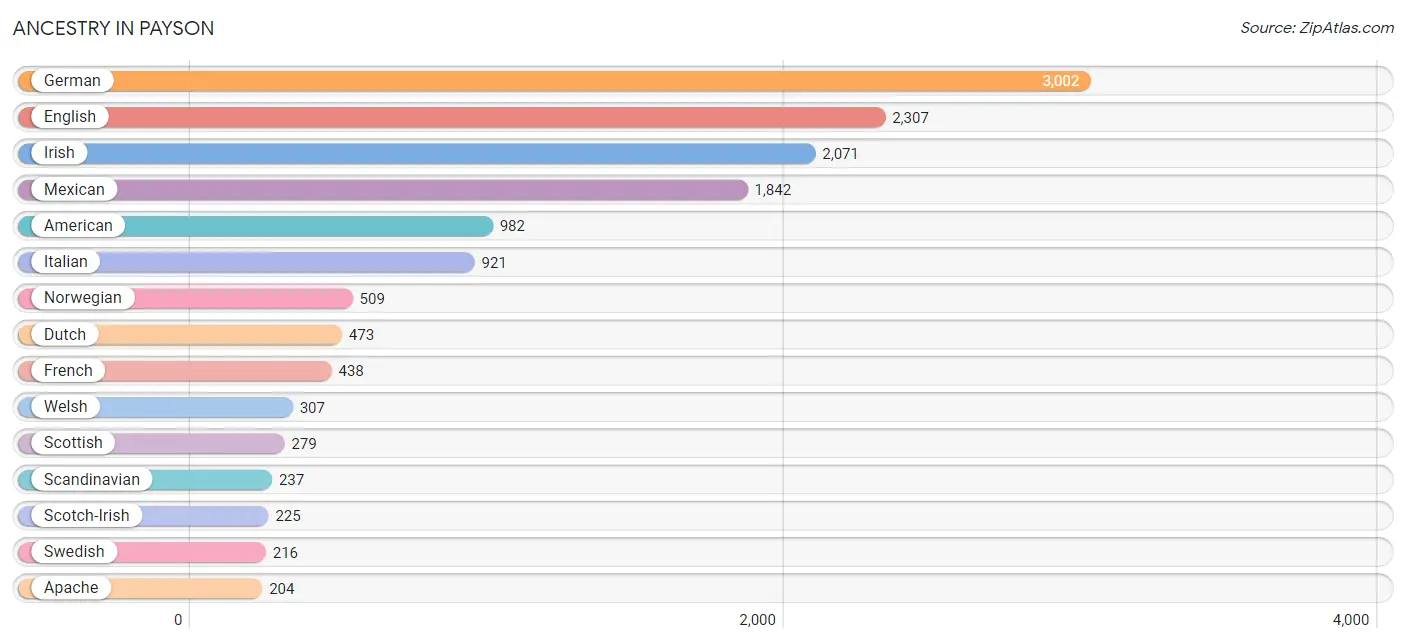
| Ancestry | # Population | % Population |
| American | 982 | 6.0% |
| Apache | 204 | 1.3% |
| Arab | 19 | 0.1% |
| Assyrian / Chaldean / Syriac | 22 | 0.1% |
| Australian | 11 | 0.1% |
| Austrian | 13 | 0.1% |
| Belgian | 47 | 0.3% |
| Bhutanese | 33 | 0.2% |
| Brazilian | 13 | 0.1% |
| British | 106 | 0.6% |
| Canadian | 8 | 0.1% |
| Celtic | 8 | 0.1% |
| Central American | 159 | 1.0% |
| Cherokee | 28 | 0.2% |
| Choctaw | 8 | 0.1% |
| Colombian | 27 | 0.2% |
| Cuban | 17 | 0.1% |
| Czech | 141 | 0.9% |
| Czechoslovakian | 15 | 0.1% |
| Danish | 127 | 0.8% |
| Dutch | 473 | 2.9% |
| Dutch West Indian | 11 | 0.1% |
| English | 2,307 | 14.1% |
| European | 67 | 0.4% |
| Finnish | 98 | 0.6% |
| French | 438 | 2.7% |
| French Canadian | 198 | 1.2% |
| German | 3,002 | 18.3% |
| Greek | 16 | 0.1% |
| Guatemalan | 101 | 0.6% |
| Honduran | 21 | 0.1% |
| Hopi | 8 | 0.1% |
| Hungarian | 14 | 0.1% |
| Indian (Asian) | 28 | 0.2% |
| Irish | 2,071 | 12.7% |
| Italian | 921 | 5.6% |
| Jamaican | 17 | 0.1% |
| Japanese | 125 | 0.8% |
| Korean | 83 | 0.5% |
| Laotian | 15 | 0.1% |
| Lithuanian | 101 | 0.6% |
| Mexican | 1,842 | 11.3% |
| Mexican American Indian | 51 | 0.3% |
| Navajo | 68 | 0.4% |
| Nigerian | 18 | 0.1% |
| Northern European | 27 | 0.2% |
| Norwegian | 509 | 3.1% |
| Panamanian | 37 | 0.2% |
| Pennsylvania German | 9 | 0.1% |
| Polish | 195 | 1.2% |
| Portuguese | 108 | 0.7% |
| Pueblo | 11 | 0.1% |
| Puerto Rican | 18 | 0.1% |
| Romanian | 73 | 0.4% |
| Russian | 51 | 0.3% |
| Scandinavian | 237 | 1.5% |
| Scotch-Irish | 225 | 1.4% |
| Scottish | 279 | 1.7% |
| Serbian | 14 | 0.1% |
| Slavic | 9 | 0.1% |
| Slovak | 21 | 0.1% |
| Slovene | 13 | 0.1% |
| South African | 16 | 0.1% |
| South American | 27 | 0.2% |
| Spanish American | 33 | 0.2% |
| Sri Lankan | 33 | 0.2% |
| Subsaharan African | 34 | 0.2% |
| Swedish | 216 | 1.3% |
| Swiss | 114 | 0.7% |
| Turkish | 86 | 0.5% |
| Ukrainian | 30 | 0.2% |
| Welsh | 307 | 1.9% |
| Yaqui | 11 | 0.1% |
| Yugoslavian | 8 | 0.1% | View All 74 Rows |
Immigrants in Payson
The most numerous immigrant groups reported in Payson came from Latin America (299 | 1.8%), Central America (282 | 1.7%), Mexico (201 | 1.2%), Asia (180 | 1.1%), and Europe (169 | 1.0%), together accounting for 6.9% of all Payson residents.
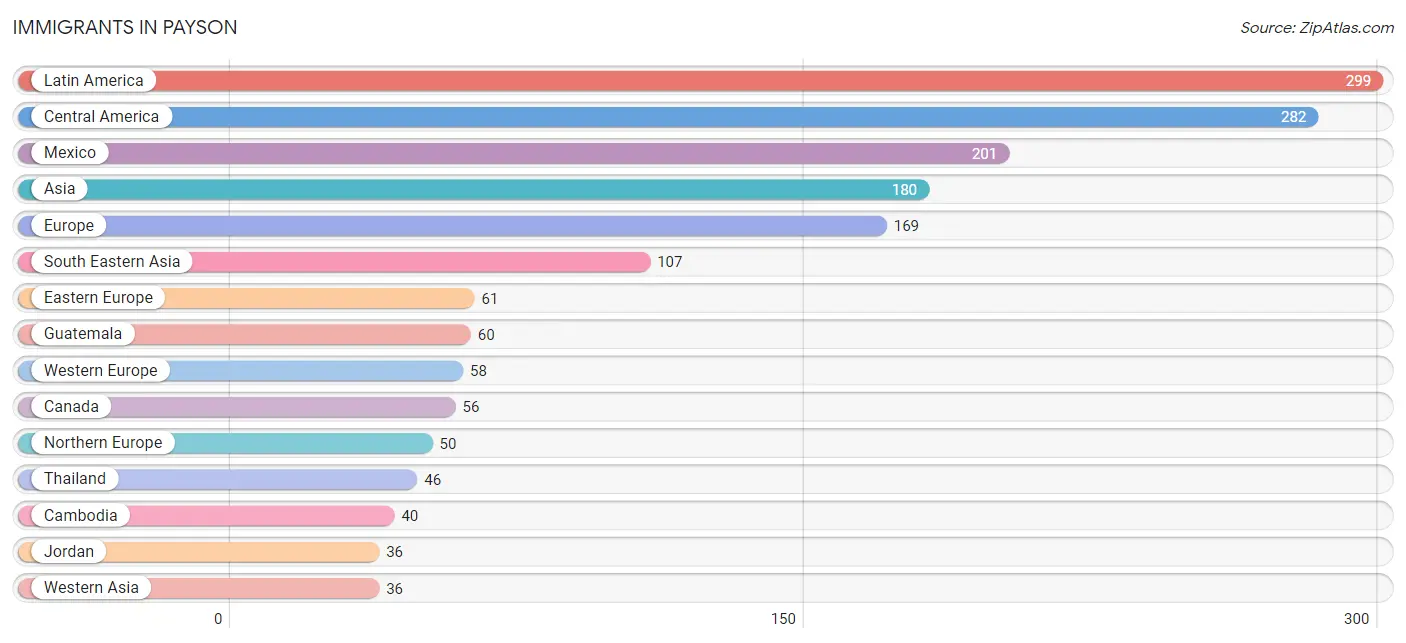
| Immigration Origin | # Population | % Population |
| Africa | 29 | 0.2% |
| Asia | 180 | 1.1% |
| Cambodia | 40 | 0.2% |
| Canada | 56 | 0.3% |
| Caribbean | 17 | 0.1% |
| Central America | 282 | 1.7% |
| Eastern Asia | 15 | 0.1% |
| Eastern Europe | 61 | 0.4% |
| Europe | 169 | 1.0% |
| Germany | 35 | 0.2% |
| Guatemala | 60 | 0.4% |
| Honduras | 21 | 0.1% |
| Iran | 22 | 0.1% |
| Ireland | 17 | 0.1% |
| Jamaica | 17 | 0.1% |
| Japan | 15 | 0.1% |
| Jordan | 36 | 0.2% |
| Latin America | 299 | 1.8% |
| Mexico | 201 | 1.2% |
| Netherlands | 14 | 0.1% |
| Northern Europe | 50 | 0.3% |
| Philippines | 21 | 0.1% |
| Romania | 15 | 0.1% |
| Russia | 16 | 0.1% |
| South Africa | 29 | 0.2% |
| South Central Asia | 22 | 0.1% |
| South Eastern Asia | 107 | 0.6% |
| Sweden | 10 | 0.1% |
| Switzerland | 9 | 0.1% |
| Thailand | 46 | 0.3% |
| Ukraine | 30 | 0.2% |
| Western Asia | 36 | 0.2% |
| Western Europe | 58 | 0.4% | View All 33 Rows |
Sex and Age in Payson
Sex and Age in Payson
The most populous age groups in Payson are 65 to 69 Years (832 | 10.7%) for men and 60 to 64 Years (958 | 11.2%) for women.
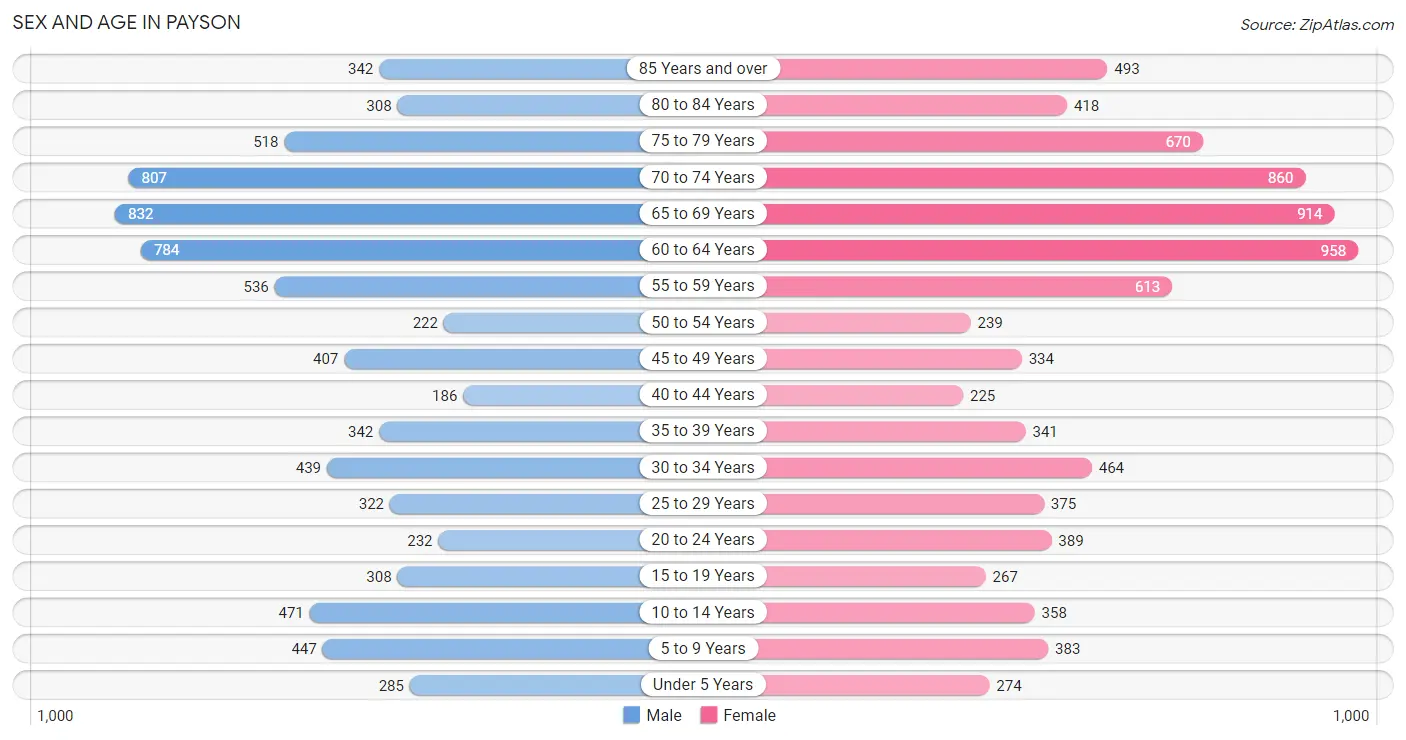
| Age Bracket | Male | Female |
| Under 5 Years | 285 (3.7%) | 274 (3.2%) |
| 5 to 9 Years | 447 (5.7%) | 383 (4.5%) |
| 10 to 14 Years | 471 (6.0%) | 358 (4.2%) |
| 15 to 19 Years | 308 (4.0%) | 267 (3.1%) |
| 20 to 24 Years | 232 (3.0%) | 389 (4.5%) |
| 25 to 29 Years | 322 (4.1%) | 375 (4.4%) |
| 30 to 34 Years | 439 (5.6%) | 464 (5.4%) |
| 35 to 39 Years | 342 (4.4%) | 341 (4.0%) |
| 40 to 44 Years | 186 (2.4%) | 225 (2.6%) |
| 45 to 49 Years | 407 (5.2%) | 334 (3.9%) |
| 50 to 54 Years | 222 (2.9%) | 239 (2.8%) |
| 55 to 59 Years | 536 (6.9%) | 613 (7.1%) |
| 60 to 64 Years | 784 (10.1%) | 958 (11.2%) |
| 65 to 69 Years | 832 (10.7%) | 914 (10.7%) |
| 70 to 74 Years | 807 (10.4%) | 860 (10.0%) |
| 75 to 79 Years | 518 (6.7%) | 670 (7.8%) |
| 80 to 84 Years | 308 (4.0%) | 418 (4.9%) |
| 85 Years and over | 342 (4.4%) | 493 (5.8%) |
| Total | 7,788 (100.0%) | 8,575 (100.0%) |
Families and Households in Payson
Median Family Size in Payson
The median family size in Payson is 2.72 persons per family, with single female/mother families (491 | 11.0%) accounting for the largest median family size of 3.12 persons per family. On the other hand, married-couple families (3,812 | 85.2%) represent the smallest median family size with 2.67 persons per family.
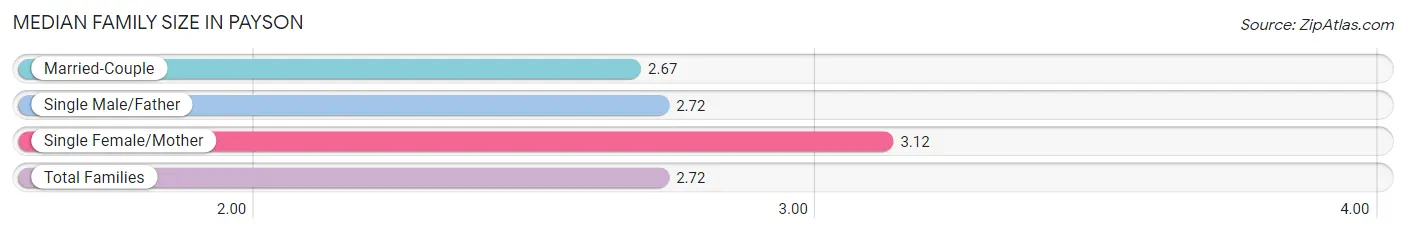
| Family Type | # Families | Family Size |
| Married-Couple | 3,812 (85.2%) | 2.67 |
| Single Male/Father | 171 (3.8%) | 2.72 |
| Single Female/Mother | 491 (11.0%) | 3.12 |
| Total Families | 4,474 (100.0%) | 2.72 |
Median Household Size in Payson
The median household size in Payson is 2.11 persons per household, with single female/mother households (491 | 6.5%) accounting for the largest median household size of 3.48 persons per household. non-family households (3,084 | 40.8%) represent the smallest median household size with 1.15 persons per household.
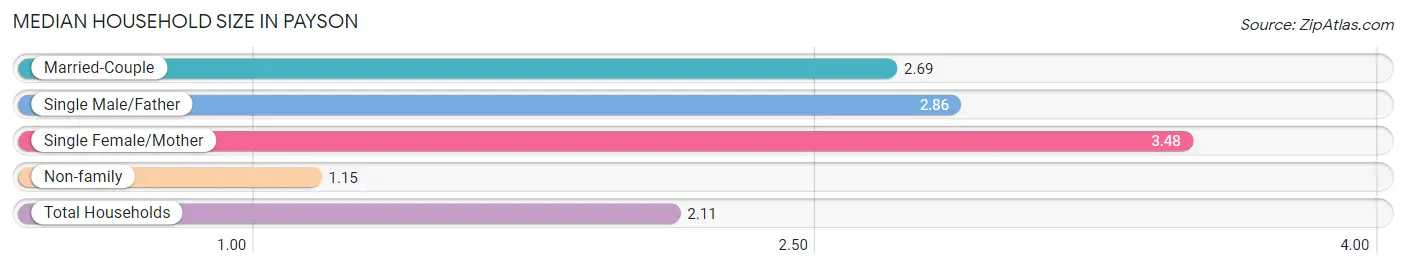
| Household Type | # Households | Household Size |
| Married-Couple | 3,812 (50.4%) | 2.69 |
| Single Male/Father | 171 (2.3%) | 2.86 |
| Single Female/Mother | 491 (6.5%) | 3.48 |
| Non-family | 3,084 (40.8%) | 1.15 |
| Total Households | 7,558 (100.0%) | 2.11 |
Household Size by Marriage Status in Payson
Out of a total of 7,558 households in Payson, 4,474 (59.2%) are family households, while 3,084 (40.8%) are nonfamily households. The most numerous type of family households are 2-person households, comprising 2,625, and the most common type of nonfamily households are 1-person households, comprising 2,586.
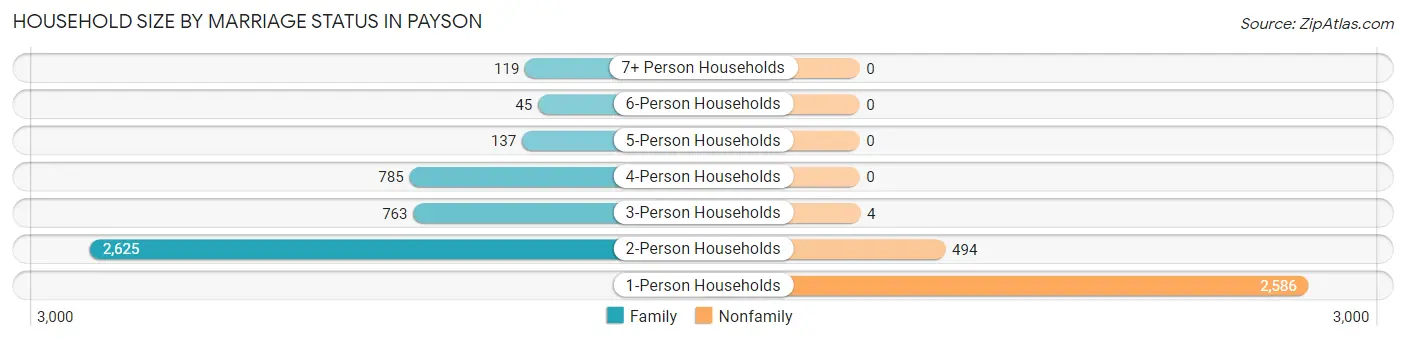
| Household Size | Family Households | Nonfamily Households |
| 1-Person Households | - | 2,586 (34.2%) |
| 2-Person Households | 2,625 (34.7%) | 494 (6.5%) |
| 3-Person Households | 763 (10.1%) | 4 (0.1%) |
| 4-Person Households | 785 (10.4%) | 0 (0.0%) |
| 5-Person Households | 137 (1.8%) | 0 (0.0%) |
| 6-Person Households | 45 (0.6%) | 0 (0.0%) |
| 7+ Person Households | 119 (1.6%) | 0 (0.0%) |
| Total | 4,474 (59.2%) | 3,084 (40.8%) |
Female Fertility in Payson
Fertility by Age in Payson
Average fertility rate in Payson is 59.0 births per 1,000 women. Women in the age bracket of 20 to 34 years have the highest fertility rate with 103.0 births per 1,000 women. Women in the age bracket of 20 to 34 years acount for 88.8% of all women with births.
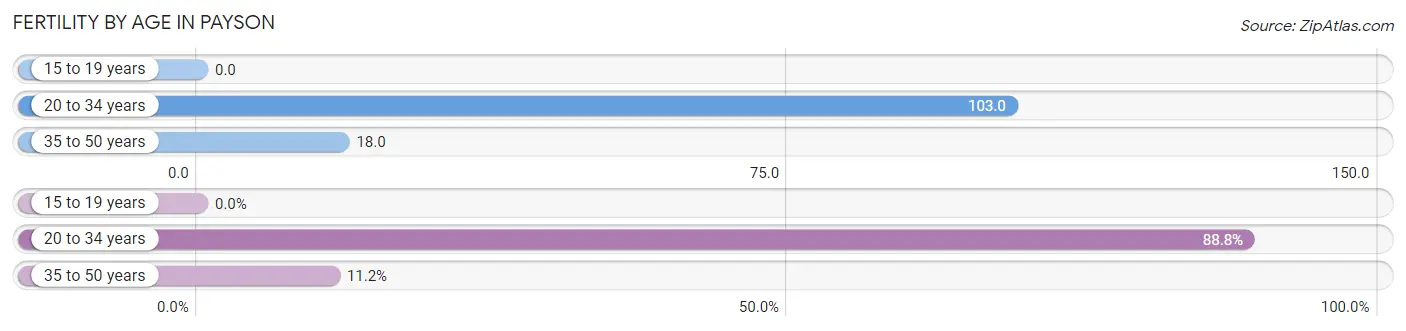
| Age Bracket | Women with Births | Births / 1,000 Women |
| 15 to 19 years | 0 (0.0%) | 0.0 |
| 20 to 34 years | 127 (88.8%) | 103.0 |
| 35 to 50 years | 16 (11.2%) | 18.0 |
| Total | 143 (100.0%) | 59.0 |
Fertility by Age by Marriage Status in Payson
86.0% of women with births (143) in Payson are married. The highest percentage of unmarried women with births falls into 20 to 34 years age bracket with 15.8% of them unmarried at the time of birth, while the lowest percentage of unmarried women with births belong to 35 to 50 years age bracket with 0.0% of them unmarried.
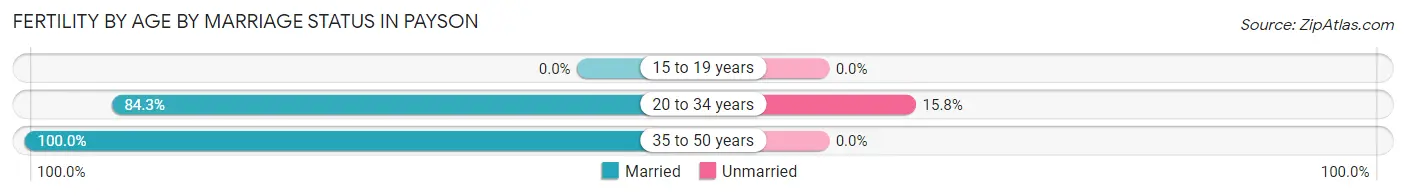
| Age Bracket | Married | Unmarried |
| 15 to 19 years | 0 (0.0%) | 0 (0.0%) |
| 20 to 34 years | 107 (84.3%) | 20 (15.8%) |
| 35 to 50 years | 16 (100.0%) | 0 (0.0%) |
| Total | 123 (86.0%) | 20 (14.0%) |
Fertility by Education in Payson
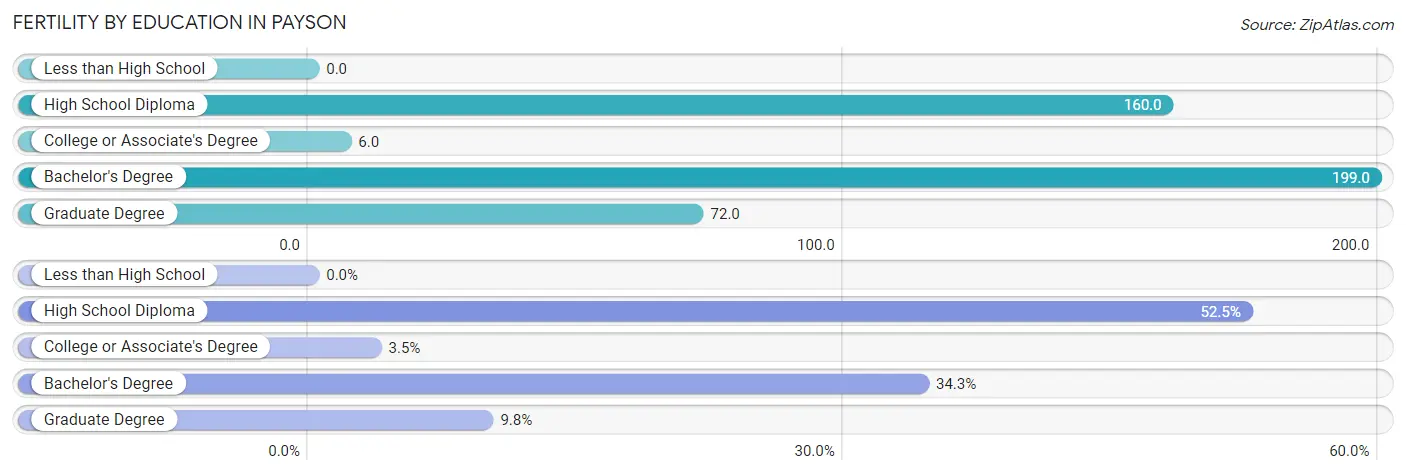
| Educational Attainment | Women with Births | Births / 1,000 Women |
| Less than High School | 0 (0.0%) | 0.0 |
| High School Diploma | 75 (52.4%) | 160.0 |
| College or Associate's Degree | 5 (3.5%) | 6.0 |
| Bachelor's Degree | 49 (34.3%) | 199.0 |
| Graduate Degree | 14 (9.8%) | 72.0 |
| Total | 143 (100.0%) | 59.0 |
Fertility by Education by Marriage Status in Payson
14.0% of women with births in Payson are unmarried. Women with the educational attainment of bachelor's degree are most likely to be married with 100.0% of them married at childbirth, while women with the educational attainment of college or associate's degree are least likely to be married with 60.0% of them unmarried at childbirth.
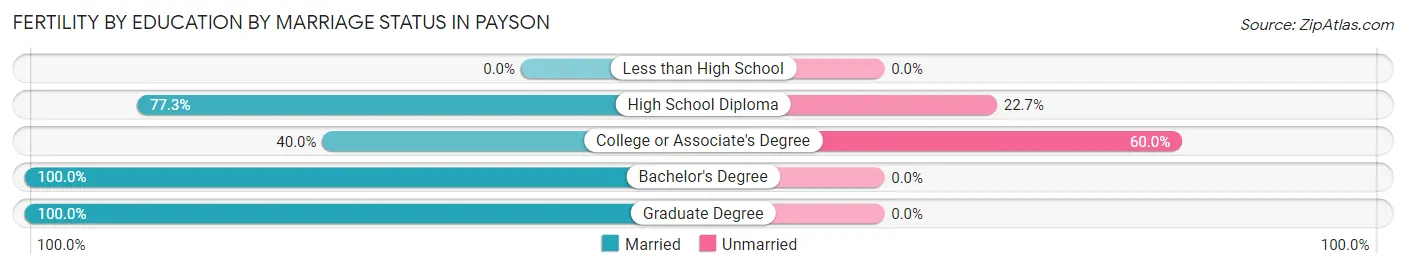
| Educational Attainment | Married | Unmarried |
| Less than High School | 0 (0.0%) | 0 (0.0%) |
| High School Diploma | 58 (77.3%) | 17 (22.7%) |
| College or Associate's Degree | 2 (40.0%) | 3 (60.0%) |
| Bachelor's Degree | 49 (100.0%) | 0 (0.0%) |
| Graduate Degree | 14 (100.0%) | 0 (0.0%) |
| Total | 123 (86.0%) | 20 (14.0%) |
Employment Characteristics in Payson
Employment by Class of Employer in Payson
Among the 5,661 employed individuals in Payson, private company employees (3,485 | 61.6%), local government employees (515 | 9.1%), and not-for-profit organizations (470 | 8.3%) make up the most common classes of employment.
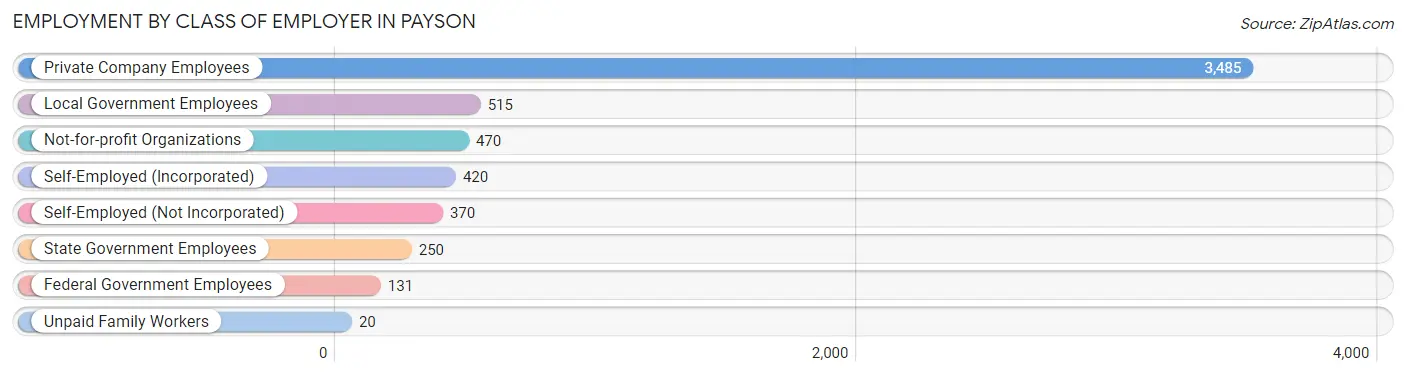
| Employer Class | # Employees | % Employees |
| Private Company Employees | 3,485 | 61.6% |
| Self-Employed (Incorporated) | 420 | 7.4% |
| Self-Employed (Not Incorporated) | 370 | 6.5% |
| Not-for-profit Organizations | 470 | 8.3% |
| Local Government Employees | 515 | 9.1% |
| State Government Employees | 250 | 4.4% |
| Federal Government Employees | 131 | 2.3% |
| Unpaid Family Workers | 20 | 0.4% |
| Total | 5,661 | 100.0% |
Employment Status by Age in Payson
According to the labor force statistics for Payson, out of the total population over 16 years of age (14,017), 44.6% or 6,252 individuals are in the labor force, with 7.0% or 438 of them unemployed. The age group with the highest labor force participation rate is 25 to 29 years, with 88.5% or 617 individuals in the labor force. Within the labor force, the 16 to 19 years age range has the highest percentage of unemployed individuals, with 67.2% or 92 of them being unemployed.
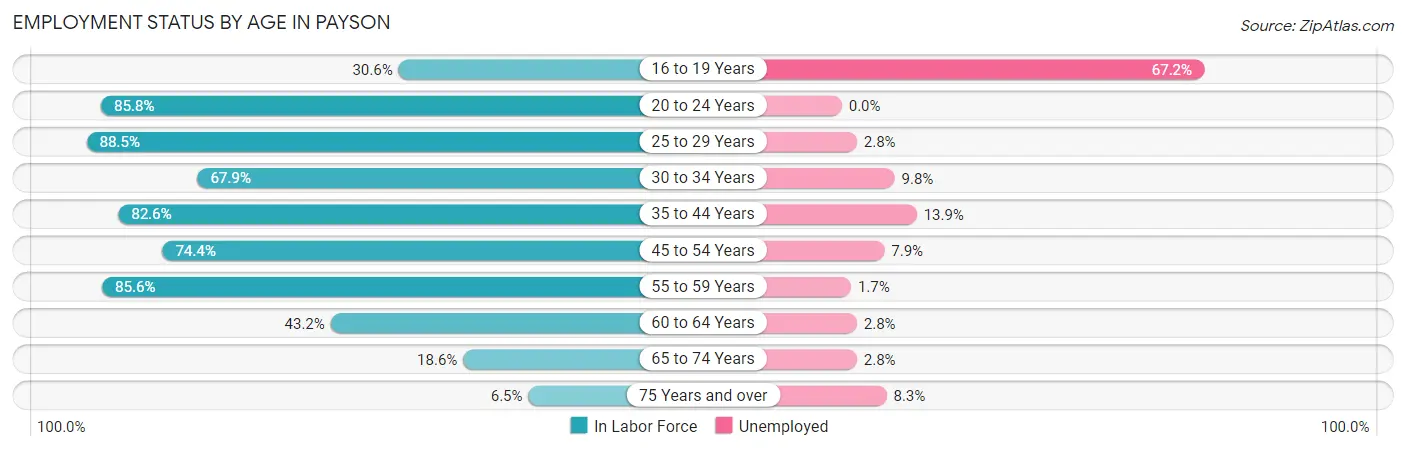
| Age Bracket | In Labor Force | Unemployed |
| 16 to 19 Years | 137 (30.6%) | 92 (67.2%) |
| 20 to 24 Years | 533 (85.8%) | 0 (0.0%) |
| 25 to 29 Years | 617 (88.5%) | 17 (2.8%) |
| 30 to 34 Years | 613 (67.9%) | 60 (9.8%) |
| 35 to 44 Years | 904 (82.6%) | 126 (13.9%) |
| 45 to 54 Years | 894 (74.4%) | 71 (7.9%) |
| 55 to 59 Years | 984 (85.6%) | 17 (1.7%) |
| 60 to 64 Years | 753 (43.2%) | 21 (2.8%) |
| 65 to 74 Years | 635 (18.6%) | 18 (2.8%) |
| 75 Years and over | 179 (6.5%) | 15 (8.3%) |
| Total | 6,252 (44.6%) | 438 (7.0%) |
Employment Status by Educational Attainment in Payson
According to labor force statistics for Payson, 70.2% of individuals (4,764) out of the total population between 25 and 64 years of age (6,787) are in the labor force, with 6.6% or 314 of them being unemployed. The group with the highest labor force participation rate are those with the educational attainment of less than high school, with 78.0% or 533 individuals in the labor force. Within the labor force, individuals with less than high school education have the highest percentage of unemployment, with 38.8% or 207 of them being unemployed.
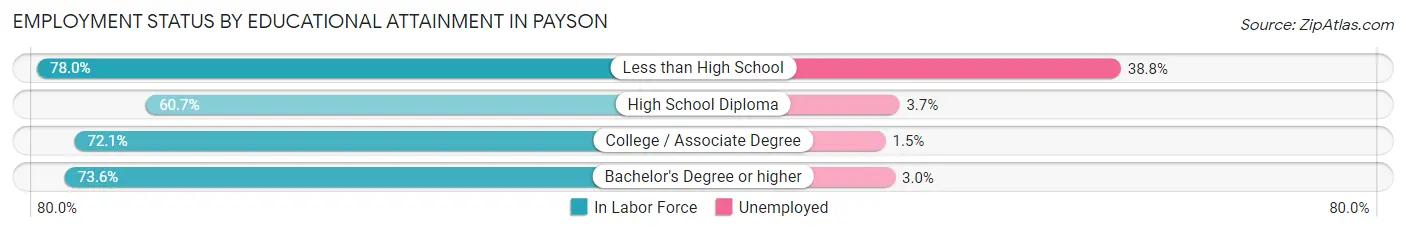
| Educational Attainment | In Labor Force | Unemployed |
| Less than High School | 533 (78.0%) | 265 (38.8%) |
| High School Diploma | 1,039 (60.7%) | 63 (3.7%) |
| College / Associate Degree | 1,917 (72.1%) | 40 (1.5%) |
| Bachelor's Degree or higher | 1,275 (73.6%) | 52 (3.0%) |
| Total | 4,764 (70.2%) | 448 (6.6%) |
Employment Occupations by Sex in Payson
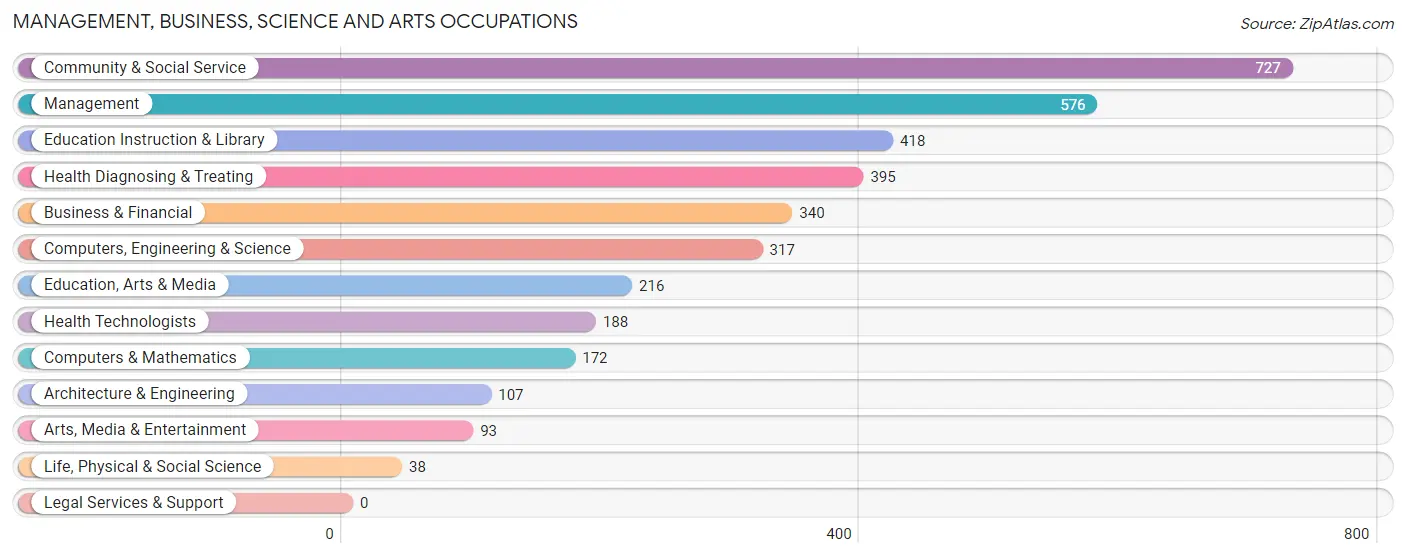
Management, Business, Science and Arts Occupations
The most common Management, Business, Science and Arts occupations in Payson are Community & Social Service (727 | 12.5%), Management (576 | 9.9%), Education Instruction & Library (418 | 7.2%), Health Diagnosing & Treating (395 | 6.8%), and Business & Financial (340 | 5.9%).
Management, Business, Science and Arts Occupations by Sex
Within the Management, Business, Science and Arts occupations in Payson, the most male-oriented occupations are Architecture & Engineering (79.4%), Arts, Media & Entertainment (71.0%), and Computers, Engineering & Science (64.0%), while the most female-oriented occupations are Education, Arts & Media (81.9%), Health Technologists (73.9%), and Education Instruction & Library (69.4%).
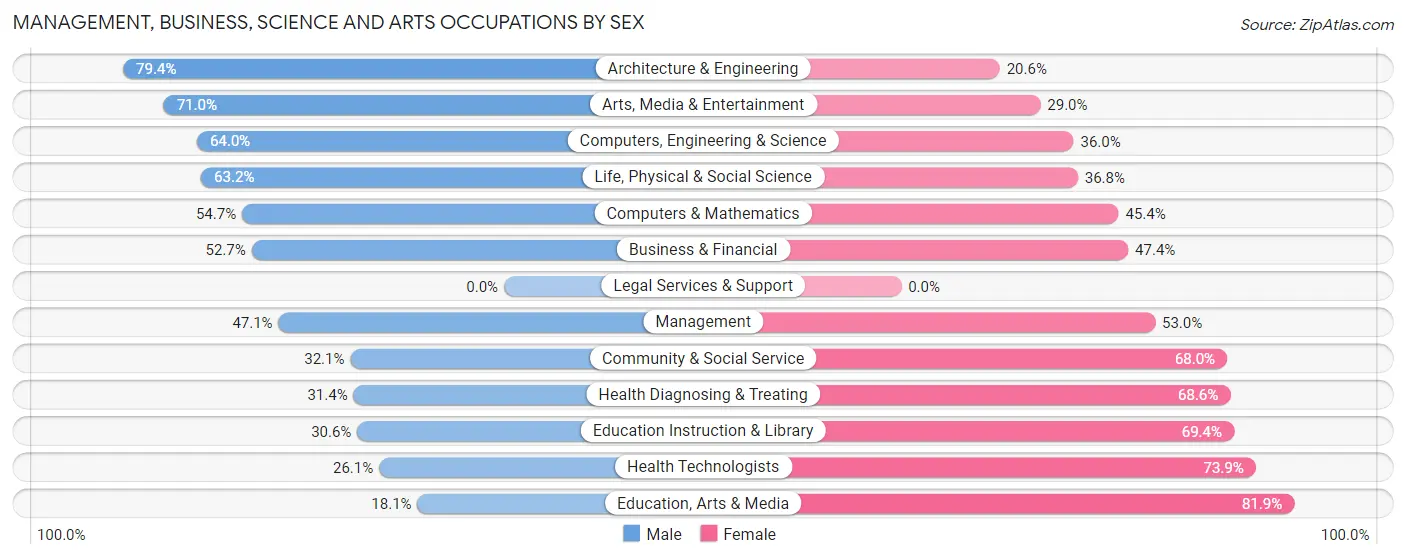
| Occupation | Male | Female |
| Management | 271 (47.0%) | 305 (52.9%) |
| Business & Financial | 179 (52.6%) | 161 (47.3%) |
| Computers, Engineering & Science | 203 (64.0%) | 114 (36.0%) |
| Computers & Mathematics | 94 (54.6%) | 78 (45.4%) |
| Architecture & Engineering | 85 (79.4%) | 22 (20.6%) |
| Life, Physical & Social Science | 24 (63.2%) | 14 (36.8%) |
| Community & Social Service | 233 (32.1%) | 494 (67.9%) |
| Education, Arts & Media | 39 (18.1%) | 177 (81.9%) |
| Legal Services & Support | 0 (0.0%) | 0 (0.0%) |
| Education Instruction & Library | 128 (30.6%) | 290 (69.4%) |
| Arts, Media & Entertainment | 66 (71.0%) | 27 (29.0%) |
| Health Diagnosing & Treating | 124 (31.4%) | 271 (68.6%) |
| Health Technologists | 49 (26.1%) | 139 (73.9%) |
| Total (Category) | 1,010 (42.9%) | 1,345 (57.1%) |
| Total (Overall) | 2,825 (48.7%) | 2,979 (51.3%) |
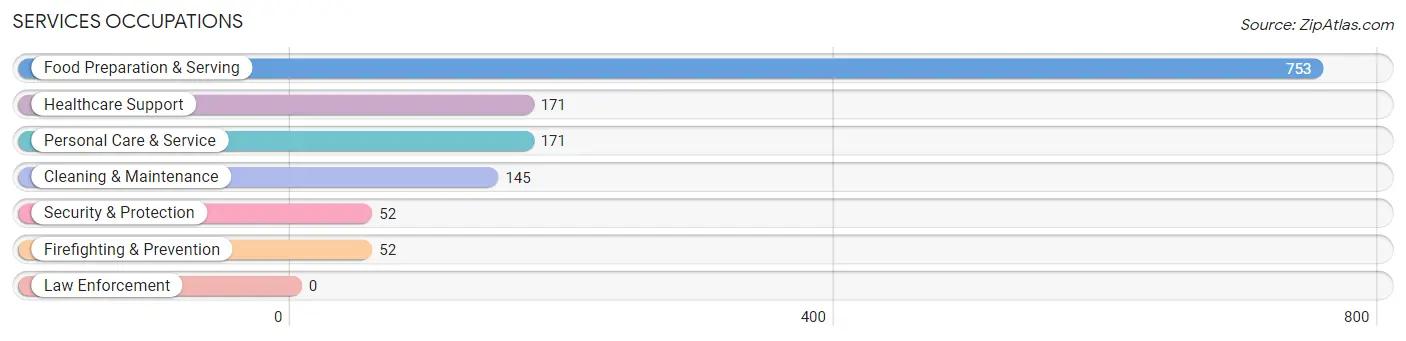
Services Occupations
The most common Services occupations in Payson are Food Preparation & Serving (753 | 13.0%), Healthcare Support (171 | 2.9%), Personal Care & Service (171 | 2.9%), Cleaning & Maintenance (145 | 2.5%), and Security & Protection (52 | 0.9%).
Services Occupations by Sex
Within the Services occupations in Payson, the most male-oriented occupations are Security & Protection (100.0%), Firefighting & Prevention (100.0%), and Cleaning & Maintenance (49.7%), while the most female-oriented occupations are Personal Care & Service (78.9%), Healthcare Support (75.4%), and Food Preparation & Serving (68.3%).
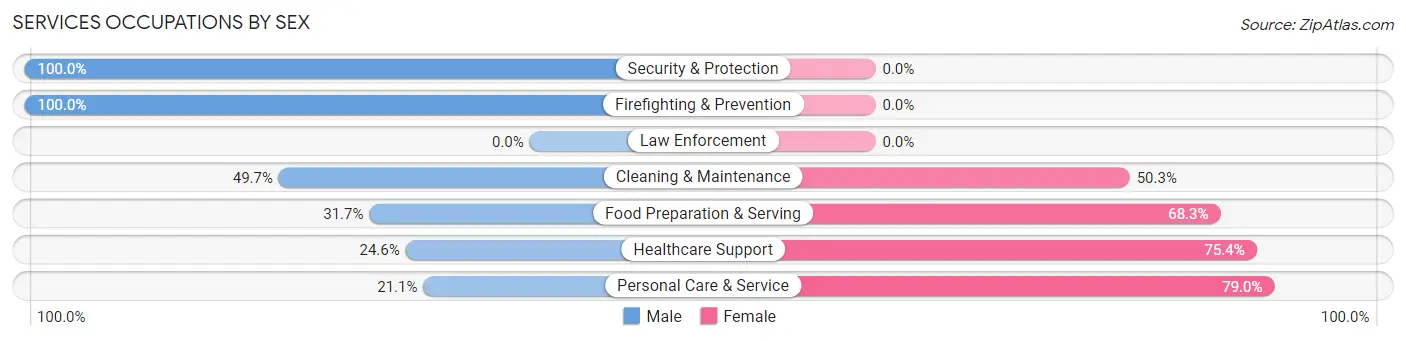
| Occupation | Male | Female |
| Healthcare Support | 42 (24.6%) | 129 (75.4%) |
| Security & Protection | 52 (100.0%) | 0 (0.0%) |
| Firefighting & Prevention | 52 (100.0%) | 0 (0.0%) |
| Law Enforcement | 0 (0.0%) | 0 (0.0%) |
| Food Preparation & Serving | 239 (31.7%) | 514 (68.3%) |
| Cleaning & Maintenance | 72 (49.7%) | 73 (50.3%) |
| Personal Care & Service | 36 (21.0%) | 135 (78.9%) |
| Total (Category) | 441 (34.1%) | 851 (65.9%) |
| Total (Overall) | 2,825 (48.7%) | 2,979 (51.3%) |
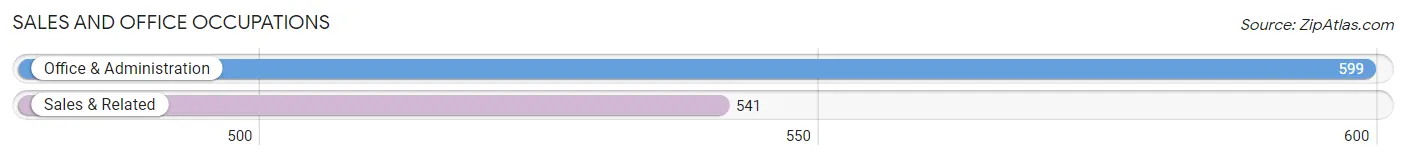
Sales and Office Occupations
The most common Sales and Office occupations in Payson are Office & Administration (599 | 10.3%), and Sales & Related (541 | 9.3%).
Sales and Office Occupations by Sex
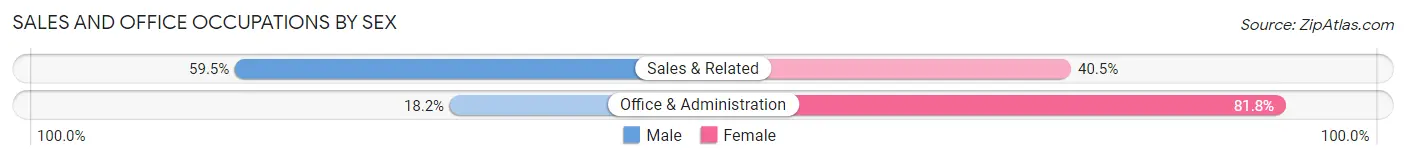
| Occupation | Male | Female |
| Sales & Related | 322 (59.5%) | 219 (40.5%) |
| Office & Administration | 109 (18.2%) | 490 (81.8%) |
| Total (Category) | 431 (37.8%) | 709 (62.2%) |
| Total (Overall) | 2,825 (48.7%) | 2,979 (51.3%) |
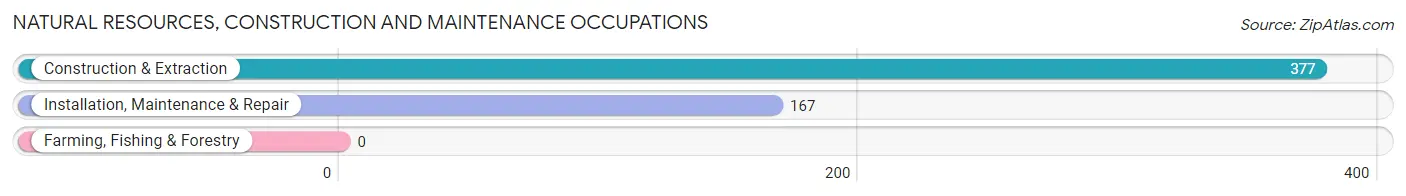
Natural Resources, Construction and Maintenance Occupations
The most common Natural Resources, Construction and Maintenance occupations in Payson are Construction & Extraction (377 | 6.5%), and Installation, Maintenance & Repair (167 | 2.9%).
Natural Resources, Construction and Maintenance Occupations by Sex
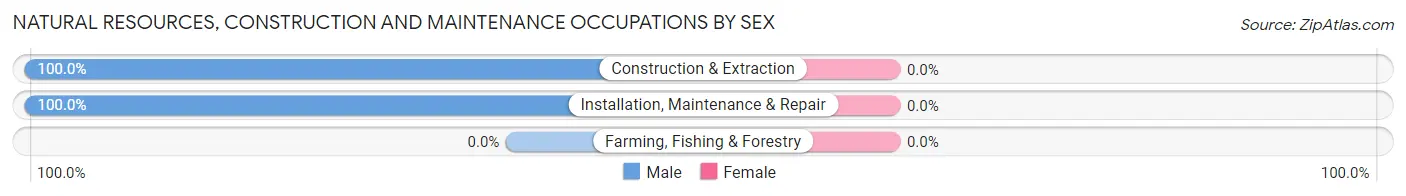
| Occupation | Male | Female |
| Farming, Fishing & Forestry | 0 (0.0%) | 0 (0.0%) |
| Construction & Extraction | 377 (100.0%) | 0 (0.0%) |
| Installation, Maintenance & Repair | 167 (100.0%) | 0 (0.0%) |
| Total (Category) | 544 (100.0%) | 0 (0.0%) |
| Total (Overall) | 2,825 (48.7%) | 2,979 (51.3%) |
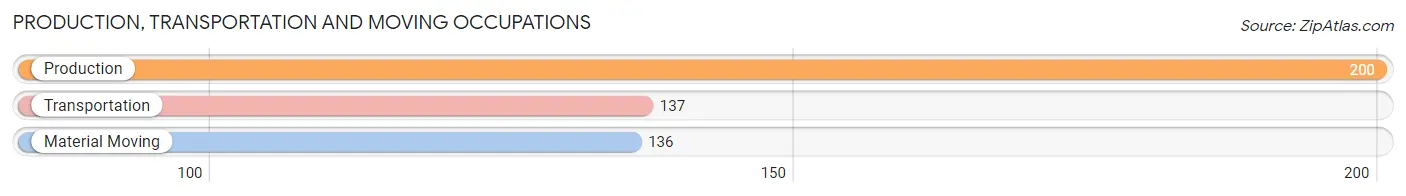
Production, Transportation and Moving Occupations
The most common Production, Transportation and Moving occupations in Payson are Production (200 | 3.5%), Transportation (137 | 2.4%), and Material Moving (136 | 2.3%).
Production, Transportation and Moving Occupations by Sex
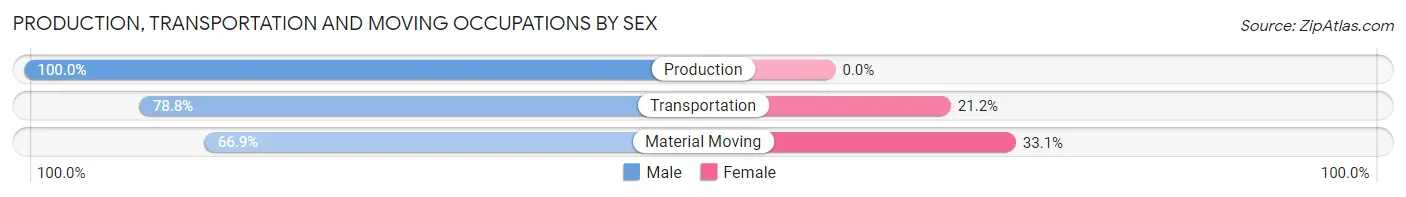
| Occupation | Male | Female |
| Production | 200 (100.0%) | 0 (0.0%) |
| Transportation | 108 (78.8%) | 29 (21.2%) |
| Material Moving | 91 (66.9%) | 45 (33.1%) |
| Total (Category) | 399 (84.4%) | 74 (15.6%) |
| Total (Overall) | 2,825 (48.7%) | 2,979 (51.3%) |
Employment Industries by Sex in Payson
Employment Industries in Payson
The major employment industries in Payson include Health Care & Social Assistance (965 | 16.6%), Retail Trade (747 | 12.9%), Accommodation & Food Services (717 | 12.3%), Educational Services (548 | 9.4%), and Construction (393 | 6.8%).
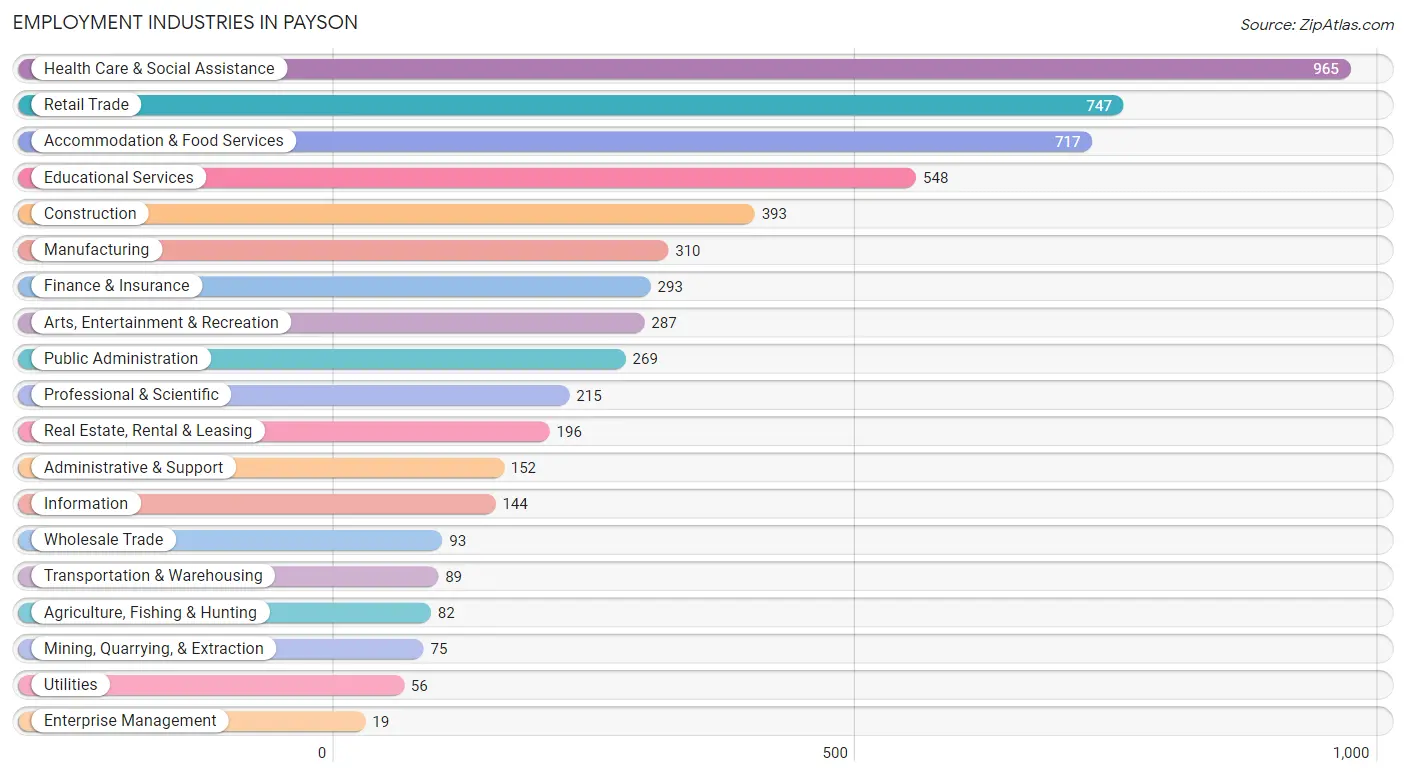
Employment Industries by Sex in Payson
The Payson industries that see more men than women are Mining, Quarrying, & Extraction (100.0%), Utilities (100.0%), and Construction (95.7%), whereas the industries that tend to have a higher number of women are Enterprise Management (100.0%), Health Care & Social Assistance (87.3%), and Educational Services (71.0%).
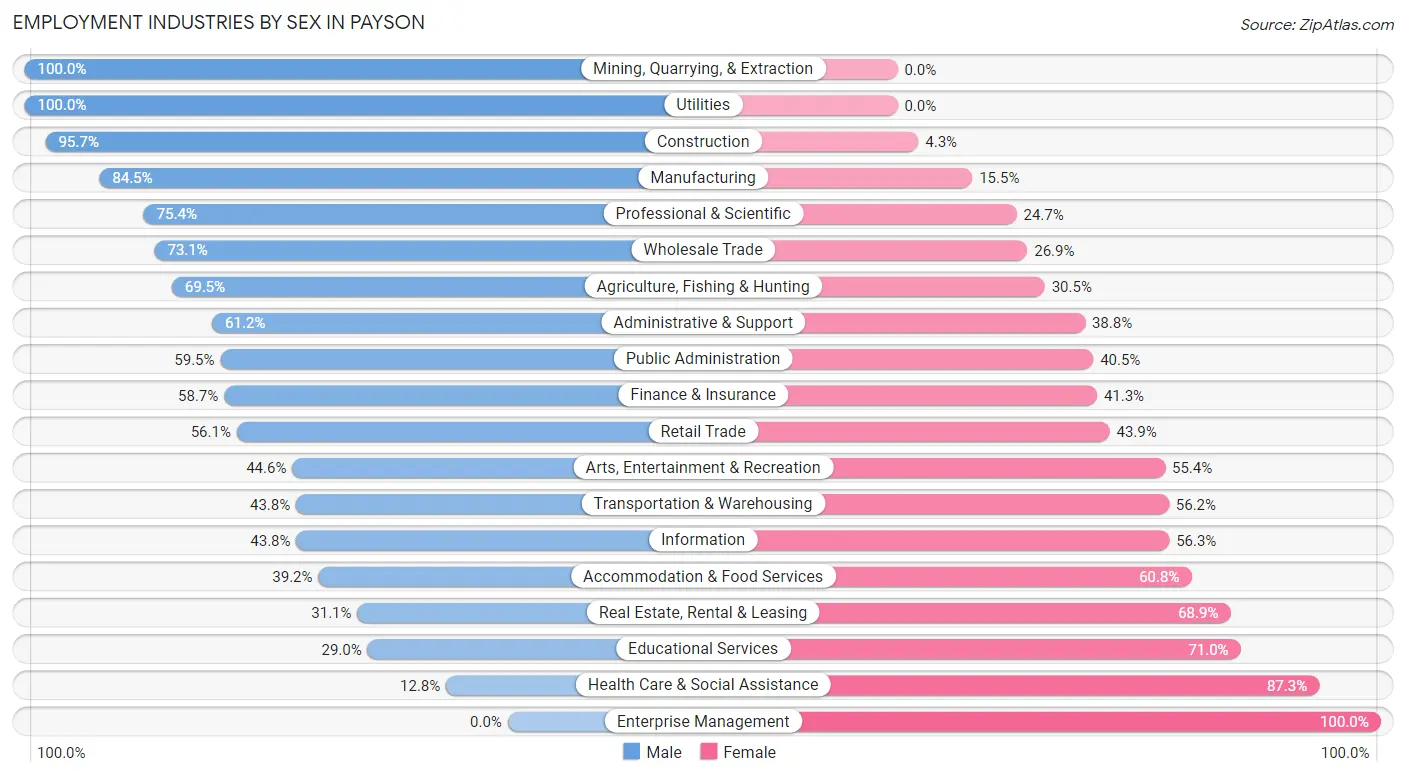
| Industry | Male | Female |
| Agriculture, Fishing & Hunting | 57 (69.5%) | 25 (30.5%) |
| Mining, Quarrying, & Extraction | 75 (100.0%) | 0 (0.0%) |
| Construction | 376 (95.7%) | 17 (4.3%) |
| Manufacturing | 262 (84.5%) | 48 (15.5%) |
| Wholesale Trade | 68 (73.1%) | 25 (26.9%) |
| Retail Trade | 419 (56.1%) | 328 (43.9%) |
| Transportation & Warehousing | 39 (43.8%) | 50 (56.2%) |
| Utilities | 56 (100.0%) | 0 (0.0%) |
| Information | 63 (43.8%) | 81 (56.2%) |
| Finance & Insurance | 172 (58.7%) | 121 (41.3%) |
| Real Estate, Rental & Leasing | 61 (31.1%) | 135 (68.9%) |
| Professional & Scientific | 162 (75.3%) | 53 (24.6%) |
| Enterprise Management | 0 (0.0%) | 19 (100.0%) |
| Administrative & Support | 93 (61.2%) | 59 (38.8%) |
| Educational Services | 159 (29.0%) | 389 (71.0%) |
| Health Care & Social Assistance | 123 (12.8%) | 842 (87.3%) |
| Arts, Entertainment & Recreation | 128 (44.6%) | 159 (55.4%) |
| Accommodation & Food Services | 281 (39.2%) | 436 (60.8%) |
| Public Administration | 160 (59.5%) | 109 (40.5%) |
| Total | 2,825 (48.7%) | 2,979 (51.3%) |
Education in Payson
School Enrollment in Payson
The most common levels of schooling among the 2,588 students in Payson are elementary school (724 | 28.0%), middle school (640 | 24.7%), and high school (588 | 22.7%).
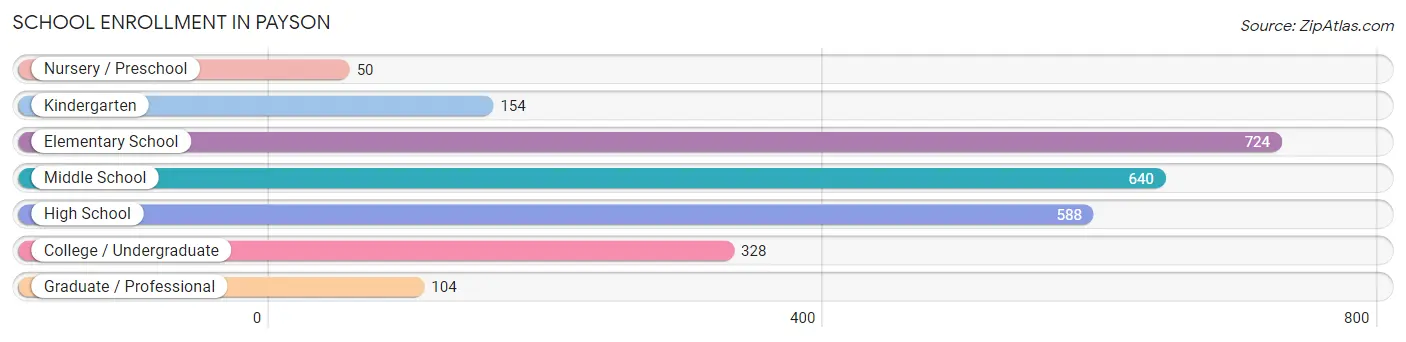
| School Level | # Students | % Students |
| Nursery / Preschool | 50 | 1.9% |
| Kindergarten | 154 | 5.9% |
| Elementary School | 724 | 28.0% |
| Middle School | 640 | 24.7% |
| High School | 588 | 22.7% |
| College / Undergraduate | 328 | 12.7% |
| Graduate / Professional | 104 | 4.0% |
| Total | 2,588 | 100.0% |
School Enrollment by Age by Funding Source in Payson
Out of a total of 2,588 students who are enrolled in schools in Payson, 236 (9.1%) attend a private institution, while the remaining 2,352 (90.9%) are enrolled in public schools. The age group of 25 to 34 year olds has the highest likelihood of being enrolled in private schools, with 53 (36.8% in the age bracket) enrolled. Conversely, the age group of 3 to 4 year olds has the lowest likelihood of being enrolled in a private school, with 50 (100.0% in the age bracket) attending a public institution.
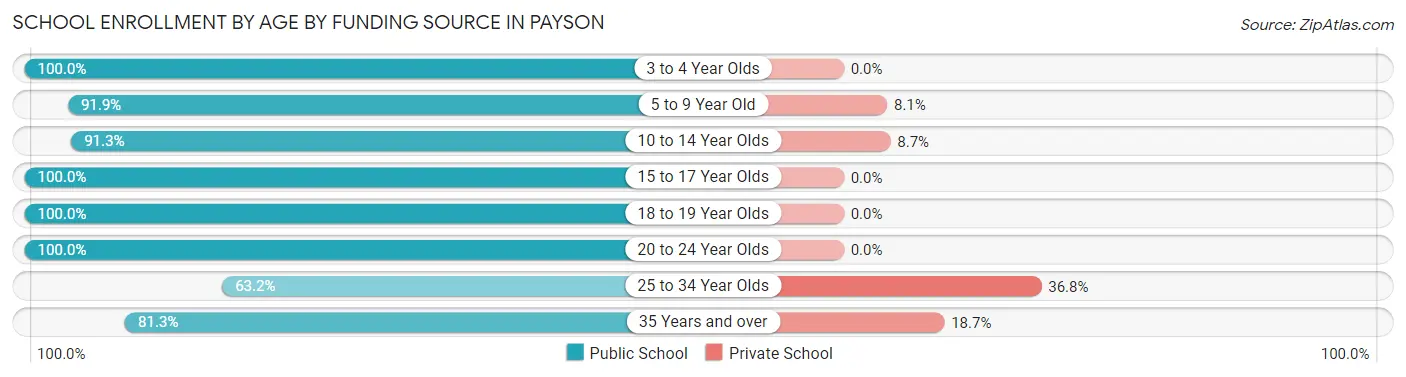
| Age Bracket | Public School | Private School |
| 3 to 4 Year Olds | 50 (100.0%) | 0 (0.0%) |
| 5 to 9 Year Old | 717 (91.9%) | 63 (8.1%) |
| 10 to 14 Year Olds | 757 (91.3%) | 72 (8.7%) |
| 15 to 17 Year Olds | 365 (100.0%) | 0 (0.0%) |
| 18 to 19 Year Olds | 80 (100.0%) | 0 (0.0%) |
| 20 to 24 Year Olds | 89 (100.0%) | 0 (0.0%) |
| 25 to 34 Year Olds | 91 (63.2%) | 53 (36.8%) |
| 35 Years and over | 204 (81.3%) | 47 (18.7%) |
| Total | 2,352 (90.9%) | 236 (9.1%) |
Educational Attainment by Field of Study in Payson
Business (822 | 23.9%), education (726 | 21.1%), psychology (210 | 6.1%), science & technology (206 | 6.0%), and arts & humanities (192 | 5.6%) are the most common fields of study among 3,438 individuals in Payson who have obtained a bachelor's degree or higher.
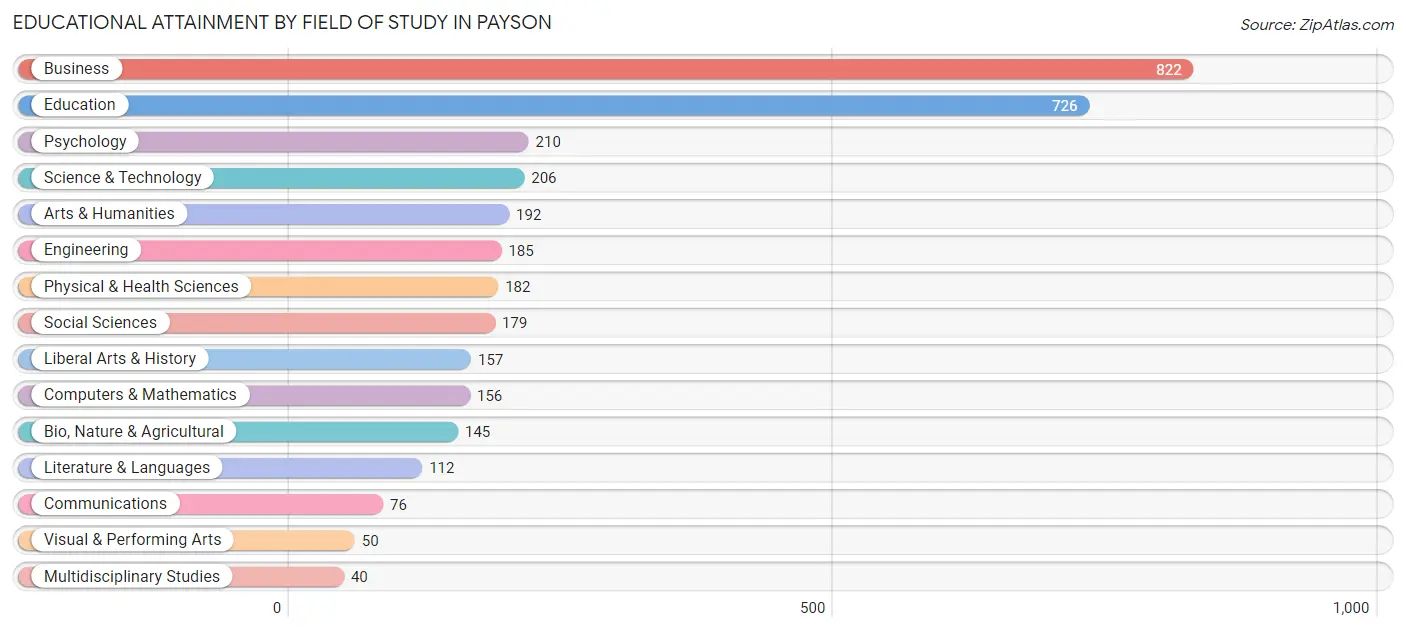
| Field of Study | # Graduates | % Graduates |
| Computers & Mathematics | 156 | 4.5% |
| Bio, Nature & Agricultural | 145 | 4.2% |
| Physical & Health Sciences | 182 | 5.3% |
| Psychology | 210 | 6.1% |
| Social Sciences | 179 | 5.2% |
| Engineering | 185 | 5.4% |
| Multidisciplinary Studies | 40 | 1.2% |
| Science & Technology | 206 | 6.0% |
| Business | 822 | 23.9% |
| Education | 726 | 21.1% |
| Literature & Languages | 112 | 3.3% |
| Liberal Arts & History | 157 | 4.6% |
| Visual & Performing Arts | 50 | 1.5% |
| Communications | 76 | 2.2% |
| Arts & Humanities | 192 | 5.6% |
| Total | 3,438 | 100.0% |
Transportation & Commute in Payson
Vehicle Availability by Sex in Payson
The most prevalent vehicle ownership categories in Payson are males with 2 vehicles (1,201, accounting for 44.2%) and females with 2 vehicles (1,279, making up 40.8%).
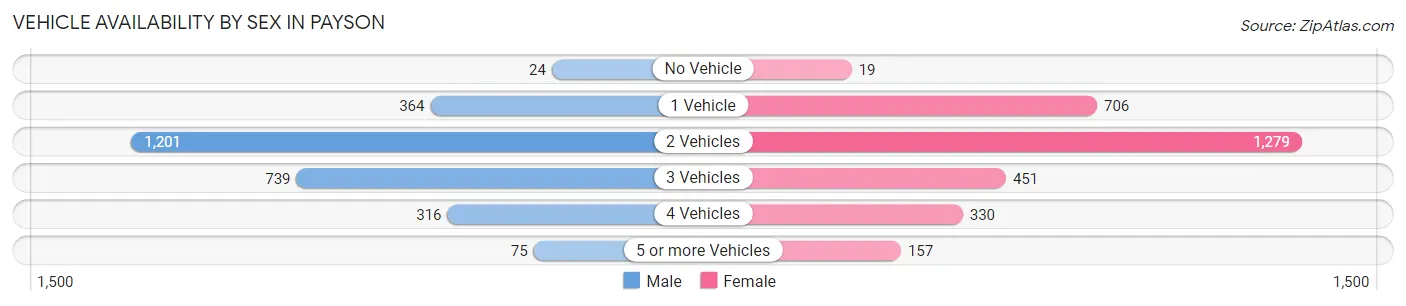
| Vehicles Available | Male | Female |
| No Vehicle | 24 (0.9%) | 19 (0.6%) |
| 1 Vehicle | 364 (13.4%) | 706 (24.0%) |
| 2 Vehicles | 1,201 (44.2%) | 1,279 (43.5%) |
| 3 Vehicles | 739 (27.2%) | 451 (15.3%) |
| 4 Vehicles | 316 (11.6%) | 330 (11.2%) |
| 5 or more Vehicles | 75 (2.8%) | 157 (5.3%) |
| Total | 2,719 (100.0%) | 2,942 (100.0%) |
Commute Time in Payson
The most frequently occuring commute durations in Payson are 5 to 9 minutes (1,864 commuters, 35.8%), 10 to 14 minutes (1,454 commuters, 27.9%), and less than 5 minutes (612 commuters, 11.7%).
| Commute Time | # Commuters | % Commuters |
| Less than 5 Minutes | 612 | 11.7% |
| 5 to 9 Minutes | 1,864 | 35.8% |
| 10 to 14 Minutes | 1,454 | 27.9% |
| 15 to 19 Minutes | 275 | 5.3% |
| 20 to 24 Minutes | 38 | 0.7% |
| 25 to 29 Minutes | 54 | 1.0% |
| 30 to 34 Minutes | 57 | 1.1% |
| 35 to 39 Minutes | 0 | 0.0% |
| 40 to 44 Minutes | 51 | 1.0% |
| 45 to 59 Minutes | 75 | 1.4% |
| 60 to 89 Minutes | 279 | 5.4% |
| 90 or more Minutes | 451 | 8.7% |
Commute Time by Sex in Payson
The most common commute times in Payson are 5 to 9 minutes (819 commuters, 33.2%) for males and 5 to 9 minutes (1,045 commuters, 38.1%) for females.
| Commute Time | Male | Female |
| Less than 5 Minutes | 292 (11.8%) | 320 (11.7%) |
| 5 to 9 Minutes | 819 (33.2%) | 1,045 (38.1%) |
| 10 to 14 Minutes | 626 (25.4%) | 828 (30.2%) |
| 15 to 19 Minutes | 94 (3.8%) | 181 (6.6%) |
| 20 to 24 Minutes | 7 (0.3%) | 31 (1.1%) |
| 25 to 29 Minutes | 0 (0.0%) | 54 (2.0%) |
| 30 to 34 Minutes | 57 (2.3%) | 0 (0.0%) |
| 35 to 39 Minutes | 0 (0.0%) | 0 (0.0%) |
| 40 to 44 Minutes | 33 (1.3%) | 18 (0.7%) |
| 45 to 59 Minutes | 41 (1.7%) | 34 (1.2%) |
| 60 to 89 Minutes | 208 (8.4%) | 71 (2.6%) |
| 90 or more Minutes | 288 (11.7%) | 163 (5.9%) |
Time of Departure to Work by Sex in Payson
The most frequent times of departure to work in Payson are 8:00 AM to 8:29 AM (313, 12.7%) for males and 7:00 AM to 7:29 AM (339, 12.3%) for females.
| Time of Departure | Male | Female |
| 12:00 AM to 4:59 AM | 220 (8.9%) | 115 (4.2%) |
| 5:00 AM to 5:29 AM | 49 (2.0%) | 58 (2.1%) |
| 5:30 AM to 5:59 AM | 282 (11.4%) | 123 (4.5%) |
| 6:00 AM to 6:29 AM | 218 (8.8%) | 125 (4.5%) |
| 6:30 AM to 6:59 AM | 273 (11.1%) | 331 (12.1%) |
| 7:00 AM to 7:29 AM | 181 (7.3%) | 339 (12.3%) |
| 7:30 AM to 7:59 AM | 122 (5.0%) | 300 (10.9%) |
| 8:00 AM to 8:29 AM | 313 (12.7%) | 333 (12.1%) |
| 8:30 AM to 8:59 AM | 51 (2.1%) | 315 (11.5%) |
| 9:00 AM to 9:59 AM | 265 (10.7%) | 67 (2.4%) |
| 10:00 AM to 10:59 AM | 121 (4.9%) | 178 (6.5%) |
| 11:00 AM to 11:59 AM | 48 (1.9%) | 58 (2.1%) |
| 12:00 PM to 3:59 PM | 183 (7.4%) | 279 (10.2%) |
| 4:00 PM to 11:59 PM | 139 (5.6%) | 124 (4.5%) |
| Total | 2,465 (100.0%) | 2,745 (100.0%) |
Housing Occupancy in Payson
Occupancy by Ownership in Payson
Of the total 7,558 dwellings in Payson, owner-occupied units account for 5,795 (76.7%), while renter-occupied units make up 1,763 (23.3%).
| Occupancy | # Housing Units | % Housing Units |
| Owner Occupied Housing Units | 5,795 | 76.7% |
| Renter-Occupied Housing Units | 1,763 | 23.3% |
| Total Occupied Housing Units | 7,558 | 100.0% |
Occupancy by Household Size in Payson
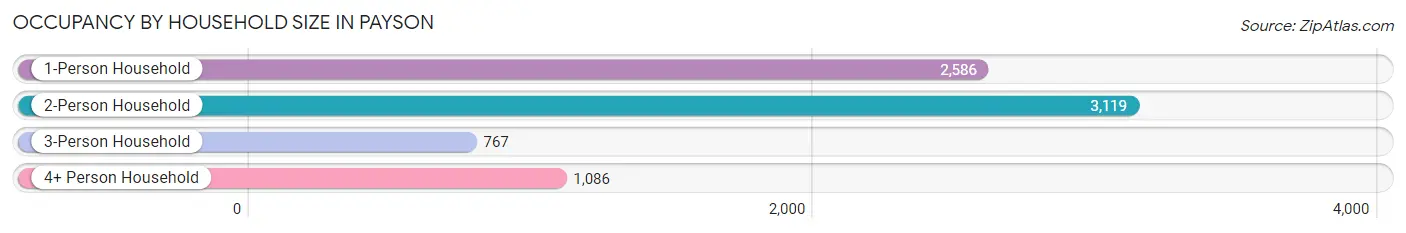
| Household Size | # Housing Units | % Housing Units |
| 1-Person Household | 2,586 | 34.2% |
| 2-Person Household | 3,119 | 41.3% |
| 3-Person Household | 767 | 10.2% |
| 4+ Person Household | 1,086 | 14.4% |
| Total Housing Units | 7,558 | 100.0% |
Occupancy by Ownership by Household Size in Payson
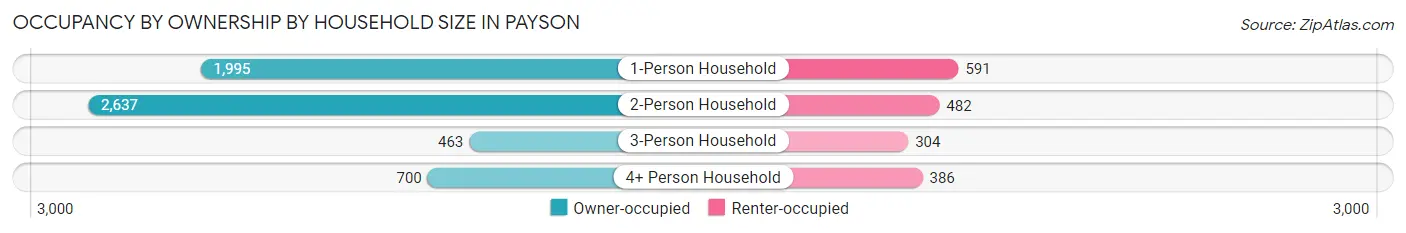
| Household Size | Owner-occupied | Renter-occupied |
| 1-Person Household | 1,995 (77.1%) | 591 (22.9%) |
| 2-Person Household | 2,637 (84.6%) | 482 (15.4%) |
| 3-Person Household | 463 (60.4%) | 304 (39.6%) |
| 4+ Person Household | 700 (64.5%) | 386 (35.5%) |
| Total Housing Units | 5,795 (76.7%) | 1,763 (23.3%) |
Occupancy by Educational Attainment in Payson
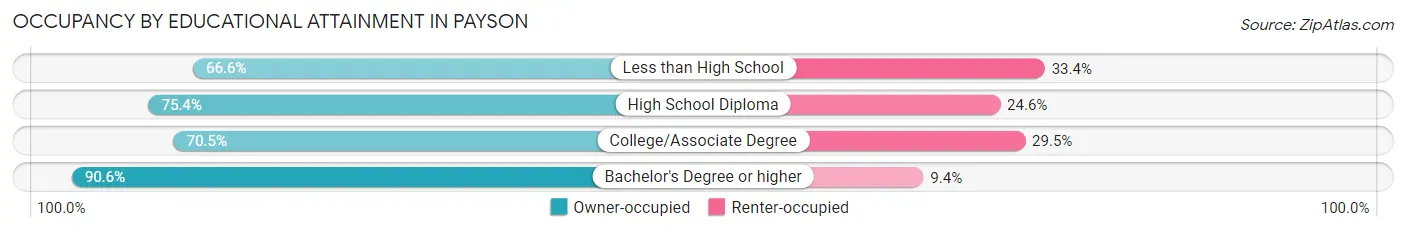
| Household Size | Owner-occupied | Renter-occupied |
| Less than High School | 249 (66.6%) | 125 (33.4%) |
| High School Diploma | 1,335 (75.4%) | 435 (24.6%) |
| College/Associate Degree | 2,430 (70.5%) | 1,019 (29.5%) |
| Bachelor's Degree or higher | 1,781 (90.6%) | 184 (9.4%) |
Occupancy by Age of Householder in Payson
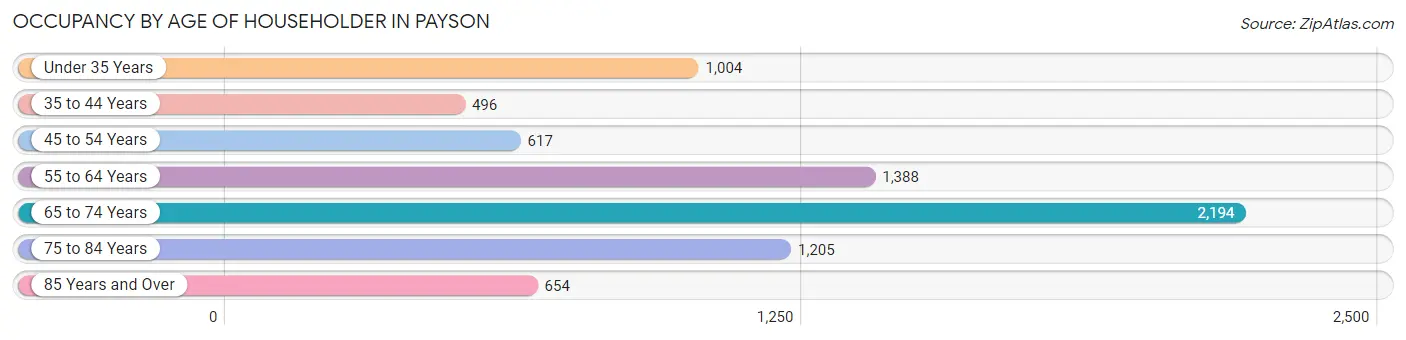
| Age Bracket | # Households | % Households |
| Under 35 Years | 1,004 | 13.3% |
| 35 to 44 Years | 496 | 6.6% |
| 45 to 54 Years | 617 | 8.2% |
| 55 to 64 Years | 1,388 | 18.4% |
| 65 to 74 Years | 2,194 | 29.0% |
| 75 to 84 Years | 1,205 | 15.9% |
| 85 Years and Over | 654 | 8.6% |
| Total | 7,558 | 100.0% |
Housing Finances in Payson
Median Income by Occupancy in Payson
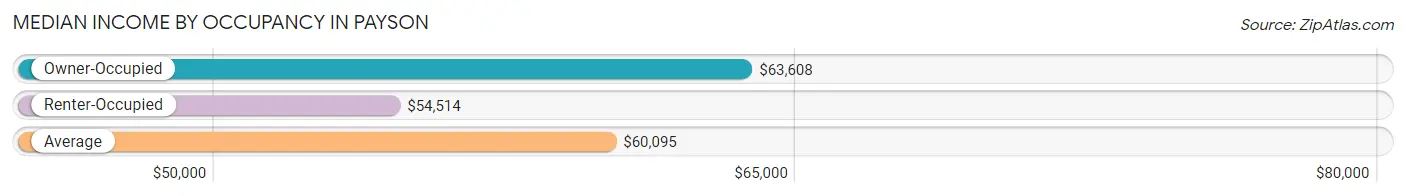
| Occupancy Type | # Households | Median Income |
| Owner-Occupied | 5,795 (76.7%) | $63,608 |
| Renter-Occupied | 1,763 (23.3%) | $54,514 |
| Average | 7,558 (100.0%) | $60,095 |
Occupancy by Householder Income Bracket in Payson
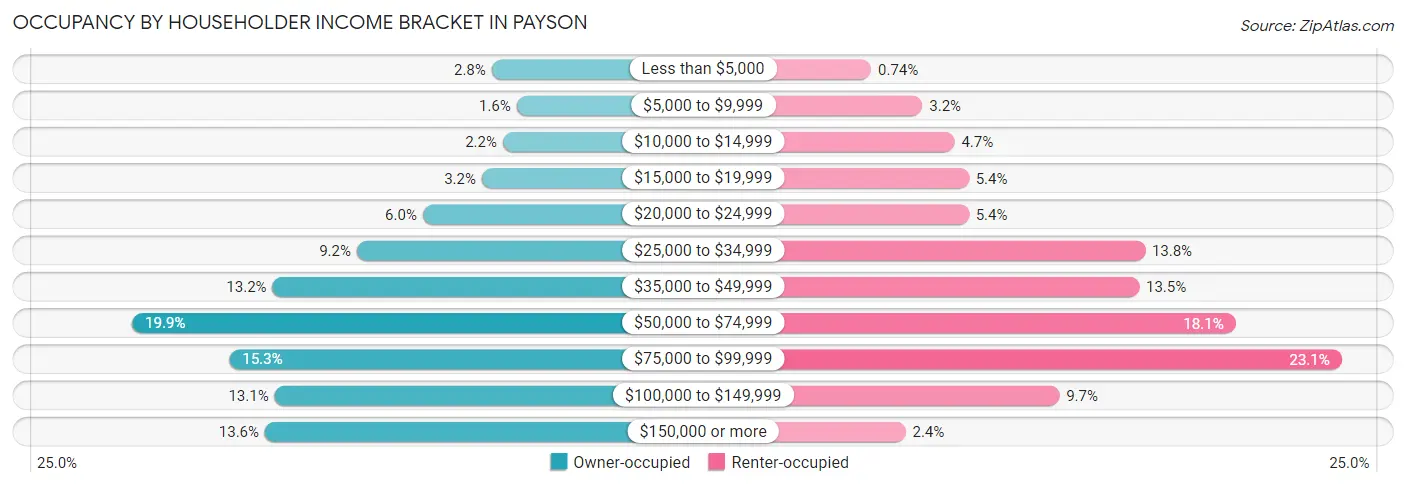
| Income Bracket | Owner-occupied | Renter-occupied |
| Less than $5,000 | 160 (2.8%) | 13 (0.7%) |
| $5,000 to $9,999 | 91 (1.6%) | 56 (3.2%) |
| $10,000 to $14,999 | 129 (2.2%) | 83 (4.7%) |
| $15,000 to $19,999 | 187 (3.2%) | 95 (5.4%) |
| $20,000 to $24,999 | 350 (6.0%) | 95 (5.4%) |
| $25,000 to $34,999 | 532 (9.2%) | 243 (13.8%) |
| $35,000 to $49,999 | 765 (13.2%) | 238 (13.5%) |
| $50,000 to $74,999 | 1,152 (19.9%) | 319 (18.1%) |
| $75,000 to $99,999 | 884 (15.2%) | 408 (23.1%) |
| $100,000 to $149,999 | 759 (13.1%) | 171 (9.7%) |
| $150,000 or more | 786 (13.6%) | 42 (2.4%) |
| Total | 5,795 (100.0%) | 1,763 (100.0%) |
Monthly Housing Cost Tiers in Payson
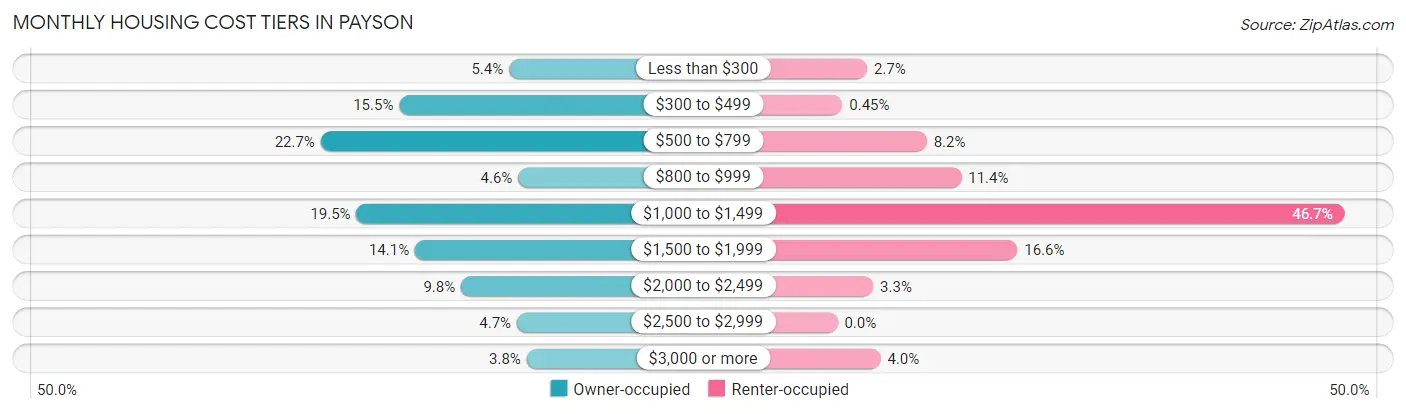
| Monthly Cost | Owner-occupied | Renter-occupied |
| Less than $300 | 313 (5.4%) | 48 (2.7%) |
| $300 to $499 | 899 (15.5%) | 8 (0.4%) |
| $500 to $799 | 1,318 (22.7%) | 145 (8.2%) |
| $800 to $999 | 264 (4.6%) | 201 (11.4%) |
| $1,000 to $1,499 | 1,127 (19.5%) | 823 (46.7%) |
| $1,500 to $1,999 | 815 (14.1%) | 292 (16.6%) |
| $2,000 to $2,499 | 569 (9.8%) | 58 (3.3%) |
| $2,500 to $2,999 | 271 (4.7%) | 0 (0.0%) |
| $3,000 or more | 219 (3.8%) | 70 (4.0%) |
| Total | 5,795 (100.0%) | 1,763 (100.0%) |
Physical Housing Characteristics in Payson
Housing Structures in Payson
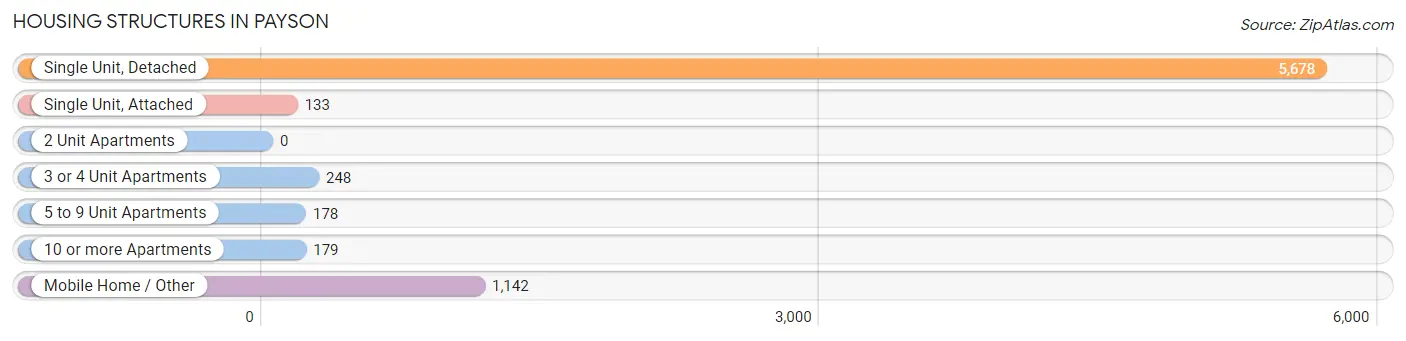
| Structure Type | # Housing Units | % Housing Units |
| Single Unit, Detached | 5,678 | 75.1% |
| Single Unit, Attached | 133 | 1.8% |
| 2 Unit Apartments | 0 | 0.0% |
| 3 or 4 Unit Apartments | 248 | 3.3% |
| 5 to 9 Unit Apartments | 178 | 2.4% |
| 10 or more Apartments | 179 | 2.4% |
| Mobile Home / Other | 1,142 | 15.1% |
| Total | 7,558 | 100.0% |
Housing Structures by Occupancy in Payson
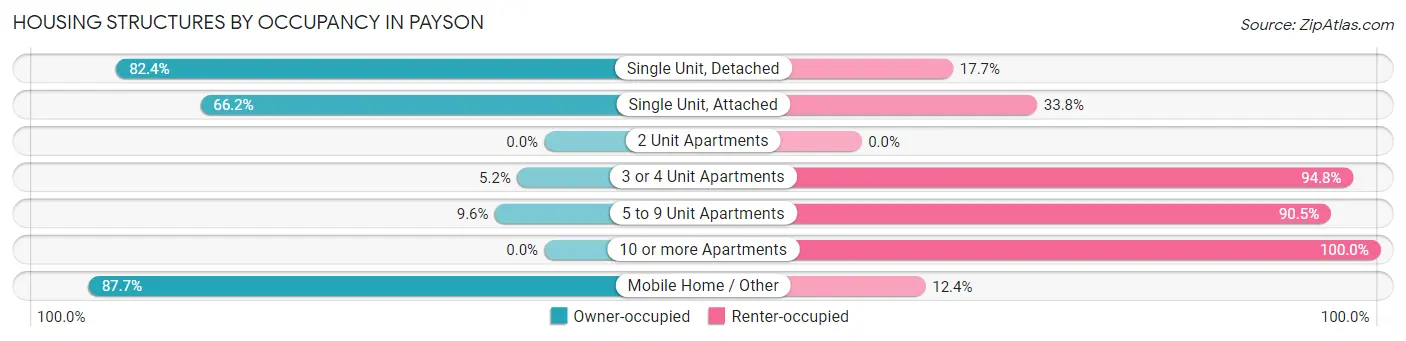
| Structure Type | Owner-occupied | Renter-occupied |
| Single Unit, Detached | 4,676 (82.4%) | 1,002 (17.6%) |
| Single Unit, Attached | 88 (66.2%) | 45 (33.8%) |
| 2 Unit Apartments | 0 (0.0%) | 0 (0.0%) |
| 3 or 4 Unit Apartments | 13 (5.2%) | 235 (94.8%) |
| 5 to 9 Unit Apartments | 17 (9.6%) | 161 (90.4%) |
| 10 or more Apartments | 0 (0.0%) | 179 (100.0%) |
| Mobile Home / Other | 1,001 (87.6%) | 141 (12.3%) |
| Total | 5,795 (76.7%) | 1,763 (23.3%) |
Housing Structures by Number of Rooms in Payson
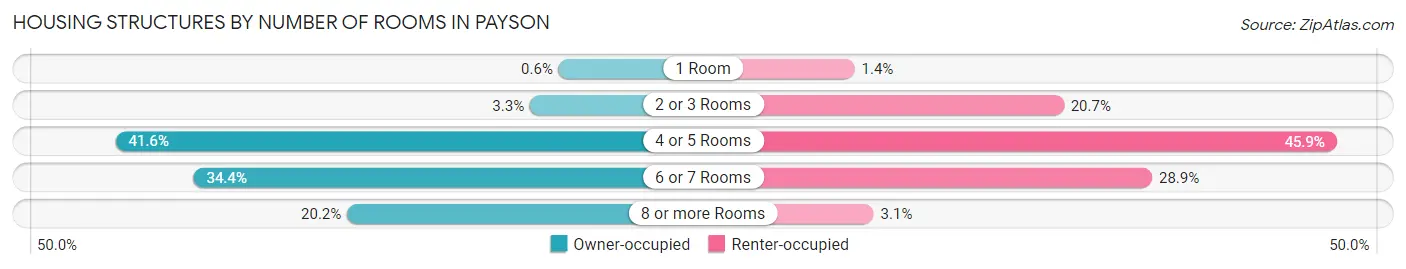
| Number of Rooms | Owner-occupied | Renter-occupied |
| 1 Room | 35 (0.6%) | 24 (1.4%) |
| 2 or 3 Rooms | 189 (3.3%) | 365 (20.7%) |
| 4 or 5 Rooms | 2,410 (41.6%) | 810 (45.9%) |
| 6 or 7 Rooms | 1,992 (34.4%) | 509 (28.9%) |
| 8 or more Rooms | 1,169 (20.2%) | 55 (3.1%) |
| Total | 5,795 (100.0%) | 1,763 (100.0%) |
Housing Structure by Heating Type in Payson
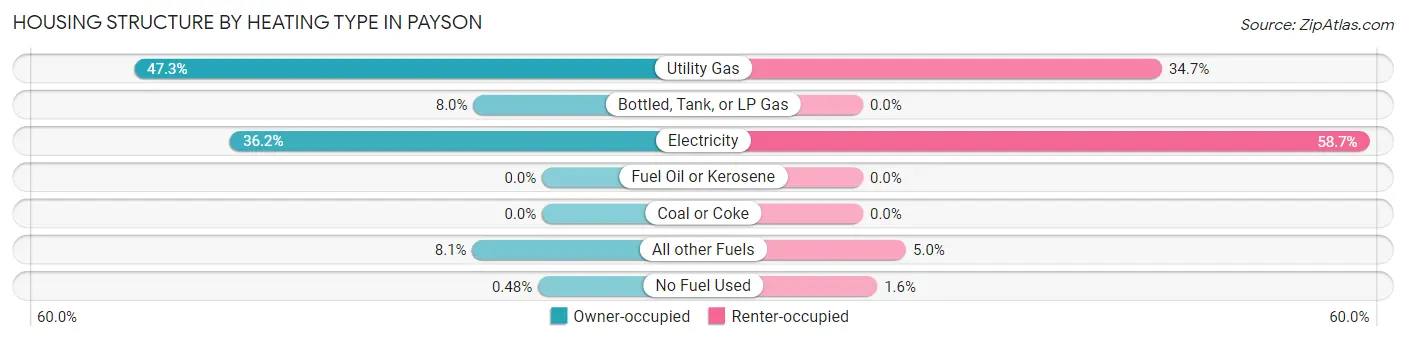
| Heating Type | Owner-occupied | Renter-occupied |
| Utility Gas | 2,741 (47.3%) | 611 (34.7%) |
| Bottled, Tank, or LP Gas | 462 (8.0%) | 0 (0.0%) |
| Electricity | 2,096 (36.2%) | 1,035 (58.7%) |
| Fuel Oil or Kerosene | 0 (0.0%) | 0 (0.0%) |
| Coal or Coke | 0 (0.0%) | 0 (0.0%) |
| All other Fuels | 468 (8.1%) | 88 (5.0%) |
| No Fuel Used | 28 (0.5%) | 29 (1.6%) |
| Total | 5,795 (100.0%) | 1,763 (100.0%) |
Household Vehicle Usage in Payson
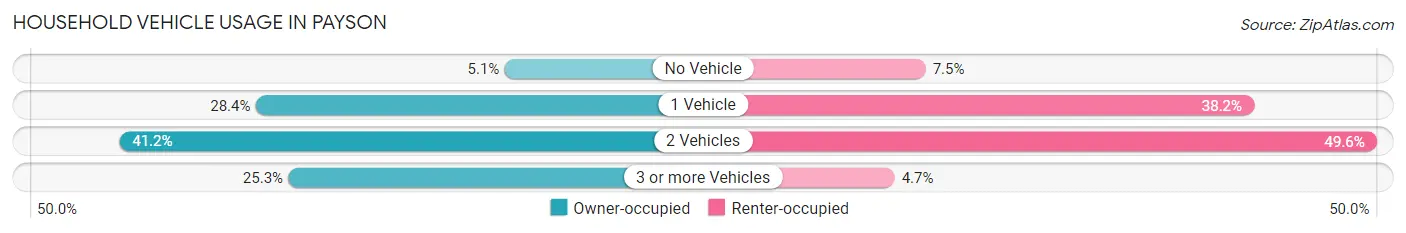
| Vehicles per Household | Owner-occupied | Renter-occupied |
| No Vehicle | 298 (5.1%) | 133 (7.5%) |
| 1 Vehicle | 1,644 (28.4%) | 673 (38.2%) |
| 2 Vehicles | 2,385 (41.2%) | 875 (49.6%) |
| 3 or more Vehicles | 1,468 (25.3%) | 82 (4.6%) |
| Total | 5,795 (100.0%) | 1,763 (100.0%) |
Real Estate & Mortgages in Payson
Real Estate and Mortgage Overview in Payson
| Characteristic | Without Mortgage | With Mortgage |
| Housing Units | 2,671 | 3,124 |
| Median Property Value | $288,800 | $326,200 |
| Median Household Income | $55,826 | $546 |
| Monthly Housing Costs | $541 | $219 |
| Real Estate Taxes | $1,528 | $18 |
Property Value by Mortgage Status in Payson
| Property Value | Without Mortgage | With Mortgage |
| Less than $50,000 | 226 (8.5%) | 73 (2.3%) |
| $50,000 to $99,999 | 31 (1.2%) | 67 (2.1%) |
| $100,000 to $299,999 | 1,184 (44.3%) | 1,249 (40.0%) |
| $300,000 to $499,999 | 694 (26.0%) | 1,220 (39.1%) |
| $500,000 to $749,999 | 207 (7.7%) | 283 (9.1%) |
| $750,000 to $999,999 | 232 (8.7%) | 83 (2.7%) |
| $1,000,000 or more | 97 (3.6%) | 149 (4.8%) |
| Total | 2,671 (100.0%) | 3,124 (100.0%) |
Household Income by Mortgage Status in Payson
| Household Income | Without Mortgage | With Mortgage |
| Less than $10,000 | 135 (5.1%) | 58 (1.9%) |
| $10,000 to $24,999 | 342 (12.8%) | 116 (3.7%) |
| $25,000 to $34,999 | 261 (9.8%) | 324 (10.4%) |
| $35,000 to $49,999 | 392 (14.7%) | 271 (8.7%) |
| $50,000 to $74,999 | 690 (25.8%) | 373 (11.9%) |
| $75,000 to $99,999 | 307 (11.5%) | 462 (14.8%) |
| $100,000 to $149,999 | 304 (11.4%) | 577 (18.5%) |
| $150,000 or more | 240 (9.0%) | 455 (14.6%) |
| Total | 2,671 (100.0%) | 3,124 (100.0%) |
Property Value to Household Income Ratio in Payson
| Value-to-Income Ratio | Without Mortgage | With Mortgage |
| Less than 2.0x | 527 (19.7%) | 75,471 (2,415.9%) |
| 2.0x to 2.9x | 230 (8.6%) | 320 (10.2%) |
| 3.0x to 3.9x | 196 (7.3%) | 320 (10.2%) |
| 4.0x or more | 1,709 (64.0%) | 594 (19.0%) |
| Total | 2,671 (100.0%) | 3,124 (100.0%) |
Real Estate Taxes by Mortgage Status in Payson
| Property Taxes | Without Mortgage | With Mortgage |
| Less than $800 | 583 (21.8%) | 15 (0.5%) |
| $800 to $1,499 | 682 (25.5%) | 372 (11.9%) |
| $800 to $1,499 | 1,300 (48.7%) | 727 (23.3%) |
| Total | 2,671 (100.0%) | 3,124 (100.0%) |
Health & Disability in Payson
Health Insurance Coverage by Age in Payson
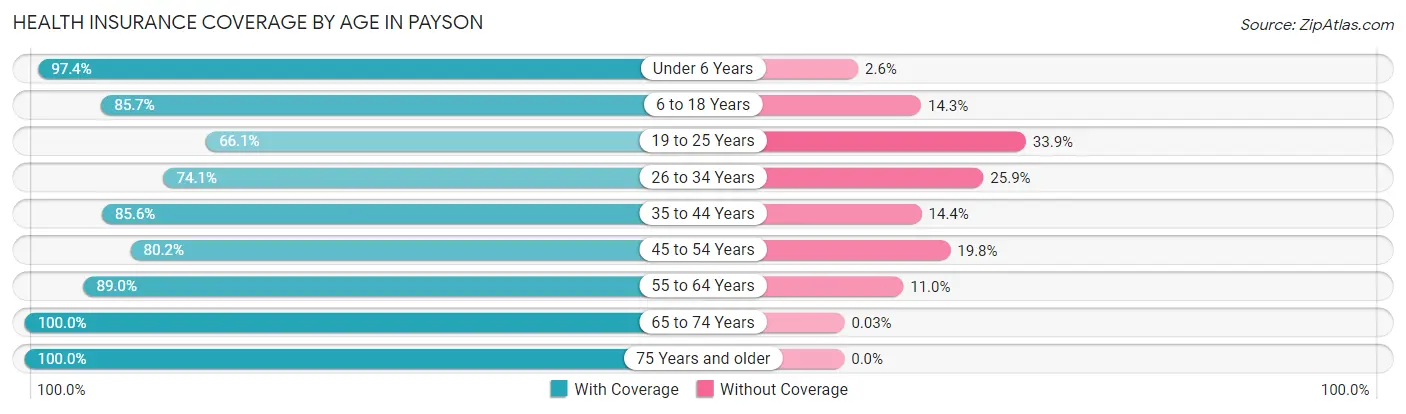
| Age Bracket | With Coverage | Without Coverage |
| Under 6 Years | 645 (97.4%) | 17 (2.6%) |
| 6 to 18 Years | 1,771 (85.7%) | 296 (14.3%) |
| 19 to 25 Years | 539 (66.1%) | 276 (33.9%) |
| 26 to 34 Years | 1,065 (74.1%) | 373 (25.9%) |
| 35 to 44 Years | 932 (85.6%) | 157 (14.4%) |
| 45 to 54 Years | 945 (80.2%) | 233 (19.8%) |
| 55 to 64 Years | 2,541 (89.0%) | 314 (11.0%) |
| 65 to 74 Years | 3,374 (100.0%) | 1 (0.0%) |
| 75 Years and older | 2,600 (100.0%) | 0 (0.0%) |
| Total | 14,412 (89.6%) | 1,667 (10.4%) |
Health Insurance Coverage by Citizenship Status in Payson
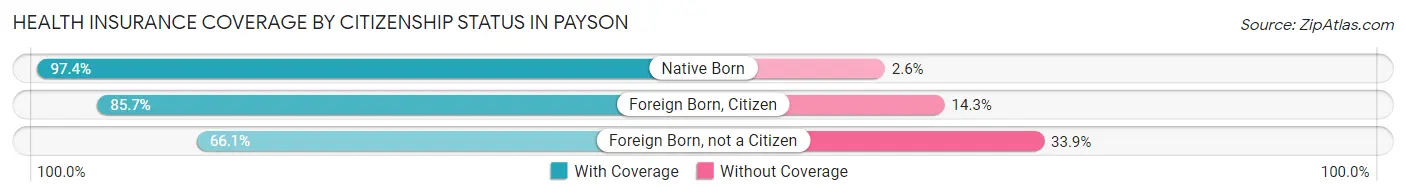
| Citizenship Status | With Coverage | Without Coverage |
| Native Born | 645 (97.4%) | 17 (2.6%) |
| Foreign Born, Citizen | 1,771 (85.7%) | 296 (14.3%) |
| Foreign Born, not a Citizen | 539 (66.1%) | 276 (33.9%) |
Health Insurance Coverage by Household Income in Payson
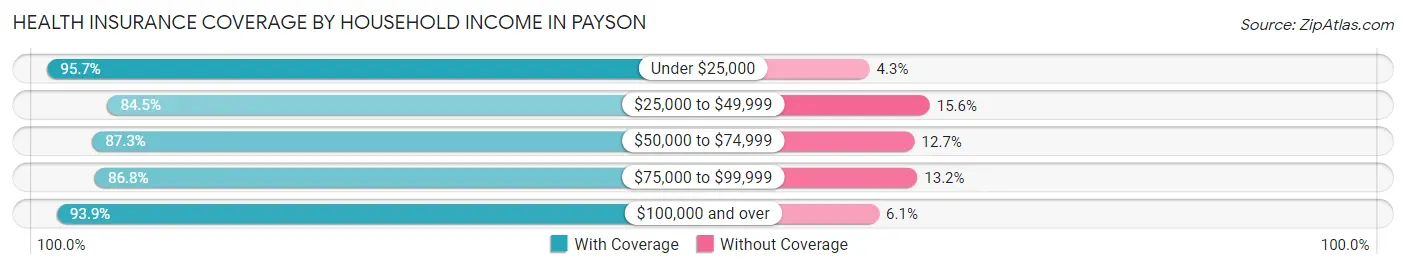
| Household Income | With Coverage | Without Coverage |
| Under $25,000 | 1,832 (95.7%) | 82 (4.3%) |
| $25,000 to $49,999 | 2,954 (84.5%) | 544 (15.5%) |
| $50,000 to $74,999 | 2,576 (87.3%) | 375 (12.7%) |
| $75,000 to $99,999 | 2,475 (86.8%) | 377 (13.2%) |
| $100,000 and over | 4,466 (93.9%) | 288 (6.1%) |
Public vs Private Health Insurance Coverage by Age in Payson
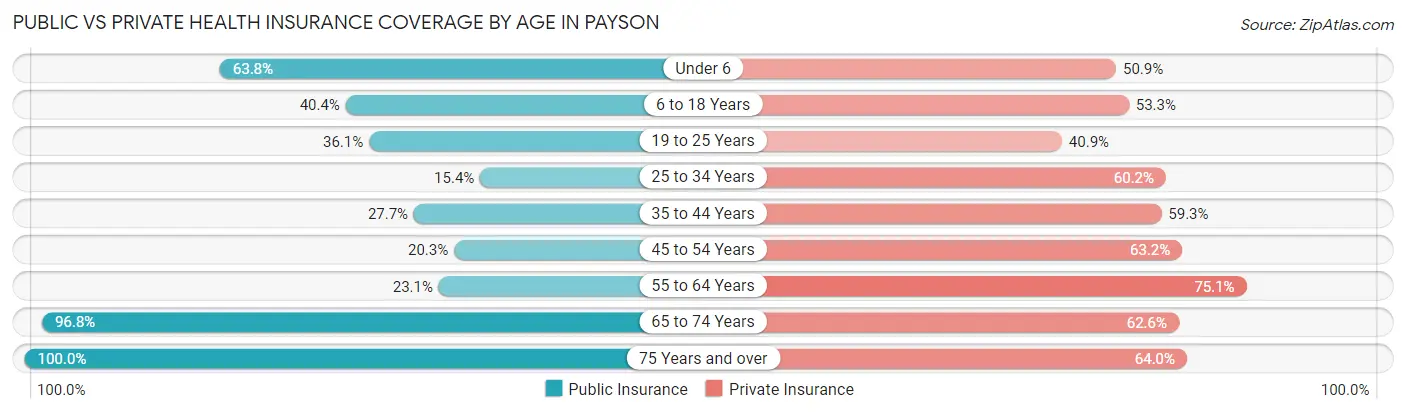
| Age Bracket | Public Insurance | Private Insurance |
| Under 6 | 422 (63.7%) | 337 (50.9%) |
| 6 to 18 Years | 835 (40.4%) | 1,101 (53.3%) |
| 19 to 25 Years | 294 (36.1%) | 333 (40.9%) |
| 25 to 34 Years | 222 (15.4%) | 865 (60.2%) |
| 35 to 44 Years | 302 (27.7%) | 646 (59.3%) |
| 45 to 54 Years | 239 (20.3%) | 744 (63.2%) |
| 55 to 64 Years | 660 (23.1%) | 2,144 (75.1%) |
| 65 to 74 Years | 3,266 (96.8%) | 2,111 (62.5%) |
| 75 Years and over | 2,600 (100.0%) | 1,665 (64.0%) |
| Total | 8,840 (55.0%) | 9,946 (61.9%) |
Disability Status by Sex by Age in Payson
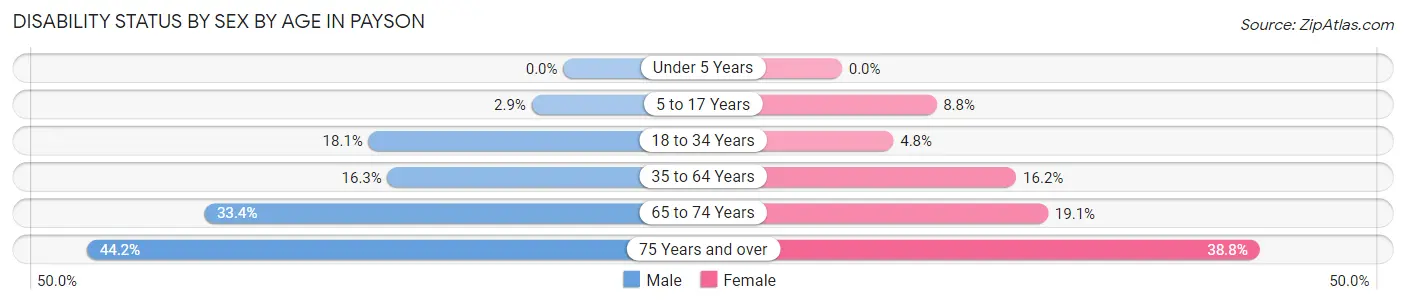
| Age Bracket | Male | Female |
| Under 5 Years | 0 (0.0%) | 0 (0.0%) |
| 5 to 17 Years | 33 (2.9%) | 84 (8.8%) |
| 18 to 34 Years | 193 (18.1%) | 61 (4.8%) |
| 35 to 64 Years | 398 (16.3%) | 434 (16.2%) |
| 65 to 74 Years | 538 (33.4%) | 337 (19.1%) |
| 75 Years and over | 486 (44.2%) | 582 (38.8%) |
Disability Class by Sex by Age in Payson
Disability Class: Hearing Difficulty
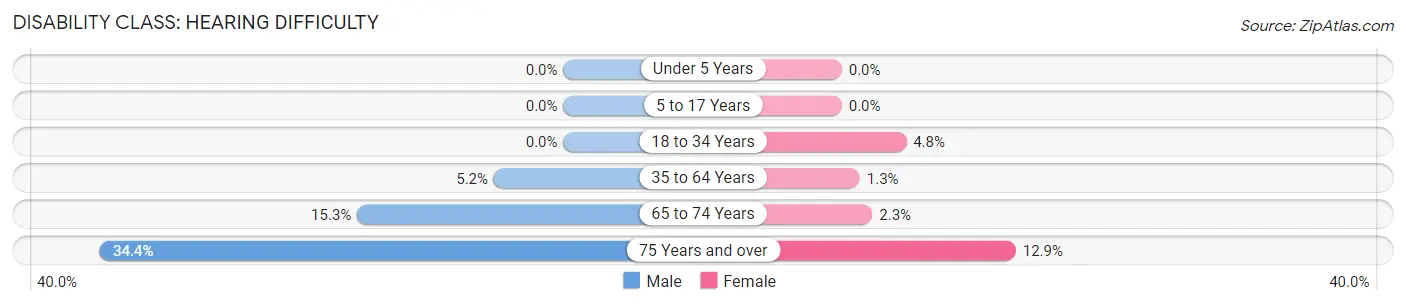
| Age Bracket | Male | Female |
| Under 5 Years | 0 (0.0%) | 0 (0.0%) |
| 5 to 17 Years | 0 (0.0%) | 0 (0.0%) |
| 18 to 34 Years | 0 (0.0%) | 61 (4.8%) |
| 35 to 64 Years | 126 (5.2%) | 36 (1.3%) |
| 65 to 74 Years | 247 (15.3%) | 40 (2.3%) |
| 75 Years and over | 378 (34.4%) | 194 (12.9%) |
Disability Class: Vision Difficulty
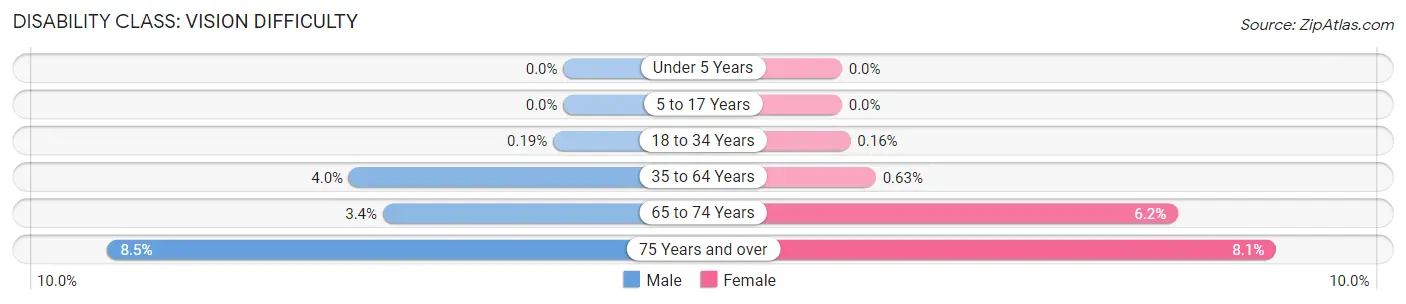
| Age Bracket | Male | Female |
| Under 5 Years | 0 (0.0%) | 0 (0.0%) |
| 5 to 17 Years | 0 (0.0%) | 0 (0.0%) |
| 18 to 34 Years | 2 (0.2%) | 2 (0.2%) |
| 35 to 64 Years | 97 (4.0%) | 17 (0.6%) |
| 65 to 74 Years | 54 (3.4%) | 110 (6.2%) |
| 75 Years and over | 93 (8.5%) | 121 (8.1%) |
Disability Class: Cognitive Difficulty
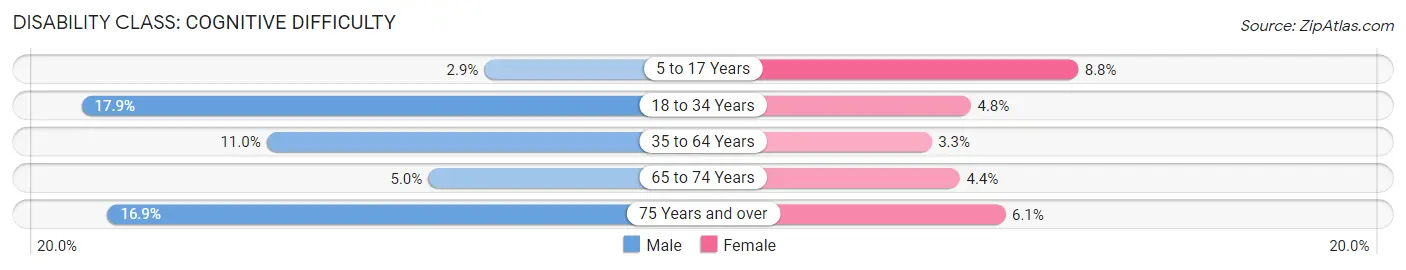
| Age Bracket | Male | Female |
| 5 to 17 Years | 33 (2.9%) | 84 (8.8%) |
| 18 to 34 Years | 191 (17.9%) | 61 (4.8%) |
| 35 to 64 Years | 269 (11.0%) | 89 (3.3%) |
| 65 to 74 Years | 81 (5.0%) | 77 (4.4%) |
| 75 Years and over | 186 (16.9%) | 91 (6.1%) |
Disability Class: Ambulatory Difficulty
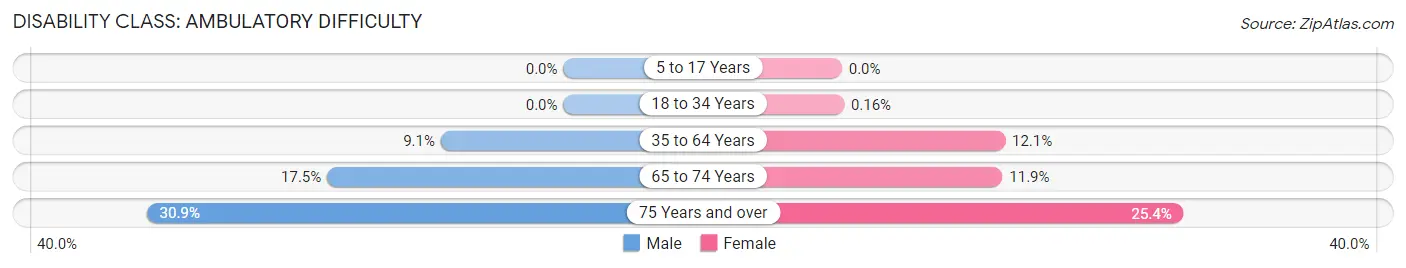
| Age Bracket | Male | Female |
| 5 to 17 Years | 0 (0.0%) | 0 (0.0%) |
| 18 to 34 Years | 0 (0.0%) | 2 (0.2%) |
| 35 to 64 Years | 222 (9.1%) | 325 (12.1%) |
| 65 to 74 Years | 283 (17.5%) | 210 (11.9%) |
| 75 Years and over | 340 (30.9%) | 381 (25.4%) |
Disability Class: Self-Care Difficulty
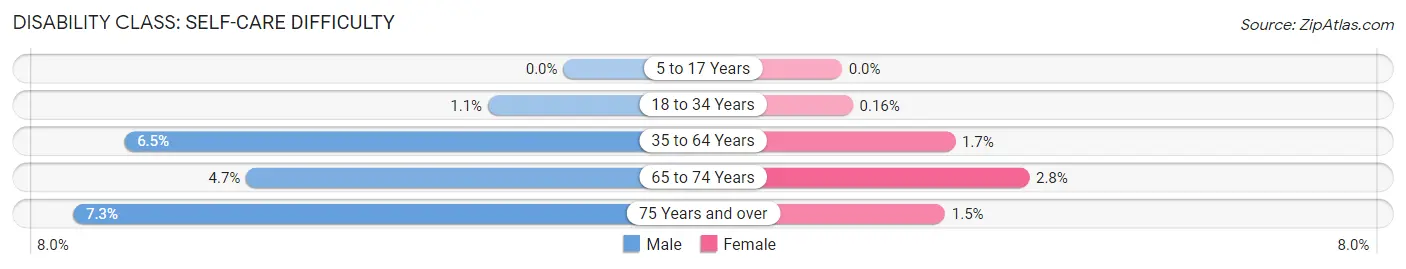
| Age Bracket | Male | Female |
| 5 to 17 Years | 0 (0.0%) | 0 (0.0%) |
| 18 to 34 Years | 12 (1.1%) | 2 (0.2%) |
| 35 to 64 Years | 159 (6.5%) | 45 (1.7%) |
| 65 to 74 Years | 76 (4.7%) | 49 (2.8%) |
| 75 Years and over | 80 (7.3%) | 23 (1.5%) |
Technology Access in Payson
Computing Device Access in Payson
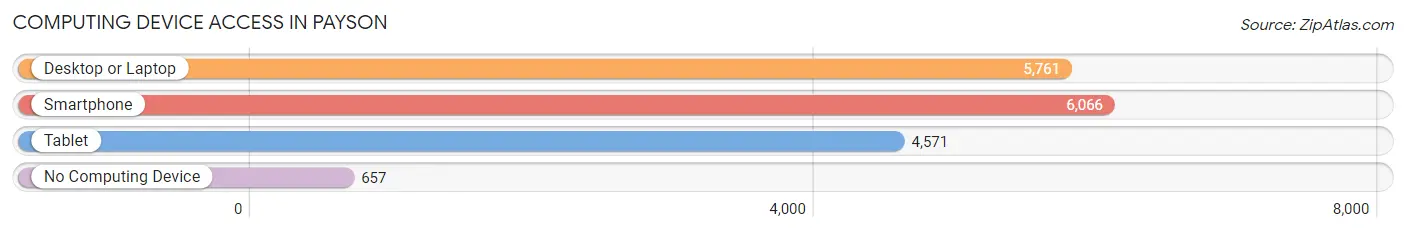
| Device Type | # Households | % Households |
| Desktop or Laptop | 5,761 | 76.2% |
| Smartphone | 6,066 | 80.3% |
| Tablet | 4,571 | 60.5% |
| No Computing Device | 657 | 8.7% |
| Total | 7,558 | 100.0% |
Internet Access in Payson
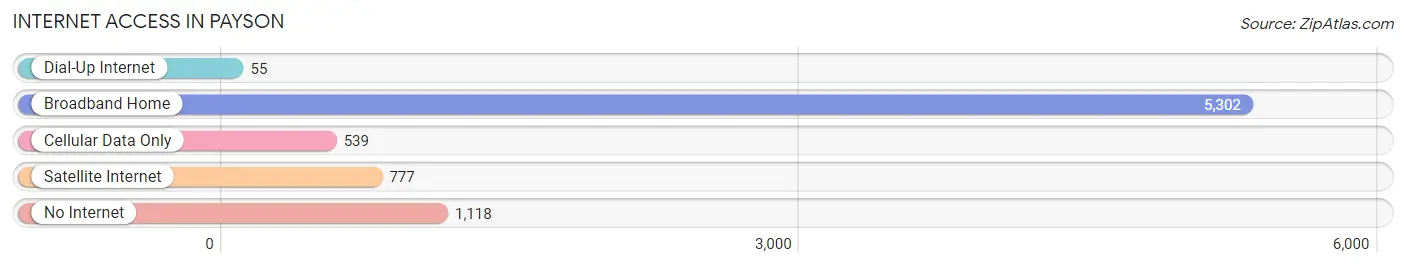
| Internet Type | # Households | % Households |
| Dial-Up Internet | 55 | 0.7% |
| Broadband Home | 5,302 | 70.2% |
| Cellular Data Only | 539 | 7.1% |
| Satellite Internet | 777 | 10.3% |
| No Internet | 1,118 | 14.8% |
| Total | 7,558 | 100.0% |
Payson Summary
Payson, Arizona is a small town located in the heart of the Tonto National Forest in Gila County. It is situated at an elevation of 5,000 feet and is surrounded by the Mogollon Rim and the Mazatzal Mountains. The town is located about 90 miles northeast of Phoenix and is the largest town in Gila County.
History
Payson was founded in 1882 by James M. Swetnam, who named the town after his hometown of Payson, Illinois. The town was originally a stagecoach stop and a trading post for the local Native American tribes. In 1884, the first post office was established and the town was incorporated in 1910.
In the early 1900s, the town began to grow as a logging and ranching center. The first sawmill was built in 1912 and the first school was established in 1913. The town continued to grow and by the 1950s, it had become a popular tourist destination.
Geography
Payson is located in the Tonto National Forest in Gila County. It is situated at an elevation of 5,000 feet and is surrounded by the Mogollon Rim and the Mazatzal Mountains. The town is located about 90 miles northeast of Phoenix and is the largest town in Gila County.
The town is located in a temperate climate with hot summers and mild winters. The average annual temperature is around 60 degrees Fahrenheit. The town receives an average of 18 inches of precipitation per year.
Economy
The economy of Payson is largely based on tourism, logging, and ranching. The town is home to several tourist attractions, including the Tonto Natural Bridge State Park, the Rim Country Museum, and the Payson Golf Course.
The town is also home to several logging and ranching operations. The town is home to several sawmills and is a major supplier of lumber to the Phoenix area. The town is also home to several cattle ranches and is a major supplier of beef to the Phoenix area.
Demographics
As of the 2010 census, the population of Payson was 15,301. The racial makeup of the town was 94.3% White, 0.7% African American, 0.9% Native American, 0.7% Asian, 0.1% Pacific Islander, 1.7% from other races, and 1.5% from two or more races. Hispanic or Latino of any race were 6.2% of the population.
The median household income in Payson was $37,917 and the median family income was $45,938. The per capita income was $20,945. About 14.2% of the population was below the poverty line.
Common Questions
What is Per Capita Income in Payson?
Per Capita income in Payson is $36,705.
What is the Median Family Income in Payson?
Median Family Income in Payson is $73,812.
What is the Median Household income in Payson?
Median Household Income in Payson is $60,095.
What is Income or Wage Gap in Payson?
Income or Wage Gap in Payson is 31.2%.
Women in Payson earn 68.8 cents for every dollar earned by a man.
What is Inequality or Gini Index in Payson?
Inequality or Gini Index in Payson is 0.42.
What is the Total Population of Payson?
Total Population of Payson is 16,363.
What is the Total Male Population of Payson?
Total Male Population of Payson is 7,788.
What is the Total Female Population of Payson?
Total Female Population of Payson is 8,575.
What is the Ratio of Males per 100 Females in Payson?
There are 90.82 Males per 100 Females in Payson.
What is the Ratio of Females per 100 Males in Payson?
There are 110.11 Females per 100 Males in Payson.
What is the Median Population Age in Payson?
Median Population Age in Payson is 59.0 Years.
What is the Average Family Size in Payson
Average Family Size in Payson is 2.7 People.
What is the Average Household Size in Payson
Average Household Size in Payson is 2.1 People.
How Large is the Labor Force in Payson?
There are 6,252 People in the Labor Forcein in Payson.
What is the Percentage of People in the Labor Force in Payson?
44.6% of People are in the Labor Force in Payson.
What is the Unemployment Rate in Payson?
Unemployment Rate in Payson is 7.0%.