Claypool, AZ Map & Demographics
Claypool Map
Claypool Overview
$33,630
PER CAPITA INCOME
$84,183
AVG FAMILY INCOME
$53,450
AVG HOUSEHOLD INCOME
62.5%
WAGE / INCOME GAP [ % ]
37.5¢/ $1
WAGE / INCOME GAP [ $ ]
0.47
INEQUALITY / GINI INDEX
1,252
TOTAL POPULATION
485
MALE POPULATION
767
FEMALE POPULATION
63.23
MALES / 100 FEMALES
158.14
FEMALES / 100 MALES
42.6
MEDIAN AGE
3.7
AVG FAMILY SIZE
2.6
AVG HOUSEHOLD SIZE
674
LABOR FORCE [ PEOPLE ]
70.6%
PERCENT IN LABOR FORCE
10.8%
UNEMPLOYMENT RATE
Claypool Zip Codes
Claypool Area Codes
Income in Claypool
Income Overview in Claypool
Per Capita Income in Claypool is $33,630, while median incomes of families and households are $84,183 and $53,450 respectively.
| Characteristic | Number | Measure |
| Per Capita Income | 1,252 | $33,630 |
| Median Family Income | 259 | $84,183 |
| Mean Family Income | 259 | $126,554 |
| Median Household Income | 487 | $53,450 |
| Mean Household Income | 487 | $89,256 |
| Income Deficit | 259 | $0 |
| Wage / Income Gap (%) | 1,252 | 62.53% |
| Wage / Income Gap ($) | 1,252 | 37.47¢ per $1 |
| Gini / Inequality Index | 1,252 | 0.47 |
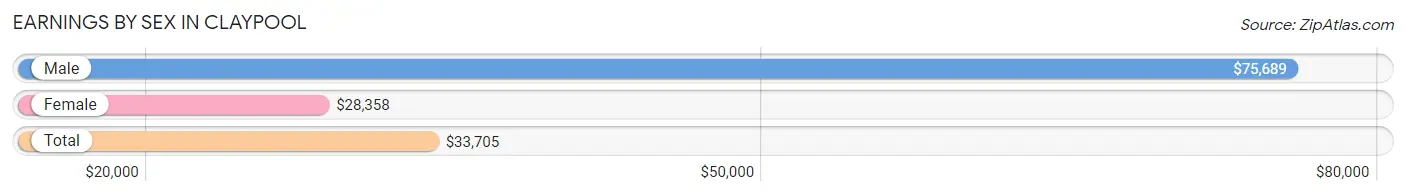
Earnings by Sex in Claypool
Average Earnings in Claypool are $33,705, $75,689 for men and $28,358 for women, a difference of 62.5%.
| Sex | Number | Average Earnings |
| Male | 279 (41.4%) | $75,689 |
| Female | 395 (58.6%) | $28,358 |
| Total | 674 (100.0%) | $33,705 |
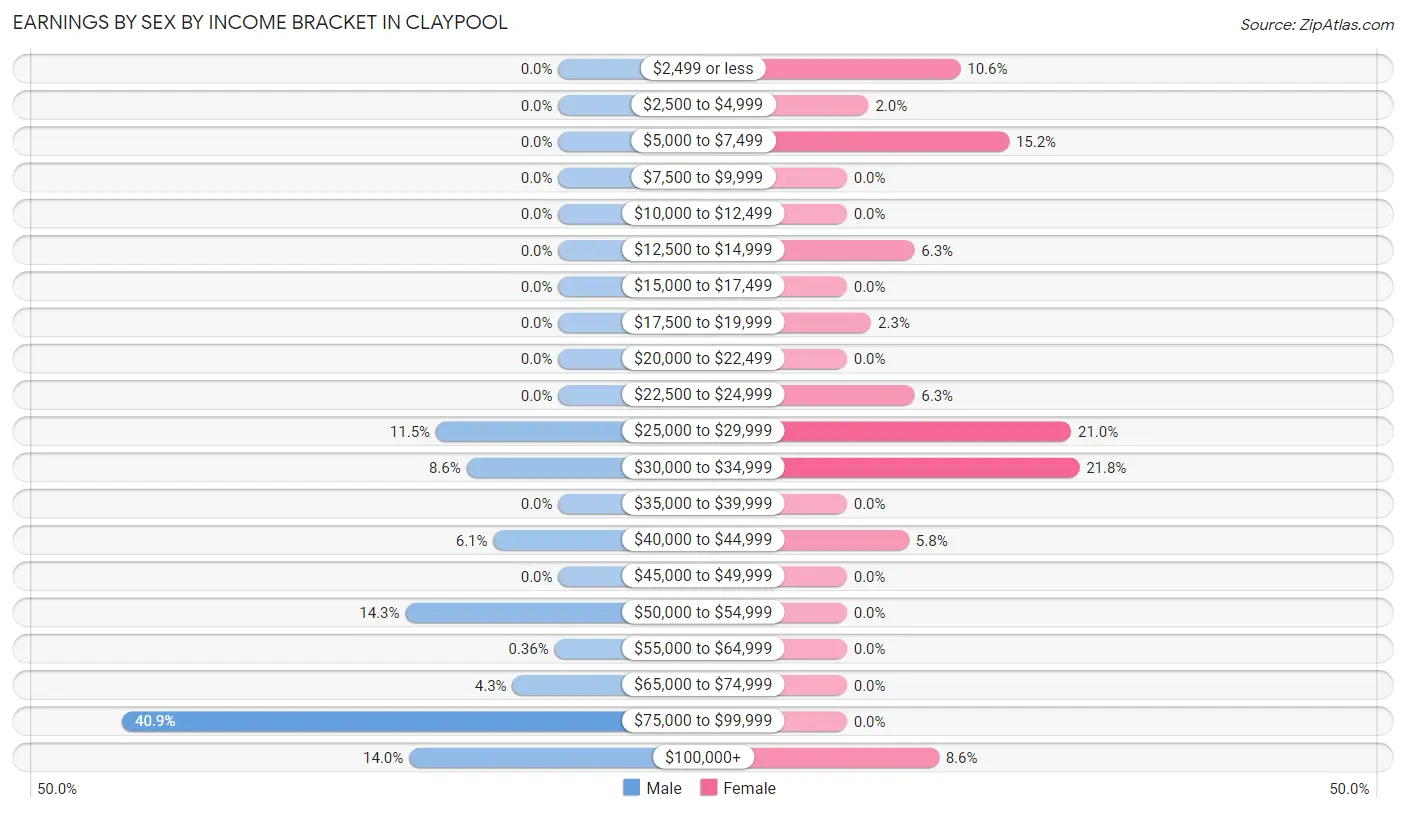
Earnings by Sex by Income Bracket in Claypool
The most common earnings brackets in Claypool are $75,000 to $99,999 for men (114 | 40.9%) and $30,000 to $34,999 for women (86 | 21.8%).
| Income | Male | Female |
| $2,499 or less | 0 (0.0%) | 42 (10.6%) |
| $2,500 to $4,999 | 0 (0.0%) | 8 (2.0%) |
| $5,000 to $7,499 | 0 (0.0%) | 60 (15.2%) |
| $7,500 to $9,999 | 0 (0.0%) | 0 (0.0%) |
| $10,000 to $12,499 | 0 (0.0%) | 0 (0.0%) |
| $12,500 to $14,999 | 0 (0.0%) | 25 (6.3%) |
| $15,000 to $17,499 | 0 (0.0%) | 0 (0.0%) |
| $17,500 to $19,999 | 0 (0.0%) | 9 (2.3%) |
| $20,000 to $22,499 | 0 (0.0%) | 0 (0.0%) |
| $22,500 to $24,999 | 0 (0.0%) | 25 (6.3%) |
| $25,000 to $29,999 | 32 (11.5%) | 83 (21.0%) |
| $30,000 to $34,999 | 24 (8.6%) | 86 (21.8%) |
| $35,000 to $39,999 | 0 (0.0%) | 0 (0.0%) |
| $40,000 to $44,999 | 17 (6.1%) | 23 (5.8%) |
| $45,000 to $49,999 | 0 (0.0%) | 0 (0.0%) |
| $50,000 to $54,999 | 40 (14.3%) | 0 (0.0%) |
| $55,000 to $64,999 | 1 (0.4%) | 0 (0.0%) |
| $65,000 to $74,999 | 12 (4.3%) | 0 (0.0%) |
| $75,000 to $99,999 | 114 (40.9%) | 0 (0.0%) |
| $100,000+ | 39 (14.0%) | 34 (8.6%) |
| Total | 279 (100.0%) | 395 (100.0%) |
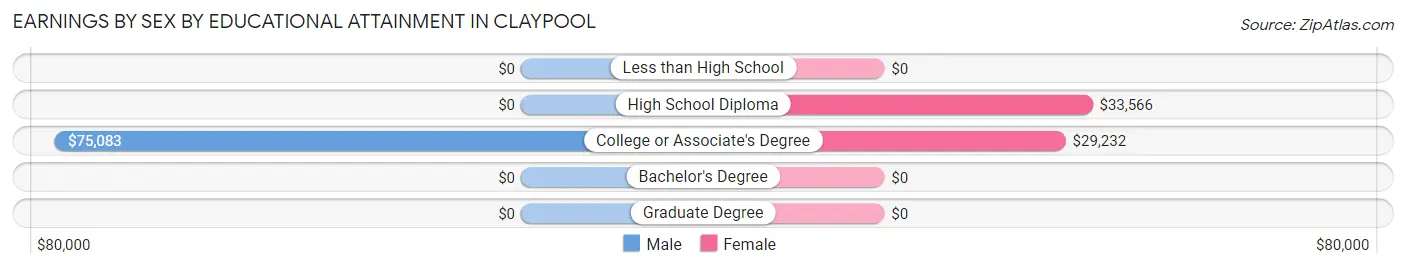
Earnings by Sex by Educational Attainment in Claypool
Average earnings in Claypool are $76,199 for men and $29,880 for women, a difference of 60.8%. Men with an educational attainment of college or associate's degree enjoy the highest average annual earnings of $75,083, while those with college or associate's degree education earn the least with $75,083. Women with an educational attainment of high school diploma earn the most with the average annual earnings of $33,566, while those with college or associate's degree education have the smallest earnings of $29,232.
| Educational Attainment | Male Income | Female Income |
| Less than High School | - | - |
| High School Diploma | - | - |
| College or Associate's Degree | $75,083 | $29,232 |
| Bachelor's Degree | - | - |
| Graduate Degree | - | - |
| Total | $76,199 | $29,880 |
Family Income in Claypool
Family Income Brackets in Claypool
According to the Claypool family income data, there are 85 families falling into the $50,000 to $74,999 income range, which is the most common income bracket and makes up 32.8% of all families.
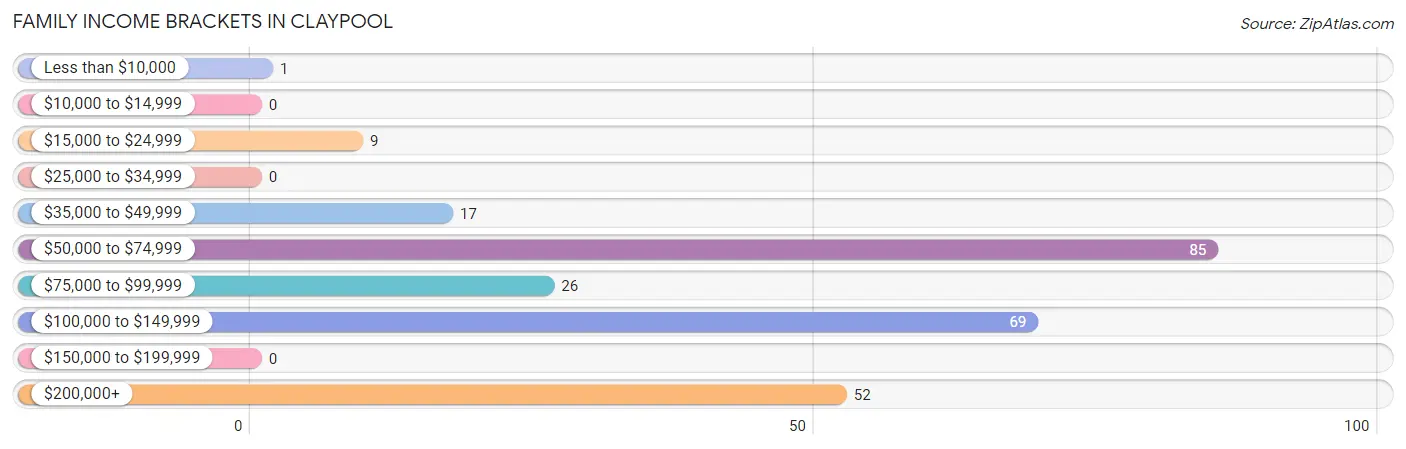
| Income Bracket | # Families | % Families |
| Less than $10,000 | 1 | 0.4% |
| $10,000 to $14,999 | 0 | 0.0% |
| $15,000 to $24,999 | 9 | 3.5% |
| $25,000 to $34,999 | 0 | 0.0% |
| $35,000 to $49,999 | 17 | 6.6% |
| $50,000 to $74,999 | 85 | 32.8% |
| $75,000 to $99,999 | 26 | 10.0% |
| $100,000 to $149,999 | 69 | 26.6% |
| $150,000 to $199,999 | 0 | 0.0% |
| $200,000+ | 52 | 20.1% |
Family Income by Famaliy Size in Claypool
2-person families (140 | 54.0%) account for the highest median family income in Claypool with $73,542 per family, while 2-person families (140 | 54.0%) have the highest median income of $36,771 per family member.
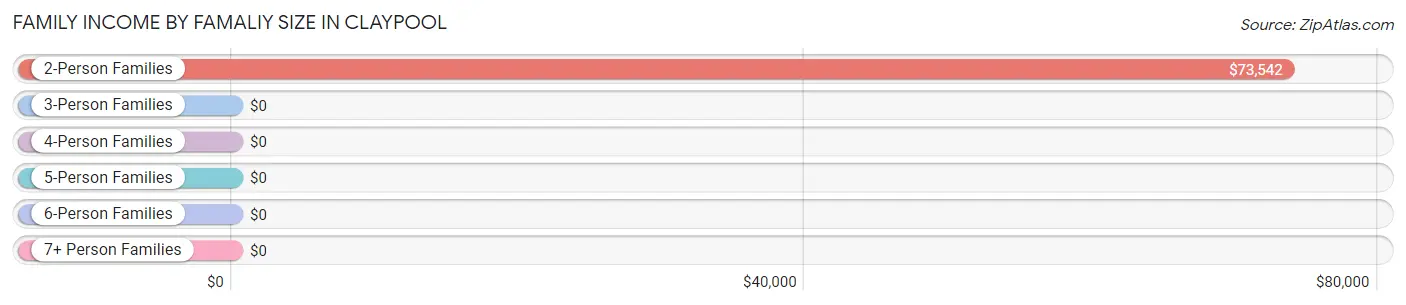
| Income Bracket | # Families | Median Income |
| 2-Person Families | 140 (54.0%) | $73,542 |
| 3-Person Families | 25 (9.7%) | $0 |
| 4-Person Families | 48 (18.5%) | $0 |
| 5-Person Families | 0 (0.0%) | $0 |
| 6-Person Families | 1 (0.4%) | $0 |
| 7+ Person Families | 45 (17.4%) | $0 |
| Total | 259 (100.0%) | $84,183 |
Family Income by Number of Earners in Claypool
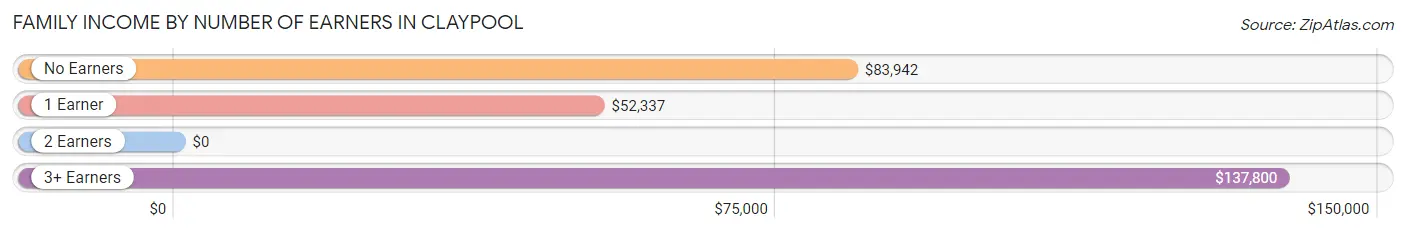
| Number of Earners | # Families | Median Income |
| No Earners | 32 (12.4%) | $83,942 |
| 1 Earner | 77 (29.7%) | $52,337 |
| 2 Earners | 66 (25.5%) | $0 |
| 3+ Earners | 84 (32.4%) | $137,800 |
| Total | 259 (100.0%) | $84,183 |
Household Income in Claypool
Household Income Brackets in Claypool
With 113 households falling in the category, the $100,000 to $149,999 income range is the most frequent in Claypool, accounting for 23.2% of all households.
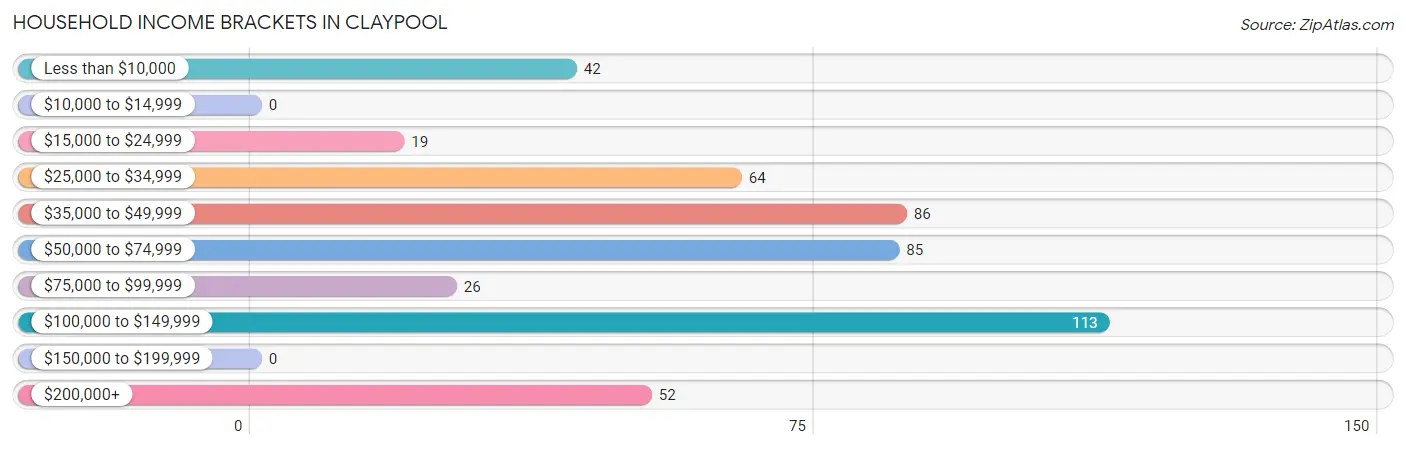
| Income Bracket | # Households | % Households |
| Less than $10,000 | 42 | 8.6% |
| $10,000 to $14,999 | 0 | 0.0% |
| $15,000 to $24,999 | 19 | 3.9% |
| $25,000 to $34,999 | 64 | 13.1% |
| $35,000 to $49,999 | 86 | 17.7% |
| $50,000 to $74,999 | 85 | 17.5% |
| $75,000 to $99,999 | 26 | 5.3% |
| $100,000 to $149,999 | 113 | 23.2% |
| $150,000 to $199,999 | 0 | 0.0% |
| $200,000+ | 52 | 10.7% |
Household Income by Householder Age in Claypool
The median household income in Claypool is $53,450, with the highest median household income of $105,929 found in the 45 to 64 years age bracket for the primary householder. A total of 203 households (41.7%) fall into this category.
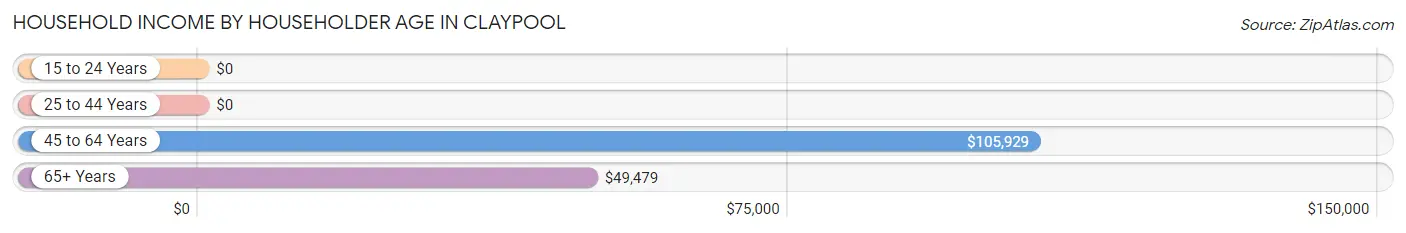
| Income Bracket | # Households | Median Income |
| 15 to 24 Years | 0 (0.0%) | $0 |
| 25 to 44 Years | 123 (25.3%) | $0 |
| 45 to 64 Years | 203 (41.7%) | $105,929 |
| 65+ Years | 161 (33.1%) | $49,479 |
| Total | 487 (100.0%) | $53,450 |
Poverty in Claypool
Income Below Poverty by Sex and Age in Claypool
With 10.5% poverty level for males and 6.4% for females among the residents of Claypool, 15 year old males and 12 to 14 year old females are the most vulnerable to poverty, with 9 males (37.5%) and 8 females (100.0%) in their respective age groups living below the poverty level.
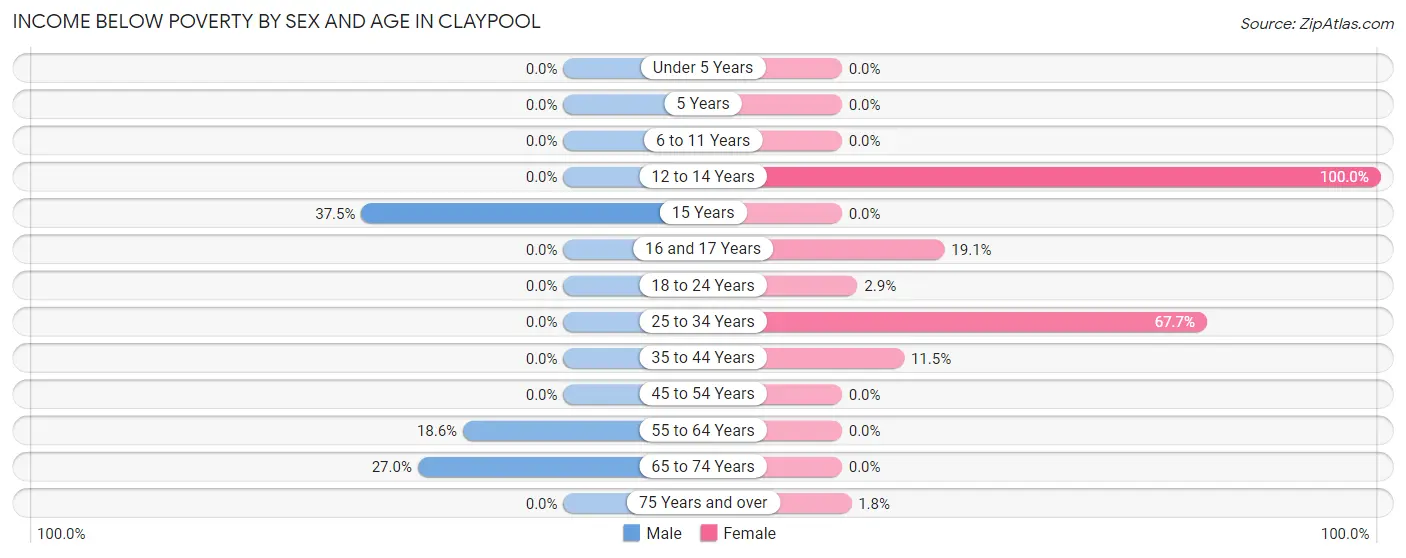
| Age Bracket | Male | Female |
| Under 5 Years | 0 (0.0%) | 0 (0.0%) |
| 5 Years | 0 (0.0%) | 0 (0.0%) |
| 6 to 11 Years | 0 (0.0%) | 0 (0.0%) |
| 12 to 14 Years | 0 (0.0%) | 8 (100.0%) |
| 15 Years | 9 (37.5%) | 0 (0.0%) |
| 16 and 17 Years | 0 (0.0%) | 8 (19.1%) |
| 18 to 24 Years | 0 (0.0%) | 2 (2.9%) |
| 25 to 34 Years | 0 (0.0%) | 21 (67.7%) |
| 35 to 44 Years | 0 (0.0%) | 9 (11.5%) |
| 45 to 54 Years | 0 (0.0%) | 0 (0.0%) |
| 55 to 64 Years | 22 (18.6%) | 0 (0.0%) |
| 65 to 74 Years | 20 (27.0%) | 0 (0.0%) |
| 75 Years and over | 0 (0.0%) | 1 (1.8%) |
| Total | 51 (10.5%) | 49 (6.4%) |
Income Above Poverty by Sex and Age in Claypool
According to the poverty statistics in Claypool, males aged 5 years and females aged under 5 years are the age groups that are most secure financially, with 100.0% of males and 100.0% of females in these age groups living above the poverty line.
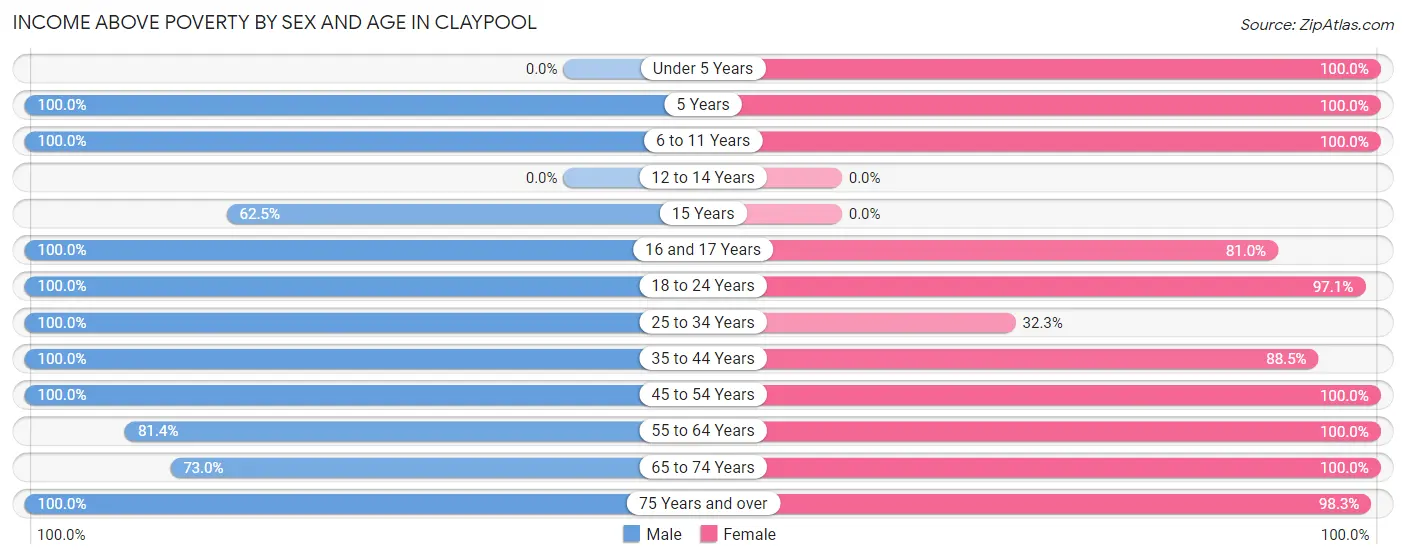
| Age Bracket | Male | Female |
| Under 5 Years | 0 (0.0%) | 65 (100.0%) |
| 5 Years | 48 (100.0%) | 68 (100.0%) |
| 6 to 11 Years | 1 (100.0%) | 84 (100.0%) |
| 12 to 14 Years | 0 (0.0%) | 0 (0.0%) |
| 15 Years | 15 (62.5%) | 0 (0.0%) |
| 16 and 17 Years | 7 (100.0%) | 34 (80.9%) |
| 18 to 24 Years | 20 (100.0%) | 67 (97.1%) |
| 25 to 34 Years | 29 (100.0%) | 10 (32.3%) |
| 35 to 44 Years | 72 (100.0%) | 69 (88.5%) |
| 45 to 54 Years | 62 (100.0%) | 126 (100.0%) |
| 55 to 64 Years | 96 (81.4%) | 86 (100.0%) |
| 65 to 74 Years | 54 (73.0%) | 53 (100.0%) |
| 75 Years and over | 30 (100.0%) | 56 (98.3%) |
| Total | 434 (89.5%) | 718 (93.6%) |
Income Below Poverty Among Married-Couple Families in Claypool
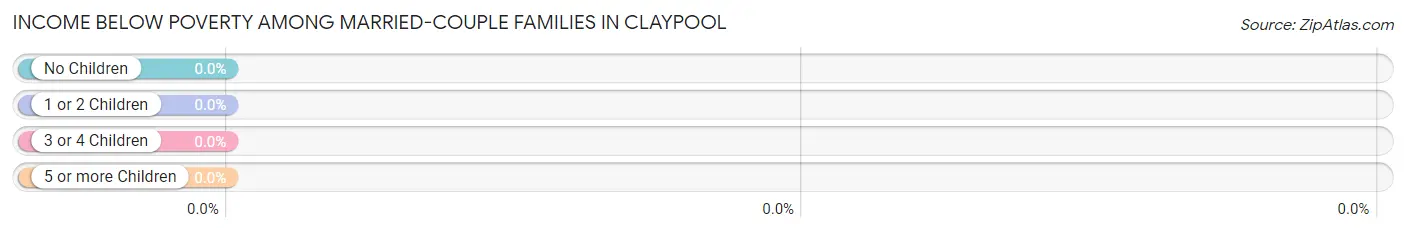
| Children | Above Poverty | Below Poverty |
| No Children | 116 (100.0%) | 0 (0.0%) |
| 1 or 2 Children | 39 (100.0%) | 0 (0.0%) |
| 3 or 4 Children | 46 (100.0%) | 0 (0.0%) |
| 5 or more Children | 0 (0.0%) | 0 (0.0%) |
| Total | 201 (100.0%) | 0 (0.0%) |
Income Below Poverty Among Single-Parent Households in Claypool
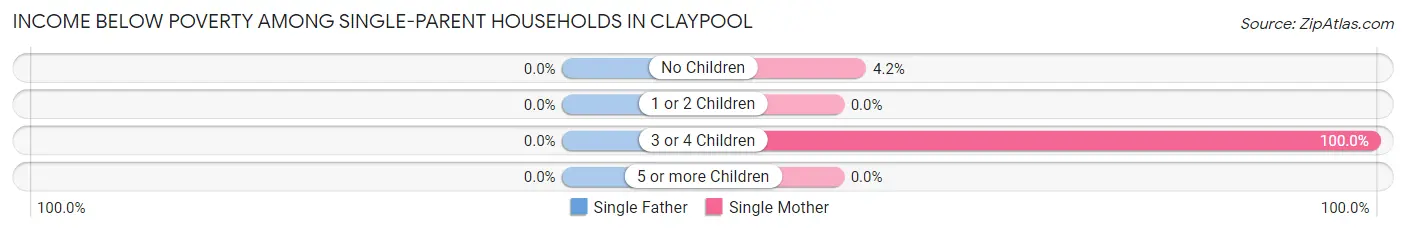
| Children | Single Father | Single Mother |
| No Children | 0 (0.0%) | 1 (4.2%) |
| 1 or 2 Children | 0 (0.0%) | 0 (0.0%) |
| 3 or 4 Children | 0 (0.0%) | 9 (100.0%) |
| 5 or more Children | 0 (0.0%) | 0 (0.0%) |
| Total | 0 (0.0%) | 10 (17.2%) |
Income Below Poverty Among Married-Couple vs Single-Parent Households in Claypool
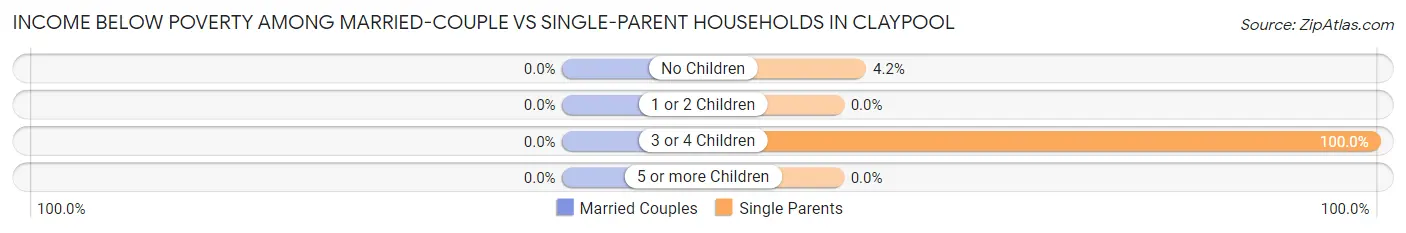
| Children | Married-Couple Families | Single-Parent Households |
| No Children | 0 (0.0%) | 1 (4.2%) |
| 1 or 2 Children | 0 (0.0%) | 0 (0.0%) |
| 3 or 4 Children | 0 (0.0%) | 9 (100.0%) |
| 5 or more Children | 0 (0.0%) | 0 (0.0%) |
| Total | 0 (0.0%) | 10 (17.2%) |
Race in Claypool
The most populous races in Claypool are Hispanic or Latino (704 | 56.2%), White / Caucasian (637 | 50.9%), and Two or more Races (366 | 29.2%).
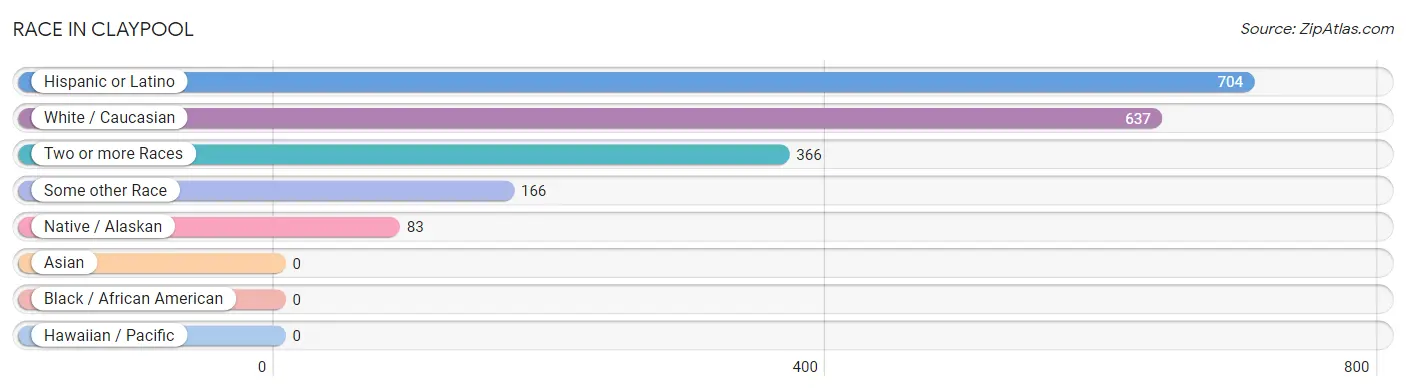
| Race | # Population | % Population |
| Asian | 0 | 0.0% |
| Black / African American | 0 | 0.0% |
| Hawaiian / Pacific | 0 | 0.0% |
| Hispanic or Latino | 704 | 56.2% |
| Native / Alaskan | 83 | 6.6% |
| White / Caucasian | 637 | 50.9% |
| Two or more Races | 366 | 29.2% |
| Some other Race | 166 | 13.3% |
| Total | 1,252 | 100.0% |
Ancestry in Claypool
The most populous ancestries reported in Claypool are Mexican (557 | 44.5%), Irish (212 | 16.9%), German (193 | 15.4%), Italian (132 | 10.5%), and English (98 | 7.8%), together accounting for 95.2% of all Claypool residents.
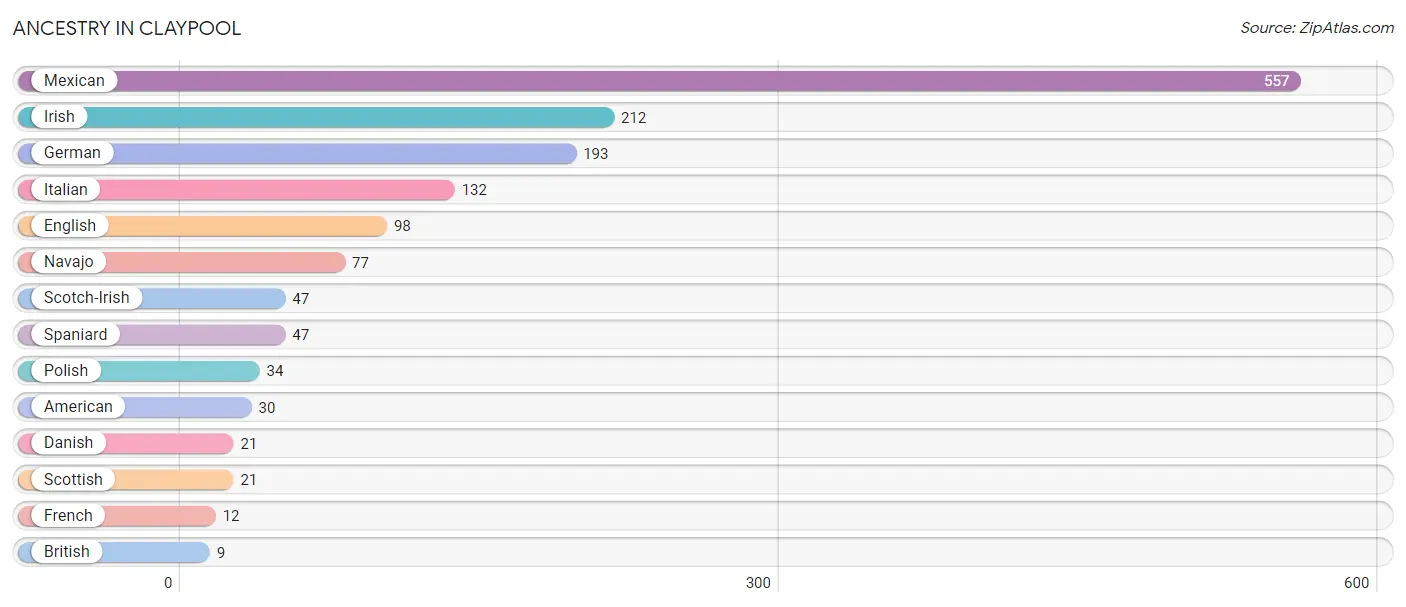
| Ancestry | # Population | % Population |
| American | 30 | 2.4% |
| British | 9 | 0.7% |
| Danish | 21 | 1.7% |
| English | 98 | 7.8% |
| French | 12 | 1.0% |
| German | 193 | 15.4% |
| Irish | 212 | 16.9% |
| Italian | 132 | 10.5% |
| Mexican | 557 | 44.5% |
| Navajo | 77 | 6.1% |
| Polish | 34 | 2.7% |
| Scotch-Irish | 47 | 3.7% |
| Scottish | 21 | 1.7% |
| Spaniard | 47 | 3.7% | View All 14 Rows |
Immigrants in Claypool
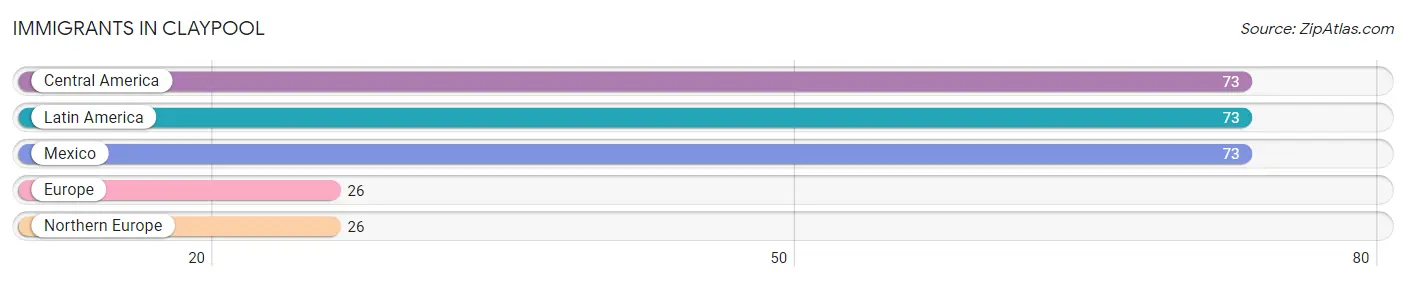
The most numerous immigrant groups reported in Claypool came from Central America (73 | 5.8%), Latin America (73 | 5.8%), Mexico (73 | 5.8%), Europe (26 | 2.1%), and Northern Europe (26 | 2.1%), together accounting for 21.6% of all Claypool residents.
| Immigration Origin | # Population | % Population |
| Central America | 73 | 5.8% |
| Europe | 26 | 2.1% |
| Latin America | 73 | 5.8% |
| Mexico | 73 | 5.8% |
| Northern Europe | 26 | 2.1% | View All 5 Rows |
Sex and Age in Claypool
Sex and Age in Claypool
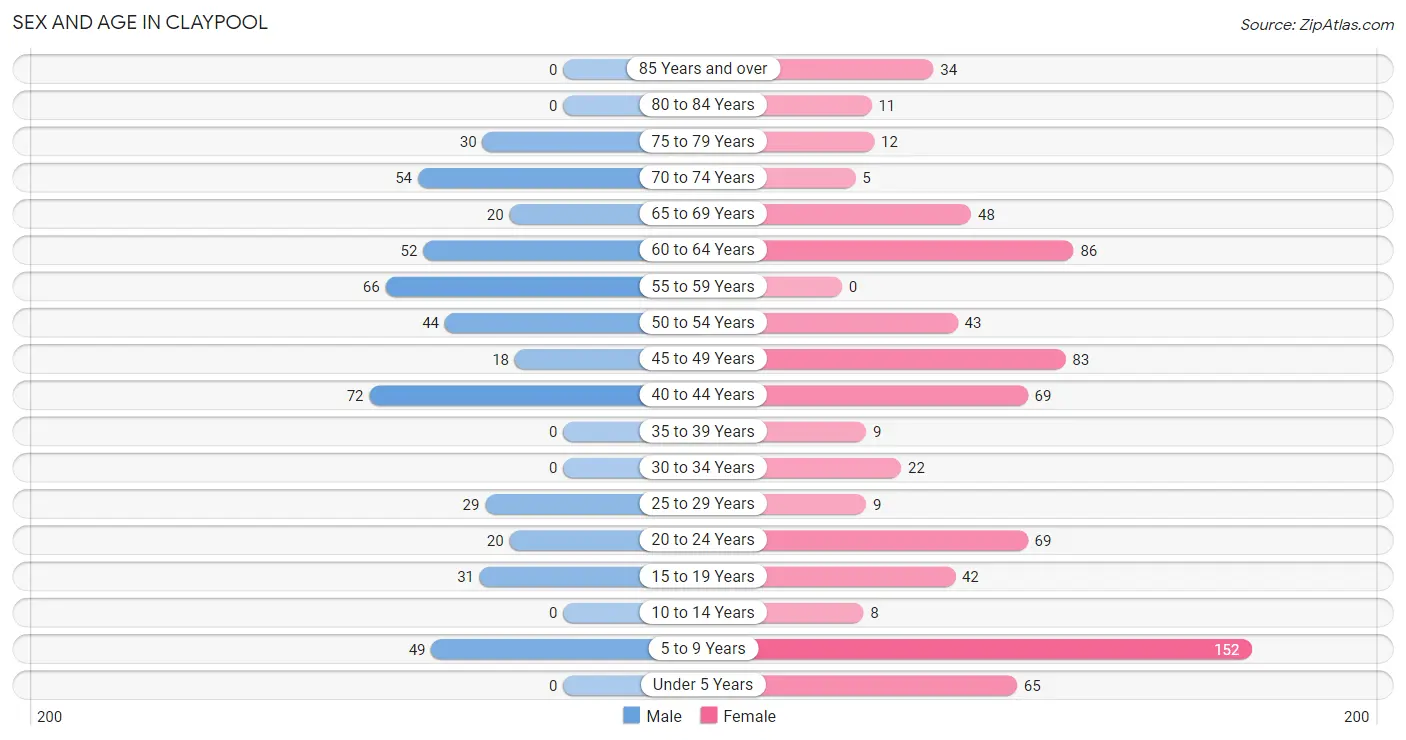
The most populous age groups in Claypool are 40 to 44 Years (72 | 14.8%) for men and 5 to 9 Years (152 | 19.8%) for women.
| Age Bracket | Male | Female |
| Under 5 Years | 0 (0.0%) | 65 (8.5%) |
| 5 to 9 Years | 49 (10.1%) | 152 (19.8%) |
| 10 to 14 Years | 0 (0.0%) | 8 (1.0%) |
| 15 to 19 Years | 31 (6.4%) | 42 (5.5%) |
| 20 to 24 Years | 20 (4.1%) | 69 (9.0%) |
| 25 to 29 Years | 29 (6.0%) | 9 (1.2%) |
| 30 to 34 Years | 0 (0.0%) | 22 (2.9%) |
| 35 to 39 Years | 0 (0.0%) | 9 (1.2%) |
| 40 to 44 Years | 72 (14.8%) | 69 (9.0%) |
| 45 to 49 Years | 18 (3.7%) | 83 (10.8%) |
| 50 to 54 Years | 44 (9.1%) | 43 (5.6%) |
| 55 to 59 Years | 66 (13.6%) | 0 (0.0%) |
| 60 to 64 Years | 52 (10.7%) | 86 (11.2%) |
| 65 to 69 Years | 20 (4.1%) | 48 (6.3%) |
| 70 to 74 Years | 54 (11.1%) | 5 (0.6%) |
| 75 to 79 Years | 30 (6.2%) | 12 (1.6%) |
| 80 to 84 Years | 0 (0.0%) | 11 (1.4%) |
| 85 Years and over | 0 (0.0%) | 34 (4.4%) |
| Total | 485 (100.0%) | 767 (100.0%) |
Families and Households in Claypool
Median Family Size in Claypool
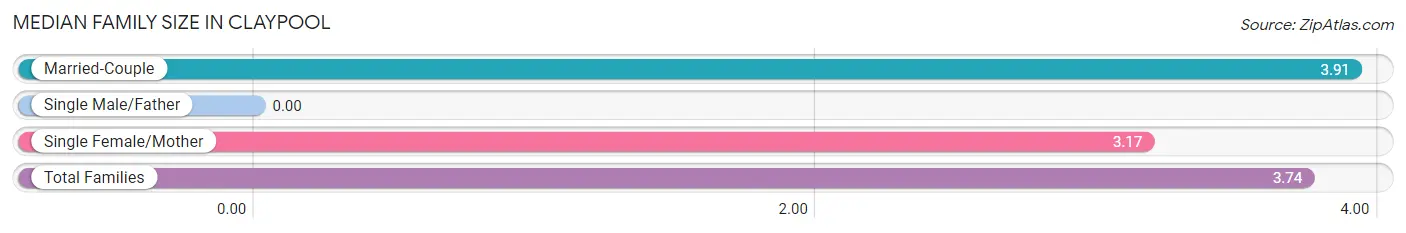
| Family Type | # Families | Family Size |
| Married-Couple | 201 (77.6%) | 3.91 |
| Single Male/Father | 0 (0.0%) | - |
| Single Female/Mother | 58 (22.4%) | 3.17 |
| Total Families | 259 (100.0%) | 3.74 |
Median Household Size in Claypool
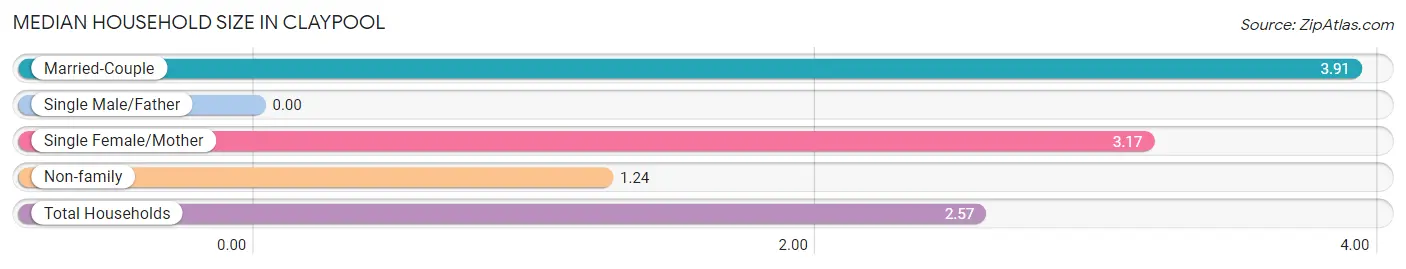
| Household Type | # Households | Household Size |
| Married-Couple | 201 (41.3%) | 3.91 |
| Single Male/Father | 0 (0.0%) | - |
| Single Female/Mother | 58 (11.9%) | 3.17 |
| Non-family | 228 (46.8%) | 1.24 |
| Total Households | 487 (100.0%) | 2.57 |
Household Size by Marriage Status in Claypool
Out of a total of 487 households in Claypool, 259 (53.2%) are family households, while 228 (46.8%) are nonfamily households. The most numerous type of family households are 2-person households, comprising 140, and the most common type of nonfamily households are 1-person households, comprising 159.
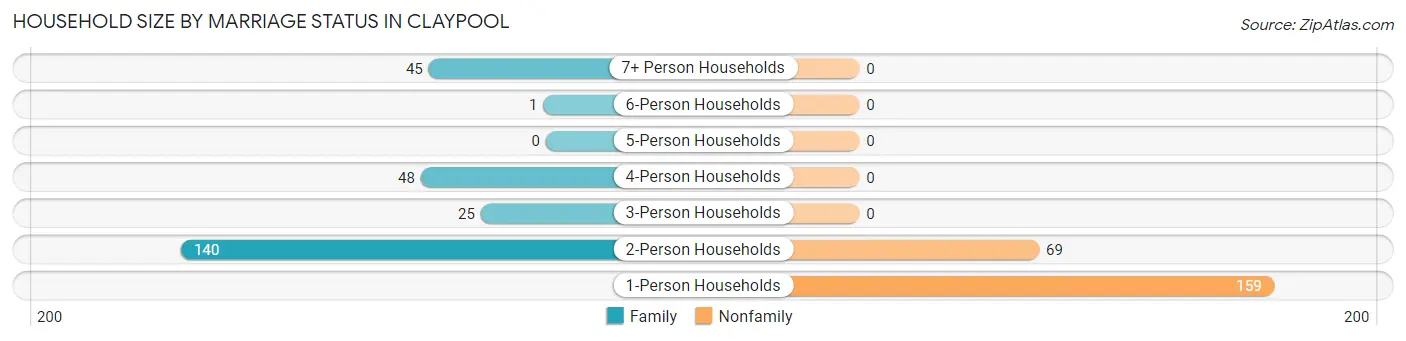
| Household Size | Family Households | Nonfamily Households |
| 1-Person Households | - | 159 (32.7%) |
| 2-Person Households | 140 (28.7%) | 69 (14.2%) |
| 3-Person Households | 25 (5.1%) | 0 (0.0%) |
| 4-Person Households | 48 (9.9%) | 0 (0.0%) |
| 5-Person Households | 0 (0.0%) | 0 (0.0%) |
| 6-Person Households | 1 (0.2%) | 0 (0.0%) |
| 7+ Person Households | 45 (9.2%) | 0 (0.0%) |
| Total | 259 (53.2%) | 228 (46.8%) |
Female Fertility in Claypool
Fertility by Age in Claypool
Average fertility rate in Claypool is 23.0 births per 1,000 women. Women in the age bracket of 20 to 34 years have the highest fertility rate with 70.0 births per 1,000 women. Women in the age bracket of 20 to 34 years acount for 100.0% of all women with births.
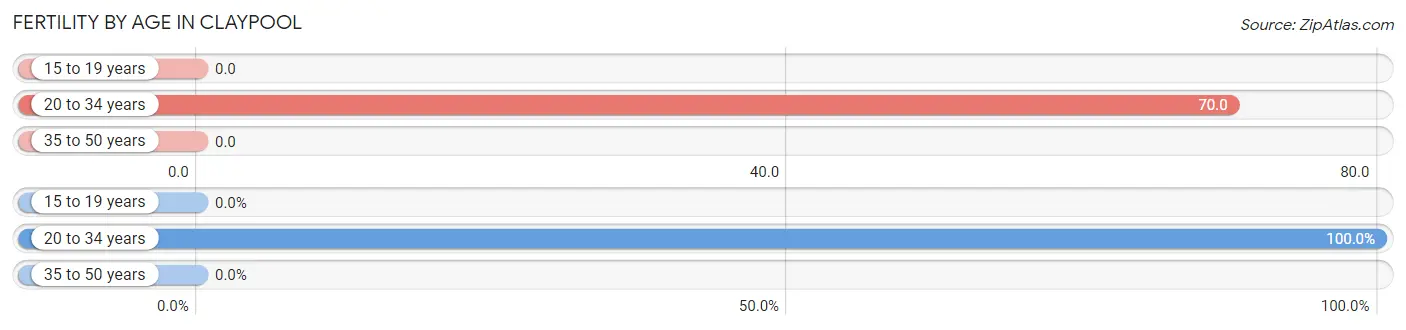
| Age Bracket | Women with Births | Births / 1,000 Women |
| 15 to 19 years | 0 (0.0%) | 0.0 |
| 20 to 34 years | 7 (100.0%) | 70.0 |
| 35 to 50 years | 0 (0.0%) | 0.0 |
| Total | 7 (100.0%) | 23.0 |
Fertility by Age by Marriage Status in Claypool
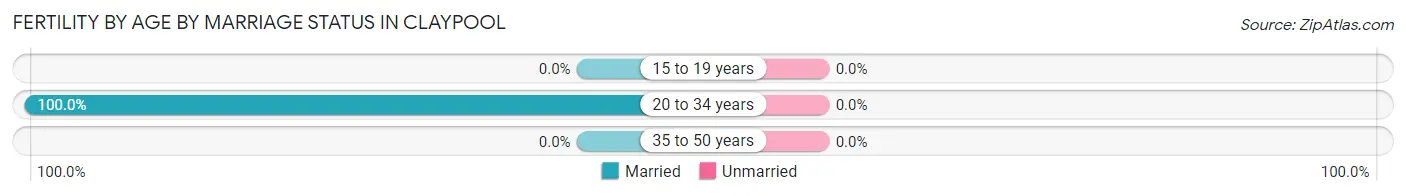
| Age Bracket | Married | Unmarried |
| 15 to 19 years | 0 (0.0%) | 0 (0.0%) |
| 20 to 34 years | 7 (100.0%) | 0 (0.0%) |
| 35 to 50 years | 0 (0.0%) | 0 (0.0%) |
| Total | 7 (100.0%) | 0 (0.0%) |
Fertility by Education in Claypool
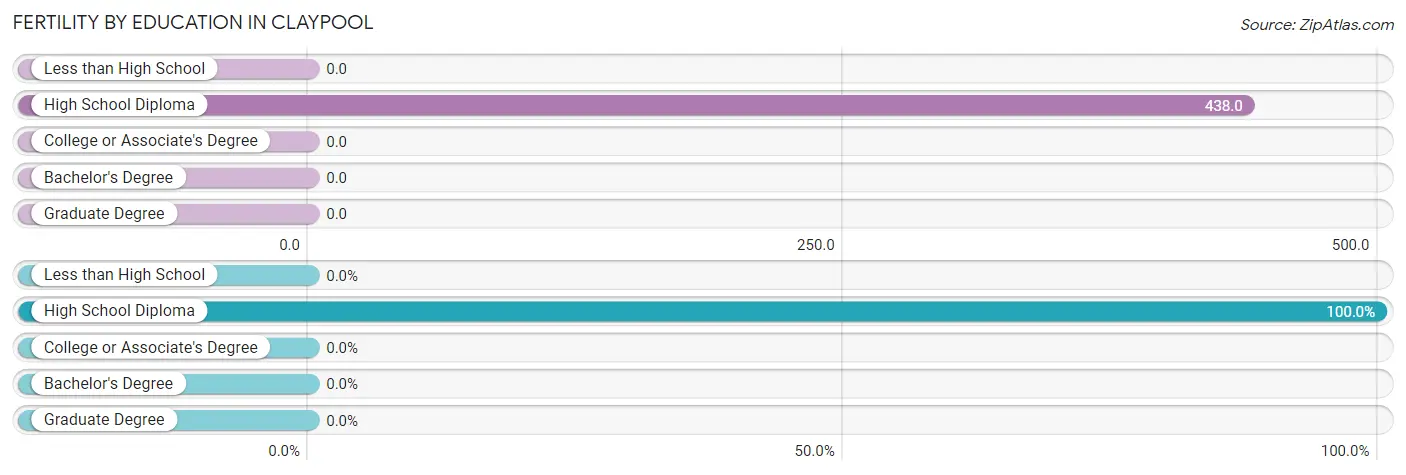
| Educational Attainment | Women with Births | Births / 1,000 Women |
| Less than High School | 0 (0.0%) | 0.0 |
| High School Diploma | 7 (100.0%) | 438.0 |
| College or Associate's Degree | 0 (0.0%) | 0.0 |
| Bachelor's Degree | 0 (0.0%) | 0.0 |
| Graduate Degree | 0 (0.0%) | 0.0 |
| Total | 7 (100.0%) | 23.0 |
Fertility by Education by Marriage Status in Claypool
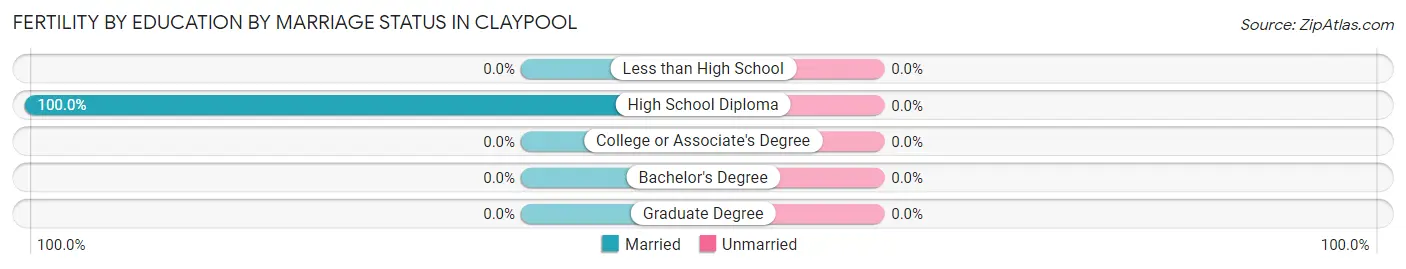
| Educational Attainment | Married | Unmarried |
| Less than High School | 0 (0.0%) | 0 (0.0%) |
| High School Diploma | 7 (100.0%) | 0 (0.0%) |
| College or Associate's Degree | 0 (0.0%) | 0 (0.0%) |
| Bachelor's Degree | 0 (0.0%) | 0 (0.0%) |
| Graduate Degree | 0 (0.0%) | 0 (0.0%) |
| Total | 7 (100.0%) | 0 (0.0%) |
Employment Characteristics in Claypool
Employment by Class of Employer in Claypool
Among the 593 employed individuals in Claypool, private company employees (448 | 75.5%), self-employed (incorporated) (85 | 14.3%), and local government employees (35 | 5.9%) make up the most common classes of employment.
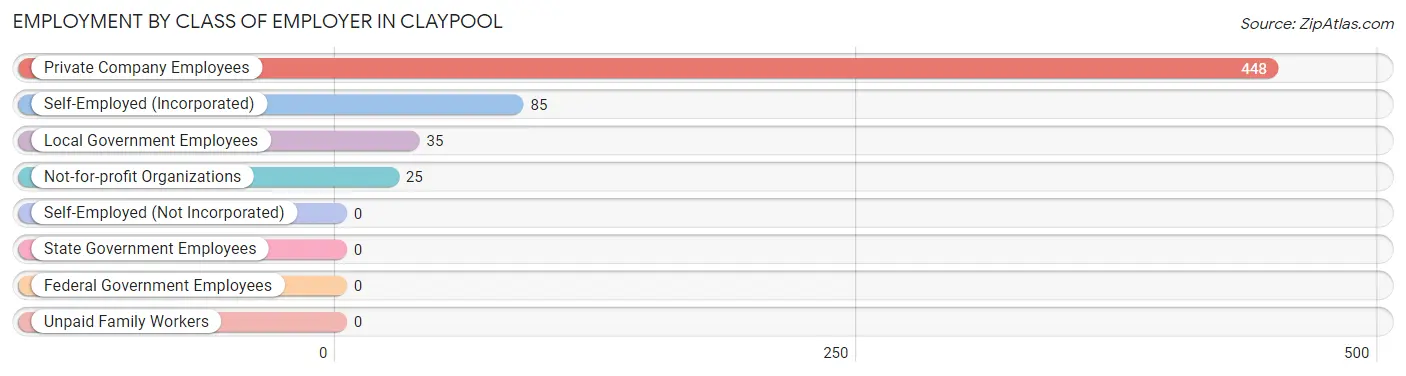
| Employer Class | # Employees | % Employees |
| Private Company Employees | 448 | 75.5% |
| Self-Employed (Incorporated) | 85 | 14.3% |
| Self-Employed (Not Incorporated) | 0 | 0.0% |
| Not-for-profit Organizations | 25 | 4.2% |
| Local Government Employees | 35 | 5.9% |
| State Government Employees | 0 | 0.0% |
| Federal Government Employees | 0 | 0.0% |
| Unpaid Family Workers | 0 | 0.0% |
| Total | 593 | 100.0% |
Employment Status by Age in Claypool
According to the labor force statistics for Claypool, out of the total population over 16 years of age (954), 70.6% or 674 individuals are in the labor force, with 10.8% or 73 of them unemployed. The age group with the highest labor force participation rate is 25 to 29 years, with 100.0% or 38 individuals in the labor force. Within the labor force, the 25 to 29 years age range has the highest percentage of unemployed individuals, with 76.3% or 29 of them being unemployed.
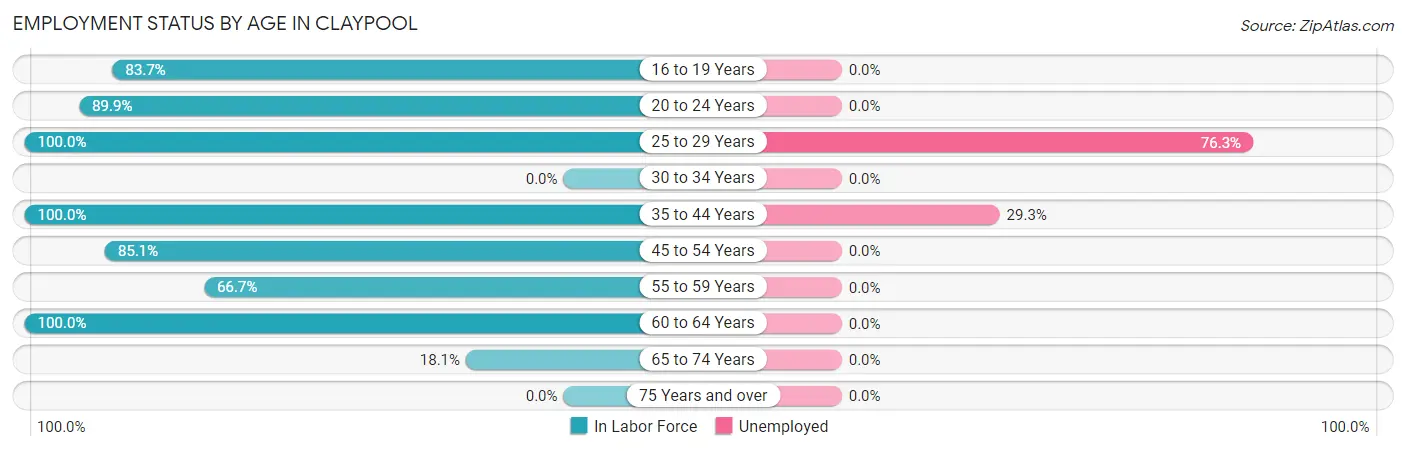
| Age Bracket | In Labor Force | Unemployed |
| 16 to 19 Years | 41 (83.7%) | 0 (0.0%) |
| 20 to 24 Years | 80 (89.9%) | 0 (0.0%) |
| 25 to 29 Years | 38 (100.0%) | 29 (76.3%) |
| 30 to 34 Years | 0 (0.0%) | 0 (0.0%) |
| 35 to 44 Years | 150 (100.0%) | 44 (29.3%) |
| 45 to 54 Years | 160 (85.1%) | 0 (0.0%) |
| 55 to 59 Years | 44 (66.7%) | 0 (0.0%) |
| 60 to 64 Years | 138 (100.0%) | 0 (0.0%) |
| 65 to 74 Years | 23 (18.1%) | 0 (0.0%) |
| 75 Years and over | 0 (0.0%) | 0 (0.0%) |
| Total | 674 (70.6%) | 73 (10.8%) |
Employment Status by Educational Attainment in Claypool
According to labor force statistics for Claypool, 88.0% of individuals (530) out of the total population between 25 and 64 years of age (602) are in the labor force, with 13.8% or 73 of them being unemployed. The group with the highest labor force participation rate are those with the educational attainment of high school diploma, with 100.0% or 134 individuals in the labor force. Within the labor force, individuals with less than high school education have the highest percentage of unemployment, with 36.3% or 29 of them being unemployed.
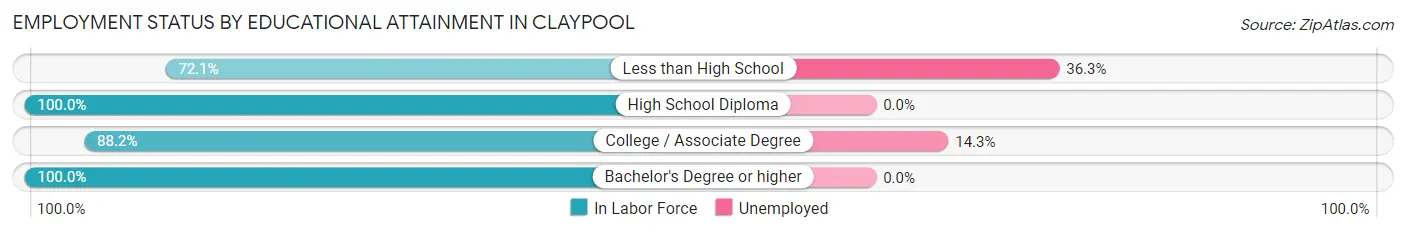
| Educational Attainment | In Labor Force | Unemployed |
| Less than High School | 80 (72.1%) | 40 (36.3%) |
| High School Diploma | 134 (100.0%) | 0 (0.0%) |
| College / Associate Degree | 307 (88.2%) | 50 (14.3%) |
| Bachelor's Degree or higher | 9 (100.0%) | 0 (0.0%) |
| Total | 530 (88.0%) | 83 (13.8%) |
Employment Occupations by Sex in Claypool
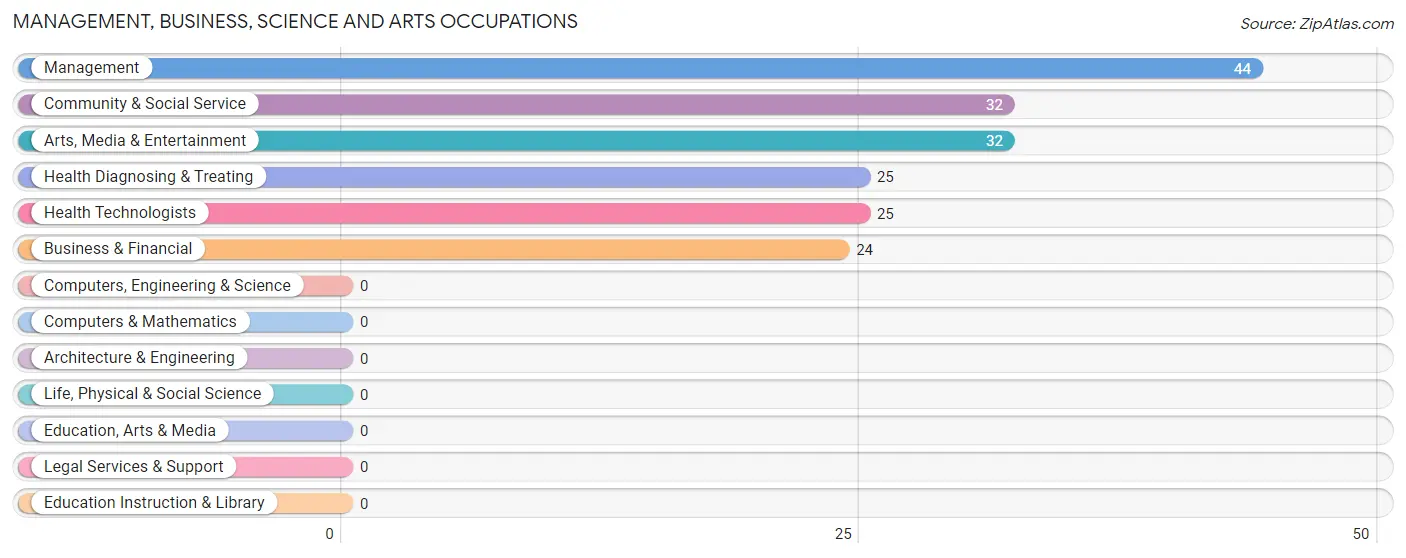
Management, Business, Science and Arts Occupations
The most common Management, Business, Science and Arts occupations in Claypool are Management (44 | 7.3%), Community & Social Service (32 | 5.3%), Arts, Media & Entertainment (32 | 5.3%), Health Diagnosing & Treating (25 | 4.2%), and Health Technologists (25 | 4.2%).
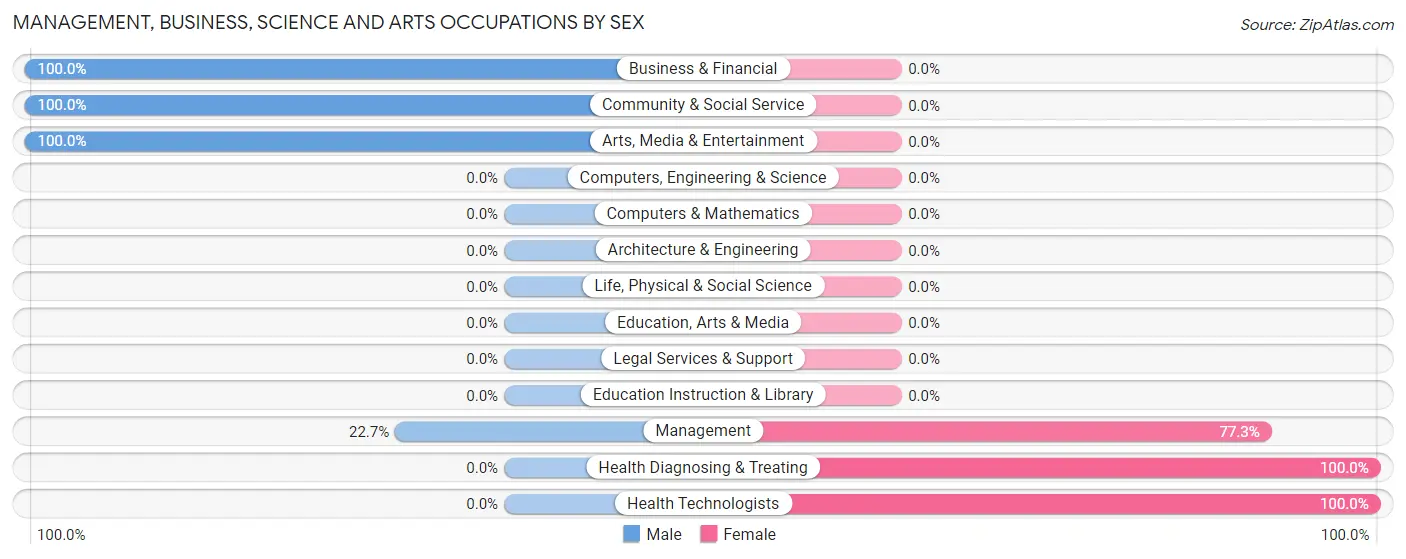
Management, Business, Science and Arts Occupations by Sex
Within the Management, Business, Science and Arts occupations in Claypool, the most male-oriented occupations are Business & Financial (100.0%), Community & Social Service (100.0%), and Arts, Media & Entertainment (100.0%), while the most female-oriented occupations are Health Diagnosing & Treating (100.0%), Health Technologists (100.0%), and Management (77.3%).
| Occupation | Male | Female |
| Management | 10 (22.7%) | 34 (77.3%) |
| Business & Financial | 24 (100.0%) | 0 (0.0%) |
| Computers, Engineering & Science | 0 (0.0%) | 0 (0.0%) |
| Computers & Mathematics | 0 (0.0%) | 0 (0.0%) |
| Architecture & Engineering | 0 (0.0%) | 0 (0.0%) |
| Life, Physical & Social Science | 0 (0.0%) | 0 (0.0%) |
| Community & Social Service | 32 (100.0%) | 0 (0.0%) |
| Education, Arts & Media | 0 (0.0%) | 0 (0.0%) |
| Legal Services & Support | 0 (0.0%) | 0 (0.0%) |
| Education Instruction & Library | 0 (0.0%) | 0 (0.0%) |
| Arts, Media & Entertainment | 32 (100.0%) | 0 (0.0%) |
| Health Diagnosing & Treating | 0 (0.0%) | 25 (100.0%) |
| Health Technologists | 0 (0.0%) | 25 (100.0%) |
| Total (Category) | 66 (52.8%) | 59 (47.2%) |
| Total (Overall) | 250 (41.6%) | 351 (58.4%) |
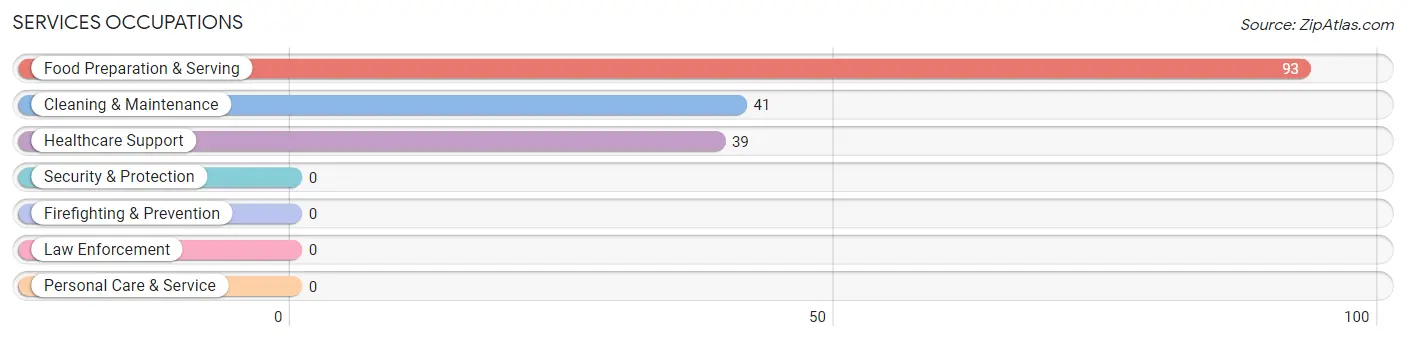
Services Occupations
The most common Services occupations in Claypool are Food Preparation & Serving (93 | 15.5%), Cleaning & Maintenance (41 | 6.8%), and Healthcare Support (39 | 6.5%).
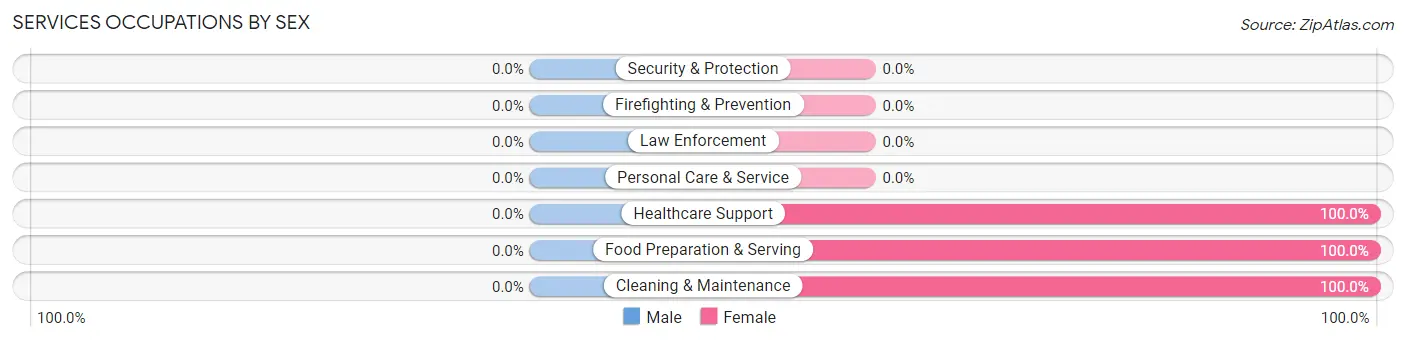
Services Occupations by Sex
| Occupation | Male | Female |
| Healthcare Support | 0 (0.0%) | 39 (100.0%) |
| Security & Protection | 0 (0.0%) | 0 (0.0%) |
| Firefighting & Prevention | 0 (0.0%) | 0 (0.0%) |
| Law Enforcement | 0 (0.0%) | 0 (0.0%) |
| Food Preparation & Serving | 0 (0.0%) | 93 (100.0%) |
| Cleaning & Maintenance | 0 (0.0%) | 41 (100.0%) |
| Personal Care & Service | 0 (0.0%) | 0 (0.0%) |
| Total (Category) | 0 (0.0%) | 173 (100.0%) |
| Total (Overall) | 250 (41.6%) | 351 (58.4%) |
Sales and Office Occupations
The most common Sales and Office occupations in Claypool are Office & Administration (102 | 17.0%), and Sales & Related (8 | 1.3%).
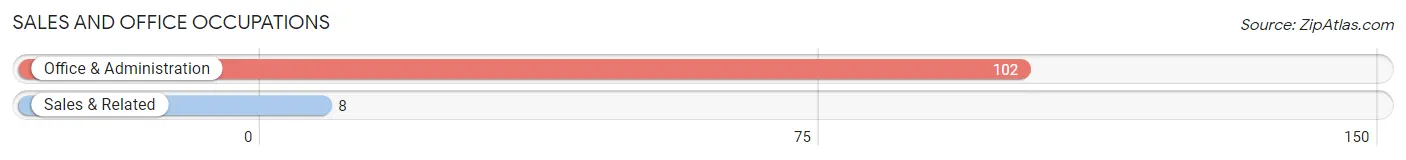
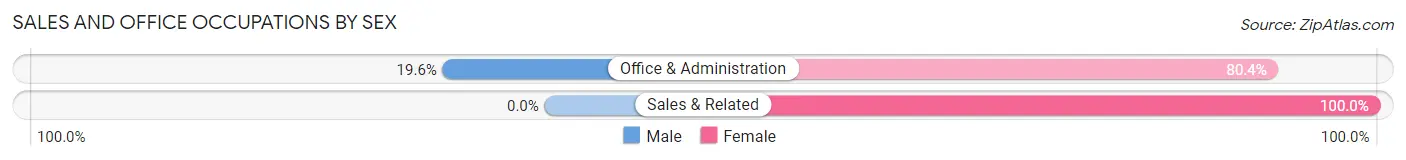
Sales and Office Occupations by Sex
| Occupation | Male | Female |
| Sales & Related | 0 (0.0%) | 8 (100.0%) |
| Office & Administration | 20 (19.6%) | 82 (80.4%) |
| Total (Category) | 20 (18.2%) | 90 (81.8%) |
| Total (Overall) | 250 (41.6%) | 351 (58.4%) |
Natural Resources, Construction and Maintenance Occupations
The most common Natural Resources, Construction and Maintenance occupations in Claypool are , and Construction & Extraction (28 | 4.7%).
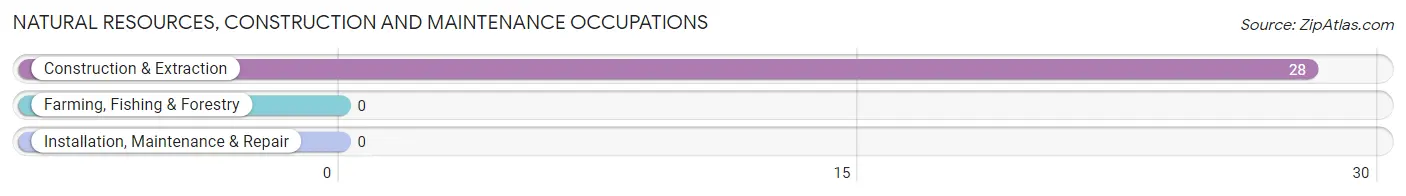
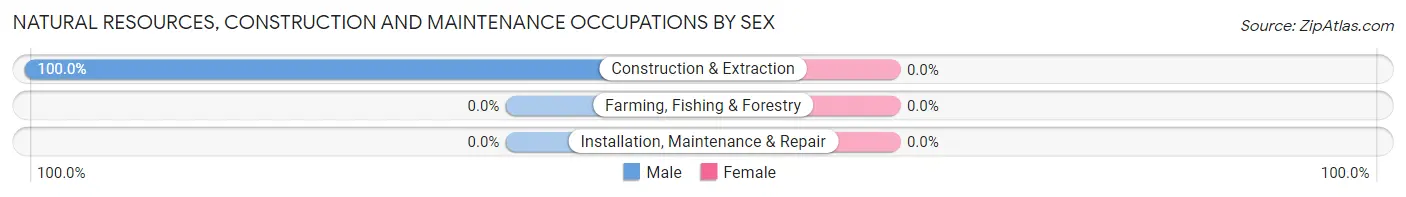
Natural Resources, Construction and Maintenance Occupations by Sex
| Occupation | Male | Female |
| Farming, Fishing & Forestry | 0 (0.0%) | 0 (0.0%) |
| Construction & Extraction | 28 (100.0%) | 0 (0.0%) |
| Installation, Maintenance & Repair | 0 (0.0%) | 0 (0.0%) |
| Total (Category) | 28 (100.0%) | 0 (0.0%) |
| Total (Overall) | 250 (41.6%) | 351 (58.4%) |
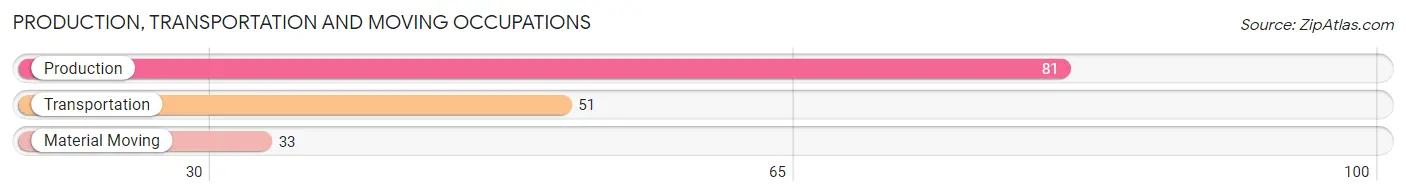
Production, Transportation and Moving Occupations
The most common Production, Transportation and Moving occupations in Claypool are Production (81 | 13.5%), Transportation (51 | 8.5%), and Material Moving (33 | 5.5%).
Production, Transportation and Moving Occupations by Sex
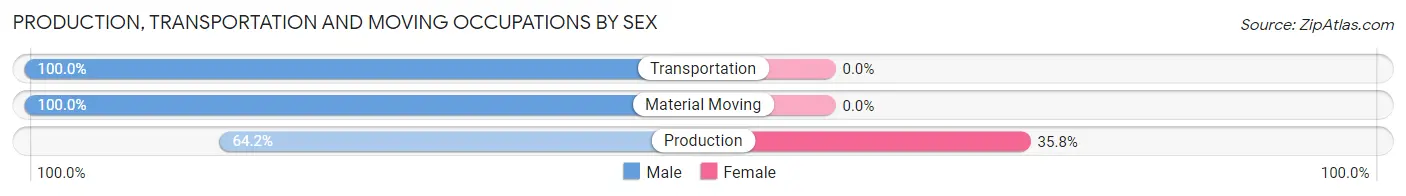
| Occupation | Male | Female |
| Production | 52 (64.2%) | 29 (35.8%) |
| Transportation | 51 (100.0%) | 0 (0.0%) |
| Material Moving | 33 (100.0%) | 0 (0.0%) |
| Total (Category) | 136 (82.4%) | 29 (17.6%) |
| Total (Overall) | 250 (41.6%) | 351 (58.4%) |
Employment Industries by Sex in Claypool
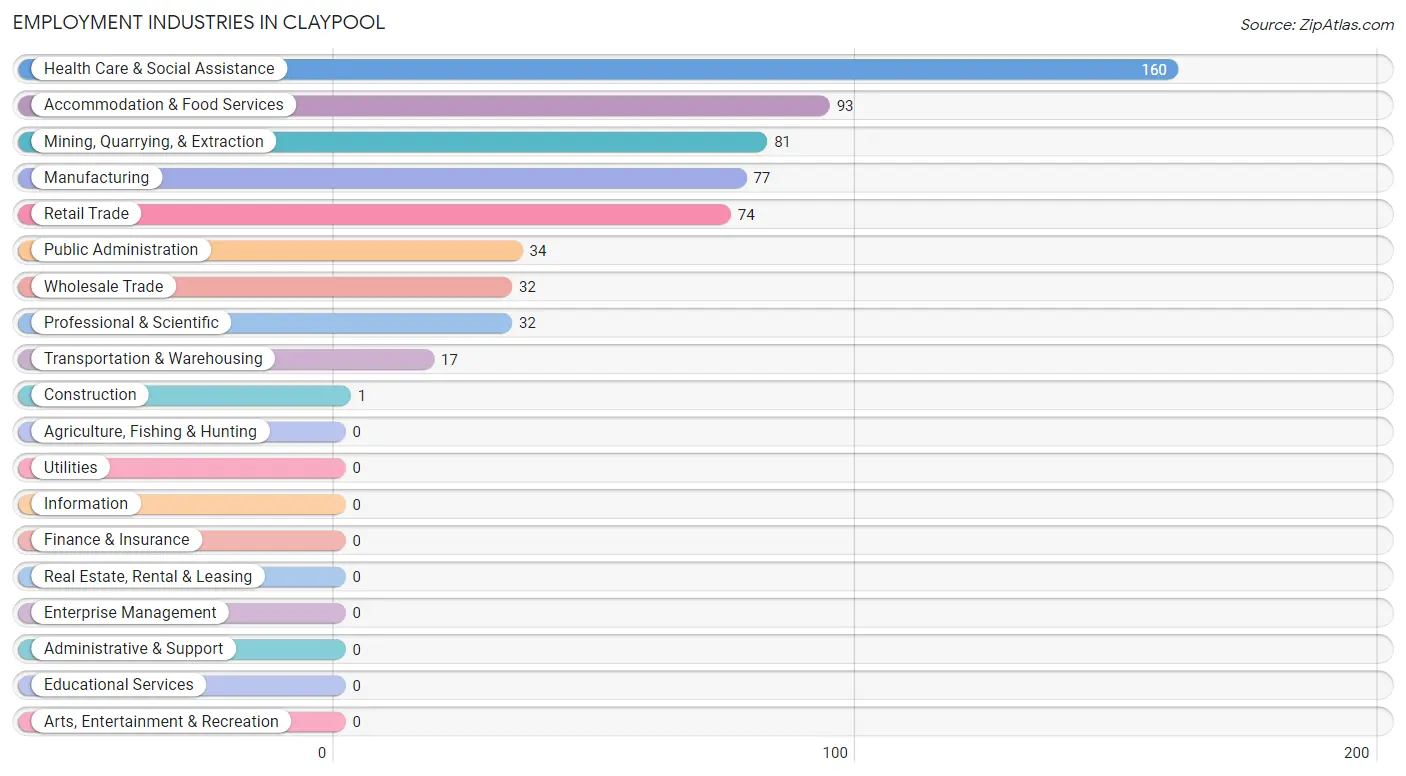
Employment Industries in Claypool
The major employment industries in Claypool include Health Care & Social Assistance (160 | 26.6%), Accommodation & Food Services (93 | 15.5%), Mining, Quarrying, & Extraction (81 | 13.5%), Manufacturing (77 | 12.8%), and Retail Trade (74 | 12.3%).
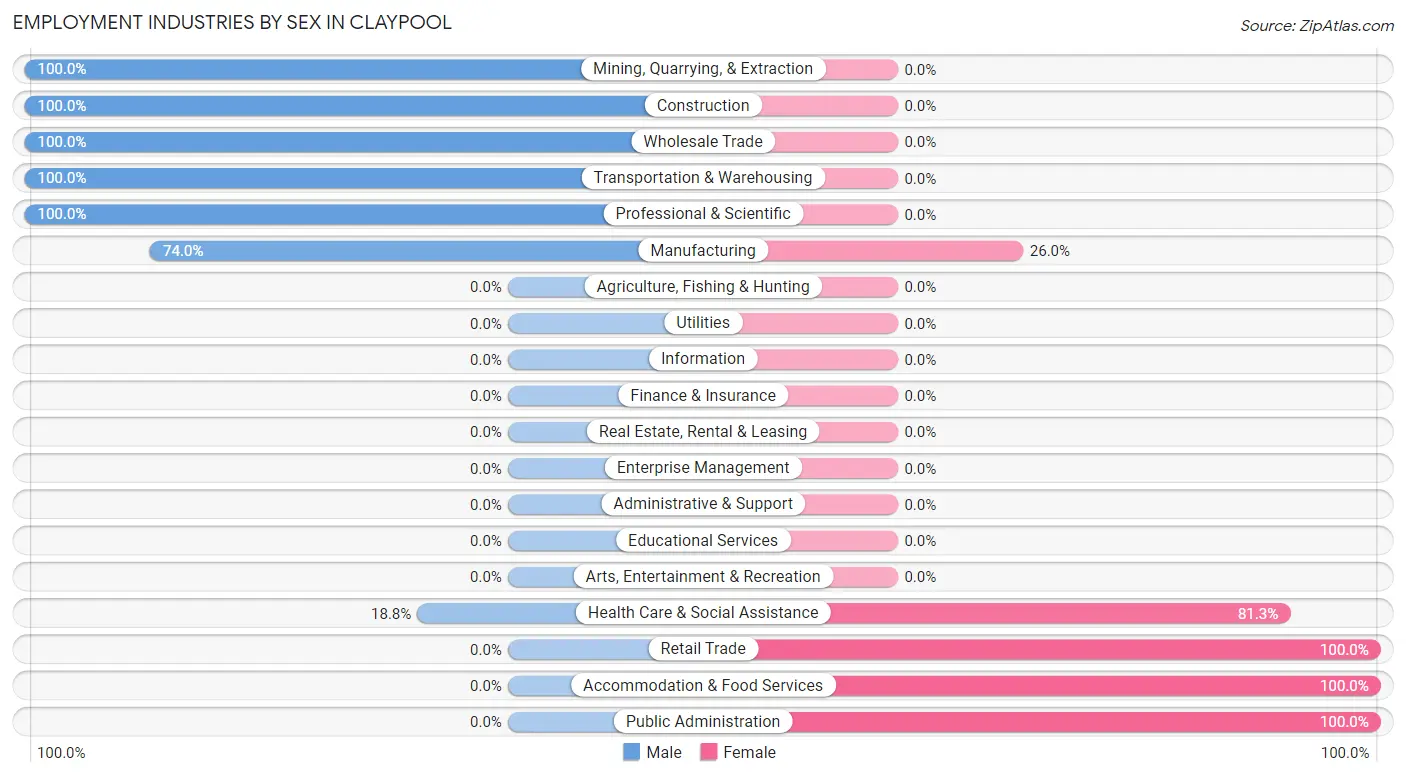
Employment Industries by Sex in Claypool
The Claypool industries that see more men than women are Mining, Quarrying, & Extraction (100.0%), Construction (100.0%), and Wholesale Trade (100.0%), whereas the industries that tend to have a higher number of women are Retail Trade (100.0%), Accommodation & Food Services (100.0%), and Public Administration (100.0%).
| Industry | Male | Female |
| Agriculture, Fishing & Hunting | 0 (0.0%) | 0 (0.0%) |
| Mining, Quarrying, & Extraction | 81 (100.0%) | 0 (0.0%) |
| Construction | 1 (100.0%) | 0 (0.0%) |
| Manufacturing | 57 (74.0%) | 20 (26.0%) |
| Wholesale Trade | 32 (100.0%) | 0 (0.0%) |
| Retail Trade | 0 (0.0%) | 74 (100.0%) |
| Transportation & Warehousing | 17 (100.0%) | 0 (0.0%) |
| Utilities | 0 (0.0%) | 0 (0.0%) |
| Information | 0 (0.0%) | 0 (0.0%) |
| Finance & Insurance | 0 (0.0%) | 0 (0.0%) |
| Real Estate, Rental & Leasing | 0 (0.0%) | 0 (0.0%) |
| Professional & Scientific | 32 (100.0%) | 0 (0.0%) |
| Enterprise Management | 0 (0.0%) | 0 (0.0%) |
| Administrative & Support | 0 (0.0%) | 0 (0.0%) |
| Educational Services | 0 (0.0%) | 0 (0.0%) |
| Health Care & Social Assistance | 30 (18.8%) | 130 (81.2%) |
| Arts, Entertainment & Recreation | 0 (0.0%) | 0 (0.0%) |
| Accommodation & Food Services | 0 (0.0%) | 93 (100.0%) |
| Public Administration | 0 (0.0%) | 34 (100.0%) |
| Total | 250 (41.6%) | 351 (58.4%) |
Education in Claypool
School Enrollment in Claypool
The most common levels of schooling among the 214 students in Claypool are elementary school (85 | 39.7%), high school (74 | 34.6%), and nursery / preschool (38 | 17.8%).
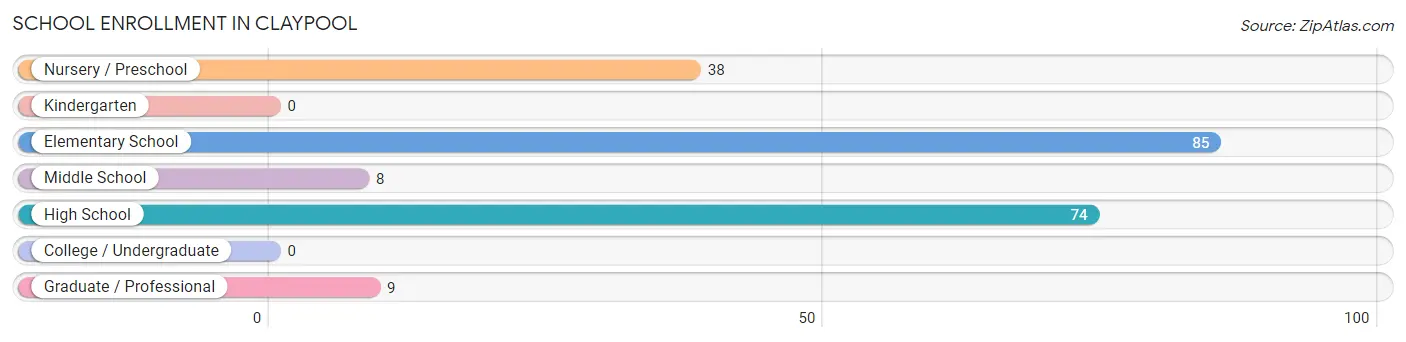
| School Level | # Students | % Students |
| Nursery / Preschool | 38 | 17.8% |
| Kindergarten | 0 | 0.0% |
| Elementary School | 85 | 39.7% |
| Middle School | 8 | 3.7% |
| High School | 74 | 34.6% |
| College / Undergraduate | 0 | 0.0% |
| Graduate / Professional | 9 | 4.2% |
| Total | 214 | 100.0% |
School Enrollment by Age by Funding Source in Claypool
Out of a total of 214 students who are enrolled in schools in Claypool, 47 (22.0%) attend a private institution, while the remaining 167 (78.0%) are enrolled in public schools. The age group of 3 to 4 year olds has the highest likelihood of being enrolled in private schools, with 38 (100.0% in the age bracket) enrolled. Conversely, the age group of 5 to 9 year old has the lowest likelihood of being enrolled in a private school, with 85 (100.0% in the age bracket) attending a public institution.
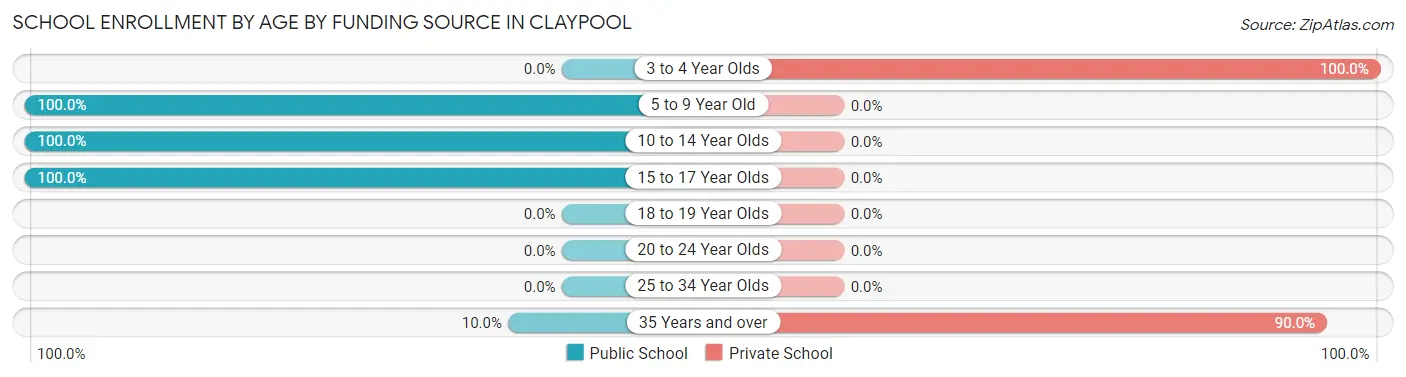
| Age Bracket | Public School | Private School |
| 3 to 4 Year Olds | 0 (0.0%) | 38 (100.0%) |
| 5 to 9 Year Old | 85 (100.0%) | 0 (0.0%) |
| 10 to 14 Year Olds | 8 (100.0%) | 0 (0.0%) |
| 15 to 17 Year Olds | 73 (100.0%) | 0 (0.0%) |
| 18 to 19 Year Olds | 0 (0.0%) | 0 (0.0%) |
| 20 to 24 Year Olds | 0 (0.0%) | 0 (0.0%) |
| 25 to 34 Year Olds | 0 (0.0%) | 0 (0.0%) |
| 35 Years and over | 1 (10.0%) | 9 (90.0%) |
| Total | 167 (78.0%) | 47 (22.0%) |
Educational Attainment by Field of Study in Claypool
Engineering (26 | 55.3%), education (12 | 25.5%), and business (9 | 19.2%) are the most common fields of study among 47 individuals in Claypool who have obtained a bachelor's degree or higher.
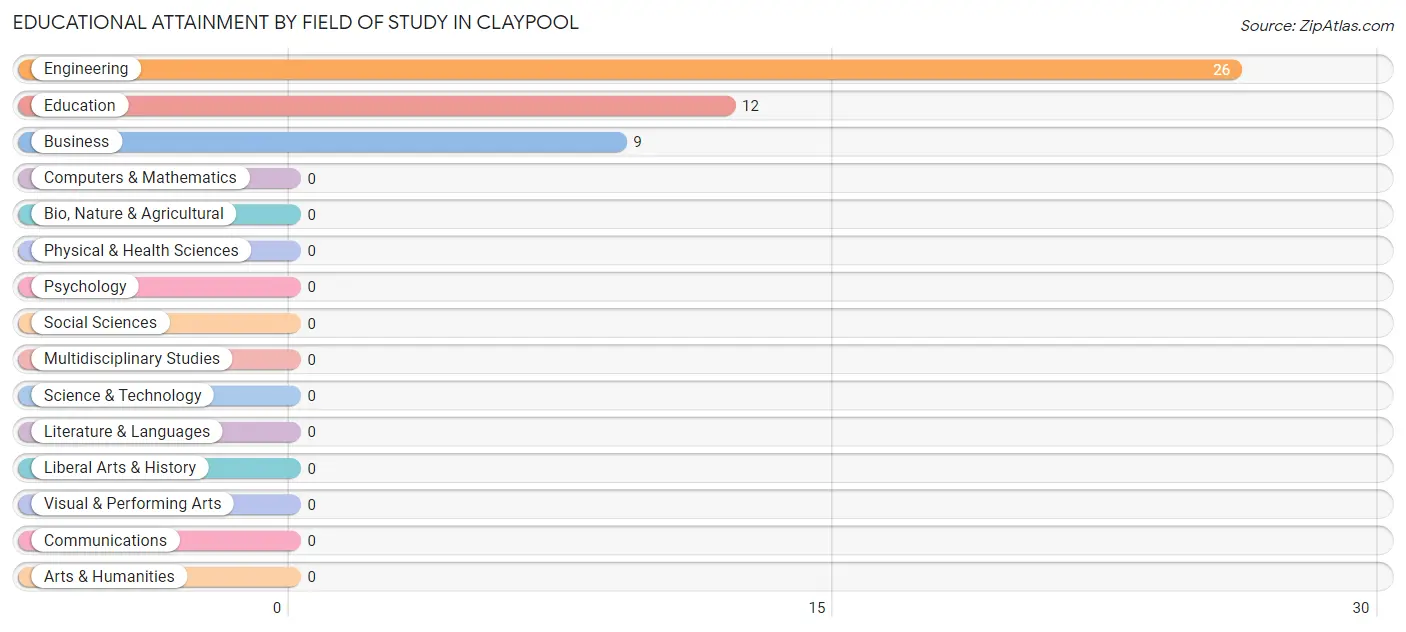
| Field of Study | # Graduates | % Graduates |
| Computers & Mathematics | 0 | 0.0% |
| Bio, Nature & Agricultural | 0 | 0.0% |
| Physical & Health Sciences | 0 | 0.0% |
| Psychology | 0 | 0.0% |
| Social Sciences | 0 | 0.0% |
| Engineering | 26 | 55.3% |
| Multidisciplinary Studies | 0 | 0.0% |
| Science & Technology | 0 | 0.0% |
| Business | 9 | 19.2% |
| Education | 12 | 25.5% |
| Literature & Languages | 0 | 0.0% |
| Liberal Arts & History | 0 | 0.0% |
| Visual & Performing Arts | 0 | 0.0% |
| Communications | 0 | 0.0% |
| Arts & Humanities | 0 | 0.0% |
| Total | 47 | 100.0% |
Transportation & Commute in Claypool
Vehicle Availability by Sex in Claypool
The most prevalent vehicle ownership categories in Claypool are males with 3 vehicles (102, accounting for 40.8%) and females with 3 vehicles (191, making up 29.7%).
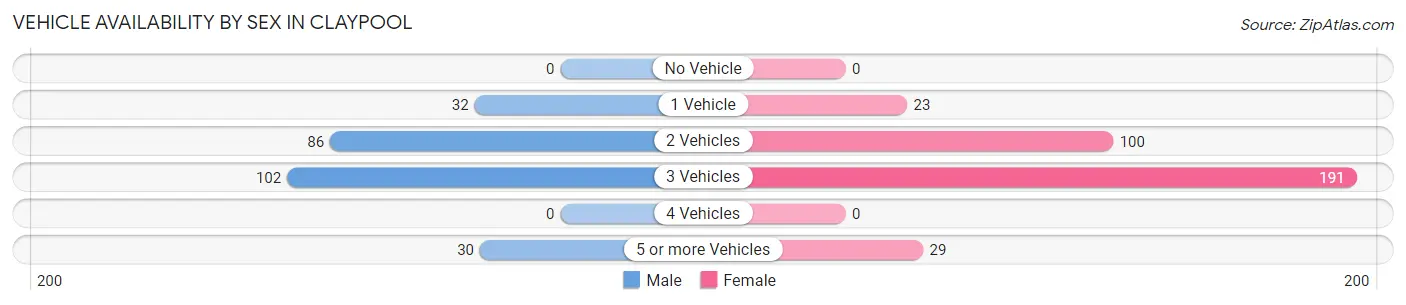
| Vehicles Available | Male | Female |
| No Vehicle | 0 (0.0%) | 0 (0.0%) |
| 1 Vehicle | 32 (12.8%) | 23 (6.7%) |
| 2 Vehicles | 86 (34.4%) | 100 (29.1%) |
| 3 Vehicles | 102 (40.8%) | 191 (55.7%) |
| 4 Vehicles | 0 (0.0%) | 0 (0.0%) |
| 5 or more Vehicles | 30 (12.0%) | 29 (8.5%) |
| Total | 250 (100.0%) | 343 (100.0%) |
Commute Time in Claypool
The most frequently occuring commute durations in Claypool are 5 to 9 minutes (185 commuters, 31.2%), 10 to 14 minutes (143 commuters, 24.1%), and 15 to 19 minutes (124 commuters, 20.9%).
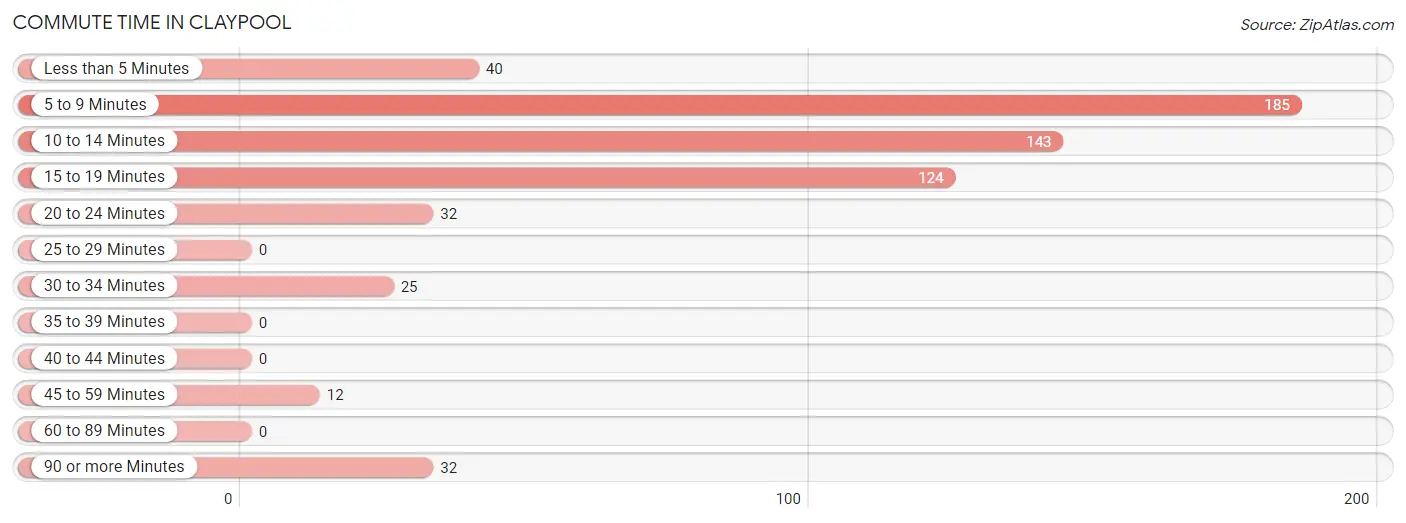
| Commute Time | # Commuters | % Commuters |
| Less than 5 Minutes | 40 | 6.8% |
| 5 to 9 Minutes | 185 | 31.2% |
| 10 to 14 Minutes | 143 | 24.1% |
| 15 to 19 Minutes | 124 | 20.9% |
| 20 to 24 Minutes | 32 | 5.4% |
| 25 to 29 Minutes | 0 | 0.0% |
| 30 to 34 Minutes | 25 | 4.2% |
| 35 to 39 Minutes | 0 | 0.0% |
| 40 to 44 Minutes | 0 | 0.0% |
| 45 to 59 Minutes | 12 | 2.0% |
| 60 to 89 Minutes | 0 | 0.0% |
| 90 or more Minutes | 32 | 5.4% |
Commute Time by Sex in Claypool
The most common commute times in Claypool are 10 to 14 minutes (102 commuters, 40.8%) for males and 5 to 9 minutes (133 commuters, 38.8%) for females.
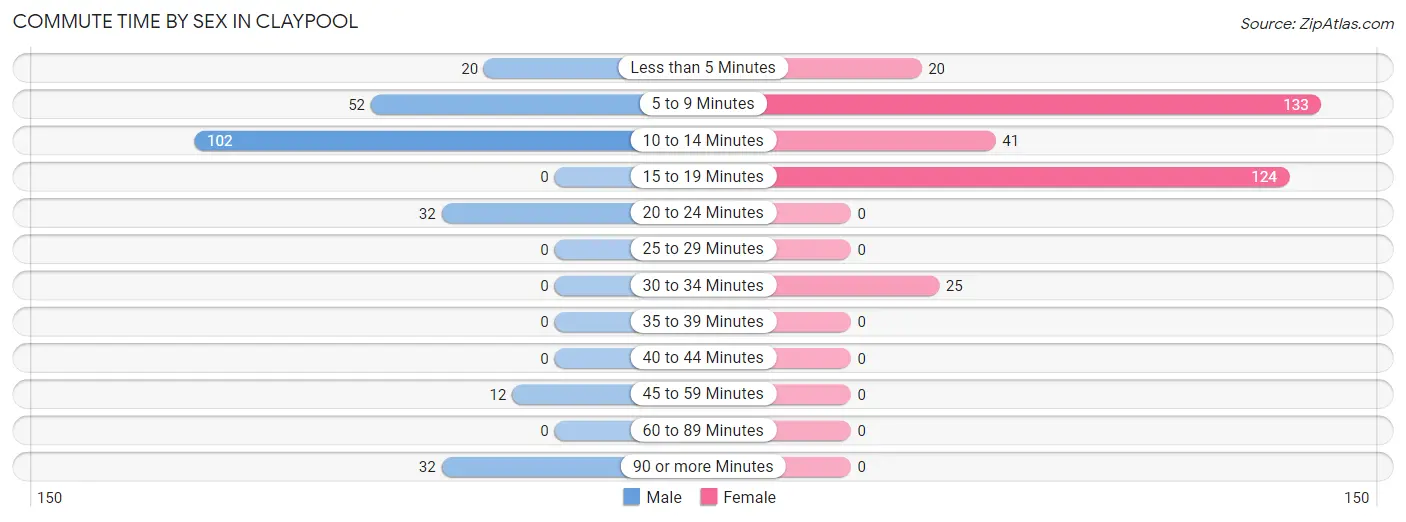
| Commute Time | Male | Female |
| Less than 5 Minutes | 20 (8.0%) | 20 (5.8%) |
| 5 to 9 Minutes | 52 (20.8%) | 133 (38.8%) |
| 10 to 14 Minutes | 102 (40.8%) | 41 (11.9%) |
| 15 to 19 Minutes | 0 (0.0%) | 124 (36.1%) |
| 20 to 24 Minutes | 32 (12.8%) | 0 (0.0%) |
| 25 to 29 Minutes | 0 (0.0%) | 0 (0.0%) |
| 30 to 34 Minutes | 0 (0.0%) | 25 (7.3%) |
| 35 to 39 Minutes | 0 (0.0%) | 0 (0.0%) |
| 40 to 44 Minutes | 0 (0.0%) | 0 (0.0%) |
| 45 to 59 Minutes | 12 (4.8%) | 0 (0.0%) |
| 60 to 89 Minutes | 0 (0.0%) | 0 (0.0%) |
| 90 or more Minutes | 32 (12.8%) | 0 (0.0%) |
Time of Departure to Work by Sex in Claypool
The most frequent times of departure to work in Claypool are 12:00 AM to 4:59 AM (78, 31.2%) for males and 12:00 PM to 3:59 PM (94, 27.4%) for females.
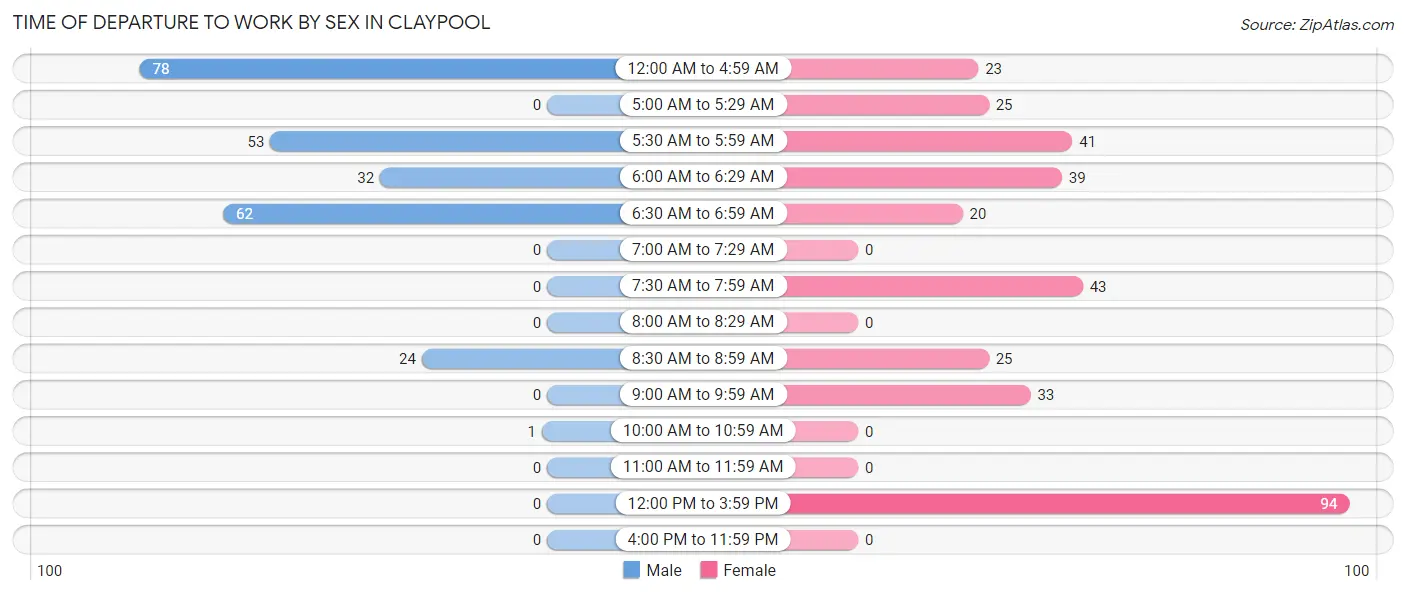
| Time of Departure | Male | Female |
| 12:00 AM to 4:59 AM | 78 (31.2%) | 23 (6.7%) |
| 5:00 AM to 5:29 AM | 0 (0.0%) | 25 (7.3%) |
| 5:30 AM to 5:59 AM | 53 (21.2%) | 41 (11.9%) |
| 6:00 AM to 6:29 AM | 32 (12.8%) | 39 (11.4%) |
| 6:30 AM to 6:59 AM | 62 (24.8%) | 20 (5.8%) |
| 7:00 AM to 7:29 AM | 0 (0.0%) | 0 (0.0%) |
| 7:30 AM to 7:59 AM | 0 (0.0%) | 43 (12.5%) |
| 8:00 AM to 8:29 AM | 0 (0.0%) | 0 (0.0%) |
| 8:30 AM to 8:59 AM | 24 (9.6%) | 25 (7.3%) |
| 9:00 AM to 9:59 AM | 0 (0.0%) | 33 (9.6%) |
| 10:00 AM to 10:59 AM | 1 (0.4%) | 0 (0.0%) |
| 11:00 AM to 11:59 AM | 0 (0.0%) | 0 (0.0%) |
| 12:00 PM to 3:59 PM | 0 (0.0%) | 94 (27.4%) |
| 4:00 PM to 11:59 PM | 0 (0.0%) | 0 (0.0%) |
| Total | 250 (100.0%) | 343 (100.0%) |
Housing Occupancy in Claypool
Occupancy by Ownership in Claypool
Of the total 487 dwellings in Claypool, owner-occupied units account for 362 (74.3%), while renter-occupied units make up 125 (25.7%).
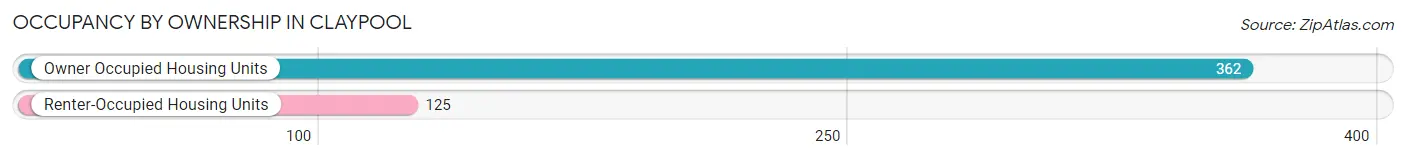
| Occupancy | # Housing Units | % Housing Units |
| Owner Occupied Housing Units | 362 | 74.3% |
| Renter-Occupied Housing Units | 125 | 25.7% |
| Total Occupied Housing Units | 487 | 100.0% |
Occupancy by Household Size in Claypool
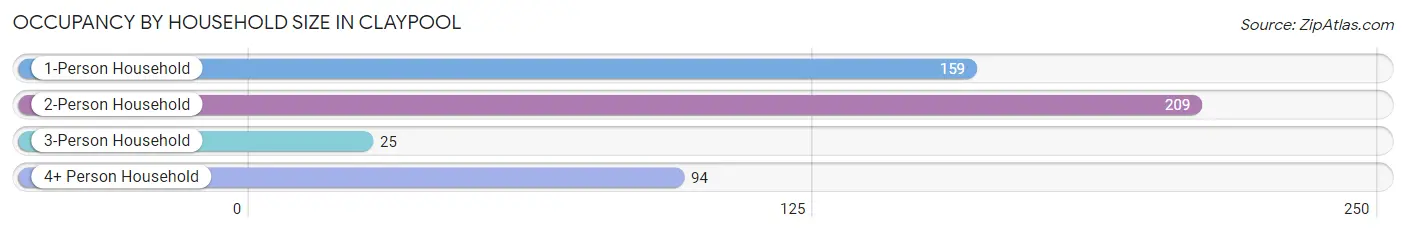
| Household Size | # Housing Units | % Housing Units |
| 1-Person Household | 159 | 32.7% |
| 2-Person Household | 209 | 42.9% |
| 3-Person Household | 25 | 5.1% |
| 4+ Person Household | 94 | 19.3% |
| Total Housing Units | 487 | 100.0% |
Occupancy by Ownership by Household Size in Claypool
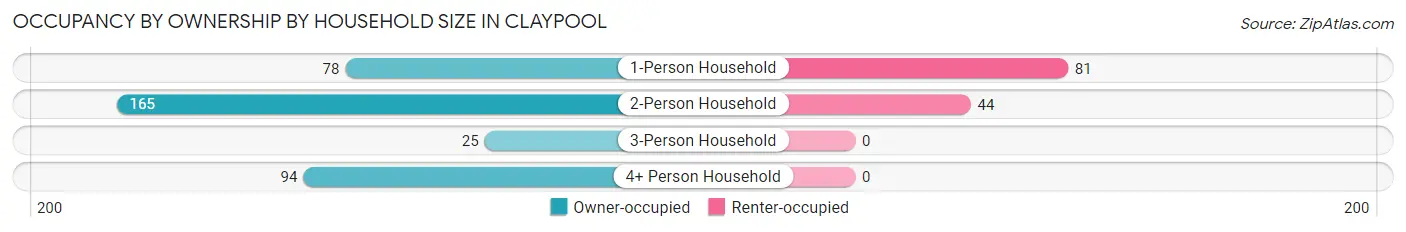
| Household Size | Owner-occupied | Renter-occupied |
| 1-Person Household | 78 (49.1%) | 81 (50.9%) |
| 2-Person Household | 165 (78.9%) | 44 (21.0%) |
| 3-Person Household | 25 (100.0%) | 0 (0.0%) |
| 4+ Person Household | 94 (100.0%) | 0 (0.0%) |
| Total Housing Units | 362 (74.3%) | 125 (25.7%) |
Occupancy by Educational Attainment in Claypool
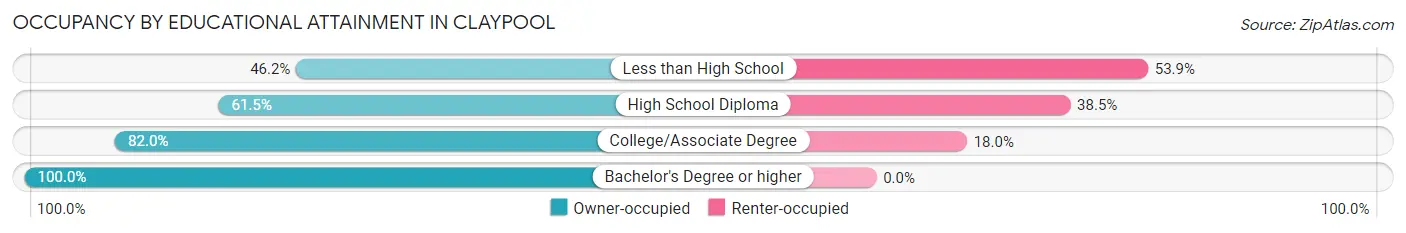
| Household Size | Owner-occupied | Renter-occupied |
| Less than High School | 18 (46.2%) | 21 (53.8%) |
| High School Diploma | 96 (61.5%) | 60 (38.5%) |
| College/Associate Degree | 201 (82.0%) | 44 (18.0%) |
| Bachelor's Degree or higher | 47 (100.0%) | 0 (0.0%) |
Occupancy by Age of Householder in Claypool
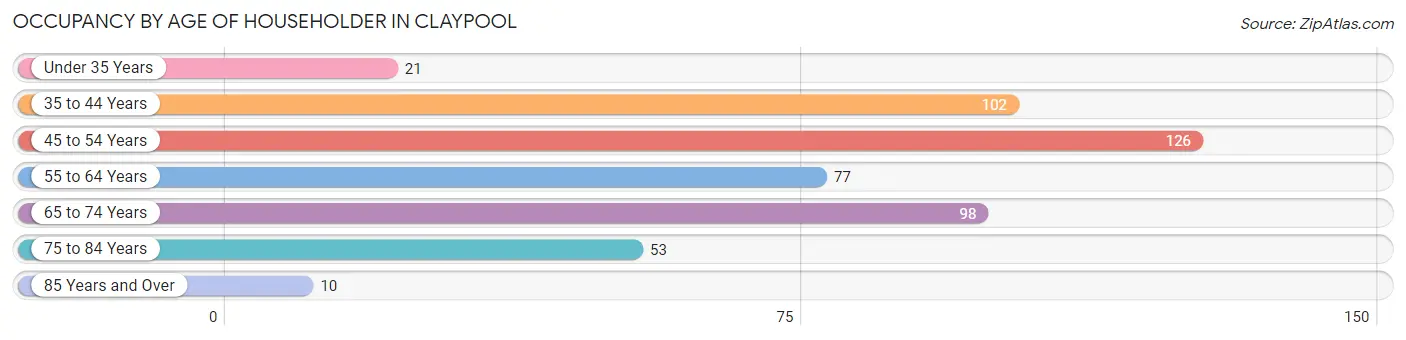
| Age Bracket | # Households | % Households |
| Under 35 Years | 21 | 4.3% |
| 35 to 44 Years | 102 | 20.9% |
| 45 to 54 Years | 126 | 25.9% |
| 55 to 64 Years | 77 | 15.8% |
| 65 to 74 Years | 98 | 20.1% |
| 75 to 84 Years | 53 | 10.9% |
| 85 Years and Over | 10 | 2.1% |
| Total | 487 | 100.0% |
Housing Finances in Claypool
Median Income by Occupancy in Claypool
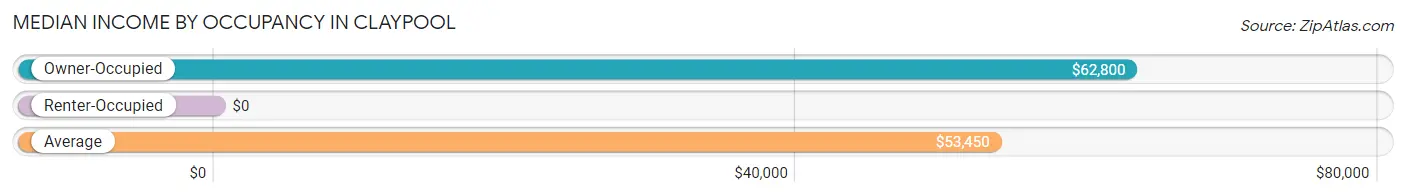
| Occupancy Type | # Households | Median Income |
| Owner-Occupied | 362 (74.3%) | $62,800 |
| Renter-Occupied | 125 (25.7%) | $0 |
| Average | 487 (100.0%) | $53,450 |
Occupancy by Householder Income Bracket in Claypool
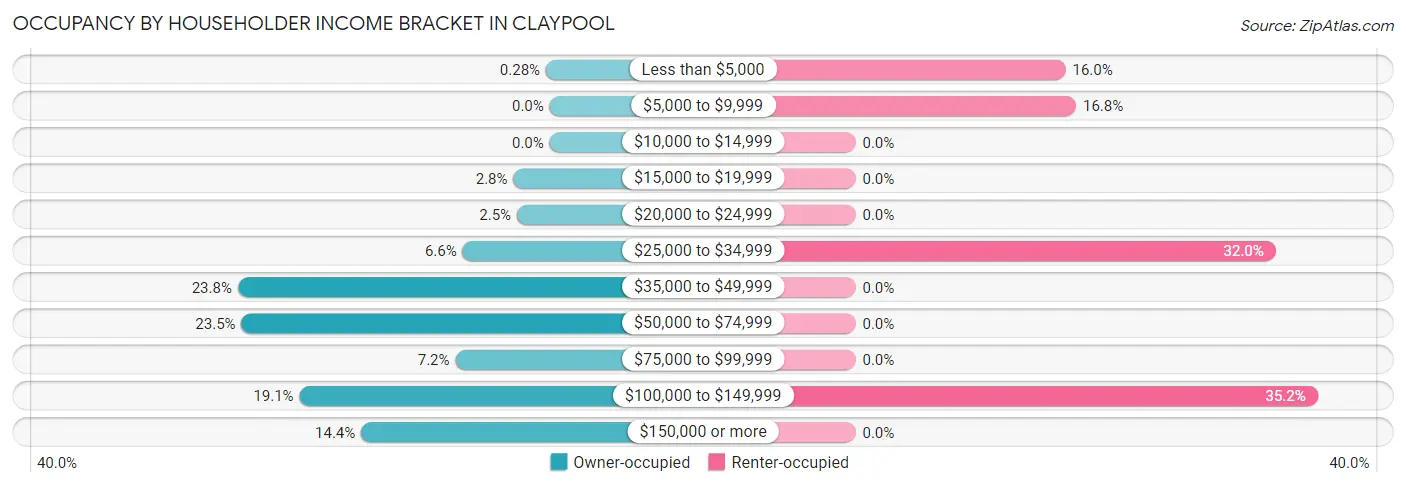
| Income Bracket | Owner-occupied | Renter-occupied |
| Less than $5,000 | 1 (0.3%) | 20 (16.0%) |
| $5,000 to $9,999 | 0 (0.0%) | 21 (16.8%) |
| $10,000 to $14,999 | 0 (0.0%) | 0 (0.0%) |
| $15,000 to $19,999 | 10 (2.8%) | 0 (0.0%) |
| $20,000 to $24,999 | 9 (2.5%) | 0 (0.0%) |
| $25,000 to $34,999 | 24 (6.6%) | 40 (32.0%) |
| $35,000 to $49,999 | 86 (23.8%) | 0 (0.0%) |
| $50,000 to $74,999 | 85 (23.5%) | 0 (0.0%) |
| $75,000 to $99,999 | 26 (7.2%) | 0 (0.0%) |
| $100,000 to $149,999 | 69 (19.1%) | 44 (35.2%) |
| $150,000 or more | 52 (14.4%) | 0 (0.0%) |
| Total | 362 (100.0%) | 125 (100.0%) |
Monthly Housing Cost Tiers in Claypool
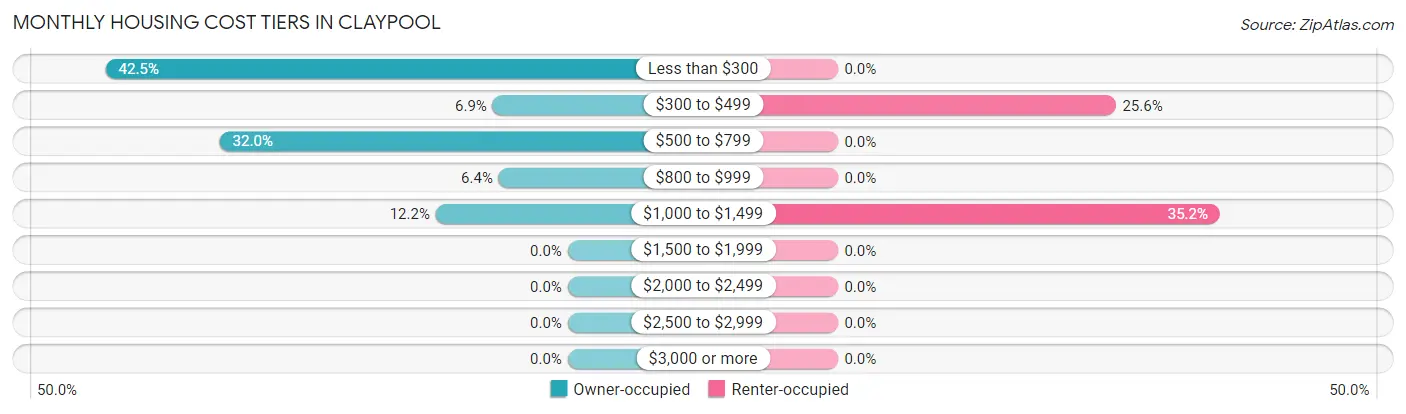
| Monthly Cost | Owner-occupied | Renter-occupied |
| Less than $300 | 154 (42.5%) | 0 (0.0%) |
| $300 to $499 | 25 (6.9%) | 32 (25.6%) |
| $500 to $799 | 116 (32.0%) | 0 (0.0%) |
| $800 to $999 | 23 (6.4%) | 0 (0.0%) |
| $1,000 to $1,499 | 44 (12.1%) | 44 (35.2%) |
| $1,500 to $1,999 | 0 (0.0%) | 0 (0.0%) |
| $2,000 to $2,499 | 0 (0.0%) | 0 (0.0%) |
| $2,500 to $2,999 | 0 (0.0%) | 0 (0.0%) |
| $3,000 or more | 0 (0.0%) | 0 (0.0%) |
| Total | 362 (100.0%) | 125 (100.0%) |
Physical Housing Characteristics in Claypool
Housing Structures in Claypool
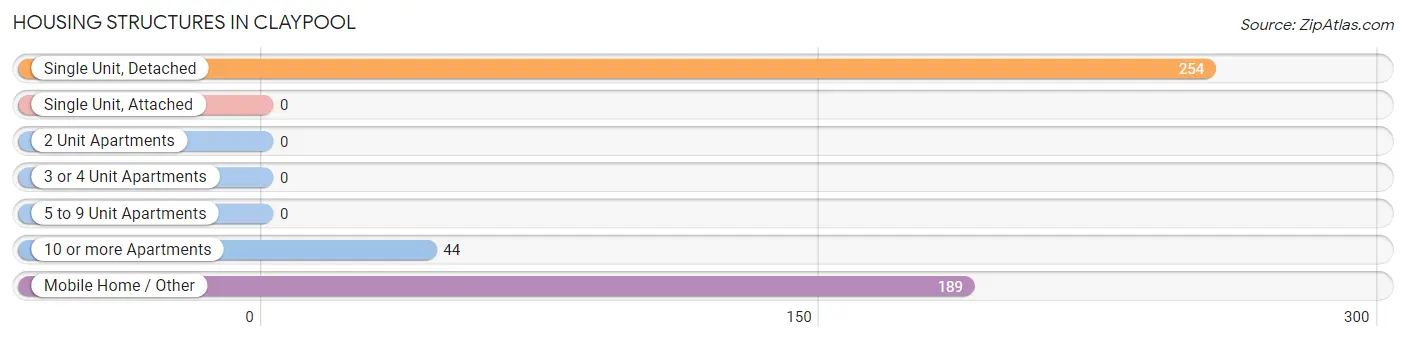
| Structure Type | # Housing Units | % Housing Units |
| Single Unit, Detached | 254 | 52.2% |
| Single Unit, Attached | 0 | 0.0% |
| 2 Unit Apartments | 0 | 0.0% |
| 3 or 4 Unit Apartments | 0 | 0.0% |
| 5 to 9 Unit Apartments | 0 | 0.0% |
| 10 or more Apartments | 44 | 9.0% |
| Mobile Home / Other | 189 | 38.8% |
| Total | 487 | 100.0% |
Housing Structures by Occupancy in Claypool
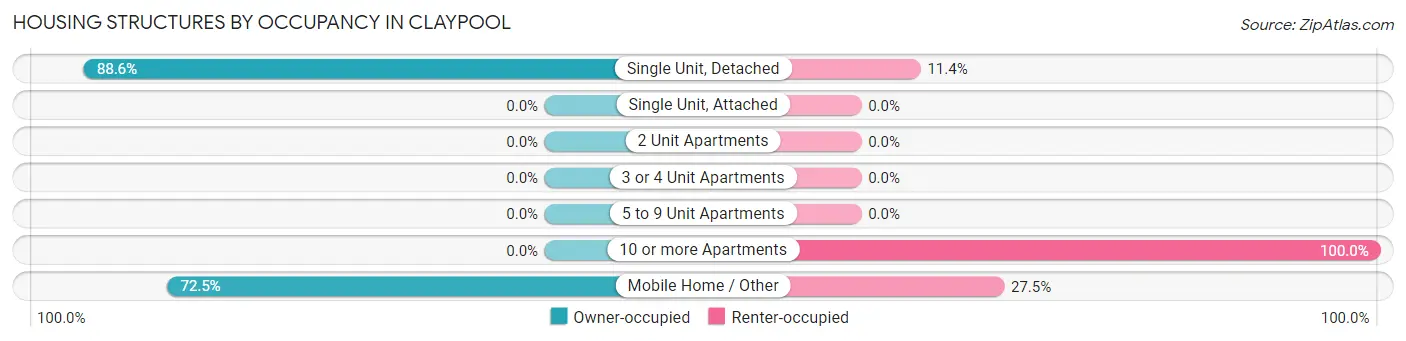
| Structure Type | Owner-occupied | Renter-occupied |
| Single Unit, Detached | 225 (88.6%) | 29 (11.4%) |
| Single Unit, Attached | 0 (0.0%) | 0 (0.0%) |
| 2 Unit Apartments | 0 (0.0%) | 0 (0.0%) |
| 3 or 4 Unit Apartments | 0 (0.0%) | 0 (0.0%) |
| 5 to 9 Unit Apartments | 0 (0.0%) | 0 (0.0%) |
| 10 or more Apartments | 0 (0.0%) | 44 (100.0%) |
| Mobile Home / Other | 137 (72.5%) | 52 (27.5%) |
| Total | 362 (74.3%) | 125 (25.7%) |
Housing Structures by Number of Rooms in Claypool
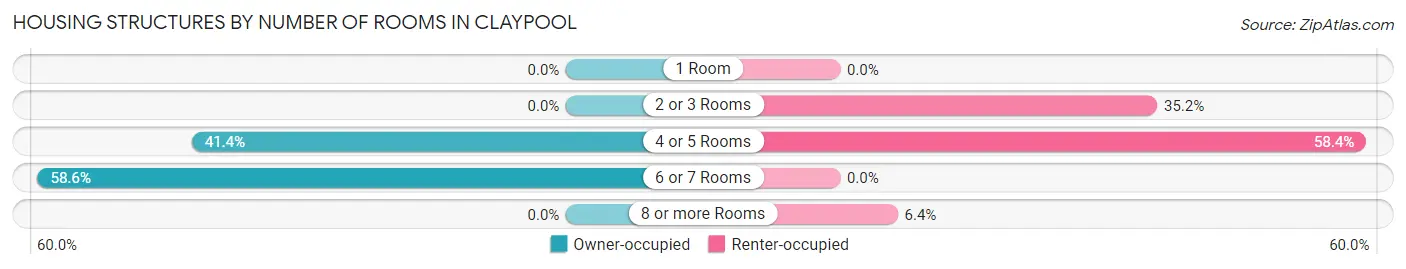
| Number of Rooms | Owner-occupied | Renter-occupied |
| 1 Room | 0 (0.0%) | 0 (0.0%) |
| 2 or 3 Rooms | 0 (0.0%) | 44 (35.2%) |
| 4 or 5 Rooms | 150 (41.4%) | 73 (58.4%) |
| 6 or 7 Rooms | 212 (58.6%) | 0 (0.0%) |
| 8 or more Rooms | 0 (0.0%) | 8 (6.4%) |
| Total | 362 (100.0%) | 125 (100.0%) |
Housing Structure by Heating Type in Claypool
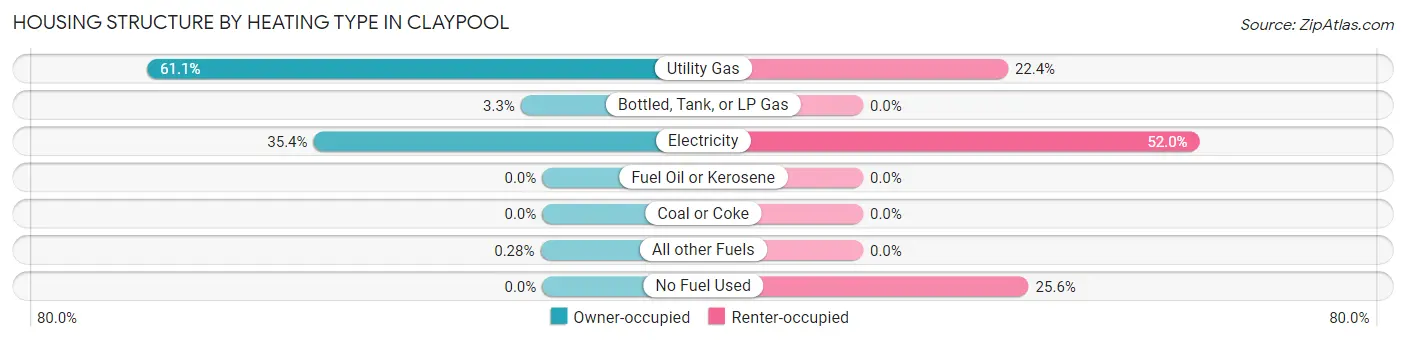
| Heating Type | Owner-occupied | Renter-occupied |
| Utility Gas | 221 (61.1%) | 28 (22.4%) |
| Bottled, Tank, or LP Gas | 12 (3.3%) | 0 (0.0%) |
| Electricity | 128 (35.4%) | 65 (52.0%) |
| Fuel Oil or Kerosene | 0 (0.0%) | 0 (0.0%) |
| Coal or Coke | 0 (0.0%) | 0 (0.0%) |
| All other Fuels | 1 (0.3%) | 0 (0.0%) |
| No Fuel Used | 0 (0.0%) | 32 (25.6%) |
| Total | 362 (100.0%) | 125 (100.0%) |
Household Vehicle Usage in Claypool
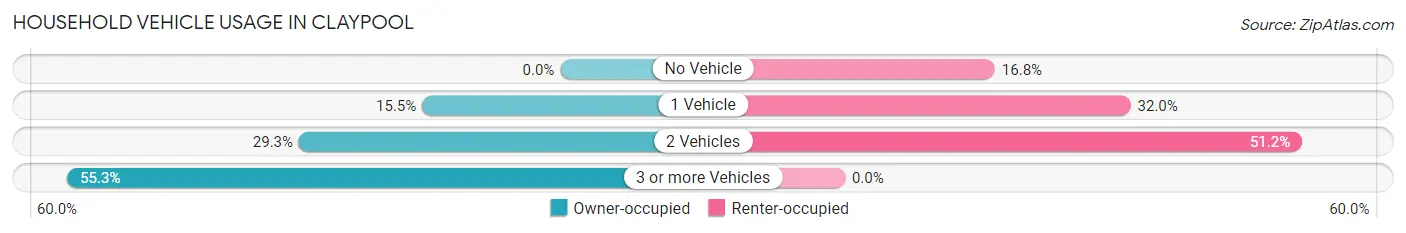
| Vehicles per Household | Owner-occupied | Renter-occupied |
| No Vehicle | 0 (0.0%) | 21 (16.8%) |
| 1 Vehicle | 56 (15.5%) | 40 (32.0%) |
| 2 Vehicles | 106 (29.3%) | 64 (51.2%) |
| 3 or more Vehicles | 200 (55.2%) | 0 (0.0%) |
| Total | 362 (100.0%) | 125 (100.0%) |
Real Estate & Mortgages in Claypool
Real Estate and Mortgage Overview in Claypool
| Characteristic | Without Mortgage | With Mortgage |
| Housing Units | 243 | 119 |
| Median Property Value | - | - |
| Median Household Income | - | - |
| Monthly Housing Costs | $265 | $0 |
| Real Estate Taxes | $493 | $0 |
Property Value by Mortgage Status in Claypool
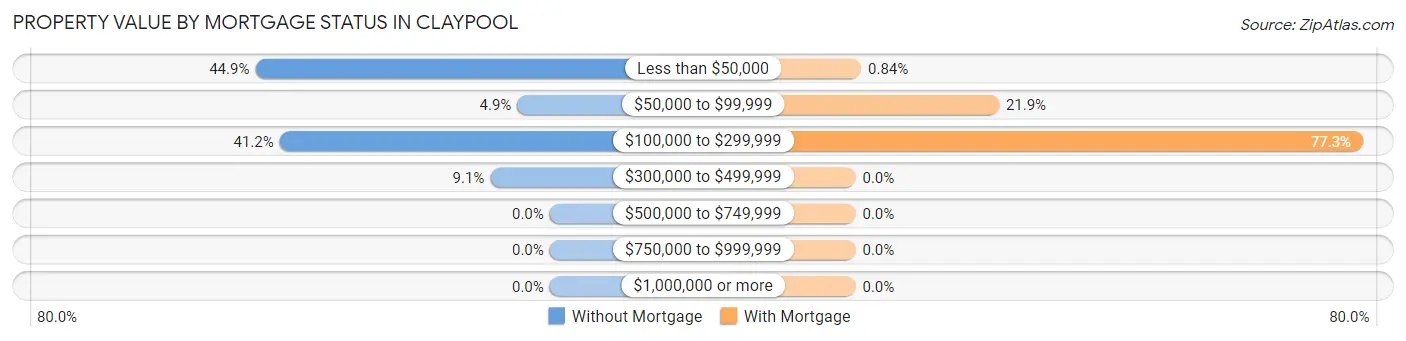
| Property Value | Without Mortgage | With Mortgage |
| Less than $50,000 | 109 (44.9%) | 1 (0.8%) |
| $50,000 to $99,999 | 12 (4.9%) | 26 (21.8%) |
| $100,000 to $299,999 | 100 (41.1%) | 92 (77.3%) |
| $300,000 to $499,999 | 22 (9.0%) | 0 (0.0%) |
| $500,000 to $749,999 | 0 (0.0%) | 0 (0.0%) |
| $750,000 to $999,999 | 0 (0.0%) | 0 (0.0%) |
| $1,000,000 or more | 0 (0.0%) | 0 (0.0%) |
| Total | 243 (100.0%) | 119 (100.0%) |
Household Income by Mortgage Status in Claypool
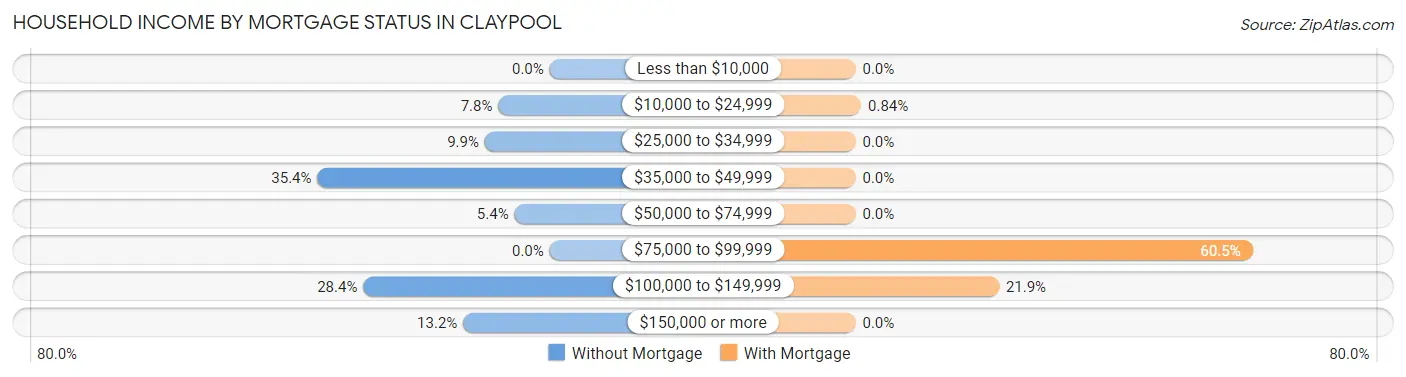
| Household Income | Without Mortgage | With Mortgage |
| Less than $10,000 | 0 (0.0%) | 0 (0.0%) |
| $10,000 to $24,999 | 19 (7.8%) | 1 (0.8%) |
| $25,000 to $34,999 | 24 (9.9%) | 0 (0.0%) |
| $35,000 to $49,999 | 86 (35.4%) | 0 (0.0%) |
| $50,000 to $74,999 | 13 (5.3%) | 0 (0.0%) |
| $75,000 to $99,999 | 0 (0.0%) | 72 (60.5%) |
| $100,000 to $149,999 | 69 (28.4%) | 26 (21.8%) |
| $150,000 or more | 32 (13.2%) | 0 (0.0%) |
| Total | 243 (100.0%) | 119 (100.0%) |
Property Value to Household Income Ratio in Claypool
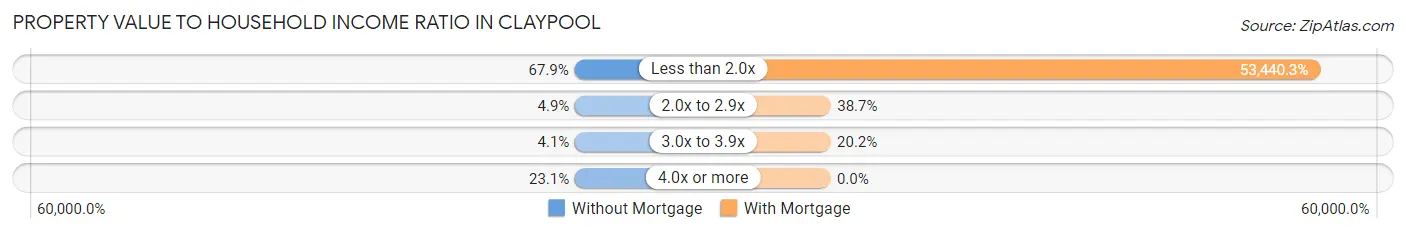
| Value-to-Income Ratio | Without Mortgage | With Mortgage |
| Less than 2.0x | 165 (67.9%) | 63,594 (53,440.3%) |
| 2.0x to 2.9x | 12 (4.9%) | 46 (38.7%) |
| 3.0x to 3.9x | 10 (4.1%) | 24 (20.2%) |
| 4.0x or more | 56 (23.1%) | 0 (0.0%) |
| Total | 243 (100.0%) | 119 (100.0%) |
Real Estate Taxes by Mortgage Status in Claypool
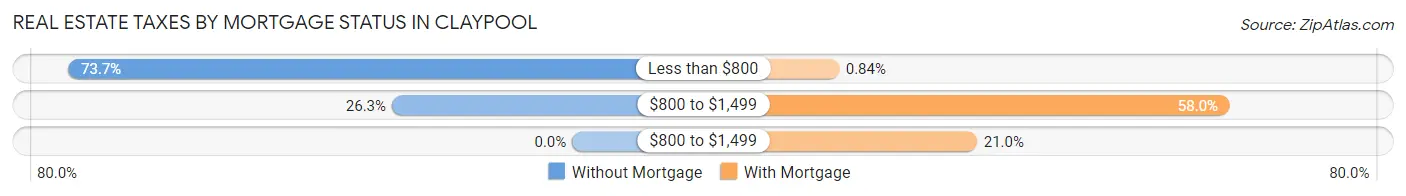
| Property Taxes | Without Mortgage | With Mortgage |
| Less than $800 | 179 (73.7%) | 1 (0.8%) |
| $800 to $1,499 | 64 (26.3%) | 69 (58.0%) |
| $800 to $1,499 | 0 (0.0%) | 25 (21.0%) |
| Total | 243 (100.0%) | 119 (100.0%) |
Health & Disability in Claypool
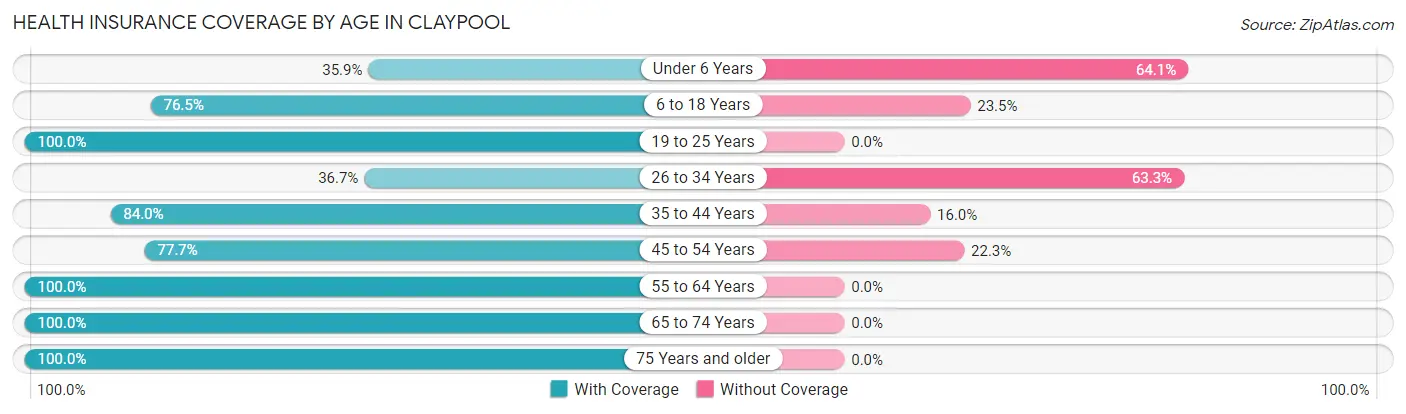
Health Insurance Coverage by Age in Claypool
| Age Bracket | With Coverage | Without Coverage |
| Under 6 Years | 65 (35.9%) | 116 (64.1%) |
| 6 to 18 Years | 127 (76.5%) | 39 (23.5%) |
| 19 to 25 Years | 89 (100.0%) | 0 (0.0%) |
| 26 to 34 Years | 22 (36.7%) | 38 (63.3%) |
| 35 to 44 Years | 126 (84.0%) | 24 (16.0%) |
| 45 to 54 Years | 146 (77.7%) | 42 (22.3%) |
| 55 to 64 Years | 204 (100.0%) | 0 (0.0%) |
| 65 to 74 Years | 127 (100.0%) | 0 (0.0%) |
| 75 Years and older | 87 (100.0%) | 0 (0.0%) |
| Total | 993 (79.3%) | 259 (20.7%) |
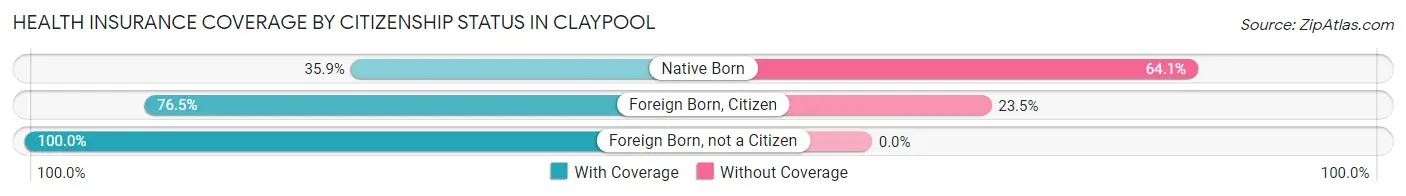
Health Insurance Coverage by Citizenship Status in Claypool
| Citizenship Status | With Coverage | Without Coverage |
| Native Born | 65 (35.9%) | 116 (64.1%) |
| Foreign Born, Citizen | 127 (76.5%) | 39 (23.5%) |
| Foreign Born, not a Citizen | 89 (100.0%) | 0 (0.0%) |
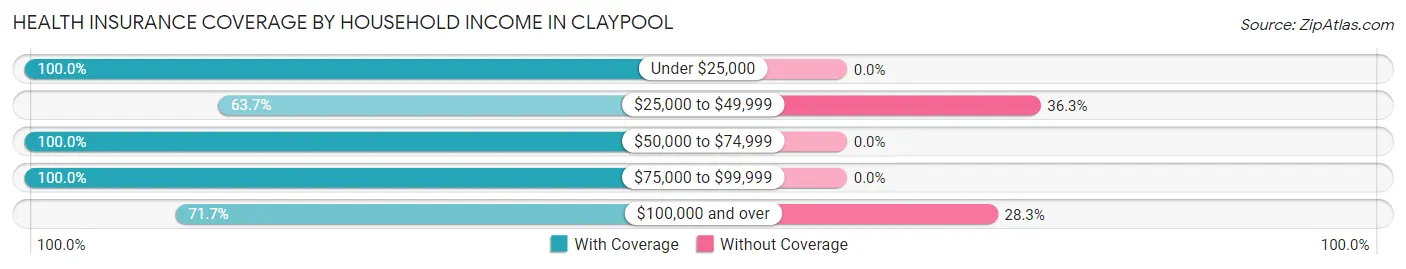
Health Insurance Coverage by Household Income in Claypool
| Household Income | With Coverage | Without Coverage |
| Under $25,000 | 88 (100.0%) | 0 (0.0%) |
| $25,000 to $49,999 | 116 (63.7%) | 66 (36.3%) |
| $50,000 to $74,999 | 248 (100.0%) | 0 (0.0%) |
| $75,000 to $99,999 | 51 (100.0%) | 0 (0.0%) |
| $100,000 and over | 490 (71.7%) | 193 (28.3%) |
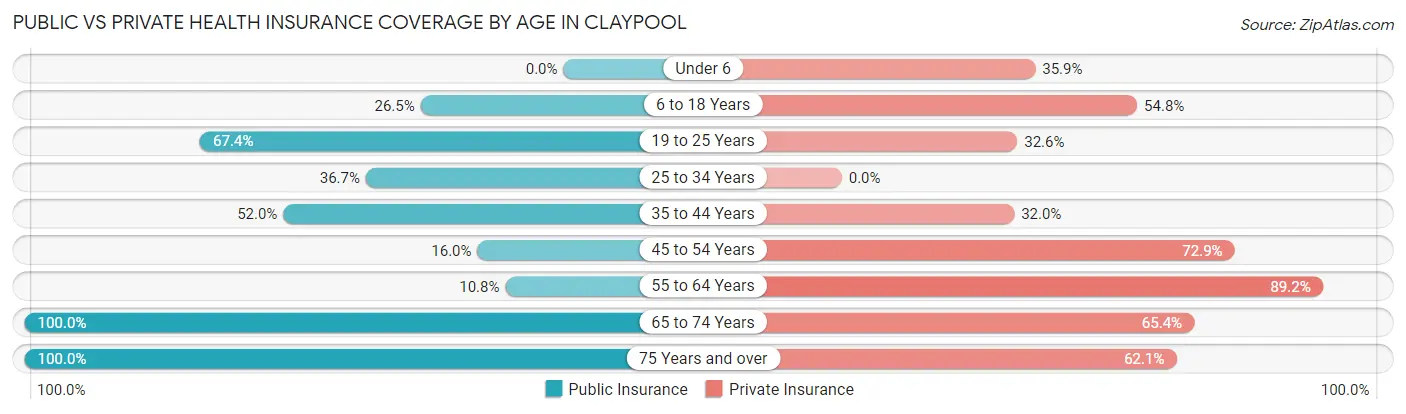
Public vs Private Health Insurance Coverage by Age in Claypool
| Age Bracket | Public Insurance | Private Insurance |
| Under 6 | 0 (0.0%) | 65 (35.9%) |
| 6 to 18 Years | 44 (26.5%) | 91 (54.8%) |
| 19 to 25 Years | 60 (67.4%) | 29 (32.6%) |
| 25 to 34 Years | 22 (36.7%) | 0 (0.0%) |
| 35 to 44 Years | 78 (52.0%) | 48 (32.0%) |
| 45 to 54 Years | 30 (16.0%) | 137 (72.9%) |
| 55 to 64 Years | 22 (10.8%) | 182 (89.2%) |
| 65 to 74 Years | 127 (100.0%) | 83 (65.3%) |
| 75 Years and over | 87 (100.0%) | 54 (62.1%) |
| Total | 470 (37.5%) | 689 (55.0%) |
Disability Status by Sex by Age in Claypool
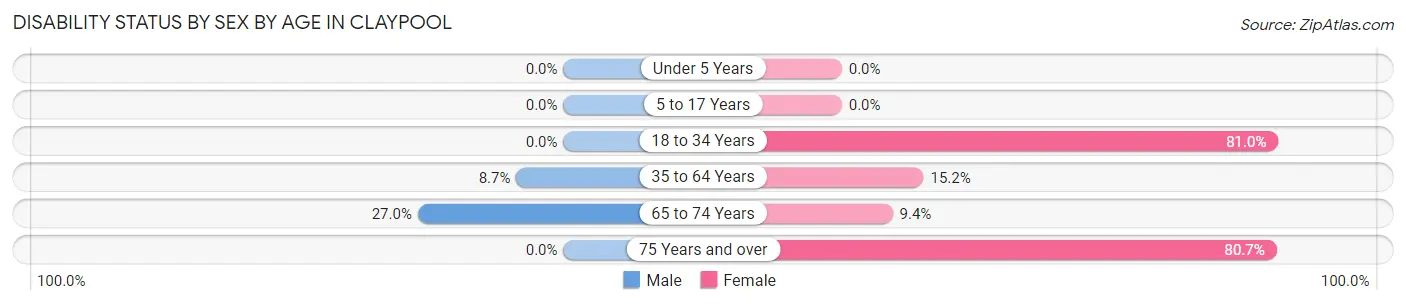
| Age Bracket | Male | Female |
| Under 5 Years | 0 (0.0%) | 0 (0.0%) |
| 5 to 17 Years | 0 (0.0%) | 0 (0.0%) |
| 18 to 34 Years | 0 (0.0%) | 81 (81.0%) |
| 35 to 64 Years | 22 (8.7%) | 44 (15.2%) |
| 65 to 74 Years | 20 (27.0%) | 5 (9.4%) |
| 75 Years and over | 0 (0.0%) | 46 (80.7%) |
Disability Class by Sex by Age in Claypool
Disability Class: Hearing Difficulty
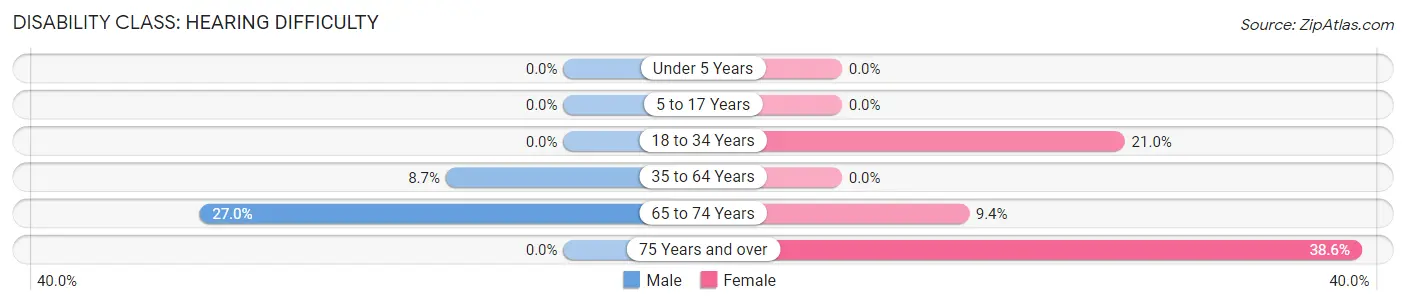
| Age Bracket | Male | Female |
| Under 5 Years | 0 (0.0%) | 0 (0.0%) |
| 5 to 17 Years | 0 (0.0%) | 0 (0.0%) |
| 18 to 34 Years | 0 (0.0%) | 21 (21.0%) |
| 35 to 64 Years | 22 (8.7%) | 0 (0.0%) |
| 65 to 74 Years | 20 (27.0%) | 5 (9.4%) |
| 75 Years and over | 0 (0.0%) | 22 (38.6%) |
Disability Class: Vision Difficulty
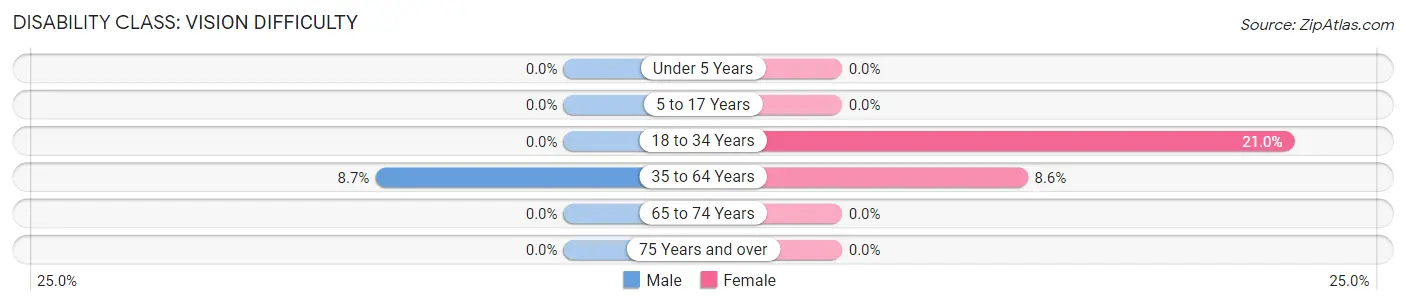
| Age Bracket | Male | Female |
| Under 5 Years | 0 (0.0%) | 0 (0.0%) |
| 5 to 17 Years | 0 (0.0%) | 0 (0.0%) |
| 18 to 34 Years | 0 (0.0%) | 21 (21.0%) |
| 35 to 64 Years | 22 (8.7%) | 25 (8.6%) |
| 65 to 74 Years | 0 (0.0%) | 0 (0.0%) |
| 75 Years and over | 0 (0.0%) | 0 (0.0%) |
Disability Class: Cognitive Difficulty
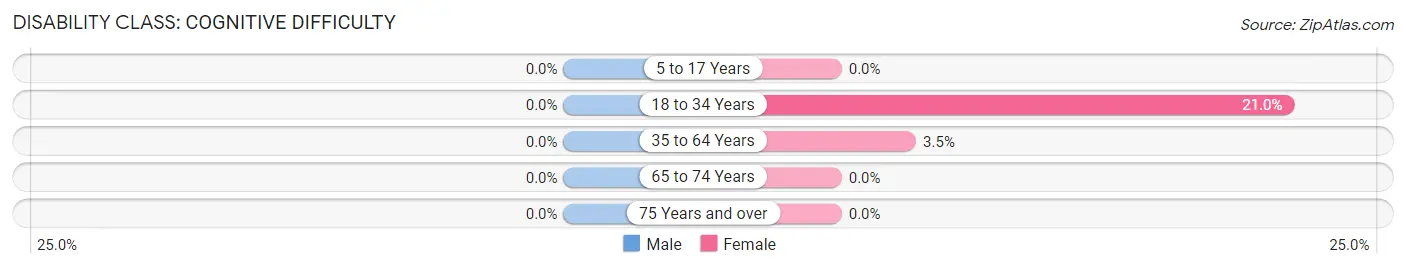
| Age Bracket | Male | Female |
| 5 to 17 Years | 0 (0.0%) | 0 (0.0%) |
| 18 to 34 Years | 0 (0.0%) | 21 (21.0%) |
| 35 to 64 Years | 0 (0.0%) | 10 (3.5%) |
| 65 to 74 Years | 0 (0.0%) | 0 (0.0%) |
| 75 Years and over | 0 (0.0%) | 0 (0.0%) |
Disability Class: Ambulatory Difficulty
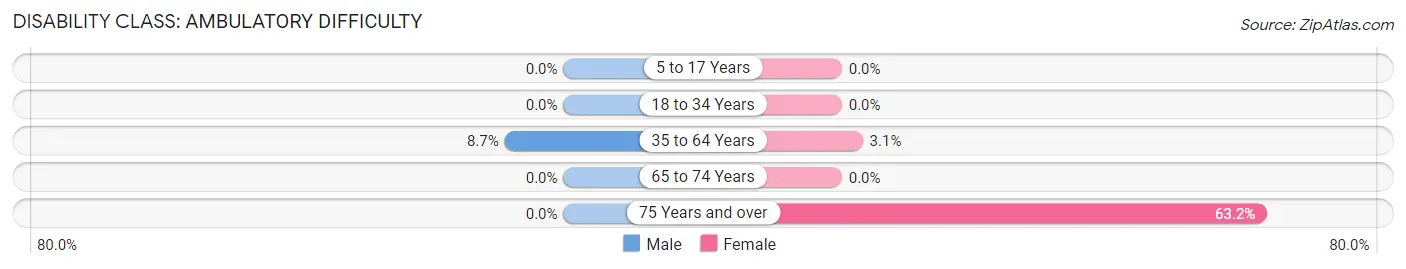
| Age Bracket | Male | Female |
| 5 to 17 Years | 0 (0.0%) | 0 (0.0%) |
| 18 to 34 Years | 0 (0.0%) | 0 (0.0%) |
| 35 to 64 Years | 22 (8.7%) | 9 (3.1%) |
| 65 to 74 Years | 0 (0.0%) | 0 (0.0%) |
| 75 Years and over | 0 (0.0%) | 36 (63.2%) |
Disability Class: Self-Care Difficulty
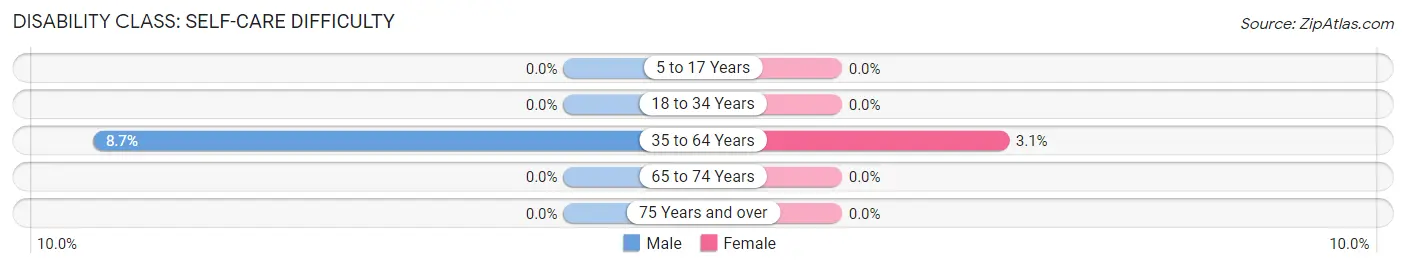
| Age Bracket | Male | Female |
| 5 to 17 Years | 0 (0.0%) | 0 (0.0%) |
| 18 to 34 Years | 0 (0.0%) | 0 (0.0%) |
| 35 to 64 Years | 22 (8.7%) | 9 (3.1%) |
| 65 to 74 Years | 0 (0.0%) | 0 (0.0%) |
| 75 Years and over | 0 (0.0%) | 0 (0.0%) |
Technology Access in Claypool
Computing Device Access in Claypool
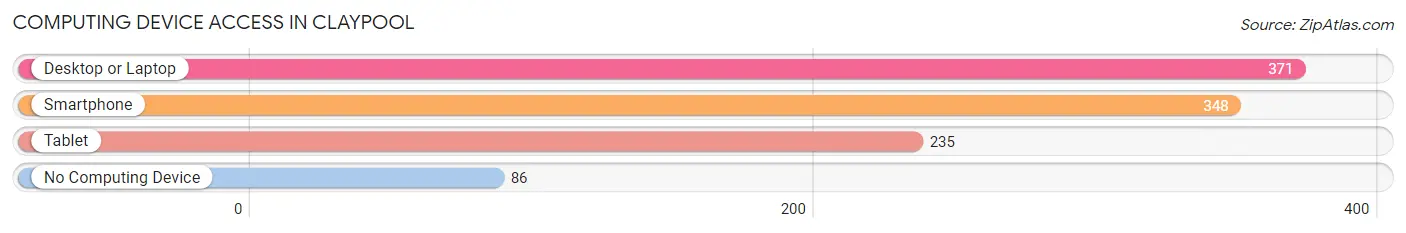
| Device Type | # Households | % Households |
| Desktop or Laptop | 371 | 76.2% |
| Smartphone | 348 | 71.5% |
| Tablet | 235 | 48.2% |
| No Computing Device | 86 | 17.7% |
| Total | 487 | 100.0% |
Internet Access in Claypool
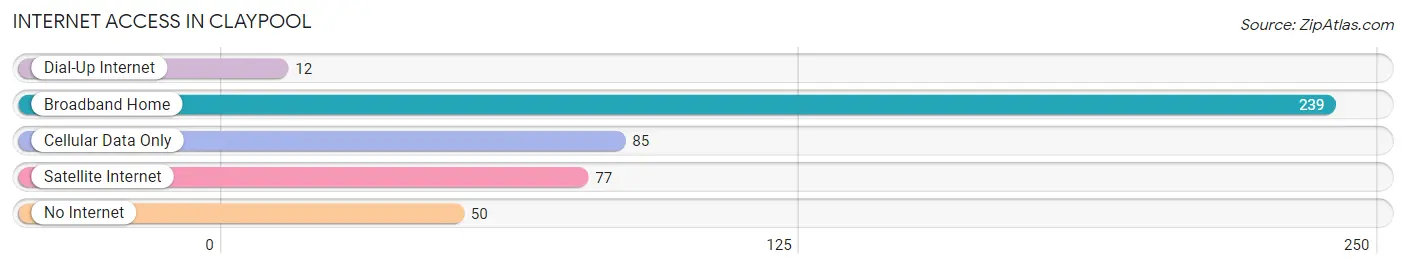
| Internet Type | # Households | % Households |
| Dial-Up Internet | 12 | 2.5% |
| Broadband Home | 239 | 49.1% |
| Cellular Data Only | 85 | 17.4% |
| Satellite Internet | 77 | 15.8% |
| No Internet | 50 | 10.3% |
| Total | 487 | 100.0% |
Claypool Summary
Claypool is a small unincorporated community located in Gila County, Arizona. It is situated in the Tonto National Forest, approximately 25 miles east of Globe and 40 miles west of Show Low. The town is located at an elevation of 5,000 feet and has a population of approximately 500 people.
History
Claypool was founded in 1881 by a group of miners who were searching for silver and gold in the area. The town was named after a local rancher, William Claypool, who owned a large ranch in the area. The town quickly grew and by the early 1900s, it had become a bustling mining town with a population of over 1,000 people.
The town was home to several businesses, including a hotel, saloon, general store, and a post office. The town also had a school, which was built in 1891 and served the local children until it closed in the 1950s.
In the early 1900s, the town was also home to a large copper smelter, which was owned by the Arizona Copper Company. The smelter was in operation until the late 1920s, when it was closed due to the Great Depression.
Geography
Claypool is located in the Tonto National Forest, which is a large area of protected land in central Arizona. The town is situated in the foothills of the Sierra Ancha Mountains, which are part of the Mogollon Rim. The town is located at an elevation of 5,000 feet and has a mild climate with hot summers and cool winters.
The town is surrounded by several small lakes, including Lake Roosevelt, which is located just to the north of the town. The area is also home to several species of wildlife, including deer, elk, and mountain lions.
Economy
The economy of Claypool is largely based on tourism and recreation. The town is home to several campgrounds and recreational areas, including the Tonto National Monument, which is located just to the north of the town. The area is also popular for fishing, hunting, and hiking.
The town is also home to several small businesses, including a general store, a gas station, and a restaurant. The town also has a post office and a library.
Demographics
As of the 2010 census, the population of Claypool was 498 people. The racial makeup of the town was 94.2% White, 0.2% African American, 0.4% Native American, 0.2% Asian, 0.2% Pacific Islander, and 4.0% from other races. The median household income was $31,250 and the median family income was $35,000.
Conclusion
Claypool is a small unincorporated community located in Gila County, Arizona. It is situated in the Tonto National Forest, approximately 25 miles east of Globe and 40 miles west of Show Low. The town is located at an elevation of 5,000 feet and has a population of approximately 500 people. The economy of Claypool is largely based on tourism and recreation, and the town is home to several small businesses, including a general store, a gas station, and a restaurant. As of the 2010 census, the population of Claypool was 498 people. The racial makeup of the town was 94.2% White, 0.2% African American, 0.4% Native American, 0.2% Asian, 0.2% Pacific Islander, and 4.0% from other races. The median household income was $31,250 and the median family income was $35,000.
Common Questions
What is Per Capita Income in Claypool?
Per Capita income in Claypool is $33,630.
What is the Median Family Income in Claypool?
Median Family Income in Claypool is $84,183.
What is the Median Household income in Claypool?
Median Household Income in Claypool is $53,450.
What is Income or Wage Gap in Claypool?
Income or Wage Gap in Claypool is 62.5%.
Women in Claypool earn 37.5 cents for every dollar earned by a man.
What is Inequality or Gini Index in Claypool?
Inequality or Gini Index in Claypool is 0.47.
What is the Total Population of Claypool?
Total Population of Claypool is 1,252.
What is the Total Male Population of Claypool?
Total Male Population of Claypool is 485.
What is the Total Female Population of Claypool?
Total Female Population of Claypool is 767.
What is the Ratio of Males per 100 Females in Claypool?
There are 63.23 Males per 100 Females in Claypool.
What is the Ratio of Females per 100 Males in Claypool?
There are 158.14 Females per 100 Males in Claypool.
What is the Median Population Age in Claypool?
Median Population Age in Claypool is 42.6 Years.
What is the Average Family Size in Claypool
Average Family Size in Claypool is 3.7 People.
What is the Average Household Size in Claypool
Average Household Size in Claypool is 2.6 People.
How Large is the Labor Force in Claypool?
There are 674 People in the Labor Forcein in Claypool.
What is the Percentage of People in the Labor Force in Claypool?
70.6% of People are in the Labor Force in Claypool.
What is the Unemployment Rate in Claypool?
Unemployment Rate in Claypool is 10.8%.