Zip Codes with the Highest Percentage of Population Employed in Food Preparation & Serving in Prescott, AZ
RELATED REPORTS & OPTIONS
Food Preparation & Serving
Prescott
Compare Zip Codes
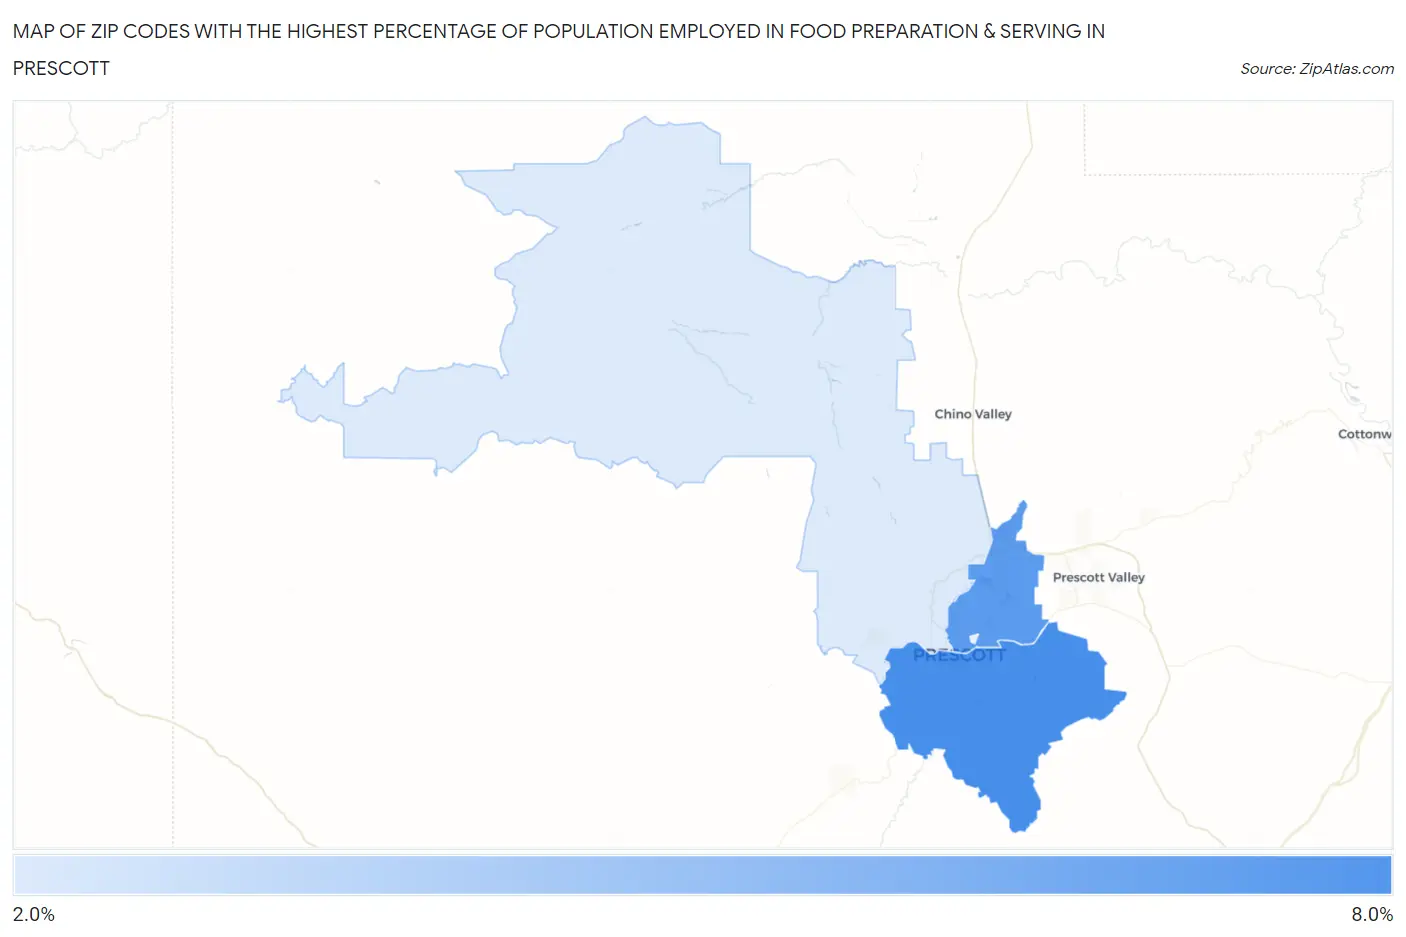
Map of Zip Codes with the Highest Percentage of Population Employed in Food Preparation & Serving in Prescott
2.7%
6.3%
Zip Codes with the Highest Percentage of Population Employed in Food Preparation & Serving in Prescott, AZ
| Zip Code | % Employed | vs State | vs National | |
| 1. | 86303 | 6.3% | 5.7%(+0.646)#136 | 5.3%(+1.03)#8,398 |
| 2. | 86301 | 5.9% | 5.7%(+0.210)#161 | 5.3%(+0.592)#9,763 |
| 3. | 86305 | 2.7% | 5.7%(-2.93)#311 | 5.3%(-2.55)#22,289 |
1
Common Questions
What are the Top 3 Zip Codes with the Highest Percentage of Population Employed in Food Preparation & Serving in Prescott, AZ?
Top 3 Zip Codes with the Highest Percentage of Population Employed in Food Preparation & Serving in Prescott, AZ are:
What zip code has the Highest Percentage of Population Employed in Food Preparation & Serving in Prescott, AZ?
86303 has the Highest Percentage of Population Employed in Food Preparation & Serving in Prescott, AZ with 6.3%.
What is the Percentage of Population Employed in Food Preparation & Serving in Prescott, AZ?
Percentage of Population Employed in Food Preparation & Serving in Prescott is 6.1%.
What is the Percentage of Population Employed in Food Preparation & Serving in Arizona?
Percentage of Population Employed in Food Preparation & Serving in Arizona is 5.7%.
What is the Percentage of Population Employed in Food Preparation & Serving in the United States?
Percentage of Population Employed in Food Preparation & Serving in the United States is 5.3%.