Zip Codes with the Highest Percentage of Population Employed in Food Preparation & Serving in Kingman, AZ
RELATED REPORTS & OPTIONS
Food Preparation & Serving
Kingman
Compare Zip Codes
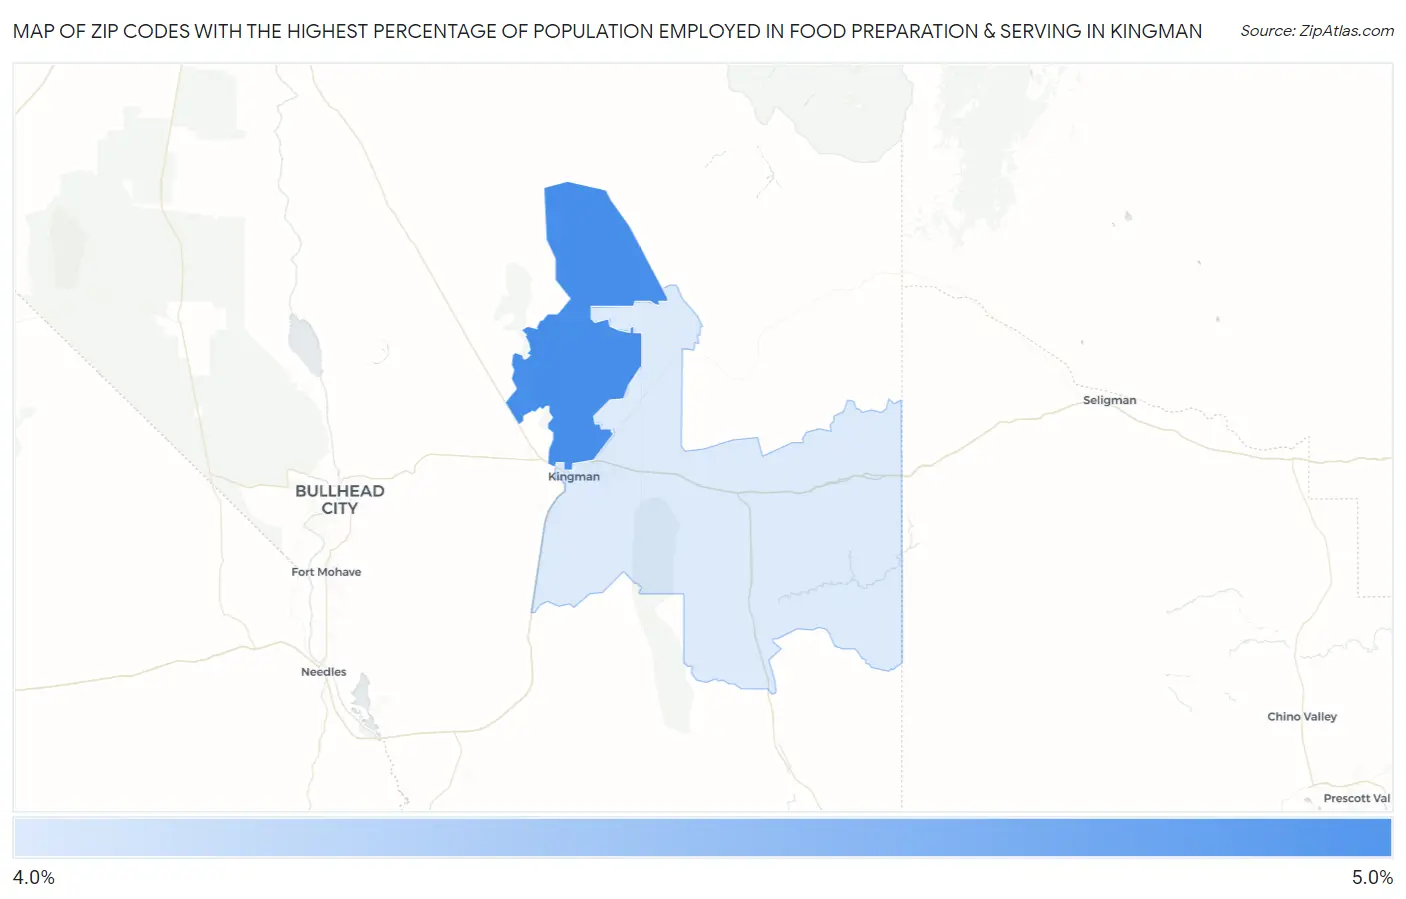
Map of Zip Codes with the Highest Percentage of Population Employed in Food Preparation & Serving in Kingman
4.3%
4.3%
Zip Codes with the Highest Percentage of Population Employed in Food Preparation & Serving in Kingman, AZ
| Zip Code | % Employed | vs State | vs National | |
| 1. | 86409 | 4.3% | 5.7%(-1.32)#229 | 5.3%(-0.941)#15,679 |
| 2. | 86401 | 4.3% | 5.7%(-1.34)#231 | 5.3%(-0.959)#15,757 |
1
Common Questions
What are the Top Zip Codes with the Highest Percentage of Population Employed in Food Preparation & Serving in Kingman, AZ?
Top Zip Codes with the Highest Percentage of Population Employed in Food Preparation & Serving in Kingman, AZ are:
What zip code has the Highest Percentage of Population Employed in Food Preparation & Serving in Kingman, AZ?
86409 has the Highest Percentage of Population Employed in Food Preparation & Serving in Kingman, AZ with 4.3%.
What is the Percentage of Population Employed in Food Preparation & Serving in Kingman, AZ?
Percentage of Population Employed in Food Preparation & Serving in Kingman is 3.7%.
What is the Percentage of Population Employed in Food Preparation & Serving in Arizona?
Percentage of Population Employed in Food Preparation & Serving in Arizona is 5.7%.
What is the Percentage of Population Employed in Food Preparation & Serving in the United States?
Percentage of Population Employed in Food Preparation & Serving in the United States is 5.3%.