Zip Codes with the Highest Percentage of Population Employed in Food Preparation & Serving in Maricopa, AZ
RELATED REPORTS & OPTIONS
Food Preparation & Serving
Maricopa
Compare Zip Codes
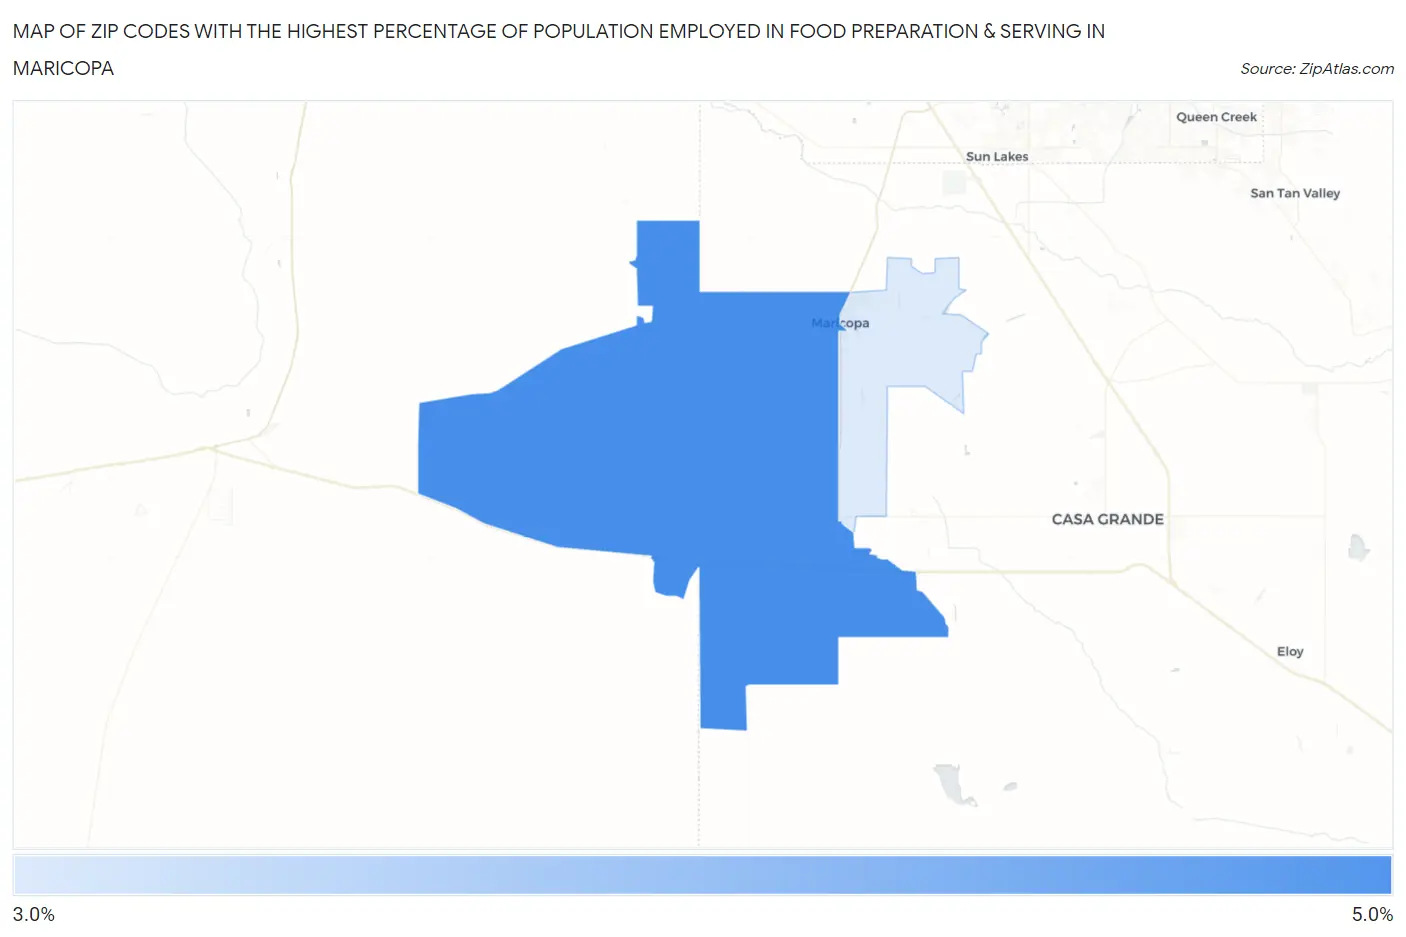
Map of Zip Codes with the Highest Percentage of Population Employed in Food Preparation & Serving in Maricopa
3.4%
4.5%
Zip Codes with the Highest Percentage of Population Employed in Food Preparation & Serving in Maricopa, AZ
| Zip Code | % Employed | vs State | vs National | |
| 1. | 85139 | 4.5% | 5.7%(-1.19)#224 | 5.3%(-0.811)#15,127 |
| 2. | 85138 | 3.4% | 5.7%(-2.30)#283 | 5.3%(-1.91)#19,721 |
1
Common Questions
What are the Top Zip Codes with the Highest Percentage of Population Employed in Food Preparation & Serving in Maricopa, AZ?
Top Zip Codes with the Highest Percentage of Population Employed in Food Preparation & Serving in Maricopa, AZ are:
What zip code has the Highest Percentage of Population Employed in Food Preparation & Serving in Maricopa, AZ?
85139 has the Highest Percentage of Population Employed in Food Preparation & Serving in Maricopa, AZ with 4.5%.
What is the Percentage of Population Employed in Food Preparation & Serving in Maricopa, AZ?
Percentage of Population Employed in Food Preparation & Serving in Maricopa is 3.6%.
What is the Percentage of Population Employed in Food Preparation & Serving in Arizona?
Percentage of Population Employed in Food Preparation & Serving in Arizona is 5.7%.
What is the Percentage of Population Employed in Food Preparation & Serving in the United States?
Percentage of Population Employed in Food Preparation & Serving in the United States is 5.3%.