Crystal Beach, AZ Map & Demographics
Crystal Beach Map
Crystal Beach Overview
$32,469
PER CAPITA INCOME
$145,500
AVG FAMILY INCOME
$29,792
AVG HOUSEHOLD INCOME
0.50
INEQUALITY / GINI INDEX
282
TOTAL POPULATION
126
MALE POPULATION
156
FEMALE POPULATION
80.77
MALES / 100 FEMALES
123.81
FEMALES / 100 MALES
65.1
MEDIAN AGE
3.3
AVG FAMILY SIZE
1.8
AVG HOUSEHOLD SIZE
104
LABOR FORCE [ PEOPLE ]
36.9%
PERCENT IN LABOR FORCE
11.5%
UNEMPLOYMENT RATE
Income in Crystal Beach
Income Overview in Crystal Beach
Per Capita Income in Crystal Beach is $32,469, while median incomes of families and households are $145,500 and $29,792 respectively.
| Characteristic | Number | Measure |
| Per Capita Income | 282 | $32,469 |
| Median Family Income | 44 | $145,500 |
| Mean Family Income | 44 | $134,225 |
| Median Household Income | 157 | $29,792 |
| Mean Household Income | 157 | $56,455 |
| Income Deficit | 44 | $0 |
| Wage / Income Gap (%) | 282 | 0.00% |
| Wage / Income Gap ($) | 282 | 100.00¢ per $1 |
| Gini / Inequality Index | 282 | 0.50 |
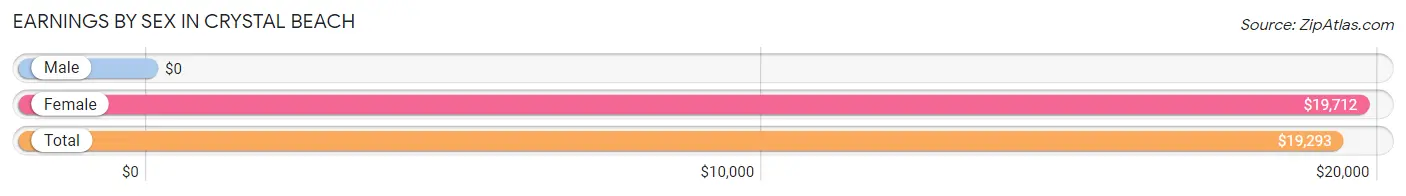
Earnings by Sex in Crystal Beach
| Sex | Number | Average Earnings |
| Male | 56 (53.3%) | $0 |
| Female | 49 (46.7%) | $19,712 |
| Total | 105 (100.0%) | $19,293 |
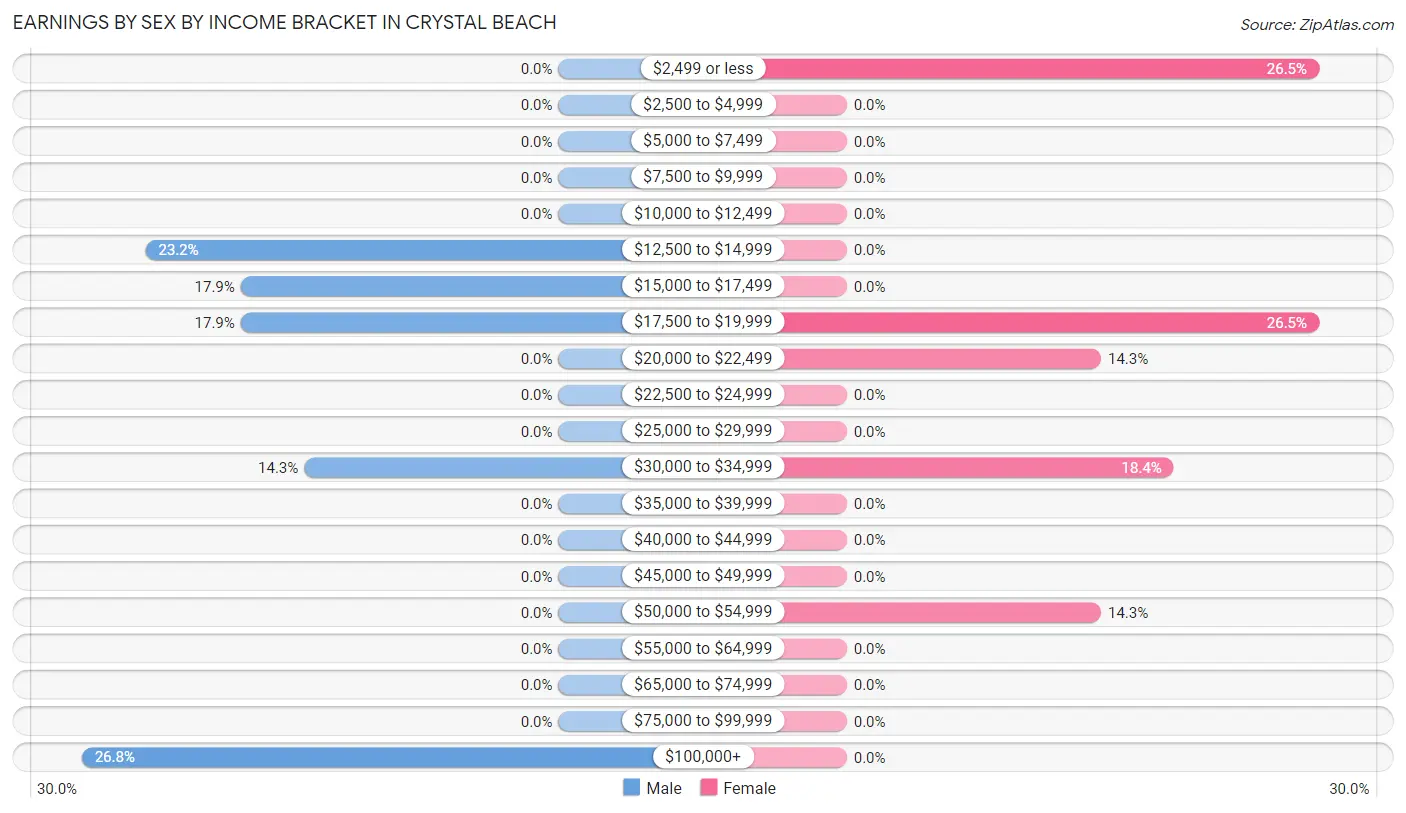
Earnings by Sex by Income Bracket in Crystal Beach
The most common earnings brackets in Crystal Beach are $100,000+ for men (15 | 26.8%) and $2,499 or less for women (13 | 26.5%).
| Income | Male | Female |
| $2,499 or less | 0 (0.0%) | 13 (26.5%) |
| $2,500 to $4,999 | 0 (0.0%) | 0 (0.0%) |
| $5,000 to $7,499 | 0 (0.0%) | 0 (0.0%) |
| $7,500 to $9,999 | 0 (0.0%) | 0 (0.0%) |
| $10,000 to $12,499 | 0 (0.0%) | 0 (0.0%) |
| $12,500 to $14,999 | 13 (23.2%) | 0 (0.0%) |
| $15,000 to $17,499 | 10 (17.9%) | 0 (0.0%) |
| $17,500 to $19,999 | 10 (17.9%) | 13 (26.5%) |
| $20,000 to $22,499 | 0 (0.0%) | 7 (14.3%) |
| $22,500 to $24,999 | 0 (0.0%) | 0 (0.0%) |
| $25,000 to $29,999 | 0 (0.0%) | 0 (0.0%) |
| $30,000 to $34,999 | 8 (14.3%) | 9 (18.4%) |
| $35,000 to $39,999 | 0 (0.0%) | 0 (0.0%) |
| $40,000 to $44,999 | 0 (0.0%) | 0 (0.0%) |
| $45,000 to $49,999 | 0 (0.0%) | 0 (0.0%) |
| $50,000 to $54,999 | 0 (0.0%) | 7 (14.3%) |
| $55,000 to $64,999 | 0 (0.0%) | 0 (0.0%) |
| $65,000 to $74,999 | 0 (0.0%) | 0 (0.0%) |
| $75,000 to $99,999 | 0 (0.0%) | 0 (0.0%) |
| $100,000+ | 15 (26.8%) | 0 (0.0%) |
| Total | 56 (100.0%) | 49 (100.0%) |
Earnings by Sex by Educational Attainment in Crystal Beach
| Educational Attainment | Male Income | Female Income |
| Less than High School | - | - |
| High School Diploma | - | - |
| College or Associate's Degree | - | - |
| Bachelor's Degree | - | - |
| Graduate Degree | - | - |
| Total | - | - |
Family Income in Crystal Beach
Family Income Brackets in Crystal Beach
According to the Crystal Beach family income data, there are 17 families falling into the $100,000 to $149,999 income range, which is the most common income bracket and makes up 38.6% of all families.
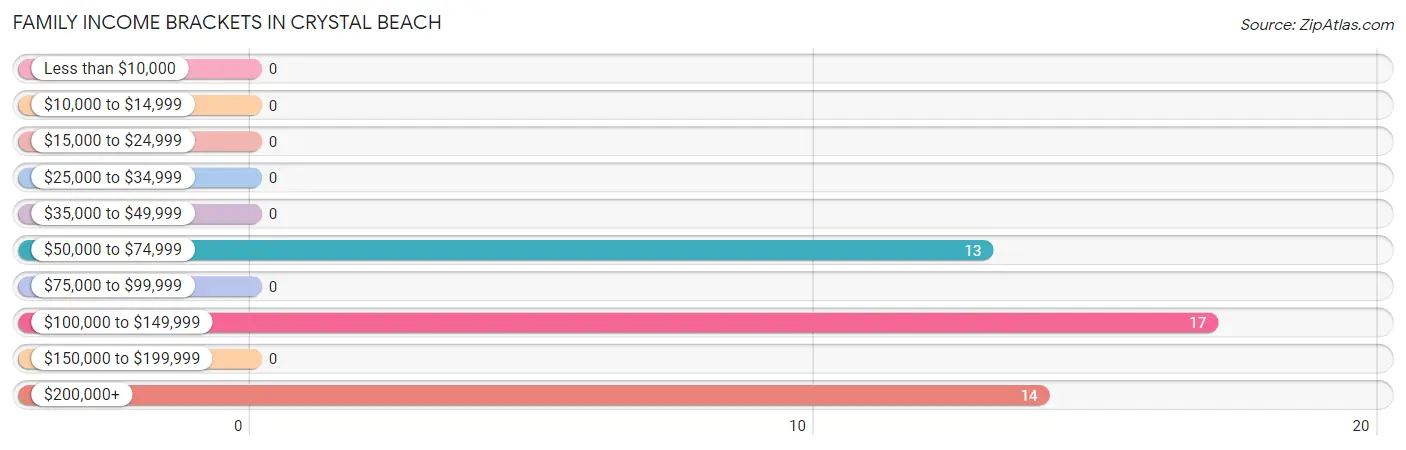
| Income Bracket | # Families | % Families |
| Less than $10,000 | 0 | 0.0% |
| $10,000 to $14,999 | 0 | 0.0% |
| $15,000 to $24,999 | 0 | 0.0% |
| $25,000 to $34,999 | 0 | 0.0% |
| $35,000 to $49,999 | 0 | 0.0% |
| $50,000 to $74,999 | 13 | 29.5% |
| $75,000 to $99,999 | 0 | 0.0% |
| $100,000 to $149,999 | 17 | 38.6% |
| $150,000 to $199,999 | 0 | 0.0% |
| $200,000+ | 14 | 31.8% |
Family Income by Famaliy Size in Crystal Beach
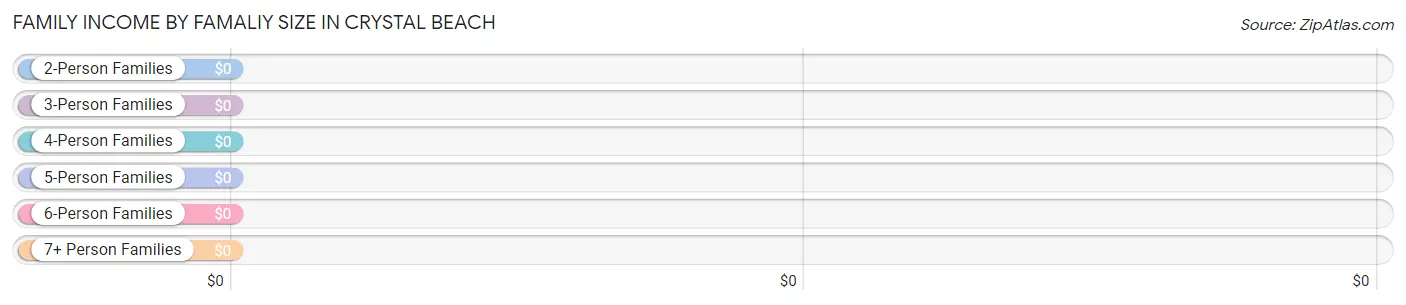
| Income Bracket | # Families | Median Income |
| 2-Person Families | 14 (31.8%) | $0 |
| 3-Person Families | 13 (29.5%) | $0 |
| 4-Person Families | 17 (38.6%) | $0 |
| 5-Person Families | 0 (0.0%) | $0 |
| 6-Person Families | 0 (0.0%) | $0 |
| 7+ Person Families | 0 (0.0%) | $0 |
| Total | 44 (100.0%) | $145,500 |
Family Income by Number of Earners in Crystal Beach
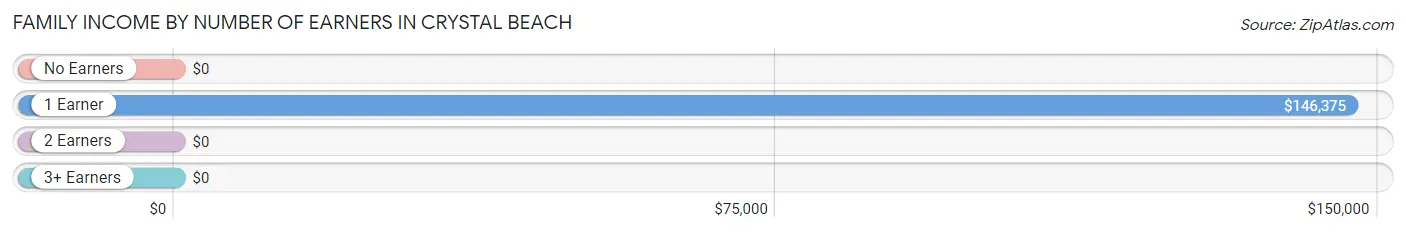
| Number of Earners | # Families | Median Income |
| No Earners | 0 (0.0%) | $0 |
| 1 Earner | 37 (84.1%) | $146,375 |
| 2 Earners | 0 (0.0%) | $0 |
| 3+ Earners | 7 (15.9%) | $0 |
| Total | 44 (100.0%) | $145,500 |
Household Income in Crystal Beach
Household Income Brackets in Crystal Beach
With 51 households falling in the category, the $25,000 to $34,999 income range is the most frequent in Crystal Beach, accounting for 32.5% of all households.
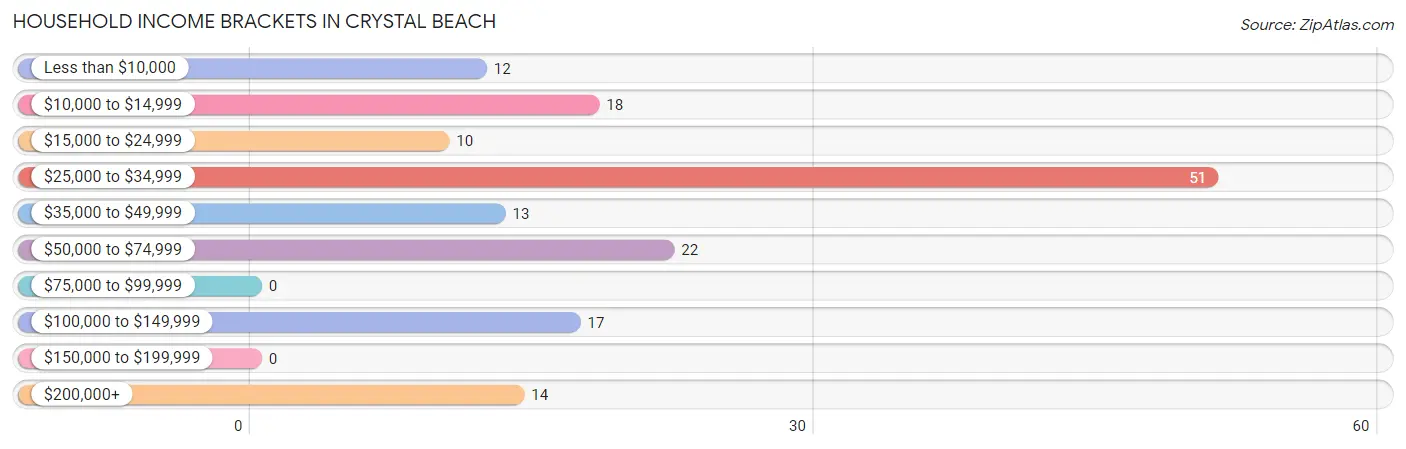
| Income Bracket | # Households | % Households |
| Less than $10,000 | 12 | 7.6% |
| $10,000 to $14,999 | 18 | 11.5% |
| $15,000 to $24,999 | 10 | 6.4% |
| $25,000 to $34,999 | 51 | 32.5% |
| $35,000 to $49,999 | 13 | 8.3% |
| $50,000 to $74,999 | 22 | 14.0% |
| $75,000 to $99,999 | 0 | 0.0% |
| $100,000 to $149,999 | 17 | 10.8% |
| $150,000 to $199,999 | 0 | 0.0% |
| $200,000+ | 14 | 8.9% |
Household Income by Householder Age in Crystal Beach
| Income Bracket | # Households | Median Income |
| 15 to 24 Years | 0 (0.0%) | $0 |
| 25 to 44 Years | 0 (0.0%) | $0 |
| 45 to 64 Years | 38 (24.2%) | $0 |
| 65+ Years | 119 (75.8%) | $0 |
| Total | 157 (100.0%) | $29,792 |
Poverty in Crystal Beach
Income Below Poverty by Sex and Age in Crystal Beach
With 9.5% poverty level for males and 8.3% for females among the residents of Crystal Beach, 55 to 64 year old males and 25 to 34 year old females are the most vulnerable to poverty, with 12 males (27.3%) and 13 females (100.0%) in their respective age groups living below the poverty level.
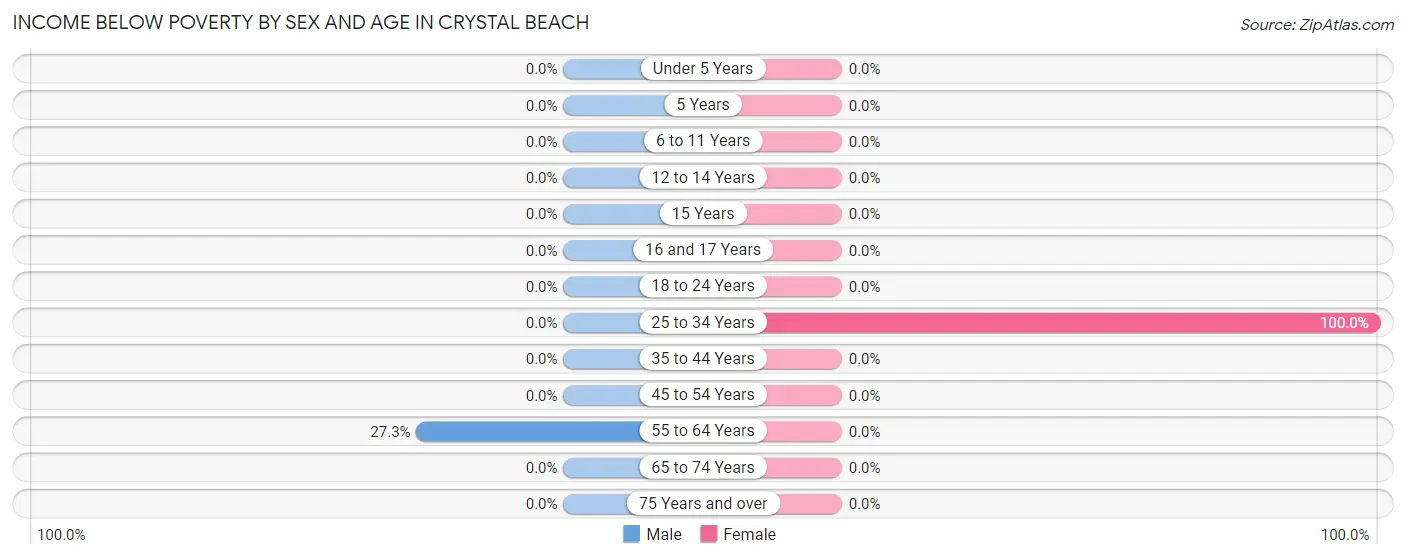
| Age Bracket | Male | Female |
| Under 5 Years | 0 (0.0%) | 0 (0.0%) |
| 5 Years | 0 (0.0%) | 0 (0.0%) |
| 6 to 11 Years | 0 (0.0%) | 0 (0.0%) |
| 12 to 14 Years | 0 (0.0%) | 0 (0.0%) |
| 15 Years | 0 (0.0%) | 0 (0.0%) |
| 16 and 17 Years | 0 (0.0%) | 0 (0.0%) |
| 18 to 24 Years | 0 (0.0%) | 0 (0.0%) |
| 25 to 34 Years | 0 (0.0%) | 13 (100.0%) |
| 35 to 44 Years | 0 (0.0%) | 0 (0.0%) |
| 45 to 54 Years | 0 (0.0%) | 0 (0.0%) |
| 55 to 64 Years | 12 (27.3%) | 0 (0.0%) |
| 65 to 74 Years | 0 (0.0%) | 0 (0.0%) |
| 75 Years and over | 0 (0.0%) | 0 (0.0%) |
| Total | 12 (9.5%) | 13 (8.3%) |
Income Above Poverty by Sex and Age in Crystal Beach
According to the poverty statistics in Crystal Beach, males aged 18 to 24 years and females aged 16 and 17 years are the age groups that are most secure financially, with 100.0% of males and 100.0% of females in these age groups living above the poverty line.
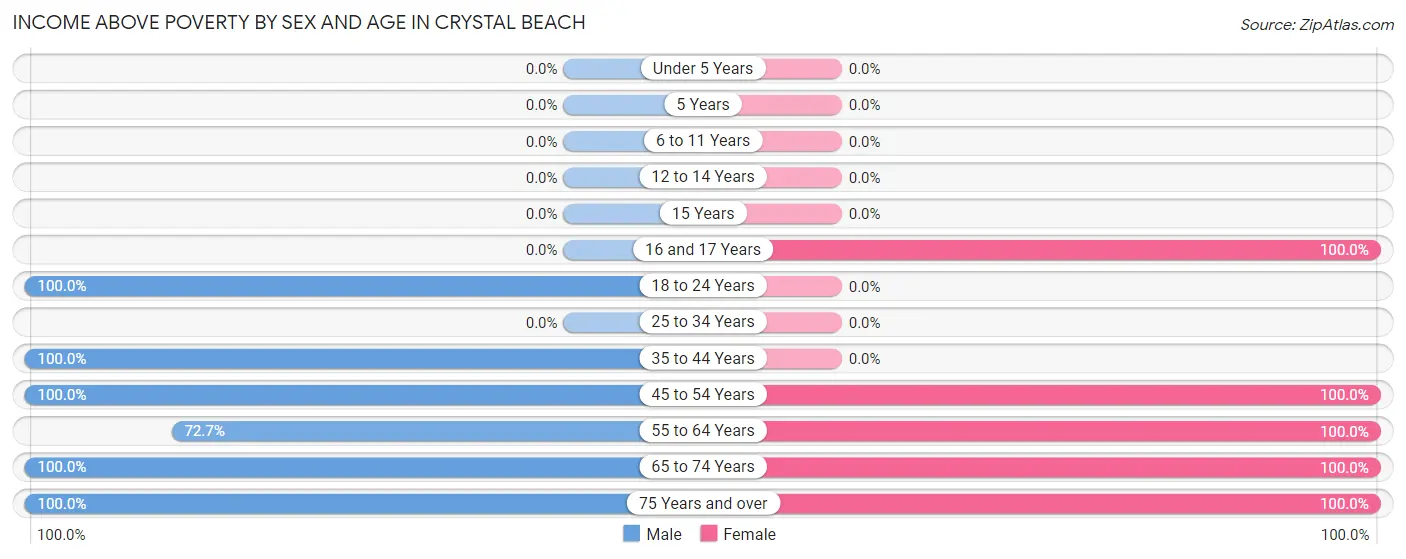
| Age Bracket | Male | Female |
| Under 5 Years | 0 (0.0%) | 0 (0.0%) |
| 5 Years | 0 (0.0%) | 0 (0.0%) |
| 6 to 11 Years | 0 (0.0%) | 0 (0.0%) |
| 12 to 14 Years | 0 (0.0%) | 0 (0.0%) |
| 15 Years | 0 (0.0%) | 0 (0.0%) |
| 16 and 17 Years | 0 (0.0%) | 7 (100.0%) |
| 18 to 24 Years | 8 (100.0%) | 0 (0.0%) |
| 25 to 34 Years | 0 (0.0%) | 0 (0.0%) |
| 35 to 44 Years | 34 (100.0%) | 0 (0.0%) |
| 45 to 54 Years | 8 (100.0%) | 7 (100.0%) |
| 55 to 64 Years | 32 (72.7%) | 19 (100.0%) |
| 65 to 74 Years | 22 (100.0%) | 41 (100.0%) |
| 75 Years and over | 10 (100.0%) | 69 (100.0%) |
| Total | 114 (90.5%) | 143 (91.7%) |
Income Below Poverty Among Married-Couple Families in Crystal Beach
| Children | Above Poverty | Below Poverty |
| No Children | 37 (100.0%) | 0 (0.0%) |
| 1 or 2 Children | 7 (100.0%) | 0 (0.0%) |
| 3 or 4 Children | 0 (0.0%) | 0 (0.0%) |
| 5 or more Children | 0 (0.0%) | 0 (0.0%) |
| Total | 44 (100.0%) | 0 (0.0%) |
Income Below Poverty Among Single-Parent Households in Crystal Beach
| Children | Single Father | Single Mother |
| No Children | 0 (0.0%) | 0 (0.0%) |
| 1 or 2 Children | 0 (0.0%) | 0 (0.0%) |
| 3 or 4 Children | 0 (0.0%) | 0 (0.0%) |
| 5 or more Children | 0 (0.0%) | 0 (0.0%) |
| Total | 0 (0.0%) | 0 (0.0%) |
Income Below Poverty Among Married-Couple vs Single-Parent Households in Crystal Beach
| Children | Married-Couple Families | Single-Parent Households |
| No Children | 0 (0.0%) | 0 (0.0%) |
| 1 or 2 Children | 0 (0.0%) | 0 (0.0%) |
| 3 or 4 Children | 0 (0.0%) | 0 (0.0%) |
| 5 or more Children | 0 (0.0%) | 0 (0.0%) |
| Total | 0 (0.0%) | 0 (0.0%) |
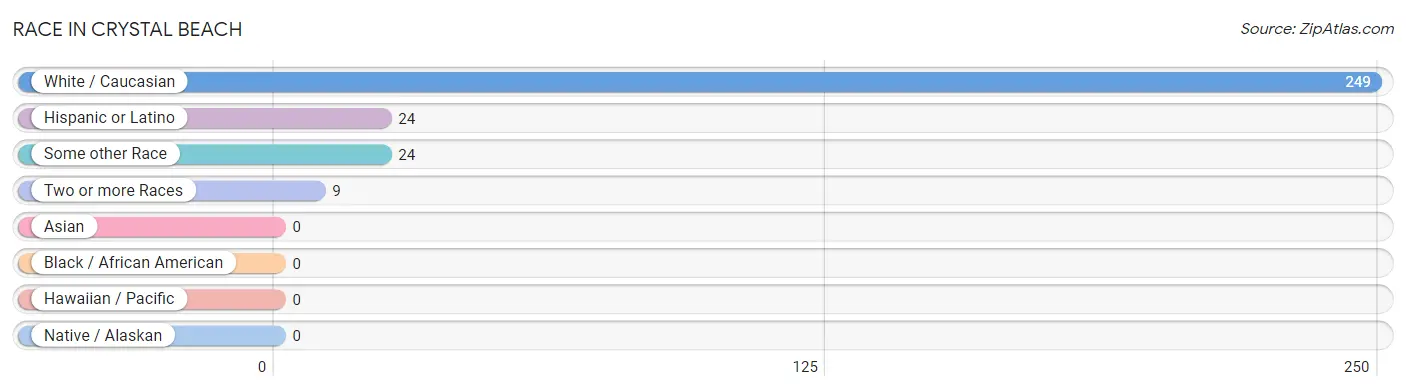
Race in Crystal Beach
The most populous races in Crystal Beach are White / Caucasian (249 | 88.3%), Hispanic or Latino (24 | 8.5%), and Some other Race (24 | 8.5%).
| Race | # Population | % Population |
| Asian | 0 | 0.0% |
| Black / African American | 0 | 0.0% |
| Hawaiian / Pacific | 0 | 0.0% |
| Hispanic or Latino | 24 | 8.5% |
| Native / Alaskan | 0 | 0.0% |
| White / Caucasian | 249 | 88.3% |
| Two or more Races | 9 | 3.2% |
| Some other Race | 24 | 8.5% |
| Total | 282 | 100.0% |
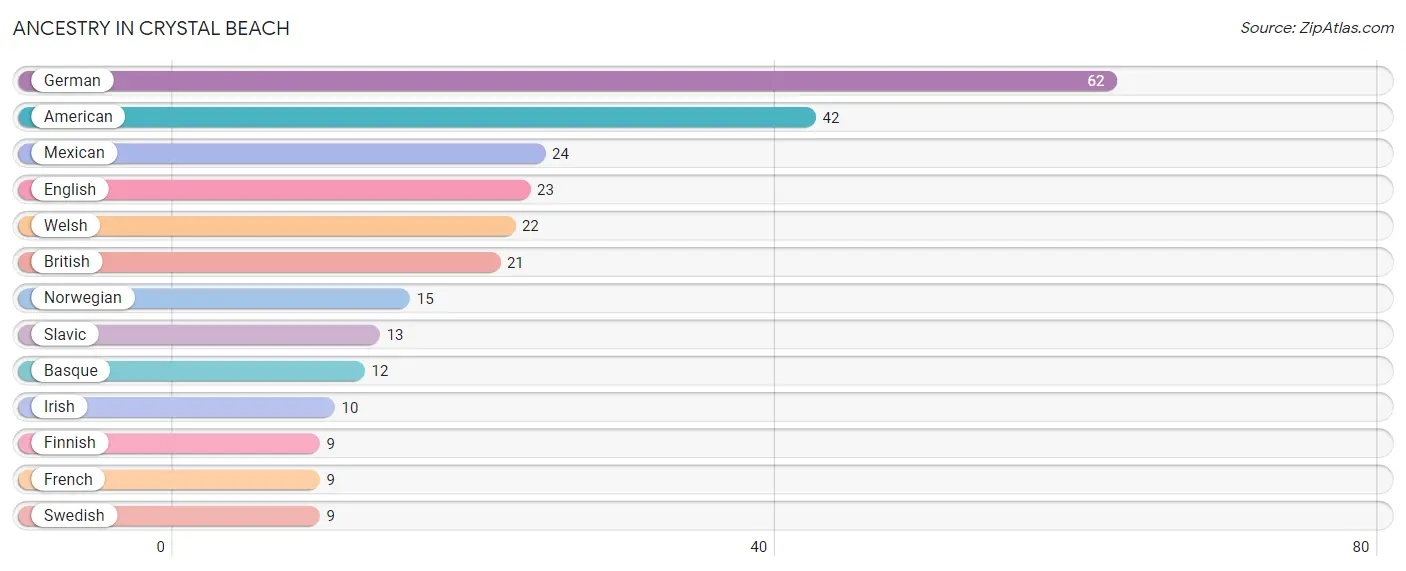
Ancestry in Crystal Beach
The most populous ancestries reported in Crystal Beach are German (62 | 22.0%), American (42 | 14.9%), Mexican (24 | 8.5%), English (23 | 8.2%), and Welsh (22 | 7.8%), together accounting for 61.4% of all Crystal Beach residents.
| Ancestry | # Population | % Population |
| American | 42 | 14.9% |
| Basque | 12 | 4.3% |
| British | 21 | 7.4% |
| English | 23 | 8.2% |
| Finnish | 9 | 3.2% |
| French | 9 | 3.2% |
| German | 62 | 22.0% |
| Irish | 10 | 3.5% |
| Mexican | 24 | 8.5% |
| Norwegian | 15 | 5.3% |
| Slavic | 13 | 4.6% |
| Swedish | 9 | 3.2% |
| Welsh | 22 | 7.8% | View All 13 Rows |
Immigrants in Crystal Beach

| Immigration Origin | # Population | % Population | View All 0 Rows |
Sex and Age in Crystal Beach
Sex and Age in Crystal Beach
The most populous age groups in Crystal Beach are 40 to 44 Years (34 | 27.0%) for men and 75 to 79 Years (42 | 26.9%) for women.
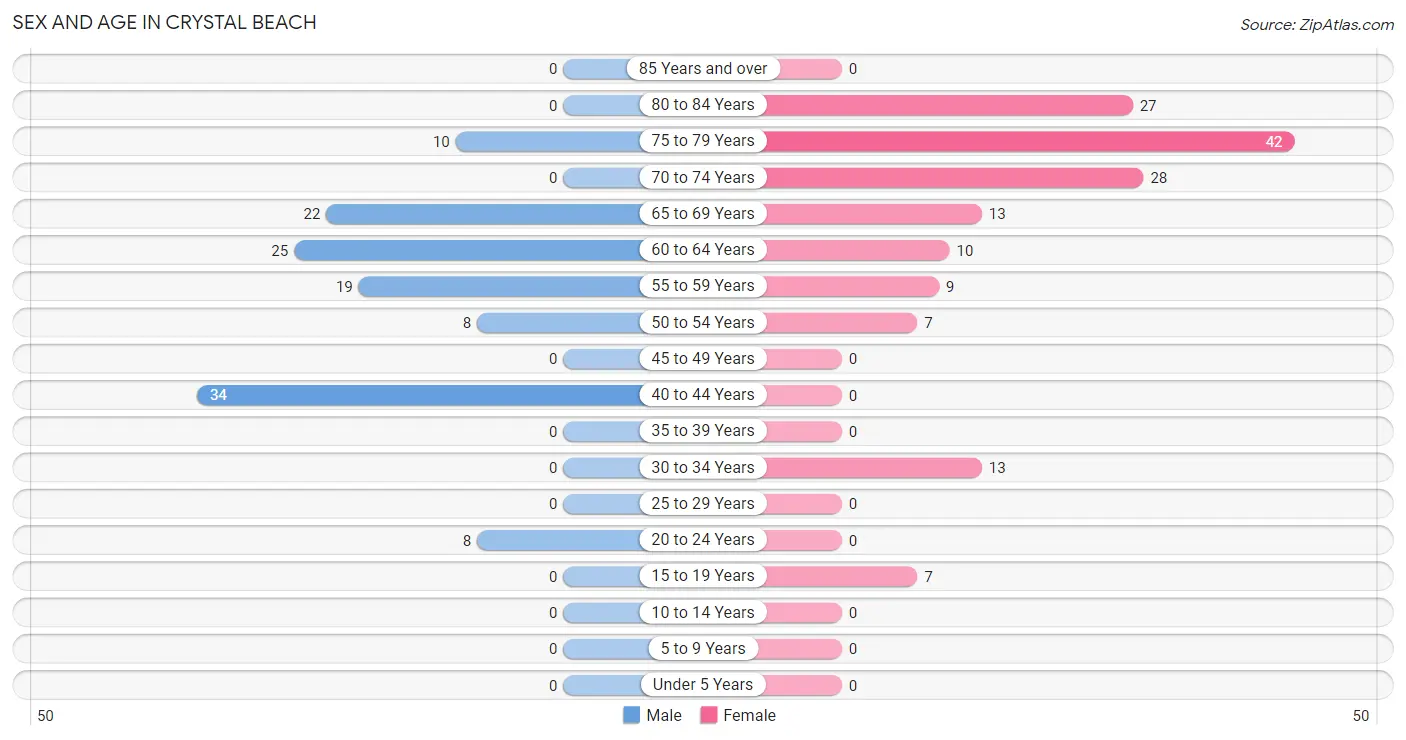
| Age Bracket | Male | Female |
| Under 5 Years | 0 (0.0%) | 0 (0.0%) |
| 5 to 9 Years | 0 (0.0%) | 0 (0.0%) |
| 10 to 14 Years | 0 (0.0%) | 0 (0.0%) |
| 15 to 19 Years | 0 (0.0%) | 7 (4.5%) |
| 20 to 24 Years | 8 (6.4%) | 0 (0.0%) |
| 25 to 29 Years | 0 (0.0%) | 0 (0.0%) |
| 30 to 34 Years | 0 (0.0%) | 13 (8.3%) |
| 35 to 39 Years | 0 (0.0%) | 0 (0.0%) |
| 40 to 44 Years | 34 (27.0%) | 0 (0.0%) |
| 45 to 49 Years | 0 (0.0%) | 0 (0.0%) |
| 50 to 54 Years | 8 (6.4%) | 7 (4.5%) |
| 55 to 59 Years | 19 (15.1%) | 9 (5.8%) |
| 60 to 64 Years | 25 (19.8%) | 10 (6.4%) |
| 65 to 69 Years | 22 (17.5%) | 13 (8.3%) |
| 70 to 74 Years | 0 (0.0%) | 28 (17.9%) |
| 75 to 79 Years | 10 (7.9%) | 42 (26.9%) |
| 80 to 84 Years | 0 (0.0%) | 27 (17.3%) |
| 85 Years and over | 0 (0.0%) | 0 (0.0%) |
| Total | 126 (100.0%) | 156 (100.0%) |
Families and Households in Crystal Beach
Median Family Size in Crystal Beach
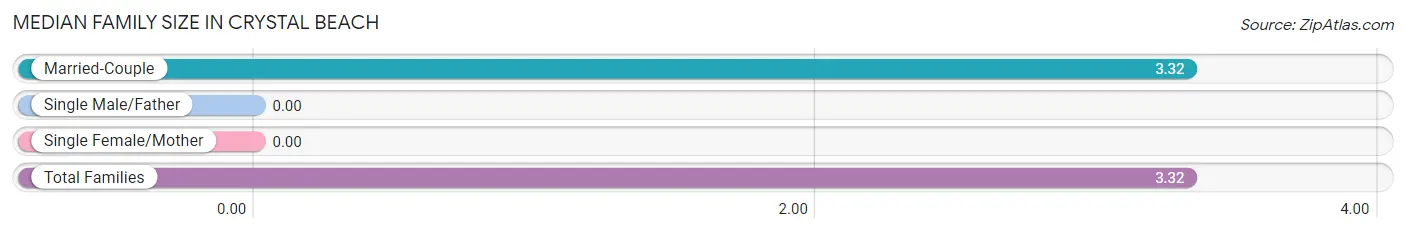
| Family Type | # Families | Family Size |
| Married-Couple | 44 (100.0%) | 3.32 |
| Single Male/Father | 0 (0.0%) | - |
| Single Female/Mother | 0 (0.0%) | - |
| Total Families | 44 (100.0%) | 3.32 |
Median Household Size in Crystal Beach
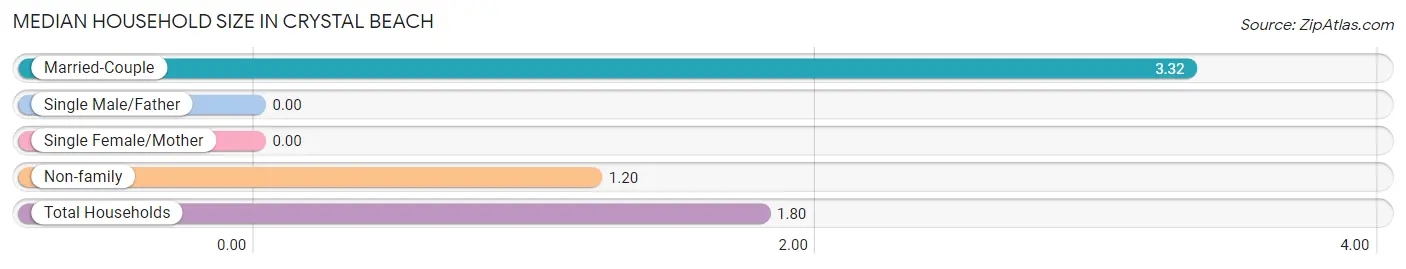
| Household Type | # Households | Household Size |
| Married-Couple | 44 (28.0%) | 3.32 |
| Single Male/Father | 0 (0.0%) | - |
| Single Female/Mother | 0 (0.0%) | - |
| Non-family | 113 (72.0%) | 1.20 |
| Total Households | 157 (100.0%) | 1.80 |
Household Size by Marriage Status in Crystal Beach
Out of a total of 157 households in Crystal Beach, 44 (28.0%) are family households, while 113 (72.0%) are nonfamily households. The most numerous type of family households are 4-person households, comprising 17, and the most common type of nonfamily households are 1-person households, comprising 104.
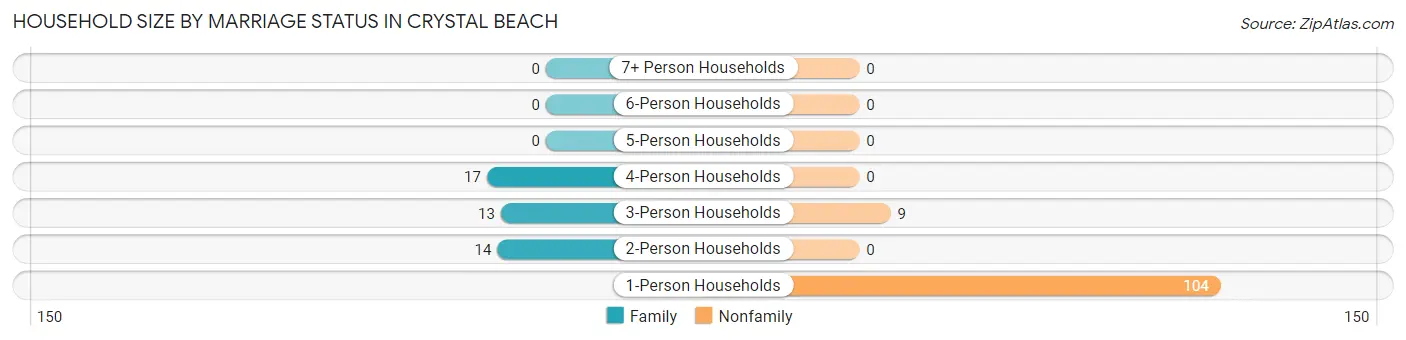
| Household Size | Family Households | Nonfamily Households |
| 1-Person Households | - | 104 (66.2%) |
| 2-Person Households | 14 (8.9%) | 0 (0.0%) |
| 3-Person Households | 13 (8.3%) | 9 (5.7%) |
| 4-Person Households | 17 (10.8%) | 0 (0.0%) |
| 5-Person Households | 0 (0.0%) | 0 (0.0%) |
| 6-Person Households | 0 (0.0%) | 0 (0.0%) |
| 7+ Person Households | 0 (0.0%) | 0 (0.0%) |
| Total | 44 (28.0%) | 113 (72.0%) |
Female Fertility in Crystal Beach
Fertility by Age in Crystal Beach
| Age Bracket | Women with Births | Births / 1,000 Women |
| 15 to 19 years | 0 (0.0%) | 0.0 |
| 20 to 34 years | 0 (0.0%) | 0.0 |
| 35 to 50 years | 0 (0.0%) | 0.0 |
| Total | 0 (0.0%) | 0.0 |
Fertility by Age by Marriage Status in Crystal Beach
| Age Bracket | Married | Unmarried |
| 15 to 19 years | 0 (0.0%) | 0 (0.0%) |
| 20 to 34 years | 0 (0.0%) | 0 (0.0%) |
| 35 to 50 years | 0 (0.0%) | 0 (0.0%) |
| Total | 0 (0.0%) | 0 (0.0%) |
Fertility by Education in Crystal Beach
| Educational Attainment | Women with Births | Births / 1,000 Women |
| Less than High School | 0 (0.0%) | 0.0 |
| High School Diploma | 0 (0.0%) | 0.0 |
| College or Associate's Degree | 0 (0.0%) | 0.0 |
| Bachelor's Degree | 0 (0.0%) | 0.0 |
| Graduate Degree | 0 (0.0%) | 0.0 |
| Total | 0 (0.0%) | 0.0 |
Fertility by Education by Marriage Status in Crystal Beach
| Educational Attainment | Married | Unmarried |
| Less than High School | 0 (0.0%) | 0 (0.0%) |
| High School Diploma | 0 (0.0%) | 0 (0.0%) |
| College or Associate's Degree | 0 (0.0%) | 0 (0.0%) |
| Bachelor's Degree | 0 (0.0%) | 0 (0.0%) |
| Graduate Degree | 0 (0.0%) | 0 (0.0%) |
| Total | 0 (0.0%) | 0 (0.0%) |
Employment Characteristics in Crystal Beach
Employment by Class of Employer in Crystal Beach
Among the 92 employed individuals in Crystal Beach, private company employees (62 | 67.4%), state government employees (20 | 21.7%), and self-employed (not incorporated) (10 | 10.9%) make up the most common classes of employment.
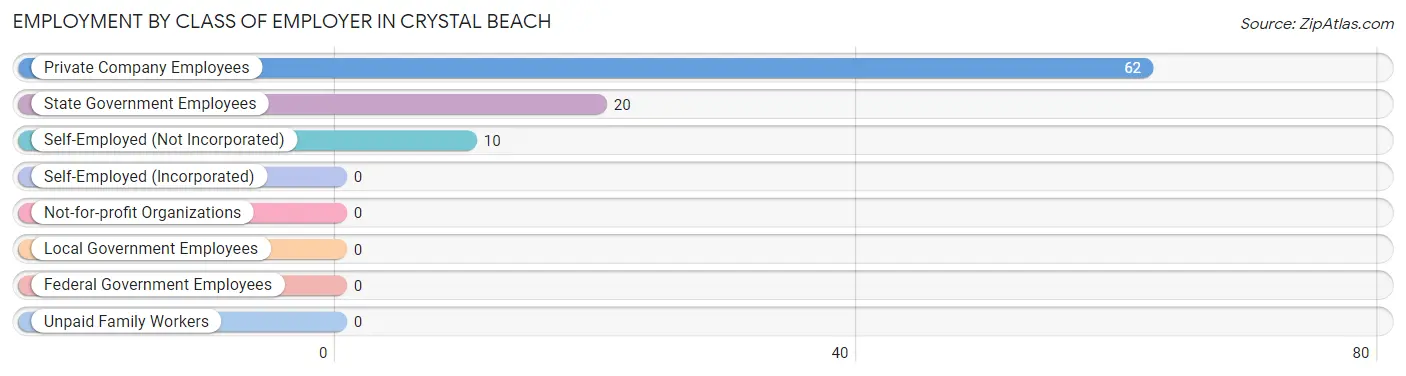
| Employer Class | # Employees | % Employees |
| Private Company Employees | 62 | 67.4% |
| Self-Employed (Incorporated) | 0 | 0.0% |
| Self-Employed (Not Incorporated) | 10 | 10.9% |
| Not-for-profit Organizations | 0 | 0.0% |
| Local Government Employees | 0 | 0.0% |
| State Government Employees | 20 | 21.7% |
| Federal Government Employees | 0 | 0.0% |
| Unpaid Family Workers | 0 | 0.0% |
| Total | 92 | 100.0% |
Employment Status by Age in Crystal Beach
According to the labor force statistics for Crystal Beach, out of the total population over 16 years of age (282), 36.9% or 104 individuals are in the labor force, with 11.5% or 12 of them unemployed. The age group with the highest labor force participation rate is 16 to 19 years, with 100.0% or 7 individuals in the labor force. Within the labor force, the 55 to 59 years age range has the highest percentage of unemployed individuals, with 57.1% or 12 of them being unemployed.
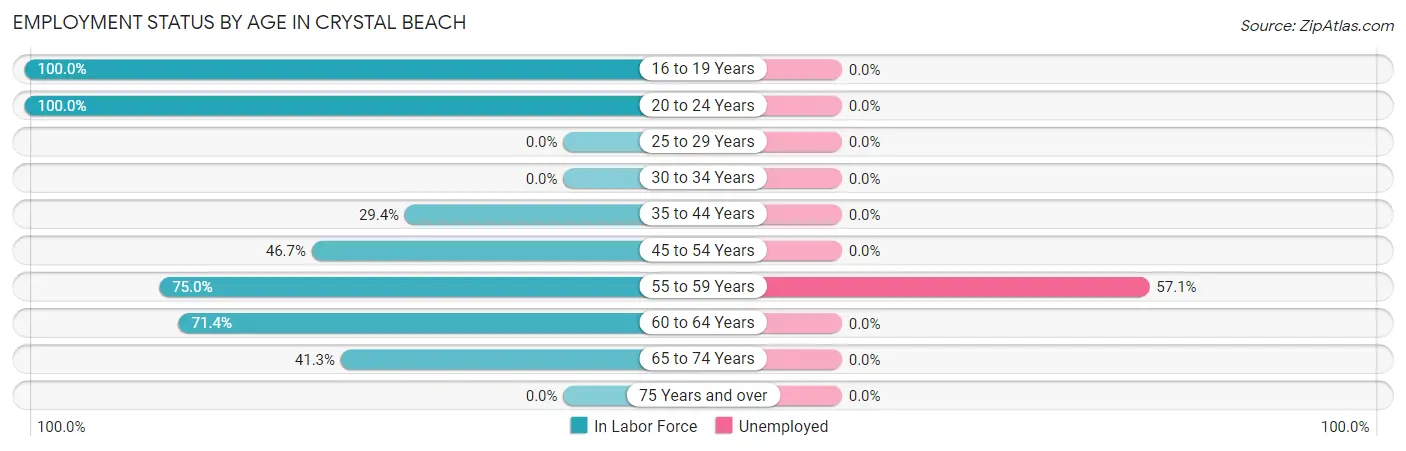
| Age Bracket | In Labor Force | Unemployed |
| 16 to 19 Years | 7 (100.0%) | 0 (0.0%) |
| 20 to 24 Years | 8 (100.0%) | 0 (0.0%) |
| 25 to 29 Years | 0 (0.0%) | 0 (0.0%) |
| 30 to 34 Years | 0 (0.0%) | 0 (0.0%) |
| 35 to 44 Years | 10 (29.4%) | 0 (0.0%) |
| 45 to 54 Years | 7 (46.7%) | 0 (0.0%) |
| 55 to 59 Years | 21 (75.0%) | 12 (57.1%) |
| 60 to 64 Years | 25 (71.4%) | 0 (0.0%) |
| 65 to 74 Years | 26 (41.3%) | 0 (0.0%) |
| 75 Years and over | 0 (0.0%) | 0 (0.0%) |
| Total | 104 (36.9%) | 12 (11.5%) |
Employment Status by Educational Attainment in Crystal Beach
According to labor force statistics for Crystal Beach, 50.4% of individuals (63) out of the total population between 25 and 64 years of age (125) are in the labor force, with 19.0% or 12 of them being unemployed. The group with the highest labor force participation rate are those with the educational attainment of less than high school, with 100.0% or 9 individuals in the labor force. Within the labor force, individuals with college / associate degree education have the highest percentage of unemployment, with 41.4% or 12 of them being unemployed.
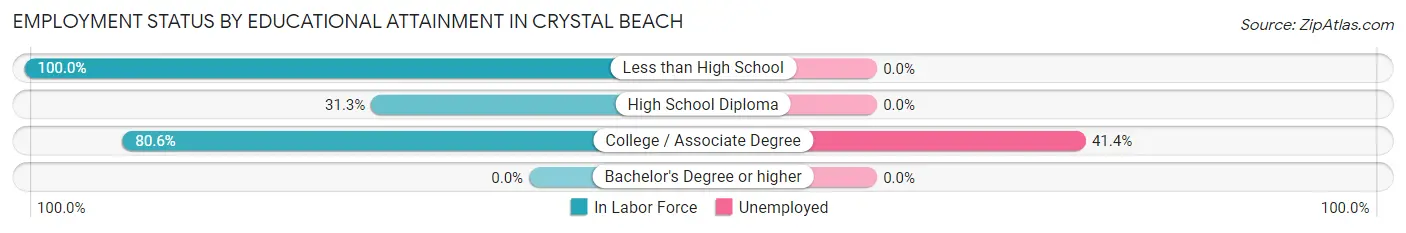
| Educational Attainment | In Labor Force | Unemployed |
| Less than High School | 9 (100.0%) | 0 (0.0%) |
| High School Diploma | 25 (31.3%) | 0 (0.0%) |
| College / Associate Degree | 29 (80.6%) | 15 (41.4%) |
| Bachelor's Degree or higher | 0 (0.0%) | 0 (0.0%) |
| Total | 63 (50.4%) | 24 (19.0%) |
Employment Occupations by Sex in Crystal Beach
Management, Business, Science and Arts Occupations
The most common Management, Business, Science and Arts occupations in Crystal Beach are , and Management (10 | 10.9%).
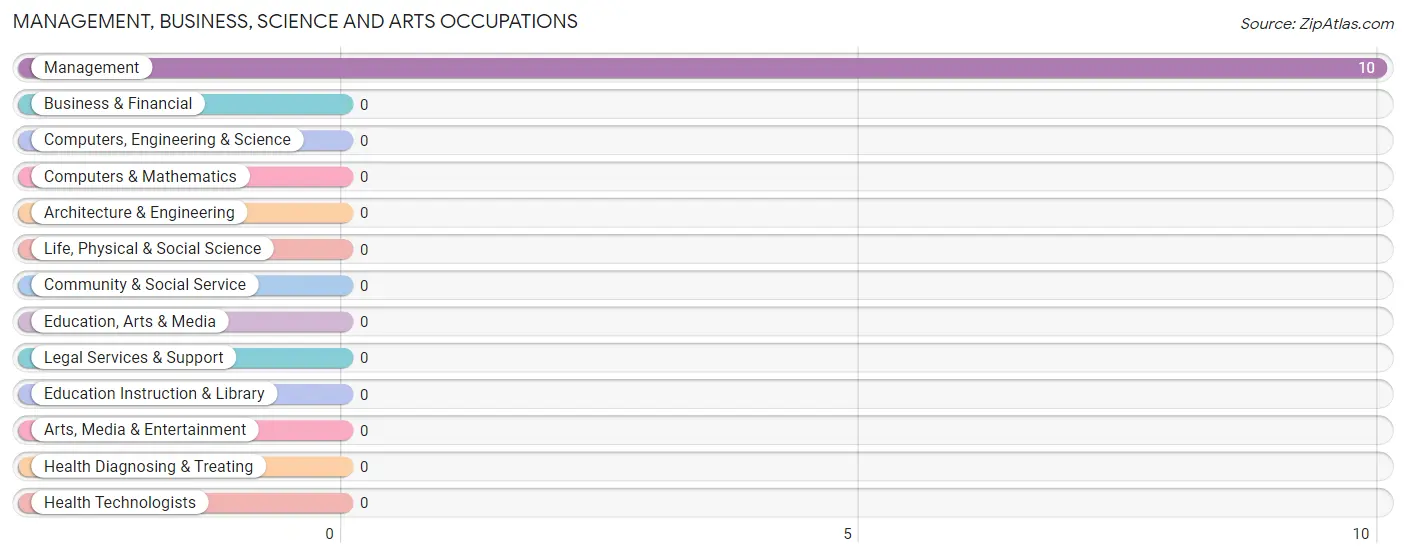
Management, Business, Science and Arts Occupations by Sex
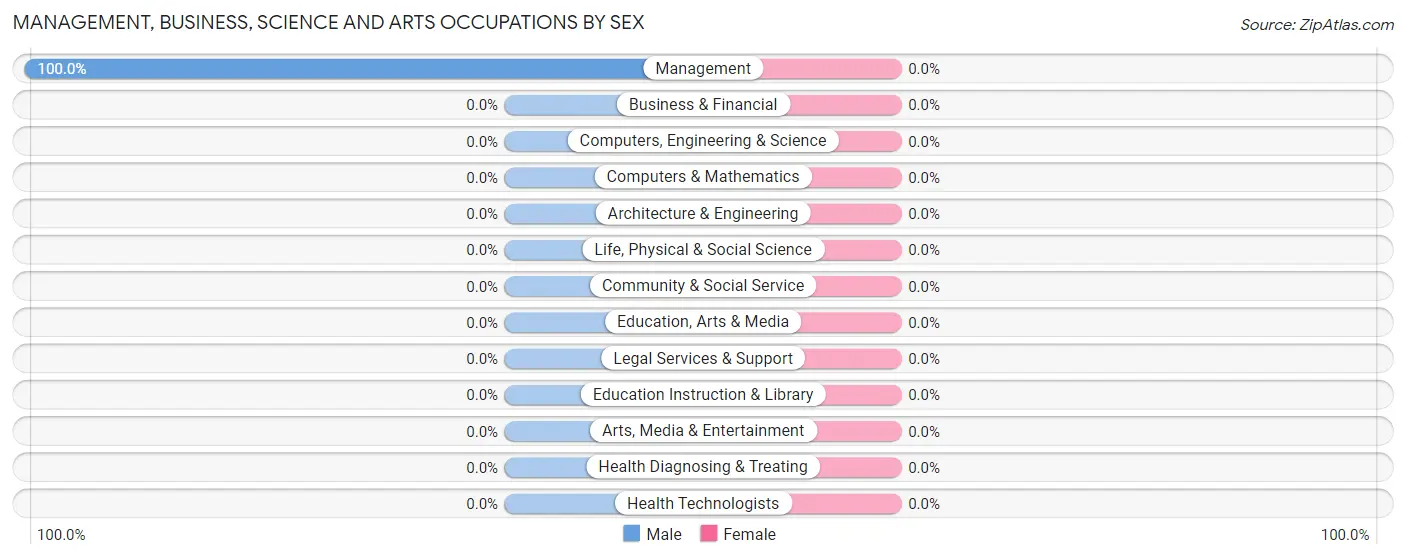
| Occupation | Male | Female |
| Management | 10 (100.0%) | 0 (0.0%) |
| Business & Financial | 0 (0.0%) | 0 (0.0%) |
| Computers, Engineering & Science | 0 (0.0%) | 0 (0.0%) |
| Computers & Mathematics | 0 (0.0%) | 0 (0.0%) |
| Architecture & Engineering | 0 (0.0%) | 0 (0.0%) |
| Life, Physical & Social Science | 0 (0.0%) | 0 (0.0%) |
| Community & Social Service | 0 (0.0%) | 0 (0.0%) |
| Education, Arts & Media | 0 (0.0%) | 0 (0.0%) |
| Legal Services & Support | 0 (0.0%) | 0 (0.0%) |
| Education Instruction & Library | 0 (0.0%) | 0 (0.0%) |
| Arts, Media & Entertainment | 0 (0.0%) | 0 (0.0%) |
| Health Diagnosing & Treating | 0 (0.0%) | 0 (0.0%) |
| Health Technologists | 0 (0.0%) | 0 (0.0%) |
| Total (Category) | 10 (100.0%) | 0 (0.0%) |
| Total (Overall) | 56 (60.9%) | 36 (39.1%) |
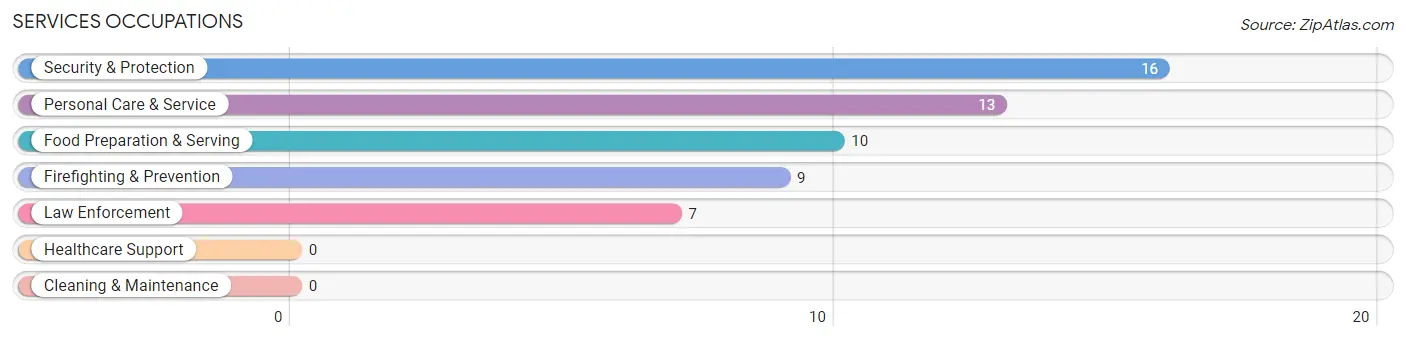
Services Occupations
The most common Services occupations in Crystal Beach are Security & Protection (16 | 17.4%), Personal Care & Service (13 | 14.1%), Food Preparation & Serving (10 | 10.9%), Firefighting & Prevention (9 | 9.8%), and Law Enforcement (7 | 7.6%).
Services Occupations by Sex
Within the Services occupations in Crystal Beach, the most male-oriented occupations are Food Preparation & Serving (100.0%), and Personal Care & Service (100.0%), while the most female-oriented occupations are Security & Protection (100.0%), Firefighting & Prevention (100.0%), and Law Enforcement (100.0%).
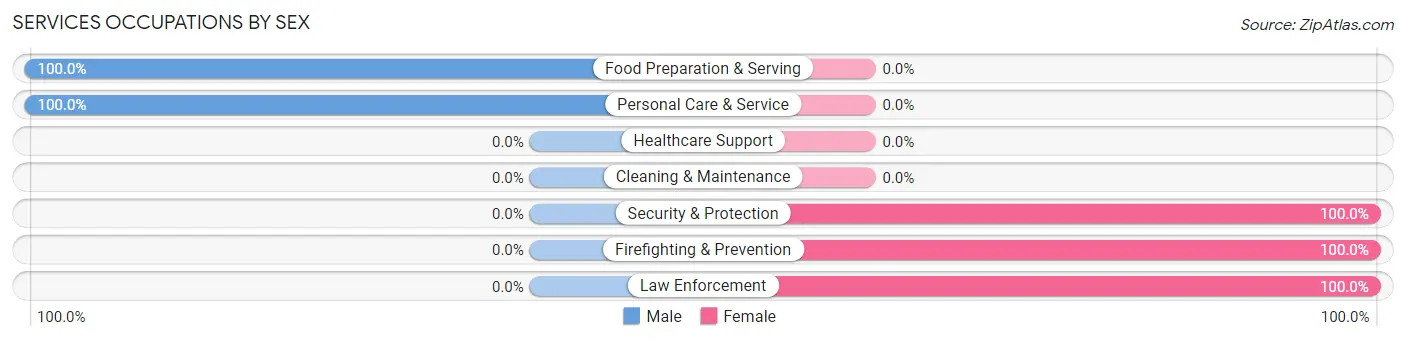
| Occupation | Male | Female |
| Healthcare Support | 0 (0.0%) | 0 (0.0%) |
| Security & Protection | 0 (0.0%) | 16 (100.0%) |
| Firefighting & Prevention | 0 (0.0%) | 9 (100.0%) |
| Law Enforcement | 0 (0.0%) | 7 (100.0%) |
| Food Preparation & Serving | 10 (100.0%) | 0 (0.0%) |
| Cleaning & Maintenance | 0 (0.0%) | 0 (0.0%) |
| Personal Care & Service | 13 (100.0%) | 0 (0.0%) |
| Total (Category) | 23 (59.0%) | 16 (41.0%) |
| Total (Overall) | 56 (60.9%) | 36 (39.1%) |
Sales and Office Occupations
The most common Sales and Office occupations in Crystal Beach are Sales & Related (15 | 16.3%), and Office & Administration (13 | 14.1%).
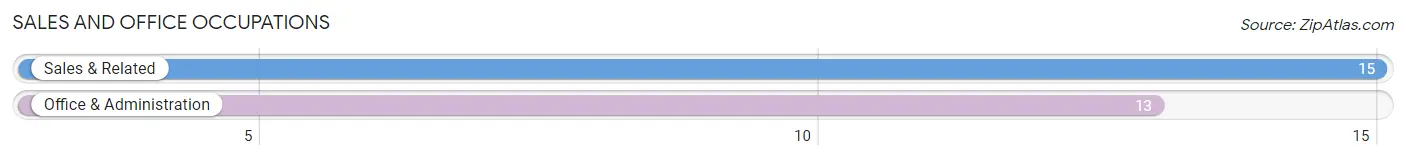
Sales and Office Occupations by Sex
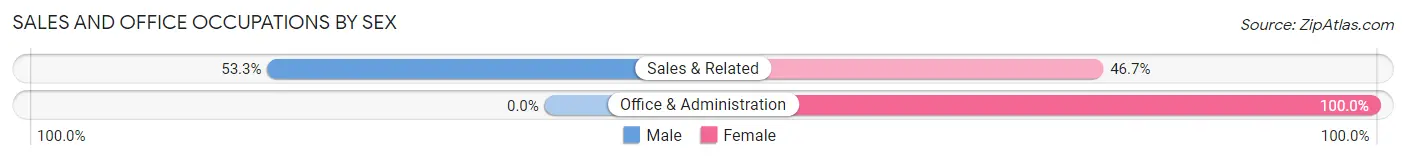
| Occupation | Male | Female |
| Sales & Related | 8 (53.3%) | 7 (46.7%) |
| Office & Administration | 0 (0.0%) | 13 (100.0%) |
| Total (Category) | 8 (28.6%) | 20 (71.4%) |
| Total (Overall) | 56 (60.9%) | 36 (39.1%) |
Natural Resources, Construction and Maintenance Occupations
Natural Resources, Construction and Maintenance Occupations by Sex
| Occupation | Male | Female |
| Farming, Fishing & Forestry | 0 (0.0%) | 0 (0.0%) |
| Construction & Extraction | 0 (0.0%) | 0 (0.0%) |
| Installation, Maintenance & Repair | 0 (0.0%) | 0 (0.0%) |
| Total (Category) | 0 (0.0%) | 0 (0.0%) |
| Total (Overall) | 56 (60.9%) | 36 (39.1%) |
Production, Transportation and Moving Occupations
The most common Production, Transportation and Moving occupations in Crystal Beach are , and Production (15 | 16.3%).
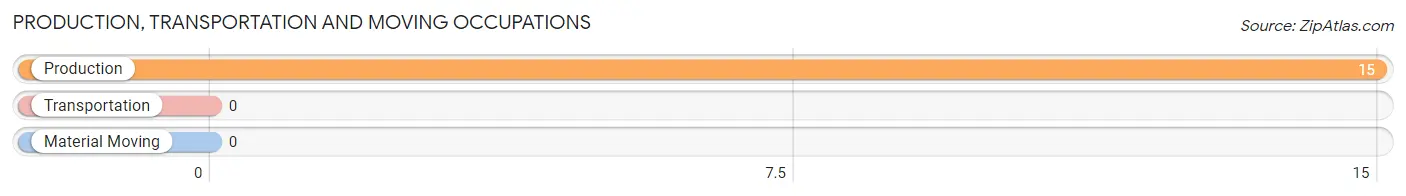
Production, Transportation and Moving Occupations by Sex
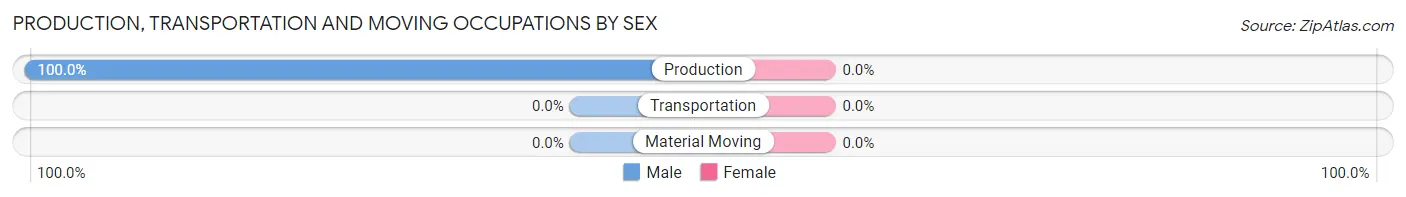
| Occupation | Male | Female |
| Production | 15 (100.0%) | 0 (0.0%) |
| Transportation | 0 (0.0%) | 0 (0.0%) |
| Material Moving | 0 (0.0%) | 0 (0.0%) |
| Total (Category) | 15 (100.0%) | 0 (0.0%) |
| Total (Overall) | 56 (60.9%) | 36 (39.1%) |
Employment Industries by Sex in Crystal Beach
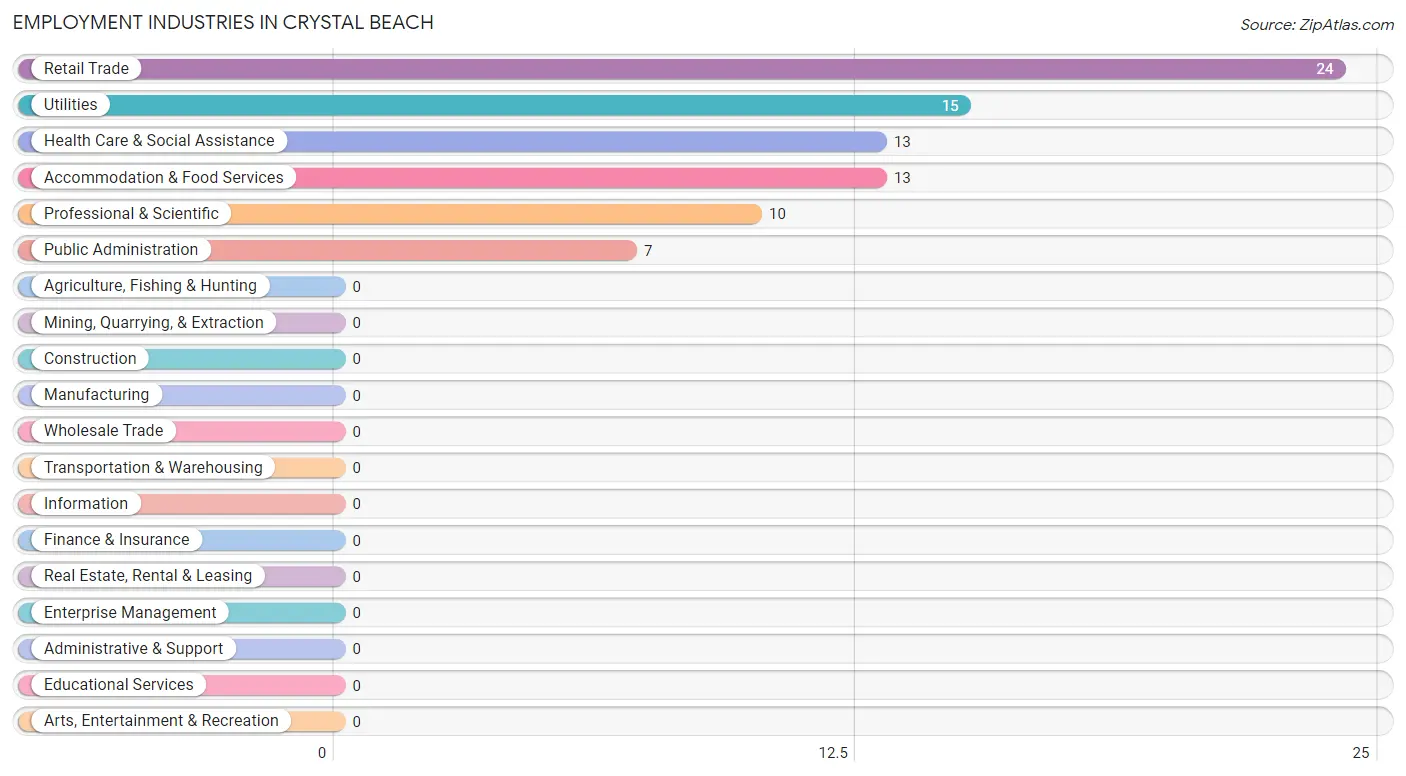
Employment Industries in Crystal Beach
The major employment industries in Crystal Beach include Retail Trade (24 | 26.1%), Utilities (15 | 16.3%), Health Care & Social Assistance (13 | 14.1%), Accommodation & Food Services (13 | 14.1%), and Professional & Scientific (10 | 10.9%).
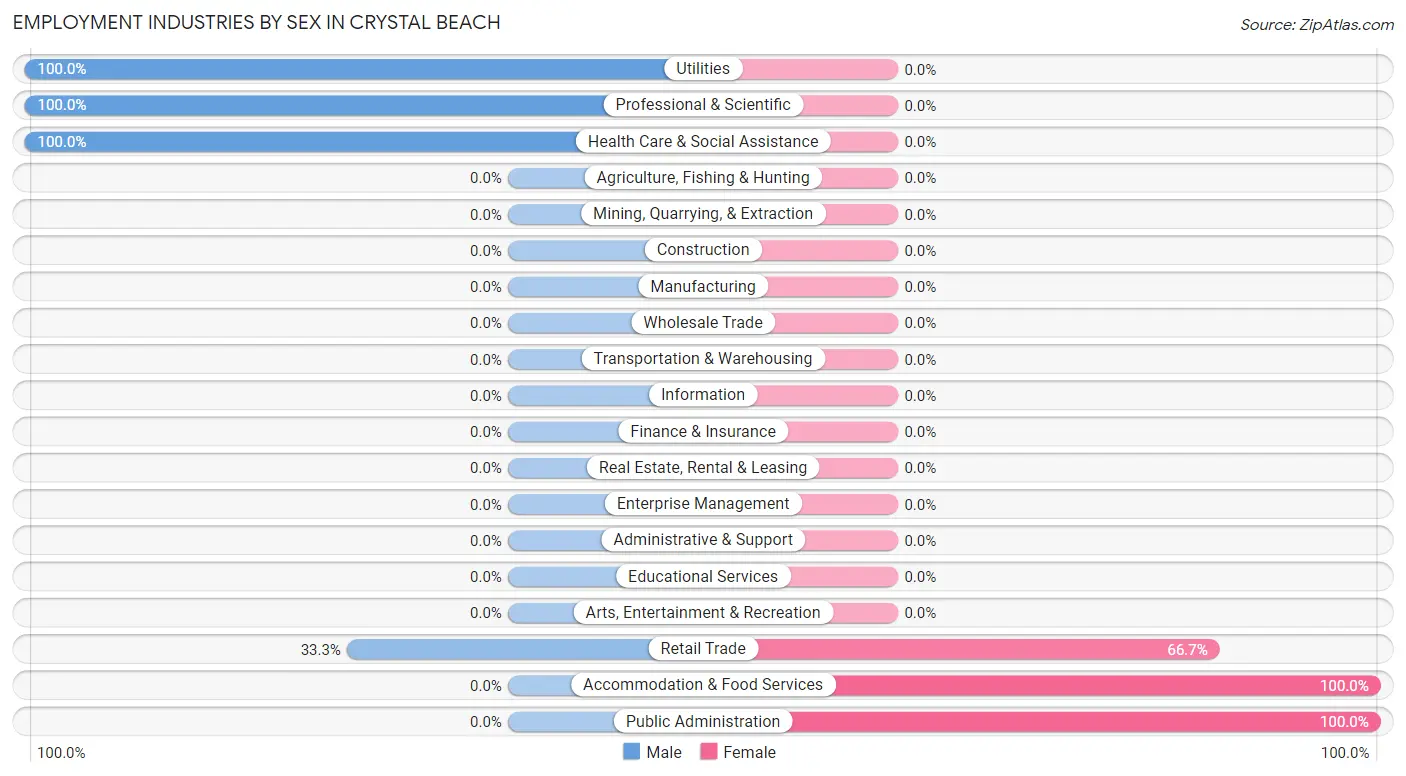
Employment Industries by Sex in Crystal Beach
The Crystal Beach industries that see more men than women are Utilities (100.0%), Professional & Scientific (100.0%), and Health Care & Social Assistance (100.0%), whereas the industries that tend to have a higher number of women are Accommodation & Food Services (100.0%), Public Administration (100.0%), and Retail Trade (66.7%).
| Industry | Male | Female |
| Agriculture, Fishing & Hunting | 0 (0.0%) | 0 (0.0%) |
| Mining, Quarrying, & Extraction | 0 (0.0%) | 0 (0.0%) |
| Construction | 0 (0.0%) | 0 (0.0%) |
| Manufacturing | 0 (0.0%) | 0 (0.0%) |
| Wholesale Trade | 0 (0.0%) | 0 (0.0%) |
| Retail Trade | 8 (33.3%) | 16 (66.7%) |
| Transportation & Warehousing | 0 (0.0%) | 0 (0.0%) |
| Utilities | 15 (100.0%) | 0 (0.0%) |
| Information | 0 (0.0%) | 0 (0.0%) |
| Finance & Insurance | 0 (0.0%) | 0 (0.0%) |
| Real Estate, Rental & Leasing | 0 (0.0%) | 0 (0.0%) |
| Professional & Scientific | 10 (100.0%) | 0 (0.0%) |
| Enterprise Management | 0 (0.0%) | 0 (0.0%) |
| Administrative & Support | 0 (0.0%) | 0 (0.0%) |
| Educational Services | 0 (0.0%) | 0 (0.0%) |
| Health Care & Social Assistance | 13 (100.0%) | 0 (0.0%) |
| Arts, Entertainment & Recreation | 0 (0.0%) | 0 (0.0%) |
| Accommodation & Food Services | 0 (0.0%) | 13 (100.0%) |
| Public Administration | 0 (0.0%) | 7 (100.0%) |
| Total | 56 (60.9%) | 36 (39.1%) |
Education in Crystal Beach
School Enrollment in Crystal Beach
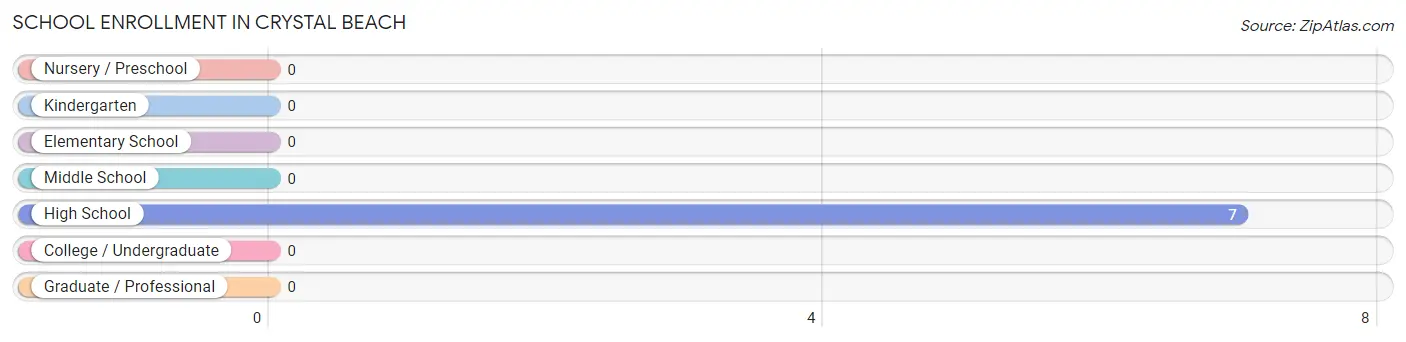
| School Level | # Students | % Students |
| Nursery / Preschool | 0 | 0.0% |
| Kindergarten | 0 | 0.0% |
| Elementary School | 0 | 0.0% |
| Middle School | 0 | 0.0% |
| High School | 7 | 100.0% |
| College / Undergraduate | 0 | 0.0% |
| Graduate / Professional | 0 | 0.0% |
| Total | 7 | 100.0% |
School Enrollment by Age by Funding Source in Crystal Beach
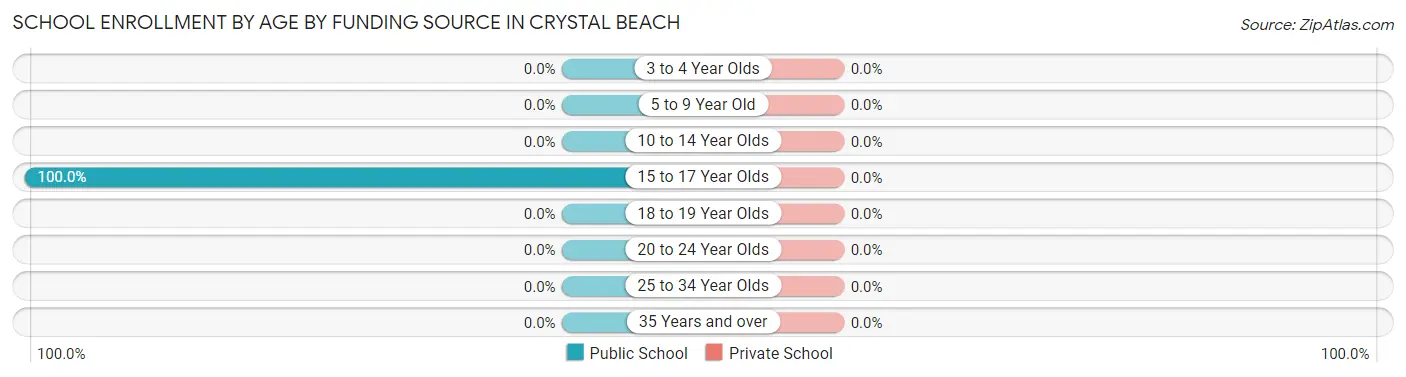
| Age Bracket | Public School | Private School |
| 3 to 4 Year Olds | 0 (0.0%) | 0 (0.0%) |
| 5 to 9 Year Old | 0 (0.0%) | 0 (0.0%) |
| 10 to 14 Year Olds | 0 (0.0%) | 0 (0.0%) |
| 15 to 17 Year Olds | 7 (100.0%) | 0 (0.0%) |
| 18 to 19 Year Olds | 0 (0.0%) | 0 (0.0%) |
| 20 to 24 Year Olds | 0 (0.0%) | 0 (0.0%) |
| 25 to 34 Year Olds | 0 (0.0%) | 0 (0.0%) |
| 35 Years and over | 0 (0.0%) | 0 (0.0%) |
| Total | 7 (100.0%) | 0 (0.0%) |
Educational Attainment by Field of Study in Crystal Beach
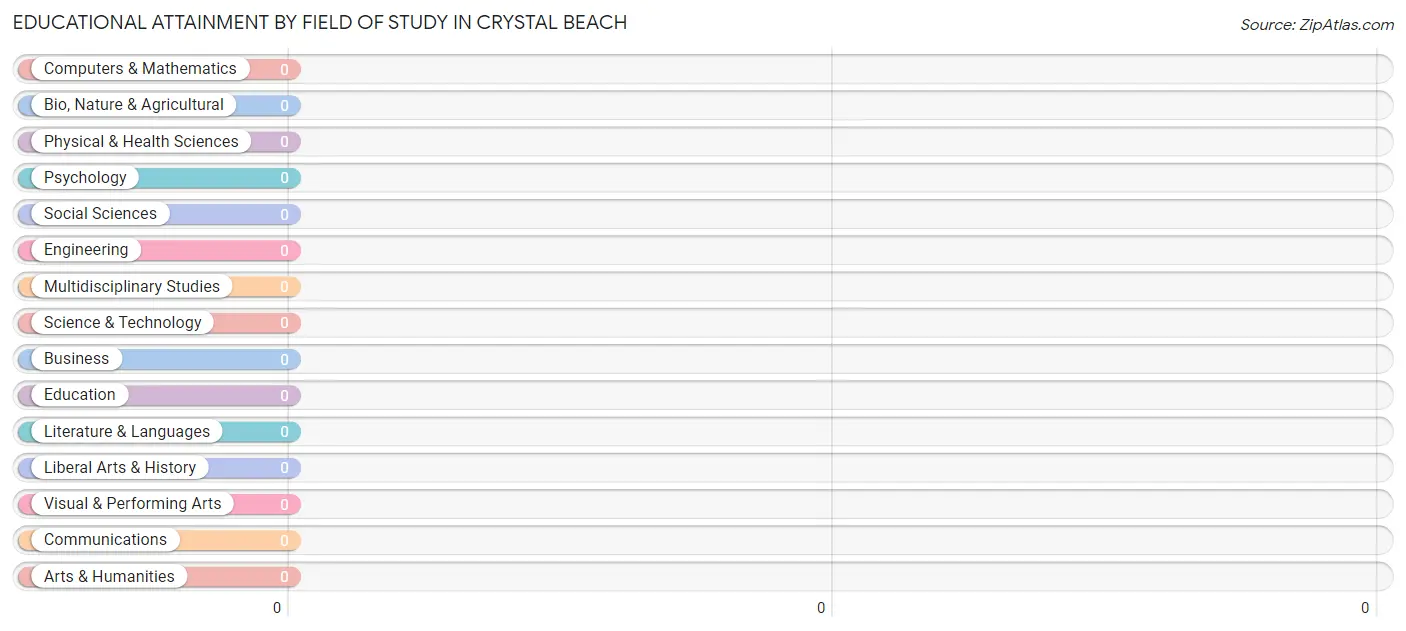
| Field of Study | # Graduates | % Graduates |
| Computers & Mathematics | 0 | 0.0% |
| Bio, Nature & Agricultural | 0 | 0.0% |
| Physical & Health Sciences | 0 | 0.0% |
| Psychology | 0 | 0.0% |
| Social Sciences | 0 | 0.0% |
| Engineering | 0 | 0.0% |
| Multidisciplinary Studies | 0 | 0.0% |
| Science & Technology | 0 | 0.0% |
| Business | 0 | 0.0% |
| Education | 0 | 0.0% |
| Literature & Languages | 0 | 0.0% |
| Liberal Arts & History | 0 | 0.0% |
| Visual & Performing Arts | 0 | 0.0% |
| Communications | 0 | 0.0% |
| Arts & Humanities | 0 | 0.0% |
| Total | 0 | 0.0% |
Transportation & Commute in Crystal Beach
Vehicle Availability by Sex in Crystal Beach
The most prevalent vehicle ownership categories in Crystal Beach are males with 5 or more vehicles (23, accounting for 41.1%) and females with 5 or more vehicles (14, making up 63.9%).
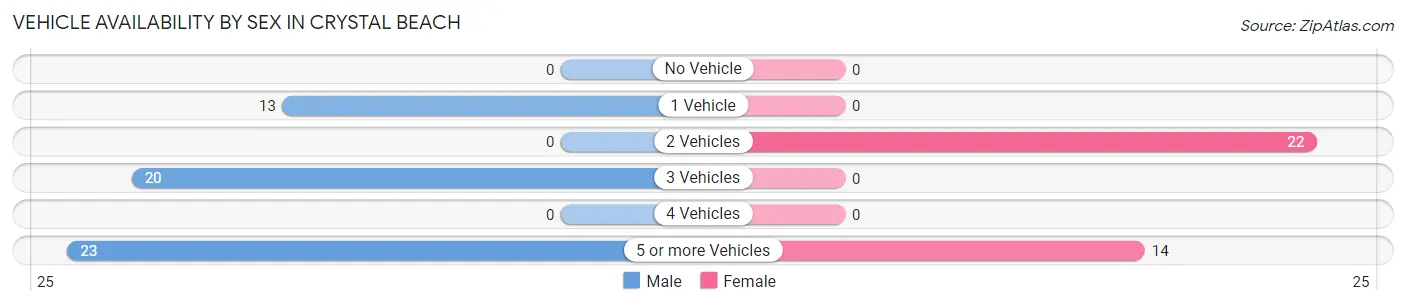
| Vehicles Available | Male | Female |
| No Vehicle | 0 (0.0%) | 0 (0.0%) |
| 1 Vehicle | 13 (23.2%) | 0 (0.0%) |
| 2 Vehicles | 0 (0.0%) | 22 (61.1%) |
| 3 Vehicles | 20 (35.7%) | 0 (0.0%) |
| 4 Vehicles | 0 (0.0%) | 0 (0.0%) |
| 5 or more Vehicles | 23 (41.1%) | 14 (38.9%) |
| Total | 56 (100.0%) | 36 (100.0%) |
Commute Time in Crystal Beach
The most frequently occuring commute durations in Crystal Beach are 20 to 24 minutes (50 commuters, 63.3%), 90 or more minutes (13 commuters, 16.5%), and 45 to 59 minutes (9 commuters, 11.4%).
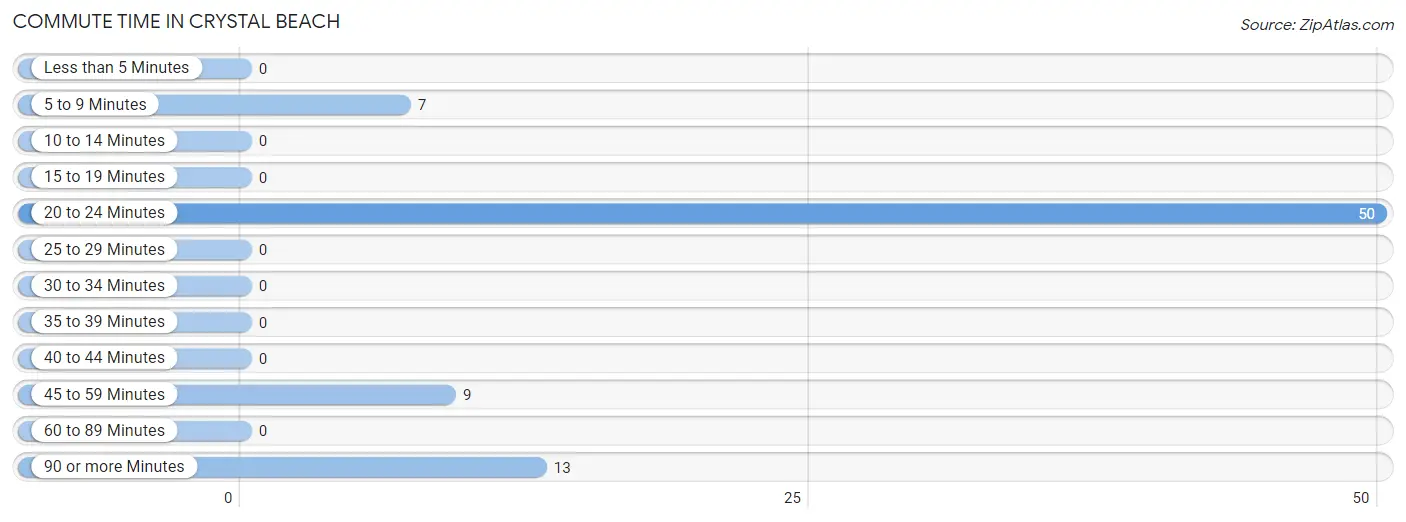
| Commute Time | # Commuters | % Commuters |
| Less than 5 Minutes | 0 | 0.0% |
| 5 to 9 Minutes | 7 | 8.9% |
| 10 to 14 Minutes | 0 | 0.0% |
| 15 to 19 Minutes | 0 | 0.0% |
| 20 to 24 Minutes | 50 | 63.3% |
| 25 to 29 Minutes | 0 | 0.0% |
| 30 to 34 Minutes | 0 | 0.0% |
| 35 to 39 Minutes | 0 | 0.0% |
| 40 to 44 Minutes | 0 | 0.0% |
| 45 to 59 Minutes | 9 | 11.4% |
| 60 to 89 Minutes | 0 | 0.0% |
| 90 or more Minutes | 13 | 16.5% |
Commute Time by Sex in Crystal Beach
The most common commute times in Crystal Beach are 20 to 24 minutes (43 commuters, 100.0%) for males and 90 or more minutes (13 commuters, 36.1%) for females.
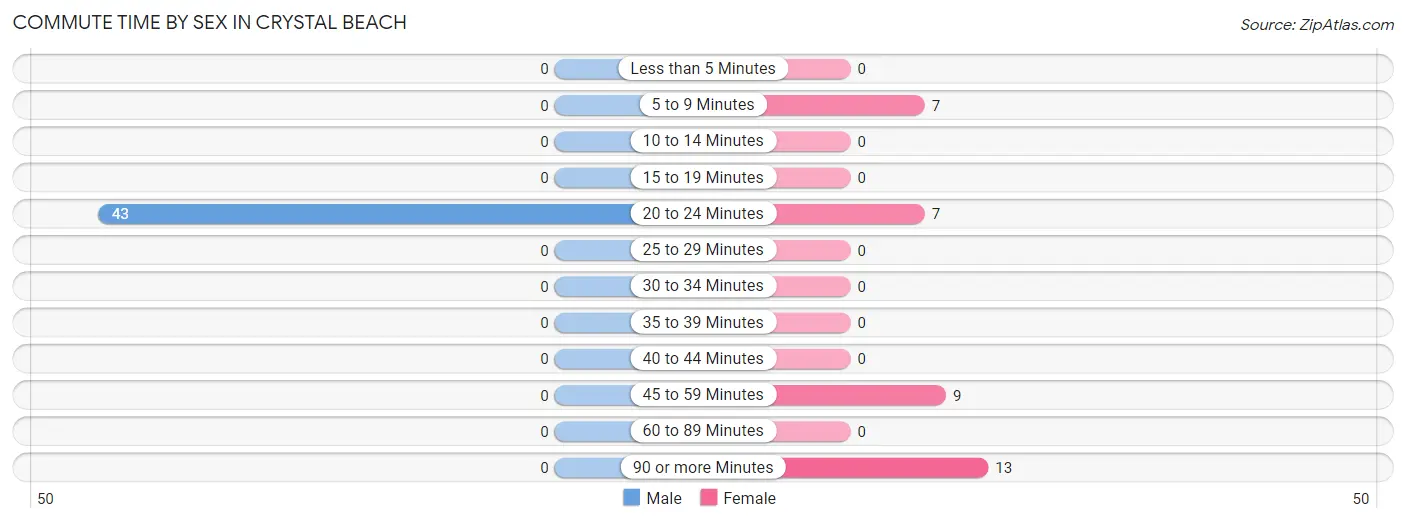
| Commute Time | Male | Female |
| Less than 5 Minutes | 0 (0.0%) | 0 (0.0%) |
| 5 to 9 Minutes | 0 (0.0%) | 7 (19.4%) |
| 10 to 14 Minutes | 0 (0.0%) | 0 (0.0%) |
| 15 to 19 Minutes | 0 (0.0%) | 0 (0.0%) |
| 20 to 24 Minutes | 43 (100.0%) | 7 (19.4%) |
| 25 to 29 Minutes | 0 (0.0%) | 0 (0.0%) |
| 30 to 34 Minutes | 0 (0.0%) | 0 (0.0%) |
| 35 to 39 Minutes | 0 (0.0%) | 0 (0.0%) |
| 40 to 44 Minutes | 0 (0.0%) | 0 (0.0%) |
| 45 to 59 Minutes | 0 (0.0%) | 9 (25.0%) |
| 60 to 89 Minutes | 0 (0.0%) | 0 (0.0%) |
| 90 or more Minutes | 0 (0.0%) | 13 (36.1%) |
Time of Departure to Work by Sex in Crystal Beach
The most frequent times of departure to work in Crystal Beach are 6:00 AM to 6:29 AM (25, 58.1%) for males and 8:30 AM to 8:59 AM (13, 36.1%) for females.
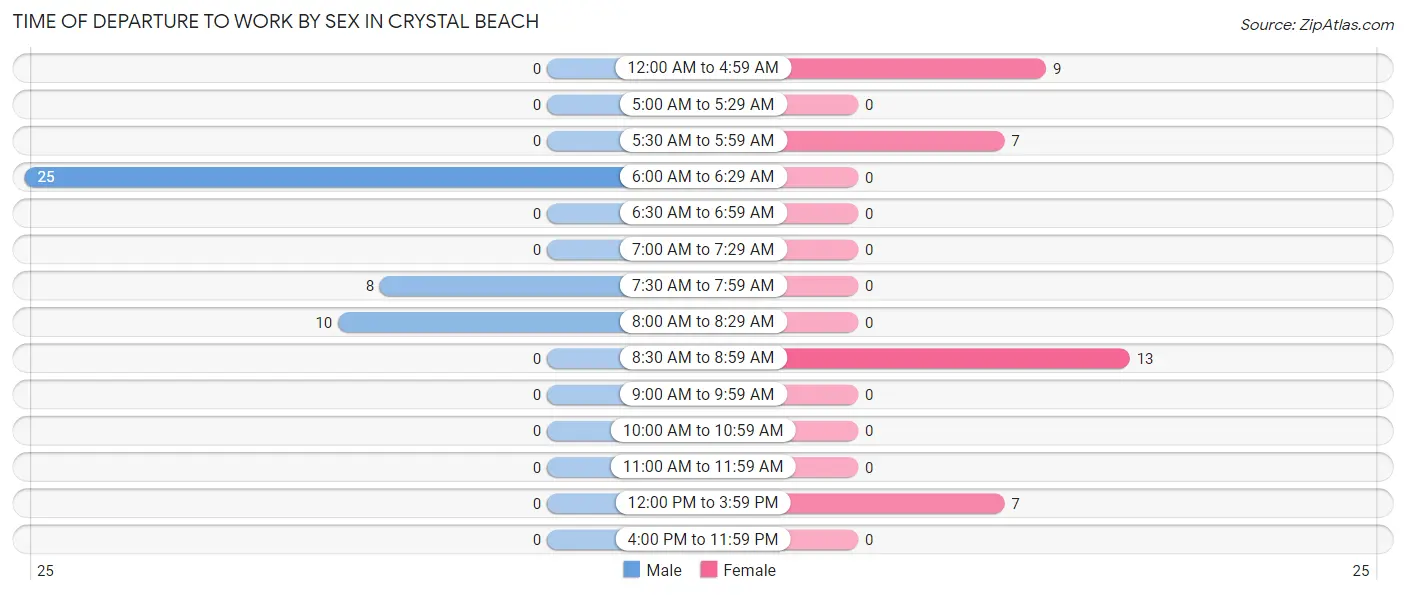
| Time of Departure | Male | Female |
| 12:00 AM to 4:59 AM | 0 (0.0%) | 9 (25.0%) |
| 5:00 AM to 5:29 AM | 0 (0.0%) | 0 (0.0%) |
| 5:30 AM to 5:59 AM | 0 (0.0%) | 7 (19.4%) |
| 6:00 AM to 6:29 AM | 25 (58.1%) | 0 (0.0%) |
| 6:30 AM to 6:59 AM | 0 (0.0%) | 0 (0.0%) |
| 7:00 AM to 7:29 AM | 0 (0.0%) | 0 (0.0%) |
| 7:30 AM to 7:59 AM | 8 (18.6%) | 0 (0.0%) |
| 8:00 AM to 8:29 AM | 10 (23.3%) | 0 (0.0%) |
| 8:30 AM to 8:59 AM | 0 (0.0%) | 13 (36.1%) |
| 9:00 AM to 9:59 AM | 0 (0.0%) | 0 (0.0%) |
| 10:00 AM to 10:59 AM | 0 (0.0%) | 0 (0.0%) |
| 11:00 AM to 11:59 AM | 0 (0.0%) | 0 (0.0%) |
| 12:00 PM to 3:59 PM | 0 (0.0%) | 7 (19.4%) |
| 4:00 PM to 11:59 PM | 0 (0.0%) | 0 (0.0%) |
| Total | 43 (100.0%) | 36 (100.0%) |
Housing Occupancy in Crystal Beach
Occupancy by Ownership in Crystal Beach
Of the total 157 dwellings in Crystal Beach, owner-occupied units account for 121 (77.1%), while renter-occupied units make up 36 (22.9%).
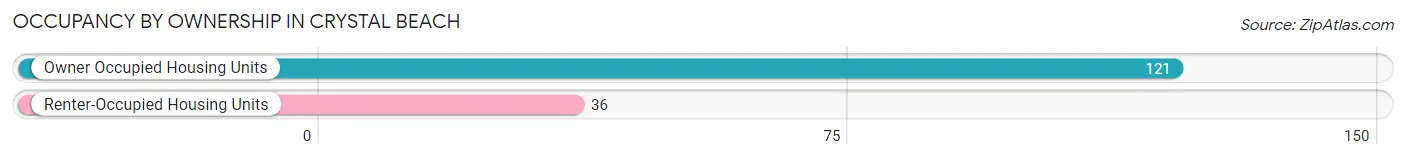
| Occupancy | # Housing Units | % Housing Units |
| Owner Occupied Housing Units | 121 | 77.1% |
| Renter-Occupied Housing Units | 36 | 22.9% |
| Total Occupied Housing Units | 157 | 100.0% |
Occupancy by Household Size in Crystal Beach
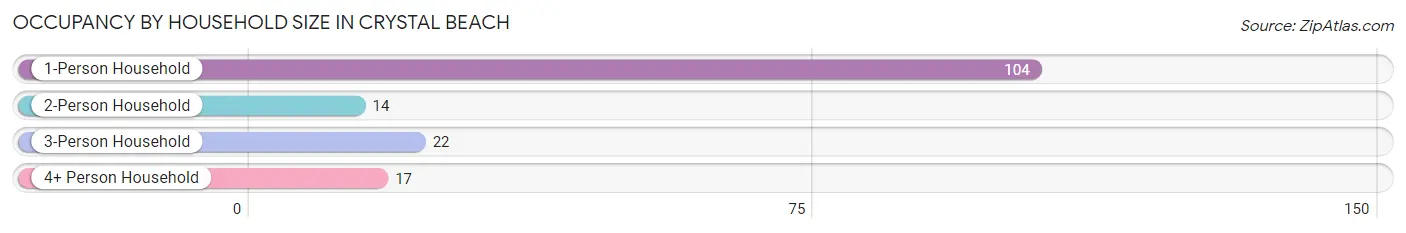
| Household Size | # Housing Units | % Housing Units |
| 1-Person Household | 104 | 66.2% |
| 2-Person Household | 14 | 8.9% |
| 3-Person Household | 22 | 14.0% |
| 4+ Person Household | 17 | 10.8% |
| Total Housing Units | 157 | 100.0% |
Occupancy by Ownership by Household Size in Crystal Beach
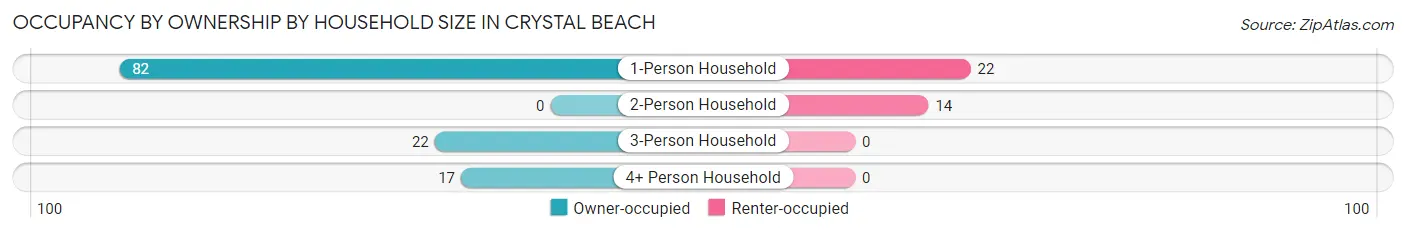
| Household Size | Owner-occupied | Renter-occupied |
| 1-Person Household | 82 (78.8%) | 22 (21.1%) |
| 2-Person Household | 0 (0.0%) | 14 (100.0%) |
| 3-Person Household | 22 (100.0%) | 0 (0.0%) |
| 4+ Person Household | 17 (100.0%) | 0 (0.0%) |
| Total Housing Units | 121 (77.1%) | 36 (22.9%) |
Occupancy by Educational Attainment in Crystal Beach
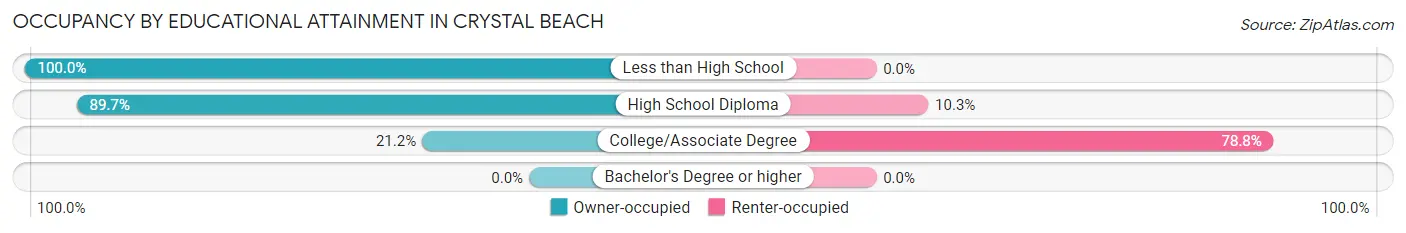
| Household Size | Owner-occupied | Renter-occupied |
| Less than High School | 27 (100.0%) | 0 (0.0%) |
| High School Diploma | 87 (89.7%) | 10 (10.3%) |
| College/Associate Degree | 7 (21.2%) | 26 (78.8%) |
| Bachelor's Degree or higher | 0 (0.0%) | 0 (0.0%) |
Occupancy by Age of Householder in Crystal Beach
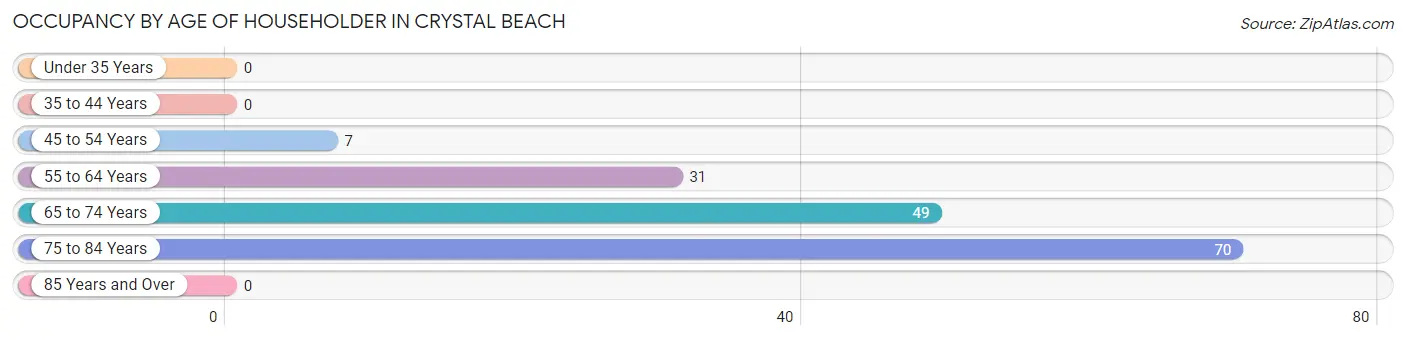
| Age Bracket | # Households | % Households |
| Under 35 Years | 0 | 0.0% |
| 35 to 44 Years | 0 | 0.0% |
| 45 to 54 Years | 7 | 4.5% |
| 55 to 64 Years | 31 | 19.8% |
| 65 to 74 Years | 49 | 31.2% |
| 75 to 84 Years | 70 | 44.6% |
| 85 Years and Over | 0 | 0.0% |
| Total | 157 | 100.0% |
Housing Finances in Crystal Beach
Median Income by Occupancy in Crystal Beach
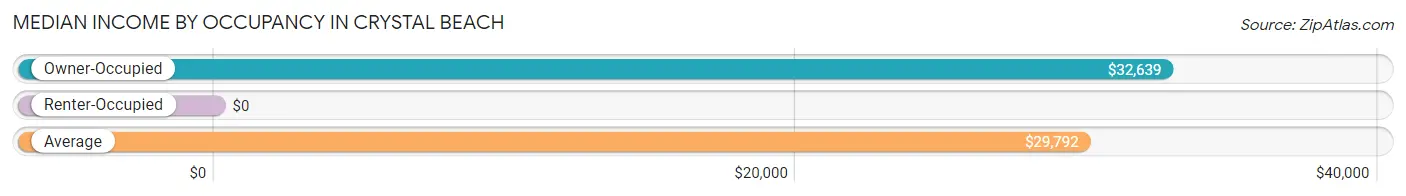
| Occupancy Type | # Households | Median Income |
| Owner-Occupied | 121 (77.1%) | $32,639 |
| Renter-Occupied | 36 (22.9%) | $0 |
| Average | 157 (100.0%) | $29,792 |
Occupancy by Householder Income Bracket in Crystal Beach
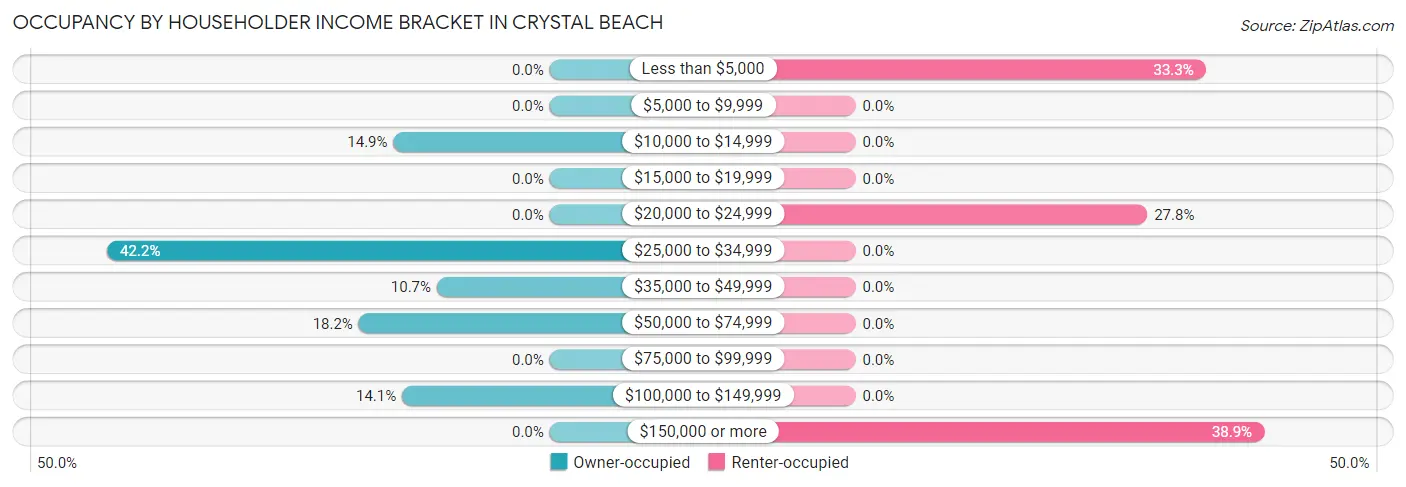
| Income Bracket | Owner-occupied | Renter-occupied |
| Less than $5,000 | 0 (0.0%) | 12 (33.3%) |
| $5,000 to $9,999 | 0 (0.0%) | 0 (0.0%) |
| $10,000 to $14,999 | 18 (14.9%) | 0 (0.0%) |
| $15,000 to $19,999 | 0 (0.0%) | 0 (0.0%) |
| $20,000 to $24,999 | 0 (0.0%) | 10 (27.8%) |
| $25,000 to $34,999 | 51 (42.1%) | 0 (0.0%) |
| $35,000 to $49,999 | 13 (10.7%) | 0 (0.0%) |
| $50,000 to $74,999 | 22 (18.2%) | 0 (0.0%) |
| $75,000 to $99,999 | 0 (0.0%) | 0 (0.0%) |
| $100,000 to $149,999 | 17 (14.1%) | 0 (0.0%) |
| $150,000 or more | 0 (0.0%) | 14 (38.9%) |
| Total | 121 (100.0%) | 36 (100.0%) |
Monthly Housing Cost Tiers in Crystal Beach
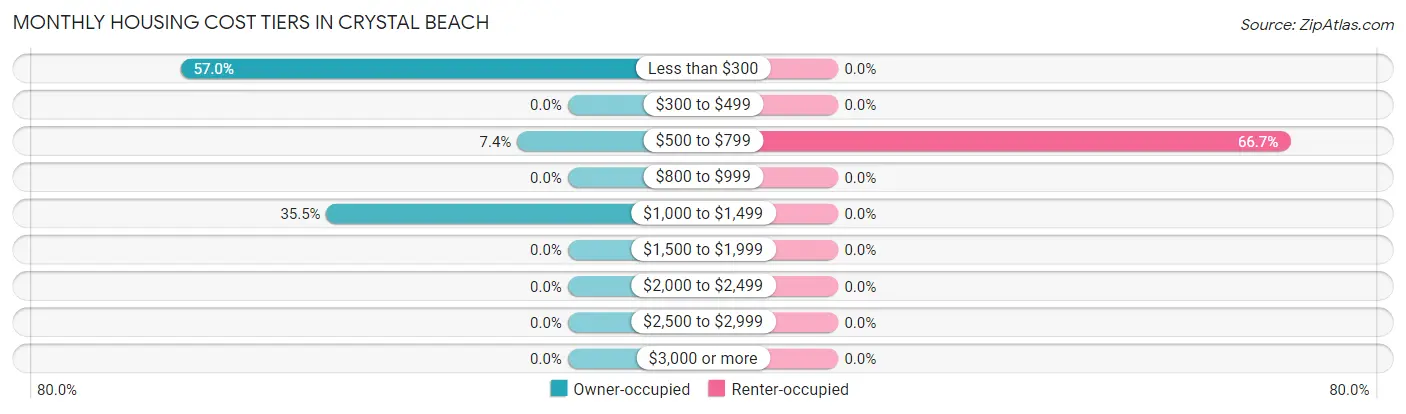
| Monthly Cost | Owner-occupied | Renter-occupied |
| Less than $300 | 69 (57.0%) | 0 (0.0%) |
| $300 to $499 | 0 (0.0%) | 0 (0.0%) |
| $500 to $799 | 9 (7.4%) | 24 (66.7%) |
| $800 to $999 | 0 (0.0%) | 0 (0.0%) |
| $1,000 to $1,499 | 43 (35.5%) | 0 (0.0%) |
| $1,500 to $1,999 | 0 (0.0%) | 0 (0.0%) |
| $2,000 to $2,499 | 0 (0.0%) | 0 (0.0%) |
| $2,500 to $2,999 | 0 (0.0%) | 0 (0.0%) |
| $3,000 or more | 0 (0.0%) | 0 (0.0%) |
| Total | 121 (100.0%) | 36 (100.0%) |
Physical Housing Characteristics in Crystal Beach
Housing Structures in Crystal Beach
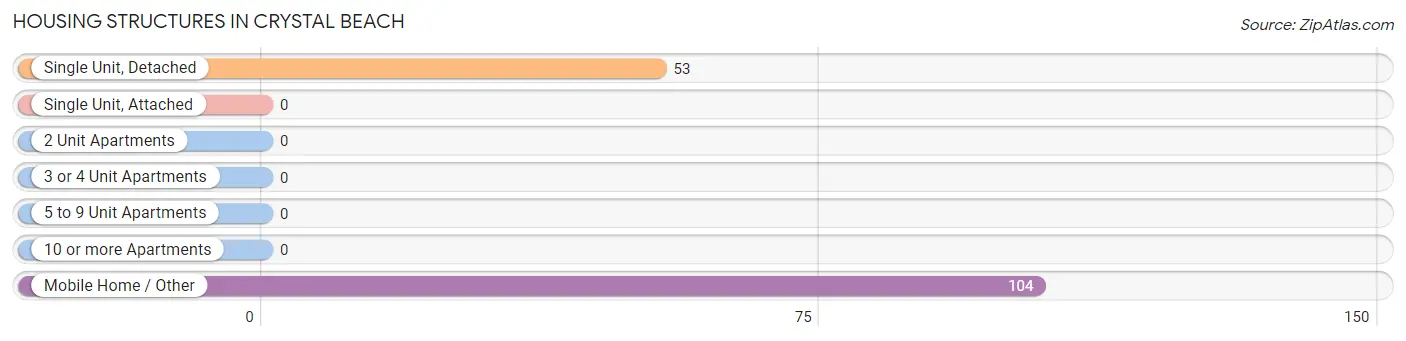
| Structure Type | # Housing Units | % Housing Units |
| Single Unit, Detached | 53 | 33.8% |
| Single Unit, Attached | 0 | 0.0% |
| 2 Unit Apartments | 0 | 0.0% |
| 3 or 4 Unit Apartments | 0 | 0.0% |
| 5 to 9 Unit Apartments | 0 | 0.0% |
| 10 or more Apartments | 0 | 0.0% |
| Mobile Home / Other | 104 | 66.2% |
| Total | 157 | 100.0% |
Housing Structures by Occupancy in Crystal Beach
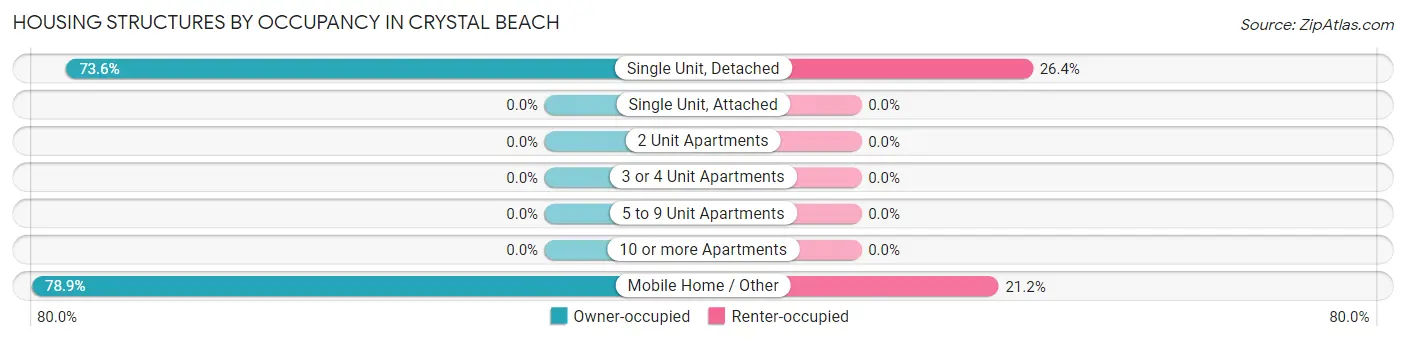
| Structure Type | Owner-occupied | Renter-occupied |
| Single Unit, Detached | 39 (73.6%) | 14 (26.4%) |
| Single Unit, Attached | 0 (0.0%) | 0 (0.0%) |
| 2 Unit Apartments | 0 (0.0%) | 0 (0.0%) |
| 3 or 4 Unit Apartments | 0 (0.0%) | 0 (0.0%) |
| 5 to 9 Unit Apartments | 0 (0.0%) | 0 (0.0%) |
| 10 or more Apartments | 0 (0.0%) | 0 (0.0%) |
| Mobile Home / Other | 82 (78.8%) | 22 (21.1%) |
| Total | 121 (77.1%) | 36 (22.9%) |
Housing Structures by Number of Rooms in Crystal Beach
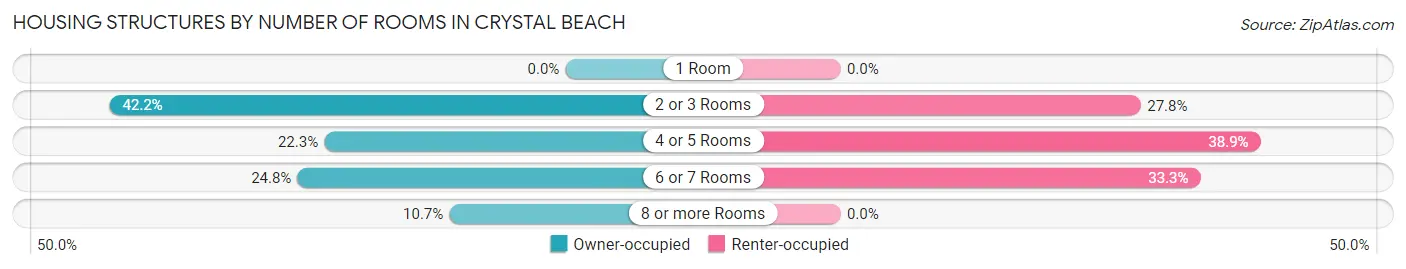
| Number of Rooms | Owner-occupied | Renter-occupied |
| 1 Room | 0 (0.0%) | 0 (0.0%) |
| 2 or 3 Rooms | 51 (42.1%) | 10 (27.8%) |
| 4 or 5 Rooms | 27 (22.3%) | 14 (38.9%) |
| 6 or 7 Rooms | 30 (24.8%) | 12 (33.3%) |
| 8 or more Rooms | 13 (10.7%) | 0 (0.0%) |
| Total | 121 (100.0%) | 36 (100.0%) |
Housing Structure by Heating Type in Crystal Beach
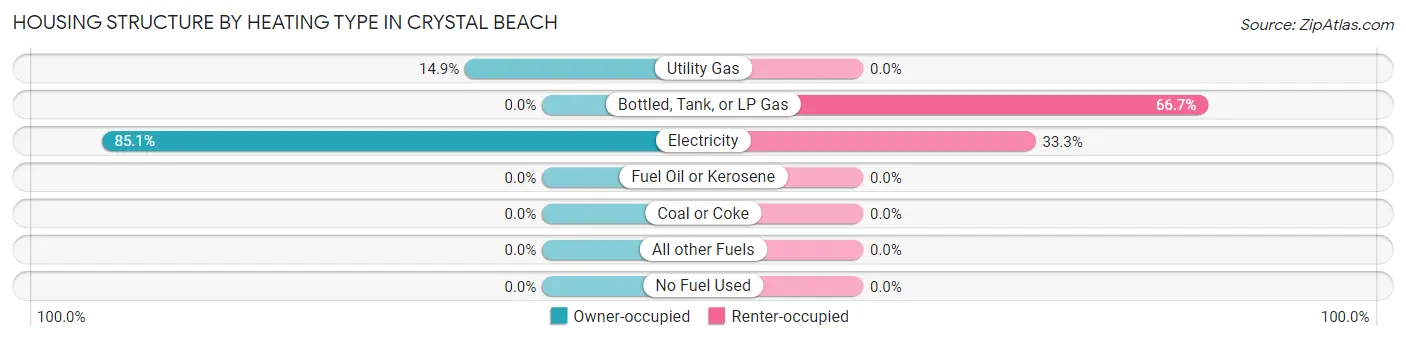
| Heating Type | Owner-occupied | Renter-occupied |
| Utility Gas | 18 (14.9%) | 0 (0.0%) |
| Bottled, Tank, or LP Gas | 0 (0.0%) | 24 (66.7%) |
| Electricity | 103 (85.1%) | 12 (33.3%) |
| Fuel Oil or Kerosene | 0 (0.0%) | 0 (0.0%) |
| Coal or Coke | 0 (0.0%) | 0 (0.0%) |
| All other Fuels | 0 (0.0%) | 0 (0.0%) |
| No Fuel Used | 0 (0.0%) | 0 (0.0%) |
| Total | 121 (100.0%) | 36 (100.0%) |
Household Vehicle Usage in Crystal Beach
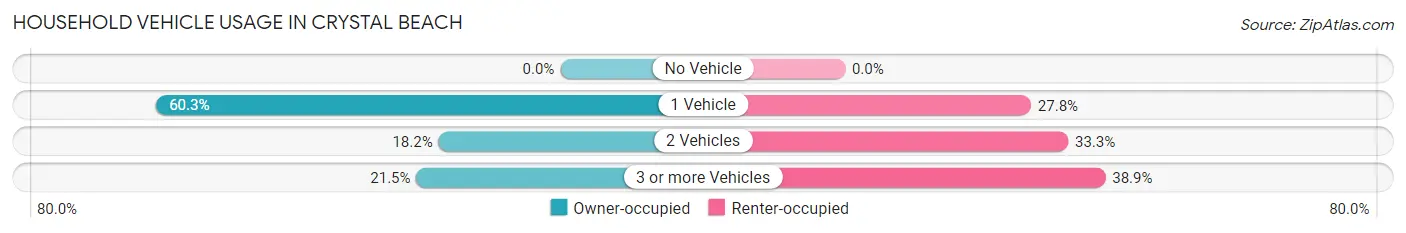
| Vehicles per Household | Owner-occupied | Renter-occupied |
| No Vehicle | 0 (0.0%) | 0 (0.0%) |
| 1 Vehicle | 73 (60.3%) | 10 (27.8%) |
| 2 Vehicles | 22 (18.2%) | 12 (33.3%) |
| 3 or more Vehicles | 26 (21.5%) | 14 (38.9%) |
| Total | 121 (100.0%) | 36 (100.0%) |
Real Estate & Mortgages in Crystal Beach
Real Estate and Mortgage Overview in Crystal Beach
| Characteristic | Without Mortgage | With Mortgage |
| Housing Units | 78 | 43 |
| Median Property Value | $9,999 | $0 |
| Median Household Income | $28,750 | $0 |
| Monthly Housing Costs | $99 | $0 |
| Real Estate Taxes | - | - |
Property Value by Mortgage Status in Crystal Beach
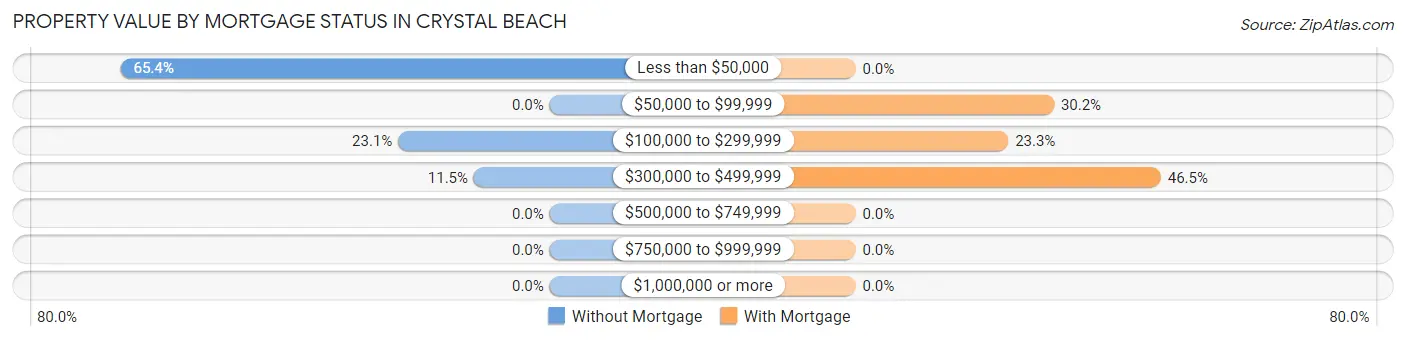
| Property Value | Without Mortgage | With Mortgage |
| Less than $50,000 | 51 (65.4%) | 0 (0.0%) |
| $50,000 to $99,999 | 0 (0.0%) | 13 (30.2%) |
| $100,000 to $299,999 | 18 (23.1%) | 10 (23.3%) |
| $300,000 to $499,999 | 9 (11.5%) | 20 (46.5%) |
| $500,000 to $749,999 | 0 (0.0%) | 0 (0.0%) |
| $750,000 to $999,999 | 0 (0.0%) | 0 (0.0%) |
| $1,000,000 or more | 0 (0.0%) | 0 (0.0%) |
| Total | 78 (100.0%) | 43 (100.0%) |
Household Income by Mortgage Status in Crystal Beach
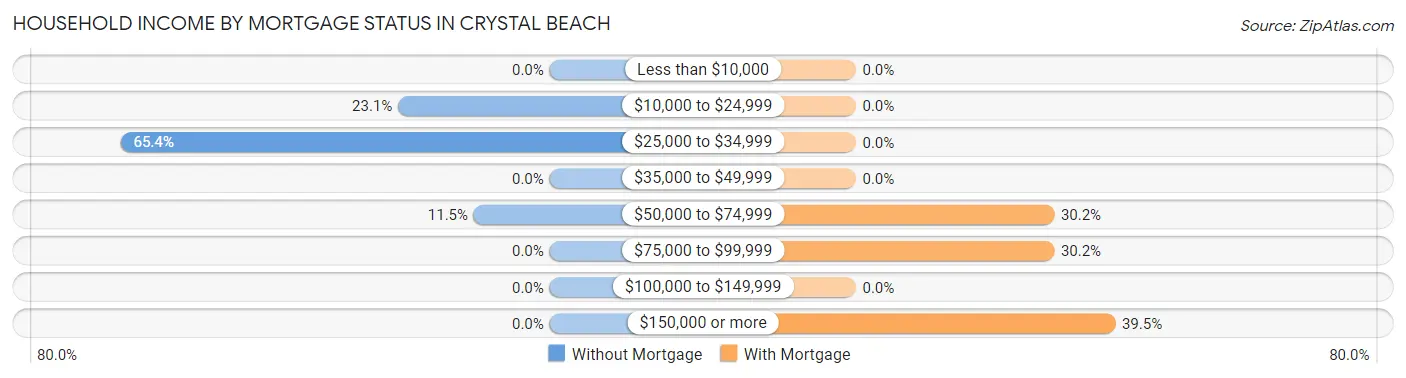
| Household Income | Without Mortgage | With Mortgage |
| Less than $10,000 | 0 (0.0%) | 0 (0.0%) |
| $10,000 to $24,999 | 18 (23.1%) | 0 (0.0%) |
| $25,000 to $34,999 | 51 (65.4%) | 0 (0.0%) |
| $35,000 to $49,999 | 0 (0.0%) | 0 (0.0%) |
| $50,000 to $74,999 | 9 (11.5%) | 13 (30.2%) |
| $75,000 to $99,999 | 0 (0.0%) | 13 (30.2%) |
| $100,000 to $149,999 | 0 (0.0%) | 0 (0.0%) |
| $150,000 or more | 0 (0.0%) | 17 (39.5%) |
| Total | 78 (100.0%) | 43 (100.0%) |
Property Value to Household Income Ratio in Crystal Beach
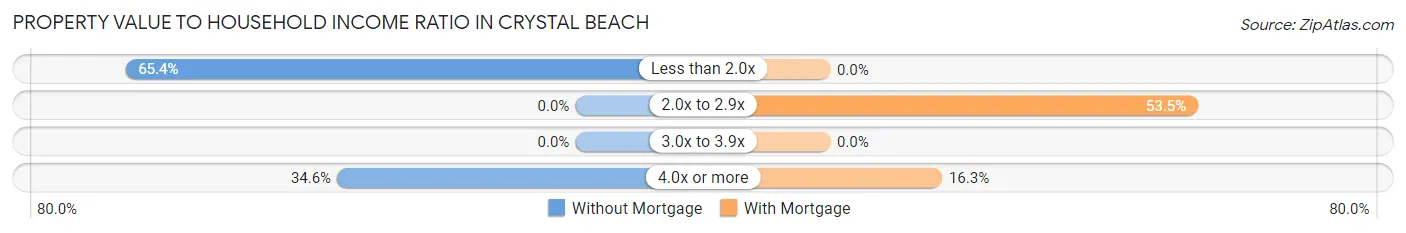
| Value-to-Income Ratio | Without Mortgage | With Mortgage |
| Less than 2.0x | 51 (65.4%) | 0 (0.0%) |
| 2.0x to 2.9x | 0 (0.0%) | 23 (53.5%) |
| 3.0x to 3.9x | 0 (0.0%) | 0 (0.0%) |
| 4.0x or more | 27 (34.6%) | 7 (16.3%) |
| Total | 78 (100.0%) | 43 (100.0%) |
Real Estate Taxes by Mortgage Status in Crystal Beach
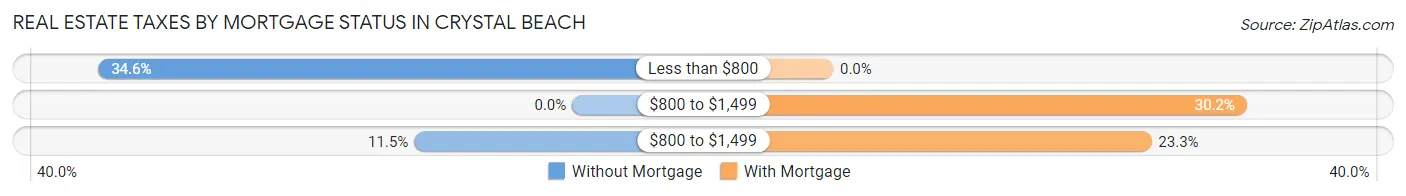
| Property Taxes | Without Mortgage | With Mortgage |
| Less than $800 | 27 (34.6%) | 0 (0.0%) |
| $800 to $1,499 | 0 (0.0%) | 13 (30.2%) |
| $800 to $1,499 | 9 (11.5%) | 10 (23.3%) |
| Total | 78 (100.0%) | 43 (100.0%) |
Health & Disability in Crystal Beach
Health Insurance Coverage by Age in Crystal Beach
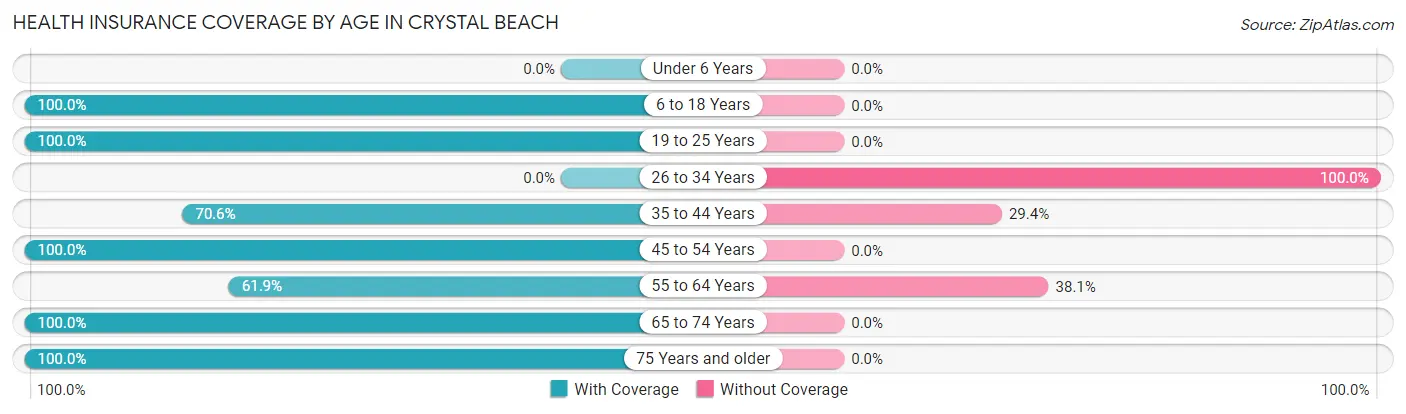
| Age Bracket | With Coverage | Without Coverage |
| Under 6 Years | 0 (0.0%) | 0 (0.0%) |
| 6 to 18 Years | 7 (100.0%) | 0 (0.0%) |
| 19 to 25 Years | 8 (100.0%) | 0 (0.0%) |
| 26 to 34 Years | 0 (0.0%) | 13 (100.0%) |
| 35 to 44 Years | 24 (70.6%) | 10 (29.4%) |
| 45 to 54 Years | 15 (100.0%) | 0 (0.0%) |
| 55 to 64 Years | 39 (61.9%) | 24 (38.1%) |
| 65 to 74 Years | 63 (100.0%) | 0 (0.0%) |
| 75 Years and older | 79 (100.0%) | 0 (0.0%) |
| Total | 235 (83.3%) | 47 (16.7%) |
Health Insurance Coverage by Citizenship Status in Crystal Beach
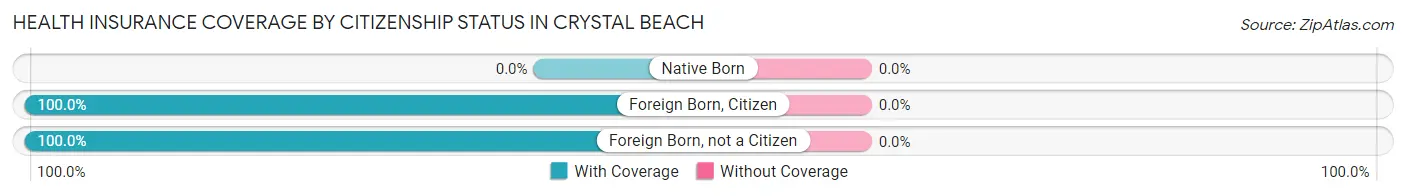
| Citizenship Status | With Coverage | Without Coverage |
| Native Born | 0 (0.0%) | 0 (0.0%) |
| Foreign Born, Citizen | 7 (100.0%) | 0 (0.0%) |
| Foreign Born, not a Citizen | 8 (100.0%) | 0 (0.0%) |
Health Insurance Coverage by Household Income in Crystal Beach
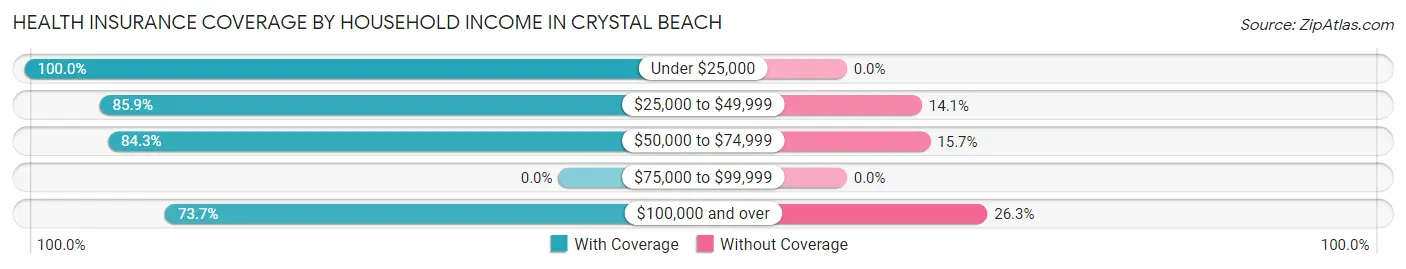
| Household Income | With Coverage | Without Coverage |
| Under $25,000 | 40 (100.0%) | 0 (0.0%) |
| $25,000 to $49,999 | 55 (85.9%) | 9 (14.1%) |
| $50,000 to $74,999 | 70 (84.3%) | 13 (15.7%) |
| $75,000 to $99,999 | 0 (0.0%) | 0 (0.0%) |
| $100,000 and over | 70 (73.7%) | 25 (26.3%) |
Public vs Private Health Insurance Coverage by Age in Crystal Beach
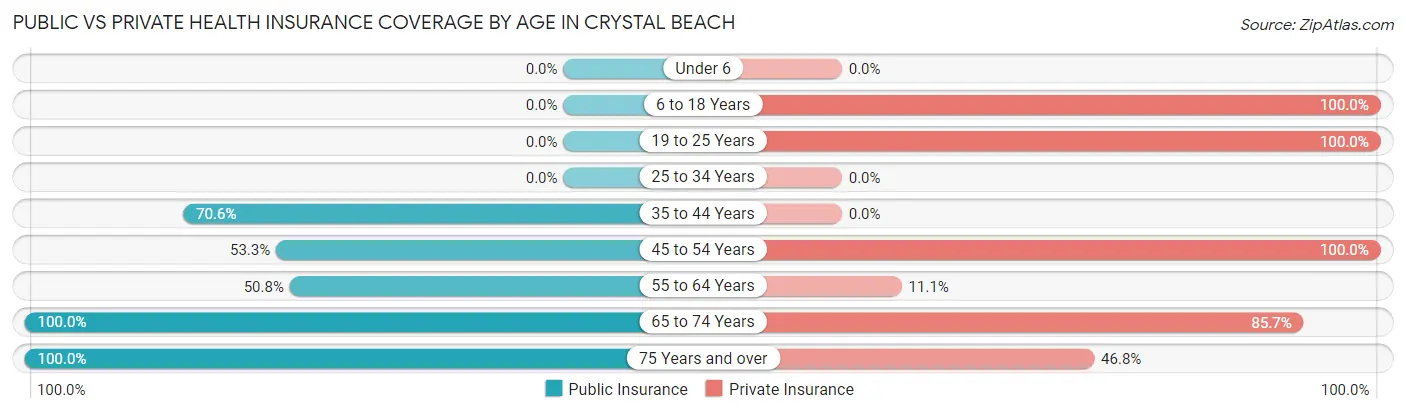
| Age Bracket | Public Insurance | Private Insurance |
| Under 6 | 0 (0.0%) | 0 (0.0%) |
| 6 to 18 Years | 0 (0.0%) | 7 (100.0%) |
| 19 to 25 Years | 0 (0.0%) | 8 (100.0%) |
| 25 to 34 Years | 0 (0.0%) | 0 (0.0%) |
| 35 to 44 Years | 24 (70.6%) | 0 (0.0%) |
| 45 to 54 Years | 8 (53.3%) | 15 (100.0%) |
| 55 to 64 Years | 32 (50.8%) | 7 (11.1%) |
| 65 to 74 Years | 63 (100.0%) | 54 (85.7%) |
| 75 Years and over | 79 (100.0%) | 37 (46.8%) |
| Total | 206 (73.1%) | 128 (45.4%) |
Disability Status by Sex by Age in Crystal Beach
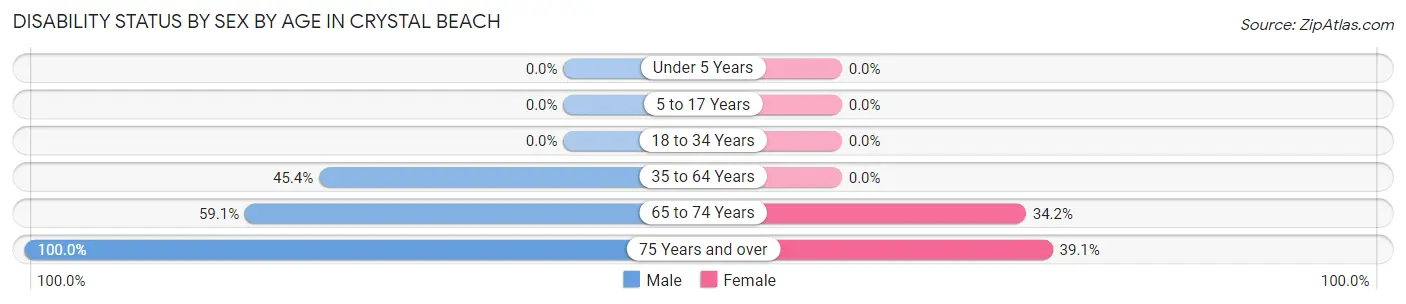
| Age Bracket | Male | Female |
| Under 5 Years | 0 (0.0%) | 0 (0.0%) |
| 5 to 17 Years | 0 (0.0%) | 0 (0.0%) |
| 18 to 34 Years | 0 (0.0%) | 0 (0.0%) |
| 35 to 64 Years | 39 (45.4%) | 0 (0.0%) |
| 65 to 74 Years | 13 (59.1%) | 14 (34.2%) |
| 75 Years and over | 10 (100.0%) | 27 (39.1%) |
Disability Class by Sex by Age in Crystal Beach
Disability Class: Hearing Difficulty
| Age Bracket | Male | Female |
| Under 5 Years | 0 (0.0%) | 0 (0.0%) |
| 5 to 17 Years | 0 (0.0%) | 0 (0.0%) |
| 18 to 34 Years | 0 (0.0%) | 0 (0.0%) |
| 35 to 64 Years | 0 (0.0%) | 0 (0.0%) |
| 65 to 74 Years | 0 (0.0%) | 0 (0.0%) |
| 75 Years and over | 0 (0.0%) | 0 (0.0%) |
Disability Class: Vision Difficulty
| Age Bracket | Male | Female |
| Under 5 Years | 0 (0.0%) | 0 (0.0%) |
| 5 to 17 Years | 0 (0.0%) | 0 (0.0%) |
| 18 to 34 Years | 0 (0.0%) | 0 (0.0%) |
| 35 to 64 Years | 0 (0.0%) | 0 (0.0%) |
| 65 to 74 Years | 0 (0.0%) | 0 (0.0%) |
| 75 Years and over | 0 (0.0%) | 0 (0.0%) |
Disability Class: Cognitive Difficulty
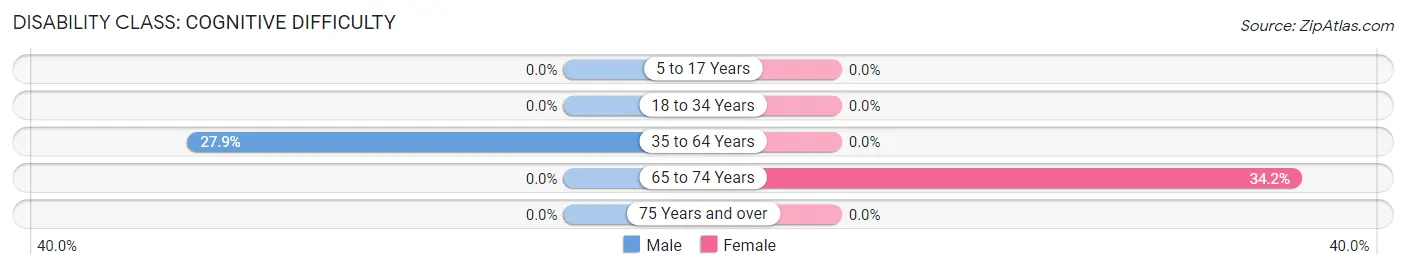
| Age Bracket | Male | Female |
| 5 to 17 Years | 0 (0.0%) | 0 (0.0%) |
| 18 to 34 Years | 0 (0.0%) | 0 (0.0%) |
| 35 to 64 Years | 24 (27.9%) | 0 (0.0%) |
| 65 to 74 Years | 0 (0.0%) | 14 (34.2%) |
| 75 Years and over | 0 (0.0%) | 0 (0.0%) |
Disability Class: Ambulatory Difficulty
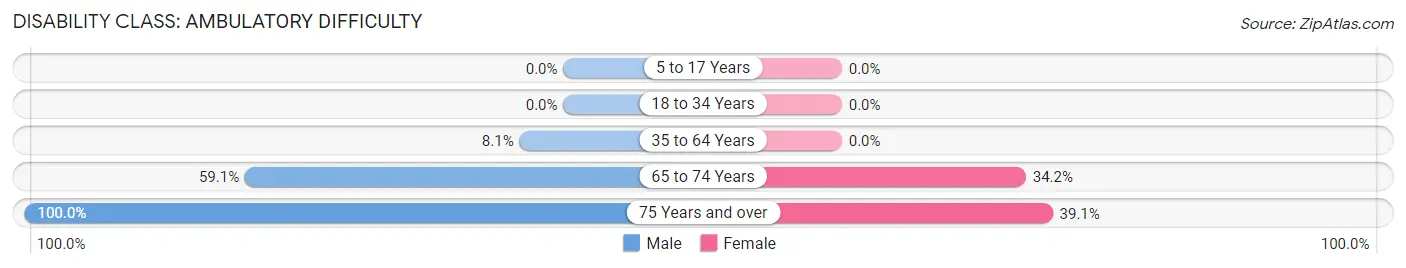
| Age Bracket | Male | Female |
| 5 to 17 Years | 0 (0.0%) | 0 (0.0%) |
| 18 to 34 Years | 0 (0.0%) | 0 (0.0%) |
| 35 to 64 Years | 7 (8.1%) | 0 (0.0%) |
| 65 to 74 Years | 13 (59.1%) | 14 (34.2%) |
| 75 Years and over | 10 (100.0%) | 27 (39.1%) |
Disability Class: Self-Care Difficulty
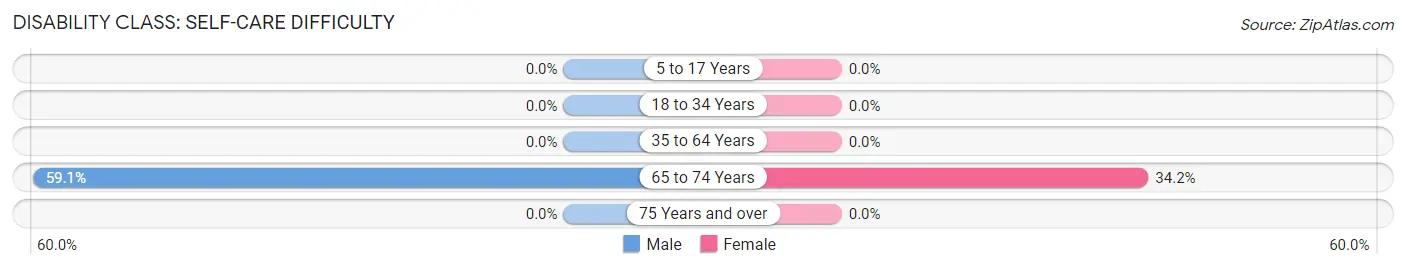
| Age Bracket | Male | Female |
| 5 to 17 Years | 0 (0.0%) | 0 (0.0%) |
| 18 to 34 Years | 0 (0.0%) | 0 (0.0%) |
| 35 to 64 Years | 0 (0.0%) | 0 (0.0%) |
| 65 to 74 Years | 13 (59.1%) | 14 (34.2%) |
| 75 Years and over | 0 (0.0%) | 0 (0.0%) |
Technology Access in Crystal Beach
Computing Device Access in Crystal Beach
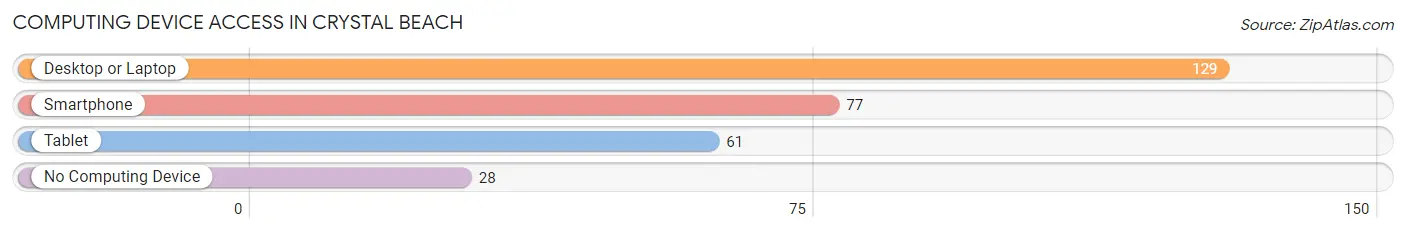
| Device Type | # Households | % Households |
| Desktop or Laptop | 129 | 82.2% |
| Smartphone | 77 | 49.0% |
| Tablet | 61 | 38.9% |
| No Computing Device | 28 | 17.8% |
| Total | 157 | 100.0% |
Internet Access in Crystal Beach
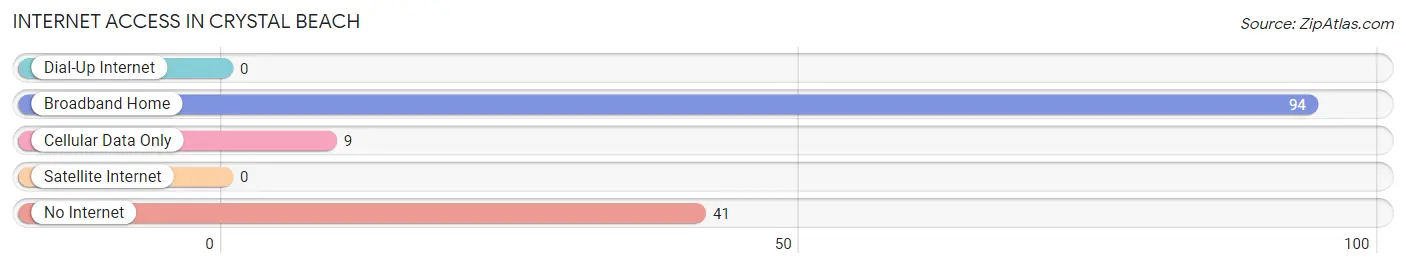
| Internet Type | # Households | % Households |
| Dial-Up Internet | 0 | 0.0% |
| Broadband Home | 94 | 59.9% |
| Cellular Data Only | 9 | 5.7% |
| Satellite Internet | 0 | 0.0% |
| No Internet | 41 | 26.1% |
| Total | 157 | 100.0% |
Crystal Beach Summary
History
Crystal Beach is a small unincorporated community located in Yuma County, Arizona. It is situated on the Colorado River, just south of the California border. The area was first settled in the late 1800s by a group of Mormon settlers who were looking for a place to establish a new community. The settlers named the area Crystal Beach after the crystal clear waters of the Colorado River.
The area was initially used for farming and ranching, but in the early 1900s, the area began to attract tourists who were looking for a place to relax and enjoy the scenery. The area quickly became a popular destination for fishing, boating, and camping.
In the 1950s, the area began to attract more visitors as the popularity of recreational vehicles increased. The area was also popular with snowbirds who would come to the area during the winter months.
In the late 1970s, the area began to experience a population boom as people from all over the country moved to the area to take advantage of the warm climate and beautiful scenery. The population of Crystal Beach has continued to grow since then, and today the area is home to a diverse population of people from all walks of life.
Geography
Crystal Beach is located in Yuma County, Arizona, on the Colorado River. The area is situated on the western edge of the Sonoran Desert, and is surrounded by the Gila Mountains to the east and the Chocolate Mountains to the west. The area is known for its hot, dry climate and its stunning views of the Colorado River.
The area is home to a variety of wildlife, including coyotes, bobcats, javelinas, and a variety of birds. The area is also home to a variety of plant life, including cacti, mesquite, and creosote bushes.
Economy
The economy of Crystal Beach is largely based on tourism. The area is a popular destination for fishing, boating, and camping, and is also home to a variety of restaurants, bars, and other businesses that cater to tourists.
The area is also home to a number of agricultural businesses, including farms and ranches. The area is also home to a number of manufacturing businesses, including a factory that produces solar panels.
Demographics
As of the 2010 census, the population of Crystal Beach was 1,845. The population is largely made up of white (77.3%) and Hispanic (17.2%) residents. The median household income in the area is $37,917, and the median age is 37.
Conclusion
Crystal Beach is a small unincorporated community located in Yuma County, Arizona. It is situated on the Colorado River, just south of the California border. The area was first settled in the late 1800s by a group of Mormon settlers who were looking for a place to establish a new community. The area is known for its hot, dry climate and its stunning views of the Colorado River. The economy of Crystal Beach is largely based on tourism, and the area is home to a diverse population of people from all walks of life.
Common Questions
What is Per Capita Income in Crystal Beach?
Per Capita income in Crystal Beach is $32,469.
What is the Median Family Income in Crystal Beach?
Median Family Income in Crystal Beach is $145,500.
What is the Median Household income in Crystal Beach?
Median Household Income in Crystal Beach is $29,792.
What is Inequality or Gini Index in Crystal Beach?
Inequality or Gini Index in Crystal Beach is 0.50.
What is the Total Population of Crystal Beach?
Total Population of Crystal Beach is 282.
What is the Total Male Population of Crystal Beach?
Total Male Population of Crystal Beach is 126.
What is the Total Female Population of Crystal Beach?
Total Female Population of Crystal Beach is 156.
What is the Ratio of Males per 100 Females in Crystal Beach?
There are 80.77 Males per 100 Females in Crystal Beach.
What is the Ratio of Females per 100 Males in Crystal Beach?
There are 123.81 Females per 100 Males in Crystal Beach.
What is the Median Population Age in Crystal Beach?
Median Population Age in Crystal Beach is 65.1 Years.
What is the Average Family Size in Crystal Beach
Average Family Size in Crystal Beach is 3.3 People.
What is the Average Household Size in Crystal Beach
Average Household Size in Crystal Beach is 1.8 People.
How Large is the Labor Force in Crystal Beach?
There are 104 People in the Labor Forcein in Crystal Beach.
What is the Percentage of People in the Labor Force in Crystal Beach?
36.9% of People are in the Labor Force in Crystal Beach.
What is the Unemployment Rate in Crystal Beach?
Unemployment Rate in Crystal Beach is 11.5%.