Kino Springs, AZ Map & Demographics
Kino Springs Map
Kino Springs Overview
$24,203
PER CAPITA INCOME
$38,750
AVG FAMILY INCOME
$43,846
AVG HOUSEHOLD INCOME
0.31
INEQUALITY / GINI INDEX
154
TOTAL POPULATION
80
MALE POPULATION
74
FEMALE POPULATION
108.11
MALES / 100 FEMALES
92.50
FEMALES / 100 MALES
49.6
MEDIAN AGE
2.5
AVG FAMILY SIZE
2.1
AVG HOUSEHOLD SIZE
54
LABOR FORCE [ PEOPLE ]
41.9%
PERCENT IN LABOR FORCE
14.8%
UNEMPLOYMENT RATE
Income in Kino Springs
Income Overview in Kino Springs
Per Capita Income in Kino Springs is $24,203, while median incomes of families and households are $38,750 and $43,846 respectively.
| Characteristic | Number | Measure |
| Per Capita Income | 154 | $24,203 |
| Median Family Income | 52 | $38,750 |
| Mean Family Income | 52 | $47,548 |
| Median Household Income | 72 | $43,846 |
| Mean Household Income | 72 | $55,228 |
| Income Deficit | 52 | $0 |
| Wage / Income Gap (%) | 154 | 0.00% |
| Wage / Income Gap ($) | 154 | 100.00¢ per $1 |
| Gini / Inequality Index | 154 | 0.31 |
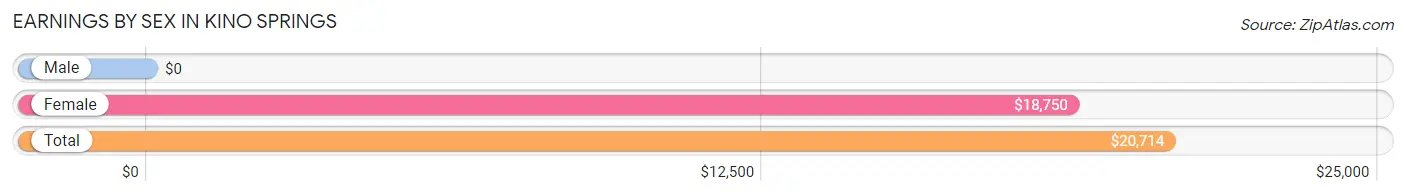
Earnings by Sex in Kino Springs
| Sex | Number | Average Earnings |
| Male | 18 (39.1%) | $0 |
| Female | 28 (60.9%) | $18,750 |
| Total | 46 (100.0%) | $20,714 |
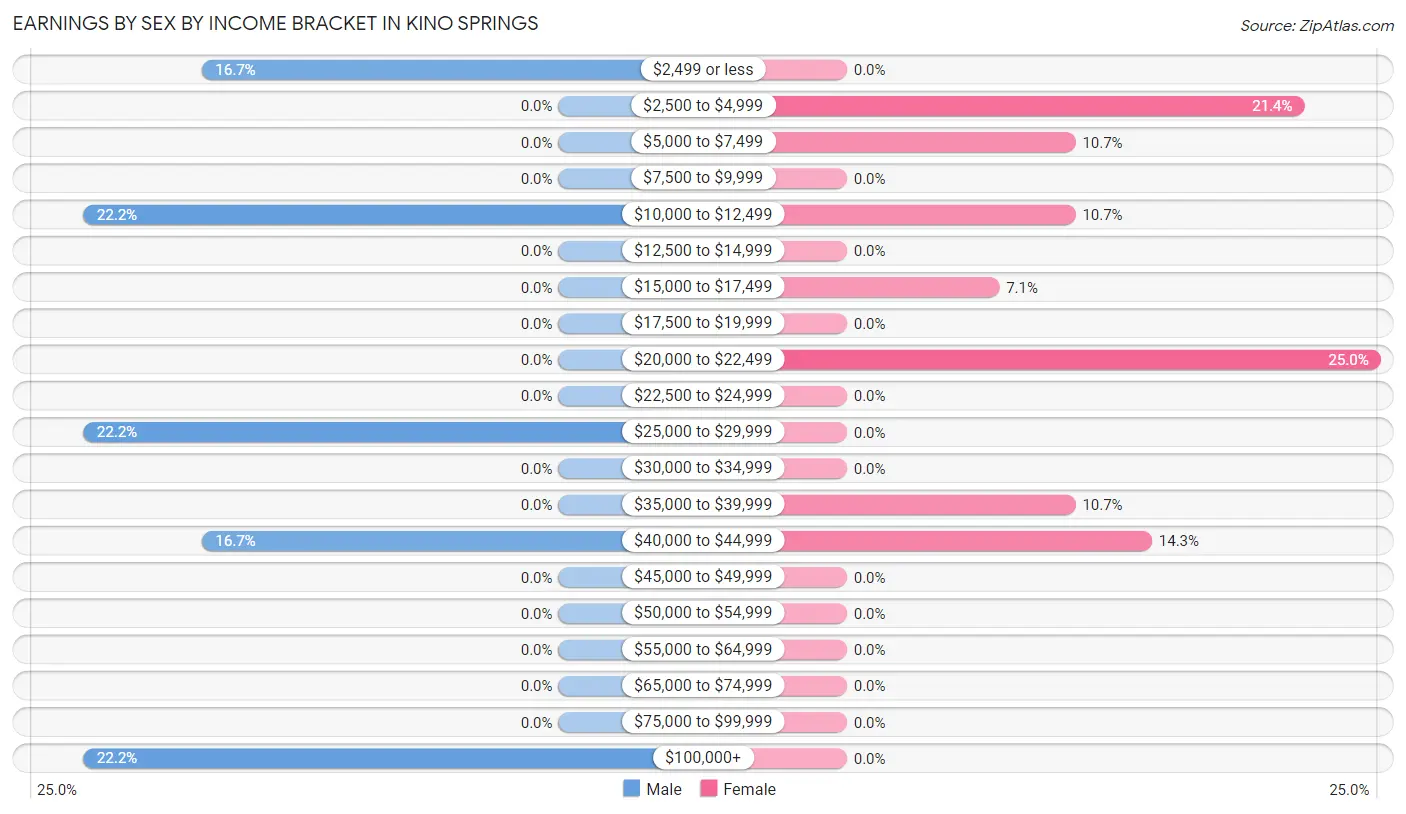
Earnings by Sex by Income Bracket in Kino Springs
The most common earnings brackets in Kino Springs are $10,000 to $12,499 for men (4 | 22.2%) and $20,000 to $22,499 for women (7 | 25.0%).
| Income | Male | Female |
| $2,499 or less | 3 (16.7%) | 0 (0.0%) |
| $2,500 to $4,999 | 0 (0.0%) | 6 (21.4%) |
| $5,000 to $7,499 | 0 (0.0%) | 3 (10.7%) |
| $7,500 to $9,999 | 0 (0.0%) | 0 (0.0%) |
| $10,000 to $12,499 | 4 (22.2%) | 3 (10.7%) |
| $12,500 to $14,999 | 0 (0.0%) | 0 (0.0%) |
| $15,000 to $17,499 | 0 (0.0%) | 2 (7.1%) |
| $17,500 to $19,999 | 0 (0.0%) | 0 (0.0%) |
| $20,000 to $22,499 | 0 (0.0%) | 7 (25.0%) |
| $22,500 to $24,999 | 0 (0.0%) | 0 (0.0%) |
| $25,000 to $29,999 | 4 (22.2%) | 0 (0.0%) |
| $30,000 to $34,999 | 0 (0.0%) | 0 (0.0%) |
| $35,000 to $39,999 | 0 (0.0%) | 3 (10.7%) |
| $40,000 to $44,999 | 3 (16.7%) | 4 (14.3%) |
| $45,000 to $49,999 | 0 (0.0%) | 0 (0.0%) |
| $50,000 to $54,999 | 0 (0.0%) | 0 (0.0%) |
| $55,000 to $64,999 | 0 (0.0%) | 0 (0.0%) |
| $65,000 to $74,999 | 0 (0.0%) | 0 (0.0%) |
| $75,000 to $99,999 | 0 (0.0%) | 0 (0.0%) |
| $100,000+ | 4 (22.2%) | 0 (0.0%) |
| Total | 18 (100.0%) | 28 (100.0%) |
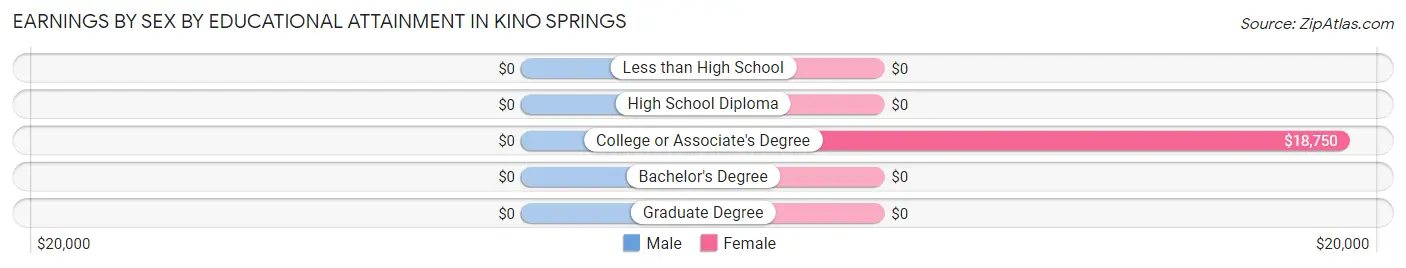
Earnings by Sex by Educational Attainment in Kino Springs
| Educational Attainment | Male Income | Female Income |
| Less than High School | - | - |
| High School Diploma | - | - |
| College or Associate's Degree | - | - |
| Bachelor's Degree | - | - |
| Graduate Degree | - | - |
| Total | - | - |
Family Income in Kino Springs
Family Income Brackets in Kino Springs
According to the Kino Springs family income data, there are 19 families falling into the $35,000 to $49,999 income range, which is the most common income bracket and makes up 36.5% of all families.
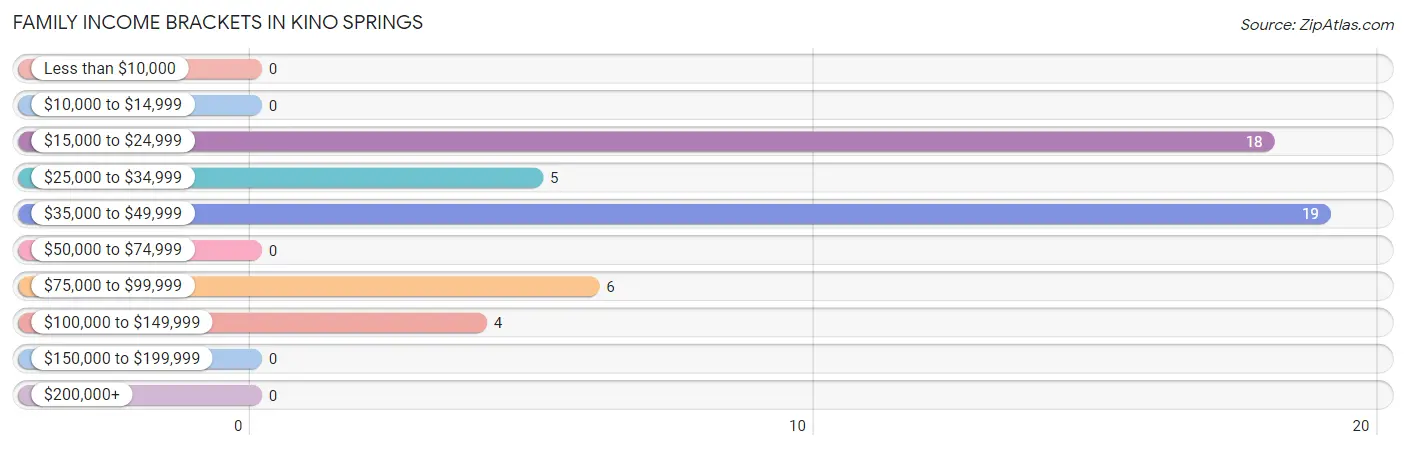
| Income Bracket | # Families | % Families |
| Less than $10,000 | 0 | 0.0% |
| $10,000 to $14,999 | 0 | 0.0% |
| $15,000 to $24,999 | 18 | 34.6% |
| $25,000 to $34,999 | 5 | 9.6% |
| $35,000 to $49,999 | 19 | 36.5% |
| $50,000 to $74,999 | 0 | 0.0% |
| $75,000 to $99,999 | 6 | 11.5% |
| $100,000 to $149,999 | 4 | 7.7% |
| $150,000 to $199,999 | 0 | 0.0% |
| $200,000+ | 0 | 0.0% |
Family Income by Famaliy Size in Kino Springs
2-person families (32 | 61.5%) account for the highest median family income in Kino Springs with $24,722 per family, while 2-person families (32 | 61.5%) have the highest median income of $12,361 per family member.
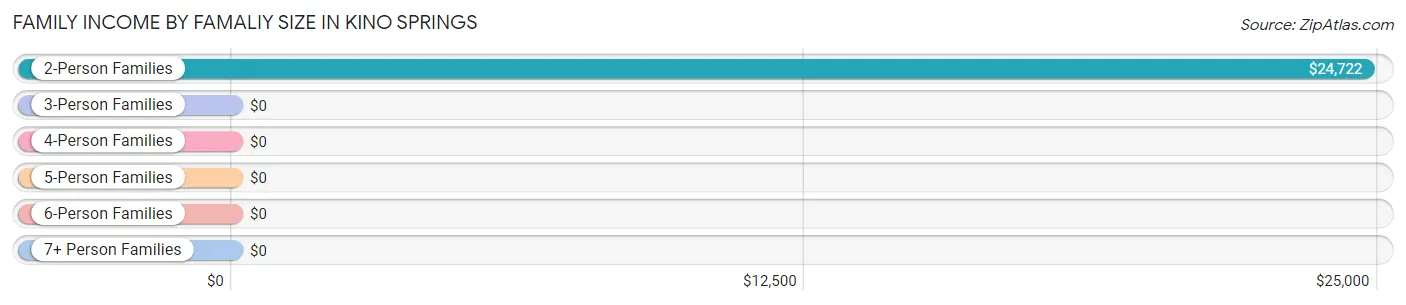
| Income Bracket | # Families | Median Income |
| 2-Person Families | 32 (61.5%) | $24,722 |
| 3-Person Families | 9 (17.3%) | $0 |
| 4-Person Families | 7 (13.5%) | $0 |
| 5-Person Families | 4 (7.7%) | $0 |
| 6-Person Families | 0 (0.0%) | $0 |
| 7+ Person Families | 0 (0.0%) | $0 |
| Total | 52 (100.0%) | $38,750 |
Family Income by Number of Earners in Kino Springs
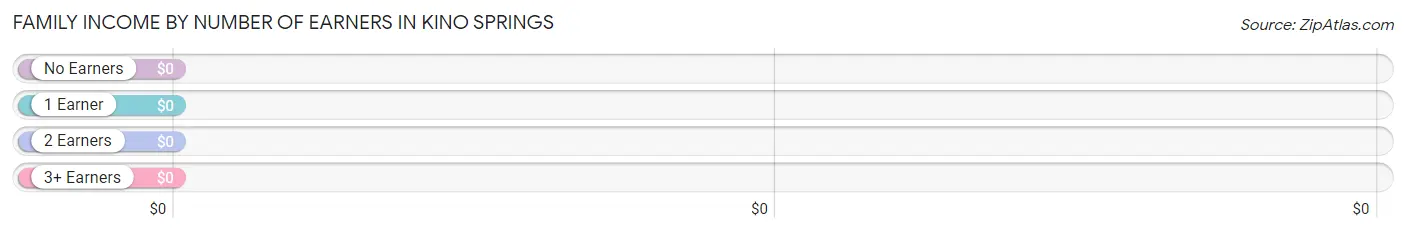
| Number of Earners | # Families | Median Income |
| No Earners | 29 (55.8%) | $0 |
| 1 Earner | 10 (19.2%) | $0 |
| 2 Earners | 10 (19.2%) | $0 |
| 3+ Earners | 3 (5.8%) | $0 |
| Total | 52 (100.0%) | $38,750 |
Household Income in Kino Springs
Household Income Brackets in Kino Springs
With 26 households falling in the category, the $35,000 to $49,999 income range is the most frequent in Kino Springs, accounting for 36.1% of all households.
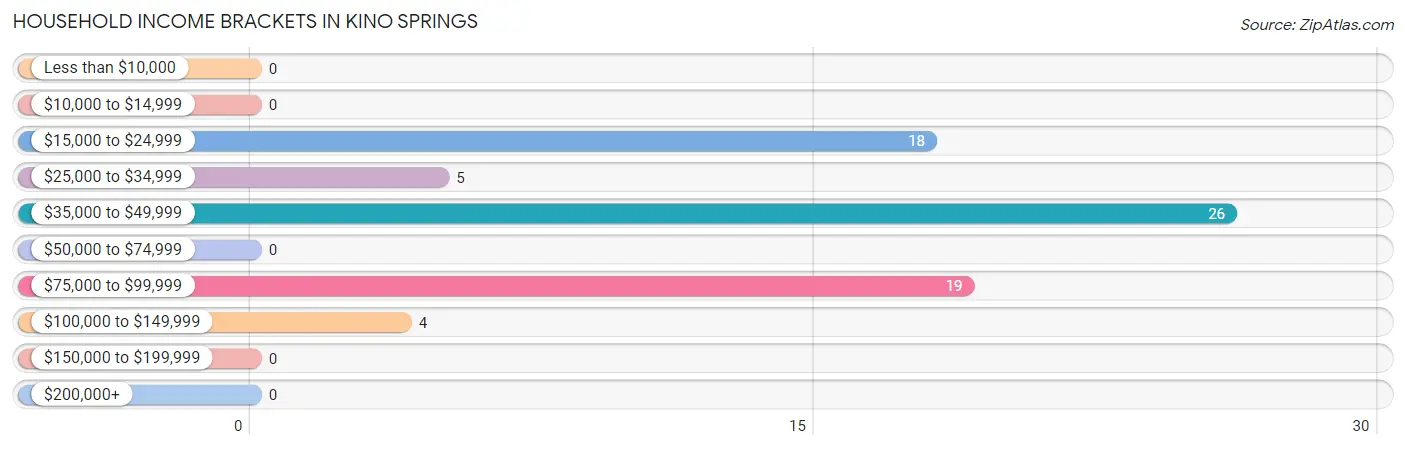
| Income Bracket | # Households | % Households |
| Less than $10,000 | 0 | 0.0% |
| $10,000 to $14,999 | 0 | 0.0% |
| $15,000 to $24,999 | 18 | 25.0% |
| $25,000 to $34,999 | 5 | 6.9% |
| $35,000 to $49,999 | 26 | 36.1% |
| $50,000 to $74,999 | 0 | 0.0% |
| $75,000 to $99,999 | 19 | 26.4% |
| $100,000 to $149,999 | 4 | 5.6% |
| $150,000 to $199,999 | 0 | 0.0% |
| $200,000+ | 0 | 0.0% |
Household Income by Householder Age in Kino Springs
The median household income in Kino Springs is $43,846, with the highest median household income of $45,313 found in the 65+ years age bracket for the primary householder. A total of 19 households (26.4%) fall into this category.
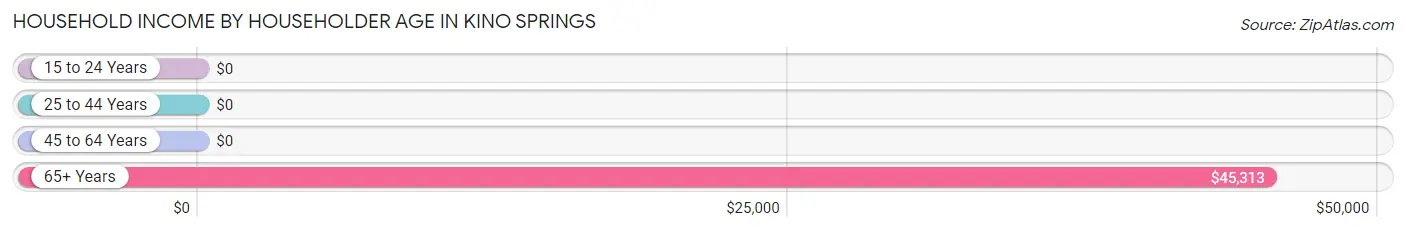
| Income Bracket | # Households | Median Income |
| 15 to 24 Years | 0 (0.0%) | $0 |
| 25 to 44 Years | 4 (5.6%) | $0 |
| 45 to 64 Years | 49 (68.1%) | $0 |
| 65+ Years | 19 (26.4%) | $45,313 |
| Total | 72 (100.0%) | $43,846 |
Poverty in Kino Springs
Income Below Poverty by Sex and Age in Kino Springs
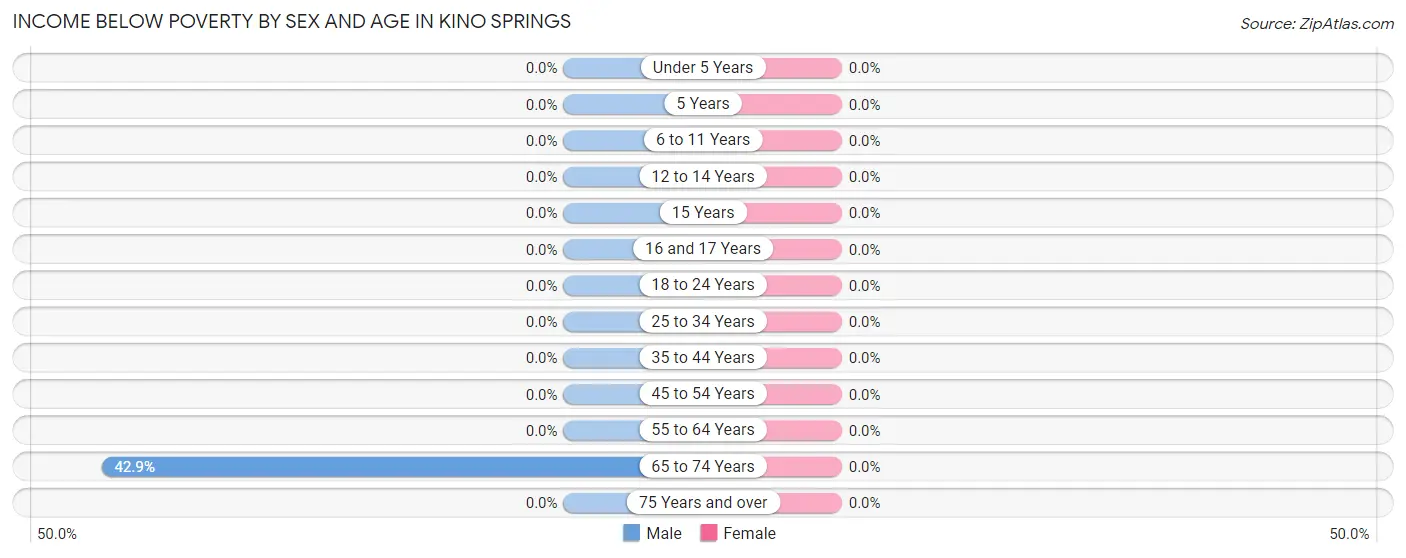
| Age Bracket | Male | Female |
| Under 5 Years | 0 (0.0%) | 0 (0.0%) |
| 5 Years | 0 (0.0%) | 0 (0.0%) |
| 6 to 11 Years | 0 (0.0%) | 0 (0.0%) |
| 12 to 14 Years | 0 (0.0%) | 0 (0.0%) |
| 15 Years | 0 (0.0%) | 0 (0.0%) |
| 16 and 17 Years | 0 (0.0%) | 0 (0.0%) |
| 18 to 24 Years | 0 (0.0%) | 0 (0.0%) |
| 25 to 34 Years | 0 (0.0%) | 0 (0.0%) |
| 35 to 44 Years | 0 (0.0%) | 0 (0.0%) |
| 45 to 54 Years | 0 (0.0%) | 0 (0.0%) |
| 55 to 64 Years | 0 (0.0%) | 0 (0.0%) |
| 65 to 74 Years | 3 (42.9%) | 0 (0.0%) |
| 75 Years and over | 0 (0.0%) | 0 (0.0%) |
| Total | 3 (3.7%) | 0 (0.0%) |
Income Above Poverty by Sex and Age in Kino Springs
According to the poverty statistics in Kino Springs, males aged 6 to 11 years and females aged 16 and 17 years are the age groups that are most secure financially, with 100.0% of males and 100.0% of females in these age groups living above the poverty line.
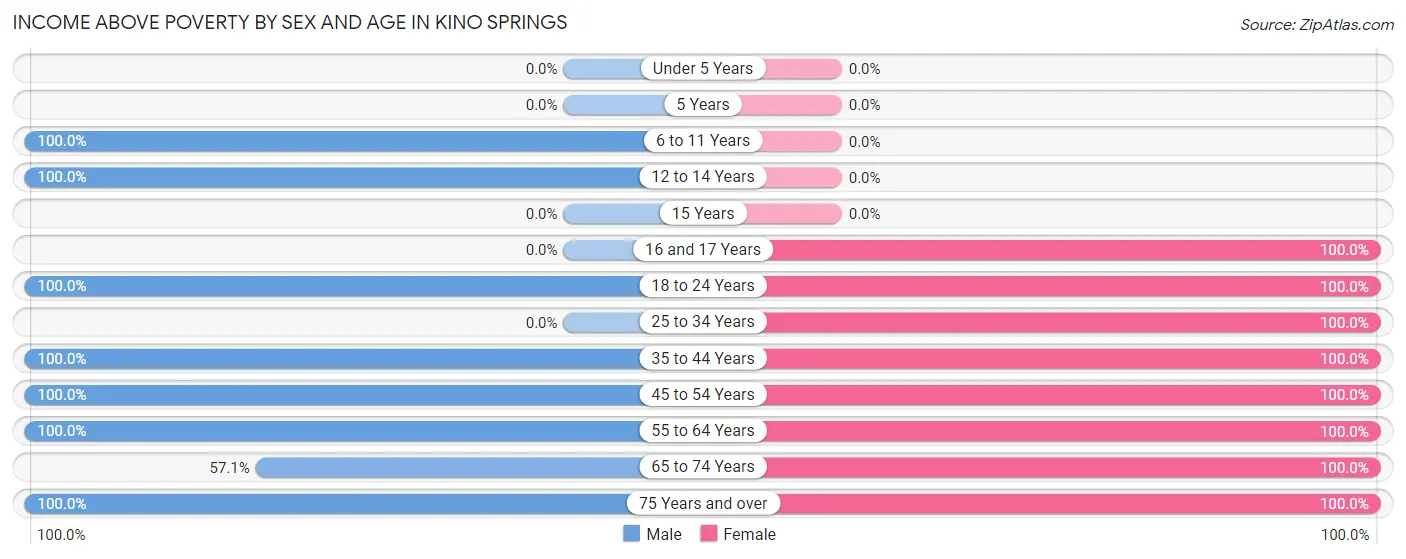
| Age Bracket | Male | Female |
| Under 5 Years | 0 (0.0%) | 0 (0.0%) |
| 5 Years | 0 (0.0%) | 0 (0.0%) |
| 6 to 11 Years | 16 (100.0%) | 0 (0.0%) |
| 12 to 14 Years | 9 (100.0%) | 0 (0.0%) |
| 15 Years | 0 (0.0%) | 0 (0.0%) |
| 16 and 17 Years | 0 (0.0%) | 4 (100.0%) |
| 18 to 24 Years | 6 (100.0%) | 3 (100.0%) |
| 25 to 34 Years | 0 (0.0%) | 8 (100.0%) |
| 35 to 44 Years | 4 (100.0%) | 19 (100.0%) |
| 45 to 54 Years | 4 (100.0%) | 26 (100.0%) |
| 55 to 64 Years | 22 (100.0%) | 8 (100.0%) |
| 65 to 74 Years | 4 (57.1%) | 4 (100.0%) |
| 75 Years and over | 12 (100.0%) | 2 (100.0%) |
| Total | 77 (96.3%) | 74 (100.0%) |
Income Below Poverty Among Married-Couple Families in Kino Springs
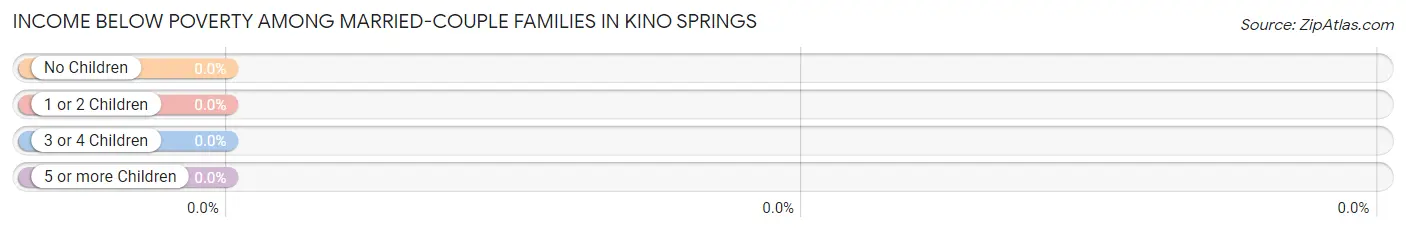
| Children | Above Poverty | Below Poverty |
| No Children | 20 (100.0%) | 0 (0.0%) |
| 1 or 2 Children | 13 (100.0%) | 0 (0.0%) |
| 3 or 4 Children | 0 (0.0%) | 0 (0.0%) |
| 5 or more Children | 0 (0.0%) | 0 (0.0%) |
| Total | 33 (100.0%) | 0 (0.0%) |
Income Below Poverty Among Single-Parent Households in Kino Springs
| Children | Single Father | Single Mother |
| No Children | 0 (0.0%) | 0 (0.0%) |
| 1 or 2 Children | 0 (0.0%) | 0 (0.0%) |
| 3 or 4 Children | 0 (0.0%) | 0 (0.0%) |
| 5 or more Children | 0 (0.0%) | 0 (0.0%) |
| Total | 0 (0.0%) | 0 (0.0%) |
Income Below Poverty Among Married-Couple vs Single-Parent Households in Kino Springs
| Children | Married-Couple Families | Single-Parent Households |
| No Children | 0 (0.0%) | 0 (0.0%) |
| 1 or 2 Children | 0 (0.0%) | 0 (0.0%) |
| 3 or 4 Children | 0 (0.0%) | 0 (0.0%) |
| 5 or more Children | 0 (0.0%) | 0 (0.0%) |
| Total | 0 (0.0%) | 0 (0.0%) |
Race in Kino Springs
The most populous races in Kino Springs are Hispanic or Latino (104 | 67.5%), White / Caucasian (92 | 59.7%), and Two or more Races (49 | 31.8%).
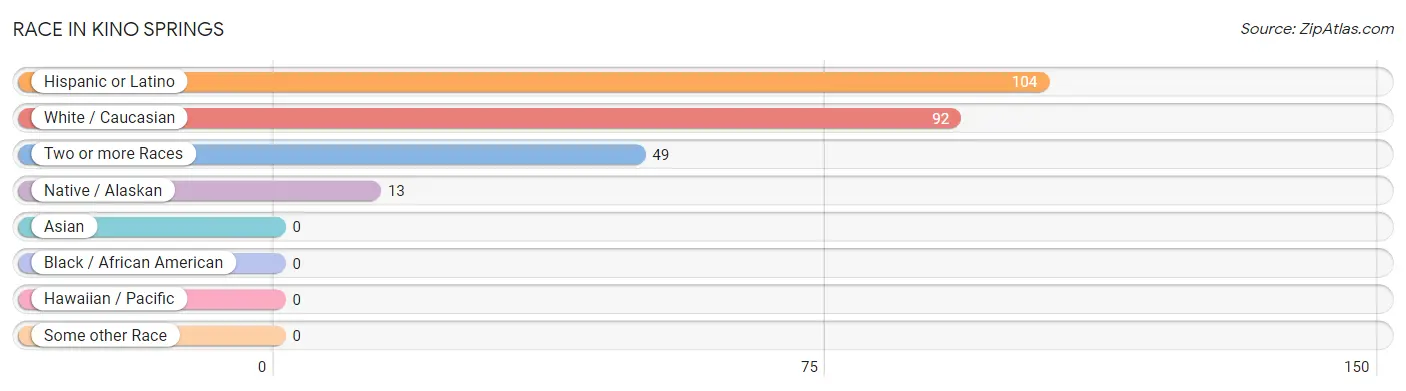
| Race | # Population | % Population |
| Asian | 0 | 0.0% |
| Black / African American | 0 | 0.0% |
| Hawaiian / Pacific | 0 | 0.0% |
| Hispanic or Latino | 104 | 67.5% |
| Native / Alaskan | 13 | 8.4% |
| White / Caucasian | 92 | 59.7% |
| Two or more Races | 49 | 31.8% |
| Some other Race | 0 | 0.0% |
| Total | 154 | 100.0% |
Ancestry in Kino Springs
The most populous ancestries reported in Kino Springs are Mexican (96 | 62.3%), Dutch (18 | 11.7%), Irish (16 | 10.4%), English (9 | 5.8%), and Swiss (4 | 2.6%), together accounting for 92.9% of all Kino Springs residents.
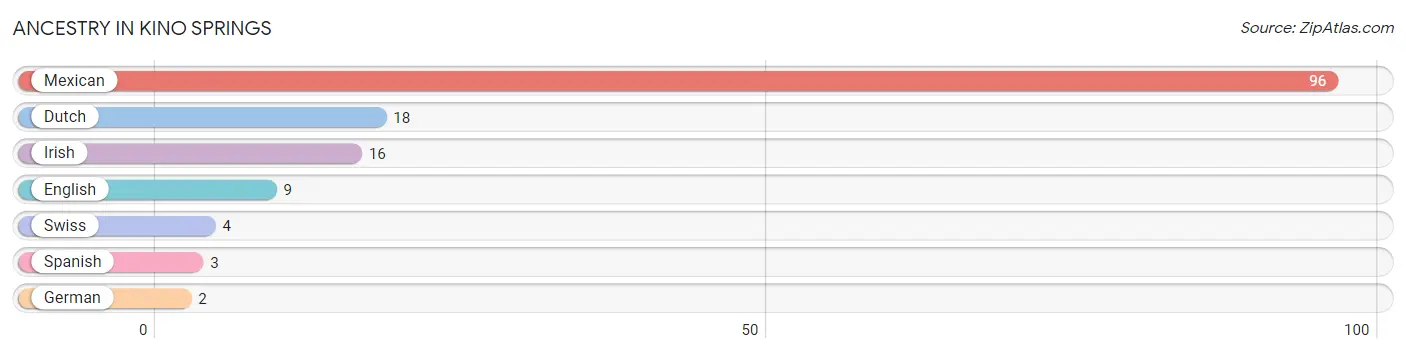
| Ancestry | # Population | % Population |
| Dutch | 18 | 11.7% |
| English | 9 | 5.8% |
| German | 2 | 1.3% |
| Irish | 16 | 10.4% |
| Mexican | 96 | 62.3% |
| Spanish | 3 | 1.9% |
| Swiss | 4 | 2.6% | View All 7 Rows |
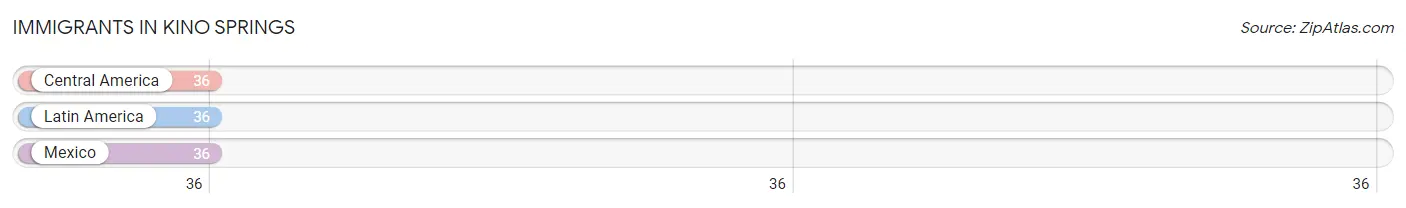
Immigrants in Kino Springs
The most numerous immigrant groups reported in Kino Springs came from Central America (36 | 23.4%), Latin America (36 | 23.4%), and Mexico (36 | 23.4%), together accounting for 70.1% of all Kino Springs residents.
| Immigration Origin | # Population | % Population |
| Central America | 36 | 23.4% |
| Latin America | 36 | 23.4% |
| Mexico | 36 | 23.4% | View All 3 Rows |
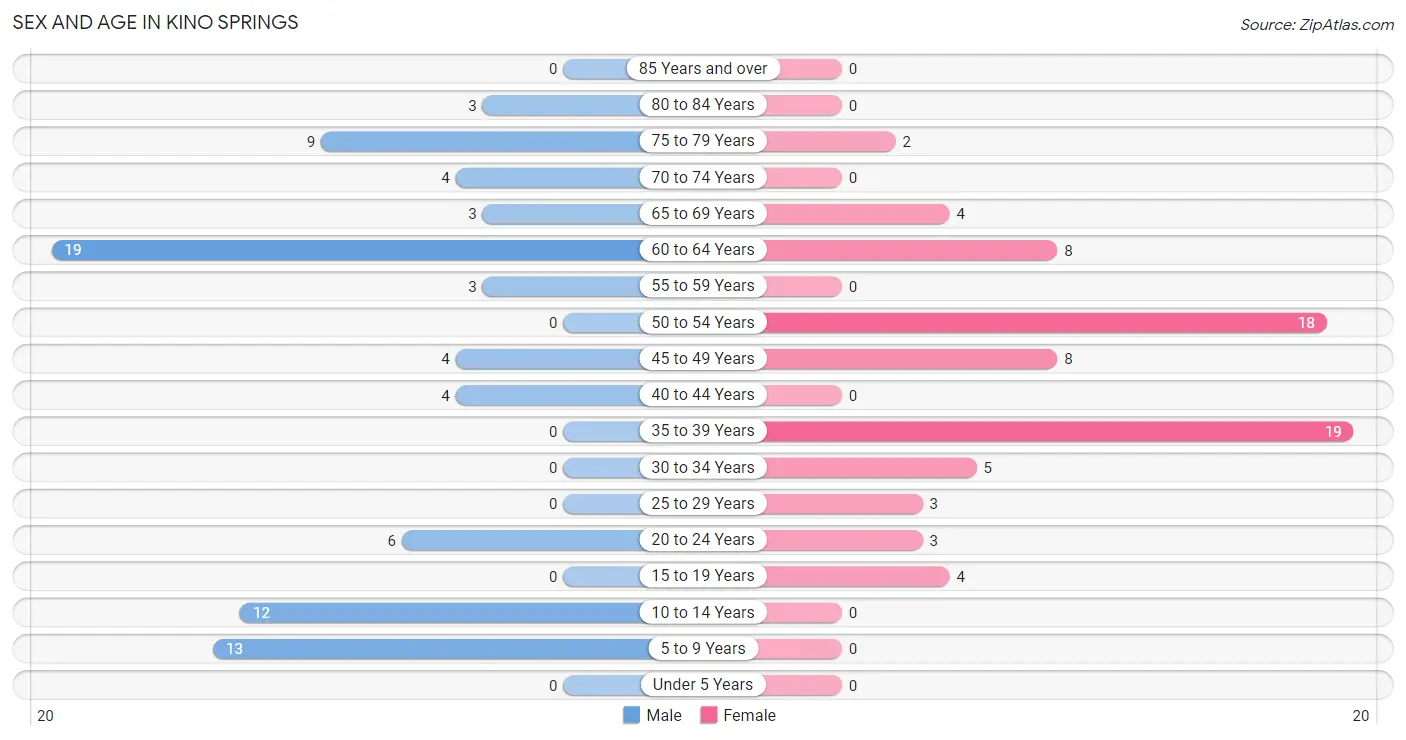
Sex and Age in Kino Springs
Sex and Age in Kino Springs
The most populous age groups in Kino Springs are 60 to 64 Years (19 | 23.7%) for men and 35 to 39 Years (19 | 25.7%) for women.
| Age Bracket | Male | Female |
| Under 5 Years | 0 (0.0%) | 0 (0.0%) |
| 5 to 9 Years | 13 (16.3%) | 0 (0.0%) |
| 10 to 14 Years | 12 (15.0%) | 0 (0.0%) |
| 15 to 19 Years | 0 (0.0%) | 4 (5.4%) |
| 20 to 24 Years | 6 (7.5%) | 3 (4.1%) |
| 25 to 29 Years | 0 (0.0%) | 3 (4.1%) |
| 30 to 34 Years | 0 (0.0%) | 5 (6.8%) |
| 35 to 39 Years | 0 (0.0%) | 19 (25.7%) |
| 40 to 44 Years | 4 (5.0%) | 0 (0.0%) |
| 45 to 49 Years | 4 (5.0%) | 8 (10.8%) |
| 50 to 54 Years | 0 (0.0%) | 18 (24.3%) |
| 55 to 59 Years | 3 (3.7%) | 0 (0.0%) |
| 60 to 64 Years | 19 (23.7%) | 8 (10.8%) |
| 65 to 69 Years | 3 (3.7%) | 4 (5.4%) |
| 70 to 74 Years | 4 (5.0%) | 0 (0.0%) |
| 75 to 79 Years | 9 (11.3%) | 2 (2.7%) |
| 80 to 84 Years | 3 (3.7%) | 0 (0.0%) |
| 85 Years and over | 0 (0.0%) | 0 (0.0%) |
| Total | 80 (100.0%) | 74 (100.0%) |
Families and Households in Kino Springs
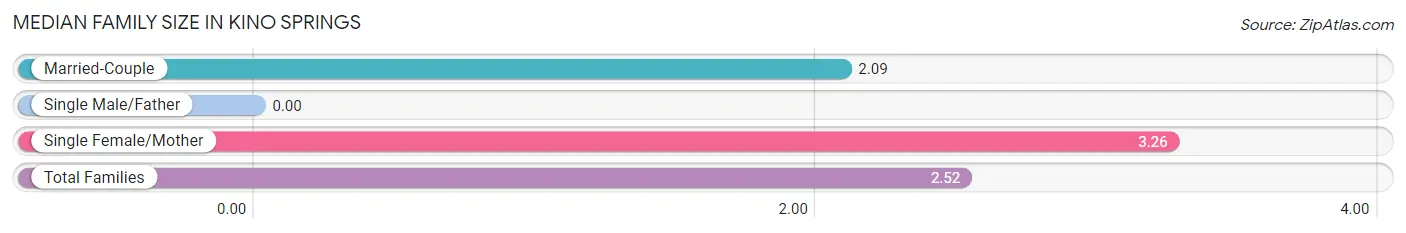
Median Family Size in Kino Springs
| Family Type | # Families | Family Size |
| Married-Couple | 33 (63.5%) | 2.09 |
| Single Male/Father | 0 (0.0%) | - |
| Single Female/Mother | 19 (36.5%) | 3.26 |
| Total Families | 52 (100.0%) | 2.52 |
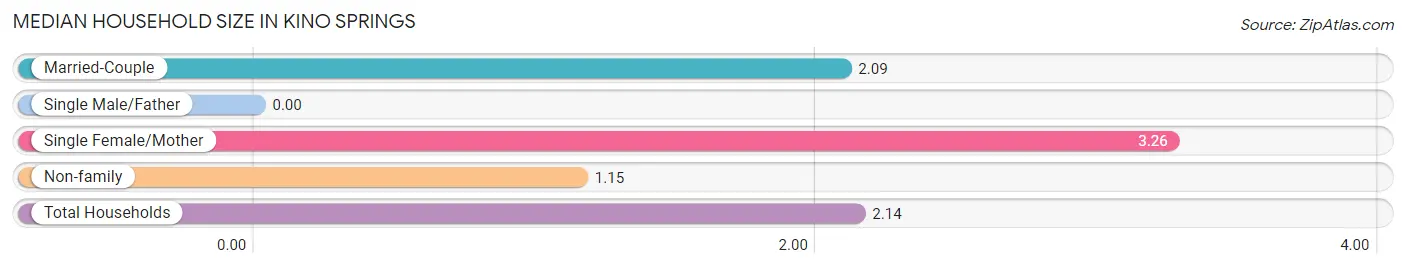
Median Household Size in Kino Springs
| Household Type | # Households | Household Size |
| Married-Couple | 33 (45.8%) | 2.09 |
| Single Male/Father | 0 (0.0%) | - |
| Single Female/Mother | 19 (26.4%) | 3.26 |
| Non-family | 20 (27.8%) | 1.15 |
| Total Households | 72 (100.0%) | 2.14 |
Household Size by Marriage Status in Kino Springs
Out of a total of 72 households in Kino Springs, 52 (72.2%) are family households, while 20 (27.8%) are nonfamily households. The most numerous type of family households are 2-person households, comprising 32, and the most common type of nonfamily households are 1-person households, comprising 16.
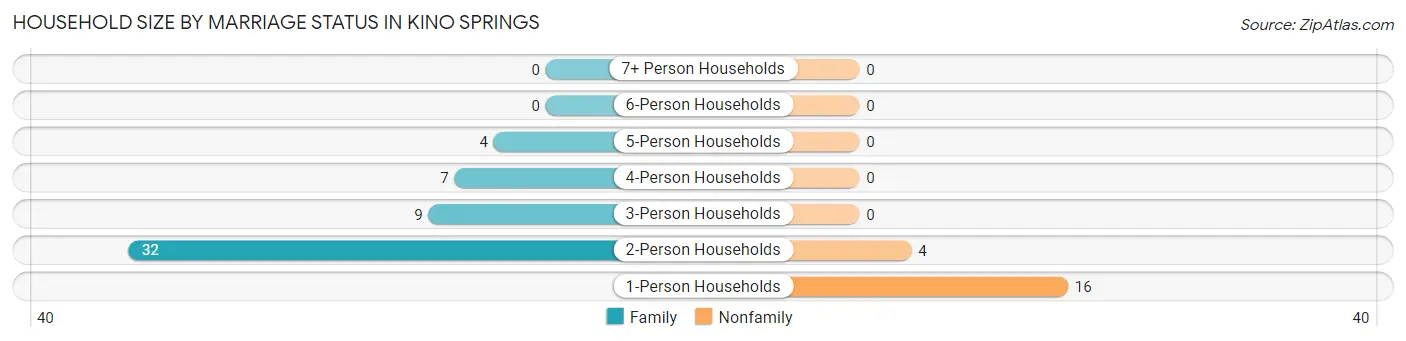
| Household Size | Family Households | Nonfamily Households |
| 1-Person Households | - | 16 (22.2%) |
| 2-Person Households | 32 (44.4%) | 4 (5.6%) |
| 3-Person Households | 9 (12.5%) | 0 (0.0%) |
| 4-Person Households | 7 (9.7%) | 0 (0.0%) |
| 5-Person Households | 4 (5.6%) | 0 (0.0%) |
| 6-Person Households | 0 (0.0%) | 0 (0.0%) |
| 7+ Person Households | 0 (0.0%) | 0 (0.0%) |
| Total | 52 (72.2%) | 20 (27.8%) |
Female Fertility in Kino Springs
Fertility by Age in Kino Springs
| Age Bracket | Women with Births | Births / 1,000 Women |
| 15 to 19 years | 0 (0.0%) | 0.0 |
| 20 to 34 years | 0 (0.0%) | 0.0 |
| 35 to 50 years | 0 (0.0%) | 0.0 |
| Total | 0 (0.0%) | 0.0 |
Fertility by Age by Marriage Status in Kino Springs
| Age Bracket | Married | Unmarried |
| 15 to 19 years | 0 (0.0%) | 0 (0.0%) |
| 20 to 34 years | 0 (0.0%) | 0 (0.0%) |
| 35 to 50 years | 0 (0.0%) | 0 (0.0%) |
| Total | 0 (0.0%) | 0 (0.0%) |
Fertility by Education in Kino Springs
| Educational Attainment | Women with Births | Births / 1,000 Women |
| Less than High School | 0 (0.0%) | 0.0 |
| High School Diploma | 0 (0.0%) | 0.0 |
| College or Associate's Degree | 0 (0.0%) | 0.0 |
| Bachelor's Degree | 0 (0.0%) | 0.0 |
| Graduate Degree | 0 (0.0%) | 0.0 |
| Total | 0 (0.0%) | 0.0 |
Fertility by Education by Marriage Status in Kino Springs
| Educational Attainment | Married | Unmarried |
| Less than High School | 0 (0.0%) | 0 (0.0%) |
| High School Diploma | 0 (0.0%) | 0 (0.0%) |
| College or Associate's Degree | 0 (0.0%) | 0 (0.0%) |
| Bachelor's Degree | 0 (0.0%) | 0 (0.0%) |
| Graduate Degree | 0 (0.0%) | 0 (0.0%) |
| Total | 0 (0.0%) | 0 (0.0%) |
Employment Characteristics in Kino Springs
Employment by Class of Employer in Kino Springs
Among the 46 employed individuals in Kino Springs, private company employees (22 | 47.8%), not-for-profit organizations (13 | 28.3%), and local government employees (7 | 15.2%) make up the most common classes of employment.
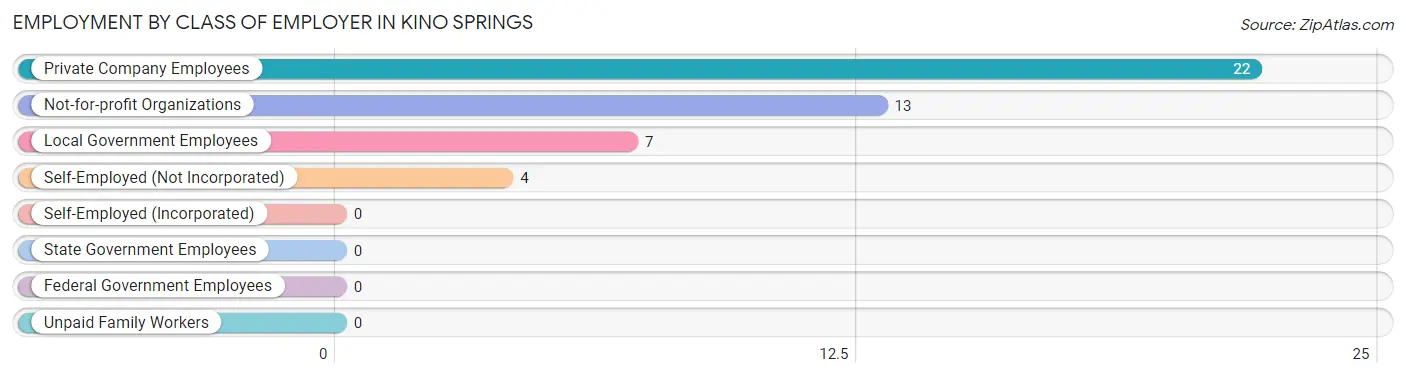
| Employer Class | # Employees | % Employees |
| Private Company Employees | 22 | 47.8% |
| Self-Employed (Incorporated) | 0 | 0.0% |
| Self-Employed (Not Incorporated) | 4 | 8.7% |
| Not-for-profit Organizations | 13 | 28.3% |
| Local Government Employees | 7 | 15.2% |
| State Government Employees | 0 | 0.0% |
| Federal Government Employees | 0 | 0.0% |
| Unpaid Family Workers | 0 | 0.0% |
| Total | 46 | 100.0% |
Employment Status by Age in Kino Springs
According to the labor force statistics for Kino Springs, out of the total population over 16 years of age (129), 41.9% or 54 individuals are in the labor force, with 14.8% or 8 of them unemployed. The age group with the highest labor force participation rate is 25 to 29 years, with 100.0% or 3 individuals in the labor force. Within the labor force, the 35 to 44 years age range has the highest percentage of unemployed individuals, with 34.8% or 8 of them being unemployed.
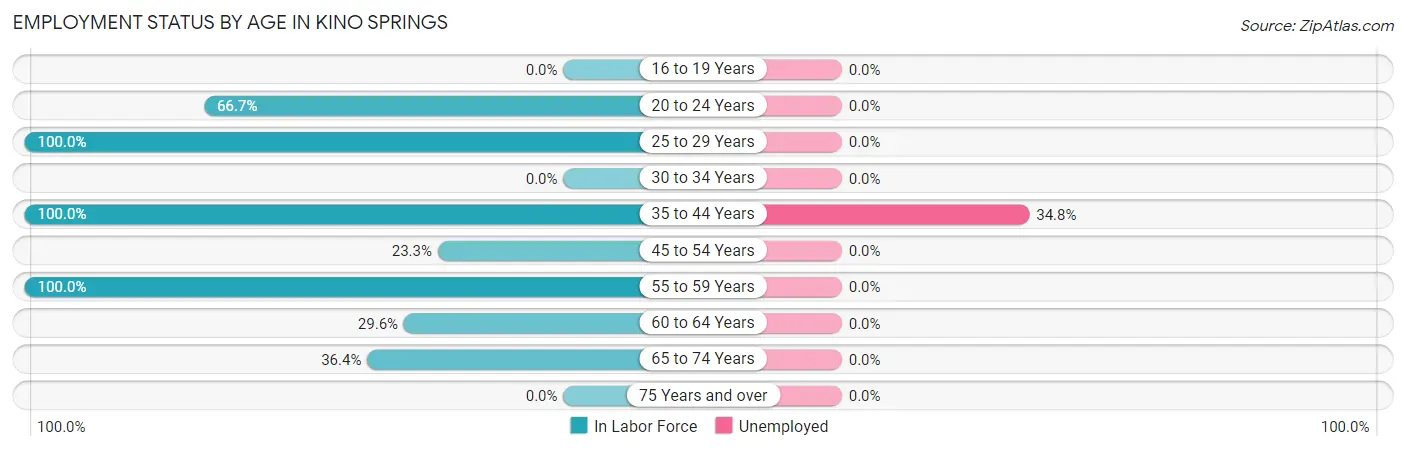
| Age Bracket | In Labor Force | Unemployed |
| 16 to 19 Years | 0 (0.0%) | 0 (0.0%) |
| 20 to 24 Years | 6 (66.7%) | 0 (0.0%) |
| 25 to 29 Years | 3 (100.0%) | 0 (0.0%) |
| 30 to 34 Years | 0 (0.0%) | 0 (0.0%) |
| 35 to 44 Years | 23 (100.0%) | 8 (34.8%) |
| 45 to 54 Years | 7 (23.3%) | 0 (0.0%) |
| 55 to 59 Years | 3 (100.0%) | 0 (0.0%) |
| 60 to 64 Years | 8 (29.6%) | 0 (0.0%) |
| 65 to 74 Years | 4 (36.4%) | 0 (0.0%) |
| 75 Years and over | 0 (0.0%) | 0 (0.0%) |
| Total | 54 (41.9%) | 8 (14.8%) |
Employment Status by Educational Attainment in Kino Springs
According to labor force statistics for Kino Springs, 48.4% of individuals (44) out of the total population between 25 and 64 years of age (91) are in the labor force, with 18.2% or 8 of them being unemployed. The group with the highest labor force participation rate are those with the educational attainment of college / associate degree, with 62.5% or 30 individuals in the labor force. Within the labor force, individuals with college / associate degree education have the highest percentage of unemployment, with 26.7% or 8 of them being unemployed.
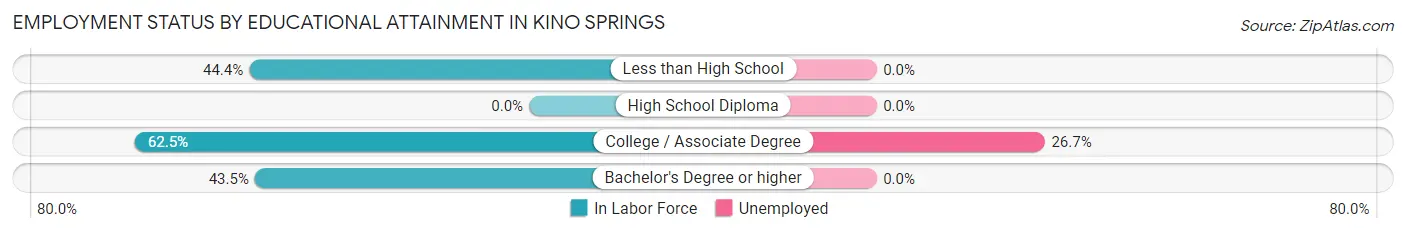
| Educational Attainment | In Labor Force | Unemployed |
| Less than High School | 4 (44.4%) | 0 (0.0%) |
| High School Diploma | 0 (0.0%) | 0 (0.0%) |
| College / Associate Degree | 30 (62.5%) | 13 (26.7%) |
| Bachelor's Degree or higher | 10 (43.5%) | 0 (0.0%) |
| Total | 44 (48.4%) | 17 (18.2%) |
Employment Occupations by Sex in Kino Springs
Management, Business, Science and Arts Occupations
The most common Management, Business, Science and Arts occupations in Kino Springs are Community & Social Service (7 | 15.2%), and Education, Arts & Media (7 | 15.2%).
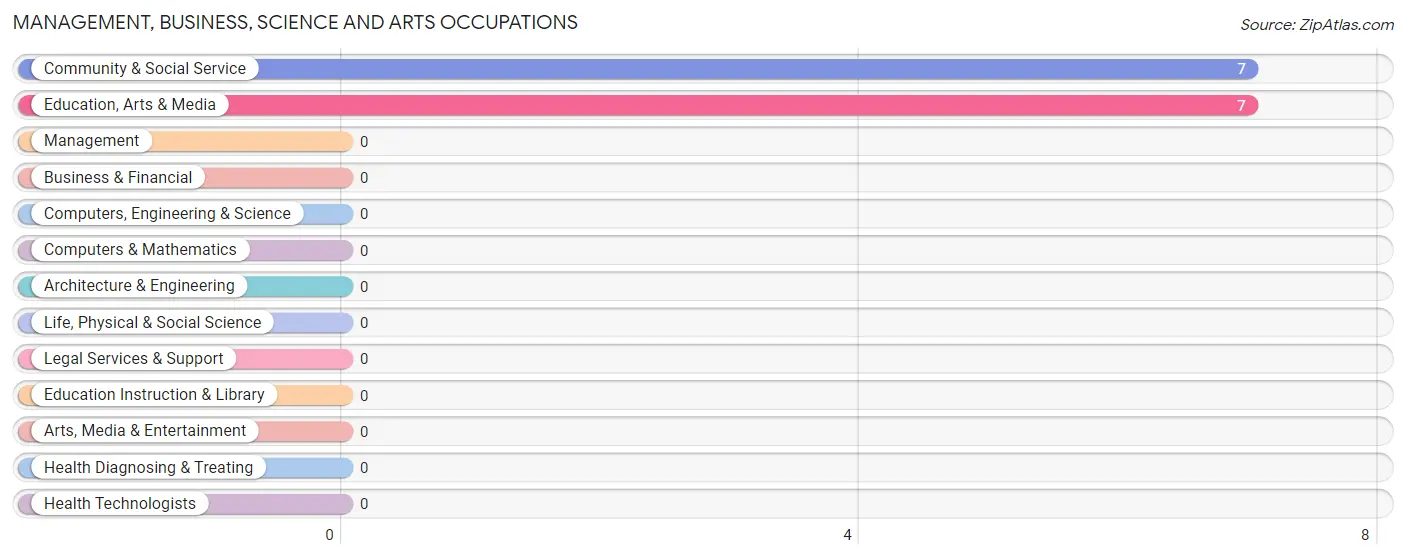
Management, Business, Science and Arts Occupations by Sex
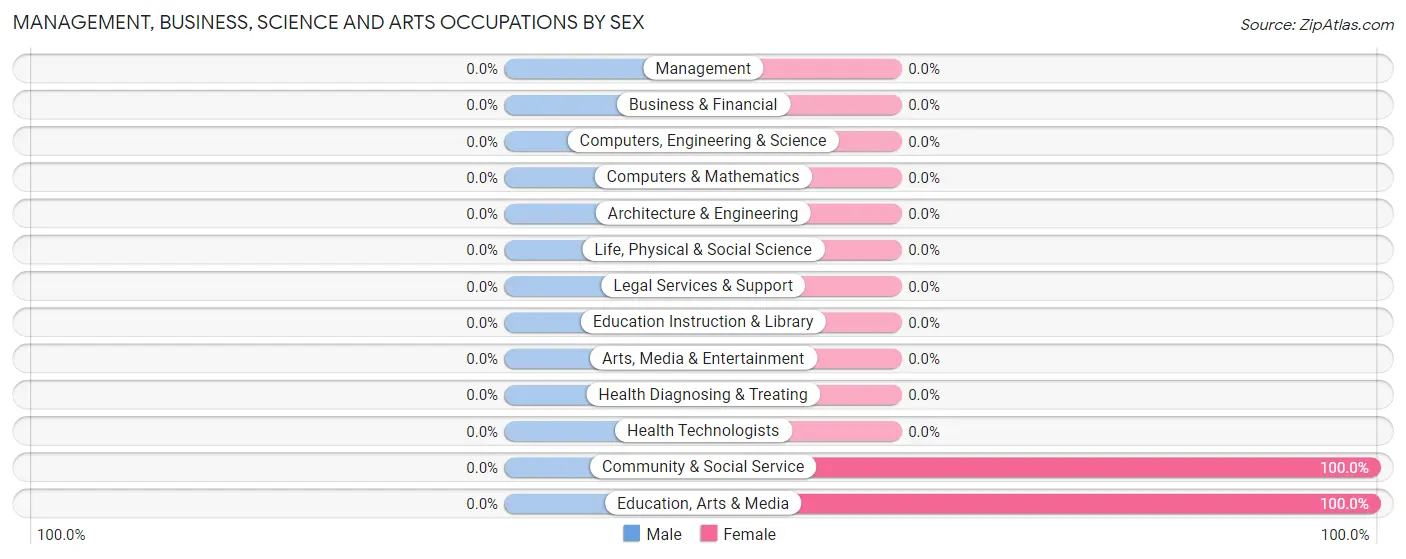
| Occupation | Male | Female |
| Management | 0 (0.0%) | 0 (0.0%) |
| Business & Financial | 0 (0.0%) | 0 (0.0%) |
| Computers, Engineering & Science | 0 (0.0%) | 0 (0.0%) |
| Computers & Mathematics | 0 (0.0%) | 0 (0.0%) |
| Architecture & Engineering | 0 (0.0%) | 0 (0.0%) |
| Life, Physical & Social Science | 0 (0.0%) | 0 (0.0%) |
| Community & Social Service | 0 (0.0%) | 7 (100.0%) |
| Education, Arts & Media | 0 (0.0%) | 7 (100.0%) |
| Legal Services & Support | 0 (0.0%) | 0 (0.0%) |
| Education Instruction & Library | 0 (0.0%) | 0 (0.0%) |
| Arts, Media & Entertainment | 0 (0.0%) | 0 (0.0%) |
| Health Diagnosing & Treating | 0 (0.0%) | 0 (0.0%) |
| Health Technologists | 0 (0.0%) | 0 (0.0%) |
| Total (Category) | 0 (0.0%) | 7 (100.0%) |
| Total (Overall) | 18 (39.1%) | 28 (60.9%) |
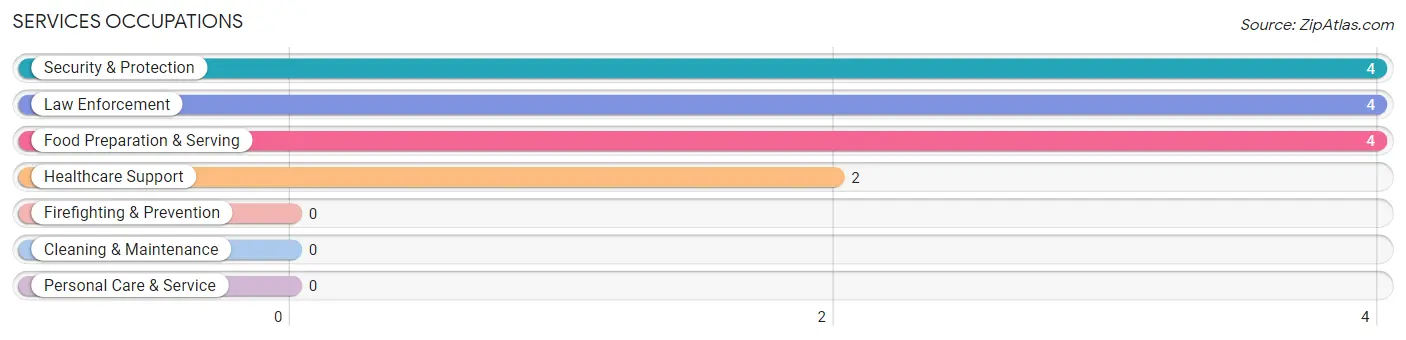
Services Occupations
The most common Services occupations in Kino Springs are Security & Protection (4 | 8.7%), Law Enforcement (4 | 8.7%), Food Preparation & Serving (4 | 8.7%), and Healthcare Support (2 | 4.3%).
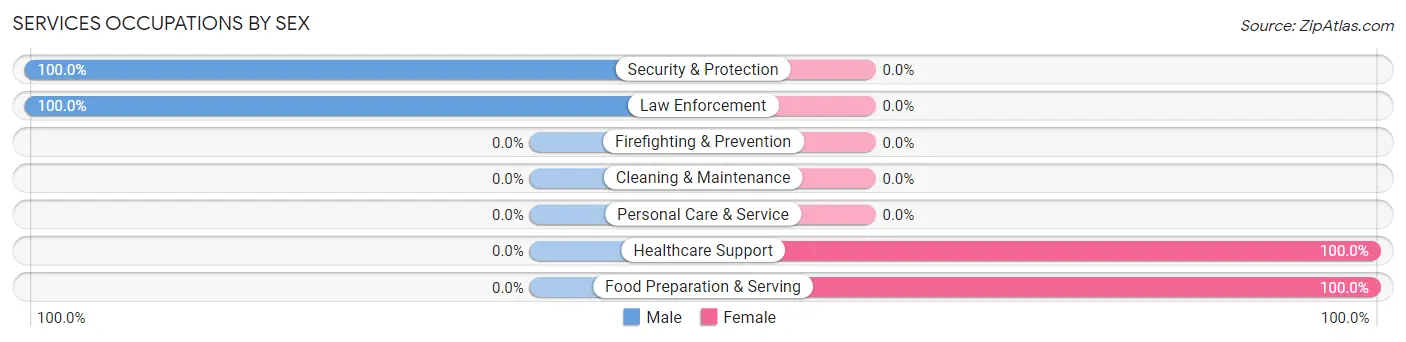
Services Occupations by Sex
Within the Services occupations in Kino Springs, the most male-oriented occupations are Security & Protection (100.0%), and Law Enforcement (100.0%), while the most female-oriented occupations are Healthcare Support (100.0%), and Food Preparation & Serving (100.0%).
| Occupation | Male | Female |
| Healthcare Support | 0 (0.0%) | 2 (100.0%) |
| Security & Protection | 4 (100.0%) | 0 (0.0%) |
| Firefighting & Prevention | 0 (0.0%) | 0 (0.0%) |
| Law Enforcement | 4 (100.0%) | 0 (0.0%) |
| Food Preparation & Serving | 0 (0.0%) | 4 (100.0%) |
| Cleaning & Maintenance | 0 (0.0%) | 0 (0.0%) |
| Personal Care & Service | 0 (0.0%) | 0 (0.0%) |
| Total (Category) | 4 (40.0%) | 6 (60.0%) |
| Total (Overall) | 18 (39.1%) | 28 (60.9%) |
Sales and Office Occupations
The most common Sales and Office occupations in Kino Springs are Sales & Related (16 | 34.8%), and Office & Administration (9 | 19.6%).
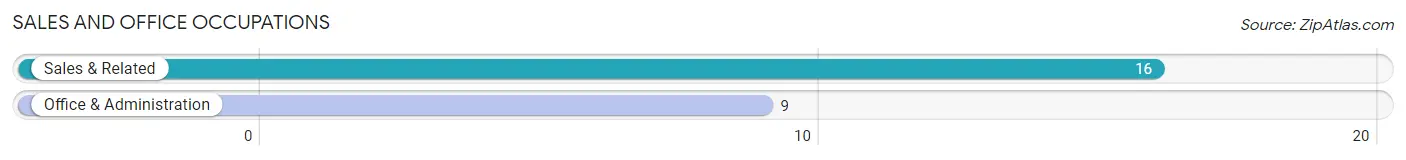
Sales and Office Occupations by Sex
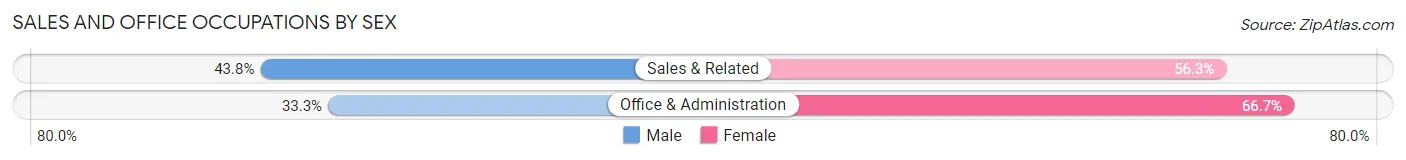
| Occupation | Male | Female |
| Sales & Related | 7 (43.8%) | 9 (56.2%) |
| Office & Administration | 3 (33.3%) | 6 (66.7%) |
| Total (Category) | 10 (40.0%) | 15 (60.0%) |
| Total (Overall) | 18 (39.1%) | 28 (60.9%) |
Natural Resources, Construction and Maintenance Occupations
The most common Natural Resources, Construction and Maintenance occupations in Kino Springs are , and Installation, Maintenance & Repair (4 | 8.7%).
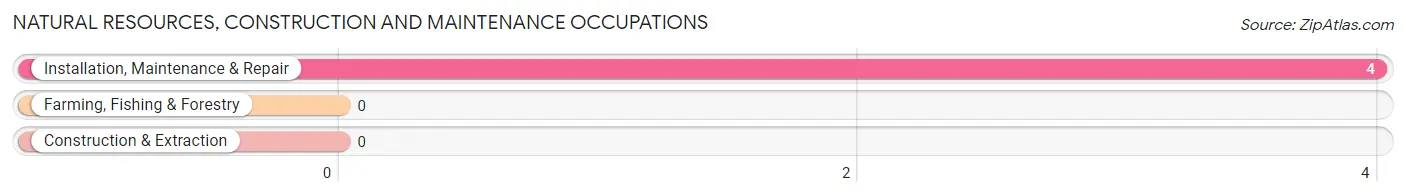
Natural Resources, Construction and Maintenance Occupations by Sex
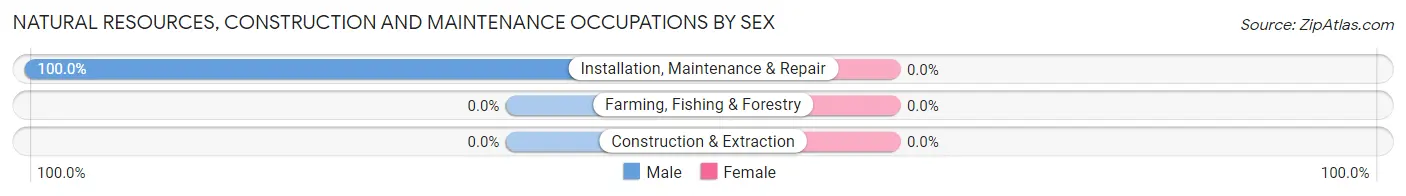
| Occupation | Male | Female |
| Farming, Fishing & Forestry | 0 (0.0%) | 0 (0.0%) |
| Construction & Extraction | 0 (0.0%) | 0 (0.0%) |
| Installation, Maintenance & Repair | 4 (100.0%) | 0 (0.0%) |
| Total (Category) | 4 (100.0%) | 0 (0.0%) |
| Total (Overall) | 18 (39.1%) | 28 (60.9%) |
Production, Transportation and Moving Occupations
Production, Transportation and Moving Occupations by Sex
| Occupation | Male | Female |
| Production | 0 (0.0%) | 0 (0.0%) |
| Transportation | 0 (0.0%) | 0 (0.0%) |
| Material Moving | 0 (0.0%) | 0 (0.0%) |
| Total (Category) | 0 (0.0%) | 0 (0.0%) |
| Total (Overall) | 18 (39.1%) | 28 (60.9%) |
Employment Industries by Sex in Kino Springs
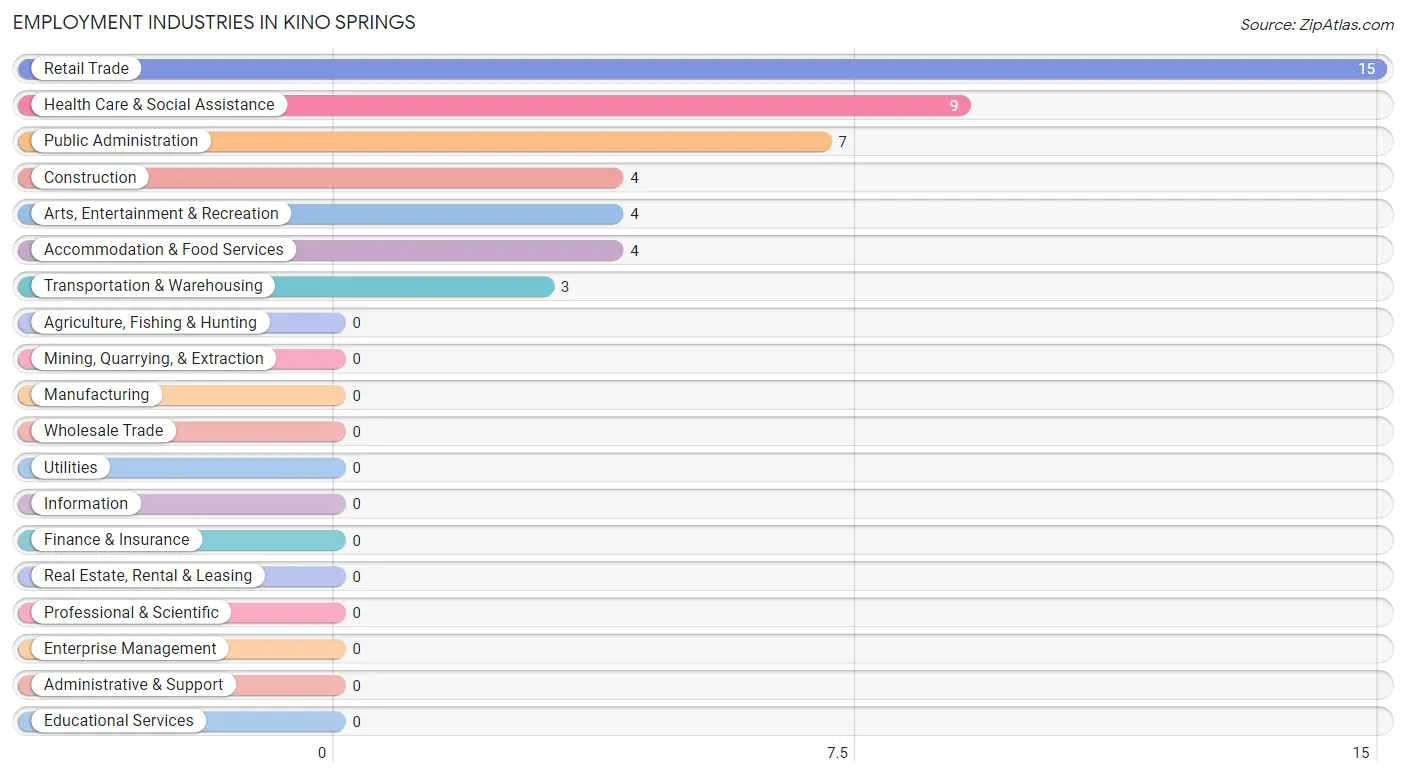
Employment Industries in Kino Springs
The major employment industries in Kino Springs include Retail Trade (15 | 32.6%), Health Care & Social Assistance (9 | 19.6%), Public Administration (7 | 15.2%), Construction (4 | 8.7%), and Arts, Entertainment & Recreation (4 | 8.7%).
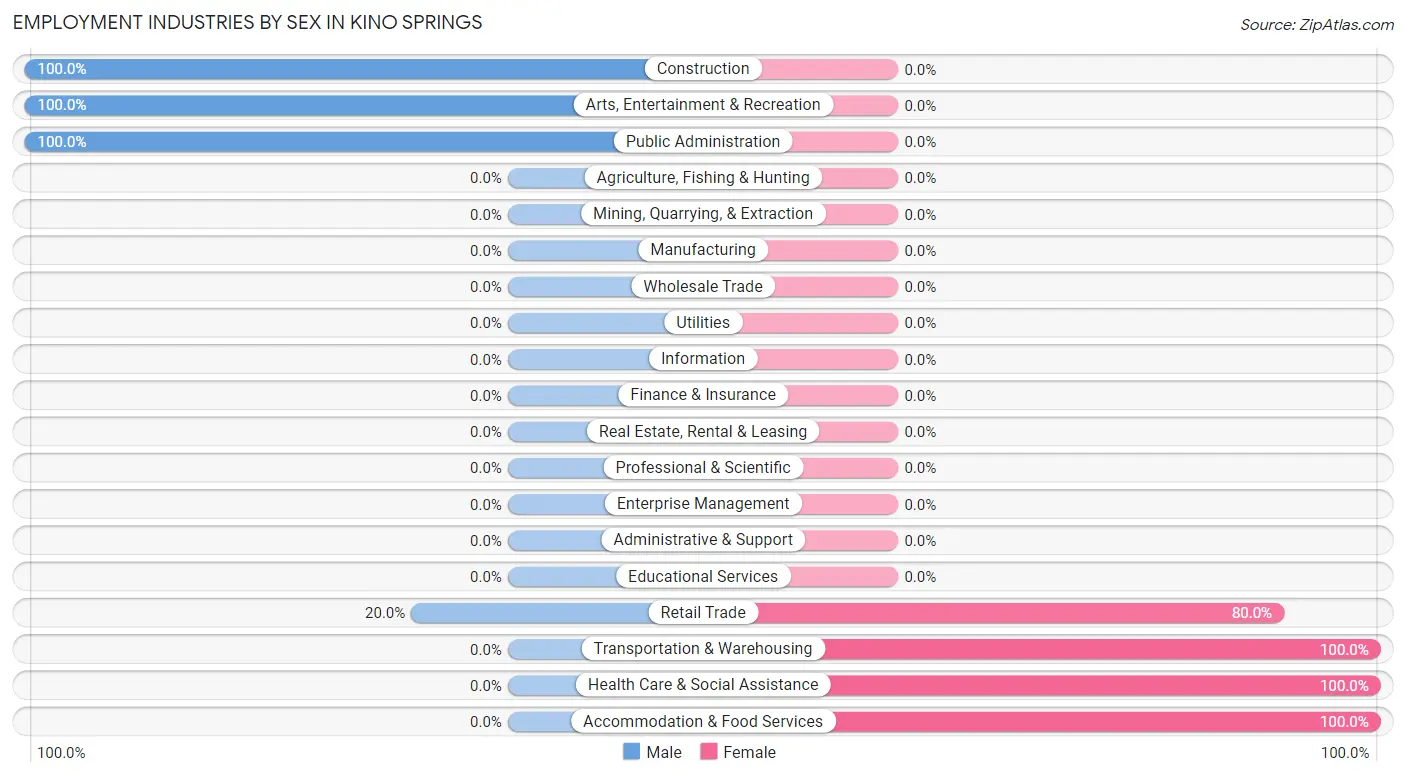
Employment Industries by Sex in Kino Springs
The Kino Springs industries that see more men than women are Construction (100.0%), Arts, Entertainment & Recreation (100.0%), and Public Administration (100.0%), whereas the industries that tend to have a higher number of women are Transportation & Warehousing (100.0%), Health Care & Social Assistance (100.0%), and Accommodation & Food Services (100.0%).
| Industry | Male | Female |
| Agriculture, Fishing & Hunting | 0 (0.0%) | 0 (0.0%) |
| Mining, Quarrying, & Extraction | 0 (0.0%) | 0 (0.0%) |
| Construction | 4 (100.0%) | 0 (0.0%) |
| Manufacturing | 0 (0.0%) | 0 (0.0%) |
| Wholesale Trade | 0 (0.0%) | 0 (0.0%) |
| Retail Trade | 3 (20.0%) | 12 (80.0%) |
| Transportation & Warehousing | 0 (0.0%) | 3 (100.0%) |
| Utilities | 0 (0.0%) | 0 (0.0%) |
| Information | 0 (0.0%) | 0 (0.0%) |
| Finance & Insurance | 0 (0.0%) | 0 (0.0%) |
| Real Estate, Rental & Leasing | 0 (0.0%) | 0 (0.0%) |
| Professional & Scientific | 0 (0.0%) | 0 (0.0%) |
| Enterprise Management | 0 (0.0%) | 0 (0.0%) |
| Administrative & Support | 0 (0.0%) | 0 (0.0%) |
| Educational Services | 0 (0.0%) | 0 (0.0%) |
| Health Care & Social Assistance | 0 (0.0%) | 9 (100.0%) |
| Arts, Entertainment & Recreation | 4 (100.0%) | 0 (0.0%) |
| Accommodation & Food Services | 0 (0.0%) | 4 (100.0%) |
| Public Administration | 7 (100.0%) | 0 (0.0%) |
| Total | 18 (39.1%) | 28 (60.9%) |
Education in Kino Springs
School Enrollment in Kino Springs
The most common levels of schooling among the 32 students in Kino Springs are elementary school (13 | 40.6%), middle school (12 | 37.5%), and high school (4 | 12.5%).
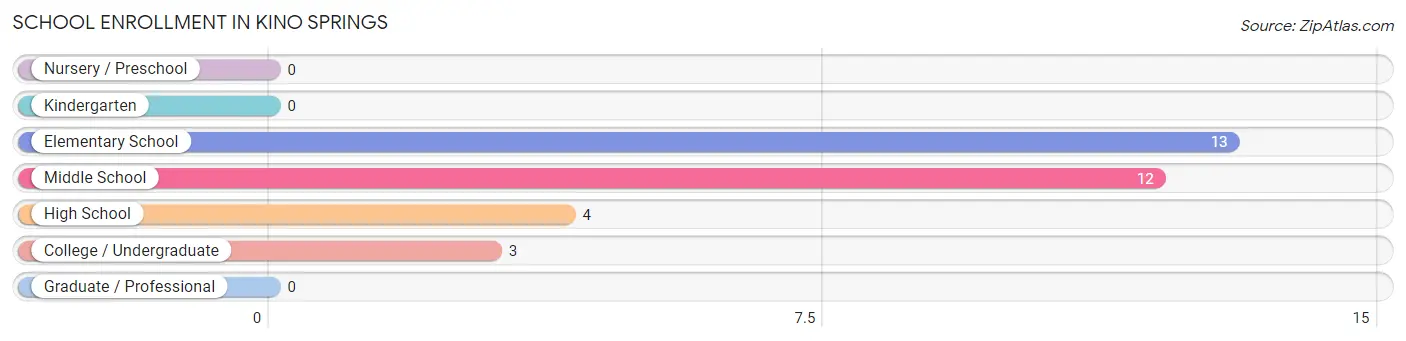
| School Level | # Students | % Students |
| Nursery / Preschool | 0 | 0.0% |
| Kindergarten | 0 | 0.0% |
| Elementary School | 13 | 40.6% |
| Middle School | 12 | 37.5% |
| High School | 4 | 12.5% |
| College / Undergraduate | 3 | 9.4% |
| Graduate / Professional | 0 | 0.0% |
| Total | 32 | 100.0% |
School Enrollment by Age by Funding Source in Kino Springs
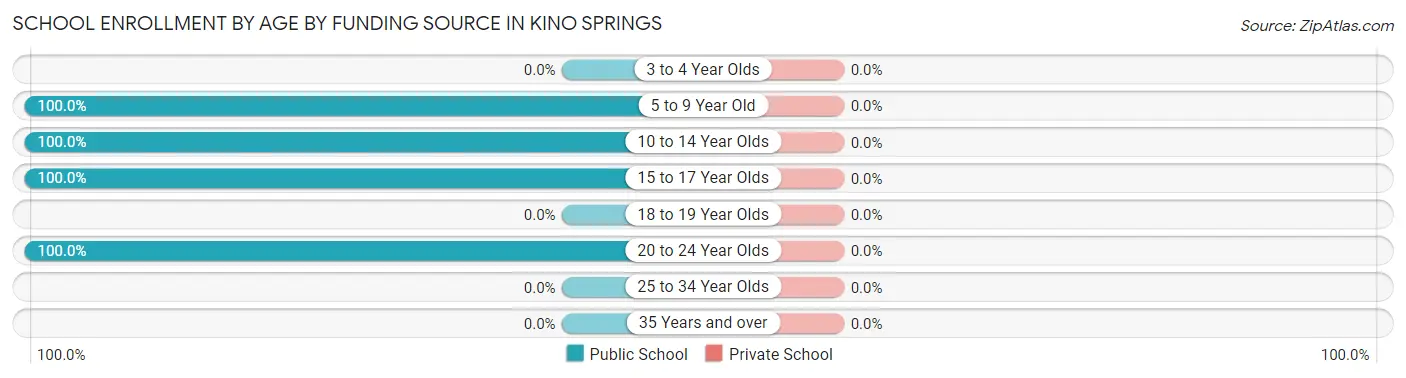
| Age Bracket | Public School | Private School |
| 3 to 4 Year Olds | 0 (0.0%) | 0 (0.0%) |
| 5 to 9 Year Old | 13 (100.0%) | 0 (0.0%) |
| 10 to 14 Year Olds | 12 (100.0%) | 0 (0.0%) |
| 15 to 17 Year Olds | 4 (100.0%) | 0 (0.0%) |
| 18 to 19 Year Olds | 0 (0.0%) | 0 (0.0%) |
| 20 to 24 Year Olds | 3 (100.0%) | 0 (0.0%) |
| 25 to 34 Year Olds | 0 (0.0%) | 0 (0.0%) |
| 35 Years and over | 0 (0.0%) | 0 (0.0%) |
| Total | 32 (100.0%) | 0 (0.0%) |
Educational Attainment by Field of Study in Kino Springs
Education (13 | 56.5%), bio, nature & agricultural (4 | 17.4%), science & technology (3 | 13.0%), and business (3 | 13.0%) are the most common fields of study among 23 individuals in Kino Springs who have obtained a bachelor's degree or higher.
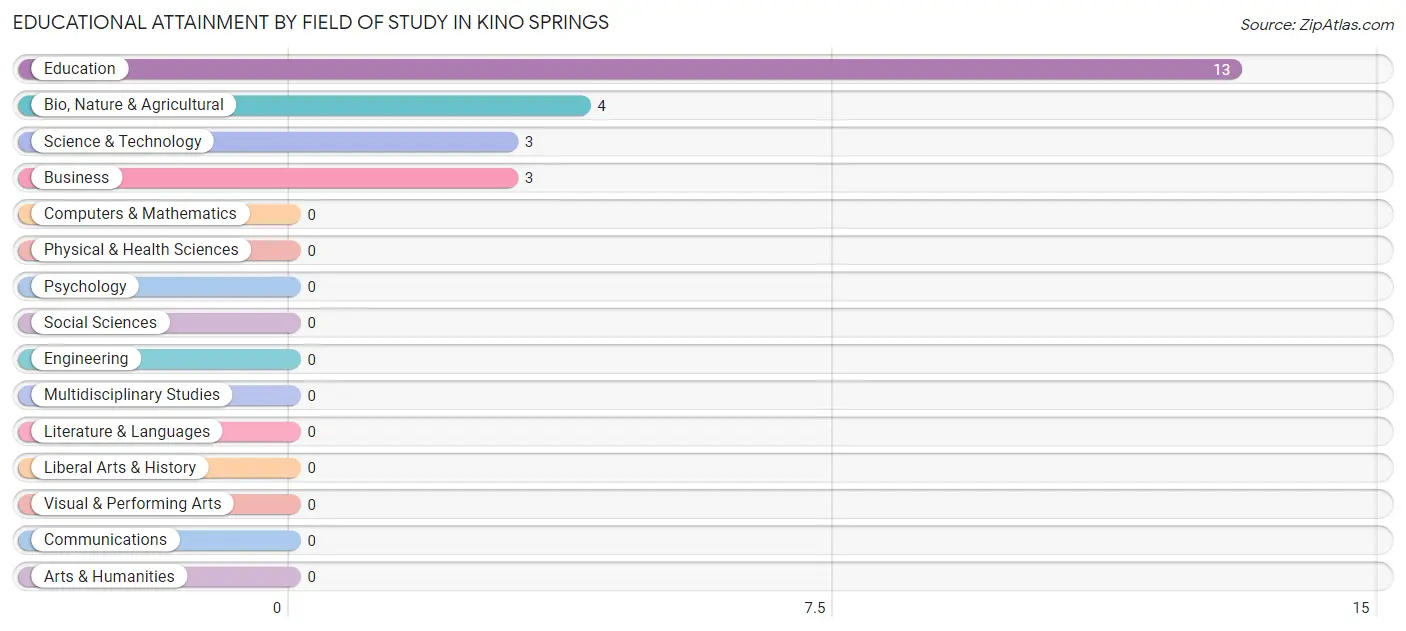
| Field of Study | # Graduates | % Graduates |
| Computers & Mathematics | 0 | 0.0% |
| Bio, Nature & Agricultural | 4 | 17.4% |
| Physical & Health Sciences | 0 | 0.0% |
| Psychology | 0 | 0.0% |
| Social Sciences | 0 | 0.0% |
| Engineering | 0 | 0.0% |
| Multidisciplinary Studies | 0 | 0.0% |
| Science & Technology | 3 | 13.0% |
| Business | 3 | 13.0% |
| Education | 13 | 56.5% |
| Literature & Languages | 0 | 0.0% |
| Liberal Arts & History | 0 | 0.0% |
| Visual & Performing Arts | 0 | 0.0% |
| Communications | 0 | 0.0% |
| Arts & Humanities | 0 | 0.0% |
| Total | 23 | 100.0% |
Transportation & Commute in Kino Springs
Vehicle Availability by Sex in Kino Springs
The most prevalent vehicle ownership categories in Kino Springs are males with 4 vehicles (7, accounting for 38.9%) and females with 4 vehicles (6, making up 25.0%).
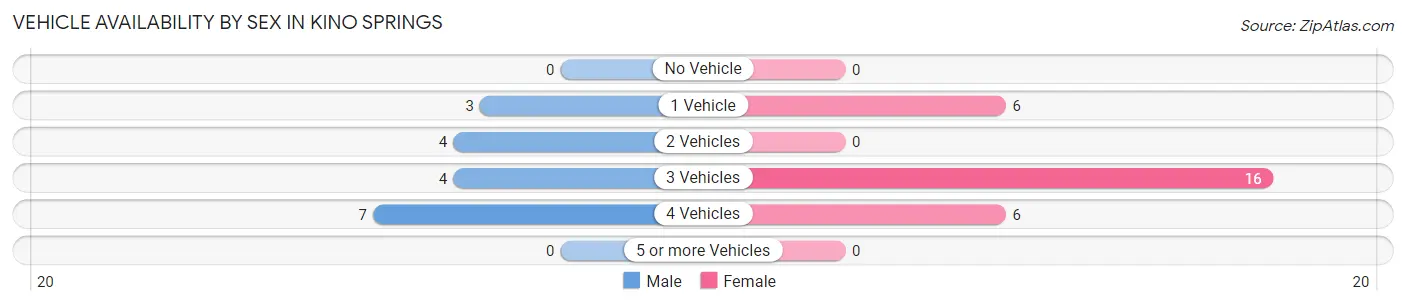
| Vehicles Available | Male | Female |
| No Vehicle | 0 (0.0%) | 0 (0.0%) |
| 1 Vehicle | 3 (16.7%) | 6 (21.4%) |
| 2 Vehicles | 4 (22.2%) | 0 (0.0%) |
| 3 Vehicles | 4 (22.2%) | 16 (57.1%) |
| 4 Vehicles | 7 (38.9%) | 6 (21.4%) |
| 5 or more Vehicles | 0 (0.0%) | 0 (0.0%) |
| Total | 18 (100.0%) | 28 (100.0%) |
Commute Time in Kino Springs
The most frequently occuring commute durations in Kino Springs are 20 to 24 minutes (16 commuters, 36.4%), 25 to 29 minutes (8 commuters, 18.2%), and 40 to 44 minutes (6 commuters, 13.6%).
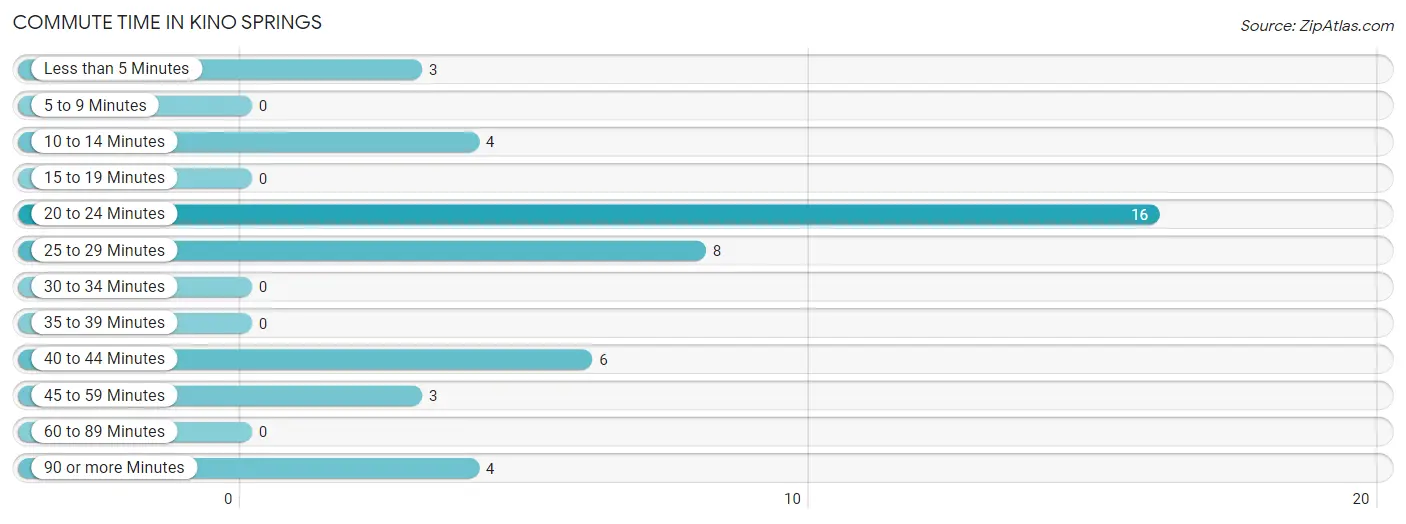
| Commute Time | # Commuters | % Commuters |
| Less than 5 Minutes | 3 | 6.8% |
| 5 to 9 Minutes | 0 | 0.0% |
| 10 to 14 Minutes | 4 | 9.1% |
| 15 to 19 Minutes | 0 | 0.0% |
| 20 to 24 Minutes | 16 | 36.4% |
| 25 to 29 Minutes | 8 | 18.2% |
| 30 to 34 Minutes | 0 | 0.0% |
| 35 to 39 Minutes | 0 | 0.0% |
| 40 to 44 Minutes | 6 | 13.6% |
| 45 to 59 Minutes | 3 | 6.8% |
| 60 to 89 Minutes | 0 | 0.0% |
| 90 or more Minutes | 4 | 9.1% |
Commute Time by Sex in Kino Springs
The most common commute times in Kino Springs are 10 to 14 minutes (4 commuters, 22.2%) for males and 20 to 24 minutes (16 commuters, 61.5%) for females.
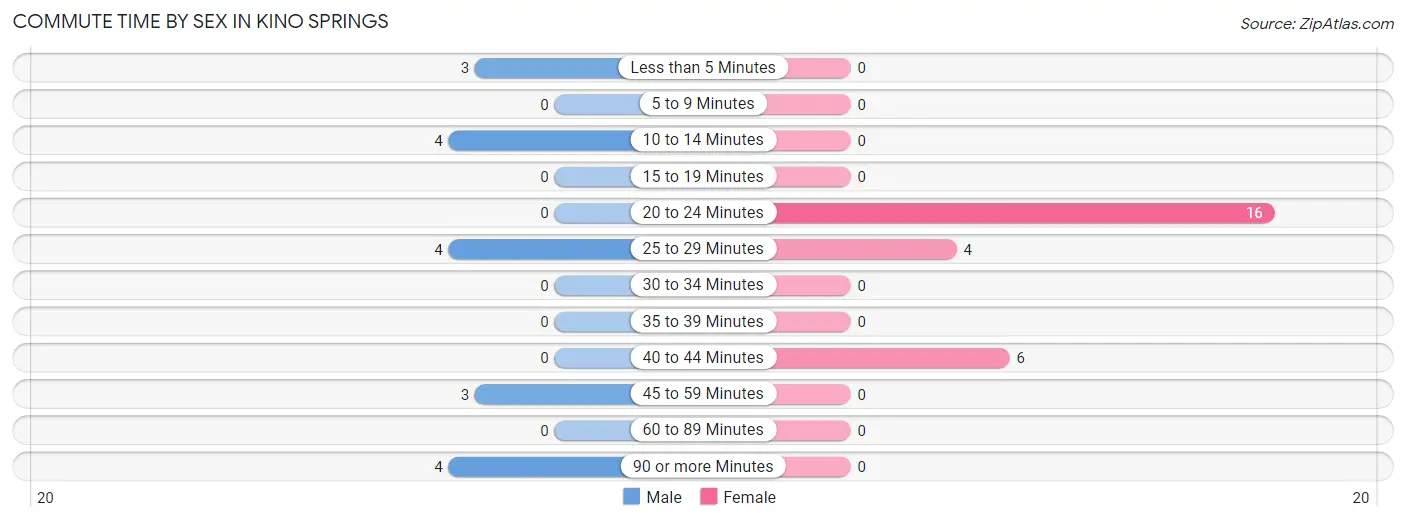
| Commute Time | Male | Female |
| Less than 5 Minutes | 3 (16.7%) | 0 (0.0%) |
| 5 to 9 Minutes | 0 (0.0%) | 0 (0.0%) |
| 10 to 14 Minutes | 4 (22.2%) | 0 (0.0%) |
| 15 to 19 Minutes | 0 (0.0%) | 0 (0.0%) |
| 20 to 24 Minutes | 0 (0.0%) | 16 (61.5%) |
| 25 to 29 Minutes | 4 (22.2%) | 4 (15.4%) |
| 30 to 34 Minutes | 0 (0.0%) | 0 (0.0%) |
| 35 to 39 Minutes | 0 (0.0%) | 0 (0.0%) |
| 40 to 44 Minutes | 0 (0.0%) | 6 (23.1%) |
| 45 to 59 Minutes | 3 (16.7%) | 0 (0.0%) |
| 60 to 89 Minutes | 0 (0.0%) | 0 (0.0%) |
| 90 or more Minutes | 4 (22.2%) | 0 (0.0%) |
Time of Departure to Work by Sex in Kino Springs
The most frequent times of departure to work in Kino Springs are 8:00 AM to 8:29 AM (8, 44.4%) for males and 8:30 AM to 8:59 AM (7, 26.9%) for females.
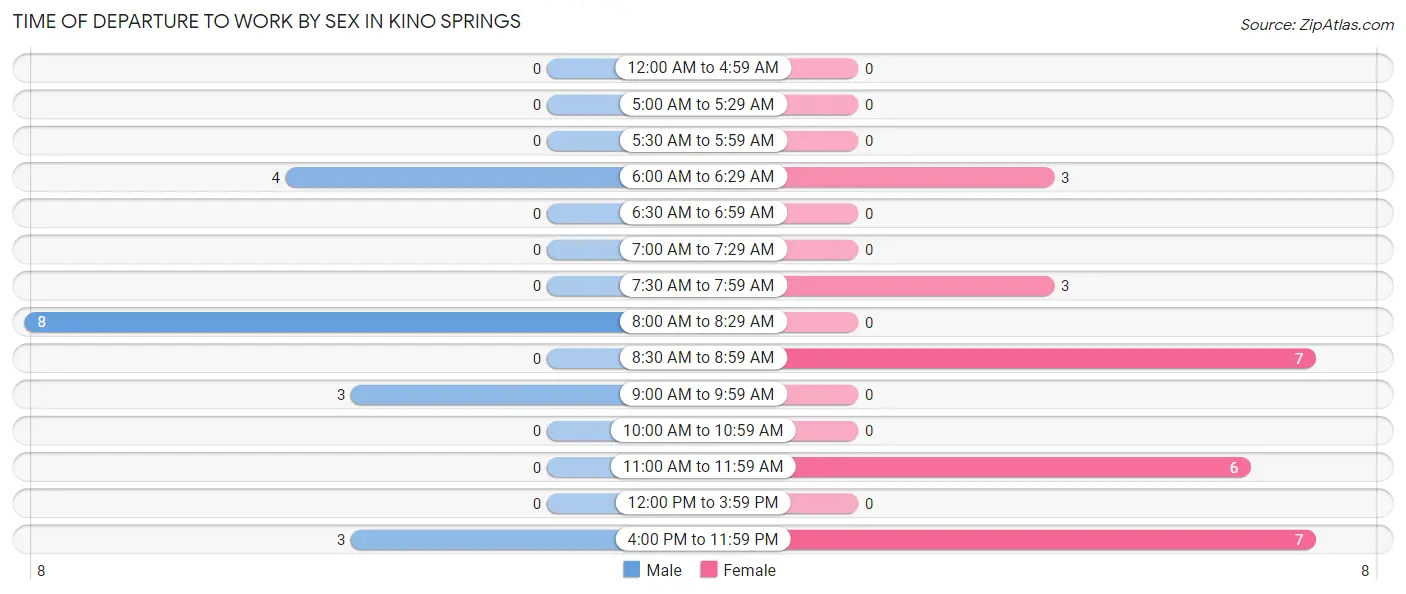
| Time of Departure | Male | Female |
| 12:00 AM to 4:59 AM | 0 (0.0%) | 0 (0.0%) |
| 5:00 AM to 5:29 AM | 0 (0.0%) | 0 (0.0%) |
| 5:30 AM to 5:59 AM | 0 (0.0%) | 0 (0.0%) |
| 6:00 AM to 6:29 AM | 4 (22.2%) | 3 (11.5%) |
| 6:30 AM to 6:59 AM | 0 (0.0%) | 0 (0.0%) |
| 7:00 AM to 7:29 AM | 0 (0.0%) | 0 (0.0%) |
| 7:30 AM to 7:59 AM | 0 (0.0%) | 3 (11.5%) |
| 8:00 AM to 8:29 AM | 8 (44.4%) | 0 (0.0%) |
| 8:30 AM to 8:59 AM | 0 (0.0%) | 7 (26.9%) |
| 9:00 AM to 9:59 AM | 3 (16.7%) | 0 (0.0%) |
| 10:00 AM to 10:59 AM | 0 (0.0%) | 0 (0.0%) |
| 11:00 AM to 11:59 AM | 0 (0.0%) | 6 (23.1%) |
| 12:00 PM to 3:59 PM | 0 (0.0%) | 0 (0.0%) |
| 4:00 PM to 11:59 PM | 3 (16.7%) | 7 (26.9%) |
| Total | 18 (100.0%) | 26 (100.0%) |
Housing Occupancy in Kino Springs
Occupancy by Ownership in Kino Springs
Of the total 72 dwellings in Kino Springs, owner-occupied units account for 45 (62.5%), while renter-occupied units make up 27 (37.5%).
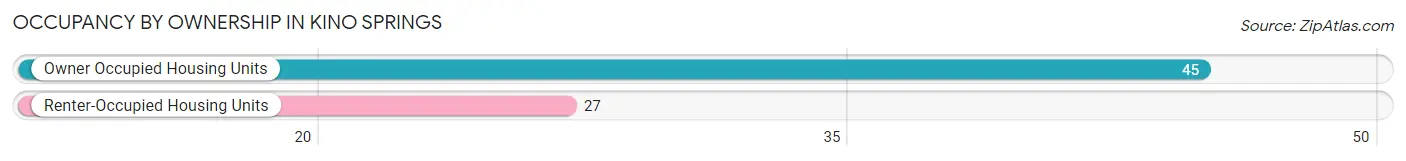
| Occupancy | # Housing Units | % Housing Units |
| Owner Occupied Housing Units | 45 | 62.5% |
| Renter-Occupied Housing Units | 27 | 37.5% |
| Total Occupied Housing Units | 72 | 100.0% |
Occupancy by Household Size in Kino Springs
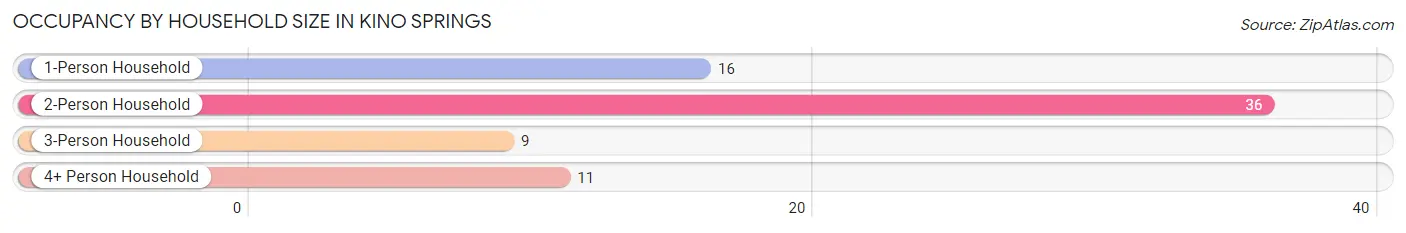
| Household Size | # Housing Units | % Housing Units |
| 1-Person Household | 16 | 22.2% |
| 2-Person Household | 36 | 50.0% |
| 3-Person Household | 9 | 12.5% |
| 4+ Person Household | 11 | 15.3% |
| Total Housing Units | 72 | 100.0% |
Occupancy by Ownership by Household Size in Kino Springs
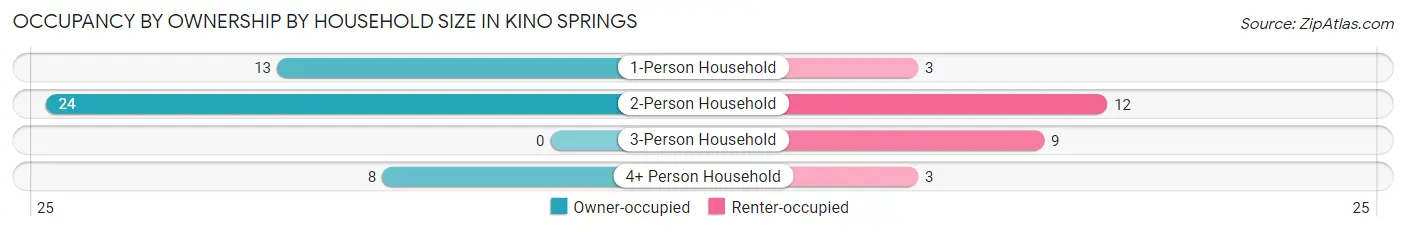
| Household Size | Owner-occupied | Renter-occupied |
| 1-Person Household | 13 (81.2%) | 3 (18.8%) |
| 2-Person Household | 24 (66.7%) | 12 (33.3%) |
| 3-Person Household | 0 (0.0%) | 9 (100.0%) |
| 4+ Person Household | 8 (72.7%) | 3 (27.3%) |
| Total Housing Units | 45 (62.5%) | 27 (37.5%) |
Occupancy by Educational Attainment in Kino Springs
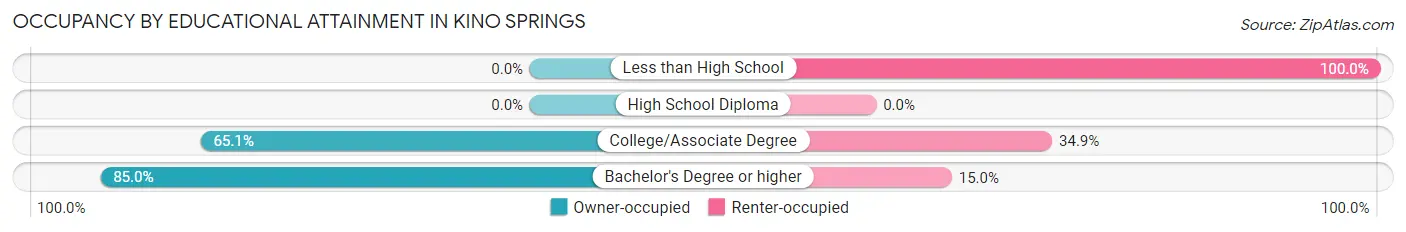
| Household Size | Owner-occupied | Renter-occupied |
| Less than High School | 0 (0.0%) | 9 (100.0%) |
| High School Diploma | 0 (0.0%) | 0 (0.0%) |
| College/Associate Degree | 28 (65.1%) | 15 (34.9%) |
| Bachelor's Degree or higher | 17 (85.0%) | 3 (15.0%) |
Occupancy by Age of Householder in Kino Springs
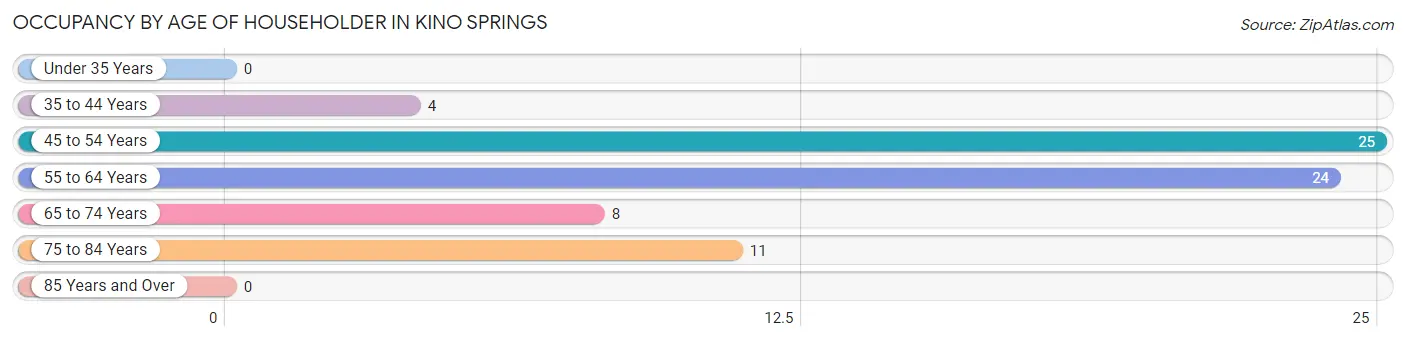
| Age Bracket | # Households | % Households |
| Under 35 Years | 0 | 0.0% |
| 35 to 44 Years | 4 | 5.6% |
| 45 to 54 Years | 25 | 34.7% |
| 55 to 64 Years | 24 | 33.3% |
| 65 to 74 Years | 8 | 11.1% |
| 75 to 84 Years | 11 | 15.3% |
| 85 Years and Over | 0 | 0.0% |
| Total | 72 | 100.0% |
Housing Finances in Kino Springs
Median Income by Occupancy in Kino Springs
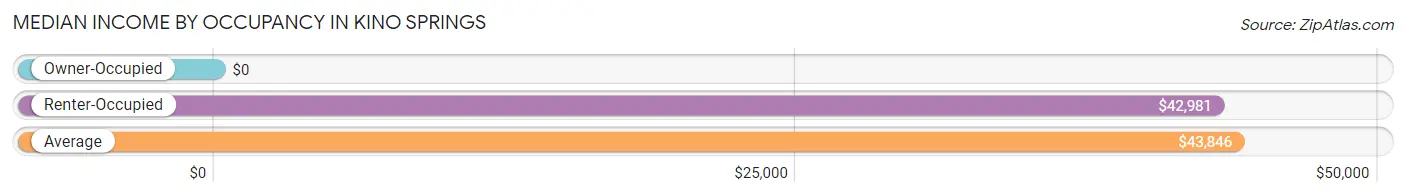
| Occupancy Type | # Households | Median Income |
| Owner-Occupied | 45 (62.5%) | $0 |
| Renter-Occupied | 27 (37.5%) | $42,981 |
| Average | 72 (100.0%) | $43,846 |
Occupancy by Householder Income Bracket in Kino Springs
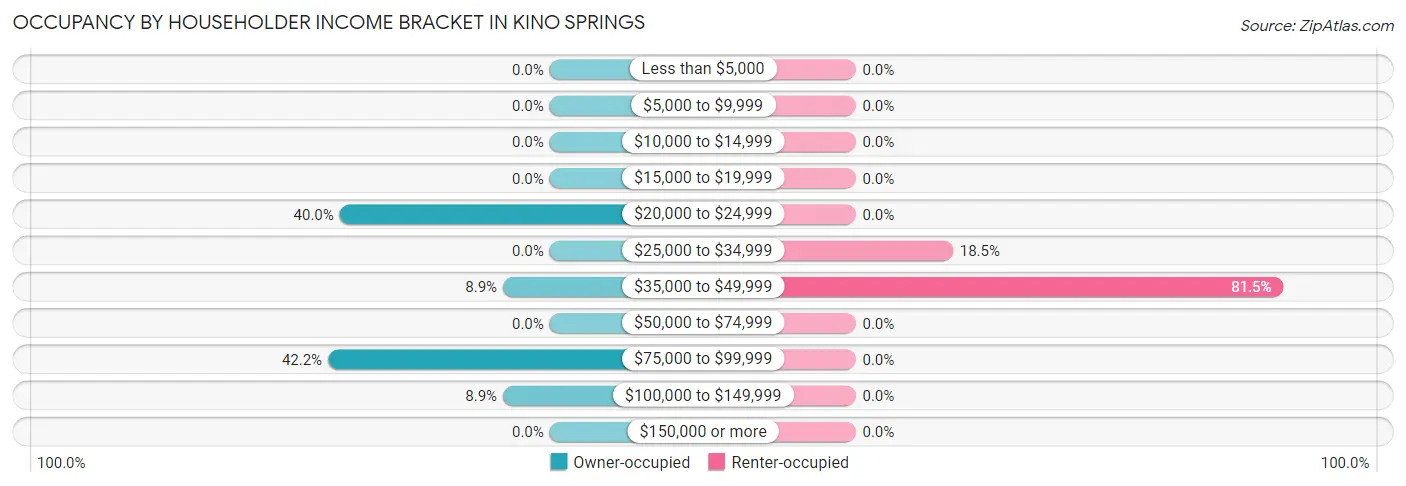
| Income Bracket | Owner-occupied | Renter-occupied |
| Less than $5,000 | 0 (0.0%) | 0 (0.0%) |
| $5,000 to $9,999 | 0 (0.0%) | 0 (0.0%) |
| $10,000 to $14,999 | 0 (0.0%) | 0 (0.0%) |
| $15,000 to $19,999 | 0 (0.0%) | 0 (0.0%) |
| $20,000 to $24,999 | 18 (40.0%) | 0 (0.0%) |
| $25,000 to $34,999 | 0 (0.0%) | 5 (18.5%) |
| $35,000 to $49,999 | 4 (8.9%) | 22 (81.5%) |
| $50,000 to $74,999 | 0 (0.0%) | 0 (0.0%) |
| $75,000 to $99,999 | 19 (42.2%) | 0 (0.0%) |
| $100,000 to $149,999 | 4 (8.9%) | 0 (0.0%) |
| $150,000 or more | 0 (0.0%) | 0 (0.0%) |
| Total | 45 (100.0%) | 27 (100.0%) |
Monthly Housing Cost Tiers in Kino Springs
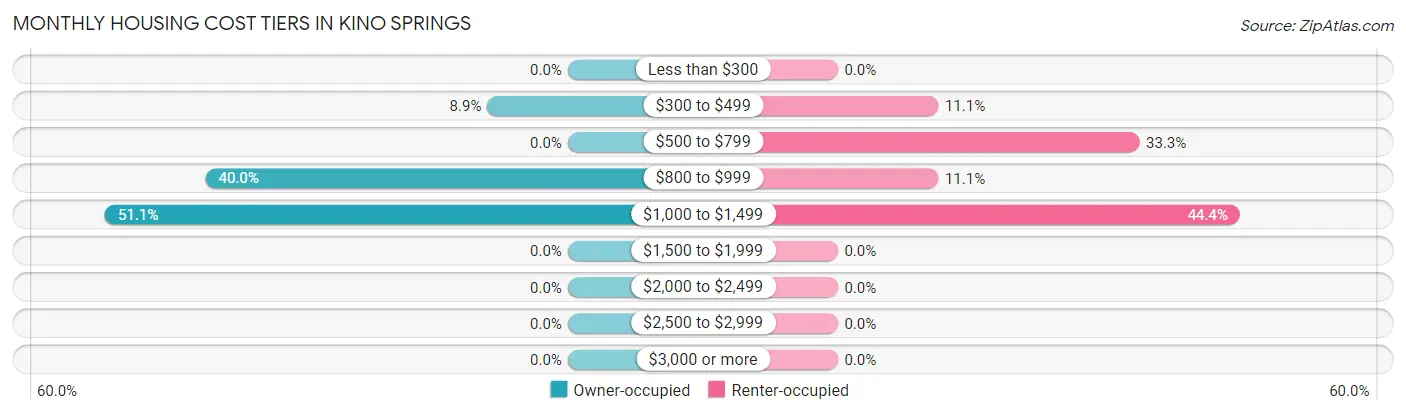
| Monthly Cost | Owner-occupied | Renter-occupied |
| Less than $300 | 0 (0.0%) | 0 (0.0%) |
| $300 to $499 | 4 (8.9%) | 3 (11.1%) |
| $500 to $799 | 0 (0.0%) | 9 (33.3%) |
| $800 to $999 | 18 (40.0%) | 3 (11.1%) |
| $1,000 to $1,499 | 23 (51.1%) | 12 (44.4%) |
| $1,500 to $1,999 | 0 (0.0%) | 0 (0.0%) |
| $2,000 to $2,499 | 0 (0.0%) | 0 (0.0%) |
| $2,500 to $2,999 | 0 (0.0%) | 0 (0.0%) |
| $3,000 or more | 0 (0.0%) | 0 (0.0%) |
| Total | 45 (100.0%) | 27 (100.0%) |
Physical Housing Characteristics in Kino Springs
Housing Structures in Kino Springs
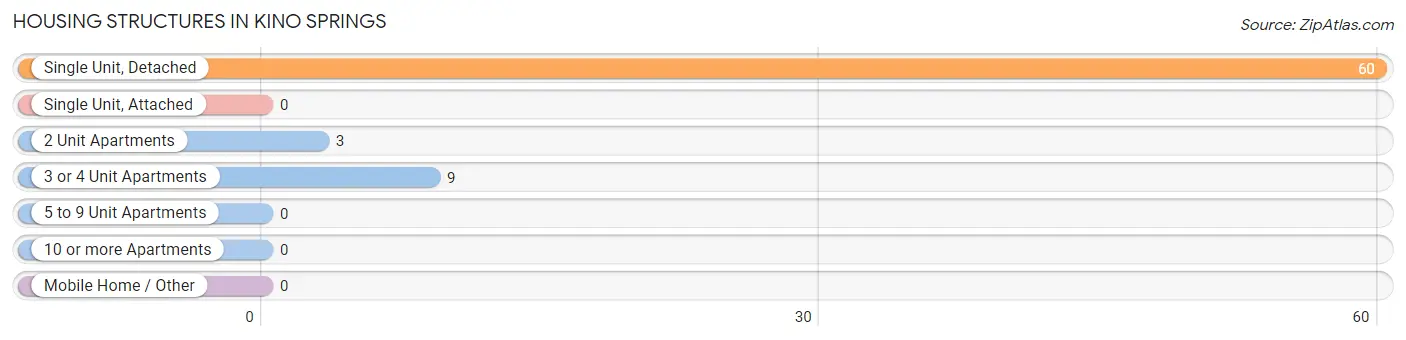
| Structure Type | # Housing Units | % Housing Units |
| Single Unit, Detached | 60 | 83.3% |
| Single Unit, Attached | 0 | 0.0% |
| 2 Unit Apartments | 3 | 4.2% |
| 3 or 4 Unit Apartments | 9 | 12.5% |
| 5 to 9 Unit Apartments | 0 | 0.0% |
| 10 or more Apartments | 0 | 0.0% |
| Mobile Home / Other | 0 | 0.0% |
| Total | 72 | 100.0% |
Housing Structures by Occupancy in Kino Springs
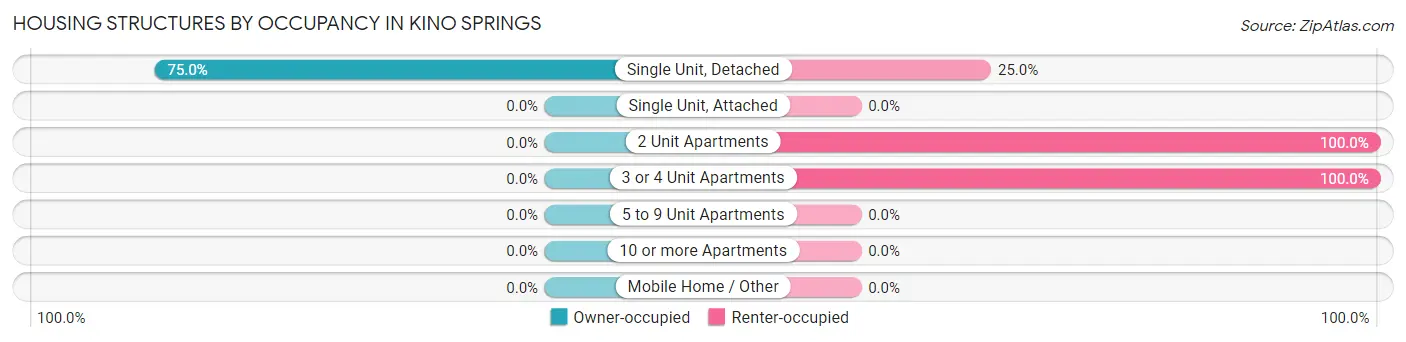
| Structure Type | Owner-occupied | Renter-occupied |
| Single Unit, Detached | 45 (75.0%) | 15 (25.0%) |
| Single Unit, Attached | 0 (0.0%) | 0 (0.0%) |
| 2 Unit Apartments | 0 (0.0%) | 3 (100.0%) |
| 3 or 4 Unit Apartments | 0 (0.0%) | 9 (100.0%) |
| 5 to 9 Unit Apartments | 0 (0.0%) | 0 (0.0%) |
| 10 or more Apartments | 0 (0.0%) | 0 (0.0%) |
| Mobile Home / Other | 0 (0.0%) | 0 (0.0%) |
| Total | 45 (62.5%) | 27 (37.5%) |
Housing Structures by Number of Rooms in Kino Springs
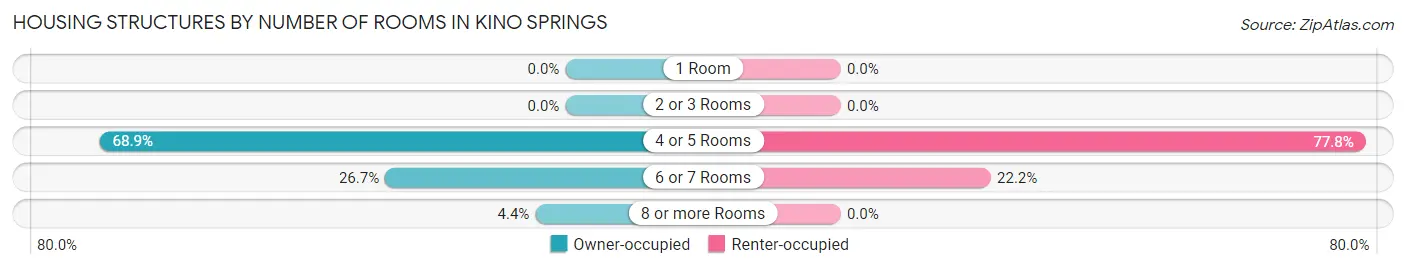
| Number of Rooms | Owner-occupied | Renter-occupied |
| 1 Room | 0 (0.0%) | 0 (0.0%) |
| 2 or 3 Rooms | 0 (0.0%) | 0 (0.0%) |
| 4 or 5 Rooms | 31 (68.9%) | 21 (77.8%) |
| 6 or 7 Rooms | 12 (26.7%) | 6 (22.2%) |
| 8 or more Rooms | 2 (4.4%) | 0 (0.0%) |
| Total | 45 (100.0%) | 27 (100.0%) |
Housing Structure by Heating Type in Kino Springs
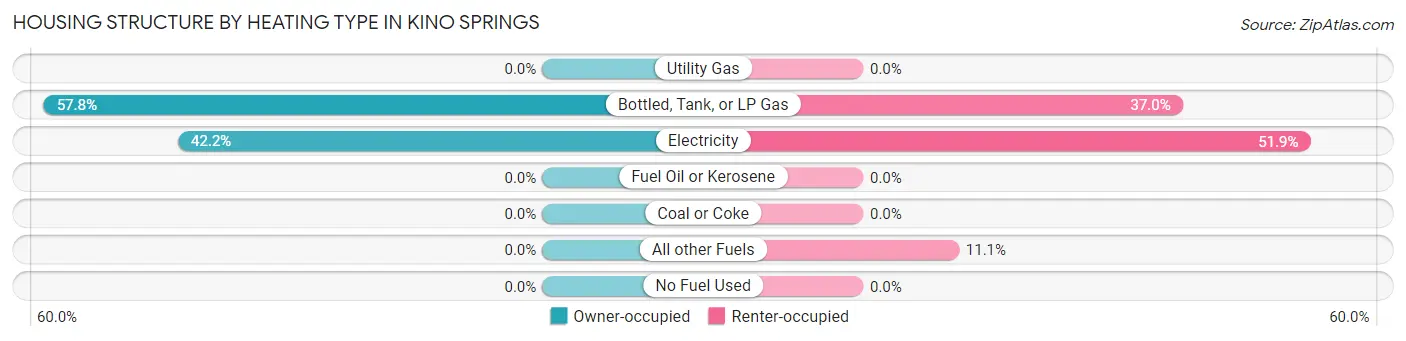
| Heating Type | Owner-occupied | Renter-occupied |
| Utility Gas | 0 (0.0%) | 0 (0.0%) |
| Bottled, Tank, or LP Gas | 26 (57.8%) | 10 (37.0%) |
| Electricity | 19 (42.2%) | 14 (51.8%) |
| Fuel Oil or Kerosene | 0 (0.0%) | 0 (0.0%) |
| Coal or Coke | 0 (0.0%) | 0 (0.0%) |
| All other Fuels | 0 (0.0%) | 3 (11.1%) |
| No Fuel Used | 0 (0.0%) | 0 (0.0%) |
| Total | 45 (100.0%) | 27 (100.0%) |
Household Vehicle Usage in Kino Springs
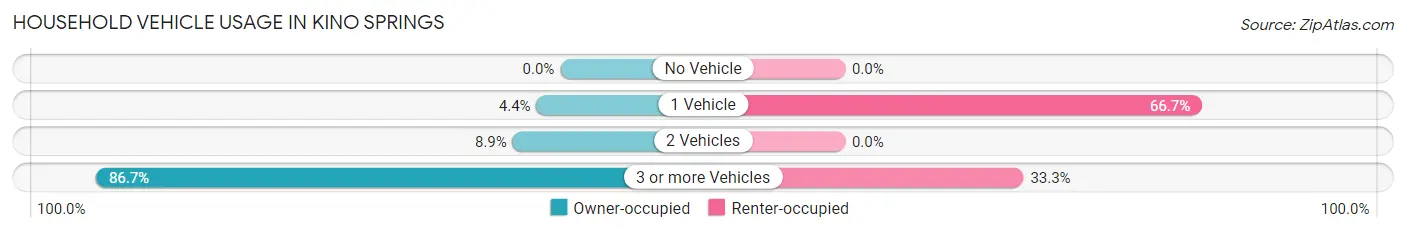
| Vehicles per Household | Owner-occupied | Renter-occupied |
| No Vehicle | 0 (0.0%) | 0 (0.0%) |
| 1 Vehicle | 2 (4.4%) | 18 (66.7%) |
| 2 Vehicles | 4 (8.9%) | 0 (0.0%) |
| 3 or more Vehicles | 39 (86.7%) | 9 (33.3%) |
| Total | 45 (100.0%) | 27 (100.0%) |
Real Estate & Mortgages in Kino Springs
Real Estate and Mortgage Overview in Kino Springs
| Characteristic | Without Mortgage | With Mortgage |
| Housing Units | 0 | 45 |
| Median Property Value | - | - |
| Median Household Income | - | - |
| Monthly Housing Costs | - | - |
| Real Estate Taxes | - | - |
Property Value by Mortgage Status in Kino Springs
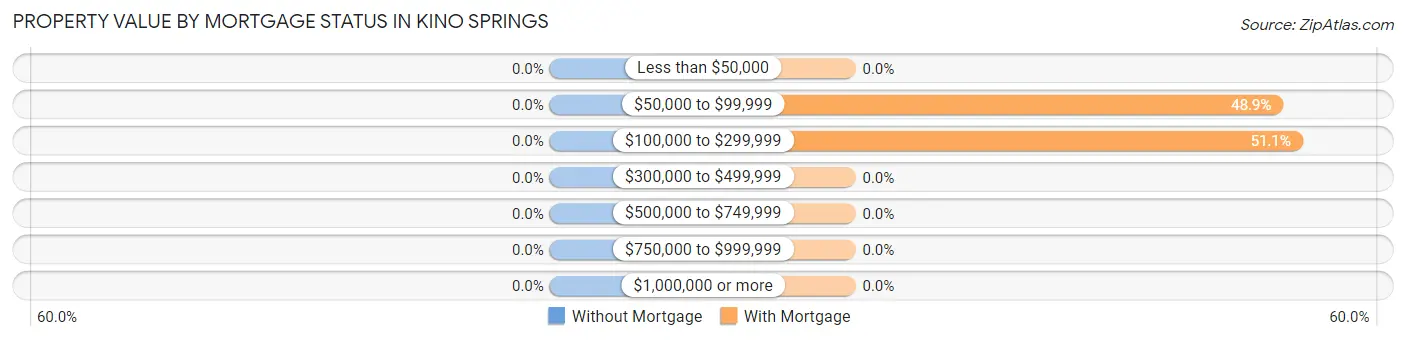
| Property Value | Without Mortgage | With Mortgage |
| Less than $50,000 | 0 (0.0%) | 0 (0.0%) |
| $50,000 to $99,999 | 0 (0.0%) | 22 (48.9%) |
| $100,000 to $299,999 | 0 (0.0%) | 23 (51.1%) |
| $300,000 to $499,999 | 0 (0.0%) | 0 (0.0%) |
| $500,000 to $749,999 | 0 (0.0%) | 0 (0.0%) |
| $750,000 to $999,999 | 0 (0.0%) | 0 (0.0%) |
| $1,000,000 or more | 0 (0.0%) | 0 (0.0%) |
| Total | 0 (0.0%) | 45 (100.0%) |
Household Income by Mortgage Status in Kino Springs
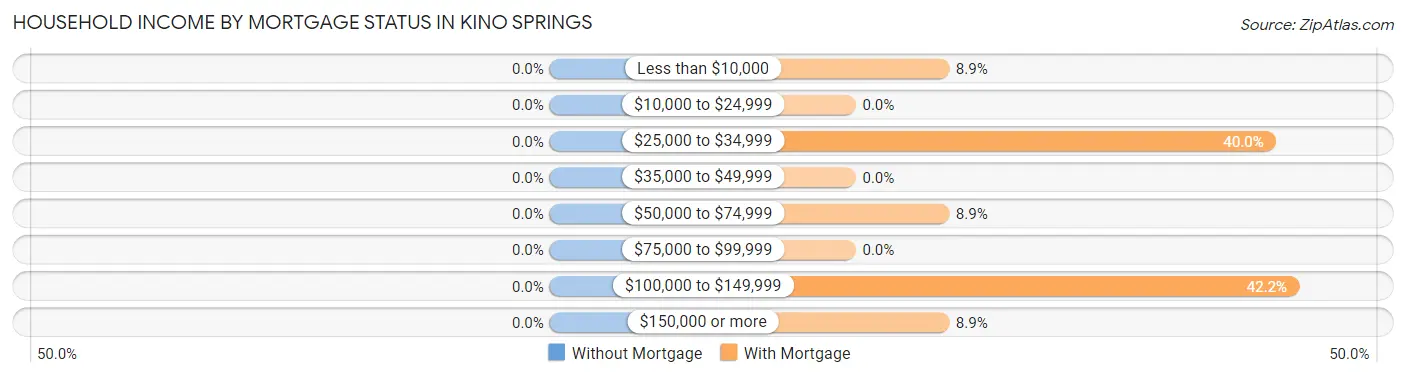
| Household Income | Without Mortgage | With Mortgage |
| Less than $10,000 | 0 (0.0%) | 4 (8.9%) |
| $10,000 to $24,999 | 0 (0.0%) | 0 (0.0%) |
| $25,000 to $34,999 | 0 (0.0%) | 18 (40.0%) |
| $35,000 to $49,999 | 0 (0.0%) | 0 (0.0%) |
| $50,000 to $74,999 | 0 (0.0%) | 4 (8.9%) |
| $75,000 to $99,999 | 0 (0.0%) | 0 (0.0%) |
| $100,000 to $149,999 | 0 (0.0%) | 19 (42.2%) |
| $150,000 or more | 0 (0.0%) | 4 (8.9%) |
| Total | 0 (0.0%) | 45 (100.0%) |
Property Value to Household Income Ratio in Kino Springs
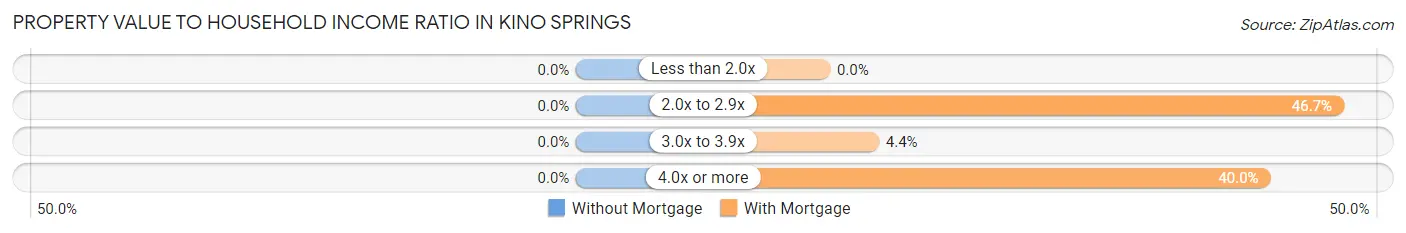
| Value-to-Income Ratio | Without Mortgage | With Mortgage |
| Less than 2.0x | 0 (0.0%) | 0 (0.0%) |
| 2.0x to 2.9x | 0 (0.0%) | 21 (46.7%) |
| 3.0x to 3.9x | 0 (0.0%) | 2 (4.4%) |
| 4.0x or more | 0 (0.0%) | 18 (40.0%) |
| Total | 0 (0.0%) | 45 (100.0%) |
Real Estate Taxes by Mortgage Status in Kino Springs
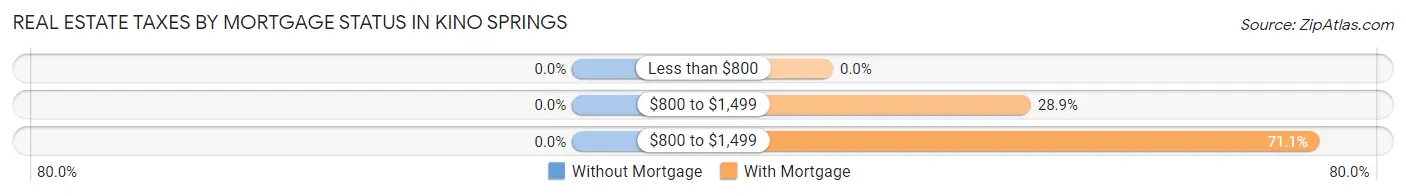
| Property Taxes | Without Mortgage | With Mortgage |
| Less than $800 | 0 (0.0%) | 0 (0.0%) |
| $800 to $1,499 | 0 (0.0%) | 13 (28.9%) |
| $800 to $1,499 | 0 (0.0%) | 32 (71.1%) |
| Total | 0 (0.0%) | 45 (100.0%) |
Health & Disability in Kino Springs
Health Insurance Coverage by Age in Kino Springs
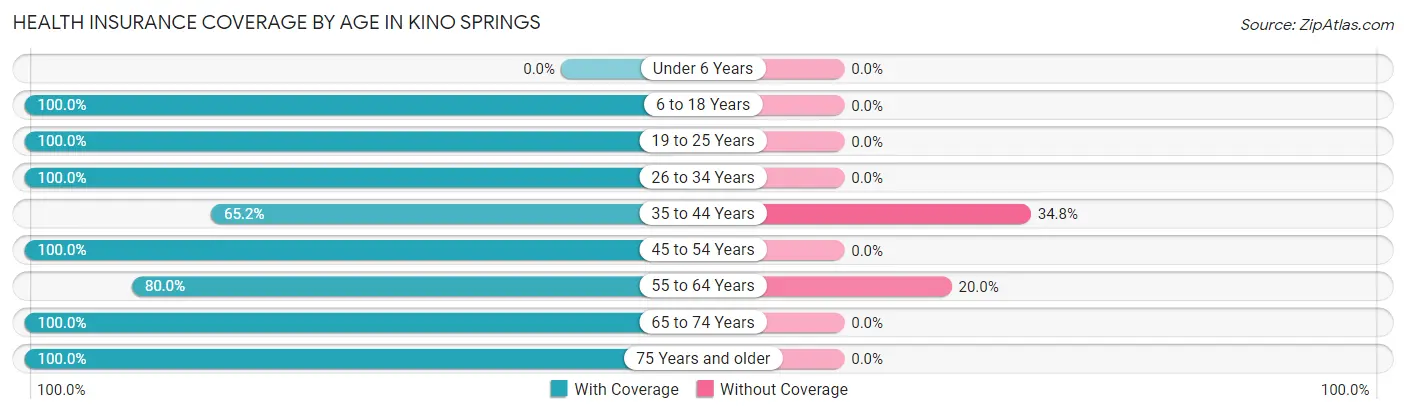
| Age Bracket | With Coverage | Without Coverage |
| Under 6 Years | 0 (0.0%) | 0 (0.0%) |
| 6 to 18 Years | 29 (100.0%) | 0 (0.0%) |
| 19 to 25 Years | 12 (100.0%) | 0 (0.0%) |
| 26 to 34 Years | 5 (100.0%) | 0 (0.0%) |
| 35 to 44 Years | 15 (65.2%) | 8 (34.8%) |
| 45 to 54 Years | 30 (100.0%) | 0 (0.0%) |
| 55 to 64 Years | 24 (80.0%) | 6 (20.0%) |
| 65 to 74 Years | 11 (100.0%) | 0 (0.0%) |
| 75 Years and older | 14 (100.0%) | 0 (0.0%) |
| Total | 140 (90.9%) | 14 (9.1%) |
Health Insurance Coverage by Citizenship Status in Kino Springs
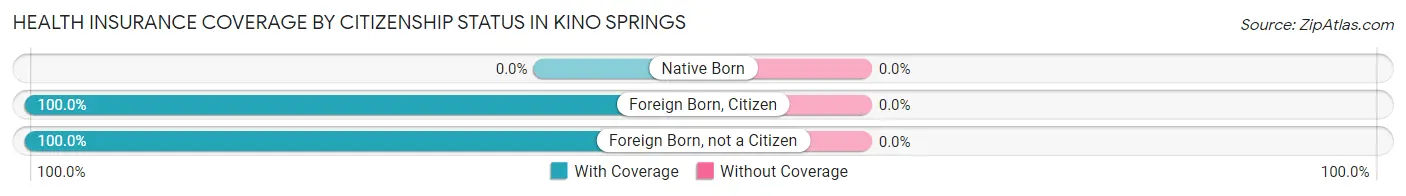
| Citizenship Status | With Coverage | Without Coverage |
| Native Born | 0 (0.0%) | 0 (0.0%) |
| Foreign Born, Citizen | 29 (100.0%) | 0 (0.0%) |
| Foreign Born, not a Citizen | 12 (100.0%) | 0 (0.0%) |
Health Insurance Coverage by Household Income in Kino Springs
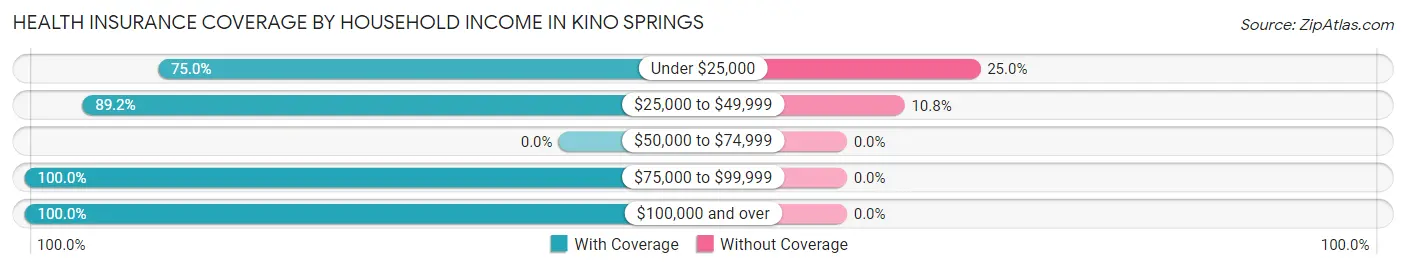
| Household Income | With Coverage | Without Coverage |
| Under $25,000 | 18 (75.0%) | 6 (25.0%) |
| $25,000 to $49,999 | 66 (89.2%) | 8 (10.8%) |
| $50,000 to $74,999 | 0 (0.0%) | 0 (0.0%) |
| $75,000 to $99,999 | 41 (100.0%) | 0 (0.0%) |
| $100,000 and over | 15 (100.0%) | 0 (0.0%) |
Public vs Private Health Insurance Coverage by Age in Kino Springs
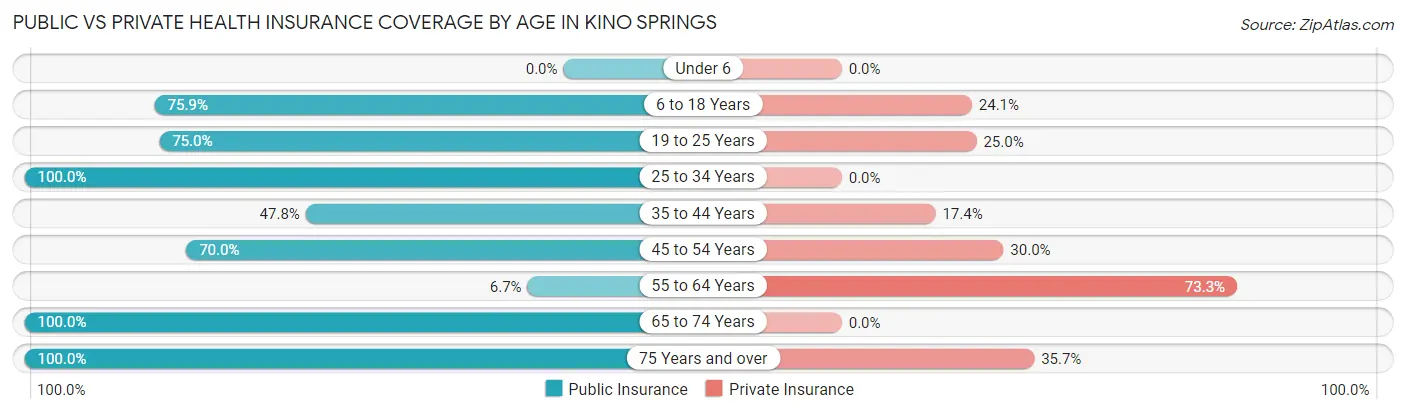
| Age Bracket | Public Insurance | Private Insurance |
| Under 6 | 0 (0.0%) | 0 (0.0%) |
| 6 to 18 Years | 22 (75.9%) | 7 (24.1%) |
| 19 to 25 Years | 9 (75.0%) | 3 (25.0%) |
| 25 to 34 Years | 5 (100.0%) | 0 (0.0%) |
| 35 to 44 Years | 11 (47.8%) | 4 (17.4%) |
| 45 to 54 Years | 21 (70.0%) | 9 (30.0%) |
| 55 to 64 Years | 2 (6.7%) | 22 (73.3%) |
| 65 to 74 Years | 11 (100.0%) | 0 (0.0%) |
| 75 Years and over | 14 (100.0%) | 5 (35.7%) |
| Total | 95 (61.7%) | 50 (32.5%) |
Disability Status by Sex by Age in Kino Springs
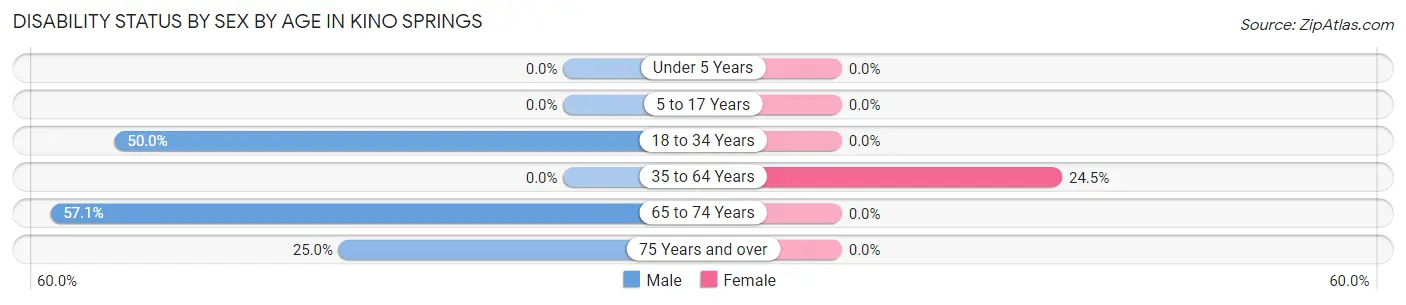
| Age Bracket | Male | Female |
| Under 5 Years | 0 (0.0%) | 0 (0.0%) |
| 5 to 17 Years | 0 (0.0%) | 0 (0.0%) |
| 18 to 34 Years | 3 (50.0%) | 0 (0.0%) |
| 35 to 64 Years | 0 (0.0%) | 13 (24.5%) |
| 65 to 74 Years | 4 (57.1%) | 0 (0.0%) |
| 75 Years and over | 3 (25.0%) | 0 (0.0%) |
Disability Class by Sex by Age in Kino Springs
Disability Class: Hearing Difficulty
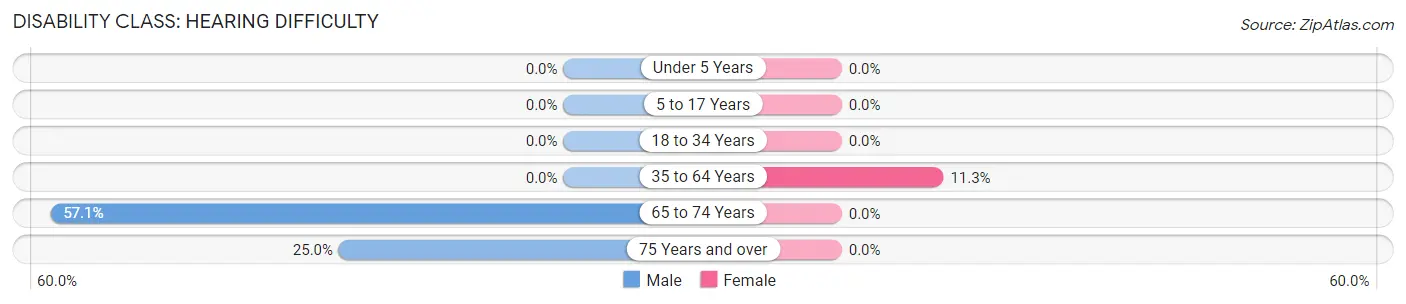
| Age Bracket | Male | Female |
| Under 5 Years | 0 (0.0%) | 0 (0.0%) |
| 5 to 17 Years | 0 (0.0%) | 0 (0.0%) |
| 18 to 34 Years | 0 (0.0%) | 0 (0.0%) |
| 35 to 64 Years | 0 (0.0%) | 6 (11.3%) |
| 65 to 74 Years | 4 (57.1%) | 0 (0.0%) |
| 75 Years and over | 3 (25.0%) | 0 (0.0%) |
Disability Class: Vision Difficulty
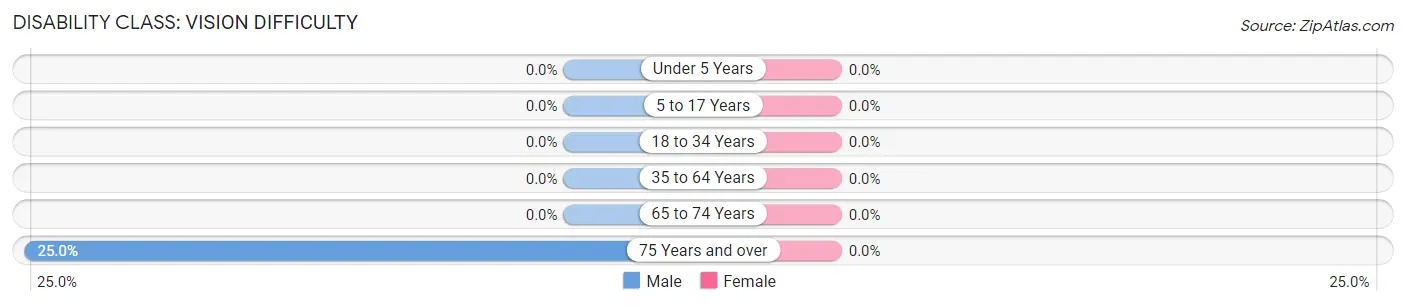
| Age Bracket | Male | Female |
| Under 5 Years | 0 (0.0%) | 0 (0.0%) |
| 5 to 17 Years | 0 (0.0%) | 0 (0.0%) |
| 18 to 34 Years | 0 (0.0%) | 0 (0.0%) |
| 35 to 64 Years | 0 (0.0%) | 0 (0.0%) |
| 65 to 74 Years | 0 (0.0%) | 0 (0.0%) |
| 75 Years and over | 3 (25.0%) | 0 (0.0%) |
Disability Class: Cognitive Difficulty
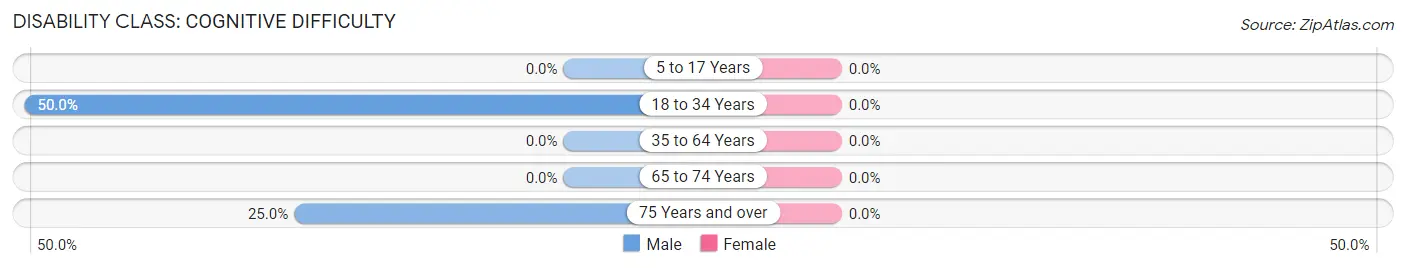
| Age Bracket | Male | Female |
| 5 to 17 Years | 0 (0.0%) | 0 (0.0%) |
| 18 to 34 Years | 3 (50.0%) | 0 (0.0%) |
| 35 to 64 Years | 0 (0.0%) | 0 (0.0%) |
| 65 to 74 Years | 0 (0.0%) | 0 (0.0%) |
| 75 Years and over | 3 (25.0%) | 0 (0.0%) |
Disability Class: Ambulatory Difficulty
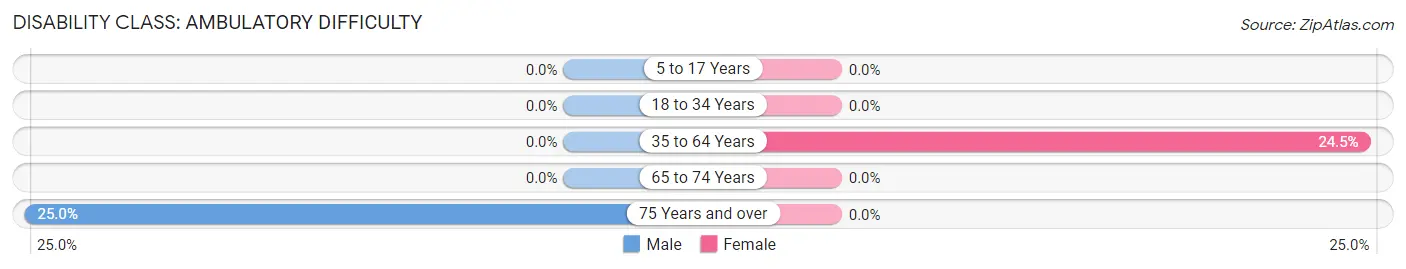
| Age Bracket | Male | Female |
| 5 to 17 Years | 0 (0.0%) | 0 (0.0%) |
| 18 to 34 Years | 0 (0.0%) | 0 (0.0%) |
| 35 to 64 Years | 0 (0.0%) | 13 (24.5%) |
| 65 to 74 Years | 0 (0.0%) | 0 (0.0%) |
| 75 Years and over | 3 (25.0%) | 0 (0.0%) |
Disability Class: Self-Care Difficulty
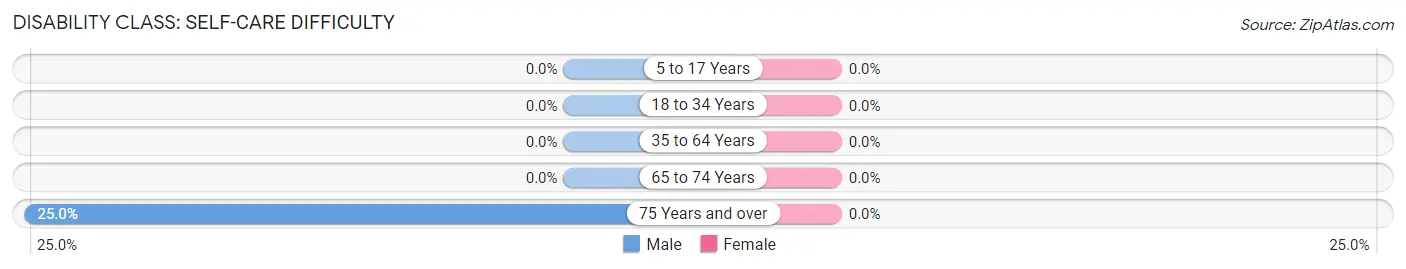
| Age Bracket | Male | Female |
| 5 to 17 Years | 0 (0.0%) | 0 (0.0%) |
| 18 to 34 Years | 0 (0.0%) | 0 (0.0%) |
| 35 to 64 Years | 0 (0.0%) | 0 (0.0%) |
| 65 to 74 Years | 0 (0.0%) | 0 (0.0%) |
| 75 Years and over | 3 (25.0%) | 0 (0.0%) |
Technology Access in Kino Springs
Computing Device Access in Kino Springs
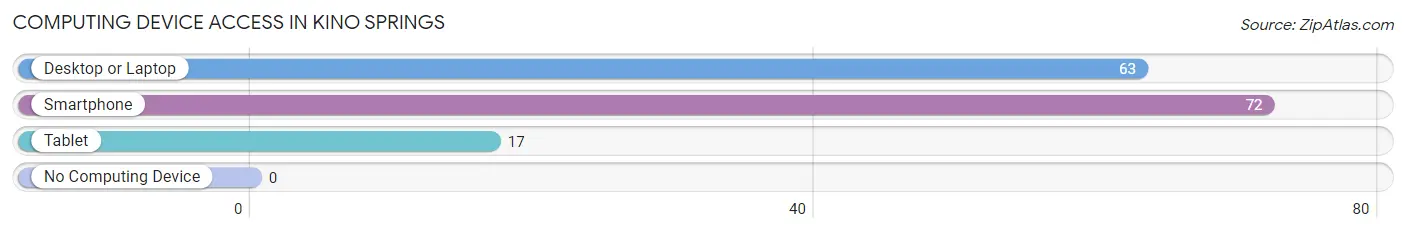
| Device Type | # Households | % Households |
| Desktop or Laptop | 63 | 87.5% |
| Smartphone | 72 | 100.0% |
| Tablet | 17 | 23.6% |
| No Computing Device | 0 | 0.0% |
| Total | 72 | 100.0% |
Internet Access in Kino Springs
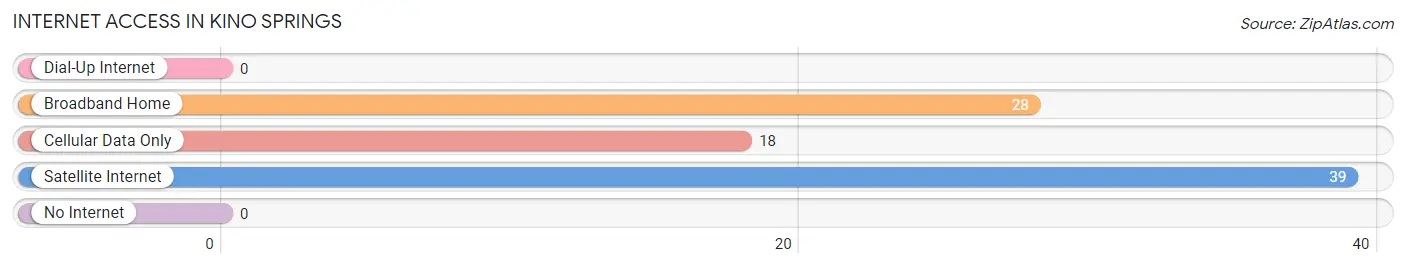
| Internet Type | # Households | % Households |
| Dial-Up Internet | 0 | 0.0% |
| Broadband Home | 28 | 38.9% |
| Cellular Data Only | 18 | 25.0% |
| Satellite Internet | 39 | 54.2% |
| No Internet | 0 | 0.0% |
| Total | 72 | 100.0% |
Kino Springs Summary
Kino Springs is a small unincorporated community located in Santa Cruz County, Arizona. It is situated on the banks of the Santa Cruz River, approximately 20 miles south of Tucson. The community is named after the nearby Kino Springs Golf Course, which was built in the early 1900s by the Kino family.
History
Kino Springs was originally inhabited by the Tohono O’odham people, who were the first to settle in the area. The Tohono O’odham were a semi-nomadic tribe that lived in the Sonoran Desert and were known for their basket weaving and pottery. The Tohono O’odham were displaced by the Spanish in the late 1700s, and the area was later settled by Mexican ranchers.
In the early 1900s, the Kino family purchased the land and built the Kino Springs Golf Course. The golf course was a popular destination for wealthy tourists from the United States and Mexico. The Kino family also built a hotel and a restaurant, which were frequented by the tourists.
In the 1950s, the Kino family sold the land to the Arizona State Land Department. The land was then sold to private developers, who built the Kino Springs subdivision. The subdivision was designed to be a retirement community for wealthy retirees.
Geography
Kino Springs is located in the Sonoran Desert, which is characterized by hot, dry summers and mild winters. The area is known for its cacti and other desert vegetation. The Santa Cruz River runs through the area, providing a source of water for the community.
The Kino Springs Golf Course is located on the banks of the Santa Cruz River. The golf course is a par-72, 18-hole course that is open to the public. The course is known for its challenging terrain and scenic views.
Economy
Kino Springs is a small, rural community with a limited economy. The main source of income for the community is tourism, as the Kino Springs Golf Course is a popular destination for golfers from around the world. The community also has a few small businesses, such as a convenience store and a restaurant.
Demographics
As of the 2010 census, the population of Kino Springs was 1,845. The population is predominantly Hispanic, with a small percentage of Native American and White residents. The median household income is $37,000, and the median home value is $150,000. The unemployment rate is 8.3%, which is slightly higher than the national average.
Common Questions
What is Per Capita Income in Kino Springs?
Per Capita income in Kino Springs is $24,203.
What is the Median Family Income in Kino Springs?
Median Family Income in Kino Springs is $38,750.
What is the Median Household income in Kino Springs?
Median Household Income in Kino Springs is $43,846.
What is Inequality or Gini Index in Kino Springs?
Inequality or Gini Index in Kino Springs is 0.31.
What is the Total Population of Kino Springs?
Total Population of Kino Springs is 154.
What is the Total Male Population of Kino Springs?
Total Male Population of Kino Springs is 80.
What is the Total Female Population of Kino Springs?
Total Female Population of Kino Springs is 74.
What is the Ratio of Males per 100 Females in Kino Springs?
There are 108.11 Males per 100 Females in Kino Springs.
What is the Ratio of Females per 100 Males in Kino Springs?
There are 92.50 Females per 100 Males in Kino Springs.
What is the Median Population Age in Kino Springs?
Median Population Age in Kino Springs is 49.6 Years.
What is the Average Family Size in Kino Springs
Average Family Size in Kino Springs is 2.5 People.
What is the Average Household Size in Kino Springs
Average Household Size in Kino Springs is 2.1 People.
How Large is the Labor Force in Kino Springs?
There are 54 People in the Labor Forcein in Kino Springs.
What is the Percentage of People in the Labor Force in Kino Springs?
41.9% of People are in the Labor Force in Kino Springs.
What is the Unemployment Rate in Kino Springs?
Unemployment Rate in Kino Springs is 14.8%.