Sacaton, AZ Map & Demographics
Sacaton Map
Sacaton Overview
$13,879
PER CAPITA INCOME
$29,347
AVG HOUSEHOLD INCOME
0.53
INEQUALITY / GINI INDEX
2,713
TOTAL POPULATION
1,434
MALE POPULATION
1,279
FEMALE POPULATION
112.12
MALES / 100 FEMALES
89.19
FEMALES / 100 MALES
30.0
MEDIAN AGE
3.9
AVG FAMILY SIZE
3.3
AVG HOUSEHOLD SIZE
598
LABOR FORCE [ PEOPLE ]
27.7%
PERCENT IN LABOR FORCE
9.4%
UNEMPLOYMENT RATE
Sacaton Zip Codes
Sacaton Area Codes
Income in Sacaton
Income Overview in Sacaton
| Characteristic | Number | Measure |
| Per Capita Income | 2,713 | $13,879 |
| Median Family Income | 476 | $0 |
| Mean Family Income | 476 | $63,267 |
| Median Household Income | 695 | $29,347 |
| Mean Household Income | 695 | $53,502 |
| Income Deficit | 476 | $0 |
| Wage / Income Gap (%) | 2,713 | 0.00% |
| Wage / Income Gap ($) | 2,713 | 100.00¢ per $1 |
| Gini / Inequality Index | 2,713 | 0.53 |
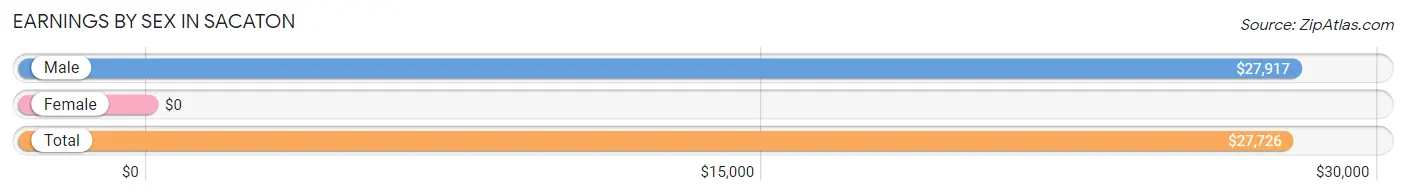
Earnings by Sex in Sacaton
| Sex | Number | Average Earnings |
| Male | 535 (64.7%) | $27,917 |
| Female | 292 (35.3%) | $0 |
| Total | 827 (100.0%) | $27,726 |
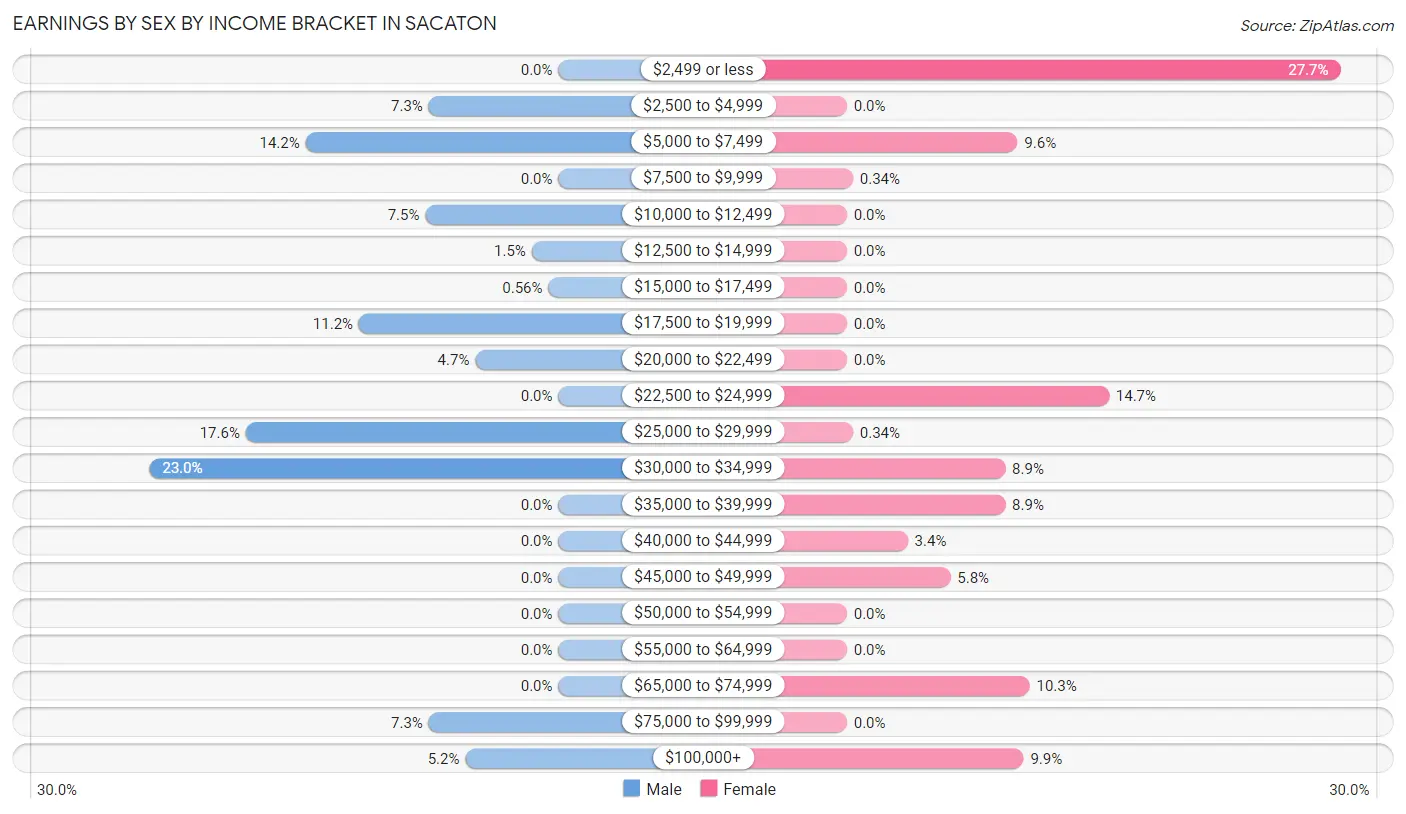
Earnings by Sex by Income Bracket in Sacaton
The most common earnings brackets in Sacaton are $30,000 to $34,999 for men (123 | 23.0%) and $2,499 or less for women (81 | 27.7%).
| Income | Male | Female |
| $2,499 or less | 0 (0.0%) | 81 (27.7%) |
| $2,500 to $4,999 | 39 (7.3%) | 0 (0.0%) |
| $5,000 to $7,499 | 76 (14.2%) | 28 (9.6%) |
| $7,500 to $9,999 | 0 (0.0%) | 1 (0.3%) |
| $10,000 to $12,499 | 40 (7.5%) | 0 (0.0%) |
| $12,500 to $14,999 | 8 (1.5%) | 0 (0.0%) |
| $15,000 to $17,499 | 3 (0.6%) | 0 (0.0%) |
| $17,500 to $19,999 | 60 (11.2%) | 0 (0.0%) |
| $20,000 to $22,499 | 25 (4.7%) | 0 (0.0%) |
| $22,500 to $24,999 | 0 (0.0%) | 43 (14.7%) |
| $25,000 to $29,999 | 94 (17.6%) | 1 (0.3%) |
| $30,000 to $34,999 | 123 (23.0%) | 26 (8.9%) |
| $35,000 to $39,999 | 0 (0.0%) | 26 (8.9%) |
| $40,000 to $44,999 | 0 (0.0%) | 10 (3.4%) |
| $45,000 to $49,999 | 0 (0.0%) | 17 (5.8%) |
| $50,000 to $54,999 | 0 (0.0%) | 0 (0.0%) |
| $55,000 to $64,999 | 0 (0.0%) | 0 (0.0%) |
| $65,000 to $74,999 | 0 (0.0%) | 30 (10.3%) |
| $75,000 to $99,999 | 39 (7.3%) | 0 (0.0%) |
| $100,000+ | 28 (5.2%) | 29 (9.9%) |
| Total | 535 (100.0%) | 292 (100.0%) |
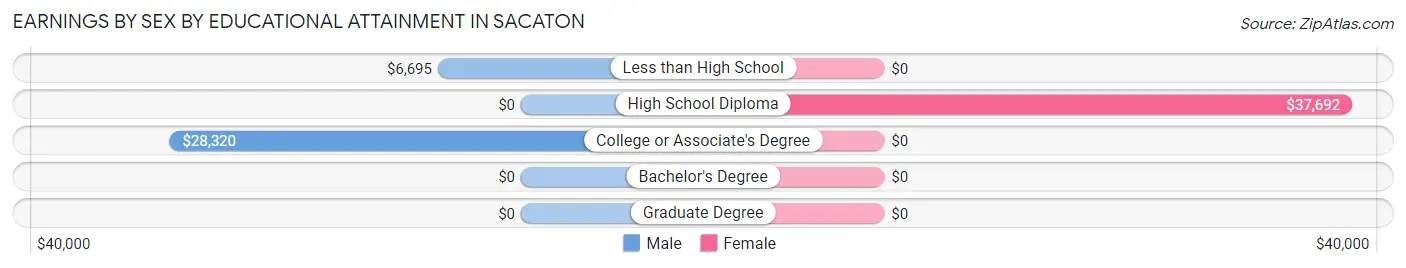
Earnings by Sex by Educational Attainment in Sacaton
Average earnings in Sacaton are $27,608 for men and $31,683 for women, a difference of 12.9%. Men with an educational attainment of college or associate's degree enjoy the highest average annual earnings of $28,320, while those with less than high school education earn the least with $6,695. Women with an educational attainment of high school diploma earn the most with the average annual earnings of $37,692, while those with high school diploma education have the smallest earnings of $37,692.
| Educational Attainment | Male Income | Female Income |
| Less than High School | $6,695 | $0 |
| High School Diploma | - | - |
| College or Associate's Degree | $28,320 | $0 |
| Bachelor's Degree | - | - |
| Graduate Degree | - | - |
| Total | $27,608 | $31,683 |
Family Income in Sacaton
Family Income Brackets in Sacaton
According to the Sacaton family income data, there are 115 families falling into the less than $10,000 income range, which is the most common income bracket and makes up 24.2% of all families.
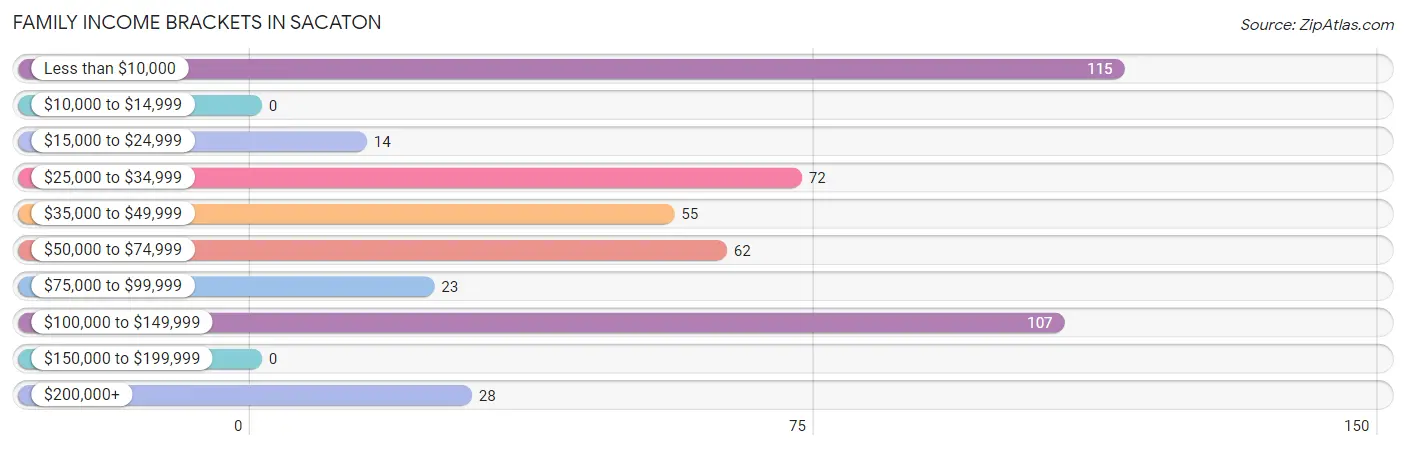
| Income Bracket | # Families | % Families |
| Less than $10,000 | 115 | 24.2% |
| $10,000 to $14,999 | 0 | 0.0% |
| $15,000 to $24,999 | 14 | 2.9% |
| $25,000 to $34,999 | 72 | 15.1% |
| $35,000 to $49,999 | 55 | 11.6% |
| $50,000 to $74,999 | 62 | 13.0% |
| $75,000 to $99,999 | 23 | 4.8% |
| $100,000 to $149,999 | 107 | 22.5% |
| $150,000 to $199,999 | 0 | 0.0% |
| $200,000+ | 28 | 5.9% |
Family Income by Famaliy Size in Sacaton
5-person families (173 | 36.3%) account for the highest median family income in Sacaton with $113,172 per family, while 5-person families (173 | 36.3%) have the highest median income of $22,634 per family member.
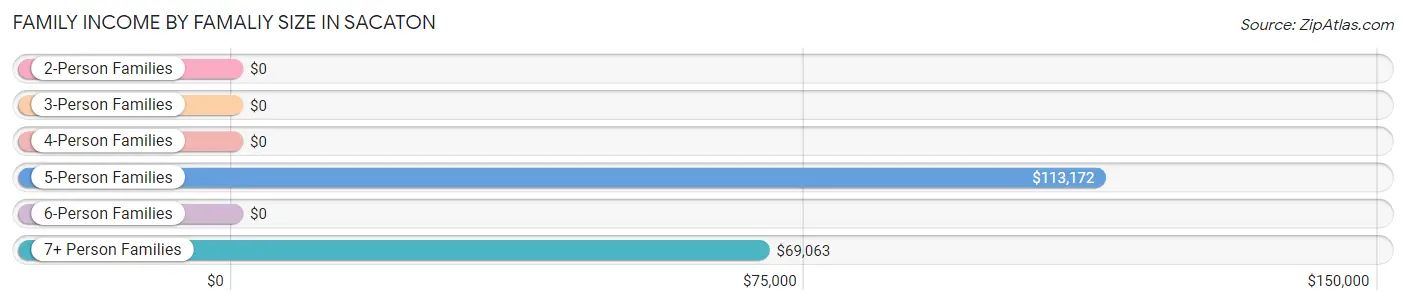
| Income Bracket | # Families | Median Income |
| 2-Person Families | 98 (20.6%) | $0 |
| 3-Person Families | 120 (25.2%) | $0 |
| 4-Person Families | 0 (0.0%) | $0 |
| 5-Person Families | 173 (36.3%) | $113,172 |
| 6-Person Families | 0 (0.0%) | $0 |
| 7+ Person Families | 85 (17.9%) | $69,063 |
| Total | 476 (100.0%) | $0 |
Family Income by Number of Earners in Sacaton
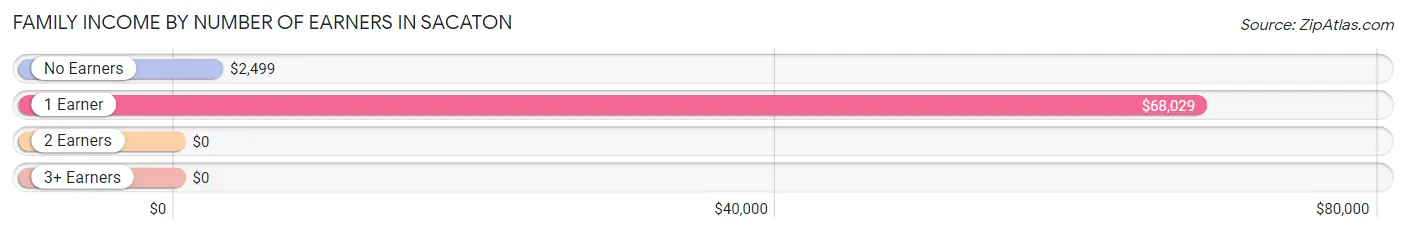
| Number of Earners | # Families | Median Income |
| No Earners | 115 (24.2%) | $2,499 |
| 1 Earner | 242 (50.8%) | $68,029 |
| 2 Earners | 37 (7.8%) | $0 |
| 3+ Earners | 82 (17.2%) | $0 |
| Total | 476 (100.0%) | $0 |
Household Income in Sacaton
Household Income Brackets in Sacaton
With 198 households falling in the category, the less than $10,000 income range is the most frequent in Sacaton, accounting for 28.5% of all households.
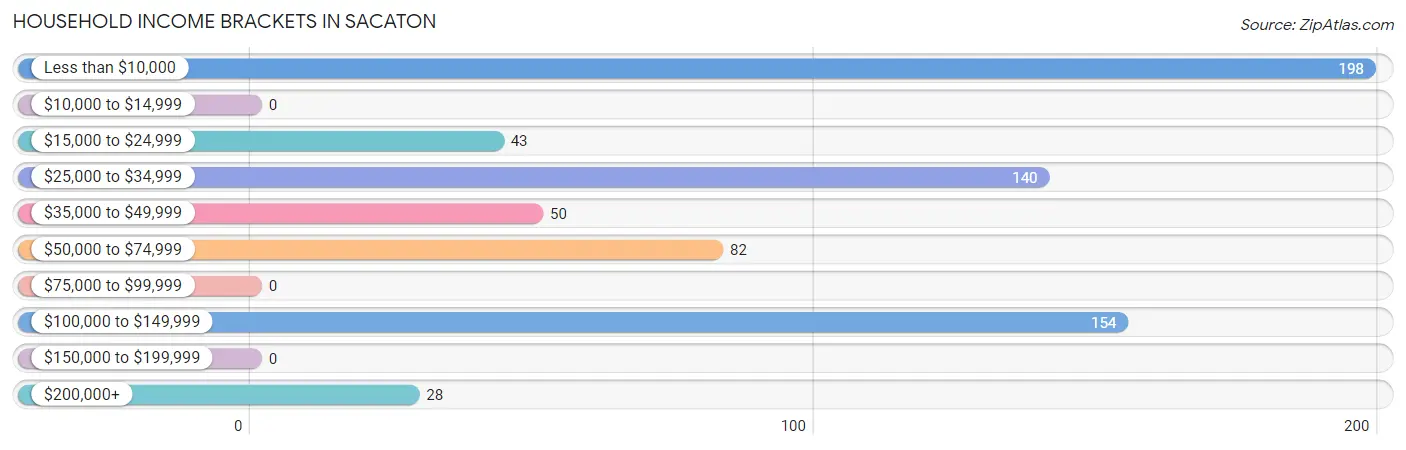
| Income Bracket | # Households | % Households |
| Less than $10,000 | 198 | 28.5% |
| $10,000 to $14,999 | 0 | 0.0% |
| $15,000 to $24,999 | 43 | 6.2% |
| $25,000 to $34,999 | 140 | 20.1% |
| $35,000 to $49,999 | 50 | 7.2% |
| $50,000 to $74,999 | 82 | 11.8% |
| $75,000 to $99,999 | 0 | 0.0% |
| $100,000 to $149,999 | 154 | 22.2% |
| $150,000 to $199,999 | 0 | 0.0% |
| $200,000+ | 28 | 4.0% |
Household Income by Householder Age in Sacaton
| Income Bracket | # Households | Median Income |
| 15 to 24 Years | 49 (7.0%) | $0 |
| 25 to 44 Years | 147 (21.1%) | $0 |
| 45 to 64 Years | 302 (43.4%) | $0 |
| 65+ Years | 197 (28.3%) | $0 |
| Total | 695 (100.0%) | $29,347 |
Poverty in Sacaton
Income Below Poverty by Sex and Age in Sacaton
With 23.0% poverty level for males and 33.4% for females among the residents of Sacaton, 6 to 11 year old males and 12 to 14 year old females are the most vulnerable to poverty, with 92 males (80.0%) and 26 females (100.0%) in their respective age groups living below the poverty level.
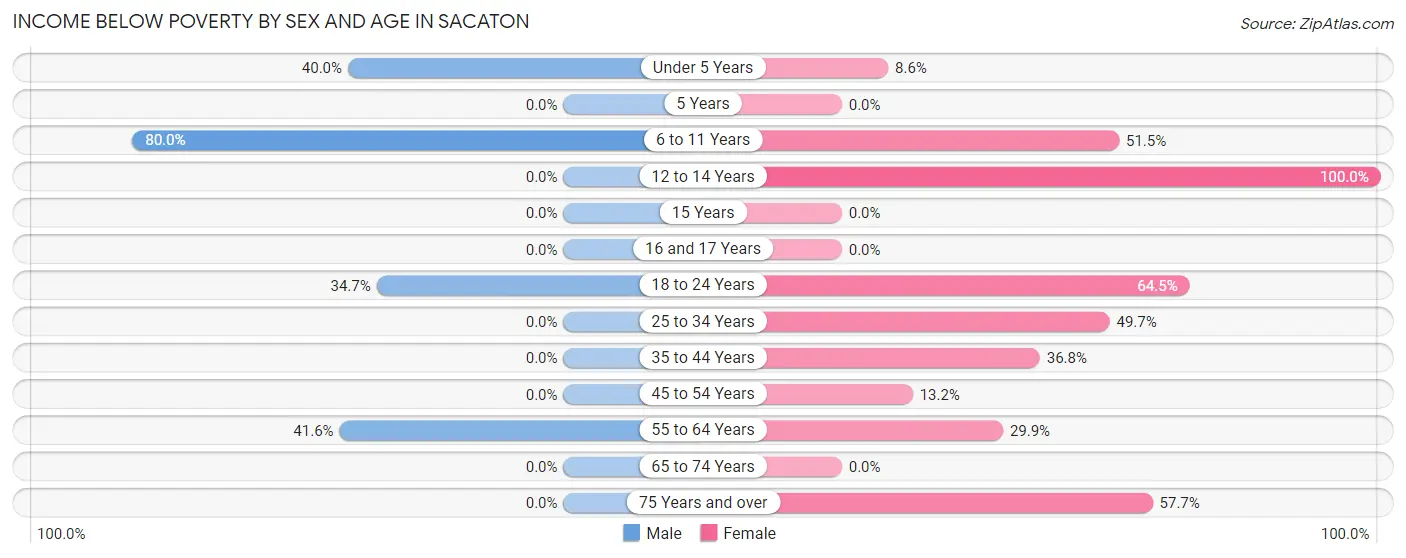
| Age Bracket | Male | Female |
| Under 5 Years | 24 (40.0%) | 8 (8.6%) |
| 5 Years | 0 (0.0%) | 0 (0.0%) |
| 6 to 11 Years | 92 (80.0%) | 53 (51.5%) |
| 12 to 14 Years | 0 (0.0%) | 26 (100.0%) |
| 15 Years | 0 (0.0%) | 0 (0.0%) |
| 16 and 17 Years | 0 (0.0%) | 0 (0.0%) |
| 18 to 24 Years | 69 (34.7%) | 91 (64.5%) |
| 25 to 34 Years | 0 (0.0%) | 82 (49.7%) |
| 35 to 44 Years | 0 (0.0%) | 25 (36.8%) |
| 45 to 54 Years | 0 (0.0%) | 10 (13.2%) |
| 55 to 64 Years | 74 (41.6%) | 32 (29.9%) |
| 65 to 74 Years | 0 (0.0%) | 0 (0.0%) |
| 75 Years and over | 0 (0.0%) | 45 (57.7%) |
| Total | 259 (23.0%) | 372 (33.4%) |
Income Above Poverty by Sex and Age in Sacaton
According to the poverty statistics in Sacaton, males aged 12 to 14 years and females aged 5 years are the age groups that are most secure financially, with 100.0% of males and 100.0% of females in these age groups living above the poverty line.
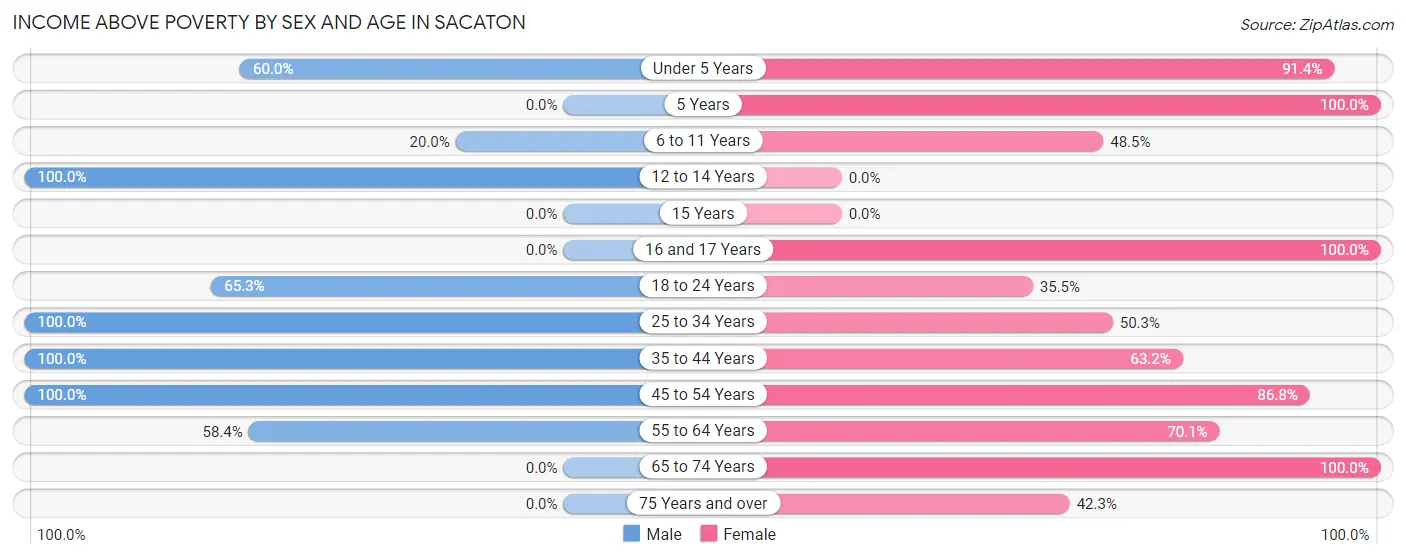
| Age Bracket | Male | Female |
| Under 5 Years | 36 (60.0%) | 85 (91.4%) |
| 5 Years | 0 (0.0%) | 27 (100.0%) |
| 6 to 11 Years | 23 (20.0%) | 50 (48.5%) |
| 12 to 14 Years | 68 (100.0%) | 0 (0.0%) |
| 15 Years | 0 (0.0%) | 0 (0.0%) |
| 16 and 17 Years | 0 (0.0%) | 112 (100.0%) |
| 18 to 24 Years | 130 (65.3%) | 50 (35.5%) |
| 25 to 34 Years | 343 (100.0%) | 83 (50.3%) |
| 35 to 44 Years | 47 (100.0%) | 43 (63.2%) |
| 45 to 54 Years | 117 (100.0%) | 66 (86.8%) |
| 55 to 64 Years | 104 (58.4%) | 75 (70.1%) |
| 65 to 74 Years | 0 (0.0%) | 119 (100.0%) |
| 75 Years and over | 0 (0.0%) | 33 (42.3%) |
| Total | 868 (77.0%) | 743 (66.6%) |
Income Below Poverty Among Married-Couple Families in Sacaton
| Children | Above Poverty | Below Poverty |
| No Children | 27 (100.0%) | 0 (0.0%) |
| 1 or 2 Children | 51 (100.0%) | 0 (0.0%) |
| 3 or 4 Children | 52 (100.0%) | 0 (0.0%) |
| 5 or more Children | 0 (0.0%) | 0 (0.0%) |
| Total | 130 (100.0%) | 0 (0.0%) |
Income Below Poverty Among Single-Parent Households in Sacaton
According to the poverty data in Sacaton, 20.0% or 16 single-father households and 41.0% or 109 single-mother households are living below the poverty line. Among single-father households, those with no children have the highest poverty rate, with 16 households (28.6%) experiencing poverty. Likewise, among single-mother households, those with 1 or 2 children have the highest poverty rate, with 109 households (57.7%) falling below the poverty line.
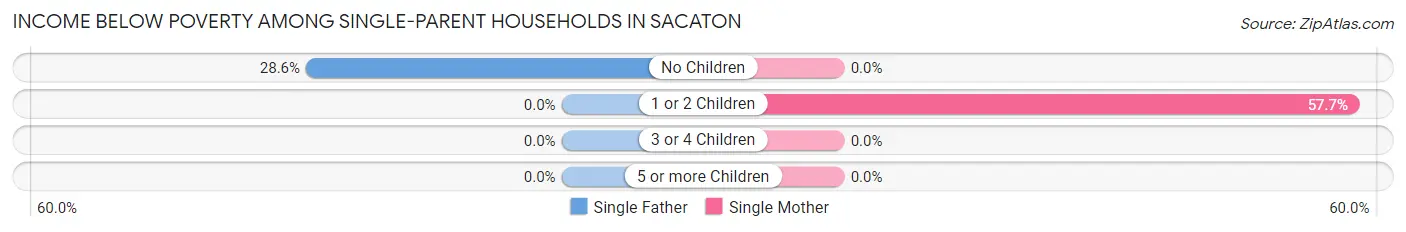
| Children | Single Father | Single Mother |
| No Children | 16 (28.6%) | 0 (0.0%) |
| 1 or 2 Children | 0 (0.0%) | 109 (57.7%) |
| 3 or 4 Children | 0 (0.0%) | 0 (0.0%) |
| 5 or more Children | 0 (0.0%) | 0 (0.0%) |
| Total | 16 (20.0%) | 109 (41.0%) |
Income Below Poverty Among Married-Couple vs Single-Parent Households in Sacaton
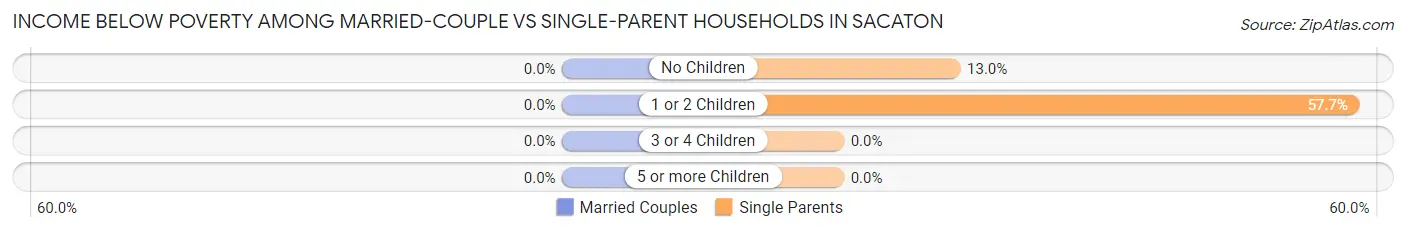
| Children | Married-Couple Families | Single-Parent Households |
| No Children | 0 (0.0%) | 16 (13.0%) |
| 1 or 2 Children | 0 (0.0%) | 109 (57.7%) |
| 3 or 4 Children | 0 (0.0%) | 0 (0.0%) |
| 5 or more Children | 0 (0.0%) | 0 (0.0%) |
| Total | 0 (0.0%) | 125 (36.1%) |
Race in Sacaton
The most populous races in Sacaton are Native / Alaskan (2,266 | 83.5%), White / Caucasian (305 | 11.2%), and Hispanic or Latino (205 | 7.6%).
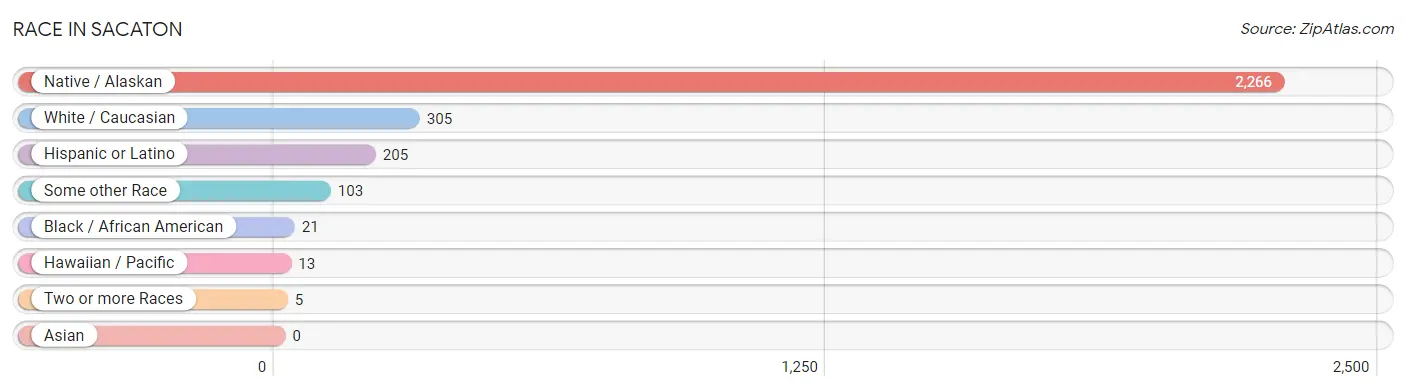
| Race | # Population | % Population |
| Asian | 0 | 0.0% |
| Black / African American | 21 | 0.8% |
| Hawaiian / Pacific | 13 | 0.5% |
| Hispanic or Latino | 205 | 7.6% |
| Native / Alaskan | 2,266 | 83.5% |
| White / Caucasian | 305 | 11.2% |
| Two or more Races | 5 | 0.2% |
| Some other Race | 103 | 3.8% |
| Total | 2,713 | 100.0% |
Ancestry in Sacaton
The most populous ancestries reported in Sacaton are Pima (2,143 | 79.0%), Mexican (129 | 4.8%), Scottish (73 | 2.7%), European (61 | 2.2%), and Cuban (57 | 2.1%), together accounting for 90.8% of all Sacaton residents.
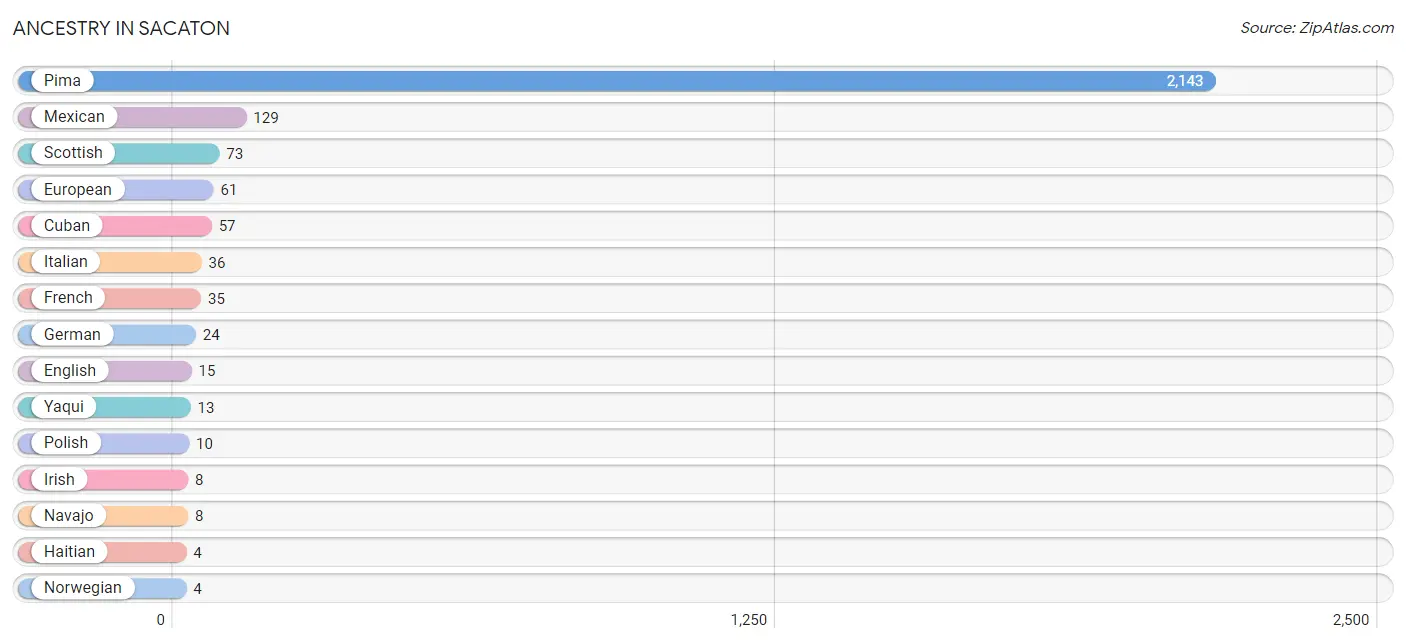
| Ancestry | # Population | % Population |
| American | 1 | 0.0% |
| Cuban | 57 | 2.1% |
| English | 15 | 0.5% |
| European | 61 | 2.2% |
| French | 35 | 1.3% |
| German | 24 | 0.9% |
| Haitian | 4 | 0.2% |
| Indian (Asian) | 1 | 0.0% |
| Irish | 8 | 0.3% |
| Italian | 36 | 1.3% |
| Mexican | 129 | 4.8% |
| Mexican American Indian | 1 | 0.0% |
| Native Hawaiian | 1 | 0.0% |
| Navajo | 8 | 0.3% |
| Norwegian | 4 | 0.2% |
| Pima | 2,143 | 79.0% |
| Polish | 10 | 0.4% |
| Scottish | 73 | 2.7% |
| Yaqui | 13 | 0.5% | View All 19 Rows |
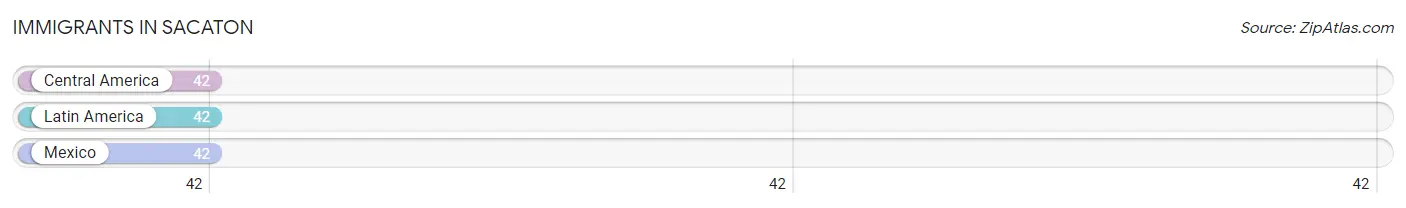
Immigrants in Sacaton
The most numerous immigrant groups reported in Sacaton came from Central America (42 | 1.5%), Latin America (42 | 1.5%), and Mexico (42 | 1.5%), together accounting for 4.6% of all Sacaton residents.
| Immigration Origin | # Population | % Population |
| Central America | 42 | 1.5% |
| Latin America | 42 | 1.5% |
| Mexico | 42 | 1.5% | View All 3 Rows |
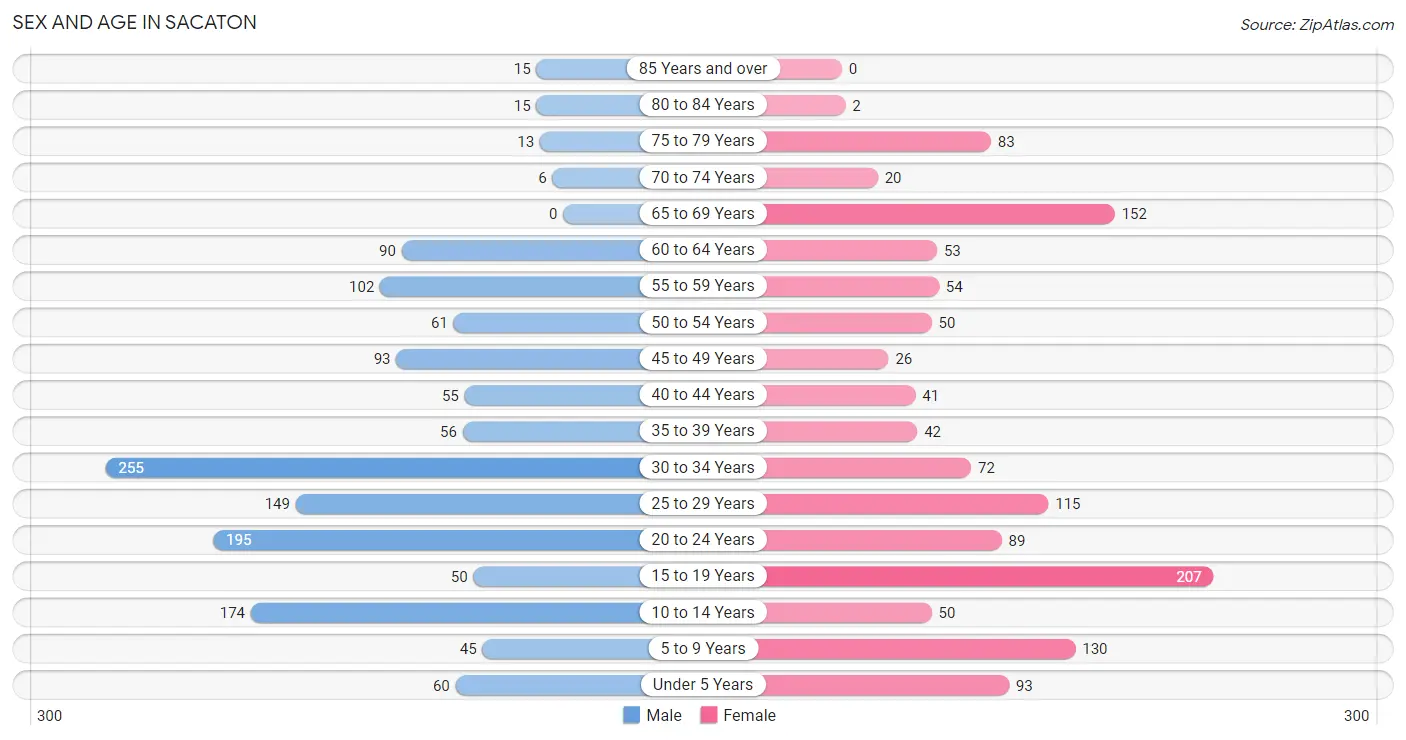
Sex and Age in Sacaton
Sex and Age in Sacaton
The most populous age groups in Sacaton are 30 to 34 Years (255 | 17.8%) for men and 15 to 19 Years (207 | 16.2%) for women.
| Age Bracket | Male | Female |
| Under 5 Years | 60 (4.2%) | 93 (7.3%) |
| 5 to 9 Years | 45 (3.1%) | 130 (10.2%) |
| 10 to 14 Years | 174 (12.1%) | 50 (3.9%) |
| 15 to 19 Years | 50 (3.5%) | 207 (16.2%) |
| 20 to 24 Years | 195 (13.6%) | 89 (7.0%) |
| 25 to 29 Years | 149 (10.4%) | 115 (9.0%) |
| 30 to 34 Years | 255 (17.8%) | 72 (5.6%) |
| 35 to 39 Years | 56 (3.9%) | 42 (3.3%) |
| 40 to 44 Years | 55 (3.8%) | 41 (3.2%) |
| 45 to 49 Years | 93 (6.5%) | 26 (2.0%) |
| 50 to 54 Years | 61 (4.3%) | 50 (3.9%) |
| 55 to 59 Years | 102 (7.1%) | 54 (4.2%) |
| 60 to 64 Years | 90 (6.3%) | 53 (4.1%) |
| 65 to 69 Years | 0 (0.0%) | 152 (11.9%) |
| 70 to 74 Years | 6 (0.4%) | 20 (1.6%) |
| 75 to 79 Years | 13 (0.9%) | 83 (6.5%) |
| 80 to 84 Years | 15 (1.1%) | 2 (0.2%) |
| 85 Years and over | 15 (1.1%) | 0 (0.0%) |
| Total | 1,434 (100.0%) | 1,279 (100.0%) |
Families and Households in Sacaton
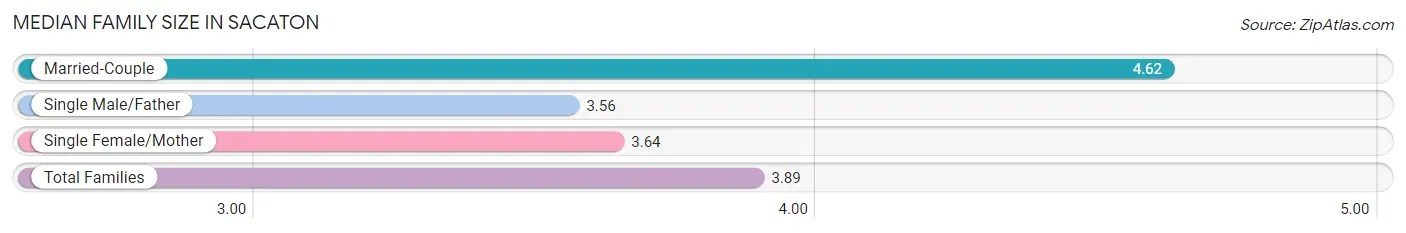
Median Family Size in Sacaton
The median family size in Sacaton is 3.89 persons per family, with married-couple families (130 | 27.3%) accounting for the largest median family size of 4.62 persons per family. On the other hand, single male/father families (80 | 16.8%) represent the smallest median family size with 3.56 persons per family.
| Family Type | # Families | Family Size |
| Married-Couple | 130 (27.3%) | 4.62 |
| Single Male/Father | 80 (16.8%) | 3.56 |
| Single Female/Mother | 266 (55.9%) | 3.64 |
| Total Families | 476 (100.0%) | 3.89 |
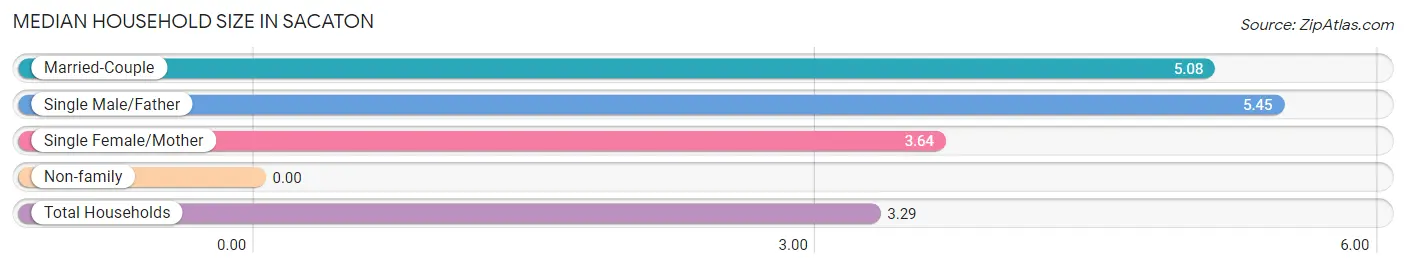
Median Household Size in Sacaton
| Household Type | # Households | Household Size |
| Married-Couple | 130 (18.7%) | 5.08 |
| Single Male/Father | 80 (11.5%) | 5.45 |
| Single Female/Mother | 266 (38.3%) | 3.64 |
| Non-family | 219 (31.5%) | - |
| Total Households | 695 (100.0%) | 3.29 |
Household Size by Marriage Status in Sacaton
Out of a total of 695 households in Sacaton, 476 (68.5%) are family households, while 219 (31.5%) are nonfamily households. The most numerous type of family households are 5-person households, comprising 149, and the most common type of nonfamily households are 1-person households, comprising 219.
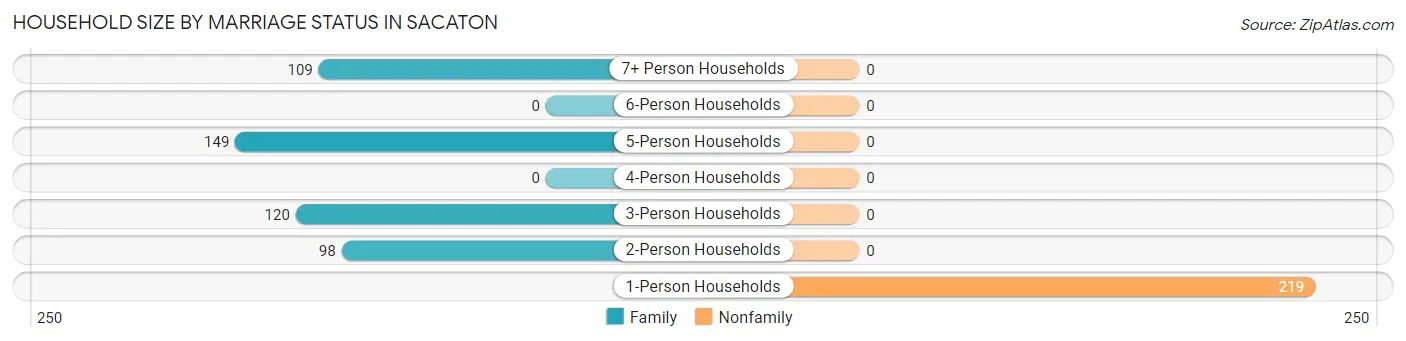
| Household Size | Family Households | Nonfamily Households |
| 1-Person Households | - | 219 (31.5%) |
| 2-Person Households | 98 (14.1%) | 0 (0.0%) |
| 3-Person Households | 120 (17.3%) | 0 (0.0%) |
| 4-Person Households | 0 (0.0%) | 0 (0.0%) |
| 5-Person Households | 149 (21.4%) | 0 (0.0%) |
| 6-Person Households | 0 (0.0%) | 0 (0.0%) |
| 7+ Person Households | 109 (15.7%) | 0 (0.0%) |
| Total | 476 (68.5%) | 219 (31.5%) |
Female Fertility in Sacaton
Fertility by Age in Sacaton
Average fertility rate in Sacaton is 150.0 births per 1,000 women. Women in the age bracket of 15 to 19 years have the highest fertility rate with 198.0 births per 1,000 women. Women in the age bracket of 15 to 19 years acount for 44.6% of all women with births.
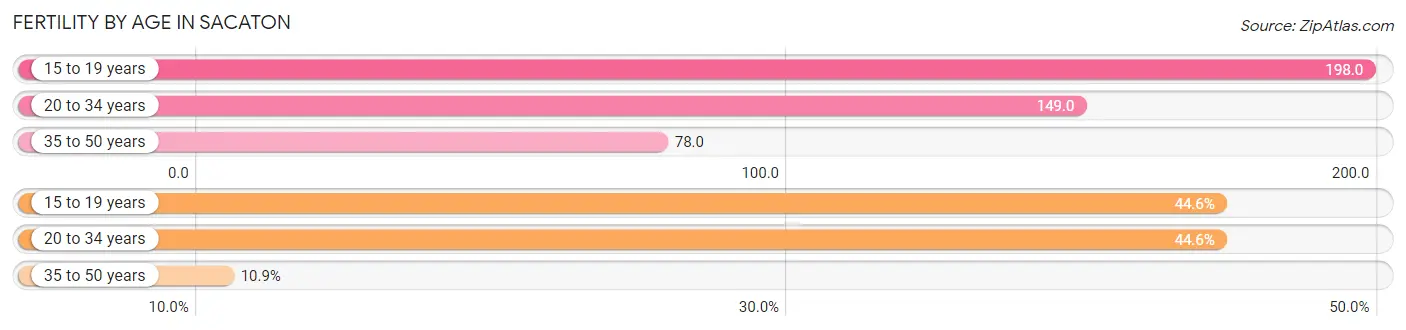
| Age Bracket | Women with Births | Births / 1,000 Women |
| 15 to 19 years | 41 (44.6%) | 198.0 |
| 20 to 34 years | 41 (44.6%) | 149.0 |
| 35 to 50 years | 10 (10.9%) | 78.0 |
| Total | 92 (100.0%) | 150.0 |
Fertility by Age by Marriage Status in Sacaton
19.6% of women with births (92) in Sacaton are married. The highest percentage of unmarried women with births falls into 15 to 19 years age bracket with 100.0% of them unmarried at the time of birth, while the lowest percentage of unmarried women with births belong to 20 to 34 years age bracket with 56.1% of them unmarried.
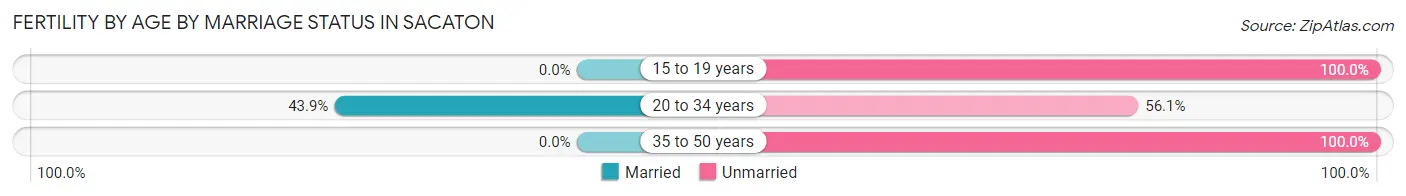
| Age Bracket | Married | Unmarried |
| 15 to 19 years | 0 (0.0%) | 41 (100.0%) |
| 20 to 34 years | 18 (43.9%) | 23 (56.1%) |
| 35 to 50 years | 0 (0.0%) | 10 (100.0%) |
| Total | 18 (19.6%) | 74 (80.4%) |
Fertility by Education in Sacaton
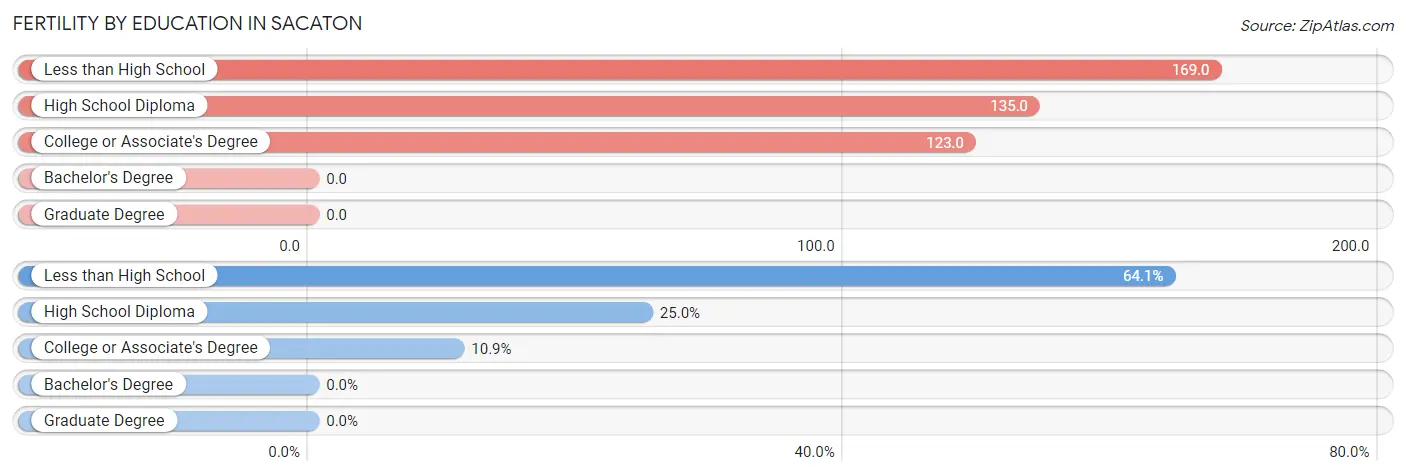
| Educational Attainment | Women with Births | Births / 1,000 Women |
| Less than High School | 59 (64.1%) | 169.0 |
| High School Diploma | 23 (25.0%) | 135.0 |
| College or Associate's Degree | 10 (10.9%) | 123.0 |
| Bachelor's Degree | 0 (0.0%) | 0.0 |
| Graduate Degree | 0 (0.0%) | 0.0 |
| Total | 92 (100.0%) | 150.0 |
Fertility by Education by Marriage Status in Sacaton
80.4% of women with births in Sacaton are unmarried. Women with the educational attainment of less than high school are most likely to be married with 30.5% of them married at childbirth, while women with the educational attainment of high school diploma are least likely to be married with 100.0% of them unmarried at childbirth.
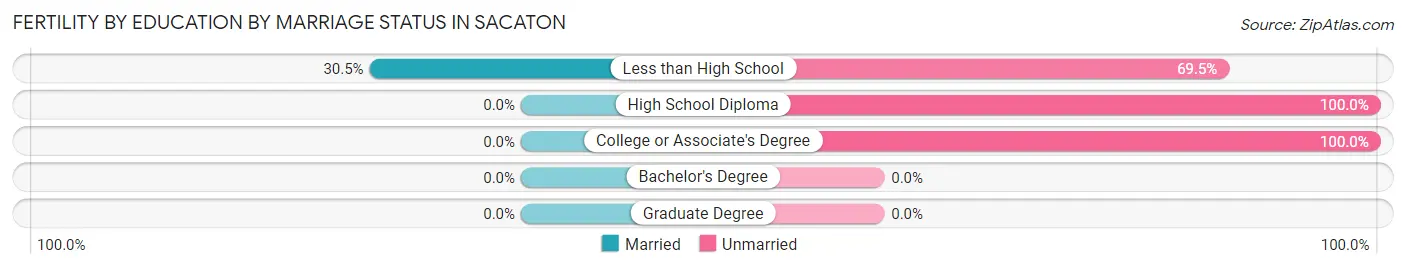
| Educational Attainment | Married | Unmarried |
| Less than High School | 18 (30.5%) | 41 (69.5%) |
| High School Diploma | 0 (0.0%) | 23 (100.0%) |
| College or Associate's Degree | 0 (0.0%) | 10 (100.0%) |
| Bachelor's Degree | 0 (0.0%) | 0 (0.0%) |
| Graduate Degree | 0 (0.0%) | 0 (0.0%) |
| Total | 18 (19.6%) | 74 (80.4%) |
Employment Characteristics in Sacaton
Employment by Class of Employer in Sacaton
Among the 542 employed individuals in Sacaton, private company employees (334 | 61.6%), local government employees (181 | 33.4%), and federal government employees (27 | 5.0%) make up the most common classes of employment.
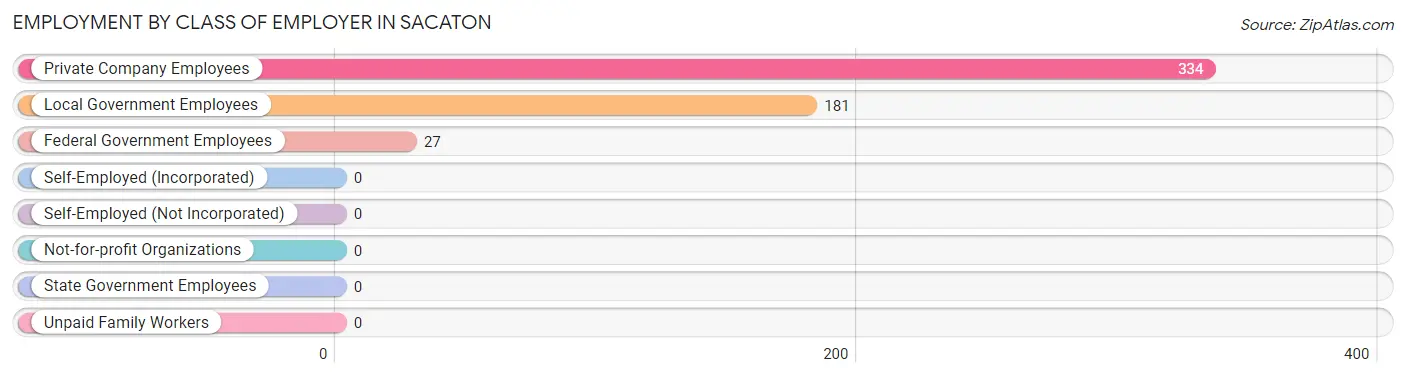
| Employer Class | # Employees | % Employees |
| Private Company Employees | 334 | 61.6% |
| Self-Employed (Incorporated) | 0 | 0.0% |
| Self-Employed (Not Incorporated) | 0 | 0.0% |
| Not-for-profit Organizations | 0 | 0.0% |
| Local Government Employees | 181 | 33.4% |
| State Government Employees | 0 | 0.0% |
| Federal Government Employees | 27 | 5.0% |
| Unpaid Family Workers | 0 | 0.0% |
| Total | 542 | 100.0% |
Employment Status by Age in Sacaton
According to the labor force statistics for Sacaton, out of the total population over 16 years of age (2,158), 27.7% or 598 individuals are in the labor force, with 9.4% or 56 of them unemployed. The age group with the highest labor force participation rate is 45 to 54 years, with 79.6% or 183 individuals in the labor force. Within the labor force, the 20 to 24 years age range has the highest percentage of unemployed individuals, with 26.5% or 27 of them being unemployed.
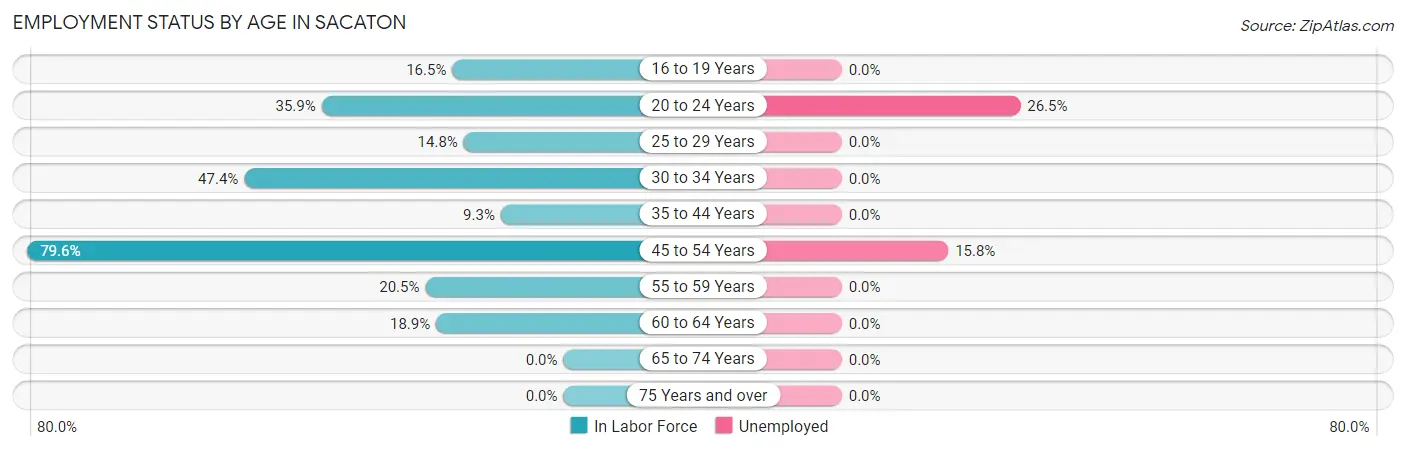
| Age Bracket | In Labor Force | Unemployed |
| 16 to 19 Years | 42 (16.5%) | 0 (0.0%) |
| 20 to 24 Years | 102 (35.9%) | 27 (26.5%) |
| 25 to 29 Years | 39 (14.8%) | 0 (0.0%) |
| 30 to 34 Years | 155 (47.4%) | 0 (0.0%) |
| 35 to 44 Years | 18 (9.3%) | 0 (0.0%) |
| 45 to 54 Years | 183 (79.6%) | 29 (15.8%) |
| 55 to 59 Years | 32 (20.5%) | 0 (0.0%) |
| 60 to 64 Years | 27 (18.9%) | 0 (0.0%) |
| 65 to 74 Years | 0 (0.0%) | 0 (0.0%) |
| 75 Years and over | 0 (0.0%) | 0 (0.0%) |
| Total | 598 (27.7%) | 56 (9.4%) |
Employment Status by Educational Attainment in Sacaton
According to labor force statistics for Sacaton, 34.6% of individuals (455) out of the total population between 25 and 64 years of age (1,314) are in the labor force, with 6.4% or 29 of them being unemployed. The group with the highest labor force participation rate are those with the educational attainment of bachelor's degree or higher, with 64.7% or 11 individuals in the labor force. Within the labor force, individuals with college / associate degree education have the highest percentage of unemployment, with 18.0% or 29 of them being unemployed.
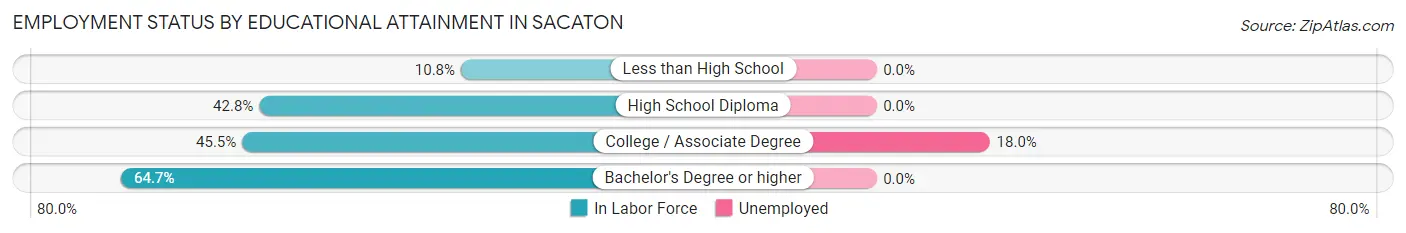
| Educational Attainment | In Labor Force | Unemployed |
| Less than High School | 41 (10.8%) | 0 (0.0%) |
| High School Diploma | 241 (42.8%) | 0 (0.0%) |
| College / Associate Degree | 161 (45.5%) | 64 (18.0%) |
| Bachelor's Degree or higher | 11 (64.7%) | 0 (0.0%) |
| Total | 455 (34.6%) | 84 (6.4%) |
Employment Occupations by Sex in Sacaton
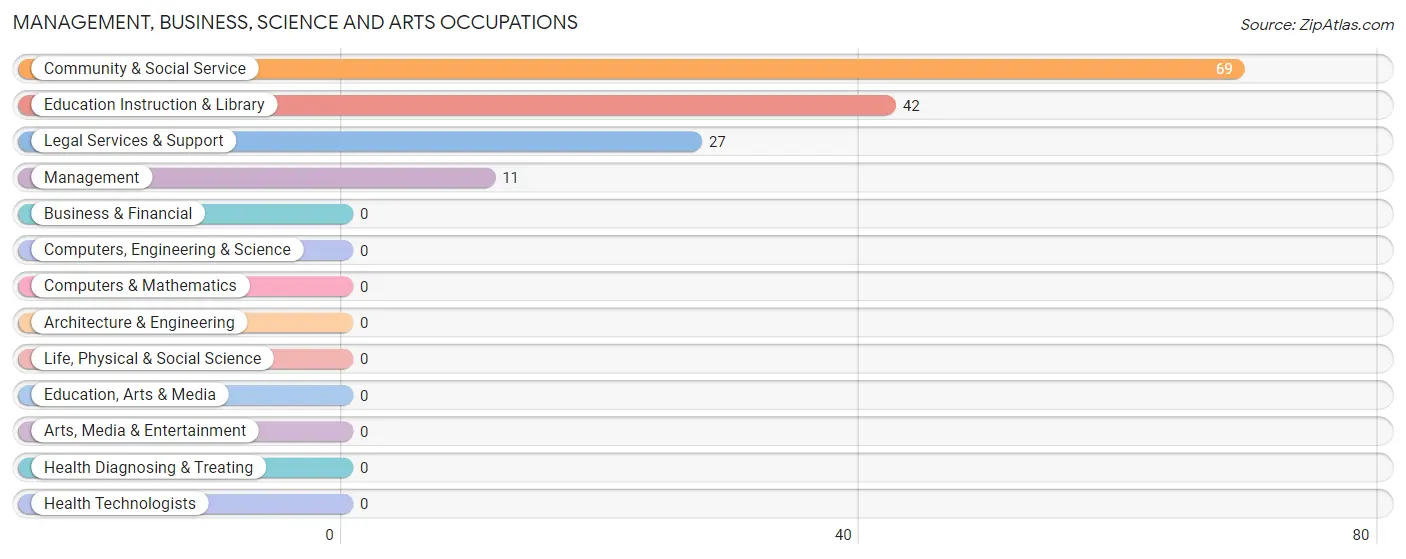
Management, Business, Science and Arts Occupations
The most common Management, Business, Science and Arts occupations in Sacaton are Community & Social Service (69 | 12.7%), Education Instruction & Library (42 | 7.7%), Legal Services & Support (27 | 5.0%), and Management (11 | 2.0%).
Management, Business, Science and Arts Occupations by Sex
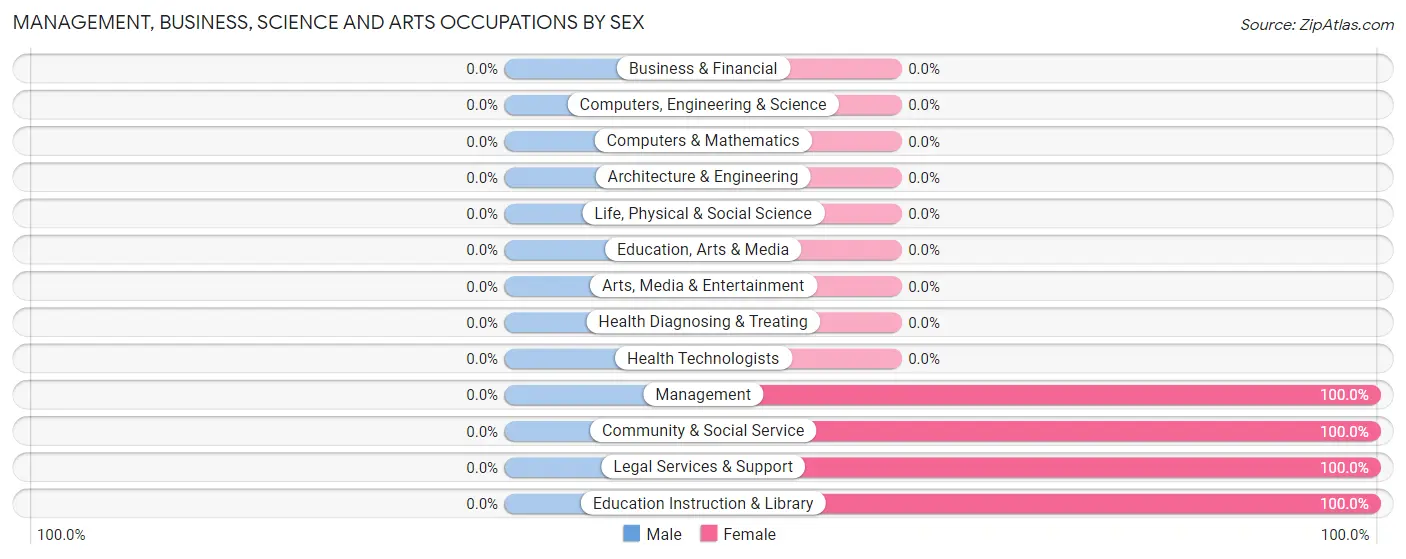
| Occupation | Male | Female |
| Management | 0 (0.0%) | 11 (100.0%) |
| Business & Financial | 0 (0.0%) | 0 (0.0%) |
| Computers, Engineering & Science | 0 (0.0%) | 0 (0.0%) |
| Computers & Mathematics | 0 (0.0%) | 0 (0.0%) |
| Architecture & Engineering | 0 (0.0%) | 0 (0.0%) |
| Life, Physical & Social Science | 0 (0.0%) | 0 (0.0%) |
| Community & Social Service | 0 (0.0%) | 69 (100.0%) |
| Education, Arts & Media | 0 (0.0%) | 0 (0.0%) |
| Legal Services & Support | 0 (0.0%) | 27 (100.0%) |
| Education Instruction & Library | 0 (0.0%) | 42 (100.0%) |
| Arts, Media & Entertainment | 0 (0.0%) | 0 (0.0%) |
| Health Diagnosing & Treating | 0 (0.0%) | 0 (0.0%) |
| Health Technologists | 0 (0.0%) | 0 (0.0%) |
| Total (Category) | 0 (0.0%) | 80 (100.0%) |
| Total (Overall) | 286 (52.8%) | 256 (47.2%) |
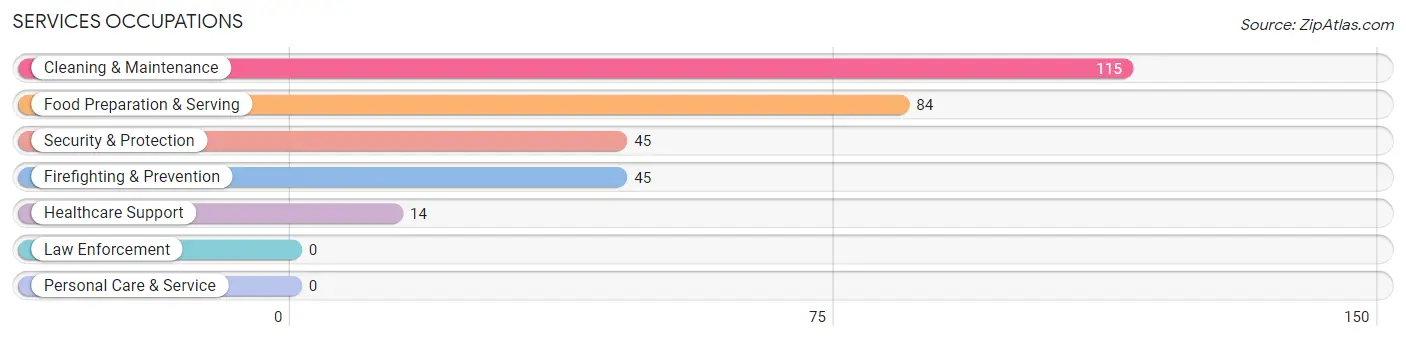
Services Occupations
The most common Services occupations in Sacaton are Cleaning & Maintenance (115 | 21.2%), Food Preparation & Serving (84 | 15.5%), Security & Protection (45 | 8.3%), Firefighting & Prevention (45 | 8.3%), and Healthcare Support (14 | 2.6%).
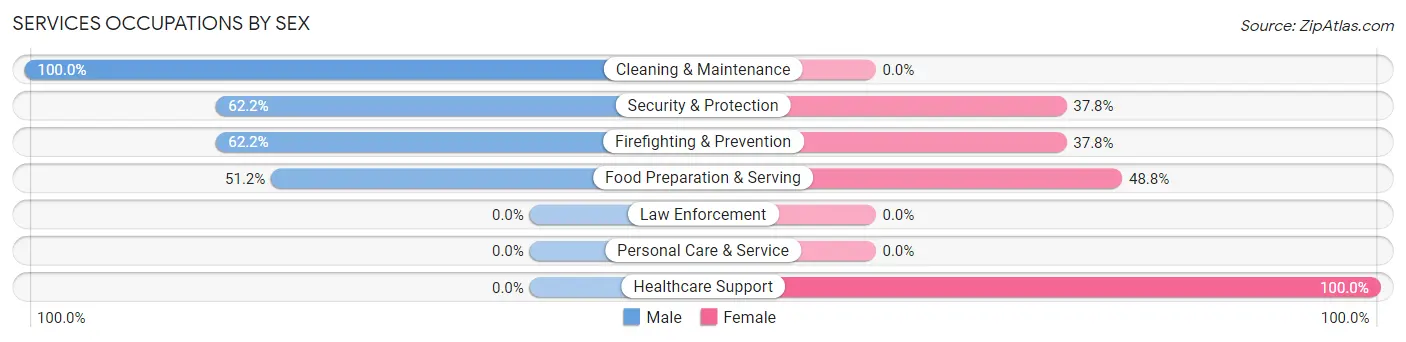
Services Occupations by Sex
Within the Services occupations in Sacaton, the most male-oriented occupations are Cleaning & Maintenance (100.0%), Security & Protection (62.2%), and Firefighting & Prevention (62.2%), while the most female-oriented occupations are Healthcare Support (100.0%), Food Preparation & Serving (48.8%), and Security & Protection (37.8%).
| Occupation | Male | Female |
| Healthcare Support | 0 (0.0%) | 14 (100.0%) |
| Security & Protection | 28 (62.2%) | 17 (37.8%) |
| Firefighting & Prevention | 28 (62.2%) | 17 (37.8%) |
| Law Enforcement | 0 (0.0%) | 0 (0.0%) |
| Food Preparation & Serving | 43 (51.2%) | 41 (48.8%) |
| Cleaning & Maintenance | 115 (100.0%) | 0 (0.0%) |
| Personal Care & Service | 0 (0.0%) | 0 (0.0%) |
| Total (Category) | 186 (72.1%) | 72 (27.9%) |
| Total (Overall) | 286 (52.8%) | 256 (47.2%) |
Sales and Office Occupations
The most common Sales and Office occupations in Sacaton are , and Office & Administration (104 | 19.2%).
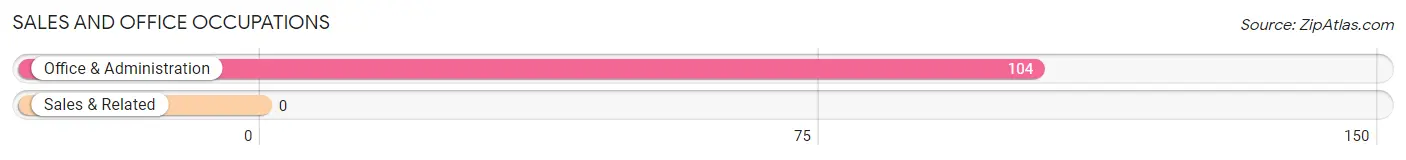
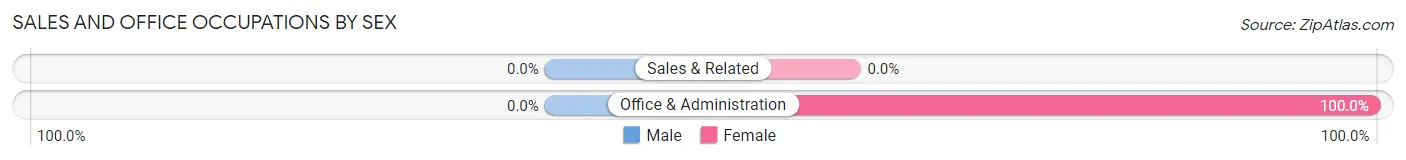
Sales and Office Occupations by Sex
| Occupation | Male | Female |
| Sales & Related | 0 (0.0%) | 0 (0.0%) |
| Office & Administration | 0 (0.0%) | 104 (100.0%) |
| Total (Category) | 0 (0.0%) | 104 (100.0%) |
| Total (Overall) | 286 (52.8%) | 256 (47.2%) |
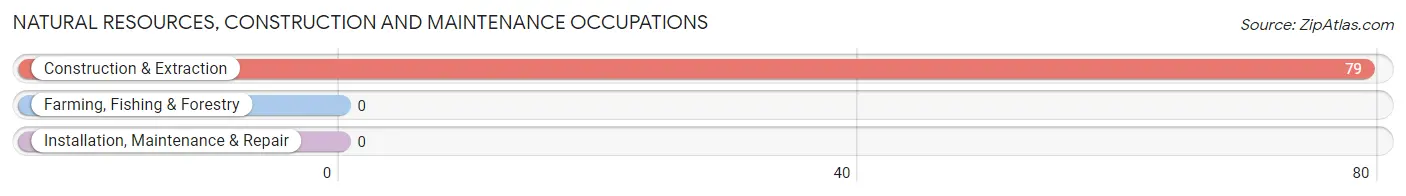
Natural Resources, Construction and Maintenance Occupations
The most common Natural Resources, Construction and Maintenance occupations in Sacaton are , and Construction & Extraction (79 | 14.6%).
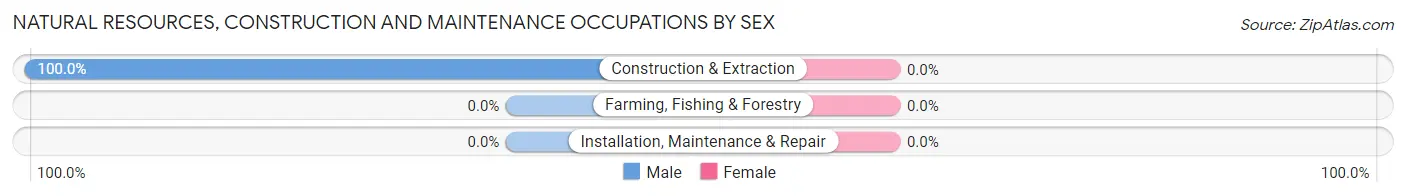
Natural Resources, Construction and Maintenance Occupations by Sex
| Occupation | Male | Female |
| Farming, Fishing & Forestry | 0 (0.0%) | 0 (0.0%) |
| Construction & Extraction | 79 (100.0%) | 0 (0.0%) |
| Installation, Maintenance & Repair | 0 (0.0%) | 0 (0.0%) |
| Total (Category) | 79 (100.0%) | 0 (0.0%) |
| Total (Overall) | 286 (52.8%) | 256 (47.2%) |
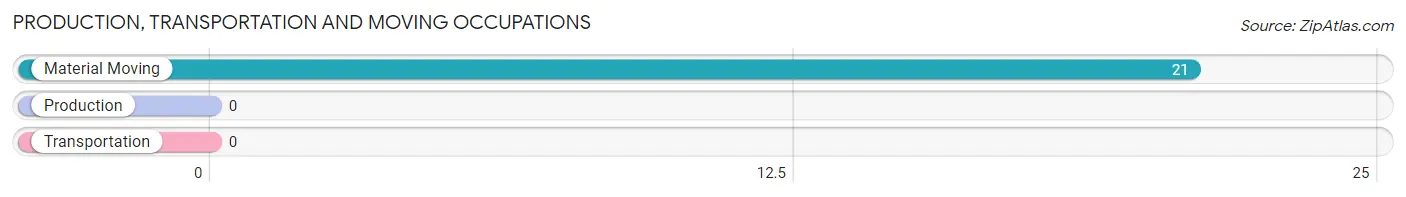
Production, Transportation and Moving Occupations
The most common Production, Transportation and Moving occupations in Sacaton are , and Material Moving (21 | 3.9%).
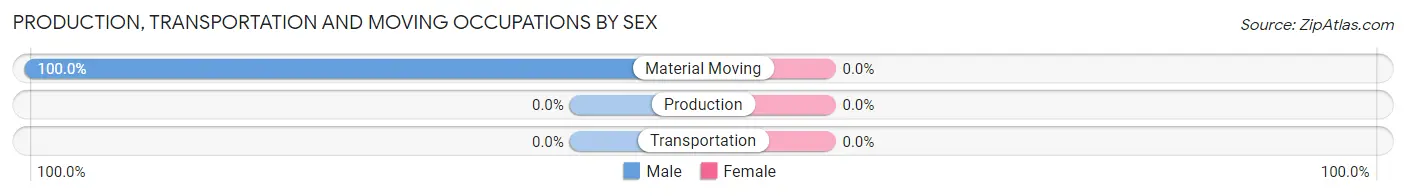
Production, Transportation and Moving Occupations by Sex
| Occupation | Male | Female |
| Production | 0 (0.0%) | 0 (0.0%) |
| Transportation | 0 (0.0%) | 0 (0.0%) |
| Material Moving | 21 (100.0%) | 0 (0.0%) |
| Total (Category) | 21 (100.0%) | 0 (0.0%) |
| Total (Overall) | 286 (52.8%) | 256 (47.2%) |
Employment Industries by Sex in Sacaton
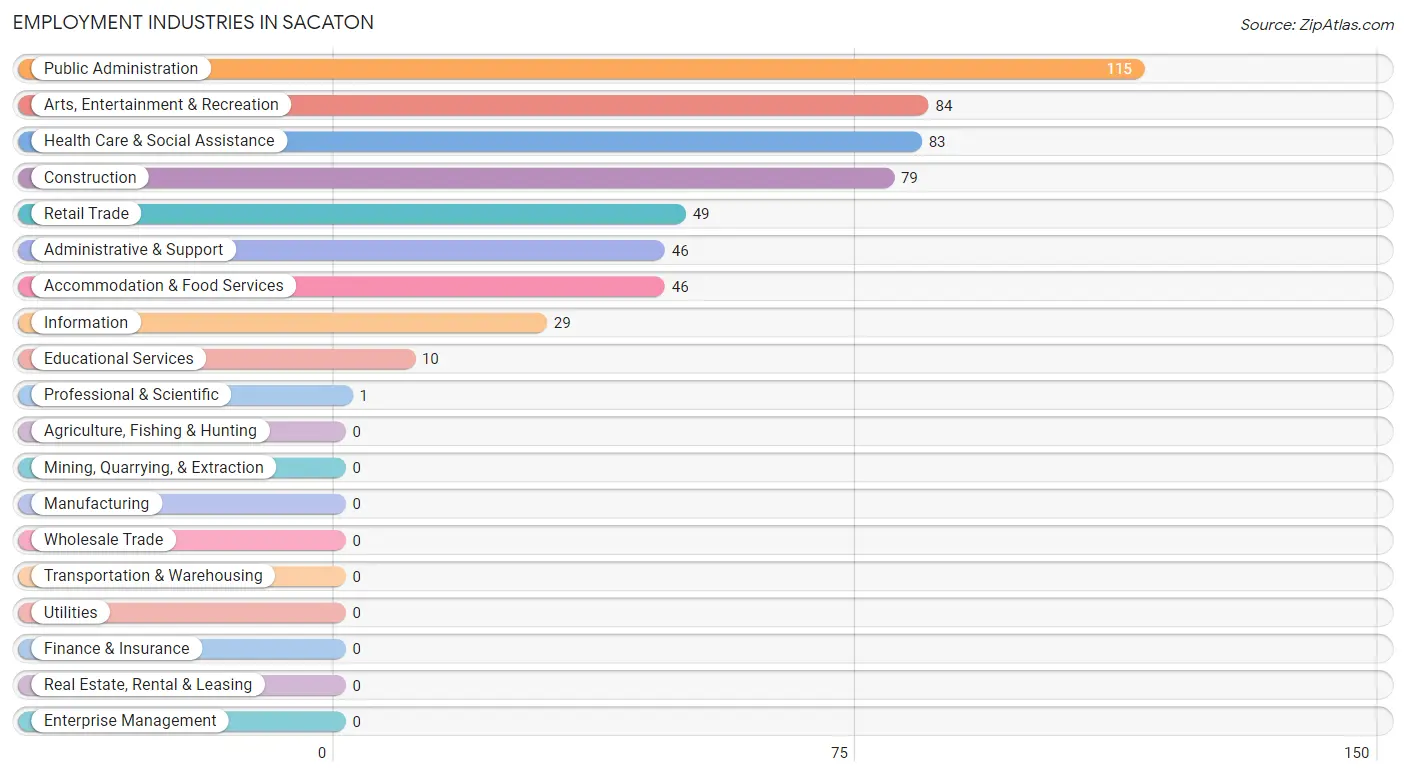
Employment Industries in Sacaton
The major employment industries in Sacaton include Public Administration (115 | 21.2%), Arts, Entertainment & Recreation (84 | 15.5%), Health Care & Social Assistance (83 | 15.3%), Construction (79 | 14.6%), and Retail Trade (49 | 9.0%).
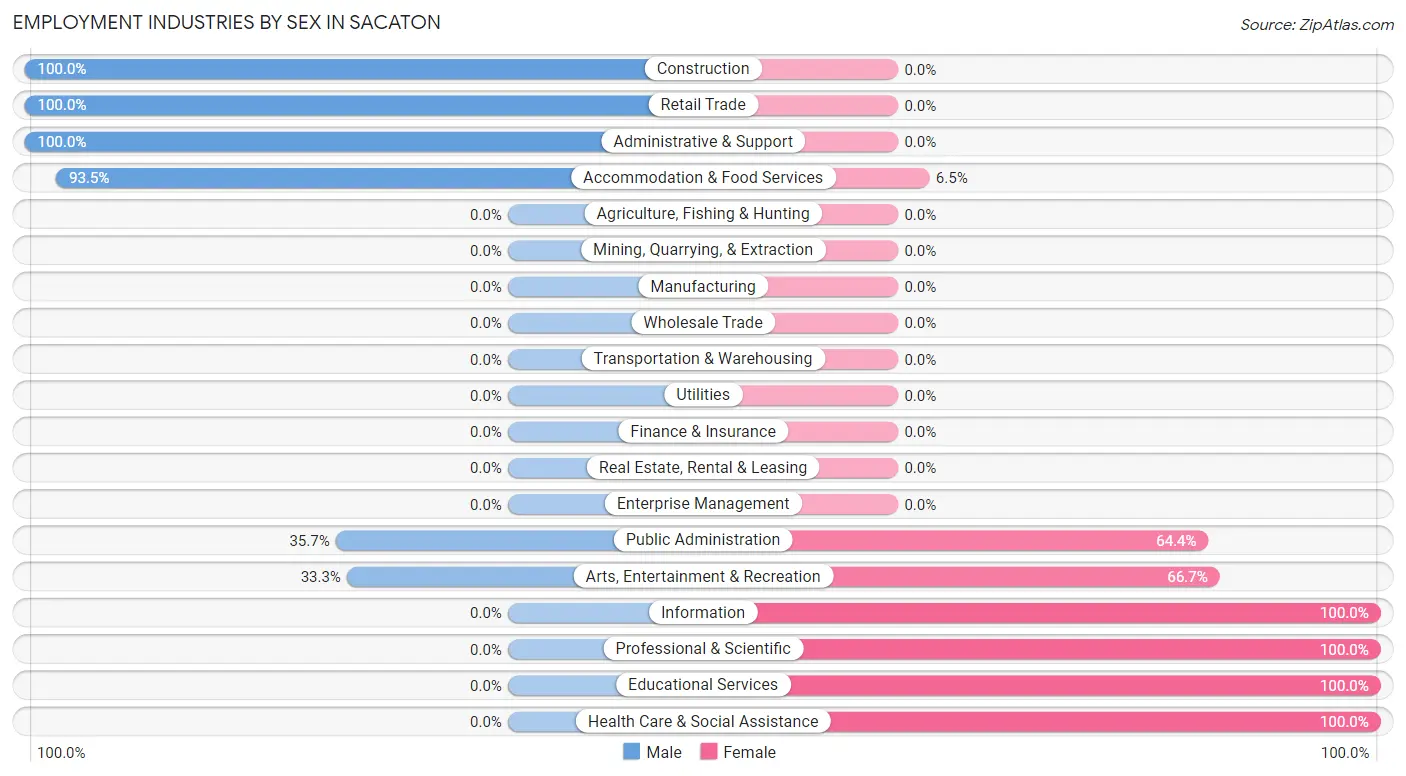
Employment Industries by Sex in Sacaton
The Sacaton industries that see more men than women are Construction (100.0%), Retail Trade (100.0%), and Administrative & Support (100.0%), whereas the industries that tend to have a higher number of women are Information (100.0%), Professional & Scientific (100.0%), and Educational Services (100.0%).
| Industry | Male | Female |
| Agriculture, Fishing & Hunting | 0 (0.0%) | 0 (0.0%) |
| Mining, Quarrying, & Extraction | 0 (0.0%) | 0 (0.0%) |
| Construction | 79 (100.0%) | 0 (0.0%) |
| Manufacturing | 0 (0.0%) | 0 (0.0%) |
| Wholesale Trade | 0 (0.0%) | 0 (0.0%) |
| Retail Trade | 49 (100.0%) | 0 (0.0%) |
| Transportation & Warehousing | 0 (0.0%) | 0 (0.0%) |
| Utilities | 0 (0.0%) | 0 (0.0%) |
| Information | 0 (0.0%) | 29 (100.0%) |
| Finance & Insurance | 0 (0.0%) | 0 (0.0%) |
| Real Estate, Rental & Leasing | 0 (0.0%) | 0 (0.0%) |
| Professional & Scientific | 0 (0.0%) | 1 (100.0%) |
| Enterprise Management | 0 (0.0%) | 0 (0.0%) |
| Administrative & Support | 46 (100.0%) | 0 (0.0%) |
| Educational Services | 0 (0.0%) | 10 (100.0%) |
| Health Care & Social Assistance | 0 (0.0%) | 83 (100.0%) |
| Arts, Entertainment & Recreation | 28 (33.3%) | 56 (66.7%) |
| Accommodation & Food Services | 43 (93.5%) | 3 (6.5%) |
| Public Administration | 41 (35.6%) | 74 (64.3%) |
| Total | 286 (52.8%) | 256 (47.2%) |
Education in Sacaton
School Enrollment in Sacaton
The most common levels of schooling among the 563 students in Sacaton are high school (219 | 38.9%), middle school (169 | 30.0%), and elementary school (126 | 22.4%).
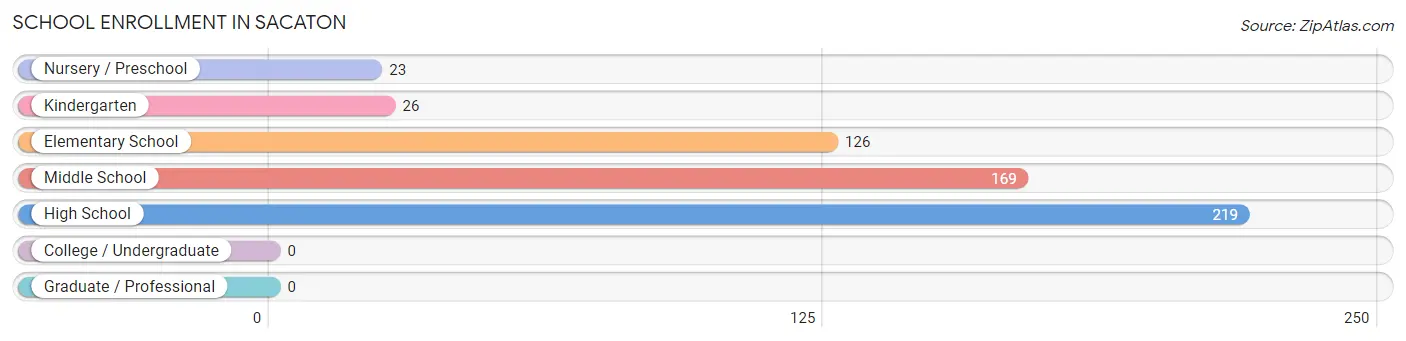
| School Level | # Students | % Students |
| Nursery / Preschool | 23 | 4.1% |
| Kindergarten | 26 | 4.6% |
| Elementary School | 126 | 22.4% |
| Middle School | 169 | 30.0% |
| High School | 219 | 38.9% |
| College / Undergraduate | 0 | 0.0% |
| Graduate / Professional | 0 | 0.0% |
| Total | 563 | 100.0% |
School Enrollment by Age by Funding Source in Sacaton
Out of a total of 563 students who are enrolled in schools in Sacaton, 87 (15.5%) attend a private institution, while the remaining 476 (84.5%) are enrolled in public schools. The age group of 18 to 19 year olds has the highest likelihood of being enrolled in private schools, with 30 (50.8% in the age bracket) enrolled. Conversely, the age group of 5 to 9 year old has the lowest likelihood of being enrolled in a private school, with 175 (100.0% in the age bracket) attending a public institution.
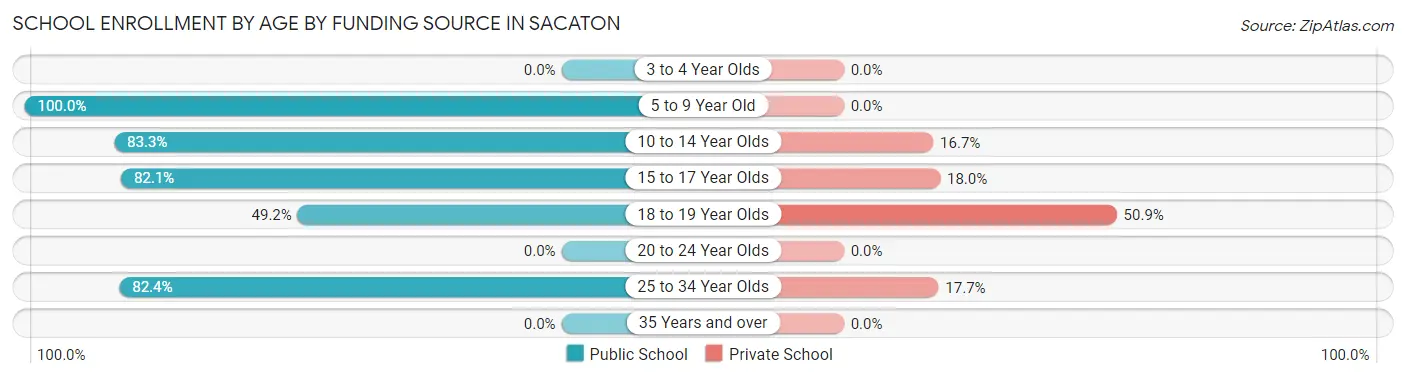
| Age Bracket | Public School | Private School |
| 3 to 4 Year Olds | 0 (0.0%) | 0 (0.0%) |
| 5 to 9 Year Old | 175 (100.0%) | 0 (0.0%) |
| 10 to 14 Year Olds | 130 (83.3%) | 26 (16.7%) |
| 15 to 17 Year Olds | 128 (82.1%) | 28 (17.9%) |
| 18 to 19 Year Olds | 29 (49.1%) | 30 (50.8%) |
| 20 to 24 Year Olds | 0 (0.0%) | 0 (0.0%) |
| 25 to 34 Year Olds | 14 (82.4%) | 3 (17.6%) |
| 35 Years and over | 0 (0.0%) | 0 (0.0%) |
| Total | 476 (84.5%) | 87 (15.5%) |
Educational Attainment by Field of Study in Sacaton
Business (70 | 78.6%), arts & humanities (10 | 11.2%), engineering (8 | 9.0%), and psychology (1 | 1.1%) are the most common fields of study among 89 individuals in Sacaton who have obtained a bachelor's degree or higher.
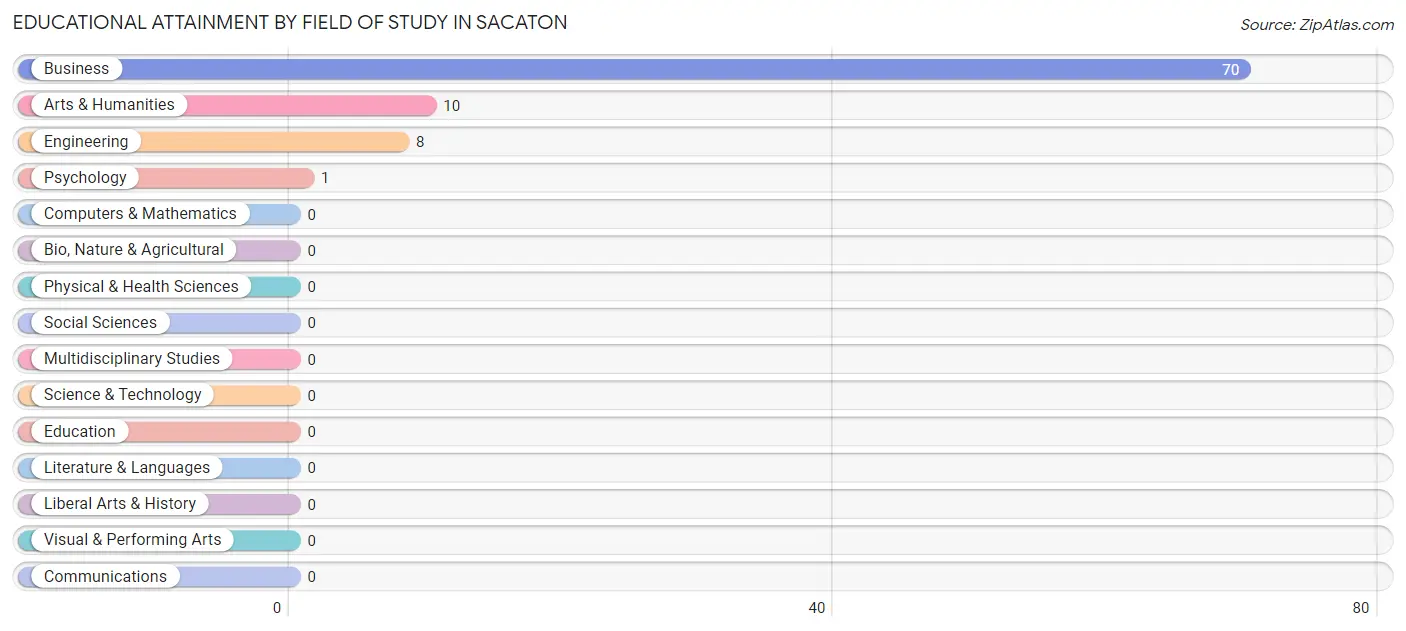
| Field of Study | # Graduates | % Graduates |
| Computers & Mathematics | 0 | 0.0% |
| Bio, Nature & Agricultural | 0 | 0.0% |
| Physical & Health Sciences | 0 | 0.0% |
| Psychology | 1 | 1.1% |
| Social Sciences | 0 | 0.0% |
| Engineering | 8 | 9.0% |
| Multidisciplinary Studies | 0 | 0.0% |
| Science & Technology | 0 | 0.0% |
| Business | 70 | 78.6% |
| Education | 0 | 0.0% |
| Literature & Languages | 0 | 0.0% |
| Liberal Arts & History | 0 | 0.0% |
| Visual & Performing Arts | 0 | 0.0% |
| Communications | 0 | 0.0% |
| Arts & Humanities | 10 | 11.2% |
| Total | 89 | 100.0% |
Transportation & Commute in Sacaton
Vehicle Availability by Sex in Sacaton
The most prevalent vehicle ownership categories in Sacaton are males with 3 vehicles (88, accounting for 30.8%) and females with 3 vehicles (43, making up 34.9%).
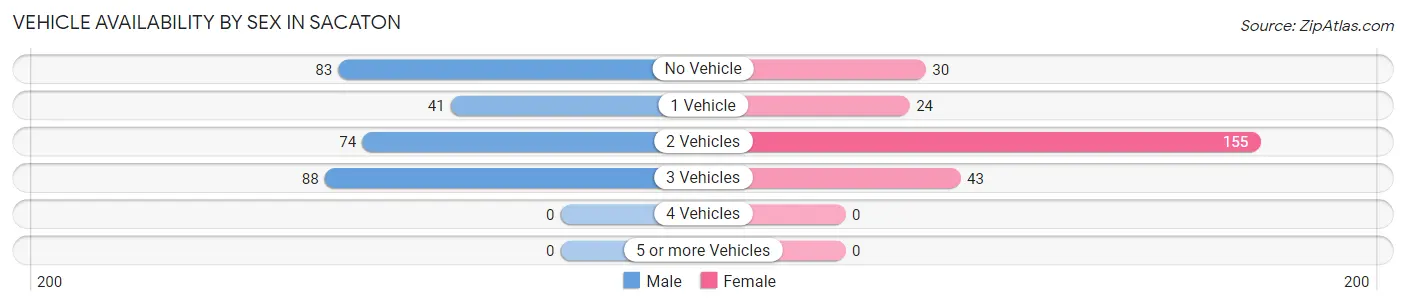
| Vehicles Available | Male | Female |
| No Vehicle | 83 (29.0%) | 30 (11.9%) |
| 1 Vehicle | 41 (14.3%) | 24 (9.5%) |
| 2 Vehicles | 74 (25.9%) | 155 (61.5%) |
| 3 Vehicles | 88 (30.8%) | 43 (17.1%) |
| 4 Vehicles | 0 (0.0%) | 0 (0.0%) |
| 5 or more Vehicles | 0 (0.0%) | 0 (0.0%) |
| Total | 286 (100.0%) | 252 (100.0%) |
Commute Time in Sacaton
The most frequently occuring commute durations in Sacaton are 5 to 9 minutes (193 commuters, 35.6%), 15 to 19 minutes (80 commuters, 14.8%), and 10 to 14 minutes (72 commuters, 13.3%).
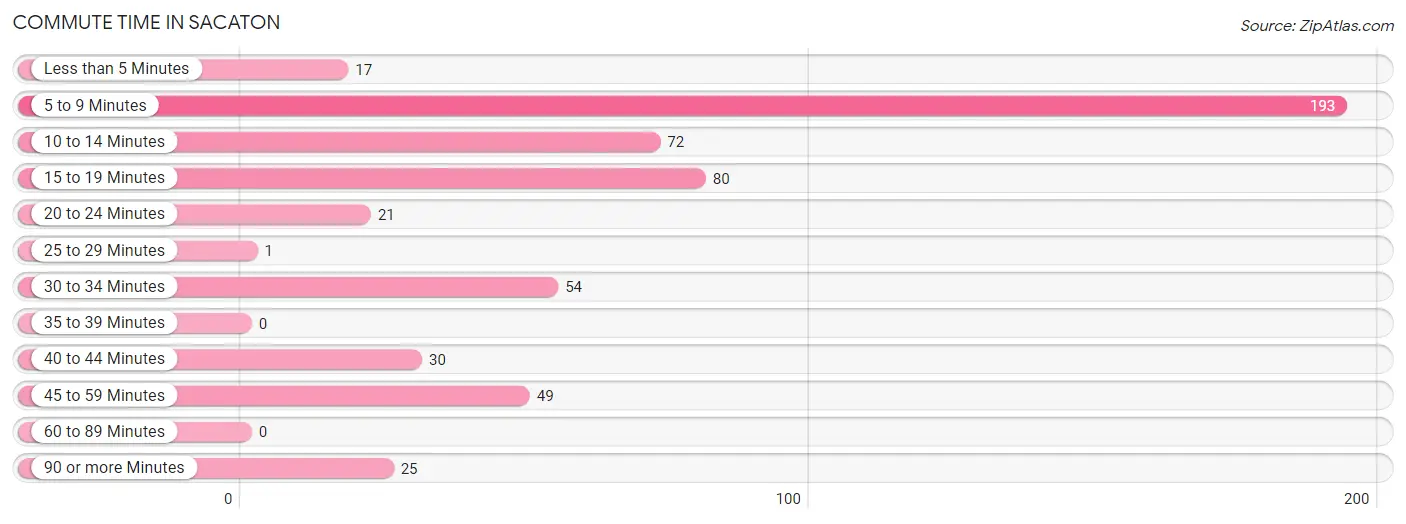
| Commute Time | # Commuters | % Commuters |
| Less than 5 Minutes | 17 | 3.1% |
| 5 to 9 Minutes | 193 | 35.6% |
| 10 to 14 Minutes | 72 | 13.3% |
| 15 to 19 Minutes | 80 | 14.8% |
| 20 to 24 Minutes | 21 | 3.9% |
| 25 to 29 Minutes | 1 | 0.2% |
| 30 to 34 Minutes | 54 | 10.0% |
| 35 to 39 Minutes | 0 | 0.0% |
| 40 to 44 Minutes | 30 | 5.5% |
| 45 to 59 Minutes | 49 | 9.0% |
| 60 to 89 Minutes | 0 | 0.0% |
| 90 or more Minutes | 25 | 4.6% |
Commute Time by Sex in Sacaton
The most common commute times in Sacaton are 15 to 19 minutes (80 commuters, 28.0%) for males and 5 to 9 minutes (153 commuters, 59.8%) for females.
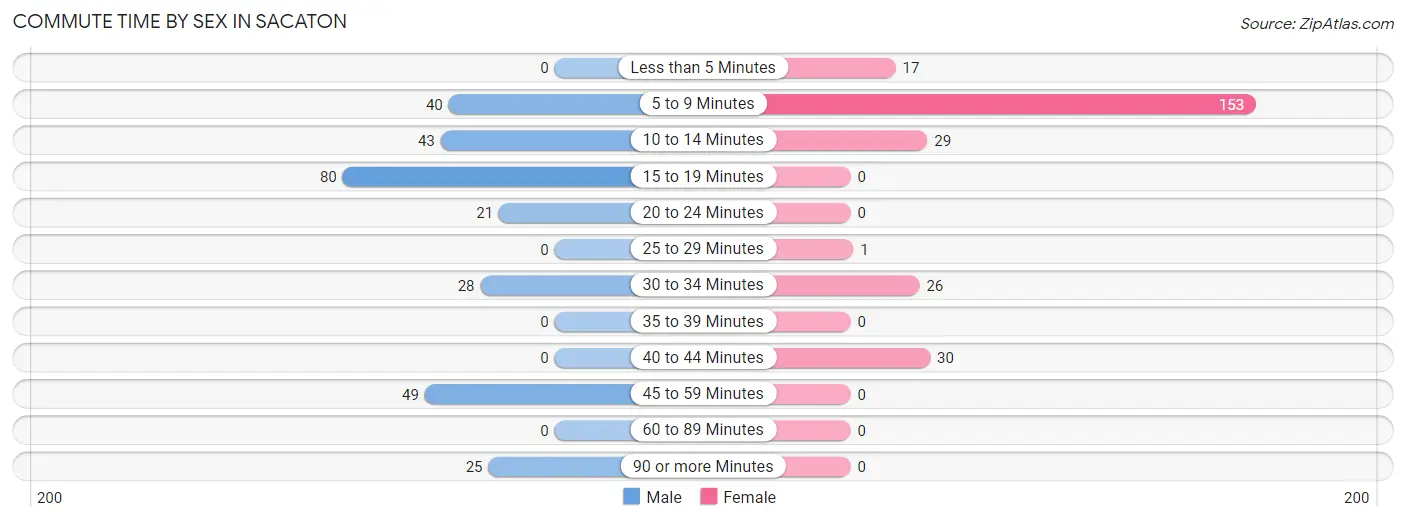
| Commute Time | Male | Female |
| Less than 5 Minutes | 0 (0.0%) | 17 (6.6%) |
| 5 to 9 Minutes | 40 (14.0%) | 153 (59.8%) |
| 10 to 14 Minutes | 43 (15.0%) | 29 (11.3%) |
| 15 to 19 Minutes | 80 (28.0%) | 0 (0.0%) |
| 20 to 24 Minutes | 21 (7.3%) | 0 (0.0%) |
| 25 to 29 Minutes | 0 (0.0%) | 1 (0.4%) |
| 30 to 34 Minutes | 28 (9.8%) | 26 (10.2%) |
| 35 to 39 Minutes | 0 (0.0%) | 0 (0.0%) |
| 40 to 44 Minutes | 0 (0.0%) | 30 (11.7%) |
| 45 to 59 Minutes | 49 (17.1%) | 0 (0.0%) |
| 60 to 89 Minutes | 0 (0.0%) | 0 (0.0%) |
| 90 or more Minutes | 25 (8.7%) | 0 (0.0%) |
Time of Departure to Work by Sex in Sacaton
The most frequent times of departure to work in Sacaton are 5:00 AM to 5:29 AM (116, 40.6%) for males and 7:30 AM to 7:59 AM (154, 60.2%) for females.
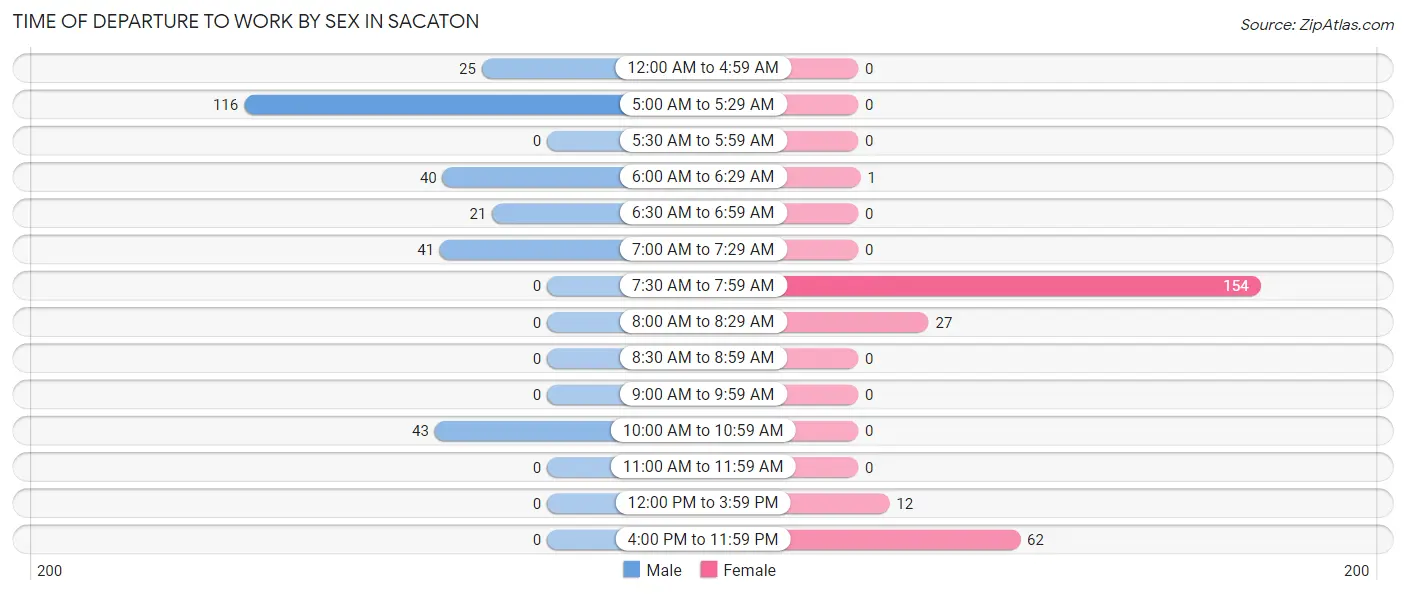
| Time of Departure | Male | Female |
| 12:00 AM to 4:59 AM | 25 (8.7%) | 0 (0.0%) |
| 5:00 AM to 5:29 AM | 116 (40.6%) | 0 (0.0%) |
| 5:30 AM to 5:59 AM | 0 (0.0%) | 0 (0.0%) |
| 6:00 AM to 6:29 AM | 40 (14.0%) | 1 (0.4%) |
| 6:30 AM to 6:59 AM | 21 (7.3%) | 0 (0.0%) |
| 7:00 AM to 7:29 AM | 41 (14.3%) | 0 (0.0%) |
| 7:30 AM to 7:59 AM | 0 (0.0%) | 154 (60.2%) |
| 8:00 AM to 8:29 AM | 0 (0.0%) | 27 (10.5%) |
| 8:30 AM to 8:59 AM | 0 (0.0%) | 0 (0.0%) |
| 9:00 AM to 9:59 AM | 0 (0.0%) | 0 (0.0%) |
| 10:00 AM to 10:59 AM | 43 (15.0%) | 0 (0.0%) |
| 11:00 AM to 11:59 AM | 0 (0.0%) | 0 (0.0%) |
| 12:00 PM to 3:59 PM | 0 (0.0%) | 12 (4.7%) |
| 4:00 PM to 11:59 PM | 0 (0.0%) | 62 (24.2%) |
| Total | 286 (100.0%) | 256 (100.0%) |
Housing Occupancy in Sacaton
Occupancy by Ownership in Sacaton
Of the total 695 dwellings in Sacaton, owner-occupied units account for 522 (75.1%), while renter-occupied units make up 173 (24.9%).
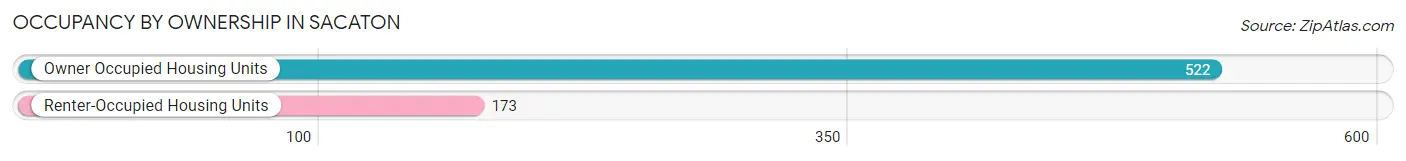
| Occupancy | # Housing Units | % Housing Units |
| Owner Occupied Housing Units | 522 | 75.1% |
| Renter-Occupied Housing Units | 173 | 24.9% |
| Total Occupied Housing Units | 695 | 100.0% |
Occupancy by Household Size in Sacaton
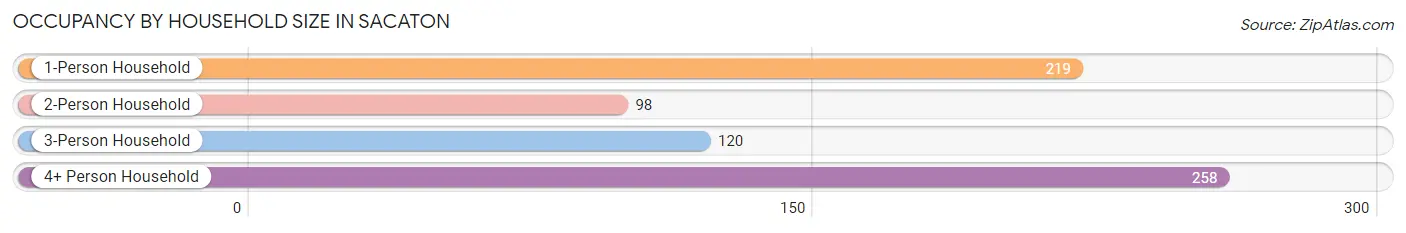
| Household Size | # Housing Units | % Housing Units |
| 1-Person Household | 219 | 31.5% |
| 2-Person Household | 98 | 14.1% |
| 3-Person Household | 120 | 17.3% |
| 4+ Person Household | 258 | 37.1% |
| Total Housing Units | 695 | 100.0% |
Occupancy by Ownership by Household Size in Sacaton
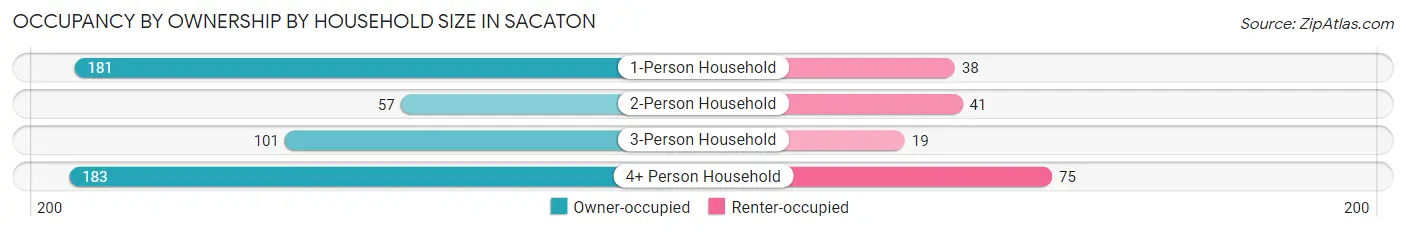
| Household Size | Owner-occupied | Renter-occupied |
| 1-Person Household | 181 (82.7%) | 38 (17.3%) |
| 2-Person Household | 57 (58.2%) | 41 (41.8%) |
| 3-Person Household | 101 (84.2%) | 19 (15.8%) |
| 4+ Person Household | 183 (70.9%) | 75 (29.1%) |
| Total Housing Units | 522 (75.1%) | 173 (24.9%) |
Occupancy by Educational Attainment in Sacaton
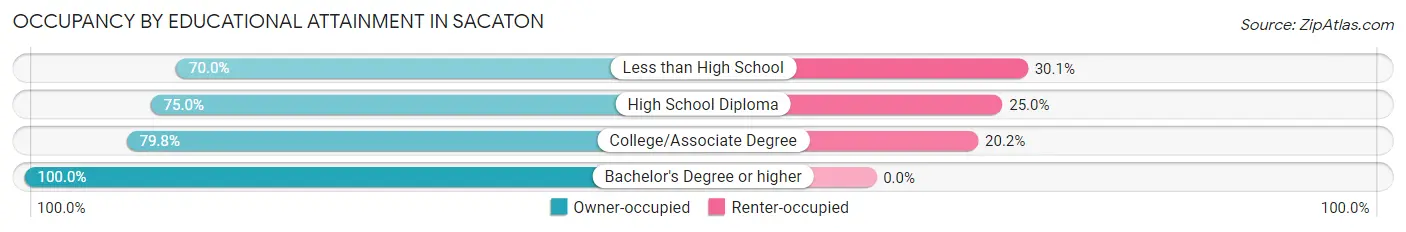
| Household Size | Owner-occupied | Renter-occupied |
| Less than High School | 149 (70.0%) | 64 (30.0%) |
| High School Diploma | 213 (75.0%) | 71 (25.0%) |
| College/Associate Degree | 150 (79.8%) | 38 (20.2%) |
| Bachelor's Degree or higher | 10 (100.0%) | 0 (0.0%) |
Occupancy by Age of Householder in Sacaton
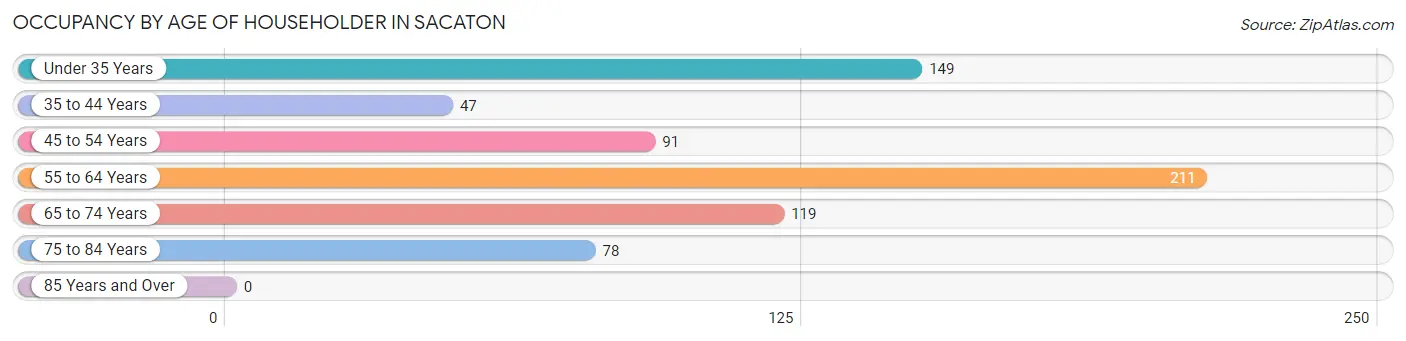
| Age Bracket | # Households | % Households |
| Under 35 Years | 149 | 21.4% |
| 35 to 44 Years | 47 | 6.8% |
| 45 to 54 Years | 91 | 13.1% |
| 55 to 64 Years | 211 | 30.4% |
| 65 to 74 Years | 119 | 17.1% |
| 75 to 84 Years | 78 | 11.2% |
| 85 Years and Over | 0 | 0.0% |
| Total | 695 | 100.0% |
Housing Finances in Sacaton
Median Income by Occupancy in Sacaton
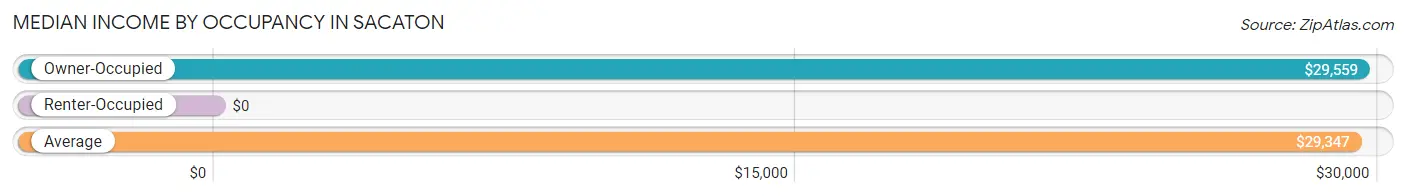
| Occupancy Type | # Households | Median Income |
| Owner-Occupied | 522 (75.1%) | $29,559 |
| Renter-Occupied | 173 (24.9%) | $0 |
| Average | 695 (100.0%) | $29,347 |
Occupancy by Householder Income Bracket in Sacaton
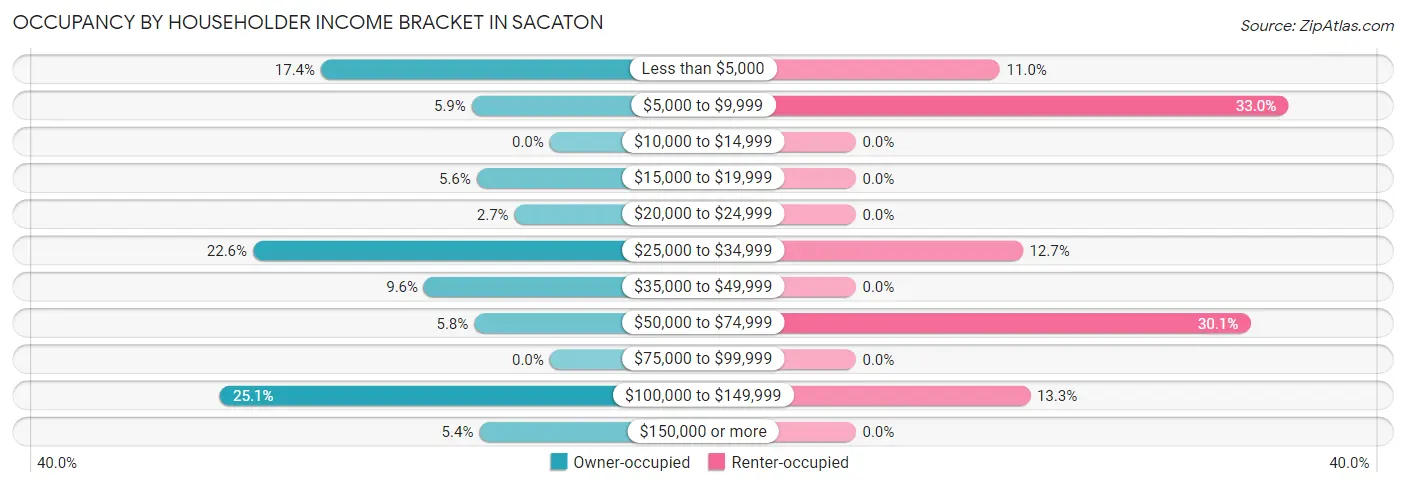
| Income Bracket | Owner-occupied | Renter-occupied |
| Less than $5,000 | 91 (17.4%) | 19 (11.0%) |
| $5,000 to $9,999 | 31 (5.9%) | 57 (33.0%) |
| $10,000 to $14,999 | 0 (0.0%) | 0 (0.0%) |
| $15,000 to $19,999 | 29 (5.6%) | 0 (0.0%) |
| $20,000 to $24,999 | 14 (2.7%) | 0 (0.0%) |
| $25,000 to $34,999 | 118 (22.6%) | 22 (12.7%) |
| $35,000 to $49,999 | 50 (9.6%) | 0 (0.0%) |
| $50,000 to $74,999 | 30 (5.8%) | 52 (30.1%) |
| $75,000 to $99,999 | 0 (0.0%) | 0 (0.0%) |
| $100,000 to $149,999 | 131 (25.1%) | 23 (13.3%) |
| $150,000 or more | 28 (5.4%) | 0 (0.0%) |
| Total | 522 (100.0%) | 173 (100.0%) |
Monthly Housing Cost Tiers in Sacaton
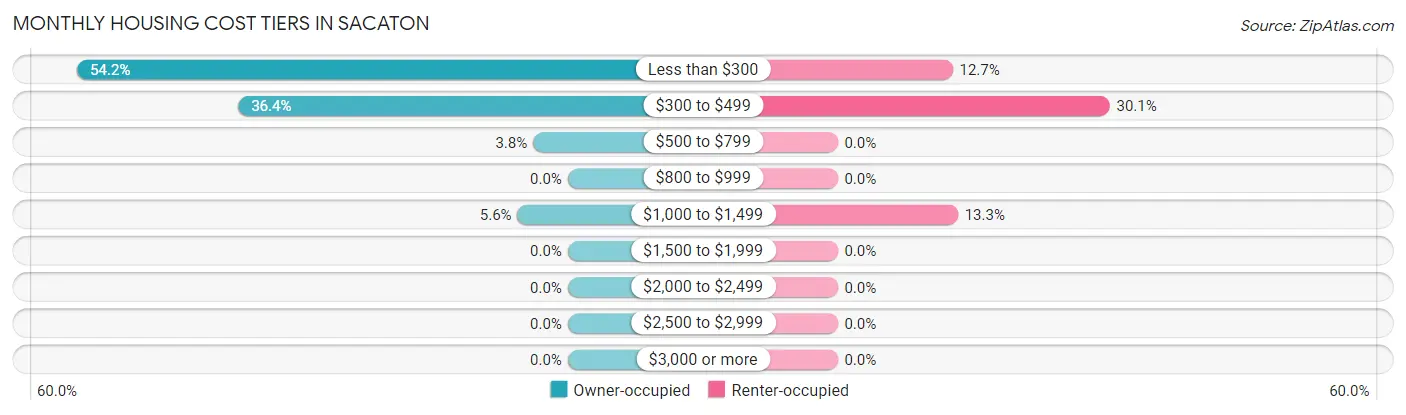
| Monthly Cost | Owner-occupied | Renter-occupied |
| Less than $300 | 283 (54.2%) | 22 (12.7%) |
| $300 to $499 | 190 (36.4%) | 52 (30.1%) |
| $500 to $799 | 20 (3.8%) | 0 (0.0%) |
| $800 to $999 | 0 (0.0%) | 0 (0.0%) |
| $1,000 to $1,499 | 29 (5.6%) | 23 (13.3%) |
| $1,500 to $1,999 | 0 (0.0%) | 0 (0.0%) |
| $2,000 to $2,499 | 0 (0.0%) | 0 (0.0%) |
| $2,500 to $2,999 | 0 (0.0%) | 0 (0.0%) |
| $3,000 or more | 0 (0.0%) | 0 (0.0%) |
| Total | 522 (100.0%) | 173 (100.0%) |
Physical Housing Characteristics in Sacaton
Housing Structures in Sacaton
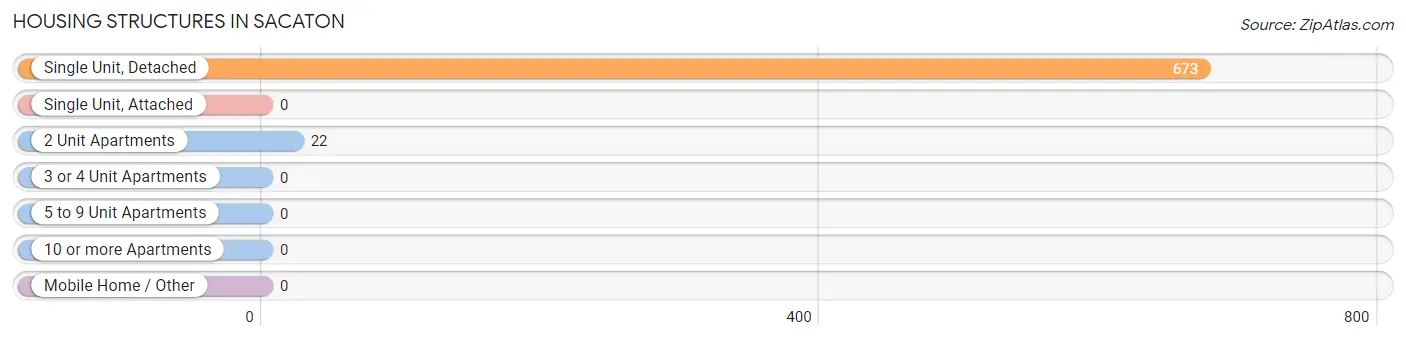
| Structure Type | # Housing Units | % Housing Units |
| Single Unit, Detached | 673 | 96.8% |
| Single Unit, Attached | 0 | 0.0% |
| 2 Unit Apartments | 22 | 3.2% |
| 3 or 4 Unit Apartments | 0 | 0.0% |
| 5 to 9 Unit Apartments | 0 | 0.0% |
| 10 or more Apartments | 0 | 0.0% |
| Mobile Home / Other | 0 | 0.0% |
| Total | 695 | 100.0% |
Housing Structures by Occupancy in Sacaton
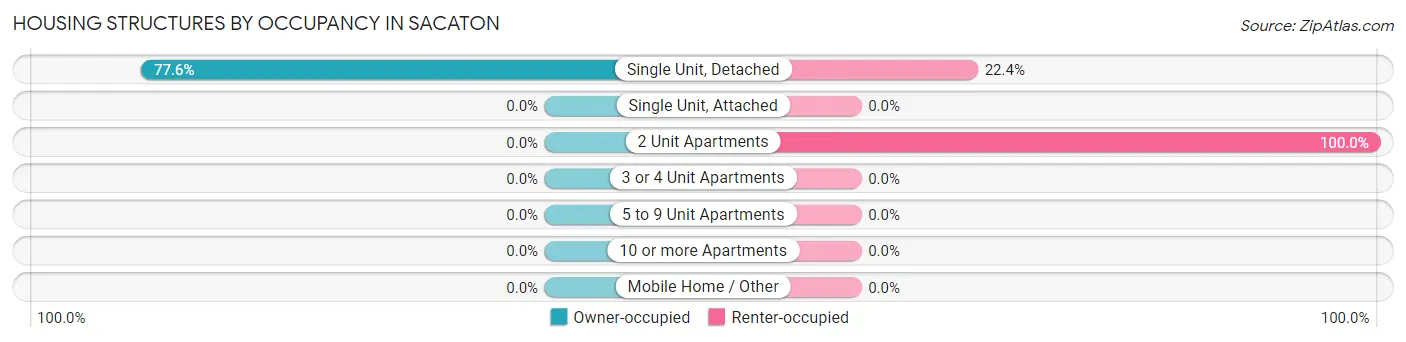
| Structure Type | Owner-occupied | Renter-occupied |
| Single Unit, Detached | 522 (77.6%) | 151 (22.4%) |
| Single Unit, Attached | 0 (0.0%) | 0 (0.0%) |
| 2 Unit Apartments | 0 (0.0%) | 22 (100.0%) |
| 3 or 4 Unit Apartments | 0 (0.0%) | 0 (0.0%) |
| 5 to 9 Unit Apartments | 0 (0.0%) | 0 (0.0%) |
| 10 or more Apartments | 0 (0.0%) | 0 (0.0%) |
| Mobile Home / Other | 0 (0.0%) | 0 (0.0%) |
| Total | 522 (75.1%) | 173 (24.9%) |
Housing Structures by Number of Rooms in Sacaton
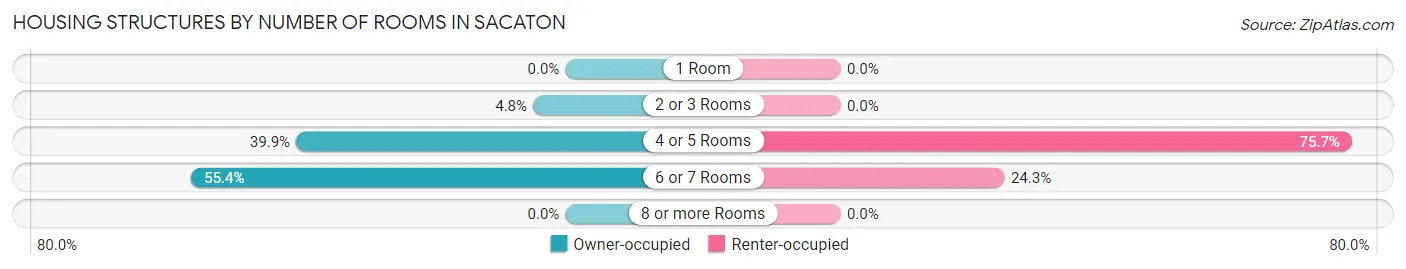
| Number of Rooms | Owner-occupied | Renter-occupied |
| 1 Room | 0 (0.0%) | 0 (0.0%) |
| 2 or 3 Rooms | 25 (4.8%) | 0 (0.0%) |
| 4 or 5 Rooms | 208 (39.9%) | 131 (75.7%) |
| 6 or 7 Rooms | 289 (55.4%) | 42 (24.3%) |
| 8 or more Rooms | 0 (0.0%) | 0 (0.0%) |
| Total | 522 (100.0%) | 173 (100.0%) |
Housing Structure by Heating Type in Sacaton
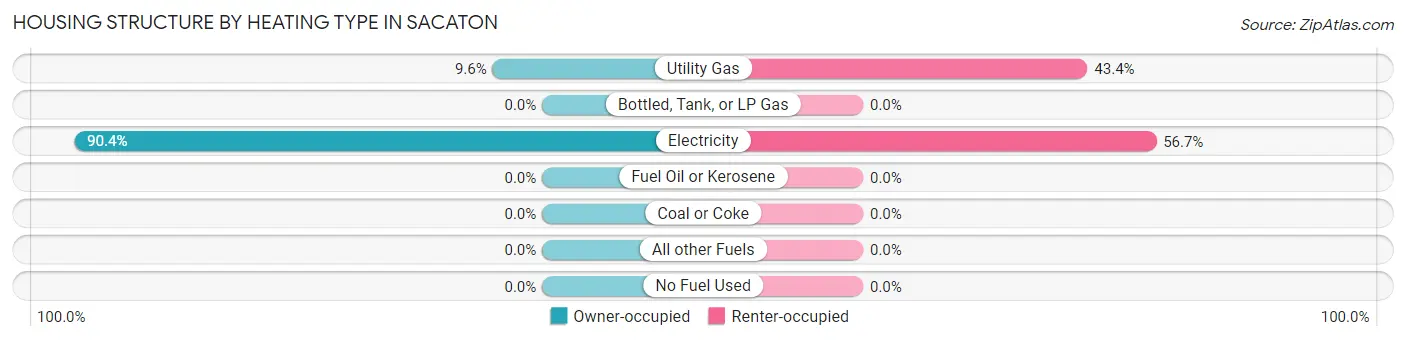
| Heating Type | Owner-occupied | Renter-occupied |
| Utility Gas | 50 (9.6%) | 75 (43.3%) |
| Bottled, Tank, or LP Gas | 0 (0.0%) | 0 (0.0%) |
| Electricity | 472 (90.4%) | 98 (56.7%) |
| Fuel Oil or Kerosene | 0 (0.0%) | 0 (0.0%) |
| Coal or Coke | 0 (0.0%) | 0 (0.0%) |
| All other Fuels | 0 (0.0%) | 0 (0.0%) |
| No Fuel Used | 0 (0.0%) | 0 (0.0%) |
| Total | 522 (100.0%) | 173 (100.0%) |
Household Vehicle Usage in Sacaton
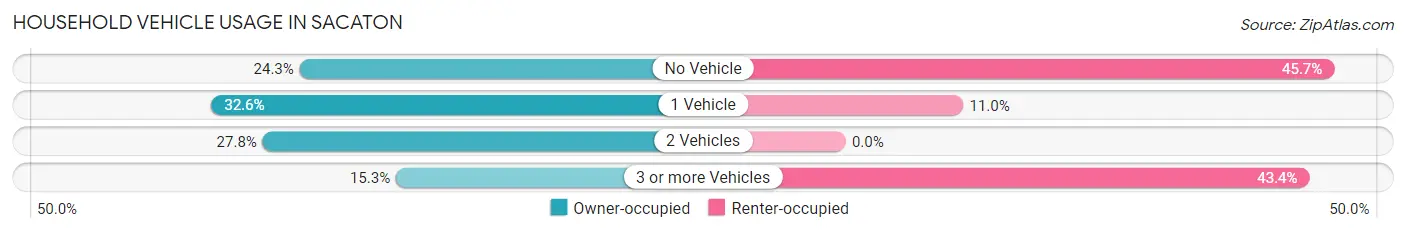
| Vehicles per Household | Owner-occupied | Renter-occupied |
| No Vehicle | 127 (24.3%) | 79 (45.7%) |
| 1 Vehicle | 170 (32.6%) | 19 (11.0%) |
| 2 Vehicles | 145 (27.8%) | 0 (0.0%) |
| 3 or more Vehicles | 80 (15.3%) | 75 (43.3%) |
| Total | 522 (100.0%) | 173 (100.0%) |
Real Estate & Mortgages in Sacaton
Real Estate and Mortgage Overview in Sacaton
| Characteristic | Without Mortgage | With Mortgage |
| Housing Units | 493 | 29 |
| Median Property Value | $91,800 | $0 |
| Median Household Income | $30,625 | $0 |
| Monthly Housing Costs | $309 | $0 |
| Real Estate Taxes | $304 | $0 |
Property Value by Mortgage Status in Sacaton
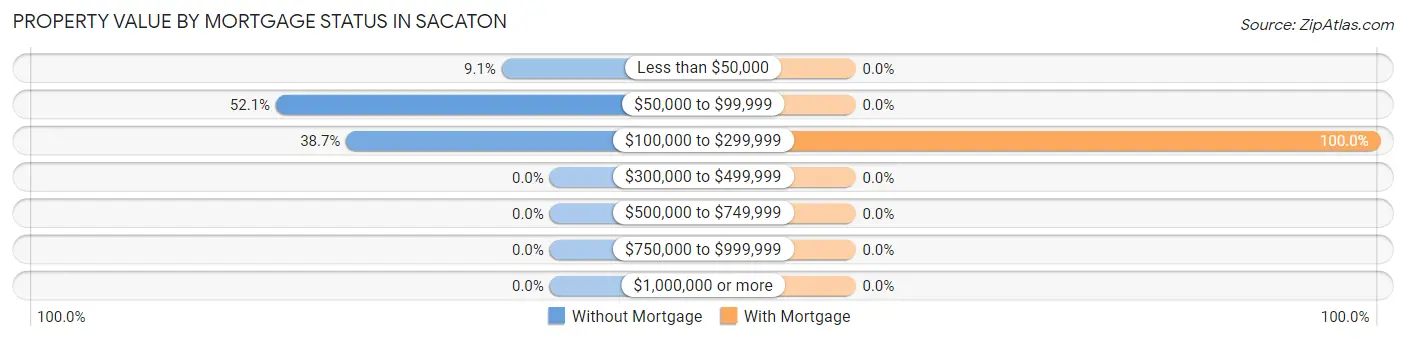
| Property Value | Without Mortgage | With Mortgage |
| Less than $50,000 | 45 (9.1%) | 0 (0.0%) |
| $50,000 to $99,999 | 257 (52.1%) | 0 (0.0%) |
| $100,000 to $299,999 | 191 (38.7%) | 29 (100.0%) |
| $300,000 to $499,999 | 0 (0.0%) | 0 (0.0%) |
| $500,000 to $749,999 | 0 (0.0%) | 0 (0.0%) |
| $750,000 to $999,999 | 0 (0.0%) | 0 (0.0%) |
| $1,000,000 or more | 0 (0.0%) | 0 (0.0%) |
| Total | 493 (100.0%) | 29 (100.0%) |
Household Income by Mortgage Status in Sacaton
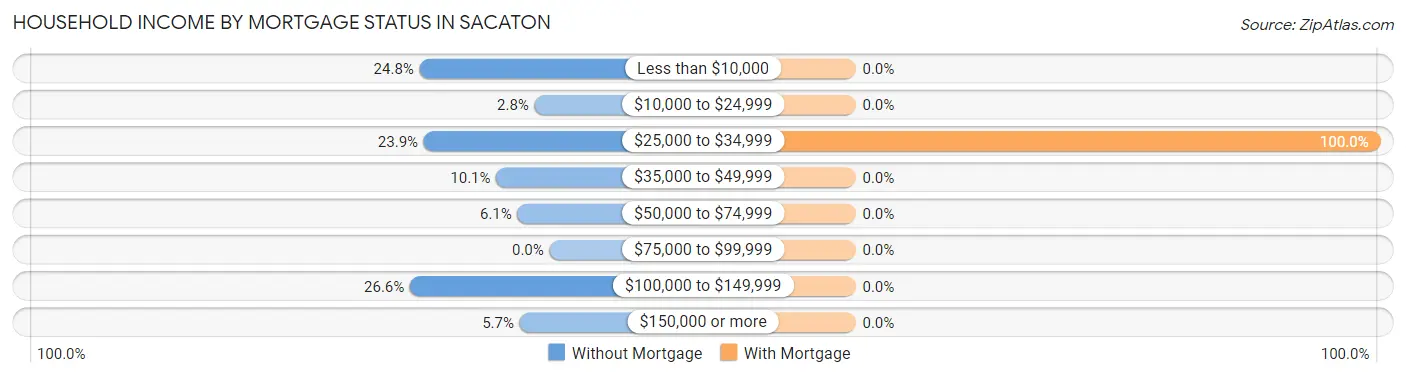
| Household Income | Without Mortgage | With Mortgage |
| Less than $10,000 | 122 (24.7%) | 0 (0.0%) |
| $10,000 to $24,999 | 14 (2.8%) | 0 (0.0%) |
| $25,000 to $34,999 | 118 (23.9%) | 29 (100.0%) |
| $35,000 to $49,999 | 50 (10.1%) | 0 (0.0%) |
| $50,000 to $74,999 | 30 (6.1%) | 0 (0.0%) |
| $75,000 to $99,999 | 0 (0.0%) | 0 (0.0%) |
| $100,000 to $149,999 | 131 (26.6%) | 0 (0.0%) |
| $150,000 or more | 28 (5.7%) | 0 (0.0%) |
| Total | 493 (100.0%) | 29 (100.0%) |
Property Value to Household Income Ratio in Sacaton
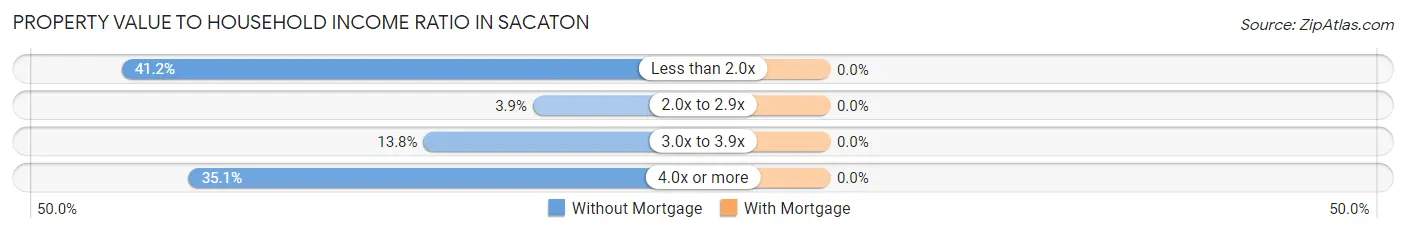
| Value-to-Income Ratio | Without Mortgage | With Mortgage |
| Less than 2.0x | 203 (41.2%) | 0 (0.0%) |
| 2.0x to 2.9x | 19 (3.8%) | 0 (0.0%) |
| 3.0x to 3.9x | 68 (13.8%) | 0 (0.0%) |
| 4.0x or more | 173 (35.1%) | 0 (0.0%) |
| Total | 493 (100.0%) | 29 (100.0%) |
Real Estate Taxes by Mortgage Status in Sacaton
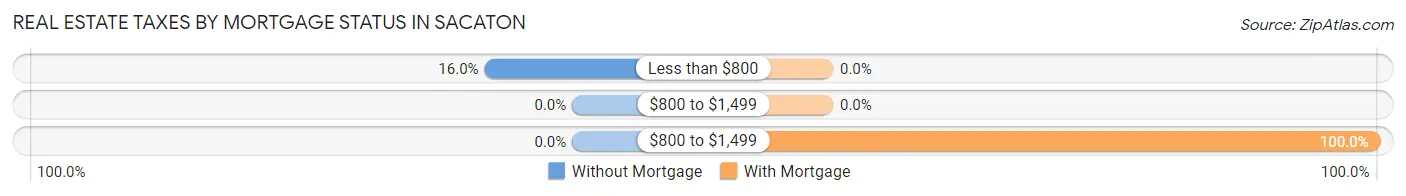
| Property Taxes | Without Mortgage | With Mortgage |
| Less than $800 | 79 (16.0%) | 0 (0.0%) |
| $800 to $1,499 | 0 (0.0%) | 0 (0.0%) |
| $800 to $1,499 | 0 (0.0%) | 29 (100.0%) |
| Total | 493 (100.0%) | 29 (100.0%) |
Health & Disability in Sacaton
Health Insurance Coverage by Age in Sacaton
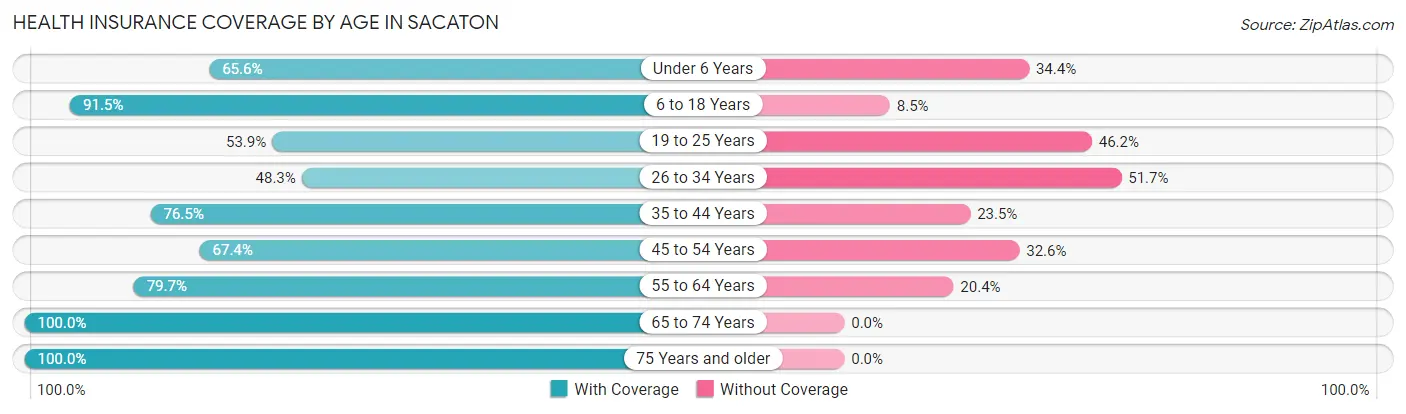
| Age Bracket | With Coverage | Without Coverage |
| Under 6 Years | 118 (65.6%) | 62 (34.4%) |
| 6 to 18 Years | 485 (91.5%) | 45 (8.5%) |
| 19 to 25 Years | 182 (53.8%) | 156 (46.2%) |
| 26 to 34 Years | 218 (48.3%) | 233 (51.7%) |
| 35 to 44 Years | 88 (76.5%) | 27 (23.5%) |
| 45 to 54 Years | 130 (67.4%) | 63 (32.6%) |
| 55 to 64 Years | 227 (79.6%) | 58 (20.3%) |
| 65 to 74 Years | 119 (100.0%) | 0 (0.0%) |
| 75 Years and older | 78 (100.0%) | 0 (0.0%) |
| Total | 1,645 (71.9%) | 644 (28.1%) |
Health Insurance Coverage by Citizenship Status in Sacaton
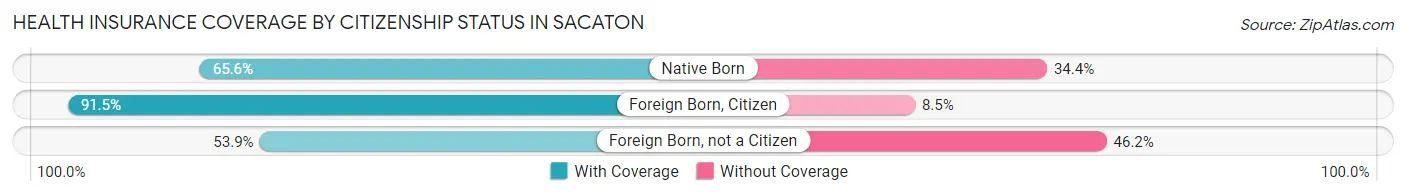
| Citizenship Status | With Coverage | Without Coverage |
| Native Born | 118 (65.6%) | 62 (34.4%) |
| Foreign Born, Citizen | 485 (91.5%) | 45 (8.5%) |
| Foreign Born, not a Citizen | 182 (53.8%) | 156 (46.2%) |
Health Insurance Coverage by Household Income in Sacaton
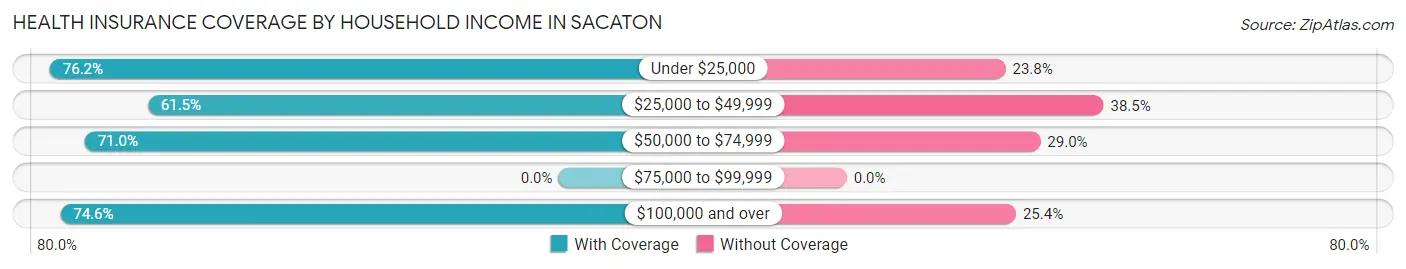
| Household Income | With Coverage | Without Coverage |
| Under $25,000 | 410 (76.2%) | 128 (23.8%) |
| $25,000 to $49,999 | 275 (61.5%) | 172 (38.5%) |
| $50,000 to $74,999 | 225 (71.0%) | 92 (29.0%) |
| $75,000 to $99,999 | 0 (0.0%) | 0 (0.0%) |
| $100,000 and over | 733 (74.6%) | 249 (25.4%) |
Public vs Private Health Insurance Coverage by Age in Sacaton
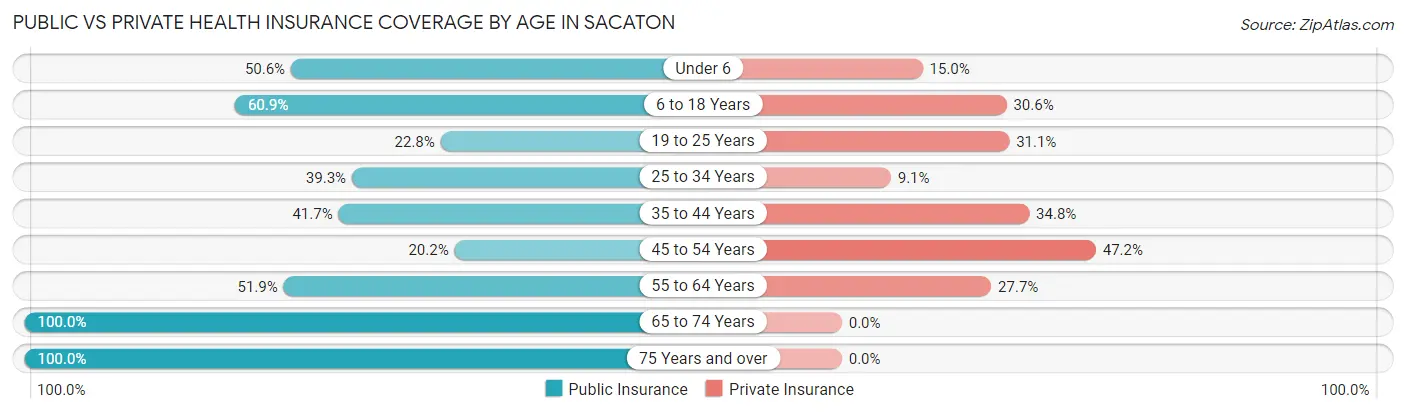
| Age Bracket | Public Insurance | Private Insurance |
| Under 6 | 91 (50.6%) | 27 (15.0%) |
| 6 to 18 Years | 323 (60.9%) | 162 (30.6%) |
| 19 to 25 Years | 77 (22.8%) | 105 (31.1%) |
| 25 to 34 Years | 177 (39.3%) | 41 (9.1%) |
| 35 to 44 Years | 48 (41.7%) | 40 (34.8%) |
| 45 to 54 Years | 39 (20.2%) | 91 (47.1%) |
| 55 to 64 Years | 148 (51.9%) | 79 (27.7%) |
| 65 to 74 Years | 119 (100.0%) | 0 (0.0%) |
| 75 Years and over | 78 (100.0%) | 0 (0.0%) |
| Total | 1,100 (48.1%) | 545 (23.8%) |
Disability Status by Sex by Age in Sacaton
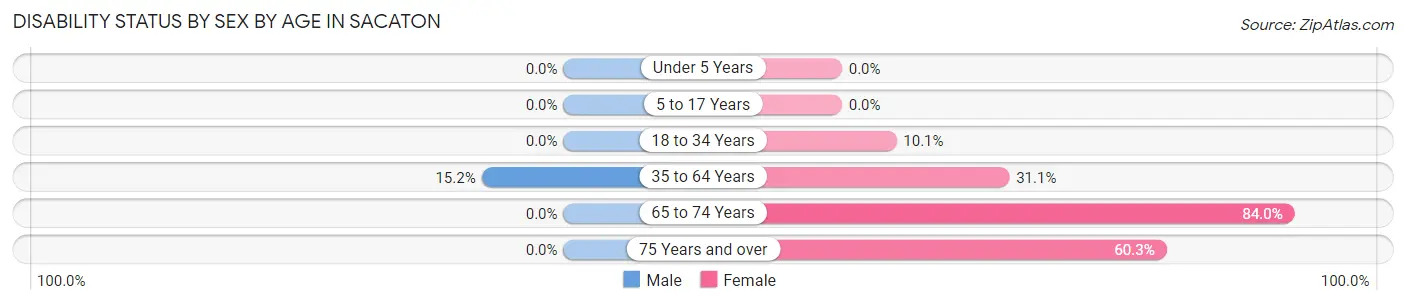
| Age Bracket | Male | Female |
| Under 5 Years | 0 (0.0%) | 0 (0.0%) |
| 5 to 17 Years | 0 (0.0%) | 0 (0.0%) |
| 18 to 34 Years | 0 (0.0%) | 31 (10.1%) |
| 35 to 64 Years | 52 (15.2%) | 78 (31.1%) |
| 65 to 74 Years | 0 (0.0%) | 100 (84.0%) |
| 75 Years and over | 0 (0.0%) | 47 (60.3%) |
Disability Class by Sex by Age in Sacaton
Disability Class: Hearing Difficulty
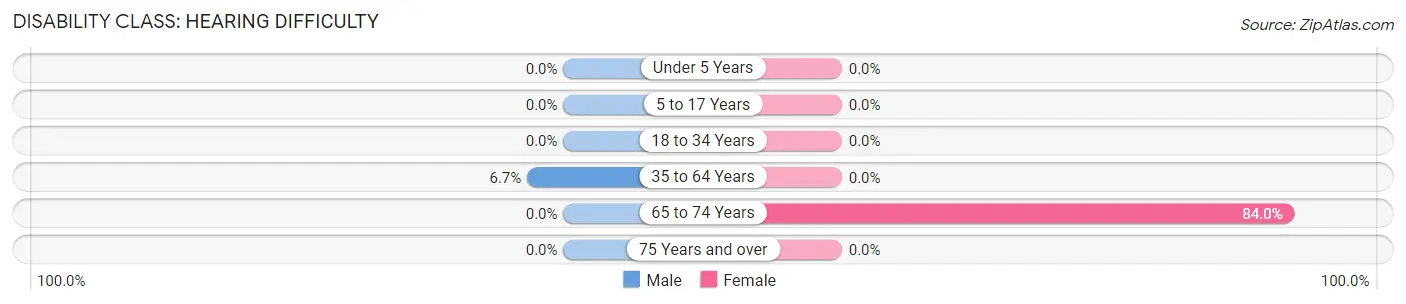
| Age Bracket | Male | Female |
| Under 5 Years | 0 (0.0%) | 0 (0.0%) |
| 5 to 17 Years | 0 (0.0%) | 0 (0.0%) |
| 18 to 34 Years | 0 (0.0%) | 0 (0.0%) |
| 35 to 64 Years | 23 (6.7%) | 0 (0.0%) |
| 65 to 74 Years | 0 (0.0%) | 100 (84.0%) |
| 75 Years and over | 0 (0.0%) | 0 (0.0%) |
Disability Class: Vision Difficulty
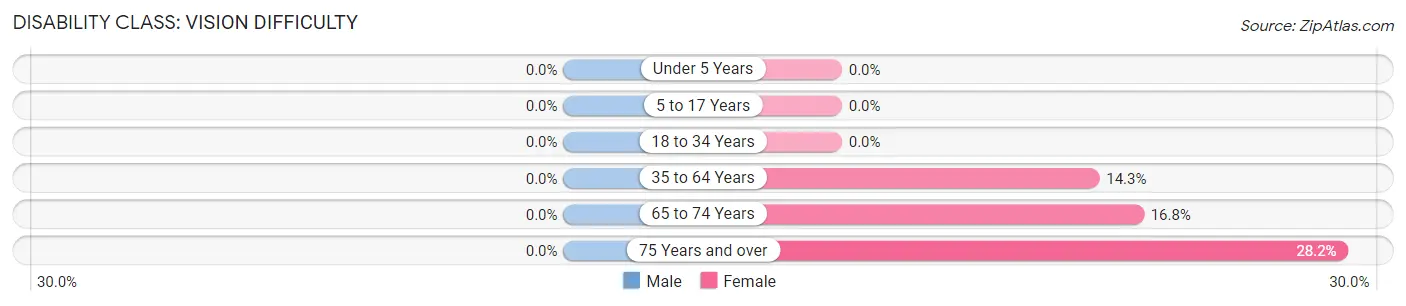
| Age Bracket | Male | Female |
| Under 5 Years | 0 (0.0%) | 0 (0.0%) |
| 5 to 17 Years | 0 (0.0%) | 0 (0.0%) |
| 18 to 34 Years | 0 (0.0%) | 0 (0.0%) |
| 35 to 64 Years | 0 (0.0%) | 36 (14.3%) |
| 65 to 74 Years | 0 (0.0%) | 20 (16.8%) |
| 75 Years and over | 0 (0.0%) | 22 (28.2%) |
Disability Class: Cognitive Difficulty
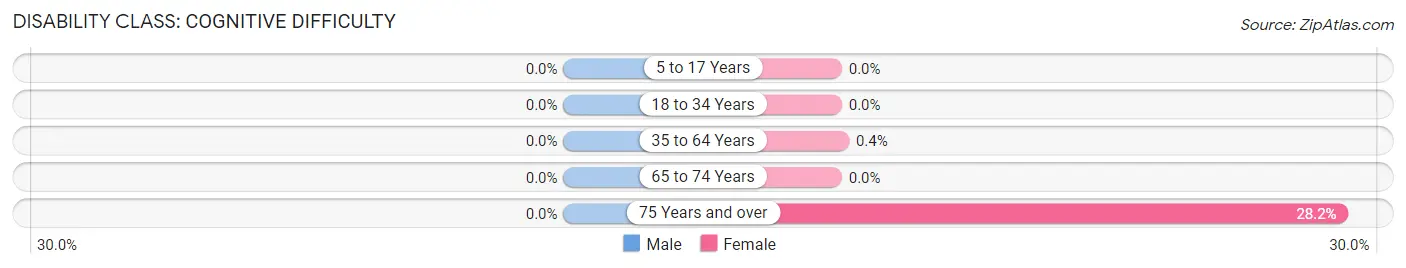
| Age Bracket | Male | Female |
| 5 to 17 Years | 0 (0.0%) | 0 (0.0%) |
| 18 to 34 Years | 0 (0.0%) | 0 (0.0%) |
| 35 to 64 Years | 0 (0.0%) | 1 (0.4%) |
| 65 to 74 Years | 0 (0.0%) | 0 (0.0%) |
| 75 Years and over | 0 (0.0%) | 22 (28.2%) |
Disability Class: Ambulatory Difficulty
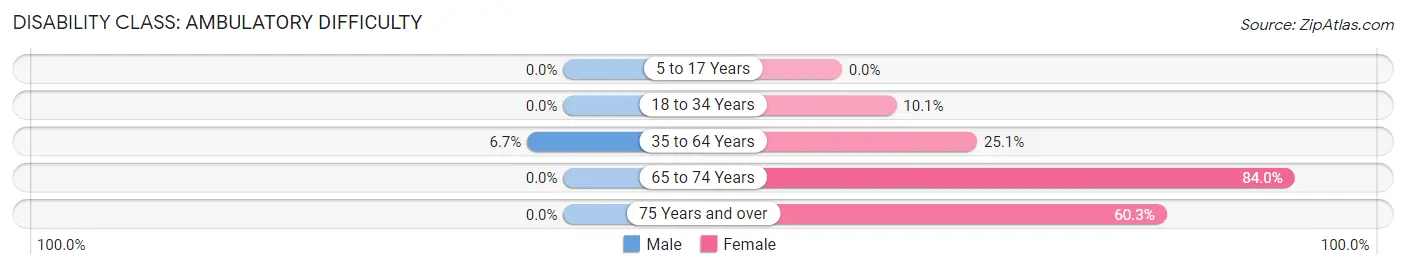
| Age Bracket | Male | Female |
| 5 to 17 Years | 0 (0.0%) | 0 (0.0%) |
| 18 to 34 Years | 0 (0.0%) | 31 (10.1%) |
| 35 to 64 Years | 23 (6.7%) | 63 (25.1%) |
| 65 to 74 Years | 0 (0.0%) | 100 (84.0%) |
| 75 Years and over | 0 (0.0%) | 47 (60.3%) |
Disability Class: Self-Care Difficulty
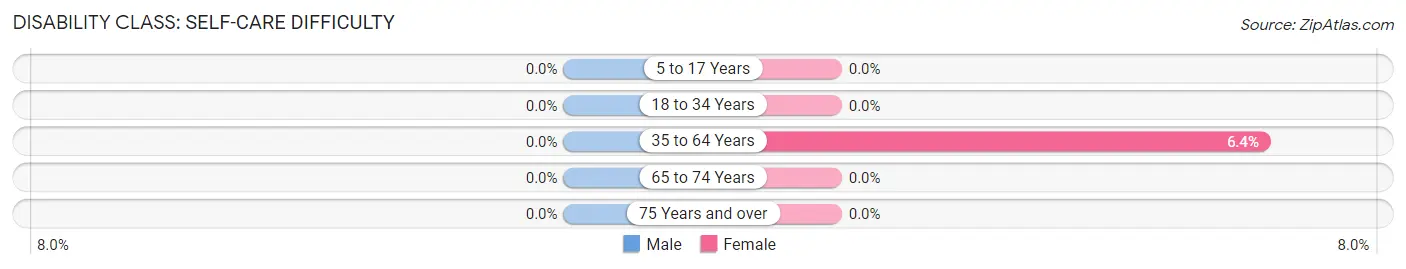
| Age Bracket | Male | Female |
| 5 to 17 Years | 0 (0.0%) | 0 (0.0%) |
| 18 to 34 Years | 0 (0.0%) | 0 (0.0%) |
| 35 to 64 Years | 0 (0.0%) | 16 (6.4%) |
| 65 to 74 Years | 0 (0.0%) | 0 (0.0%) |
| 75 Years and over | 0 (0.0%) | 0 (0.0%) |
Technology Access in Sacaton
Computing Device Access in Sacaton
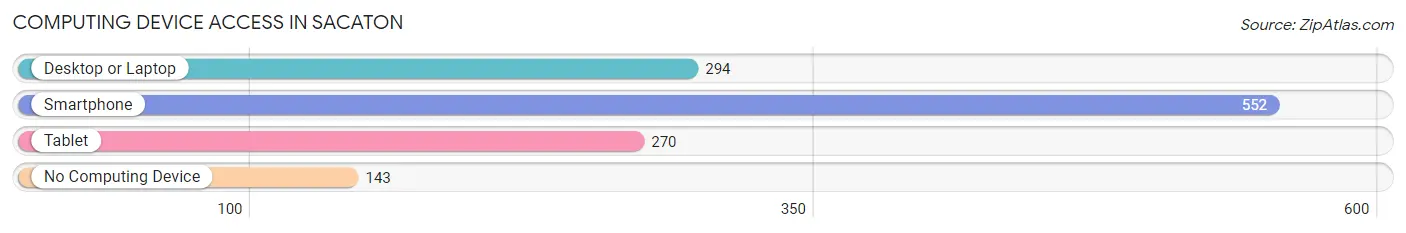
| Device Type | # Households | % Households |
| Desktop or Laptop | 294 | 42.3% |
| Smartphone | 552 | 79.4% |
| Tablet | 270 | 38.9% |
| No Computing Device | 143 | 20.6% |
| Total | 695 | 100.0% |
Internet Access in Sacaton
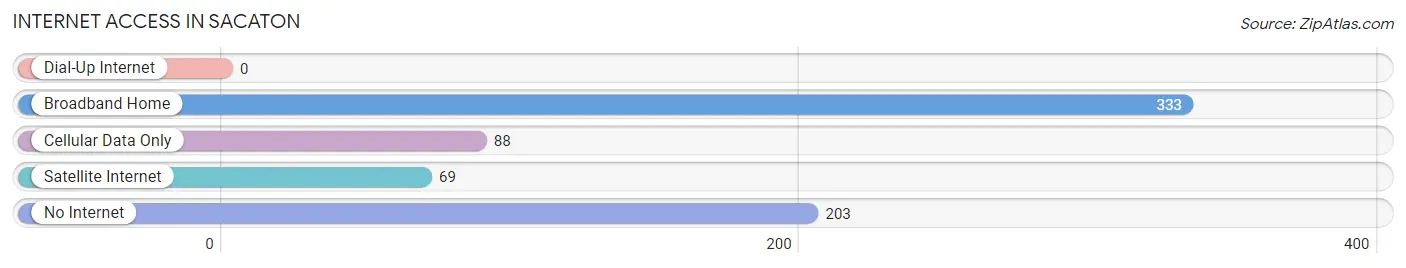
| Internet Type | # Households | % Households |
| Dial-Up Internet | 0 | 0.0% |
| Broadband Home | 333 | 47.9% |
| Cellular Data Only | 88 | 12.7% |
| Satellite Internet | 69 | 9.9% |
| No Internet | 203 | 29.2% |
| Total | 695 | 100.0% |
Sacaton Summary
History
Sacaton is a small town located in Pinal County, Arizona. It is situated in the Gila River Indian Community, which is home to the Akimel O’odham and Pee-Posh tribes. The town was founded in 1874 by the United States government as a reservation for the Akimel O’odham and Pee-Posh tribes. The town was named after the Sacaton Mountains, which are located nearby.
The town was originally a farming community, with the main crops being cotton, corn, and wheat. The town also had a small trading post, which served as a hub for the local tribes. In the early 1900s, the town began to grow as more settlers moved in. The town was incorporated in 1912 and the population grew to over 1,000 by the 1930s.
The town was largely unaffected by World War II, but the 1950s saw a decline in the population as many of the residents moved away to find work in other parts of the state. The population continued to decline until the 1970s, when the Gila River Indian Community was established. This allowed the tribes to reclaim their land and the population began to grow again.
Today, Sacaton is a small town with a population of just over 2,000. The town is home to several businesses, including a grocery store, a gas station, and a few restaurants. The town is also home to the Gila River Indian Community Cultural Center, which is a museum and cultural center dedicated to preserving the history and culture of the Akimel O’odham and Pee-Posh tribes.
Geography
Sacaton is located in Pinal County, Arizona, in the Gila River Indian Community. The town is situated in the Sonoran Desert, which is characterized by hot, dry summers and mild winters. The town is located near the Gila River, which provides a source of water for the town. The town is also located near the Sacaton Mountains, which are a range of mountains located in the area.
The town is located about 40 miles south of Phoenix and about 60 miles north of Tucson. The town is located at an elevation of 1,845 feet above sea level. The town is located in a semi-arid climate, with hot summers and mild winters. The average temperature in the summer is around 95 degrees Fahrenheit, and the average temperature in the winter is around 55 degrees Fahrenheit.
Economy
The economy of Sacaton is largely based on agriculture. The town is home to several farms, which produce cotton, corn, wheat, and other crops. The town is also home to several businesses, including a grocery store, a gas station, and a few restaurants. The town is also home to the Gila River Indian Community Cultural Center, which is a museum and cultural center dedicated to preserving the history and culture of the Akimel O’odham and Pee-Posh tribes.
The town is also home to several manufacturing companies, which produce a variety of products, including furniture, clothing, and electronics. The town is also home to several government offices, including the Gila River Indian Community Tribal Council and the Gila River Indian Community Police Department.
Demographics
As of the 2010 census, the population of Sacaton was 2,053. The town is home to a diverse population, with the majority of the population being Native American. The town is also home to a small Hispanic population, as well as a small population of African Americans and Asians. The median household income in the town is $30,000, and the median home value is $90,000. The town has a poverty rate of 28.3%, which is higher than the national average.
Common Questions
What is Per Capita Income in Sacaton?
Per Capita income in Sacaton is $13,879.
What is the Median Household income in Sacaton?
Median Household Income in Sacaton is $29,347.
What is Inequality or Gini Index in Sacaton?
Inequality or Gini Index in Sacaton is 0.53.
What is the Total Population of Sacaton?
Total Population of Sacaton is 2,713.
What is the Total Male Population of Sacaton?
Total Male Population of Sacaton is 1,434.
What is the Total Female Population of Sacaton?
Total Female Population of Sacaton is 1,279.
What is the Ratio of Males per 100 Females in Sacaton?
There are 112.12 Males per 100 Females in Sacaton.
What is the Ratio of Females per 100 Males in Sacaton?
There are 89.19 Females per 100 Males in Sacaton.
What is the Median Population Age in Sacaton?
Median Population Age in Sacaton is 30.0 Years.
What is the Average Family Size in Sacaton
Average Family Size in Sacaton is 3.9 People.
What is the Average Household Size in Sacaton
Average Household Size in Sacaton is 3.3 People.
How Large is the Labor Force in Sacaton?
There are 598 People in the Labor Forcein in Sacaton.
What is the Percentage of People in the Labor Force in Sacaton?
27.7% of People are in the Labor Force in Sacaton.
What is the Unemployment Rate in Sacaton?
Unemployment Rate in Sacaton is 9.4%.