Moenkopi, AZ Map & Demographics
Moenkopi Map
Moenkopi Overview
$13,884
PER CAPITA INCOME
$40,500
AVG FAMILY INCOME
$51,518
AVG HOUSEHOLD INCOME
1.9%
WAGE / INCOME GAP [ % ]
98.1¢/ $1
WAGE / INCOME GAP [ $ ]
0.44
INEQUALITY / GINI INDEX
1,064
TOTAL POPULATION
604
MALE POPULATION
460
FEMALE POPULATION
131.30
MALES / 100 FEMALES
76.16
FEMALES / 100 MALES
36.9
MEDIAN AGE
3.8
AVG FAMILY SIZE
3.8
AVG HOUSEHOLD SIZE
355
LABOR FORCE [ PEOPLE ]
40.3%
PERCENT IN LABOR FORCE
11.3%
UNEMPLOYMENT RATE
Income in Moenkopi
Income Overview in Moenkopi
Per Capita Income in Moenkopi is $13,884, while median incomes of families and households are $40,500 and $51,518 respectively.
| Characteristic | Number | Measure |
| Per Capita Income | 1,064 | $13,884 |
| Median Family Income | 236 | $40,500 |
| Mean Family Income | 236 | $50,509 |
| Median Household Income | 283 | $51,518 |
| Mean Household Income | 283 | $54,016 |
| Income Deficit | 236 | $0 |
| Wage / Income Gap (%) | 1,064 | 1.87% |
| Wage / Income Gap ($) | 1,064 | 98.13¢ per $1 |
| Gini / Inequality Index | 1,064 | 0.44 |
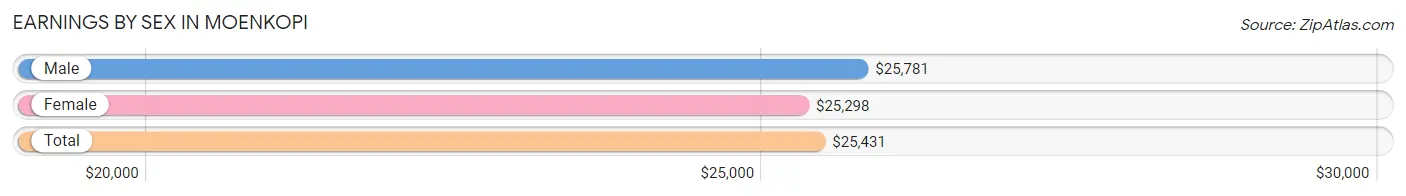
Earnings by Sex in Moenkopi
Average Earnings in Moenkopi are $25,431, $25,781 for men and $25,298 for women, a difference of 1.9%.
| Sex | Number | Average Earnings |
| Male | 195 (48.5%) | $25,781 |
| Female | 207 (51.5%) | $25,298 |
| Total | 402 (100.0%) | $25,431 |
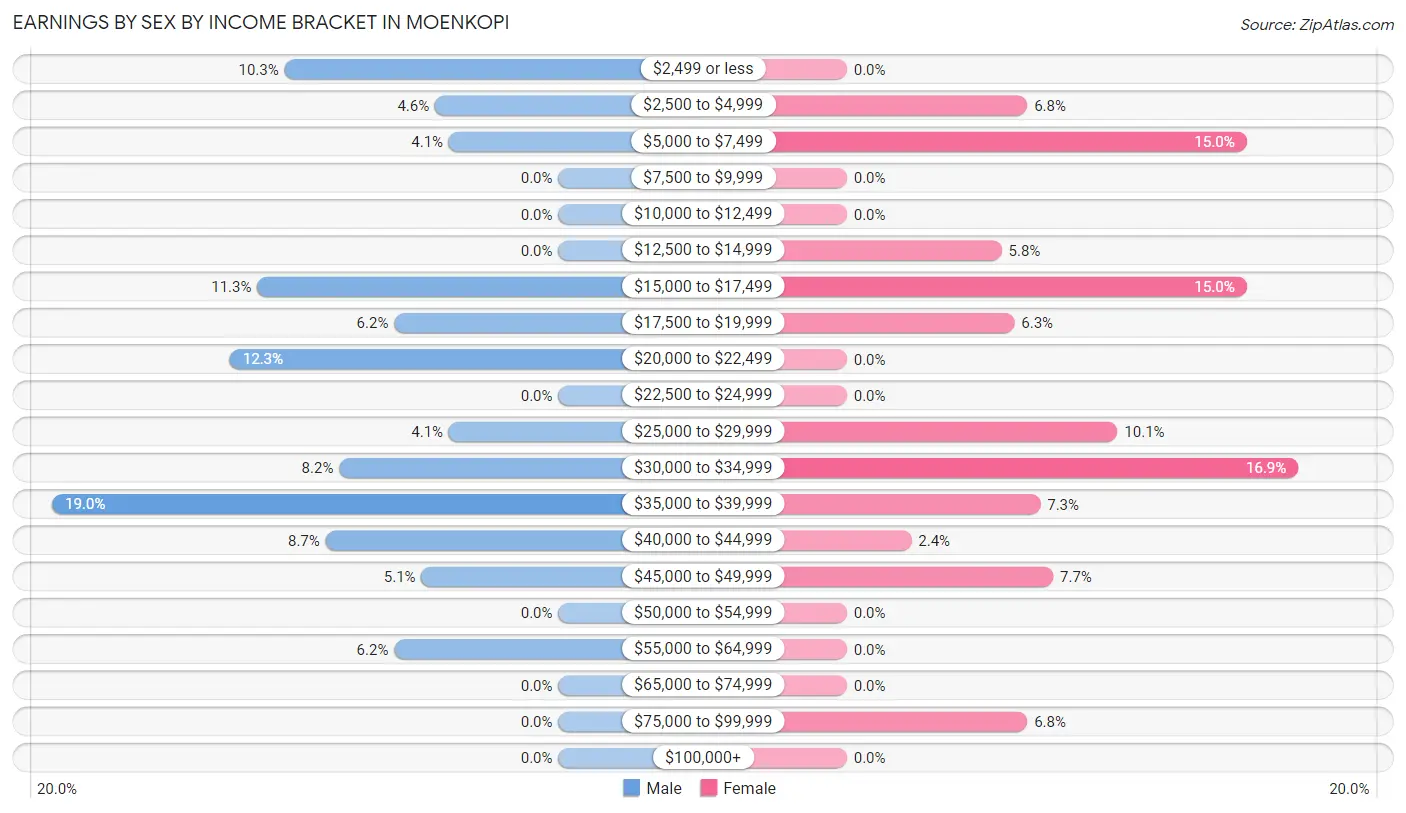
Earnings by Sex by Income Bracket in Moenkopi
The most common earnings brackets in Moenkopi are $35,000 to $39,999 for men (37 | 19.0%) and $30,000 to $34,999 for women (35 | 16.9%).
| Income | Male | Female |
| $2,499 or less | 20 (10.3%) | 0 (0.0%) |
| $2,500 to $4,999 | 9 (4.6%) | 14 (6.8%) |
| $5,000 to $7,499 | 8 (4.1%) | 31 (15.0%) |
| $7,500 to $9,999 | 0 (0.0%) | 0 (0.0%) |
| $10,000 to $12,499 | 0 (0.0%) | 0 (0.0%) |
| $12,500 to $14,999 | 0 (0.0%) | 12 (5.8%) |
| $15,000 to $17,499 | 22 (11.3%) | 31 (15.0%) |
| $17,500 to $19,999 | 12 (6.1%) | 13 (6.3%) |
| $20,000 to $22,499 | 24 (12.3%) | 0 (0.0%) |
| $22,500 to $24,999 | 0 (0.0%) | 0 (0.0%) |
| $25,000 to $29,999 | 8 (4.1%) | 21 (10.1%) |
| $30,000 to $34,999 | 16 (8.2%) | 35 (16.9%) |
| $35,000 to $39,999 | 37 (19.0%) | 15 (7.2%) |
| $40,000 to $44,999 | 17 (8.7%) | 5 (2.4%) |
| $45,000 to $49,999 | 10 (5.1%) | 16 (7.7%) |
| $50,000 to $54,999 | 0 (0.0%) | 0 (0.0%) |
| $55,000 to $64,999 | 12 (6.1%) | 0 (0.0%) |
| $65,000 to $74,999 | 0 (0.0%) | 0 (0.0%) |
| $75,000 to $99,999 | 0 (0.0%) | 14 (6.8%) |
| $100,000+ | 0 (0.0%) | 0 (0.0%) |
| Total | 195 (100.0%) | 207 (100.0%) |
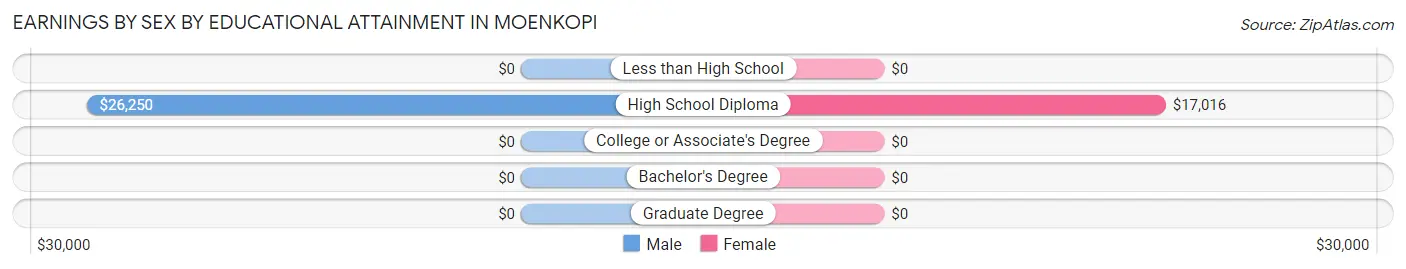
Earnings by Sex by Educational Attainment in Moenkopi
Average earnings in Moenkopi are $33,203 for men and $25,476 for women, a difference of 23.3%. Men with an educational attainment of high school diploma enjoy the highest average annual earnings of $26,250, while those with high school diploma education earn the least with $26,250. Women with an educational attainment of high school diploma earn the most with the average annual earnings of $17,016, while those with high school diploma education have the smallest earnings of $17,016.
| Educational Attainment | Male Income | Female Income |
| Less than High School | - | - |
| High School Diploma | $26,250 | $17,016 |
| College or Associate's Degree | - | - |
| Bachelor's Degree | - | - |
| Graduate Degree | - | - |
| Total | $33,203 | $25,476 |
Family Income in Moenkopi
Family Income Brackets in Moenkopi
According to the Moenkopi family income data, there are 57 families falling into the $50,000 to $74,999 income range, which is the most common income bracket and makes up 24.1% of all families.
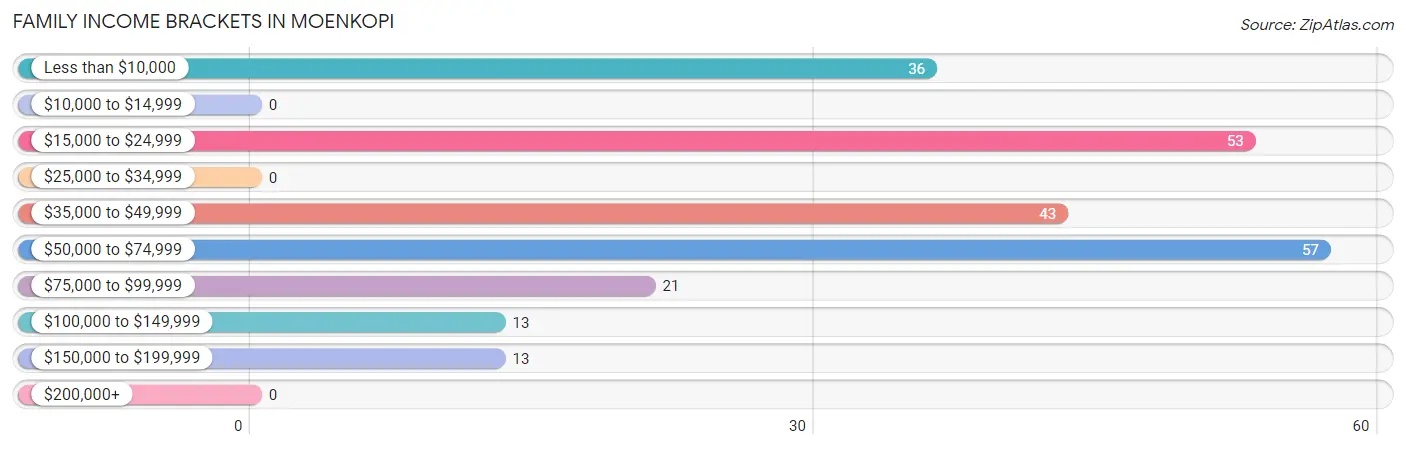
| Income Bracket | # Families | % Families |
| Less than $10,000 | 36 | 15.3% |
| $10,000 to $14,999 | 0 | 0.0% |
| $15,000 to $24,999 | 53 | 22.5% |
| $25,000 to $34,999 | 0 | 0.0% |
| $35,000 to $49,999 | 43 | 18.2% |
| $50,000 to $74,999 | 57 | 24.2% |
| $75,000 to $99,999 | 21 | 8.9% |
| $100,000 to $149,999 | 13 | 5.5% |
| $150,000 to $199,999 | 13 | 5.5% |
| $200,000+ | 0 | 0.0% |
Family Income by Famaliy Size in Moenkopi
4-person families (38 | 16.1%) account for the highest median family income in Moenkopi with $63,462 per family, while 3-person families (36 | 15.2%) have the highest median income of $20,357 per family member.
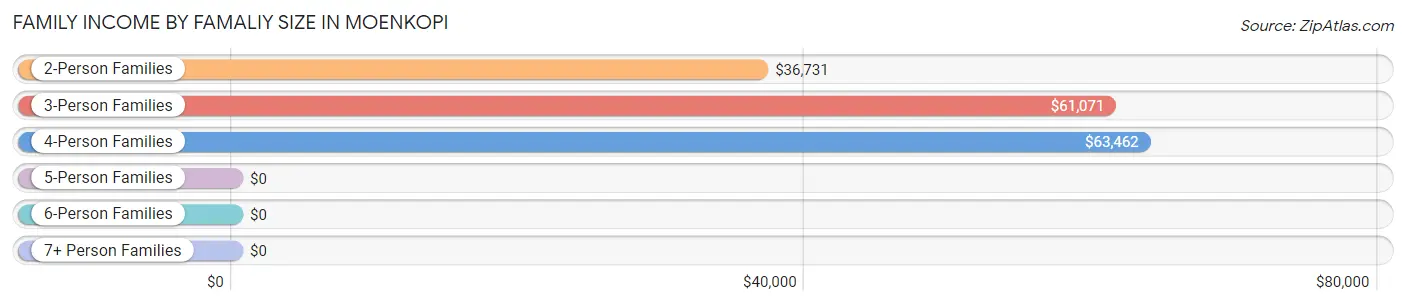
| Income Bracket | # Families | Median Income |
| 2-Person Families | 78 (33.1%) | $36,731 |
| 3-Person Families | 36 (15.2%) | $61,071 |
| 4-Person Families | 38 (16.1%) | $63,462 |
| 5-Person Families | 21 (8.9%) | $0 |
| 6-Person Families | 50 (21.2%) | $0 |
| 7+ Person Families | 13 (5.5%) | $0 |
| Total | 236 (100.0%) | $40,500 |
Family Income by Number of Earners in Moenkopi
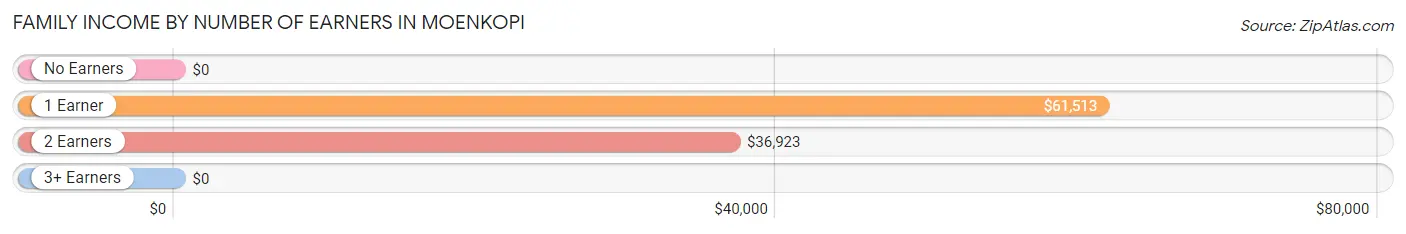
| Number of Earners | # Families | Median Income |
| No Earners | 57 (24.1%) | $0 |
| 1 Earner | 67 (28.4%) | $61,513 |
| 2 Earners | 80 (33.9%) | $36,923 |
| 3+ Earners | 32 (13.6%) | $0 |
| Total | 236 (100.0%) | $40,500 |
Household Income in Moenkopi
Household Income Brackets in Moenkopi
With 69 households falling in the category, the less than $10,000 income range is the most frequent in Moenkopi, accounting for 24.4% of all households.
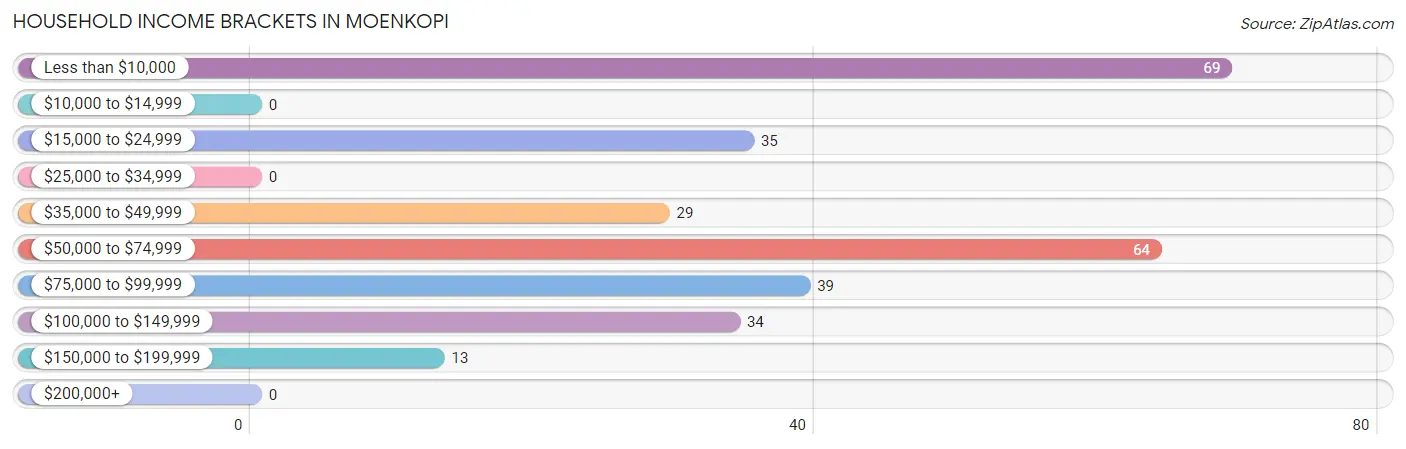
| Income Bracket | # Households | % Households |
| Less than $10,000 | 69 | 24.4% |
| $10,000 to $14,999 | 0 | 0.0% |
| $15,000 to $24,999 | 35 | 12.4% |
| $25,000 to $34,999 | 0 | 0.0% |
| $35,000 to $49,999 | 29 | 10.2% |
| $50,000 to $74,999 | 64 | 22.6% |
| $75,000 to $99,999 | 39 | 13.8% |
| $100,000 to $149,999 | 34 | 12.0% |
| $150,000 to $199,999 | 13 | 4.6% |
| $200,000+ | 0 | 0.0% |
Household Income by Householder Age in Moenkopi
The median household income in Moenkopi is $51,518, with the highest median household income of $36,635 found in the 45 to 64 years age bracket for the primary householder. A total of 121 households (42.8%) fall into this category. Meanwhile, the 15 to 24 years age bracket for the primary householder has the lowest median household income of $0, with 21 households (7.4%) in this group.
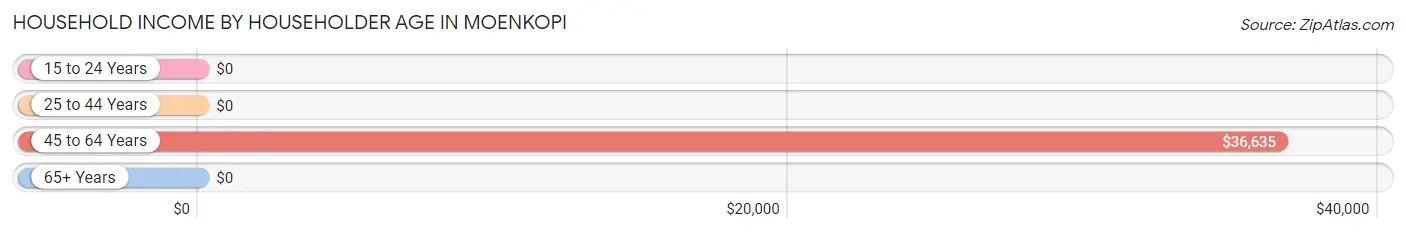
| Income Bracket | # Households | Median Income |
| 15 to 24 Years | 21 (7.4%) | $0 |
| 25 to 44 Years | 32 (11.3%) | $0 |
| 45 to 64 Years | 121 (42.8%) | $36,635 |
| 65+ Years | 109 (38.5%) | $0 |
| Total | 283 (100.0%) | $51,518 |
Poverty in Moenkopi
Income Below Poverty by Sex and Age in Moenkopi
With 43.8% poverty level for males and 36.1% for females among the residents of Moenkopi, 12 to 14 year old males and 45 to 54 year old females are the most vulnerable to poverty, with 13 males (100.0%) and 32 females (86.5%) in their respective age groups living below the poverty level.
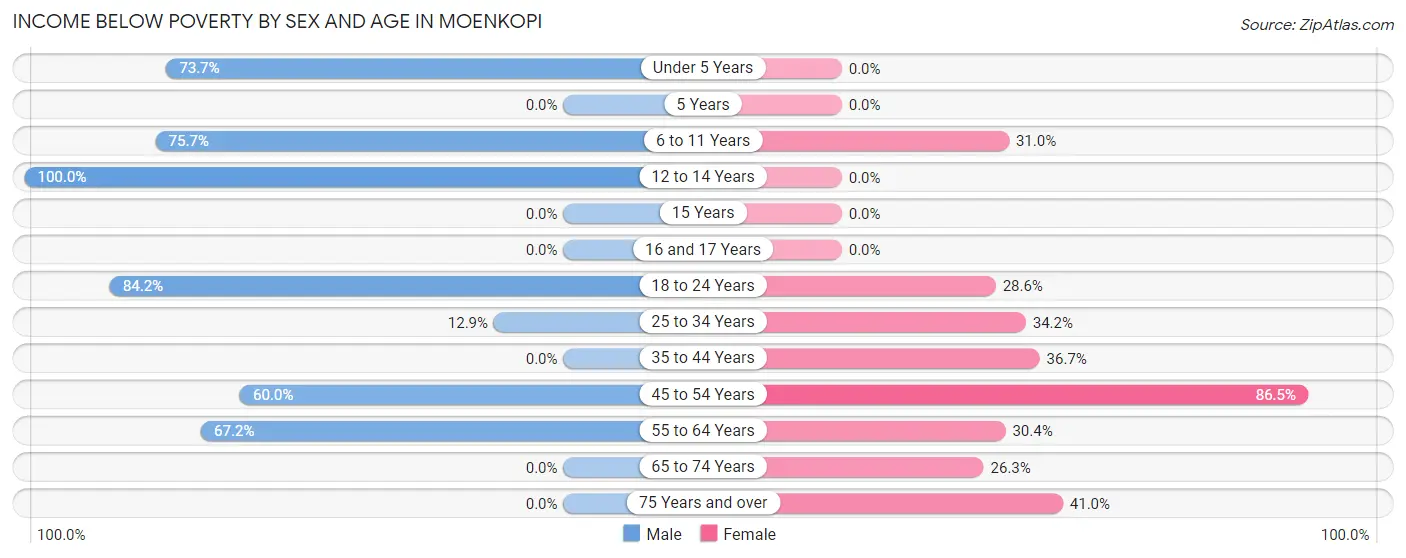
| Age Bracket | Male | Female |
| Under 5 Years | 28 (73.7%) | 0 (0.0%) |
| 5 Years | 0 (0.0%) | 0 (0.0%) |
| 6 to 11 Years | 28 (75.7%) | 18 (31.0%) |
| 12 to 14 Years | 13 (100.0%) | 0 (0.0%) |
| 15 Years | 0 (0.0%) | 0 (0.0%) |
| 16 and 17 Years | 0 (0.0%) | 0 (0.0%) |
| 18 to 24 Years | 85 (84.2%) | 18 (28.6%) |
| 25 to 34 Years | 8 (12.9%) | 14 (34.2%) |
| 35 to 44 Years | 0 (0.0%) | 18 (36.7%) |
| 45 to 54 Years | 18 (60.0%) | 32 (86.5%) |
| 55 to 64 Years | 80 (67.2%) | 24 (30.4%) |
| 65 to 74 Years | 0 (0.0%) | 10 (26.3%) |
| 75 Years and over | 0 (0.0%) | 32 (41.0%) |
| Total | 260 (43.8%) | 166 (36.1%) |
Income Above Poverty by Sex and Age in Moenkopi
According to the poverty statistics in Moenkopi, males aged 5 years and females aged under 5 years are the age groups that are most secure financially, with 100.0% of males and 100.0% of females in these age groups living above the poverty line.
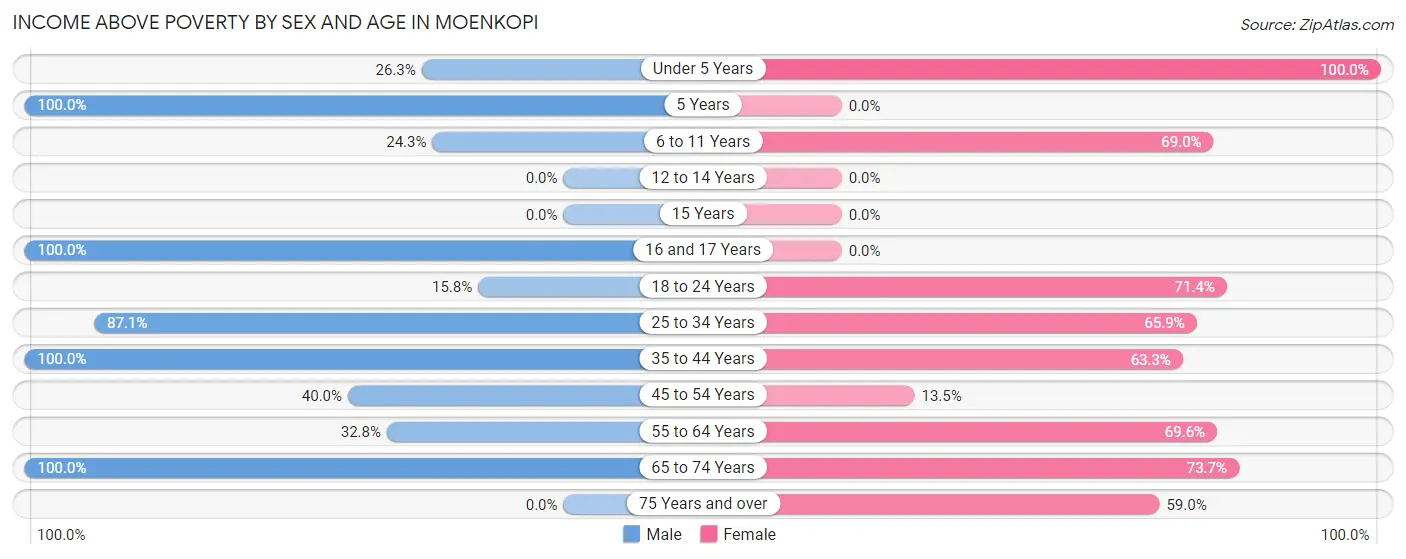
| Age Bracket | Male | Female |
| Under 5 Years | 10 (26.3%) | 17 (100.0%) |
| 5 Years | 10 (100.0%) | 0 (0.0%) |
| 6 to 11 Years | 9 (24.3%) | 40 (69.0%) |
| 12 to 14 Years | 0 (0.0%) | 0 (0.0%) |
| 15 Years | 0 (0.0%) | 0 (0.0%) |
| 16 and 17 Years | 34 (100.0%) | 0 (0.0%) |
| 18 to 24 Years | 16 (15.8%) | 45 (71.4%) |
| 25 to 34 Years | 54 (87.1%) | 27 (65.8%) |
| 35 to 44 Years | 89 (100.0%) | 31 (63.3%) |
| 45 to 54 Years | 12 (40.0%) | 5 (13.5%) |
| 55 to 64 Years | 39 (32.8%) | 55 (69.6%) |
| 65 to 74 Years | 61 (100.0%) | 28 (73.7%) |
| 75 Years and over | 0 (0.0%) | 46 (59.0%) |
| Total | 334 (56.2%) | 294 (63.9%) |
Income Below Poverty Among Married-Couple Families in Moenkopi
The poverty statistics for married-couple families in Moenkopi show that 15.3% or 13 of the total 85 families live below the poverty line. Families with no children have the highest poverty rate of 21.3%, comprising of 13 families. On the other hand, families with 1 or 2 children have the lowest poverty rate of 0.0%, which includes 0 families.
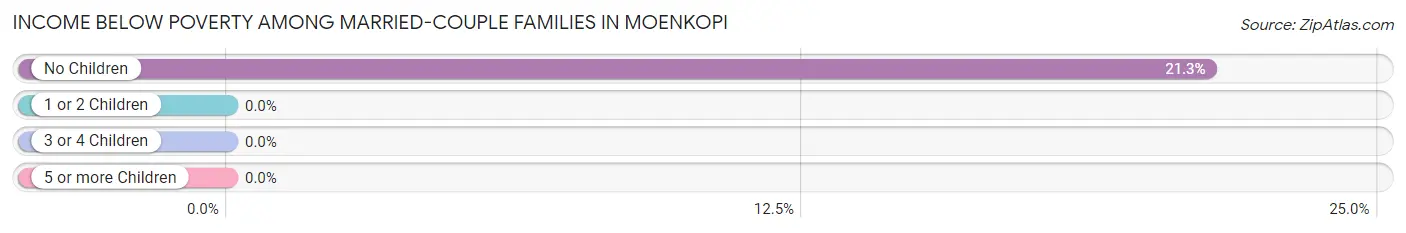
| Children | Above Poverty | Below Poverty |
| No Children | 48 (78.7%) | 13 (21.3%) |
| 1 or 2 Children | 24 (100.0%) | 0 (0.0%) |
| 3 or 4 Children | 0 (0.0%) | 0 (0.0%) |
| 5 or more Children | 0 (0.0%) | 0 (0.0%) |
| Total | 72 (84.7%) | 13 (15.3%) |
Income Below Poverty Among Single-Parent Households in Moenkopi
According to the poverty data in Moenkopi, 50.9% or 27 single-father households and 27.6% or 27 single-mother households are living below the poverty line. Among single-father households, those with no children have the highest poverty rate, with 8 households (100.0%) experiencing poverty. Likewise, among single-mother households, those with 3 or 4 children have the highest poverty rate, with 18 households (100.0%) falling below the poverty line.
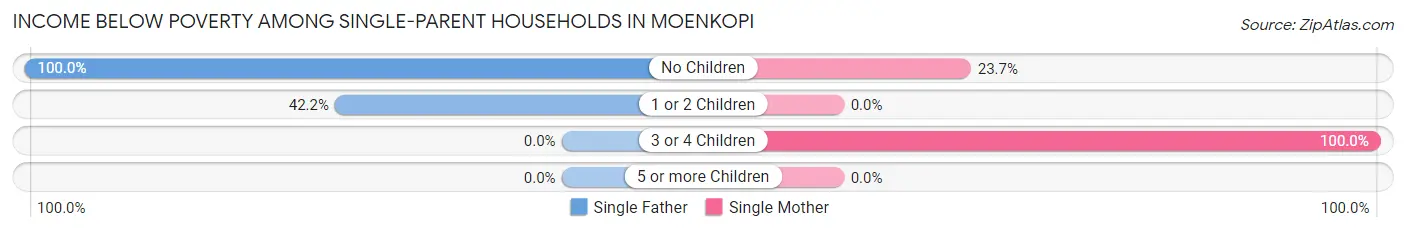
| Children | Single Father | Single Mother |
| No Children | 8 (100.0%) | 9 (23.7%) |
| 1 or 2 Children | 19 (42.2%) | 0 (0.0%) |
| 3 or 4 Children | 0 (0.0%) | 18 (100.0%) |
| 5 or more Children | 0 (0.0%) | 0 (0.0%) |
| Total | 27 (50.9%) | 27 (27.6%) |
Income Below Poverty Among Married-Couple vs Single-Parent Households in Moenkopi
The poverty data for Moenkopi shows that 13 of the married-couple family households (15.3%) and 54 of the single-parent households (35.8%) are living below the poverty level. Within the married-couple family households, those with no children have the highest poverty rate, with 13 households (21.3%) falling below the poverty line. Among the single-parent households, those with 3 or 4 children have the highest poverty rate, with 18 household (100.0%) living below poverty.
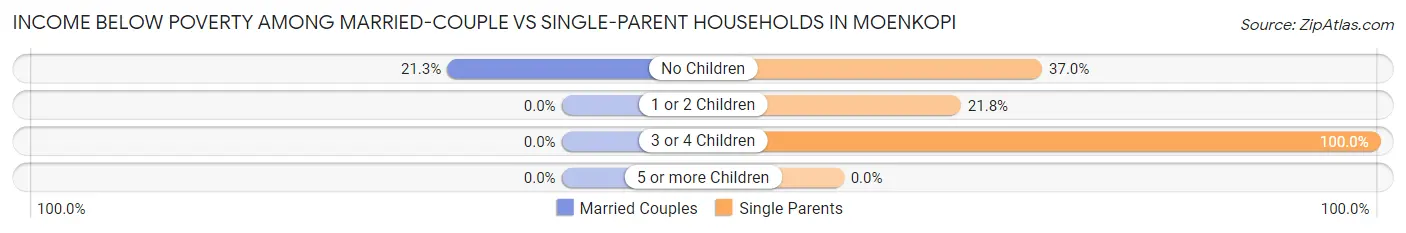
| Children | Married-Couple Families | Single-Parent Households |
| No Children | 13 (21.3%) | 17 (37.0%) |
| 1 or 2 Children | 0 (0.0%) | 19 (21.8%) |
| 3 or 4 Children | 0 (0.0%) | 18 (100.0%) |
| 5 or more Children | 0 (0.0%) | 0 (0.0%) |
| Total | 13 (15.3%) | 54 (35.8%) |
Race in Moenkopi
The most populous races in Moenkopi are Native / Alaskan (1,051 | 98.8%), Hispanic or Latino (78 | 7.3%), and White / Caucasian (13 | 1.2%).
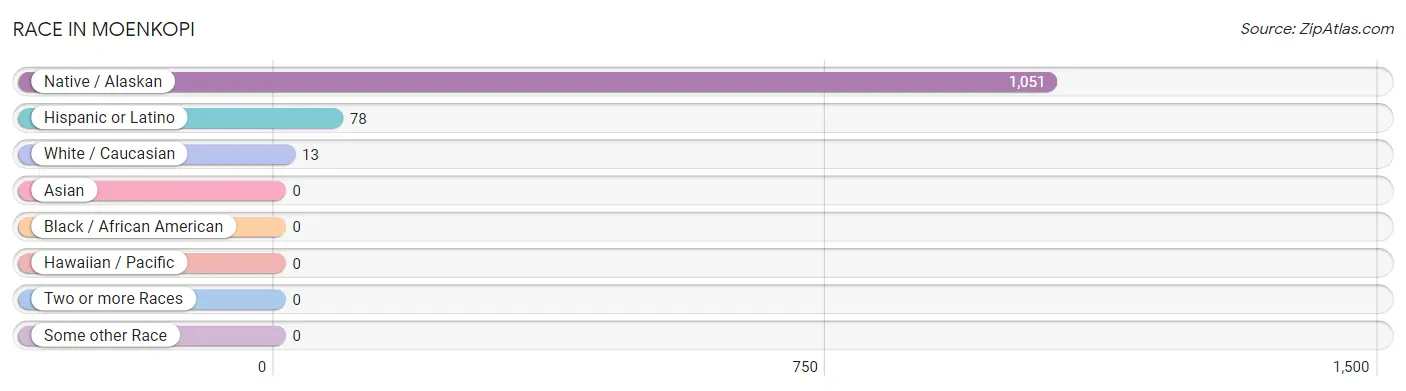
| Race | # Population | % Population |
| Asian | 0 | 0.0% |
| Black / African American | 0 | 0.0% |
| Hawaiian / Pacific | 0 | 0.0% |
| Hispanic or Latino | 78 | 7.3% |
| Native / Alaskan | 1,051 | 98.8% |
| White / Caucasian | 13 | 1.2% |
| Two or more Races | 0 | 0.0% |
| Some other Race | 0 | 0.0% |
| Total | 1,064 | 100.0% |
Ancestry in Moenkopi
The most populous ancestries reported in Moenkopi are Hopi (940 | 88.3%), Navajo (111 | 10.4%), and Mexican (78 | 7.3%), together accounting for 106.1% of all Moenkopi residents.
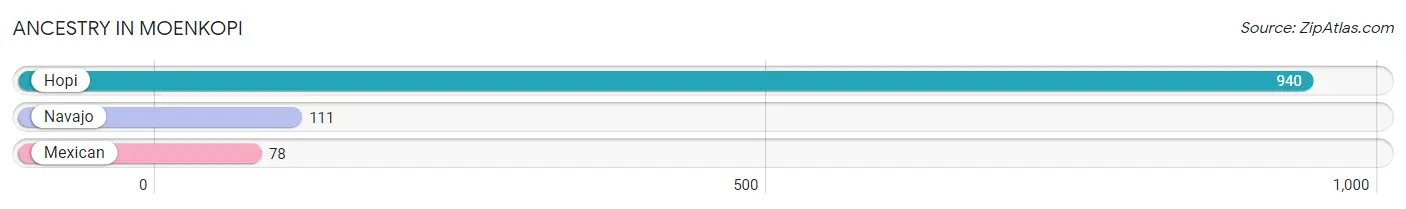
| Ancestry | # Population | % Population |
| Hopi | 940 | 88.3% |
| Mexican | 78 | 7.3% |
| Navajo | 111 | 10.4% | View All 3 Rows |
Immigrants in Moenkopi

| Immigration Origin | # Population | % Population | View All 0 Rows |
Sex and Age in Moenkopi
Sex and Age in Moenkopi
The most populous age groups in Moenkopi are 20 to 24 Years (101 | 16.7%) for men and 55 to 59 Years (60 | 13.0%) for women.
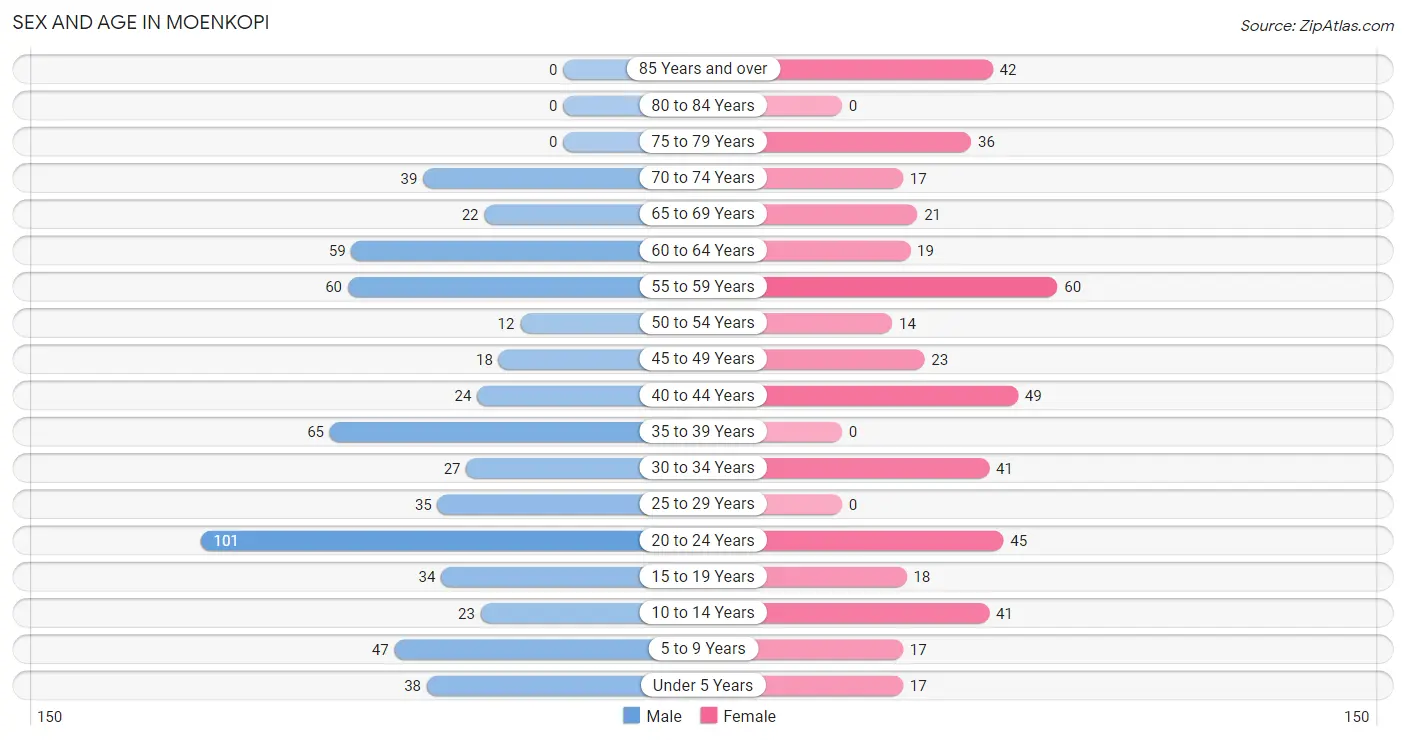
| Age Bracket | Male | Female |
| Under 5 Years | 38 (6.3%) | 17 (3.7%) |
| 5 to 9 Years | 47 (7.8%) | 17 (3.7%) |
| 10 to 14 Years | 23 (3.8%) | 41 (8.9%) |
| 15 to 19 Years | 34 (5.6%) | 18 (3.9%) |
| 20 to 24 Years | 101 (16.7%) | 45 (9.8%) |
| 25 to 29 Years | 35 (5.8%) | 0 (0.0%) |
| 30 to 34 Years | 27 (4.5%) | 41 (8.9%) |
| 35 to 39 Years | 65 (10.8%) | 0 (0.0%) |
| 40 to 44 Years | 24 (4.0%) | 49 (10.6%) |
| 45 to 49 Years | 18 (3.0%) | 23 (5.0%) |
| 50 to 54 Years | 12 (2.0%) | 14 (3.0%) |
| 55 to 59 Years | 60 (9.9%) | 60 (13.0%) |
| 60 to 64 Years | 59 (9.8%) | 19 (4.1%) |
| 65 to 69 Years | 22 (3.6%) | 21 (4.6%) |
| 70 to 74 Years | 39 (6.5%) | 17 (3.7%) |
| 75 to 79 Years | 0 (0.0%) | 36 (7.8%) |
| 80 to 84 Years | 0 (0.0%) | 0 (0.0%) |
| 85 Years and over | 0 (0.0%) | 42 (9.1%) |
| Total | 604 (100.0%) | 460 (100.0%) |
Families and Households in Moenkopi
Median Family Size in Moenkopi
The median family size in Moenkopi is 3.84 persons per family, with married-couple families (85 | 36.0%) accounting for the largest median family size of 4.19 persons per family. On the other hand, single female/mother families (98 | 41.5%) represent the smallest median family size with 3.52 persons per family.
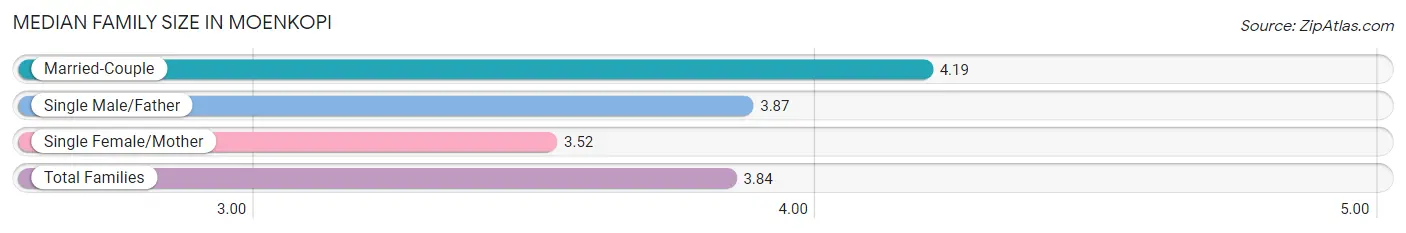
| Family Type | # Families | Family Size |
| Married-Couple | 85 (36.0%) | 4.19 |
| Single Male/Father | 53 (22.5%) | 3.87 |
| Single Female/Mother | 98 (41.5%) | 3.52 |
| Total Families | 236 (100.0%) | 3.84 |
Median Household Size in Moenkopi
The median household size in Moenkopi is 3.76 persons per household, with single male/father households (53 | 18.7%) accounting for the largest median household size of 4.53 persons per household. non-family households (47 | 16.6%) represent the smallest median household size with 1.45 persons per household.
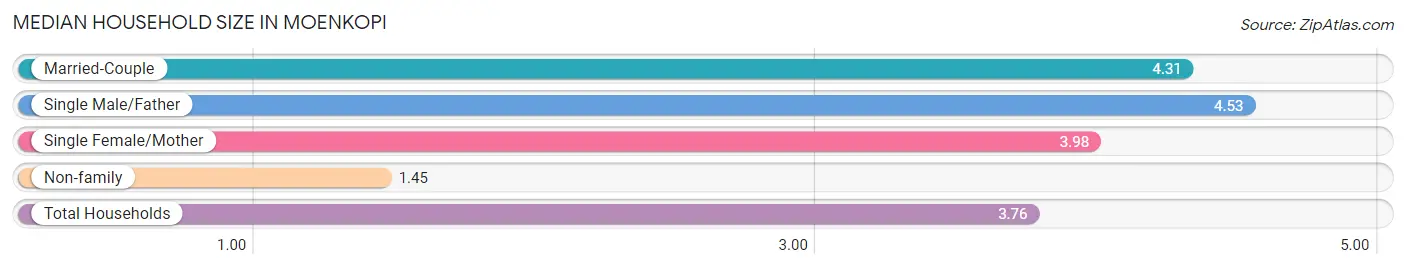
| Household Type | # Households | Household Size |
| Married-Couple | 85 (30.0%) | 4.31 |
| Single Male/Father | 53 (18.7%) | 4.53 |
| Single Female/Mother | 98 (34.6%) | 3.98 |
| Non-family | 47 (16.6%) | 1.45 |
| Total Households | 283 (100.0%) | 3.76 |
Household Size by Marriage Status in Moenkopi
Out of a total of 283 households in Moenkopi, 236 (83.4%) are family households, while 47 (16.6%) are nonfamily households. The most numerous type of family households are 2-person households, comprising 70, and the most common type of nonfamily households are 1-person households, comprising 24.
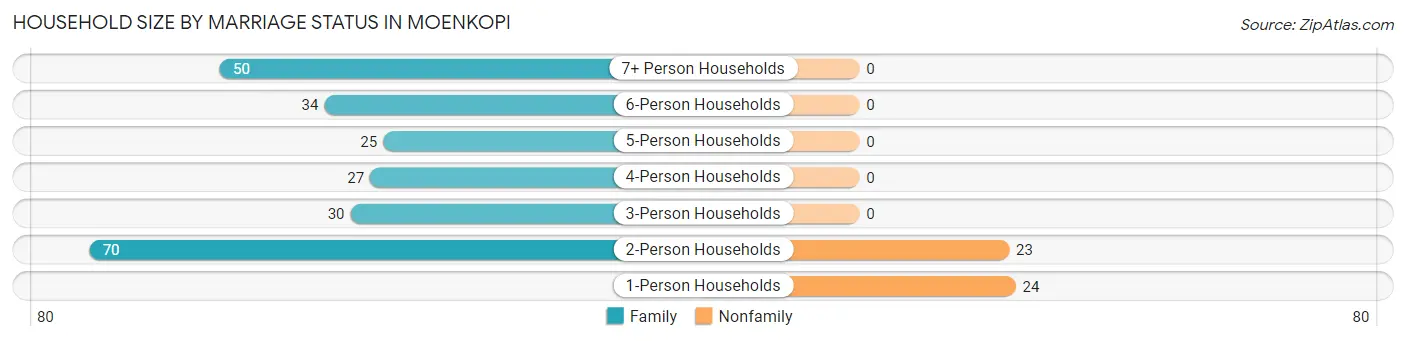
| Household Size | Family Households | Nonfamily Households |
| 1-Person Households | - | 24 (8.5%) |
| 2-Person Households | 70 (24.7%) | 23 (8.1%) |
| 3-Person Households | 30 (10.6%) | 0 (0.0%) |
| 4-Person Households | 27 (9.5%) | 0 (0.0%) |
| 5-Person Households | 25 (8.8%) | 0 (0.0%) |
| 6-Person Households | 34 (12.0%) | 0 (0.0%) |
| 7+ Person Households | 50 (17.7%) | 0 (0.0%) |
| Total | 236 (83.4%) | 47 (16.6%) |
Female Fertility in Moenkopi
Fertility by Age in Moenkopi
Average fertility rate in Moenkopi is 102.0 births per 1,000 women. Women in the age bracket of 35 to 50 years have the highest fertility rate with 250.0 births per 1,000 women. Women in the age bracket of 35 to 50 years acount for 100.0% of all women with births.
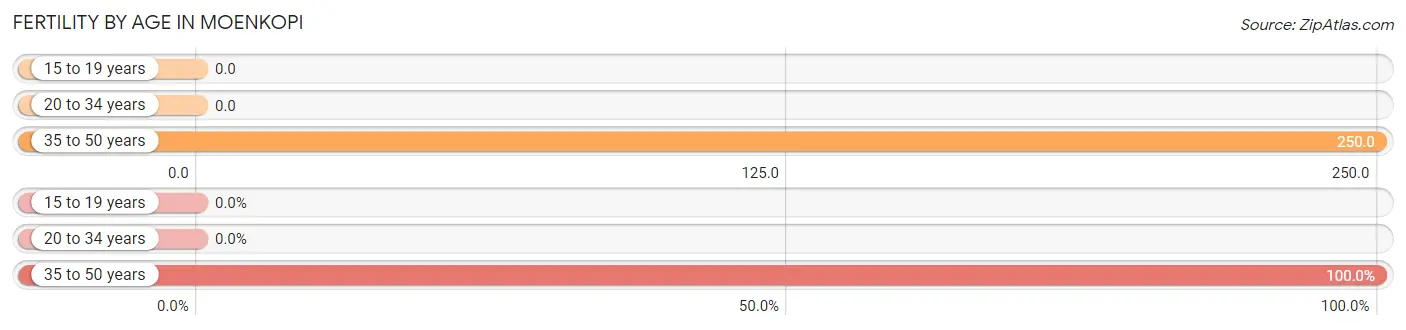
| Age Bracket | Women with Births | Births / 1,000 Women |
| 15 to 19 years | 0 (0.0%) | 0.0 |
| 20 to 34 years | 0 (0.0%) | 0.0 |
| 35 to 50 years | 18 (100.0%) | 250.0 |
| Total | 18 (100.0%) | 102.0 |
Fertility by Age by Marriage Status in Moenkopi
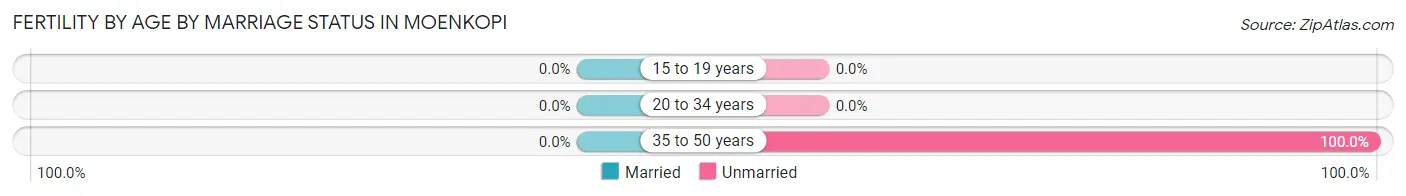
| Age Bracket | Married | Unmarried |
| 15 to 19 years | 0 (0.0%) | 0 (0.0%) |
| 20 to 34 years | 0 (0.0%) | 0 (0.0%) |
| 35 to 50 years | 0 (0.0%) | 18 (100.0%) |
| Total | 0 (0.0%) | 18 (100.0%) |
Fertility by Education in Moenkopi
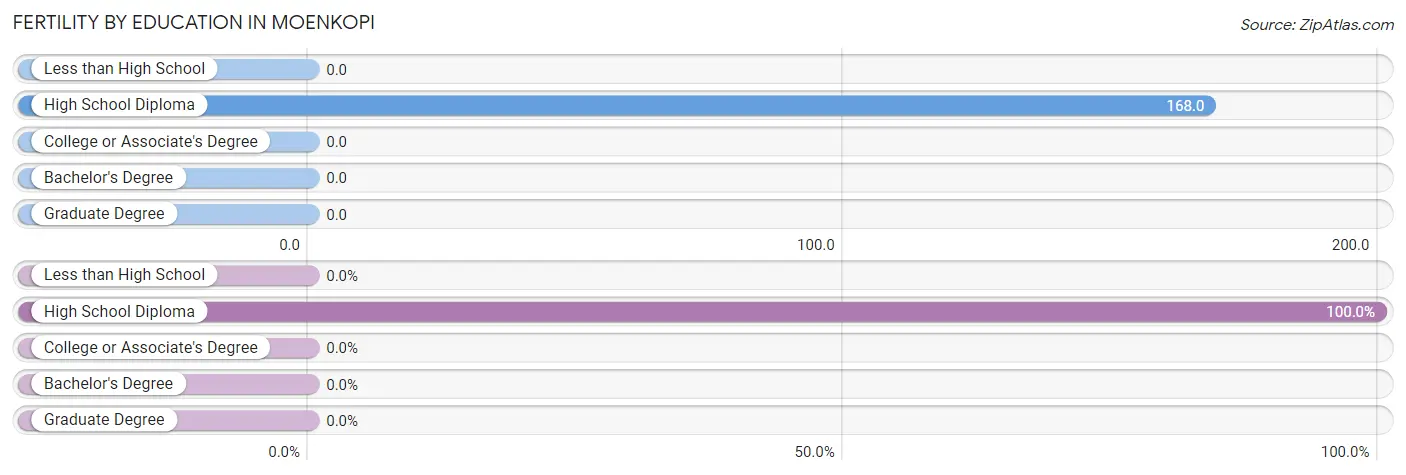
| Educational Attainment | Women with Births | Births / 1,000 Women |
| Less than High School | 0 (0.0%) | 0.0 |
| High School Diploma | 18 (100.0%) | 168.0 |
| College or Associate's Degree | 0 (0.0%) | 0.0 |
| Bachelor's Degree | 0 (0.0%) | 0.0 |
| Graduate Degree | 0 (0.0%) | 0.0 |
| Total | 18 (100.0%) | 102.0 |
Fertility by Education by Marriage Status in Moenkopi
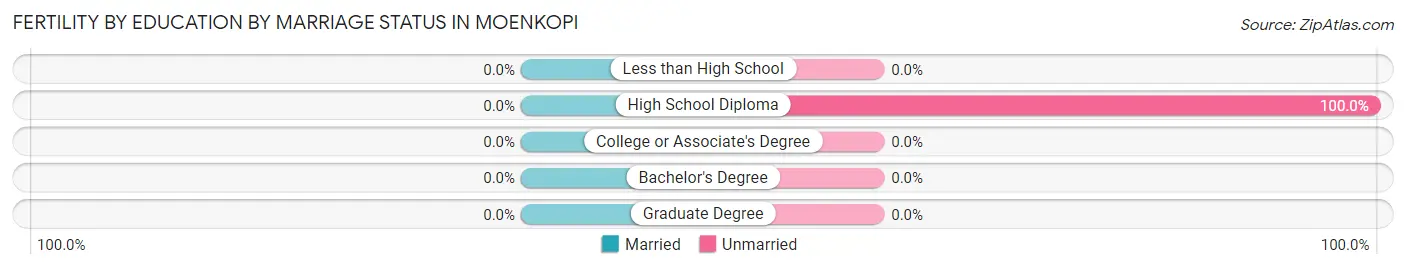
| Educational Attainment | Married | Unmarried |
| Less than High School | 0 (0.0%) | 0 (0.0%) |
| High School Diploma | 0 (0.0%) | 18 (100.0%) |
| College or Associate's Degree | 0 (0.0%) | 0 (0.0%) |
| Bachelor's Degree | 0 (0.0%) | 0 (0.0%) |
| Graduate Degree | 0 (0.0%) | 0 (0.0%) |
| Total | 0 (0.0%) | 18 (100.0%) |
Employment Characteristics in Moenkopi
Employment by Class of Employer in Moenkopi
Among the 315 employed individuals in Moenkopi, private company employees (161 | 51.1%), local government employees (62 | 19.7%), and state government employees (41 | 13.0%) make up the most common classes of employment.
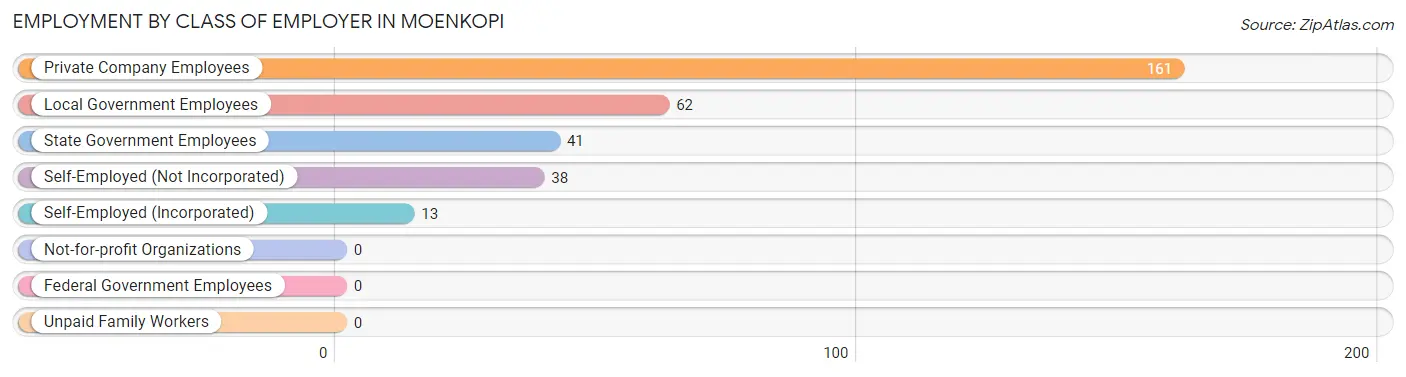
| Employer Class | # Employees | % Employees |
| Private Company Employees | 161 | 51.1% |
| Self-Employed (Incorporated) | 13 | 4.1% |
| Self-Employed (Not Incorporated) | 38 | 12.1% |
| Not-for-profit Organizations | 0 | 0.0% |
| Local Government Employees | 62 | 19.7% |
| State Government Employees | 41 | 13.0% |
| Federal Government Employees | 0 | 0.0% |
| Unpaid Family Workers | 0 | 0.0% |
| Total | 315 | 100.0% |
Employment Status by Age in Moenkopi
According to the labor force statistics for Moenkopi, out of the total population over 16 years of age (881), 40.3% or 355 individuals are in the labor force, with 11.3% or 40 of them unemployed. The age group with the highest labor force participation rate is 25 to 29 years, with 100.0% or 35 individuals in the labor force. Within the labor force, the 20 to 24 years age range has the highest percentage of unemployed individuals, with 53.3% or 24 of them being unemployed.
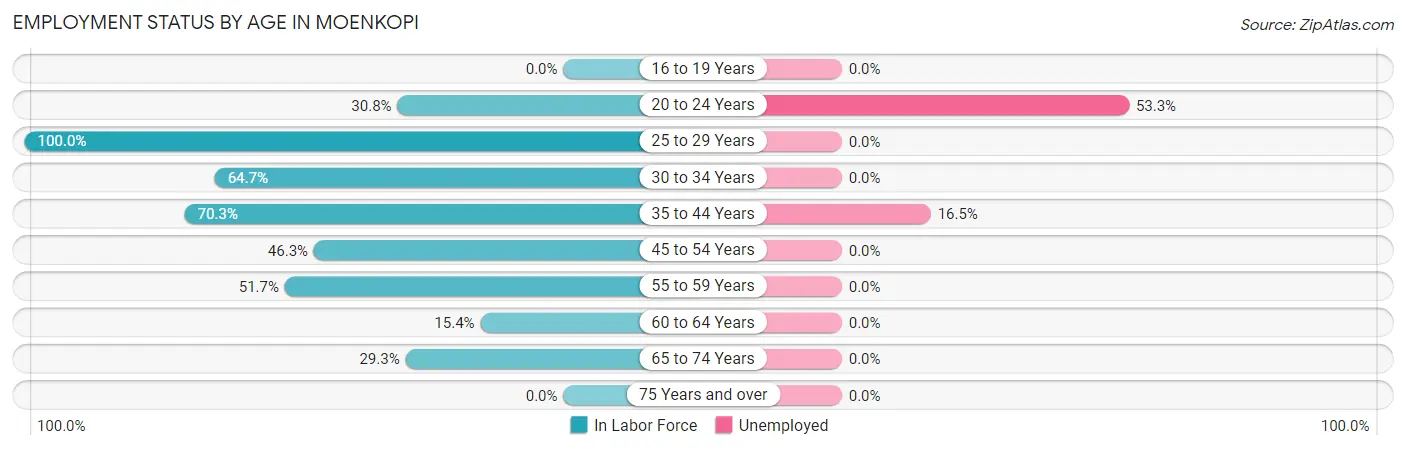
| Age Bracket | In Labor Force | Unemployed |
| 16 to 19 Years | 0 (0.0%) | 0 (0.0%) |
| 20 to 24 Years | 45 (30.8%) | 24 (53.3%) |
| 25 to 29 Years | 35 (100.0%) | 0 (0.0%) |
| 30 to 34 Years | 44 (64.7%) | 0 (0.0%) |
| 35 to 44 Years | 97 (70.3%) | 16 (16.5%) |
| 45 to 54 Years | 31 (46.3%) | 0 (0.0%) |
| 55 to 59 Years | 62 (51.7%) | 0 (0.0%) |
| 60 to 64 Years | 12 (15.4%) | 0 (0.0%) |
| 65 to 74 Years | 29 (29.3%) | 0 (0.0%) |
| 75 Years and over | 0 (0.0%) | 0 (0.0%) |
| Total | 355 (40.3%) | 40 (11.3%) |
Employment Status by Educational Attainment in Moenkopi
According to labor force statistics for Moenkopi, 55.5% of individuals (281) out of the total population between 25 and 64 years of age (506) are in the labor force, with 5.7% or 16 of them being unemployed. The group with the highest labor force participation rate are those with the educational attainment of bachelor's degree or higher, with 100.0% or 28 individuals in the labor force. Within the labor force, individuals with college / associate degree education have the highest percentage of unemployment, with 31.4% or 16 of them being unemployed.
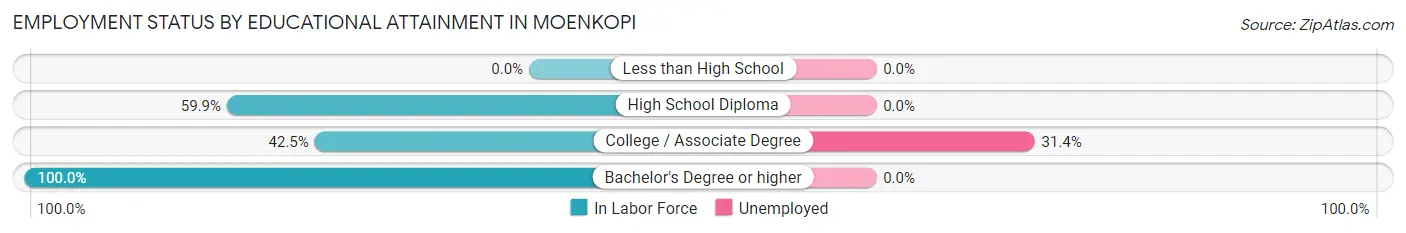
| Educational Attainment | In Labor Force | Unemployed |
| Less than High School | 0 (0.0%) | 0 (0.0%) |
| High School Diploma | 202 (59.9%) | 0 (0.0%) |
| College / Associate Degree | 51 (42.5%) | 38 (31.4%) |
| Bachelor's Degree or higher | 28 (100.0%) | 0 (0.0%) |
| Total | 281 (55.5%) | 29 (5.7%) |
Employment Occupations by Sex in Moenkopi
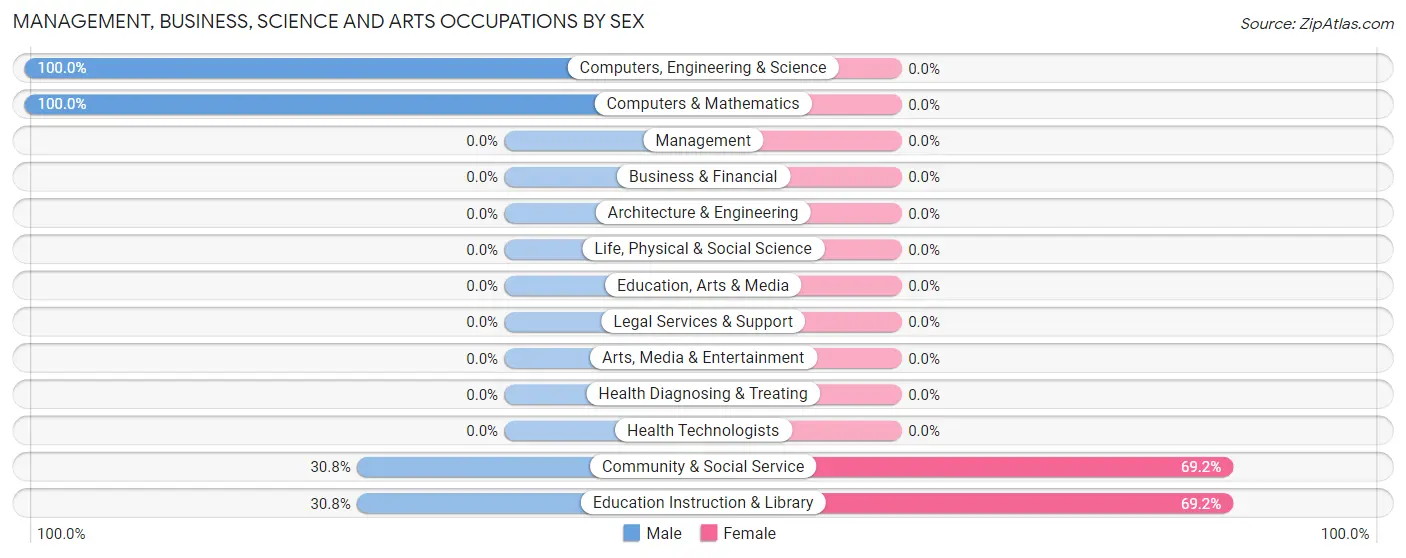
Management, Business, Science and Arts Occupations
The most common Management, Business, Science and Arts occupations in Moenkopi are Community & Social Service (39 | 12.4%), Education Instruction & Library (39 | 12.4%), Computers, Engineering & Science (16 | 5.1%), and Computers & Mathematics (16 | 5.1%).
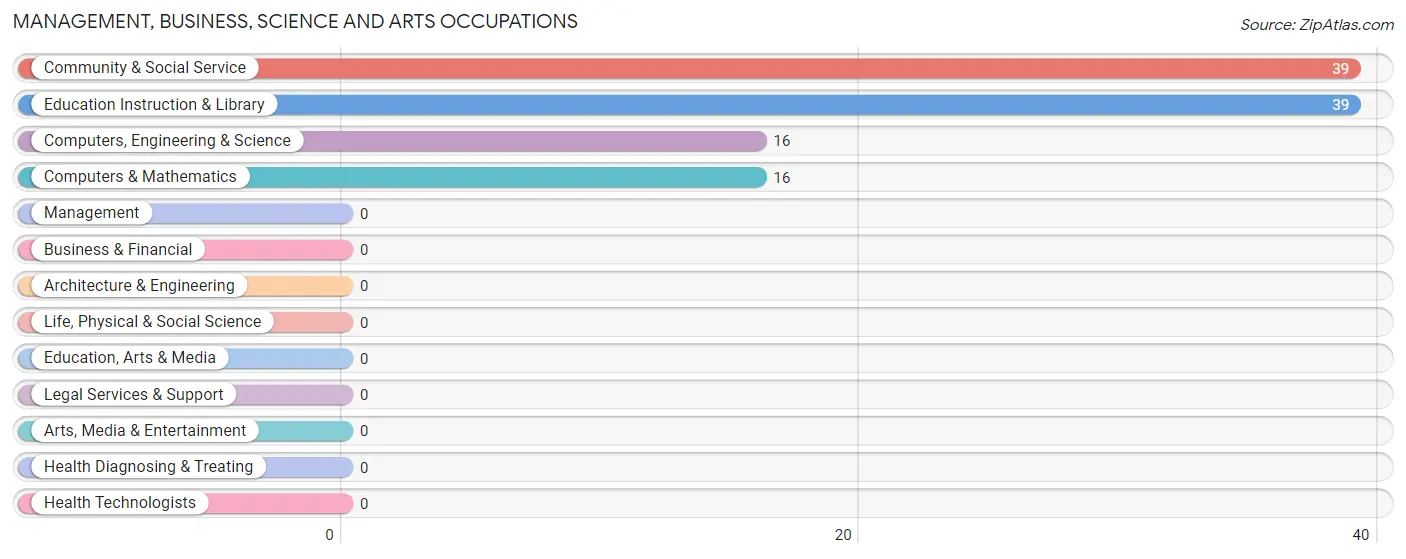
Management, Business, Science and Arts Occupations by Sex
Within the Management, Business, Science and Arts occupations in Moenkopi, the most male-oriented occupations are Computers, Engineering & Science (100.0%), Computers & Mathematics (100.0%), and Community & Social Service (30.8%), while the most female-oriented occupations are Community & Social Service (69.2%), and Education Instruction & Library (69.2%).
| Occupation | Male | Female |
| Management | 0 (0.0%) | 0 (0.0%) |
| Business & Financial | 0 (0.0%) | 0 (0.0%) |
| Computers, Engineering & Science | 16 (100.0%) | 0 (0.0%) |
| Computers & Mathematics | 16 (100.0%) | 0 (0.0%) |
| Architecture & Engineering | 0 (0.0%) | 0 (0.0%) |
| Life, Physical & Social Science | 0 (0.0%) | 0 (0.0%) |
| Community & Social Service | 12 (30.8%) | 27 (69.2%) |
| Education, Arts & Media | 0 (0.0%) | 0 (0.0%) |
| Legal Services & Support | 0 (0.0%) | 0 (0.0%) |
| Education Instruction & Library | 12 (30.8%) | 27 (69.2%) |
| Arts, Media & Entertainment | 0 (0.0%) | 0 (0.0%) |
| Health Diagnosing & Treating | 0 (0.0%) | 0 (0.0%) |
| Health Technologists | 0 (0.0%) | 0 (0.0%) |
| Total (Category) | 28 (50.9%) | 27 (49.1%) |
| Total (Overall) | 165 (52.4%) | 150 (47.6%) |
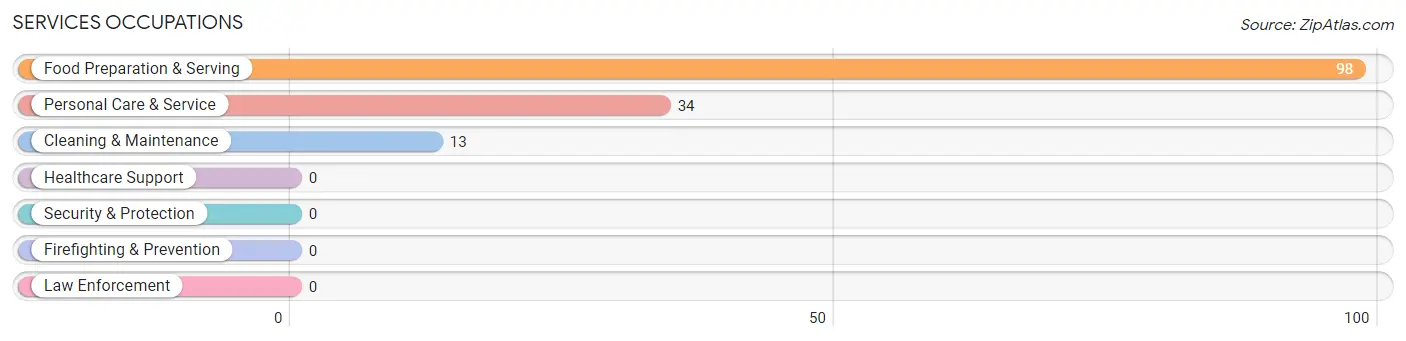
Services Occupations
The most common Services occupations in Moenkopi are Food Preparation & Serving (98 | 31.1%), Personal Care & Service (34 | 10.8%), and Cleaning & Maintenance (13 | 4.1%).
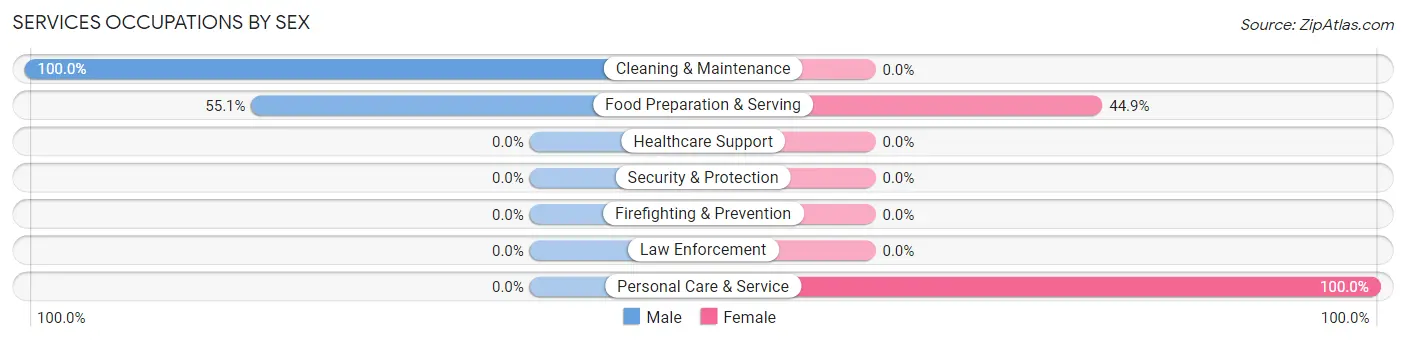
Services Occupations by Sex
Within the Services occupations in Moenkopi, the most male-oriented occupations are Cleaning & Maintenance (100.0%), and Food Preparation & Serving (55.1%), while the most female-oriented occupations are Personal Care & Service (100.0%), and Food Preparation & Serving (44.9%).
| Occupation | Male | Female |
| Healthcare Support | 0 (0.0%) | 0 (0.0%) |
| Security & Protection | 0 (0.0%) | 0 (0.0%) |
| Firefighting & Prevention | 0 (0.0%) | 0 (0.0%) |
| Law Enforcement | 0 (0.0%) | 0 (0.0%) |
| Food Preparation & Serving | 54 (55.1%) | 44 (44.9%) |
| Cleaning & Maintenance | 13 (100.0%) | 0 (0.0%) |
| Personal Care & Service | 0 (0.0%) | 34 (100.0%) |
| Total (Category) | 67 (46.2%) | 78 (53.8%) |
| Total (Overall) | 165 (52.4%) | 150 (47.6%) |
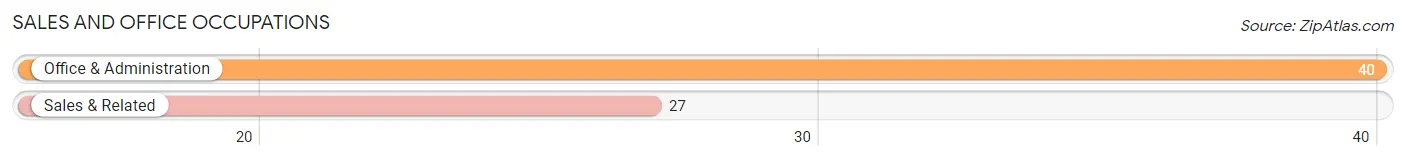
Sales and Office Occupations
The most common Sales and Office occupations in Moenkopi are Office & Administration (40 | 12.7%), and Sales & Related (27 | 8.6%).
Sales and Office Occupations by Sex
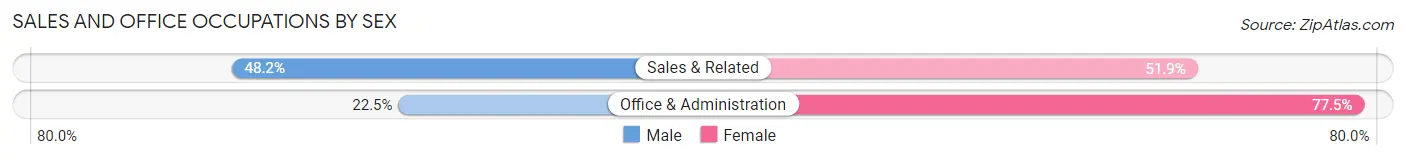
| Occupation | Male | Female |
| Sales & Related | 13 (48.1%) | 14 (51.8%) |
| Office & Administration | 9 (22.5%) | 31 (77.5%) |
| Total (Category) | 22 (32.8%) | 45 (67.2%) |
| Total (Overall) | 165 (52.4%) | 150 (47.6%) |
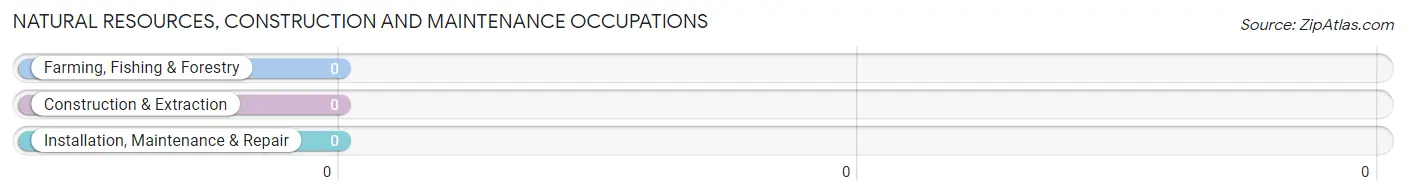
Natural Resources, Construction and Maintenance Occupations
Natural Resources, Construction and Maintenance Occupations by Sex
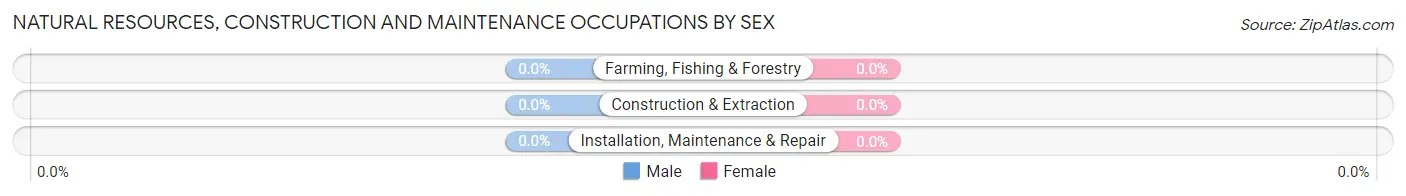
| Occupation | Male | Female |
| Farming, Fishing & Forestry | 0 (0.0%) | 0 (0.0%) |
| Construction & Extraction | 0 (0.0%) | 0 (0.0%) |
| Installation, Maintenance & Repair | 0 (0.0%) | 0 (0.0%) |
| Total (Category) | 0 (0.0%) | 0 (0.0%) |
| Total (Overall) | 165 (52.4%) | 150 (47.6%) |
Production, Transportation and Moving Occupations
The most common Production, Transportation and Moving occupations in Moenkopi are Production (25 | 7.9%), and Transportation (23 | 7.3%).
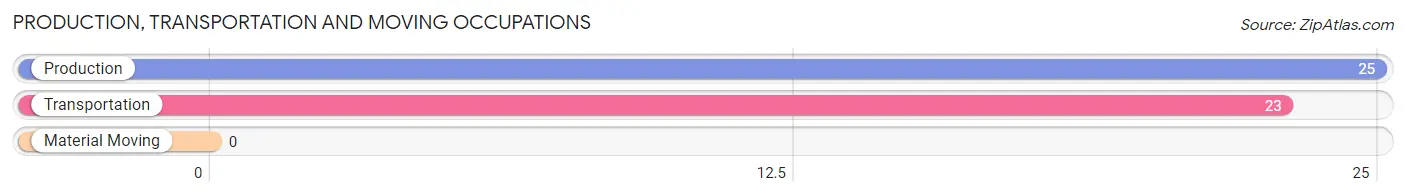
Production, Transportation and Moving Occupations by Sex
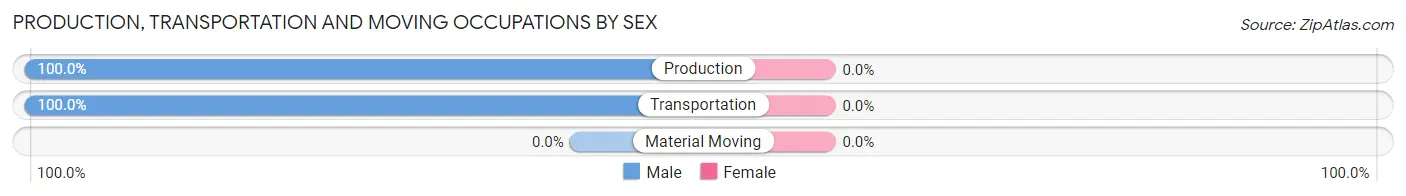
| Occupation | Male | Female |
| Production | 25 (100.0%) | 0 (0.0%) |
| Transportation | 23 (100.0%) | 0 (0.0%) |
| Material Moving | 0 (0.0%) | 0 (0.0%) |
| Total (Category) | 48 (100.0%) | 0 (0.0%) |
| Total (Overall) | 165 (52.4%) | 150 (47.6%) |
Employment Industries by Sex in Moenkopi
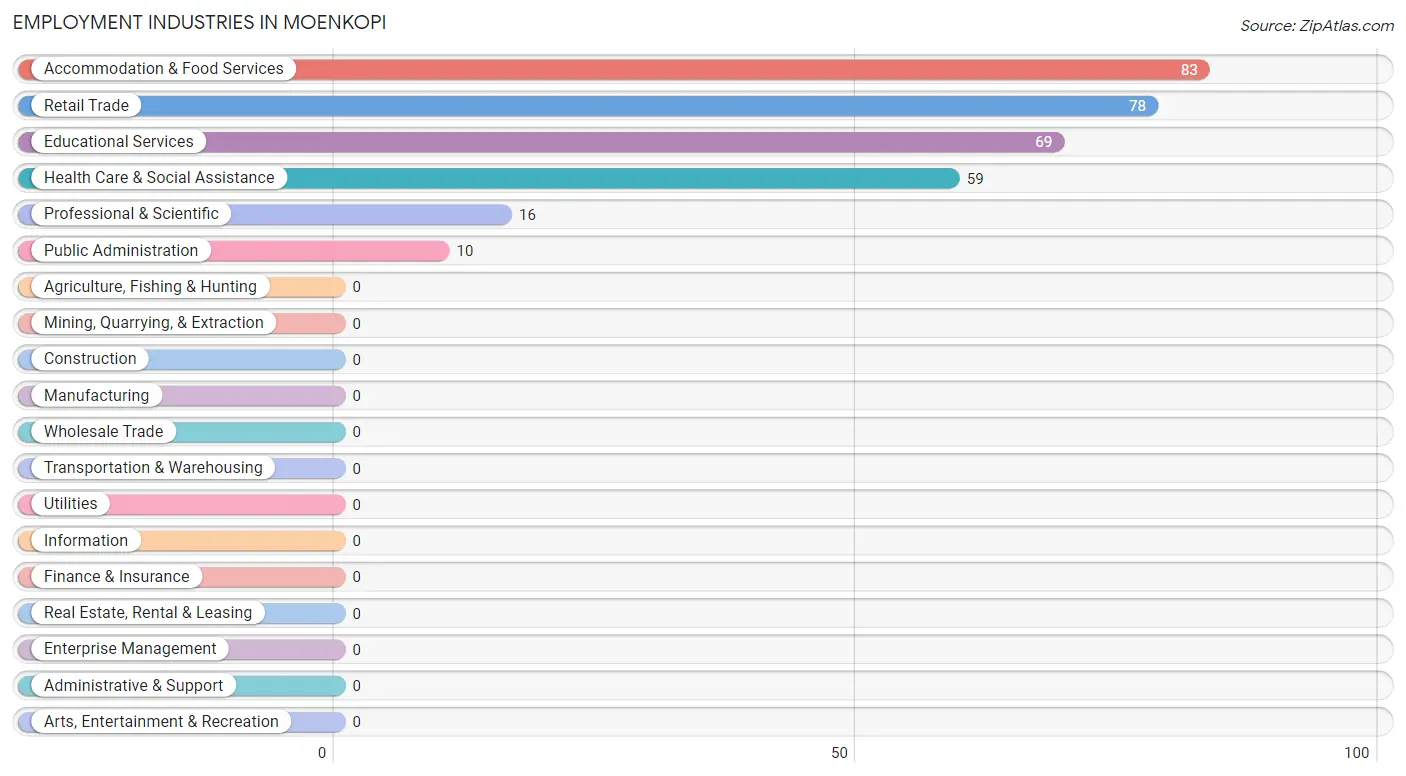
Employment Industries in Moenkopi
The major employment industries in Moenkopi include Accommodation & Food Services (83 | 26.4%), Retail Trade (78 | 24.8%), Educational Services (69 | 21.9%), Health Care & Social Assistance (59 | 18.7%), and Professional & Scientific (16 | 5.1%).
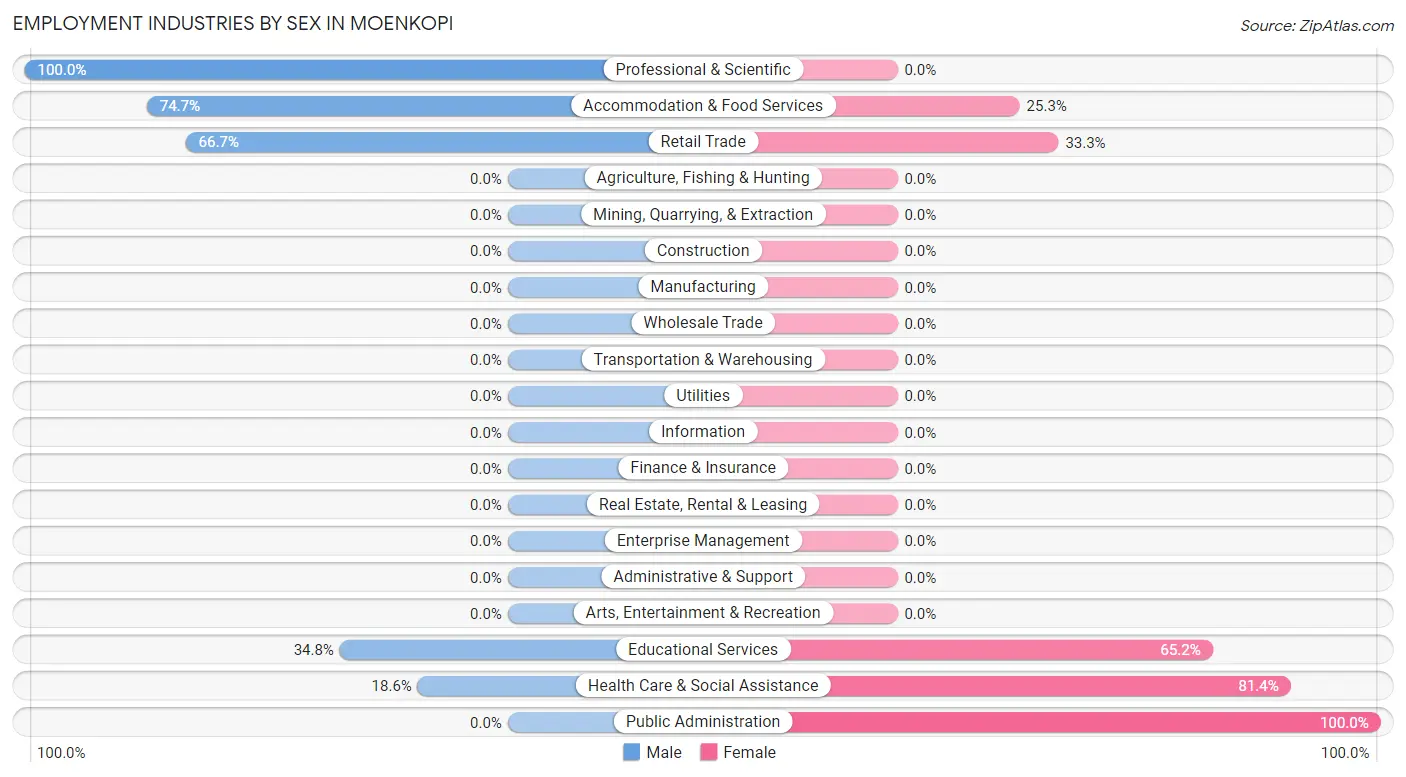
Employment Industries by Sex in Moenkopi
The Moenkopi industries that see more men than women are Professional & Scientific (100.0%), Accommodation & Food Services (74.7%), and Retail Trade (66.7%), whereas the industries that tend to have a higher number of women are Public Administration (100.0%), Health Care & Social Assistance (81.4%), and Educational Services (65.2%).
| Industry | Male | Female |
| Agriculture, Fishing & Hunting | 0 (0.0%) | 0 (0.0%) |
| Mining, Quarrying, & Extraction | 0 (0.0%) | 0 (0.0%) |
| Construction | 0 (0.0%) | 0 (0.0%) |
| Manufacturing | 0 (0.0%) | 0 (0.0%) |
| Wholesale Trade | 0 (0.0%) | 0 (0.0%) |
| Retail Trade | 52 (66.7%) | 26 (33.3%) |
| Transportation & Warehousing | 0 (0.0%) | 0 (0.0%) |
| Utilities | 0 (0.0%) | 0 (0.0%) |
| Information | 0 (0.0%) | 0 (0.0%) |
| Finance & Insurance | 0 (0.0%) | 0 (0.0%) |
| Real Estate, Rental & Leasing | 0 (0.0%) | 0 (0.0%) |
| Professional & Scientific | 16 (100.0%) | 0 (0.0%) |
| Enterprise Management | 0 (0.0%) | 0 (0.0%) |
| Administrative & Support | 0 (0.0%) | 0 (0.0%) |
| Educational Services | 24 (34.8%) | 45 (65.2%) |
| Health Care & Social Assistance | 11 (18.6%) | 48 (81.4%) |
| Arts, Entertainment & Recreation | 0 (0.0%) | 0 (0.0%) |
| Accommodation & Food Services | 62 (74.7%) | 21 (25.3%) |
| Public Administration | 0 (0.0%) | 10 (100.0%) |
| Total | 165 (52.4%) | 150 (47.6%) |
Education in Moenkopi
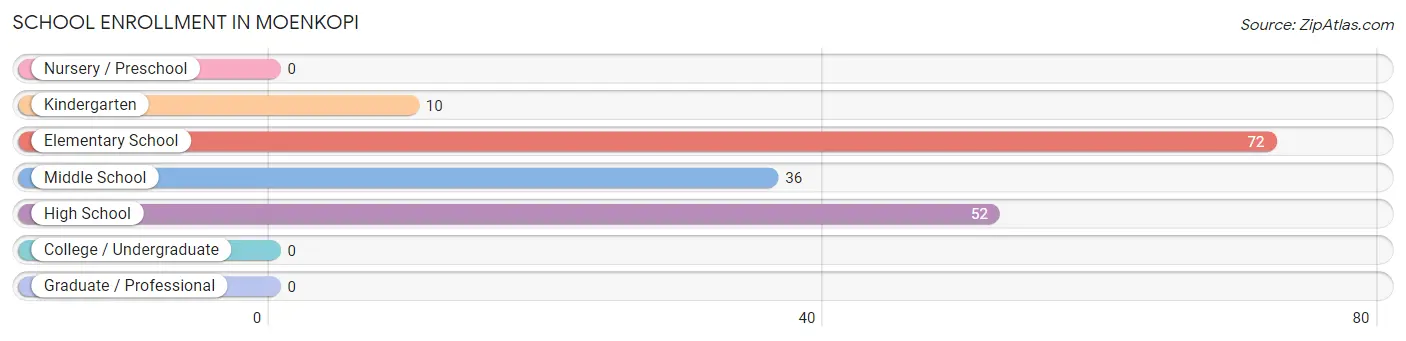
School Enrollment in Moenkopi
The most common levels of schooling among the 170 students in Moenkopi are elementary school (72 | 42.3%), high school (52 | 30.6%), and middle school (36 | 21.2%).
| School Level | # Students | % Students |
| Nursery / Preschool | 0 | 0.0% |
| Kindergarten | 10 | 5.9% |
| Elementary School | 72 | 42.3% |
| Middle School | 36 | 21.2% |
| High School | 52 | 30.6% |
| College / Undergraduate | 0 | 0.0% |
| Graduate / Professional | 0 | 0.0% |
| Total | 170 | 100.0% |
School Enrollment by Age by Funding Source in Moenkopi
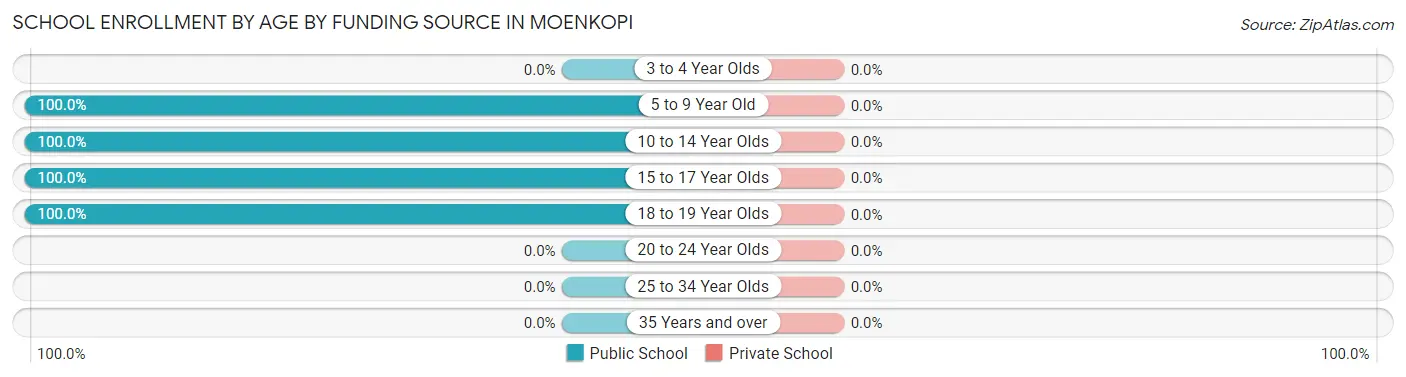
| Age Bracket | Public School | Private School |
| 3 to 4 Year Olds | 0 (0.0%) | 0 (0.0%) |
| 5 to 9 Year Old | 64 (100.0%) | 0 (0.0%) |
| 10 to 14 Year Olds | 54 (100.0%) | 0 (0.0%) |
| 15 to 17 Year Olds | 34 (100.0%) | 0 (0.0%) |
| 18 to 19 Year Olds | 18 (100.0%) | 0 (0.0%) |
| 20 to 24 Year Olds | 0 (0.0%) | 0 (0.0%) |
| 25 to 34 Year Olds | 0 (0.0%) | 0 (0.0%) |
| 35 Years and over | 0 (0.0%) | 0 (0.0%) |
| Total | 170 (100.0%) | 0 (0.0%) |
Educational Attainment by Field of Study in Moenkopi
Education (38 | 70.4%), and social sciences (16 | 29.6%) are the most common fields of study among 54 individuals in Moenkopi who have obtained a bachelor's degree or higher.
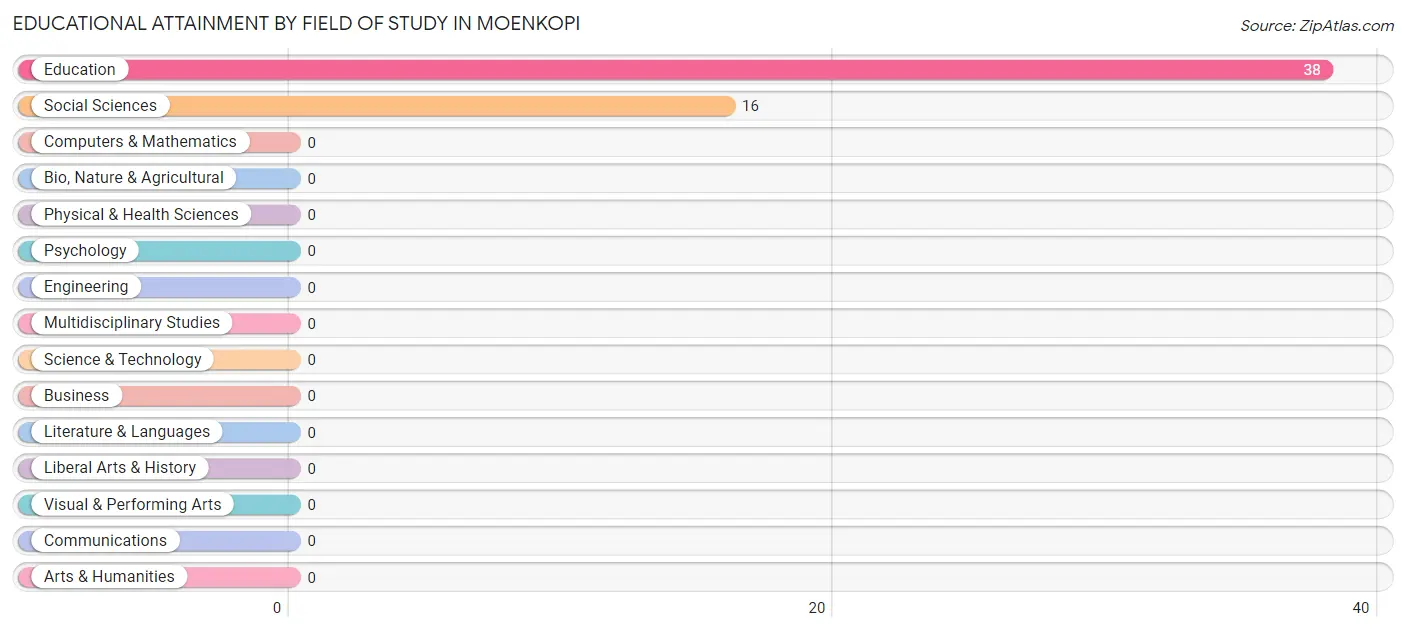
| Field of Study | # Graduates | % Graduates |
| Computers & Mathematics | 0 | 0.0% |
| Bio, Nature & Agricultural | 0 | 0.0% |
| Physical & Health Sciences | 0 | 0.0% |
| Psychology | 0 | 0.0% |
| Social Sciences | 16 | 29.6% |
| Engineering | 0 | 0.0% |
| Multidisciplinary Studies | 0 | 0.0% |
| Science & Technology | 0 | 0.0% |
| Business | 0 | 0.0% |
| Education | 38 | 70.4% |
| Literature & Languages | 0 | 0.0% |
| Liberal Arts & History | 0 | 0.0% |
| Visual & Performing Arts | 0 | 0.0% |
| Communications | 0 | 0.0% |
| Arts & Humanities | 0 | 0.0% |
| Total | 54 | 100.0% |
Transportation & Commute in Moenkopi
Vehicle Availability by Sex in Moenkopi
The most prevalent vehicle ownership categories in Moenkopi are males with 2 vehicles (87, accounting for 52.7%) and females with 2 vehicles (37, making up 58.0%).
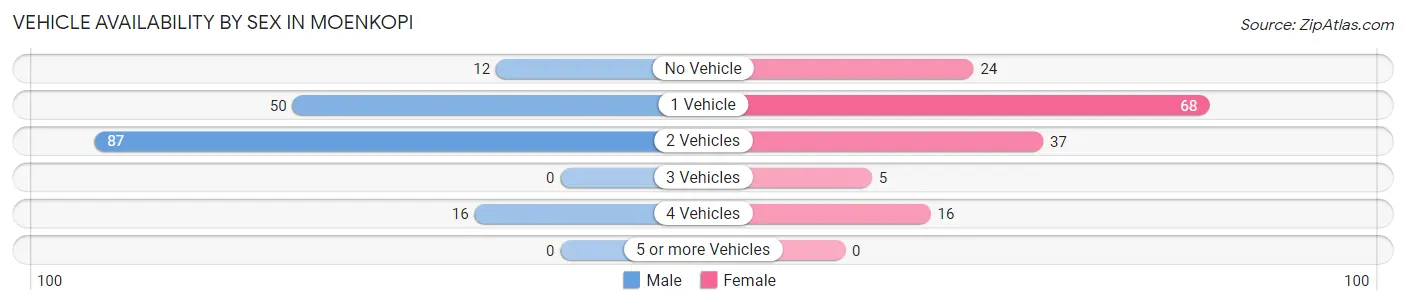
| Vehicles Available | Male | Female |
| No Vehicle | 12 (7.3%) | 24 (16.0%) |
| 1 Vehicle | 50 (30.3%) | 68 (45.3%) |
| 2 Vehicles | 87 (52.7%) | 37 (24.7%) |
| 3 Vehicles | 0 (0.0%) | 5 (3.3%) |
| 4 Vehicles | 16 (9.7%) | 16 (10.7%) |
| 5 or more Vehicles | 0 (0.0%) | 0 (0.0%) |
| Total | 165 (100.0%) | 150 (100.0%) |
Commute Time in Moenkopi
The most frequently occuring commute durations in Moenkopi are 5 to 9 minutes (175 commuters, 62.9%), 10 to 14 minutes (31 commuters, 11.2%), and 30 to 34 minutes (22 commuters, 7.9%).
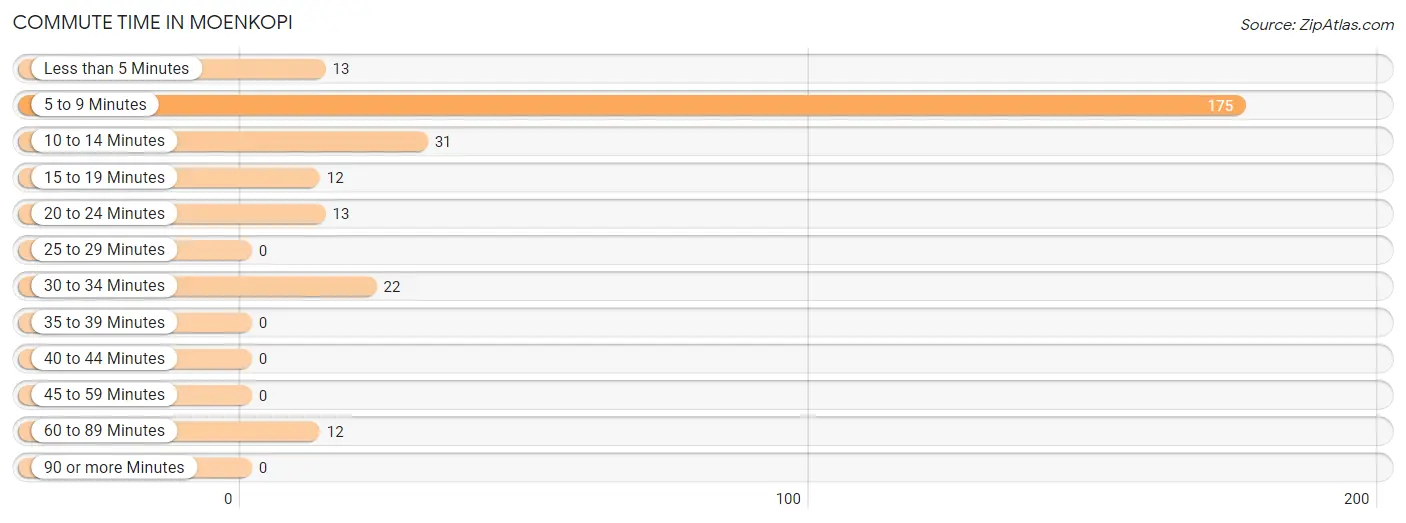
| Commute Time | # Commuters | % Commuters |
| Less than 5 Minutes | 13 | 4.7% |
| 5 to 9 Minutes | 175 | 62.9% |
| 10 to 14 Minutes | 31 | 11.2% |
| 15 to 19 Minutes | 12 | 4.3% |
| 20 to 24 Minutes | 13 | 4.7% |
| 25 to 29 Minutes | 0 | 0.0% |
| 30 to 34 Minutes | 22 | 7.9% |
| 35 to 39 Minutes | 0 | 0.0% |
| 40 to 44 Minutes | 0 | 0.0% |
| 45 to 59 Minutes | 0 | 0.0% |
| 60 to 89 Minutes | 12 | 4.3% |
| 90 or more Minutes | 0 | 0.0% |
Commute Time by Sex in Moenkopi
The most common commute times in Moenkopi are 5 to 9 minutes (86 commuters, 58.1%) for males and 5 to 9 minutes (89 commuters, 68.5%) for females.
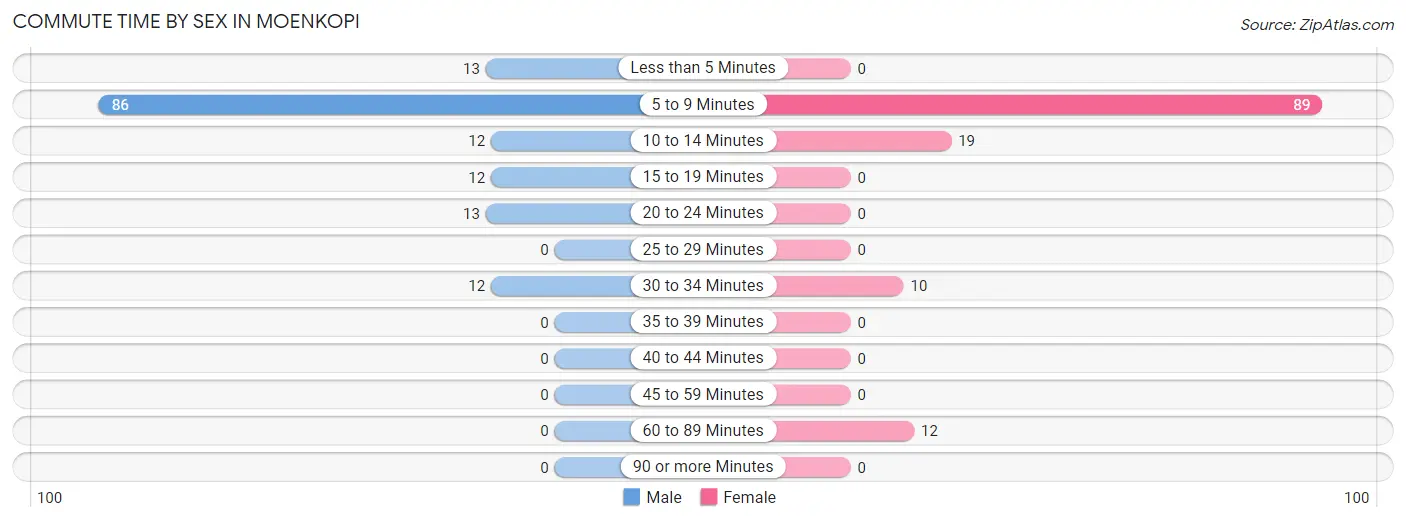
| Commute Time | Male | Female |
| Less than 5 Minutes | 13 (8.8%) | 0 (0.0%) |
| 5 to 9 Minutes | 86 (58.1%) | 89 (68.5%) |
| 10 to 14 Minutes | 12 (8.1%) | 19 (14.6%) |
| 15 to 19 Minutes | 12 (8.1%) | 0 (0.0%) |
| 20 to 24 Minutes | 13 (8.8%) | 0 (0.0%) |
| 25 to 29 Minutes | 0 (0.0%) | 0 (0.0%) |
| 30 to 34 Minutes | 12 (8.1%) | 10 (7.7%) |
| 35 to 39 Minutes | 0 (0.0%) | 0 (0.0%) |
| 40 to 44 Minutes | 0 (0.0%) | 0 (0.0%) |
| 45 to 59 Minutes | 0 (0.0%) | 0 (0.0%) |
| 60 to 89 Minutes | 0 (0.0%) | 12 (9.2%) |
| 90 or more Minutes | 0 (0.0%) | 0 (0.0%) |
Time of Departure to Work by Sex in Moenkopi
The most frequent times of departure to work in Moenkopi are 7:30 AM to 7:59 AM (51, 34.5%) for males and 6:30 AM to 6:59 AM (51, 39.2%) for females.
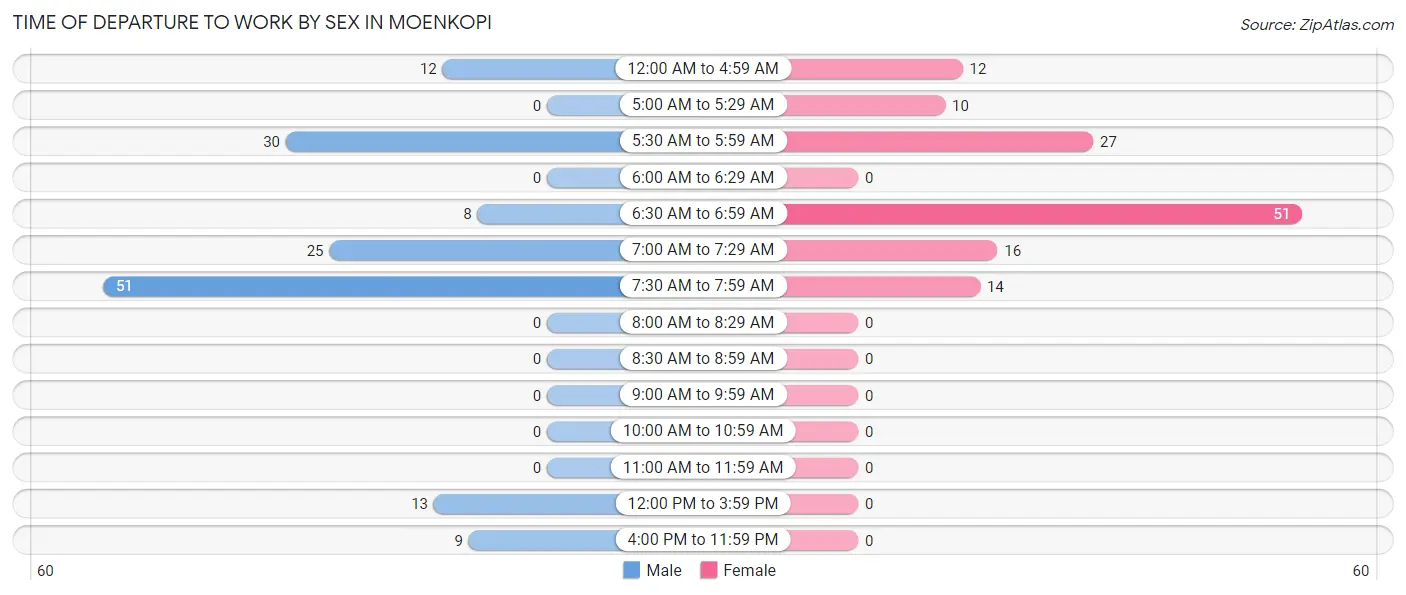
| Time of Departure | Male | Female |
| 12:00 AM to 4:59 AM | 12 (8.1%) | 12 (9.2%) |
| 5:00 AM to 5:29 AM | 0 (0.0%) | 10 (7.7%) |
| 5:30 AM to 5:59 AM | 30 (20.3%) | 27 (20.8%) |
| 6:00 AM to 6:29 AM | 0 (0.0%) | 0 (0.0%) |
| 6:30 AM to 6:59 AM | 8 (5.4%) | 51 (39.2%) |
| 7:00 AM to 7:29 AM | 25 (16.9%) | 16 (12.3%) |
| 7:30 AM to 7:59 AM | 51 (34.5%) | 14 (10.8%) |
| 8:00 AM to 8:29 AM | 0 (0.0%) | 0 (0.0%) |
| 8:30 AM to 8:59 AM | 0 (0.0%) | 0 (0.0%) |
| 9:00 AM to 9:59 AM | 0 (0.0%) | 0 (0.0%) |
| 10:00 AM to 10:59 AM | 0 (0.0%) | 0 (0.0%) |
| 11:00 AM to 11:59 AM | 0 (0.0%) | 0 (0.0%) |
| 12:00 PM to 3:59 PM | 13 (8.8%) | 0 (0.0%) |
| 4:00 PM to 11:59 PM | 9 (6.1%) | 0 (0.0%) |
| Total | 148 (100.0%) | 130 (100.0%) |
Housing Occupancy in Moenkopi
Occupancy by Ownership in Moenkopi
Of the total 283 dwellings in Moenkopi, owner-occupied units account for 217 (76.7%), while renter-occupied units make up 66 (23.3%).
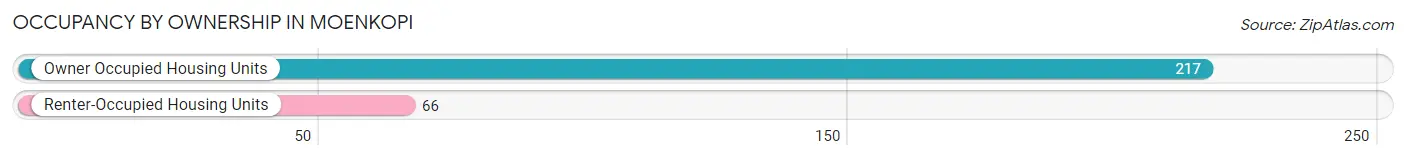
| Occupancy | # Housing Units | % Housing Units |
| Owner Occupied Housing Units | 217 | 76.7% |
| Renter-Occupied Housing Units | 66 | 23.3% |
| Total Occupied Housing Units | 283 | 100.0% |
Occupancy by Household Size in Moenkopi
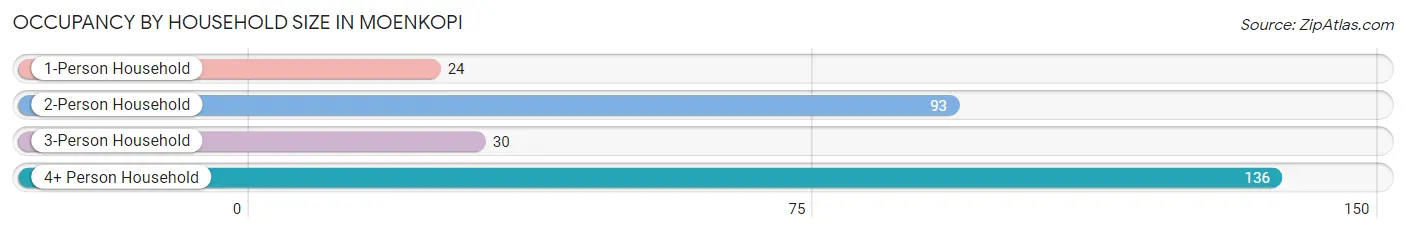
| Household Size | # Housing Units | % Housing Units |
| 1-Person Household | 24 | 8.5% |
| 2-Person Household | 93 | 32.9% |
| 3-Person Household | 30 | 10.6% |
| 4+ Person Household | 136 | 48.1% |
| Total Housing Units | 283 | 100.0% |
Occupancy by Ownership by Household Size in Moenkopi
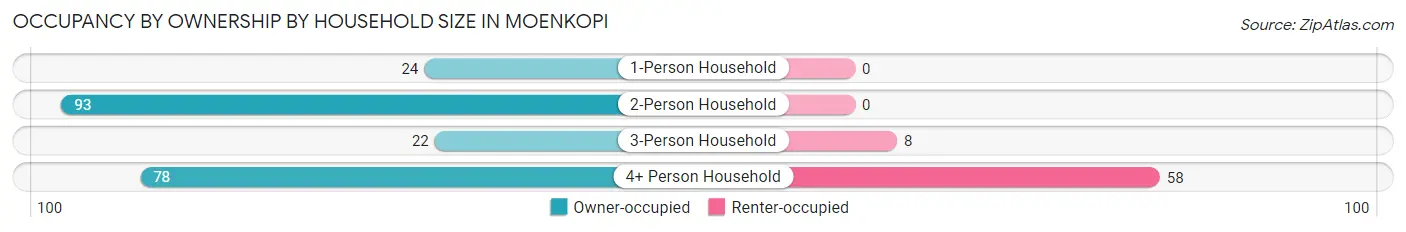
| Household Size | Owner-occupied | Renter-occupied |
| 1-Person Household | 24 (100.0%) | 0 (0.0%) |
| 2-Person Household | 93 (100.0%) | 0 (0.0%) |
| 3-Person Household | 22 (73.3%) | 8 (26.7%) |
| 4+ Person Household | 78 (57.4%) | 58 (42.6%) |
| Total Housing Units | 217 (76.7%) | 66 (23.3%) |
Occupancy by Educational Attainment in Moenkopi
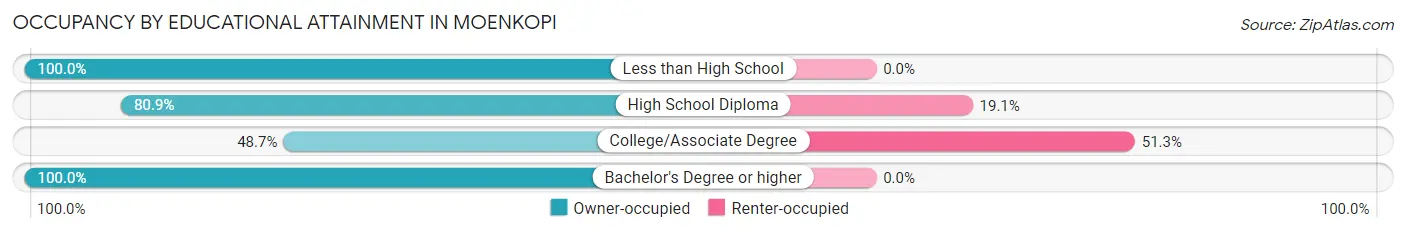
| Household Size | Owner-occupied | Renter-occupied |
| Less than High School | 31 (100.0%) | 0 (0.0%) |
| High School Diploma | 110 (80.9%) | 26 (19.1%) |
| College/Associate Degree | 38 (48.7%) | 40 (51.3%) |
| Bachelor's Degree or higher | 38 (100.0%) | 0 (0.0%) |
Occupancy by Age of Householder in Moenkopi
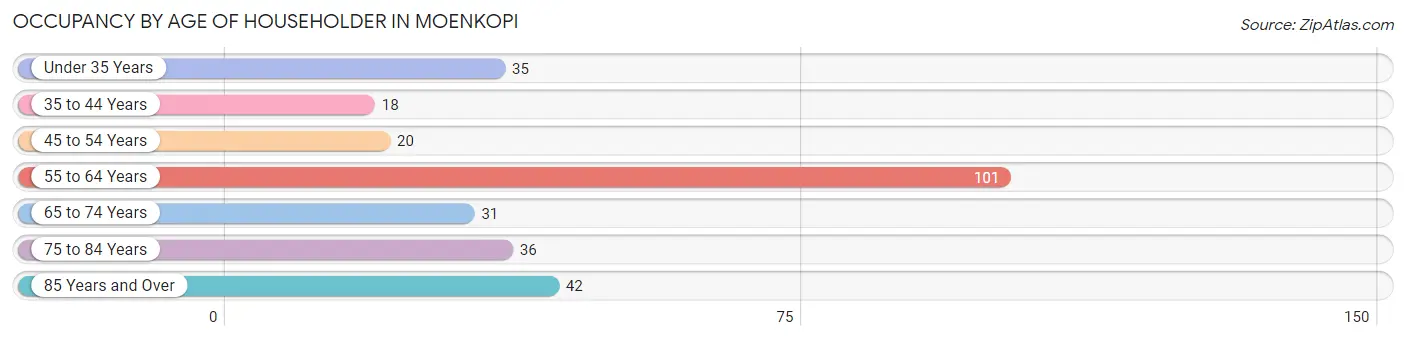
| Age Bracket | # Households | % Households |
| Under 35 Years | 35 | 12.4% |
| 35 to 44 Years | 18 | 6.4% |
| 45 to 54 Years | 20 | 7.1% |
| 55 to 64 Years | 101 | 35.7% |
| 65 to 74 Years | 31 | 11.0% |
| 75 to 84 Years | 36 | 12.7% |
| 85 Years and Over | 42 | 14.8% |
| Total | 283 | 100.0% |
Housing Finances in Moenkopi
Median Income by Occupancy in Moenkopi
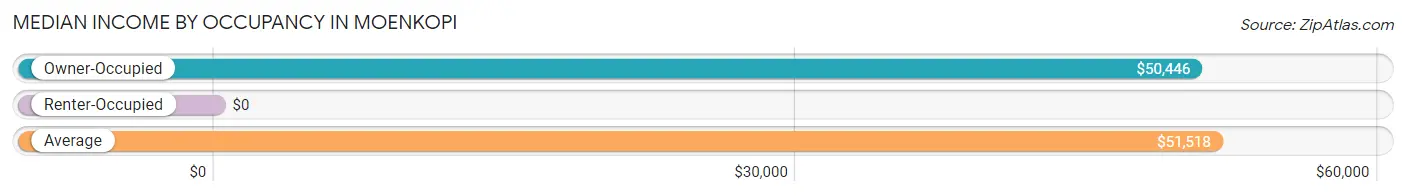
| Occupancy Type | # Households | Median Income |
| Owner-Occupied | 217 (76.7%) | $50,446 |
| Renter-Occupied | 66 (23.3%) | $0 |
| Average | 283 (100.0%) | $51,518 |
Occupancy by Householder Income Bracket in Moenkopi
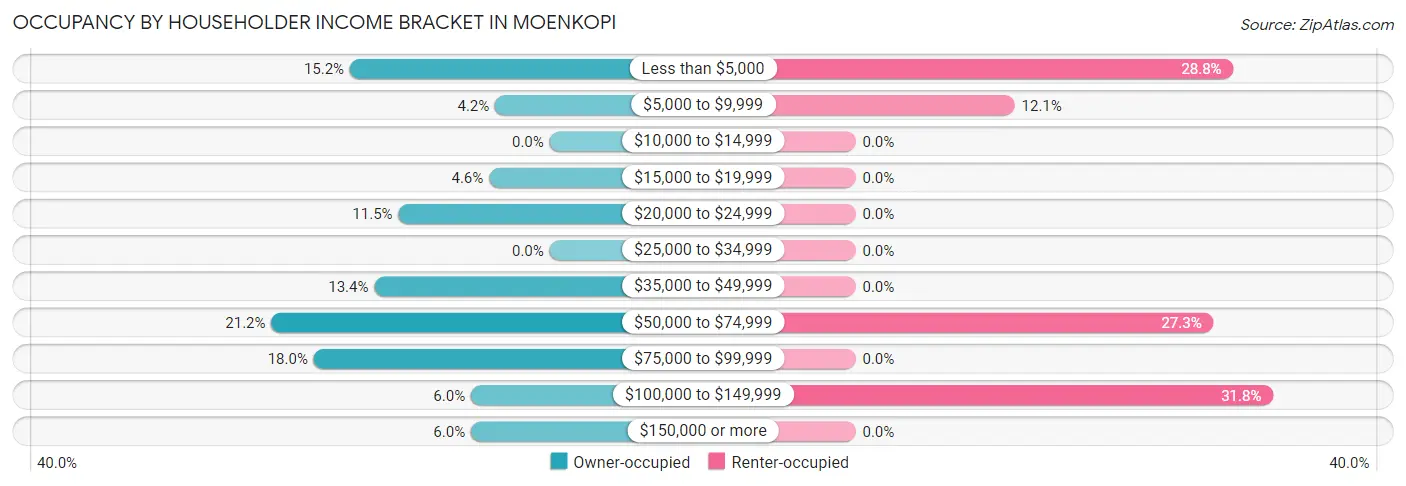
| Income Bracket | Owner-occupied | Renter-occupied |
| Less than $5,000 | 33 (15.2%) | 19 (28.8%) |
| $5,000 to $9,999 | 9 (4.2%) | 8 (12.1%) |
| $10,000 to $14,999 | 0 (0.0%) | 0 (0.0%) |
| $15,000 to $19,999 | 10 (4.6%) | 0 (0.0%) |
| $20,000 to $24,999 | 25 (11.5%) | 0 (0.0%) |
| $25,000 to $34,999 | 0 (0.0%) | 0 (0.0%) |
| $35,000 to $49,999 | 29 (13.4%) | 0 (0.0%) |
| $50,000 to $74,999 | 46 (21.2%) | 18 (27.3%) |
| $75,000 to $99,999 | 39 (18.0%) | 0 (0.0%) |
| $100,000 to $149,999 | 13 (6.0%) | 21 (31.8%) |
| $150,000 or more | 13 (6.0%) | 0 (0.0%) |
| Total | 217 (100.0%) | 66 (100.0%) |
Monthly Housing Cost Tiers in Moenkopi
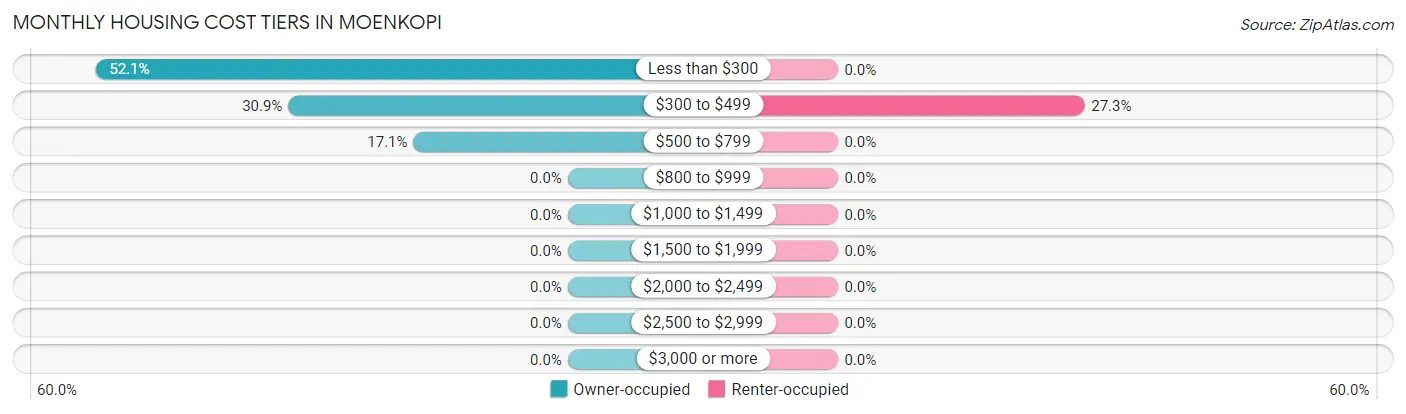
| Monthly Cost | Owner-occupied | Renter-occupied |
| Less than $300 | 113 (52.1%) | 0 (0.0%) |
| $300 to $499 | 67 (30.9%) | 18 (27.3%) |
| $500 to $799 | 37 (17.1%) | 0 (0.0%) |
| $800 to $999 | 0 (0.0%) | 0 (0.0%) |
| $1,000 to $1,499 | 0 (0.0%) | 0 (0.0%) |
| $1,500 to $1,999 | 0 (0.0%) | 0 (0.0%) |
| $2,000 to $2,499 | 0 (0.0%) | 0 (0.0%) |
| $2,500 to $2,999 | 0 (0.0%) | 0 (0.0%) |
| $3,000 or more | 0 (0.0%) | 0 (0.0%) |
| Total | 217 (100.0%) | 66 (100.0%) |
Physical Housing Characteristics in Moenkopi
Housing Structures in Moenkopi
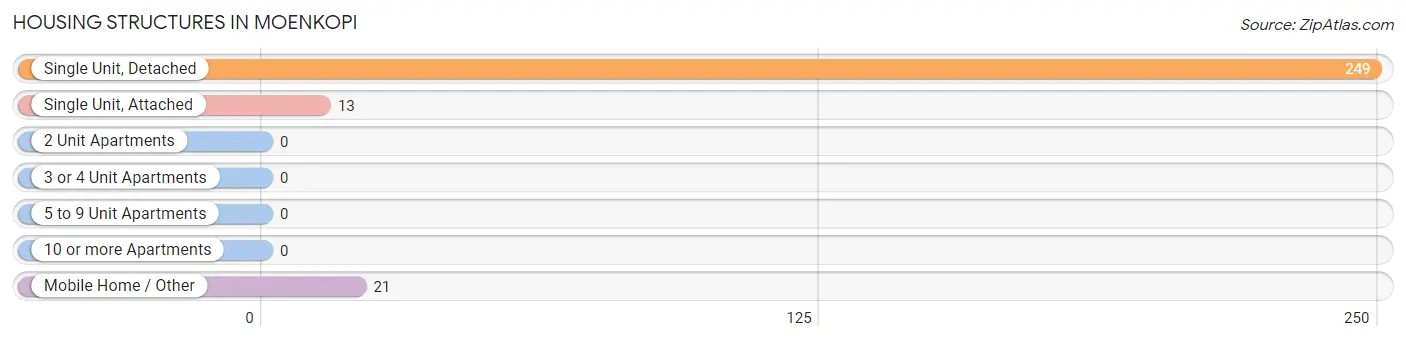
| Structure Type | # Housing Units | % Housing Units |
| Single Unit, Detached | 249 | 88.0% |
| Single Unit, Attached | 13 | 4.6% |
| 2 Unit Apartments | 0 | 0.0% |
| 3 or 4 Unit Apartments | 0 | 0.0% |
| 5 to 9 Unit Apartments | 0 | 0.0% |
| 10 or more Apartments | 0 | 0.0% |
| Mobile Home / Other | 21 | 7.4% |
| Total | 283 | 100.0% |
Housing Structures by Occupancy in Moenkopi
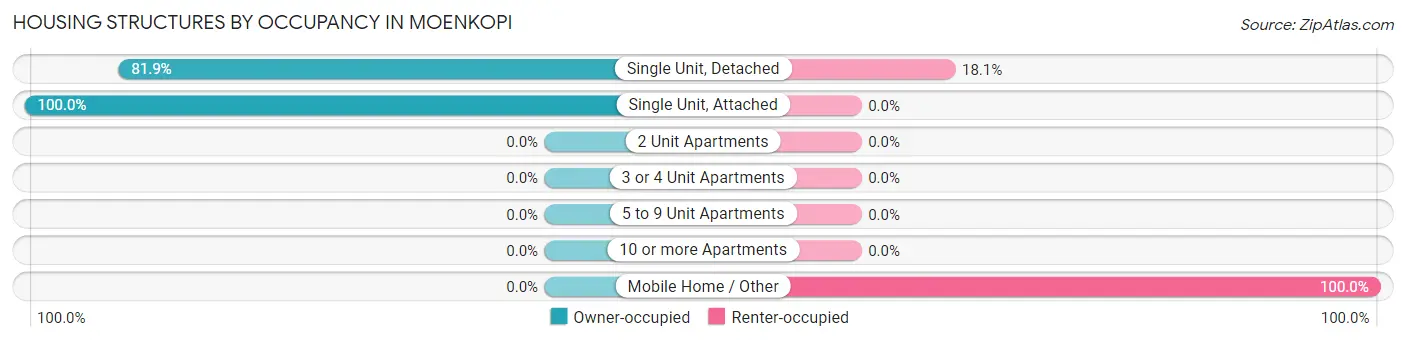
| Structure Type | Owner-occupied | Renter-occupied |
| Single Unit, Detached | 204 (81.9%) | 45 (18.1%) |
| Single Unit, Attached | 13 (100.0%) | 0 (0.0%) |
| 2 Unit Apartments | 0 (0.0%) | 0 (0.0%) |
| 3 or 4 Unit Apartments | 0 (0.0%) | 0 (0.0%) |
| 5 to 9 Unit Apartments | 0 (0.0%) | 0 (0.0%) |
| 10 or more Apartments | 0 (0.0%) | 0 (0.0%) |
| Mobile Home / Other | 0 (0.0%) | 21 (100.0%) |
| Total | 217 (76.7%) | 66 (23.3%) |
Housing Structures by Number of Rooms in Moenkopi
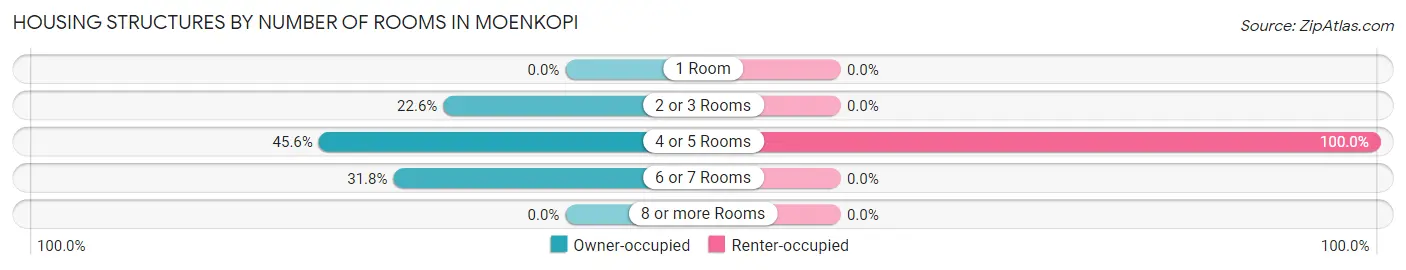
| Number of Rooms | Owner-occupied | Renter-occupied |
| 1 Room | 0 (0.0%) | 0 (0.0%) |
| 2 or 3 Rooms | 49 (22.6%) | 0 (0.0%) |
| 4 or 5 Rooms | 99 (45.6%) | 66 (100.0%) |
| 6 or 7 Rooms | 69 (31.8%) | 0 (0.0%) |
| 8 or more Rooms | 0 (0.0%) | 0 (0.0%) |
| Total | 217 (100.0%) | 66 (100.0%) |
Housing Structure by Heating Type in Moenkopi
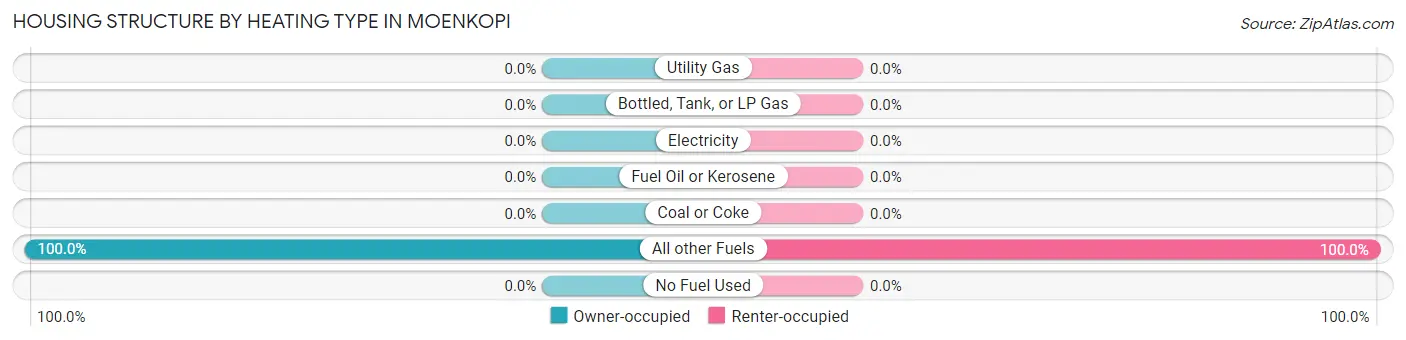
| Heating Type | Owner-occupied | Renter-occupied |
| Utility Gas | 0 (0.0%) | 0 (0.0%) |
| Bottled, Tank, or LP Gas | 0 (0.0%) | 0 (0.0%) |
| Electricity | 0 (0.0%) | 0 (0.0%) |
| Fuel Oil or Kerosene | 0 (0.0%) | 0 (0.0%) |
| Coal or Coke | 0 (0.0%) | 0 (0.0%) |
| All other Fuels | 217 (100.0%) | 66 (100.0%) |
| No Fuel Used | 0 (0.0%) | 0 (0.0%) |
| Total | 217 (100.0%) | 66 (100.0%) |
Household Vehicle Usage in Moenkopi
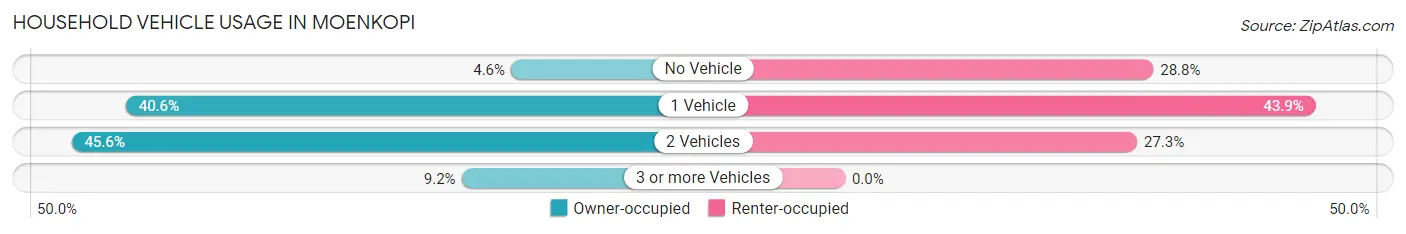
| Vehicles per Household | Owner-occupied | Renter-occupied |
| No Vehicle | 10 (4.6%) | 19 (28.8%) |
| 1 Vehicle | 88 (40.6%) | 29 (43.9%) |
| 2 Vehicles | 99 (45.6%) | 18 (27.3%) |
| 3 or more Vehicles | 20 (9.2%) | 0 (0.0%) |
| Total | 217 (100.0%) | 66 (100.0%) |
Real Estate & Mortgages in Moenkopi
Real Estate and Mortgage Overview in Moenkopi
| Characteristic | Without Mortgage | With Mortgage |
| Housing Units | 205 | 12 |
| Median Property Value | $105,800 | $0 |
| Median Household Income | $46,042 | $0 |
| Monthly Housing Costs | $292 | $0 |
| Real Estate Taxes | - | - |
Property Value by Mortgage Status in Moenkopi
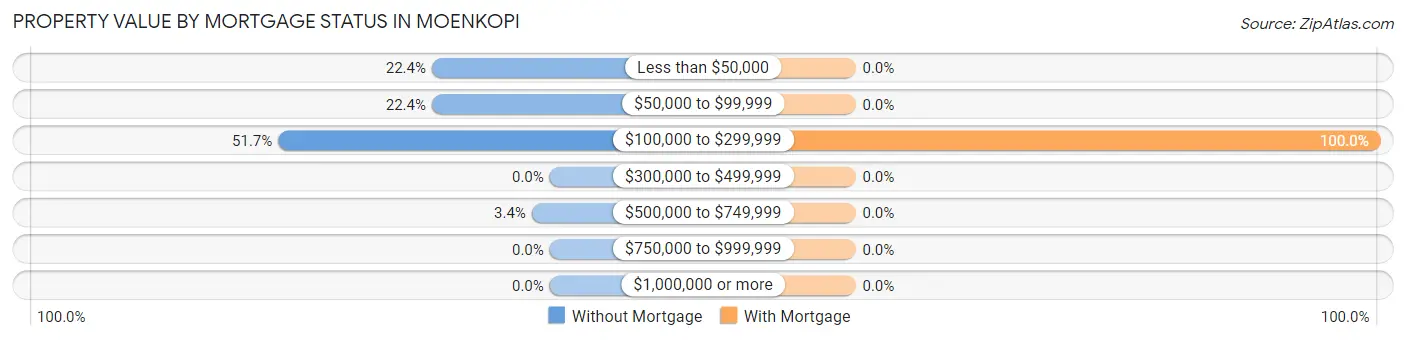
| Property Value | Without Mortgage | With Mortgage |
| Less than $50,000 | 46 (22.4%) | 0 (0.0%) |
| $50,000 to $99,999 | 46 (22.4%) | 0 (0.0%) |
| $100,000 to $299,999 | 106 (51.7%) | 12 (100.0%) |
| $300,000 to $499,999 | 0 (0.0%) | 0 (0.0%) |
| $500,000 to $749,999 | 7 (3.4%) | 0 (0.0%) |
| $750,000 to $999,999 | 0 (0.0%) | 0 (0.0%) |
| $1,000,000 or more | 0 (0.0%) | 0 (0.0%) |
| Total | 205 (100.0%) | 12 (100.0%) |
Household Income by Mortgage Status in Moenkopi
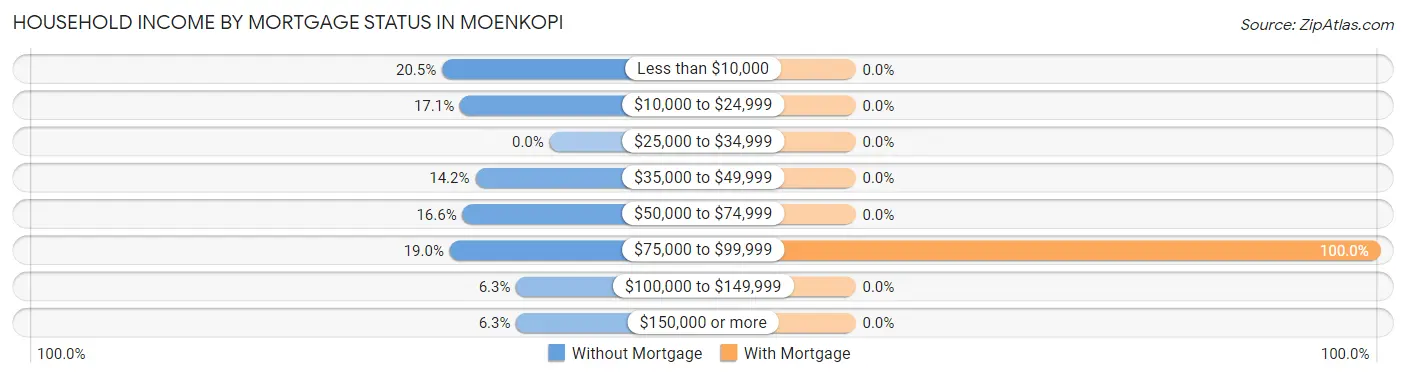
| Household Income | Without Mortgage | With Mortgage |
| Less than $10,000 | 42 (20.5%) | 0 (0.0%) |
| $10,000 to $24,999 | 35 (17.1%) | 0 (0.0%) |
| $25,000 to $34,999 | 0 (0.0%) | 0 (0.0%) |
| $35,000 to $49,999 | 29 (14.1%) | 0 (0.0%) |
| $50,000 to $74,999 | 34 (16.6%) | 0 (0.0%) |
| $75,000 to $99,999 | 39 (19.0%) | 12 (100.0%) |
| $100,000 to $149,999 | 13 (6.3%) | 0 (0.0%) |
| $150,000 or more | 13 (6.3%) | 0 (0.0%) |
| Total | 205 (100.0%) | 12 (100.0%) |
Property Value to Household Income Ratio in Moenkopi
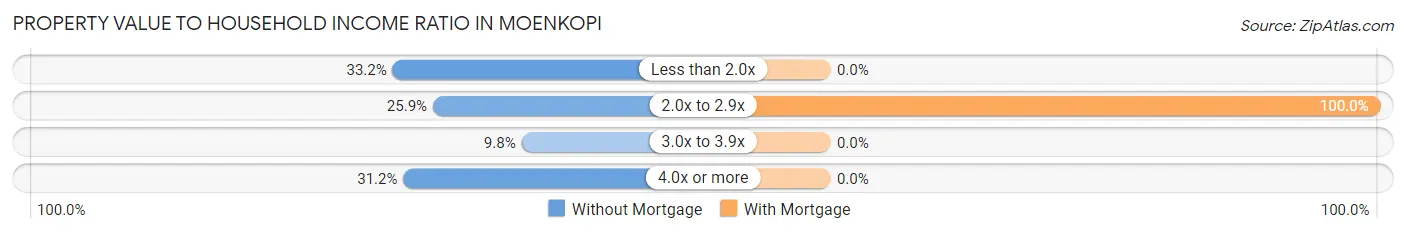
| Value-to-Income Ratio | Without Mortgage | With Mortgage |
| Less than 2.0x | 68 (33.2%) | 0 (0.0%) |
| 2.0x to 2.9x | 53 (25.9%) | 12 (100.0%) |
| 3.0x to 3.9x | 20 (9.8%) | 0 (0.0%) |
| 4.0x or more | 64 (31.2%) | 0 (0.0%) |
| Total | 205 (100.0%) | 12 (100.0%) |
Real Estate Taxes by Mortgage Status in Moenkopi
| Property Taxes | Without Mortgage | With Mortgage |
| Less than $800 | 0 (0.0%) | 0 (0.0%) |
| $800 to $1,499 | 0 (0.0%) | 0 (0.0%) |
| $800 to $1,499 | 0 (0.0%) | 0 (0.0%) |
| Total | 205 (100.0%) | 12 (100.0%) |
Health & Disability in Moenkopi
Health Insurance Coverage by Age in Moenkopi
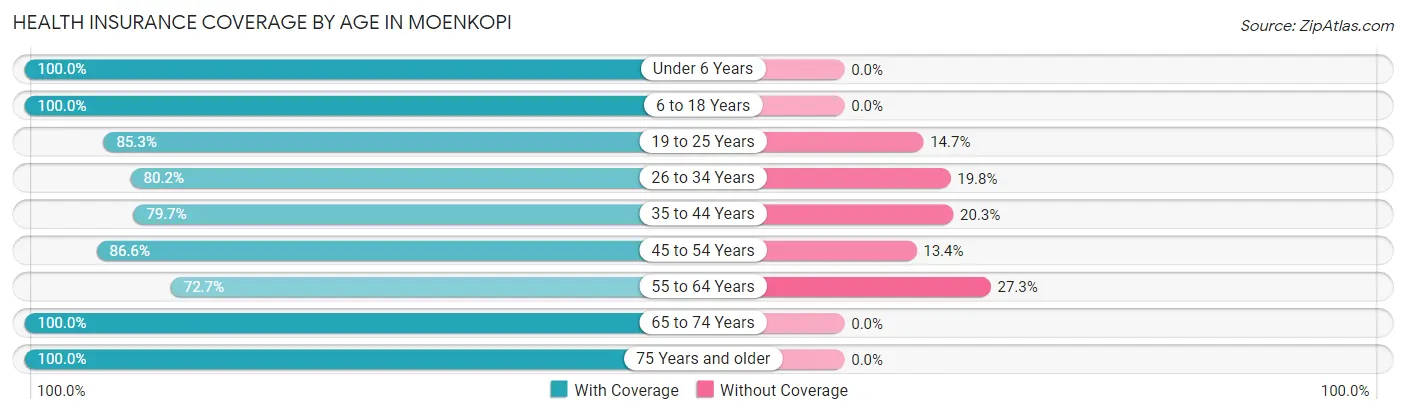
| Age Bracket | With Coverage | Without Coverage |
| Under 6 Years | 65 (100.0%) | 0 (0.0%) |
| 6 to 18 Years | 170 (100.0%) | 0 (0.0%) |
| 19 to 25 Years | 139 (85.3%) | 24 (14.7%) |
| 26 to 34 Years | 69 (80.2%) | 17 (19.8%) |
| 35 to 44 Years | 110 (79.7%) | 28 (20.3%) |
| 45 to 54 Years | 58 (86.6%) | 9 (13.4%) |
| 55 to 64 Years | 144 (72.7%) | 54 (27.3%) |
| 65 to 74 Years | 99 (100.0%) | 0 (0.0%) |
| 75 Years and older | 78 (100.0%) | 0 (0.0%) |
| Total | 932 (87.6%) | 132 (12.4%) |
Health Insurance Coverage by Citizenship Status in Moenkopi

| Citizenship Status | With Coverage | Without Coverage |
| Native Born | 65 (100.0%) | 0 (0.0%) |
| Foreign Born, Citizen | 170 (100.0%) | 0 (0.0%) |
| Foreign Born, not a Citizen | 139 (85.3%) | 24 (14.7%) |
Health Insurance Coverage by Household Income in Moenkopi
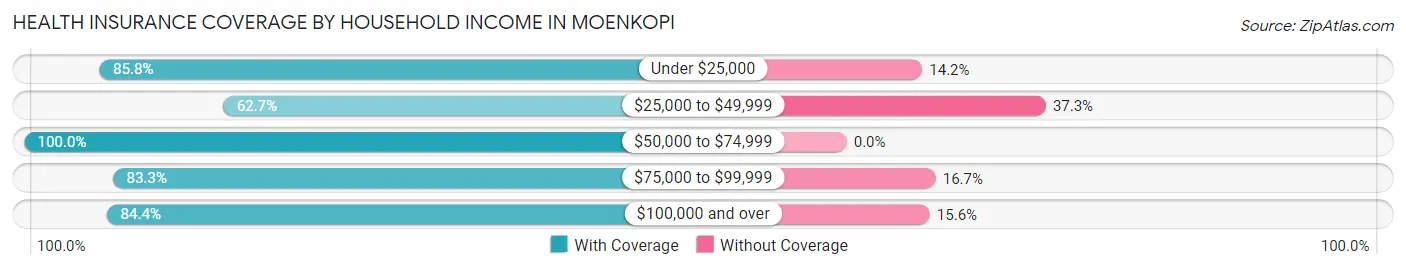
| Household Income | With Coverage | Without Coverage |
| Under $25,000 | 303 (85.8%) | 50 (14.2%) |
| $25,000 to $49,999 | 42 (62.7%) | 25 (37.3%) |
| $50,000 to $74,999 | 288 (100.0%) | 0 (0.0%) |
| $75,000 to $99,999 | 120 (83.3%) | 24 (16.7%) |
| $100,000 and over | 179 (84.4%) | 33 (15.6%) |
Public vs Private Health Insurance Coverage by Age in Moenkopi
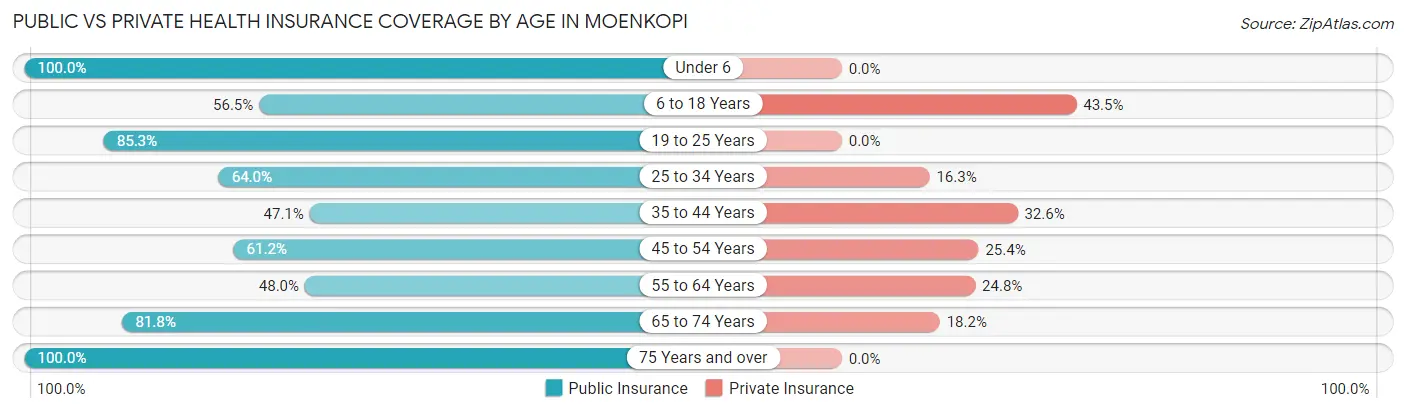
| Age Bracket | Public Insurance | Private Insurance |
| Under 6 | 65 (100.0%) | 0 (0.0%) |
| 6 to 18 Years | 96 (56.5%) | 74 (43.5%) |
| 19 to 25 Years | 139 (85.3%) | 0 (0.0%) |
| 25 to 34 Years | 55 (63.9%) | 14 (16.3%) |
| 35 to 44 Years | 65 (47.1%) | 45 (32.6%) |
| 45 to 54 Years | 41 (61.2%) | 17 (25.4%) |
| 55 to 64 Years | 95 (48.0%) | 49 (24.7%) |
| 65 to 74 Years | 81 (81.8%) | 18 (18.2%) |
| 75 Years and over | 78 (100.0%) | 0 (0.0%) |
| Total | 715 (67.2%) | 217 (20.4%) |
Disability Status by Sex by Age in Moenkopi
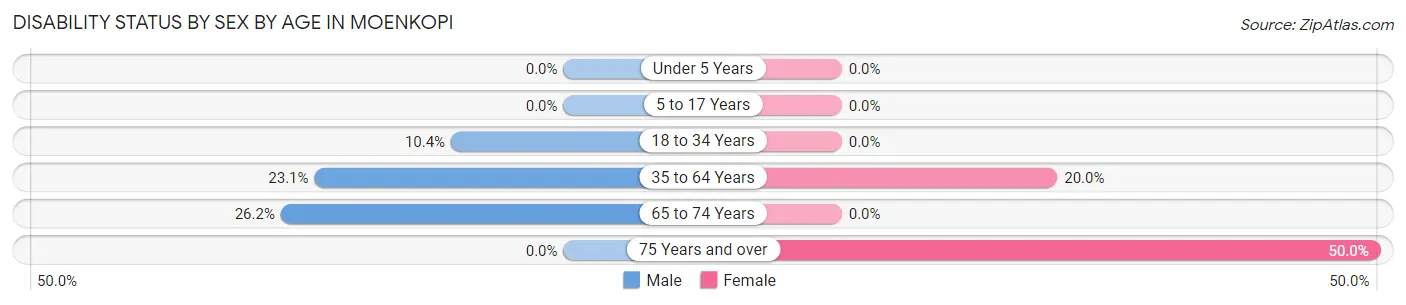
| Age Bracket | Male | Female |
| Under 5 Years | 0 (0.0%) | 0 (0.0%) |
| 5 to 17 Years | 0 (0.0%) | 0 (0.0%) |
| 18 to 34 Years | 17 (10.4%) | 0 (0.0%) |
| 35 to 64 Years | 55 (23.1%) | 33 (20.0%) |
| 65 to 74 Years | 16 (26.2%) | 0 (0.0%) |
| 75 Years and over | 0 (0.0%) | 39 (50.0%) |
Disability Class by Sex by Age in Moenkopi
Disability Class: Hearing Difficulty

| Age Bracket | Male | Female |
| Under 5 Years | 0 (0.0%) | 0 (0.0%) |
| 5 to 17 Years | 0 (0.0%) | 0 (0.0%) |
| 18 to 34 Years | 0 (0.0%) | 0 (0.0%) |
| 35 to 64 Years | 11 (4.6%) | 13 (7.9%) |
| 65 to 74 Years | 16 (26.2%) | 0 (0.0%) |
| 75 Years and over | 0 (0.0%) | 0 (0.0%) |
Disability Class: Vision Difficulty
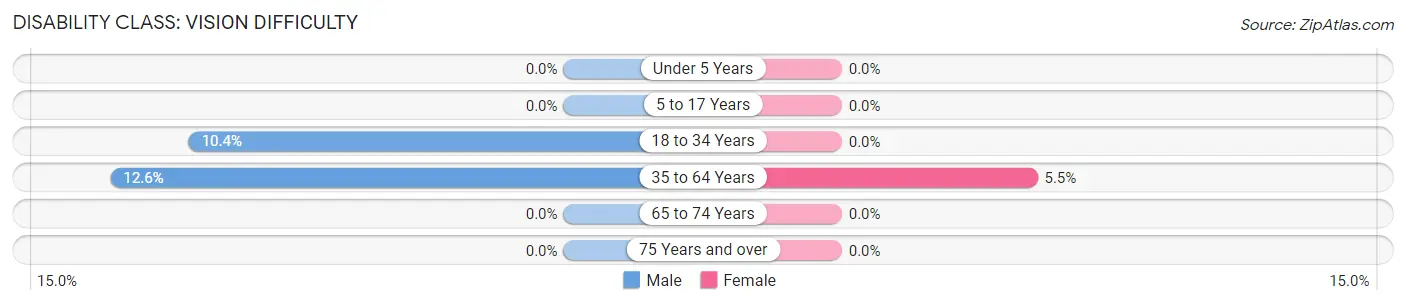
| Age Bracket | Male | Female |
| Under 5 Years | 0 (0.0%) | 0 (0.0%) |
| 5 to 17 Years | 0 (0.0%) | 0 (0.0%) |
| 18 to 34 Years | 17 (10.4%) | 0 (0.0%) |
| 35 to 64 Years | 30 (12.6%) | 9 (5.4%) |
| 65 to 74 Years | 0 (0.0%) | 0 (0.0%) |
| 75 Years and over | 0 (0.0%) | 0 (0.0%) |
Disability Class: Cognitive Difficulty
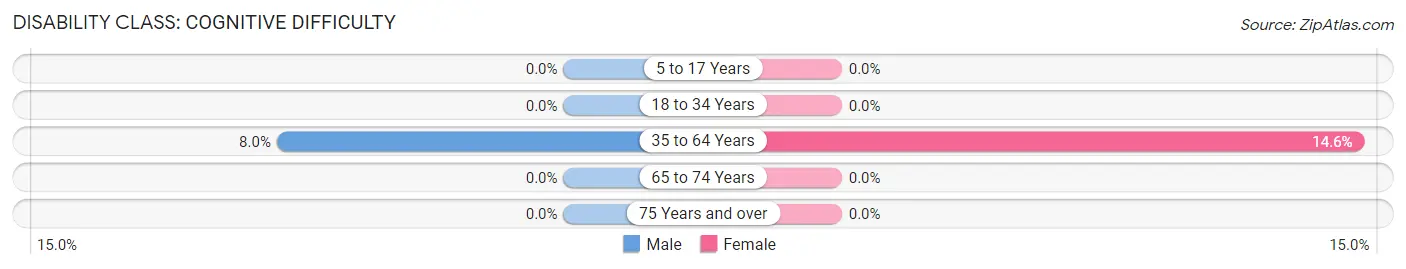
| Age Bracket | Male | Female |
| 5 to 17 Years | 0 (0.0%) | 0 (0.0%) |
| 18 to 34 Years | 0 (0.0%) | 0 (0.0%) |
| 35 to 64 Years | 19 (8.0%) | 24 (14.5%) |
| 65 to 74 Years | 0 (0.0%) | 0 (0.0%) |
| 75 Years and over | 0 (0.0%) | 0 (0.0%) |
Disability Class: Ambulatory Difficulty
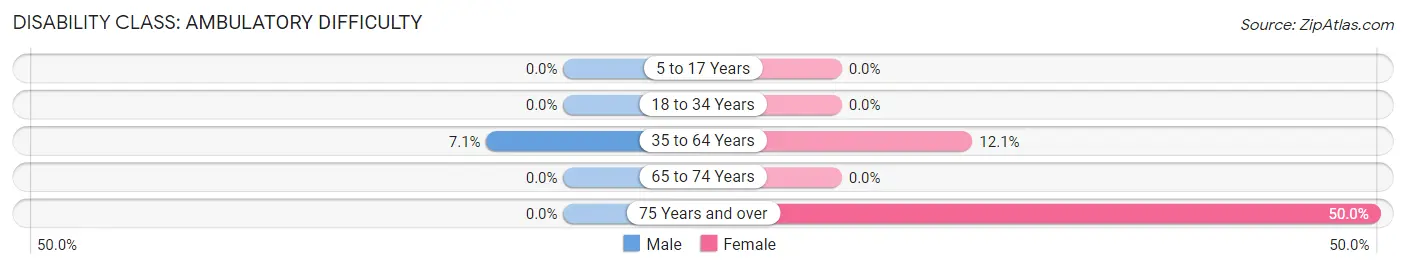
| Age Bracket | Male | Female |
| 5 to 17 Years | 0 (0.0%) | 0 (0.0%) |
| 18 to 34 Years | 0 (0.0%) | 0 (0.0%) |
| 35 to 64 Years | 17 (7.1%) | 20 (12.1%) |
| 65 to 74 Years | 0 (0.0%) | 0 (0.0%) |
| 75 Years and over | 0 (0.0%) | 39 (50.0%) |
Disability Class: Self-Care Difficulty
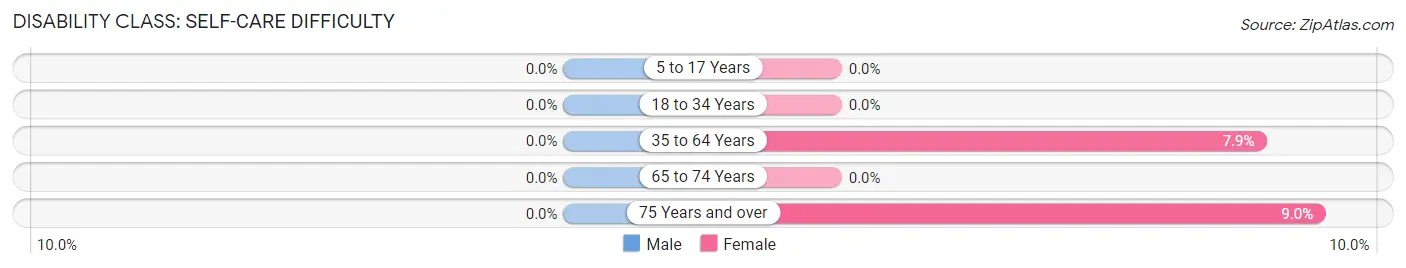
| Age Bracket | Male | Female |
| 5 to 17 Years | 0 (0.0%) | 0 (0.0%) |
| 18 to 34 Years | 0 (0.0%) | 0 (0.0%) |
| 35 to 64 Years | 0 (0.0%) | 13 (7.9%) |
| 65 to 74 Years | 0 (0.0%) | 0 (0.0%) |
| 75 Years and over | 0 (0.0%) | 7 (9.0%) |
Technology Access in Moenkopi
Computing Device Access in Moenkopi
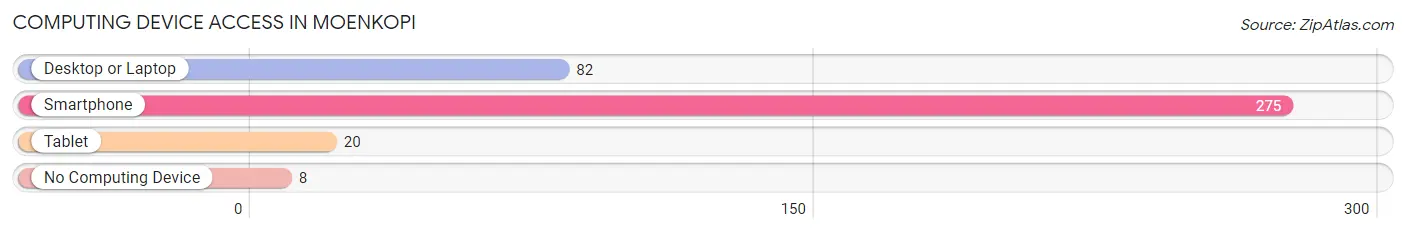
| Device Type | # Households | % Households |
| Desktop or Laptop | 82 | 29.0% |
| Smartphone | 275 | 97.2% |
| Tablet | 20 | 7.1% |
| No Computing Device | 8 | 2.8% |
| Total | 283 | 100.0% |
Internet Access in Moenkopi
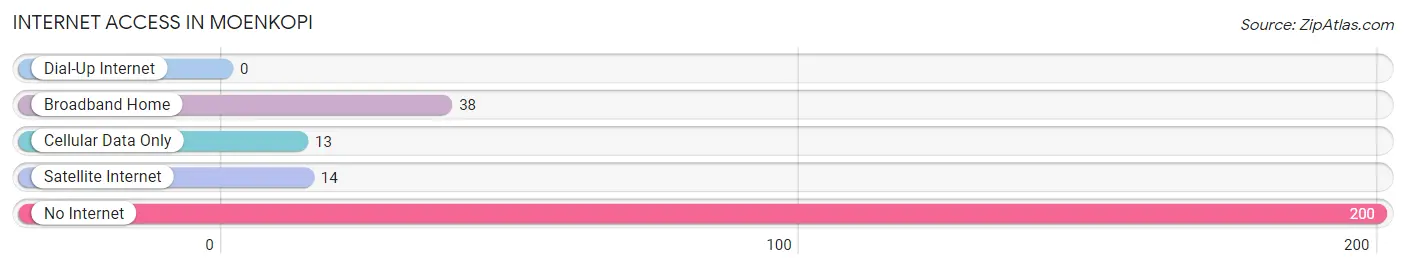
| Internet Type | # Households | % Households |
| Dial-Up Internet | 0 | 0.0% |
| Broadband Home | 38 | 13.4% |
| Cellular Data Only | 13 | 4.6% |
| Satellite Internet | 14 | 5.0% |
| No Internet | 200 | 70.7% |
| Total | 283 | 100.0% |
Moenkopi Summary
Moenkopi is a small unincorporated community located in the Tuba City District of the Navajo Nation in Coconino County, Arizona. It is located on the Hopi Reservation, approximately 20 miles west of Tuba City. The population of Moenkopi was 590 in the 2010 census.
History
Moenkopi was originally established in the late 1800s as a Hopi village. The name Moenkopi is derived from the Hopi word for “spring at the foot of the hill”. The village was located near a natural spring that provided water for the Hopi people.
In the early 1900s, the Bureau of Indian Affairs (BIA) established a trading post in Moenkopi. This trading post was the first of its kind in the area and provided the Hopi people with access to goods and services that were not available in the area.
In the 1930s, the BIA established a school in Moenkopi. This school provided education to the Hopi children in the area.
In the 1950s, the BIA established a health clinic in Moenkopi. This clinic provided medical care to the Hopi people in the area.
In the 1960s, the BIA established a housing project in Moenkopi. This housing project provided housing for the Hopi people in the area.
In the 1970s, the BIA established a community center in Moenkopi. This community center provided a place for the Hopi people to gather and socialize.
In the 1980s, the BIA established a post office in Moenkopi. This post office provided mail services to the Hopi people in the area.
In the 1990s, the BIA established a library in Moenkopi. This library provided access to books and other resources to the Hopi people in the area.
Geography
Moenkopi is located in the Tuba City District of the Navajo Nation in Coconino County, Arizona. It is located on the Hopi Reservation, approximately 20 miles west of Tuba City. The elevation of Moenkopi is 5,400 feet.
The climate of Moenkopi is semi-arid, with hot summers and cold winters. The average annual temperature is 57°F. The average annual precipitation is 8.5 inches.
Economy
The economy of Moenkopi is largely based on agriculture and tourism. The Hopi people in the area grow corn, beans, squash, and melons. The area is also home to several tourist attractions, including the Hopi Cultural Center, the Hopi Arts and Crafts Center, and the Moenkopi Legacy Inn and Suites.
Demographics
As of the 2010 census, the population of Moenkopi was 590. The racial makeup of the town was 95.3% Native American, 2.7% White, 0.2% Asian, and 1.8% from other races. The median household income was $20,000. The median age was 33.7 years.
Common Questions
What is Per Capita Income in Moenkopi?
Per Capita income in Moenkopi is $13,884.
What is the Median Family Income in Moenkopi?
Median Family Income in Moenkopi is $40,500.
What is the Median Household income in Moenkopi?
Median Household Income in Moenkopi is $51,518.
What is Income or Wage Gap in Moenkopi?
Income or Wage Gap in Moenkopi is 1.9%.
Women in Moenkopi earn 98.1 cents for every dollar earned by a man.
What is Inequality or Gini Index in Moenkopi?
Inequality or Gini Index in Moenkopi is 0.44.
What is the Total Population of Moenkopi?
Total Population of Moenkopi is 1,064.
What is the Total Male Population of Moenkopi?
Total Male Population of Moenkopi is 604.
What is the Total Female Population of Moenkopi?
Total Female Population of Moenkopi is 460.
What is the Ratio of Males per 100 Females in Moenkopi?
There are 131.30 Males per 100 Females in Moenkopi.
What is the Ratio of Females per 100 Males in Moenkopi?
There are 76.16 Females per 100 Males in Moenkopi.
What is the Median Population Age in Moenkopi?
Median Population Age in Moenkopi is 36.9 Years.
What is the Average Family Size in Moenkopi
Average Family Size in Moenkopi is 3.8 People.
What is the Average Household Size in Moenkopi
Average Household Size in Moenkopi is 3.8 People.
How Large is the Labor Force in Moenkopi?
There are 355 People in the Labor Forcein in Moenkopi.
What is the Percentage of People in the Labor Force in Moenkopi?
40.3% of People are in the Labor Force in Moenkopi.
What is the Unemployment Rate in Moenkopi?
Unemployment Rate in Moenkopi is 11.3%.