Teec Nos Pos, AZ Map & Demographics
Teec Nos Pos Map
Teec Nos Pos Overview
$14,904
PER CAPITA INCOME
$41,979
AVG FAMILY INCOME
$41,458
AVG HOUSEHOLD INCOME
9.3%
WAGE / INCOME GAP [ % ]
90.7¢/ $1
WAGE / INCOME GAP [ $ ]
0.42
INEQUALITY / GINI INDEX
884
TOTAL POPULATION
441
MALE POPULATION
443
FEMALE POPULATION
99.55
MALES / 100 FEMALES
100.45
FEMALES / 100 MALES
28.2
MEDIAN AGE
4.7
AVG FAMILY SIZE
4.0
AVG HOUSEHOLD SIZE
284
LABOR FORCE [ PEOPLE ]
48.0%
PERCENT IN LABOR FORCE
27.1%
UNEMPLOYMENT RATE
Teec Nos Pos Zip Codes
Teec Nos Pos Area Codes
Income in Teec Nos Pos
Income Overview in Teec Nos Pos
Per Capita Income in Teec Nos Pos is $14,904, while median incomes of families and households are $41,979 and $41,458 respectively.
| Characteristic | Number | Measure |
| Per Capita Income | 884 | $14,904 |
| Median Family Income | 167 | $41,979 |
| Mean Family Income | 167 | $55,772 |
| Median Household Income | 220 | $41,458 |
| Mean Household Income | 220 | $51,735 |
| Income Deficit | 167 | $0 |
| Wage / Income Gap (%) | 884 | 9.31% |
| Wage / Income Gap ($) | 884 | 90.69¢ per $1 |
| Gini / Inequality Index | 884 | 0.42 |
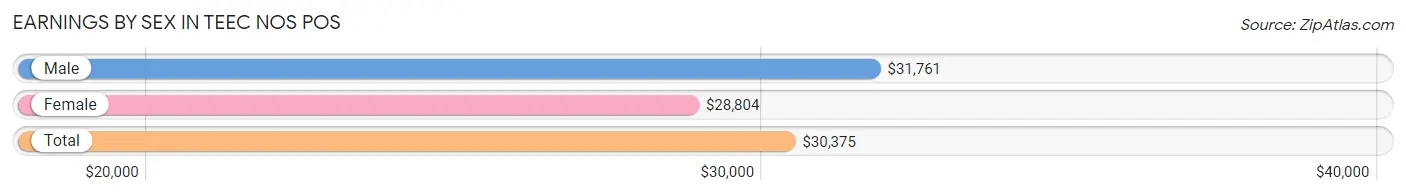
Earnings by Sex in Teec Nos Pos
Average Earnings in Teec Nos Pos are $30,375, $31,761 for men and $28,804 for women, a difference of 9.3%.
| Sex | Number | Average Earnings |
| Male | 137 (48.1%) | $31,761 |
| Female | 148 (51.9%) | $28,804 |
| Total | 285 (100.0%) | $30,375 |
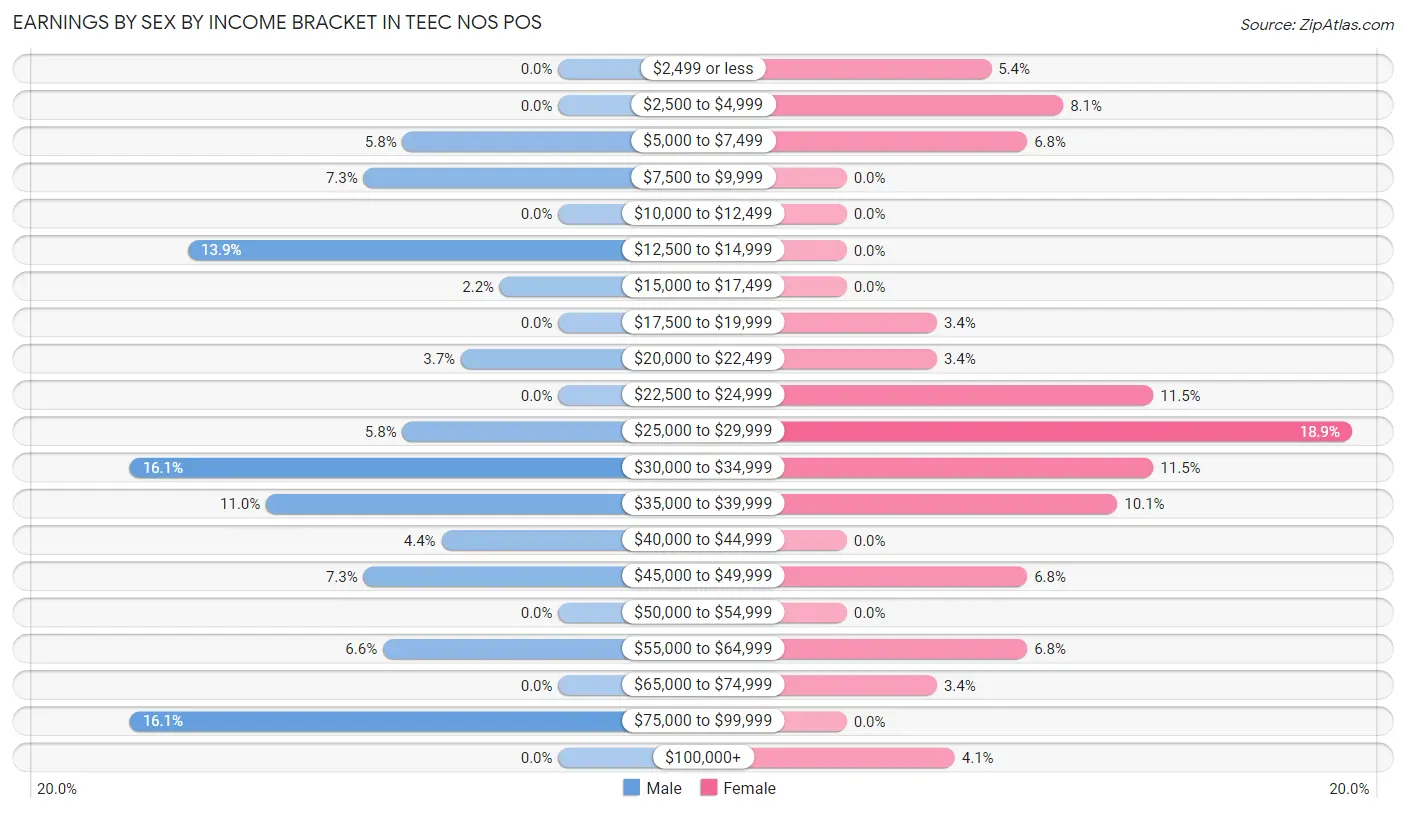
Earnings by Sex by Income Bracket in Teec Nos Pos
The most common earnings brackets in Teec Nos Pos are $30,000 to $34,999 for men (22 | 16.1%) and $25,000 to $29,999 for women (28 | 18.9%).
| Income | Male | Female |
| $2,499 or less | 0 (0.0%) | 8 (5.4%) |
| $2,500 to $4,999 | 0 (0.0%) | 12 (8.1%) |
| $5,000 to $7,499 | 8 (5.8%) | 10 (6.8%) |
| $7,500 to $9,999 | 10 (7.3%) | 0 (0.0%) |
| $10,000 to $12,499 | 0 (0.0%) | 0 (0.0%) |
| $12,500 to $14,999 | 19 (13.9%) | 0 (0.0%) |
| $15,000 to $17,499 | 3 (2.2%) | 0 (0.0%) |
| $17,500 to $19,999 | 0 (0.0%) | 5 (3.4%) |
| $20,000 to $22,499 | 5 (3.6%) | 5 (3.4%) |
| $22,500 to $24,999 | 0 (0.0%) | 17 (11.5%) |
| $25,000 to $29,999 | 8 (5.8%) | 28 (18.9%) |
| $30,000 to $34,999 | 22 (16.1%) | 17 (11.5%) |
| $35,000 to $39,999 | 15 (11.0%) | 15 (10.1%) |
| $40,000 to $44,999 | 6 (4.4%) | 0 (0.0%) |
| $45,000 to $49,999 | 10 (7.3%) | 10 (6.8%) |
| $50,000 to $54,999 | 0 (0.0%) | 0 (0.0%) |
| $55,000 to $64,999 | 9 (6.6%) | 10 (6.8%) |
| $65,000 to $74,999 | 0 (0.0%) | 5 (3.4%) |
| $75,000 to $99,999 | 22 (16.1%) | 0 (0.0%) |
| $100,000+ | 0 (0.0%) | 6 (4.1%) |
| Total | 137 (100.0%) | 148 (100.0%) |
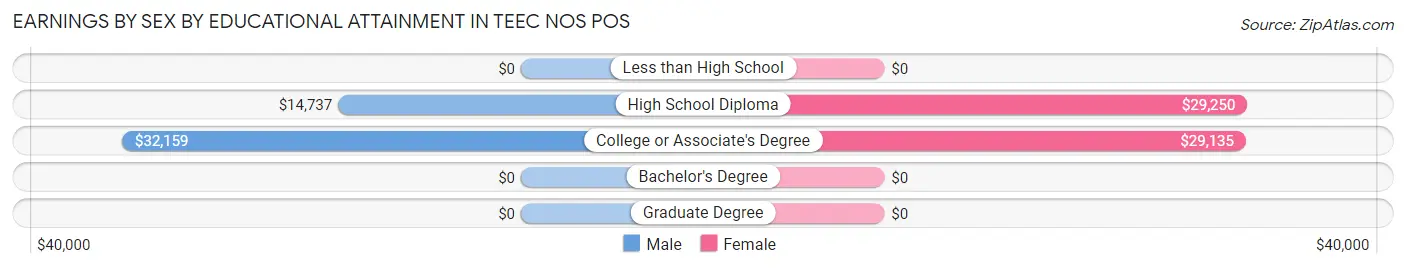
Earnings by Sex by Educational Attainment in Teec Nos Pos
Average earnings in Teec Nos Pos are $31,705 for men and $29,728 for women, a difference of 6.2%. Men with an educational attainment of college or associate's degree enjoy the highest average annual earnings of $32,159, while those with high school diploma education earn the least with $14,737. Women with an educational attainment of high school diploma earn the most with the average annual earnings of $29,250, while those with college or associate's degree education have the smallest earnings of $29,135.
| Educational Attainment | Male Income | Female Income |
| Less than High School | - | - |
| High School Diploma | $14,737 | $29,250 |
| College or Associate's Degree | $32,159 | $29,135 |
| Bachelor's Degree | - | - |
| Graduate Degree | - | - |
| Total | $31,705 | $29,728 |
Family Income in Teec Nos Pos
Family Income Brackets in Teec Nos Pos
According to the Teec Nos Pos family income data, there are 44 families falling into the $50,000 to $74,999 income range, which is the most common income bracket and makes up 26.4% of all families.
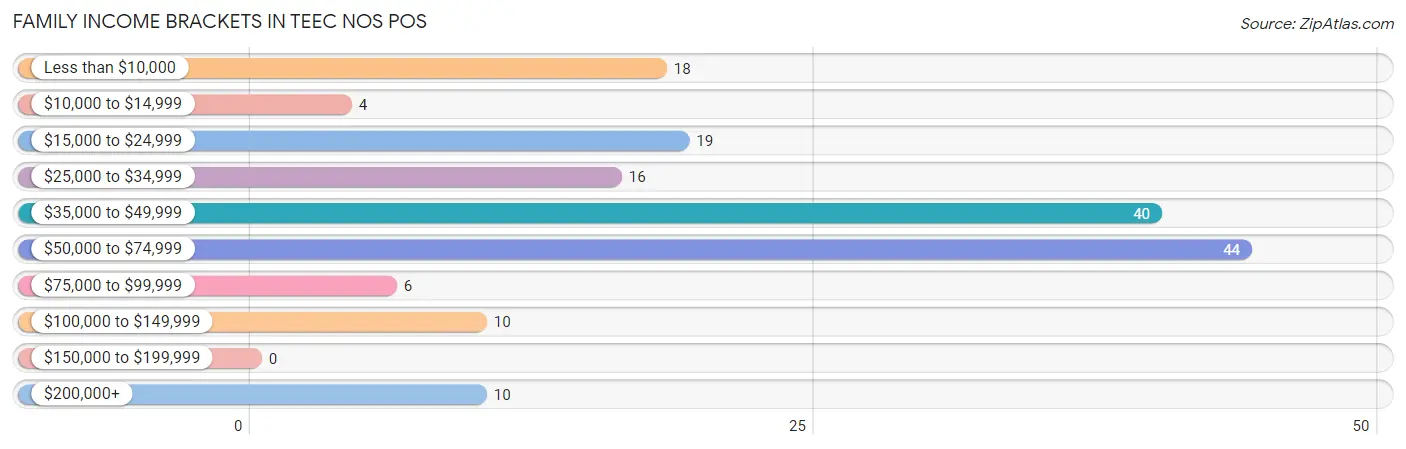
| Income Bracket | # Families | % Families |
| Less than $10,000 | 18 | 10.8% |
| $10,000 to $14,999 | 4 | 2.4% |
| $15,000 to $24,999 | 19 | 11.4% |
| $25,000 to $34,999 | 16 | 9.6% |
| $35,000 to $49,999 | 40 | 24.0% |
| $50,000 to $74,999 | 44 | 26.3% |
| $75,000 to $99,999 | 6 | 3.6% |
| $100,000 to $149,999 | 10 | 6.0% |
| $150,000 to $199,999 | 0 | 0.0% |
| $200,000+ | 10 | 6.0% |
Family Income by Famaliy Size in Teec Nos Pos
6-person families (23 | 13.8%) account for the highest median family income in Teec Nos Pos with $61,375 per family, while 2-person families (75 | 44.9%) have the highest median income of $20,573 per family member.
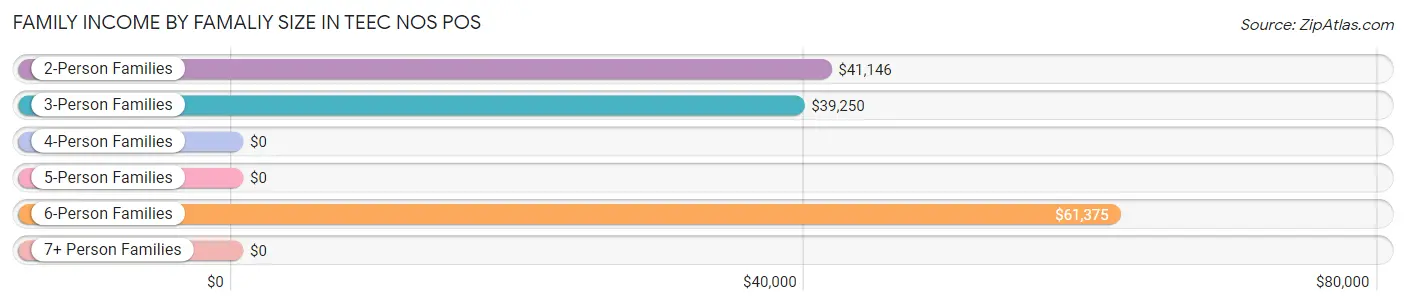
| Income Bracket | # Families | Median Income |
| 2-Person Families | 75 (44.9%) | $41,146 |
| 3-Person Families | 27 (16.2%) | $39,250 |
| 4-Person Families | 13 (7.8%) | $0 |
| 5-Person Families | 11 (6.6%) | $0 |
| 6-Person Families | 23 (13.8%) | $61,375 |
| 7+ Person Families | 18 (10.8%) | $0 |
| Total | 167 (100.0%) | $41,979 |
Family Income by Number of Earners in Teec Nos Pos
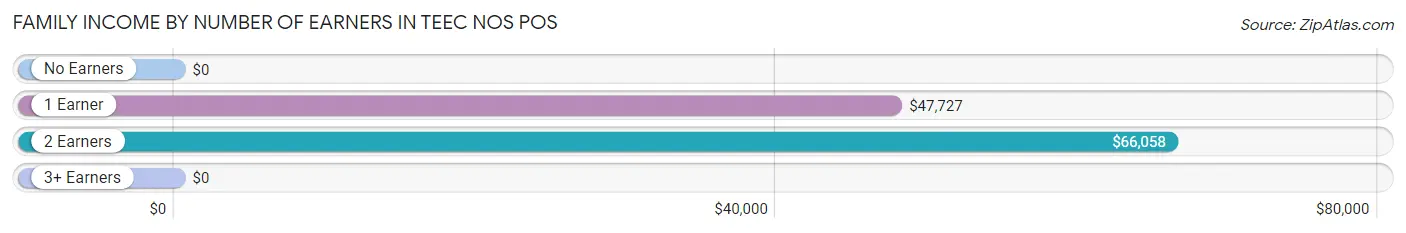
| Number of Earners | # Families | Median Income |
| No Earners | 37 (22.2%) | $0 |
| 1 Earner | 82 (49.1%) | $47,727 |
| 2 Earners | 39 (23.4%) | $66,058 |
| 3+ Earners | 9 (5.4%) | $0 |
| Total | 167 (100.0%) | $41,979 |
Household Income in Teec Nos Pos
Household Income Brackets in Teec Nos Pos
With 54 households falling in the category, the $50,000 to $74,999 income range is the most frequent in Teec Nos Pos, accounting for 24.5% of all households.
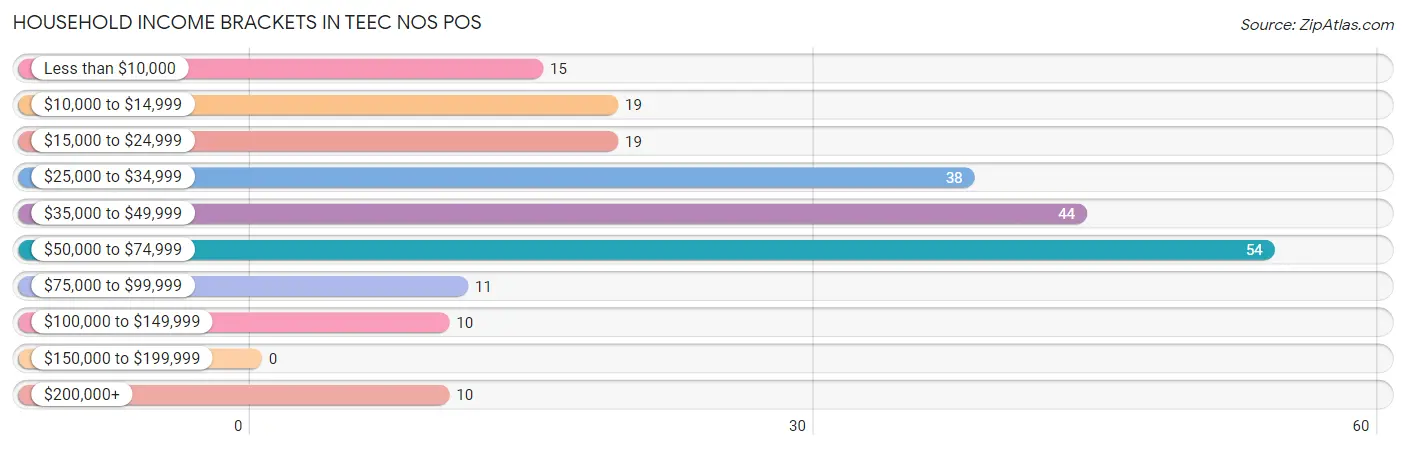
| Income Bracket | # Households | % Households |
| Less than $10,000 | 15 | 6.8% |
| $10,000 to $14,999 | 19 | 8.6% |
| $15,000 to $24,999 | 19 | 8.6% |
| $25,000 to $34,999 | 38 | 17.3% |
| $35,000 to $49,999 | 44 | 20.0% |
| $50,000 to $74,999 | 54 | 24.5% |
| $75,000 to $99,999 | 11 | 5.0% |
| $100,000 to $149,999 | 10 | 4.5% |
| $150,000 to $199,999 | 0 | 0.0% |
| $200,000+ | 10 | 4.5% |
Household Income by Householder Age in Teec Nos Pos
The median household income in Teec Nos Pos is $41,458, with the highest median household income of $50,875 found in the 45 to 64 years age bracket for the primary householder. A total of 111 households (50.4%) fall into this category. Meanwhile, the 15 to 24 years age bracket for the primary householder has the lowest median household income of $0, with 5 households (2.3%) in this group.
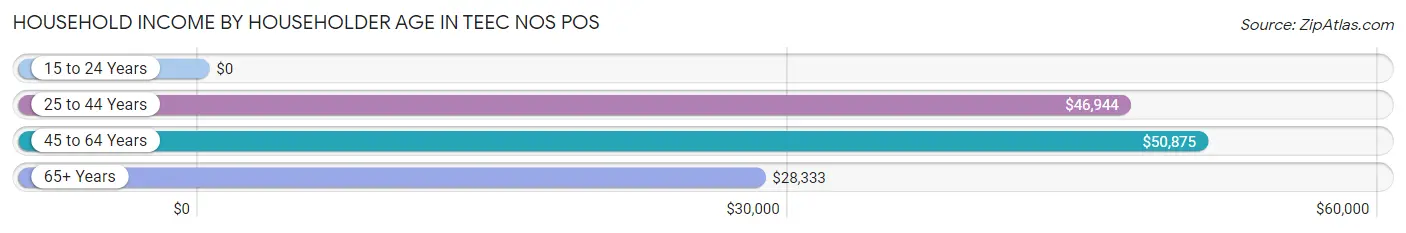
| Income Bracket | # Households | Median Income |
| 15 to 24 Years | 5 (2.3%) | $0 |
| 25 to 44 Years | 48 (21.8%) | $46,944 |
| 45 to 64 Years | 111 (50.4%) | $50,875 |
| 65+ Years | 56 (25.5%) | $28,333 |
| Total | 220 (100.0%) | $41,458 |
Poverty in Teec Nos Pos
Income Below Poverty by Sex and Age in Teec Nos Pos
With 31.3% poverty level for males and 40.6% for females among the residents of Teec Nos Pos, 25 to 34 year old males and 5 year old females are the most vulnerable to poverty, with 34 males (50.0%) and 7 females (100.0%) in their respective age groups living below the poverty level.
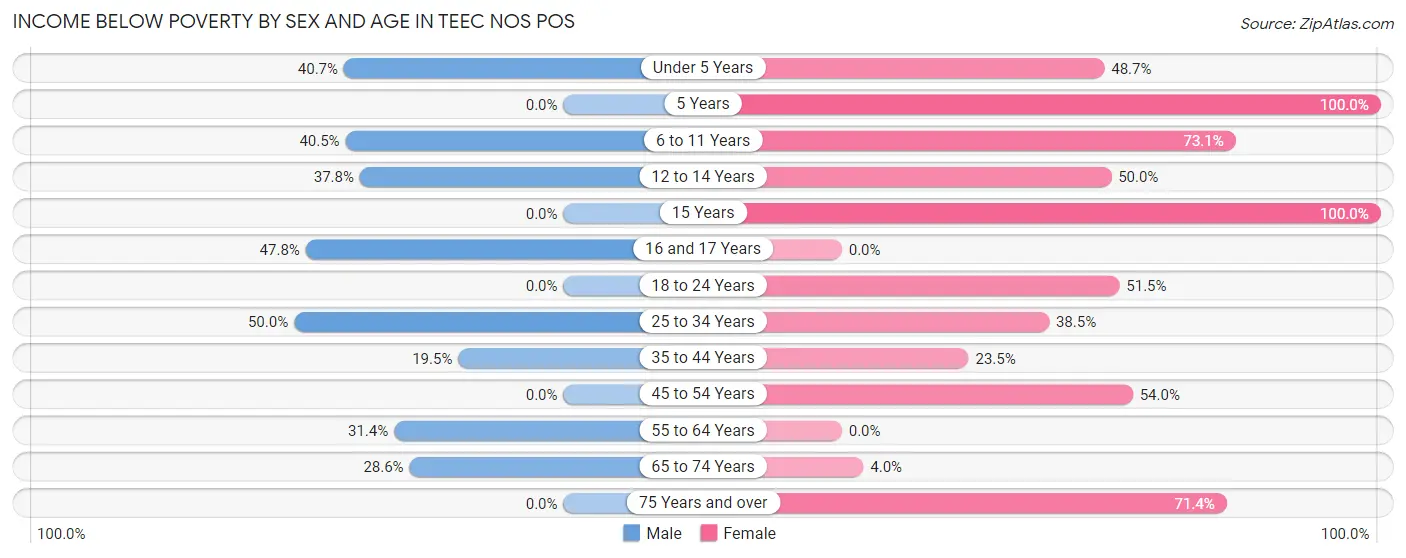
| Age Bracket | Male | Female |
| Under 5 Years | 11 (40.7%) | 38 (48.7%) |
| 5 Years | 0 (0.0%) | 7 (100.0%) |
| 6 to 11 Years | 36 (40.5%) | 19 (73.1%) |
| 12 to 14 Years | 17 (37.8%) | 7 (50.0%) |
| 15 Years | 0 (0.0%) | 6 (100.0%) |
| 16 and 17 Years | 11 (47.8%) | 0 (0.0%) |
| 18 to 24 Years | 0 (0.0%) | 17 (51.5%) |
| 25 to 34 Years | 34 (50.0%) | 35 (38.5%) |
| 35 to 44 Years | 8 (19.5%) | 8 (23.5%) |
| 45 to 54 Years | 0 (0.0%) | 27 (54.0%) |
| 55 to 64 Years | 11 (31.4%) | 0 (0.0%) |
| 65 to 74 Years | 10 (28.6%) | 1 (4.0%) |
| 75 Years and over | 0 (0.0%) | 15 (71.4%) |
| Total | 138 (31.3%) | 180 (40.6%) |
Income Above Poverty by Sex and Age in Teec Nos Pos
According to the poverty statistics in Teec Nos Pos, males aged 18 to 24 years and females aged 16 and 17 years are the age groups that are most secure financially, with 100.0% of males and 100.0% of females in these age groups living above the poverty line.
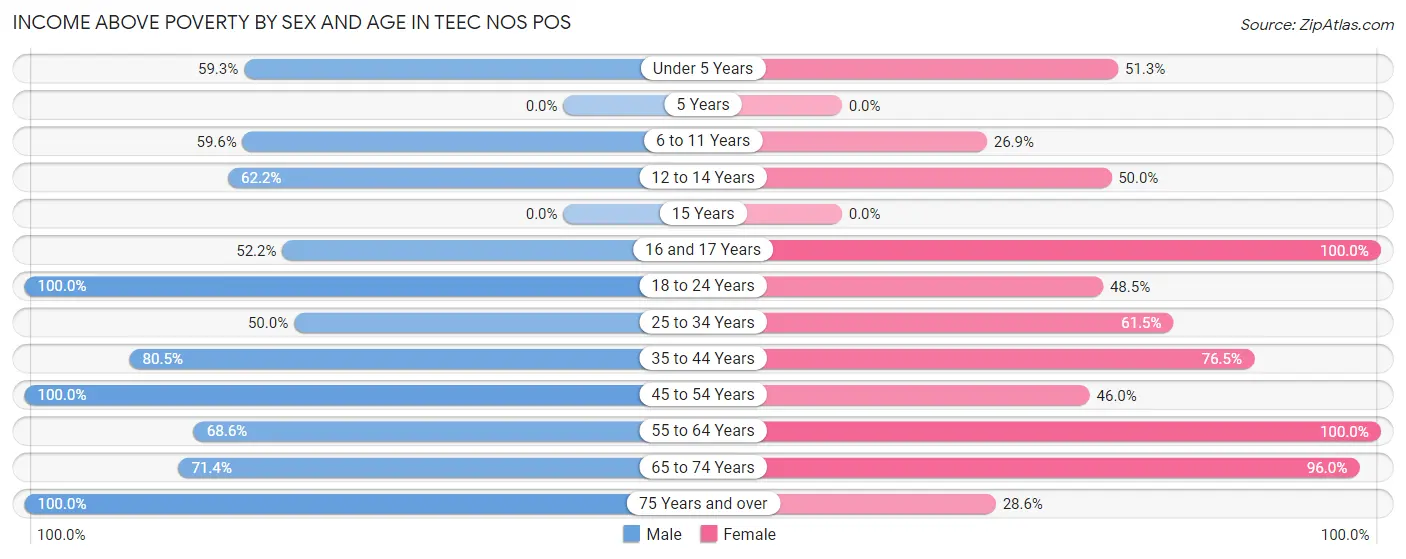
| Age Bracket | Male | Female |
| Under 5 Years | 16 (59.3%) | 40 (51.3%) |
| 5 Years | 0 (0.0%) | 0 (0.0%) |
| 6 to 11 Years | 53 (59.6%) | 7 (26.9%) |
| 12 to 14 Years | 28 (62.2%) | 7 (50.0%) |
| 15 Years | 0 (0.0%) | 0 (0.0%) |
| 16 and 17 Years | 12 (52.2%) | 21 (100.0%) |
| 18 to 24 Years | 33 (100.0%) | 16 (48.5%) |
| 25 to 34 Years | 34 (50.0%) | 56 (61.5%) |
| 35 to 44 Years | 33 (80.5%) | 26 (76.5%) |
| 45 to 54 Years | 27 (100.0%) | 23 (46.0%) |
| 55 to 64 Years | 24 (68.6%) | 37 (100.0%) |
| 65 to 74 Years | 25 (71.4%) | 24 (96.0%) |
| 75 Years and over | 18 (100.0%) | 6 (28.6%) |
| Total | 303 (68.7%) | 263 (59.4%) |
Income Below Poverty Among Married-Couple Families in Teec Nos Pos
The poverty statistics for married-couple families in Teec Nos Pos show that 5.0% or 3 of the total 60 families live below the poverty line. Families with 1 or 2 children have the highest poverty rate of 42.9%, comprising of 3 families. On the other hand, families with no children have the lowest poverty rate of 0.0%, which includes 0 families.
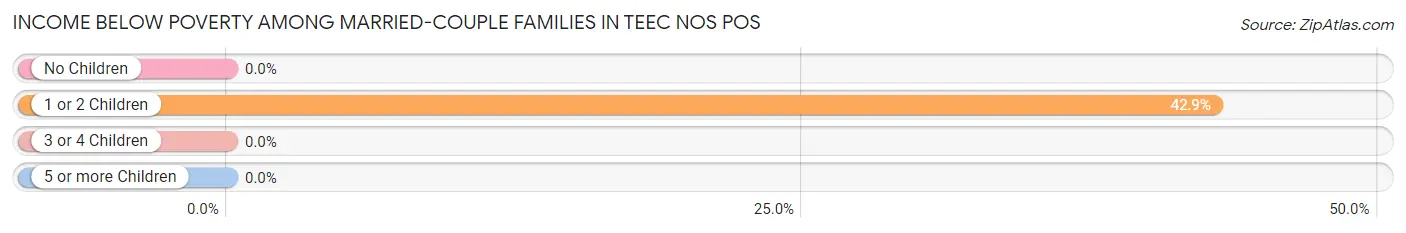
| Children | Above Poverty | Below Poverty |
| No Children | 35 (100.0%) | 0 (0.0%) |
| 1 or 2 Children | 4 (57.1%) | 3 (42.9%) |
| 3 or 4 Children | 18 (100.0%) | 0 (0.0%) |
| 5 or more Children | 0 (0.0%) | 0 (0.0%) |
| Total | 57 (95.0%) | 3 (5.0%) |
Income Below Poverty Among Single-Parent Households in Teec Nos Pos
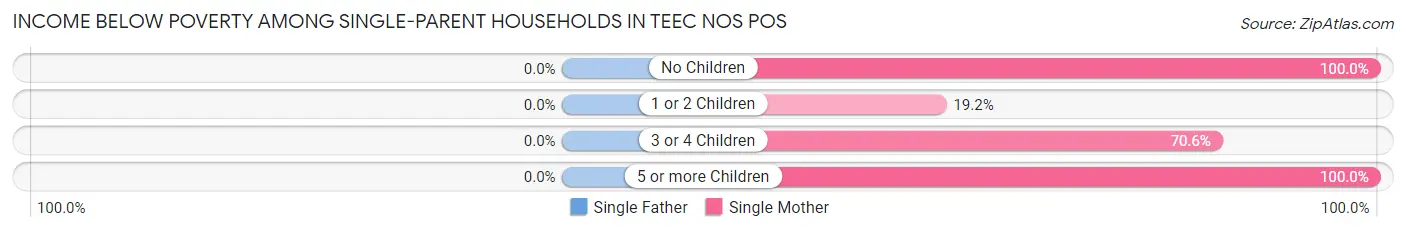
| Children | Single Father | Single Mother |
| No Children | 0 (0.0%) | 7 (100.0%) |
| 1 or 2 Children | 0 (0.0%) | 9 (19.2%) |
| 3 or 4 Children | 0 (0.0%) | 12 (70.6%) |
| 5 or more Children | 0 (0.0%) | 8 (100.0%) |
| Total | 0 (0.0%) | 36 (45.6%) |
Income Below Poverty Among Married-Couple vs Single-Parent Households in Teec Nos Pos
The poverty data for Teec Nos Pos shows that 3 of the married-couple family households (5.0%) and 36 of the single-parent households (33.6%) are living below the poverty level. Within the married-couple family households, those with 1 or 2 children have the highest poverty rate, with 3 households (42.9%) falling below the poverty line. Among the single-parent households, those with 5 or more children have the highest poverty rate, with 8 household (100.0%) living below poverty.
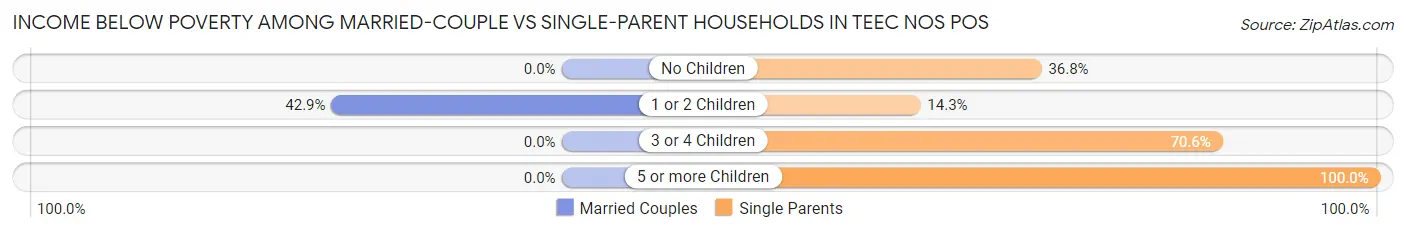
| Children | Married-Couple Families | Single-Parent Households |
| No Children | 0 (0.0%) | 7 (36.8%) |
| 1 or 2 Children | 3 (42.9%) | 9 (14.3%) |
| 3 or 4 Children | 0 (0.0%) | 12 (70.6%) |
| 5 or more Children | 0 (0.0%) | 8 (100.0%) |
| Total | 3 (5.0%) | 36 (33.6%) |
Race in Teec Nos Pos
The most populous races in Teec Nos Pos are , and Native / Alaskan (884 | 100.0%).
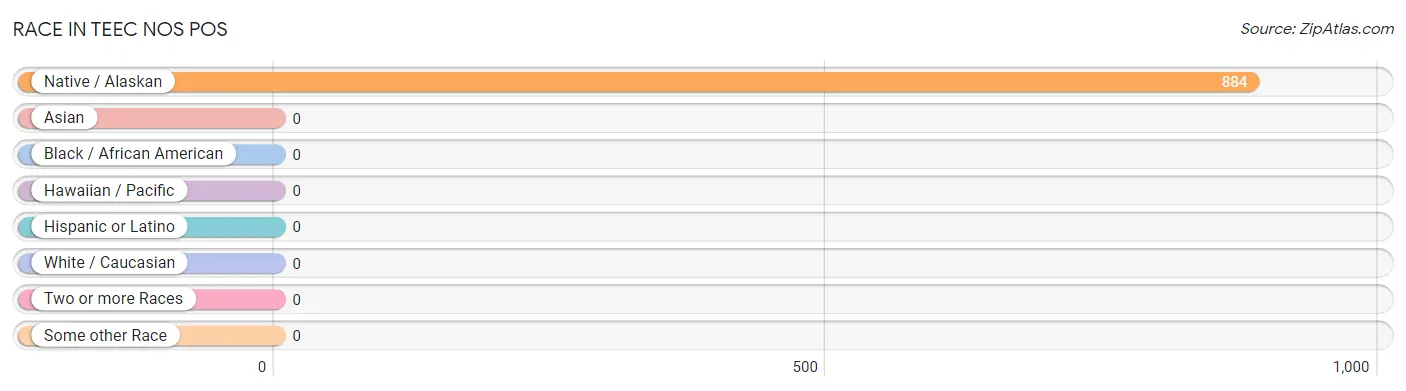
| Race | # Population | % Population |
| Asian | 0 | 0.0% |
| Black / African American | 0 | 0.0% |
| Hawaiian / Pacific | 0 | 0.0% |
| Hispanic or Latino | 0 | 0.0% |
| Native / Alaskan | 884 | 100.0% |
| White / Caucasian | 0 | 0.0% |
| Two or more Races | 0 | 0.0% |
| Some other Race | 0 | 0.0% |
| Total | 884 | 100.0% |
Ancestry in Teec Nos Pos
The most populous ancestries reported in Teec Nos Pos are Navajo (874 | 98.9%), and Hopi (7 | 0.8%), together accounting for 99.7% of all Teec Nos Pos residents.
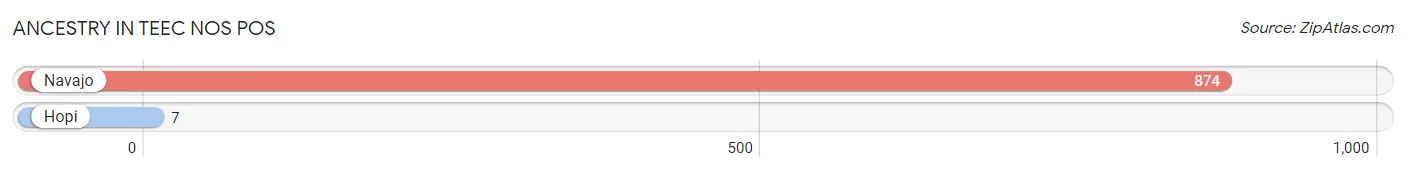
| Ancestry | # Population | % Population |
| Hopi | 7 | 0.8% |
| Navajo | 874 | 98.9% | View All 2 Rows |
Immigrants in Teec Nos Pos

| Immigration Origin | # Population | % Population | View All 0 Rows |
Sex and Age in Teec Nos Pos
Sex and Age in Teec Nos Pos
The most populous age groups in Teec Nos Pos are 10 to 14 Years (76 | 17.2%) for men and Under 5 Years (78 | 17.6%) for women.
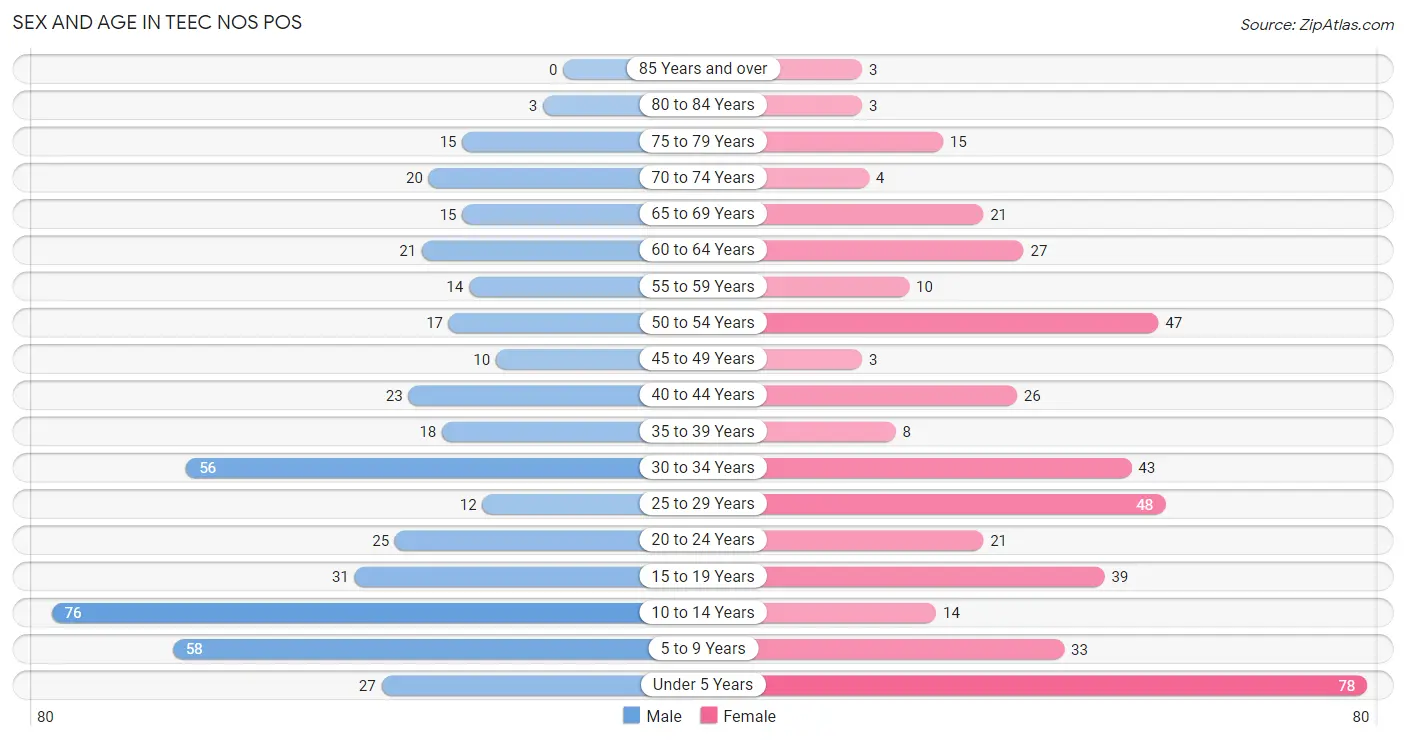
| Age Bracket | Male | Female |
| Under 5 Years | 27 (6.1%) | 78 (17.6%) |
| 5 to 9 Years | 58 (13.2%) | 33 (7.4%) |
| 10 to 14 Years | 76 (17.2%) | 14 (3.2%) |
| 15 to 19 Years | 31 (7.0%) | 39 (8.8%) |
| 20 to 24 Years | 25 (5.7%) | 21 (4.7%) |
| 25 to 29 Years | 12 (2.7%) | 48 (10.8%) |
| 30 to 34 Years | 56 (12.7%) | 43 (9.7%) |
| 35 to 39 Years | 18 (4.1%) | 8 (1.8%) |
| 40 to 44 Years | 23 (5.2%) | 26 (5.9%) |
| 45 to 49 Years | 10 (2.3%) | 3 (0.7%) |
| 50 to 54 Years | 17 (3.8%) | 47 (10.6%) |
| 55 to 59 Years | 14 (3.2%) | 10 (2.3%) |
| 60 to 64 Years | 21 (4.8%) | 27 (6.1%) |
| 65 to 69 Years | 15 (3.4%) | 21 (4.7%) |
| 70 to 74 Years | 20 (4.5%) | 4 (0.9%) |
| 75 to 79 Years | 15 (3.4%) | 15 (3.4%) |
| 80 to 84 Years | 3 (0.7%) | 3 (0.7%) |
| 85 Years and over | 0 (0.0%) | 3 (0.7%) |
| Total | 441 (100.0%) | 443 (100.0%) |
Families and Households in Teec Nos Pos
Median Family Size in Teec Nos Pos
The median family size in Teec Nos Pos is 4.73 persons per family, with single female/mother families (79 | 47.3%) accounting for the largest median family size of 5.9 persons per family. On the other hand, single male/father families (28 | 16.8%) represent the smallest median family size with 3.07 persons per family.
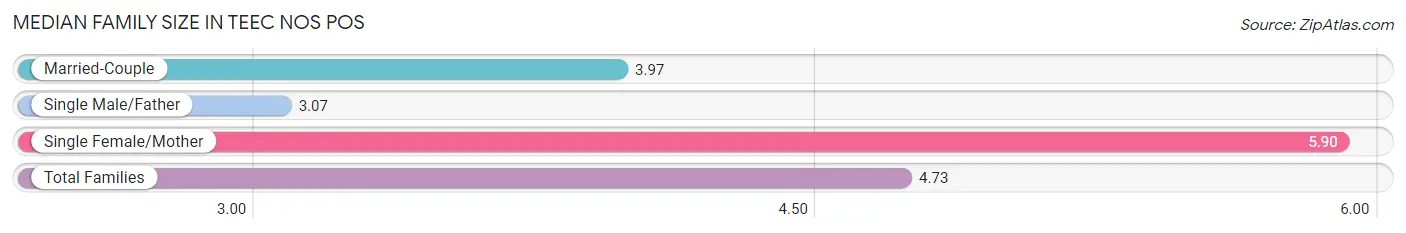
| Family Type | # Families | Family Size |
| Married-Couple | 60 (35.9%) | 3.97 |
| Single Male/Father | 28 (16.8%) | 3.07 |
| Single Female/Mother | 79 (47.3%) | 5.90 |
| Total Families | 167 (100.0%) | 4.73 |
Median Household Size in Teec Nos Pos
The median household size in Teec Nos Pos is 4.02 persons per household, with single female/mother households (79 | 35.9%) accounting for the largest median household size of 6.33 persons per household. non-family households (53 | 24.1%) represent the smallest median household size with 1.02 persons per household.
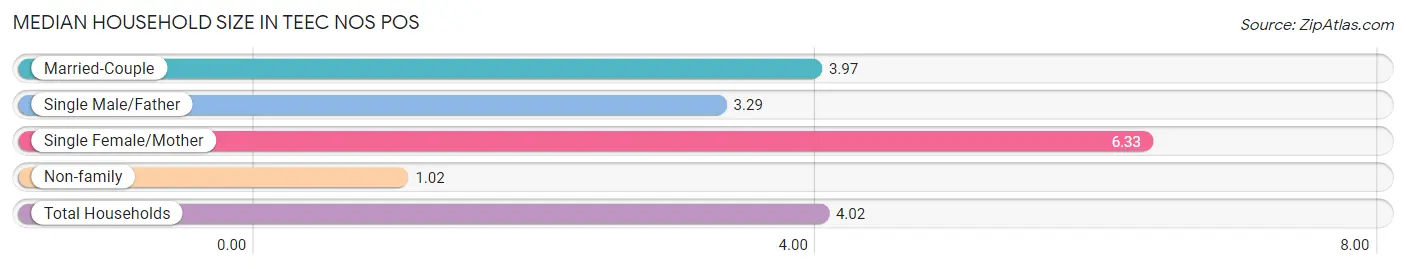
| Household Type | # Households | Household Size |
| Married-Couple | 60 (27.3%) | 3.97 |
| Single Male/Father | 28 (12.7%) | 3.29 |
| Single Female/Mother | 79 (35.9%) | 6.33 |
| Non-family | 53 (24.1%) | 1.02 |
| Total Households | 220 (100.0%) | 4.02 |
Household Size by Marriage Status in Teec Nos Pos
Out of a total of 220 households in Teec Nos Pos, 167 (75.9%) are family households, while 53 (24.1%) are nonfamily households. The most numerous type of family households are 2-person households, comprising 62, and the most common type of nonfamily households are 1-person households, comprising 52.
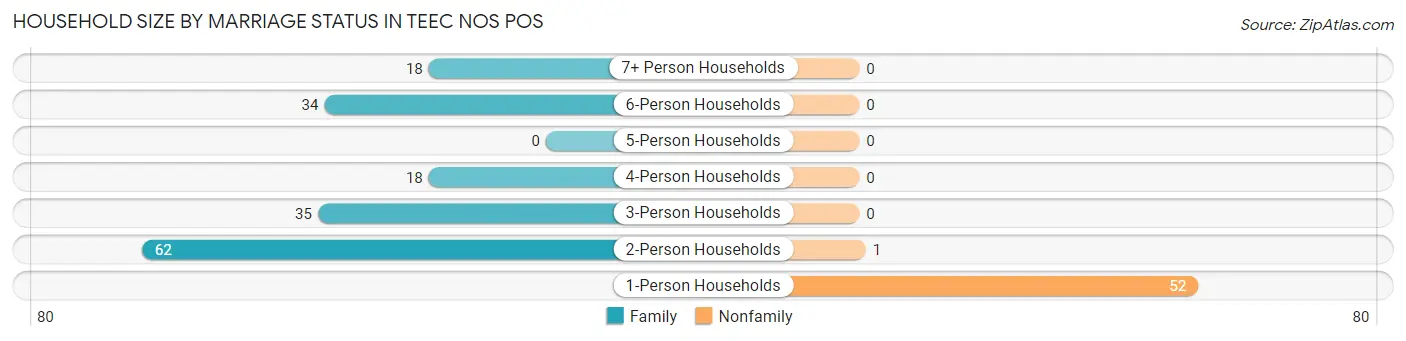
| Household Size | Family Households | Nonfamily Households |
| 1-Person Households | - | 52 (23.6%) |
| 2-Person Households | 62 (28.2%) | 1 (0.4%) |
| 3-Person Households | 35 (15.9%) | 0 (0.0%) |
| 4-Person Households | 18 (8.2%) | 0 (0.0%) |
| 5-Person Households | 0 (0.0%) | 0 (0.0%) |
| 6-Person Households | 34 (15.4%) | 0 (0.0%) |
| 7+ Person Households | 18 (8.2%) | 0 (0.0%) |
| Total | 167 (75.9%) | 53 (24.1%) |
Female Fertility in Teec Nos Pos
Fertility by Age in Teec Nos Pos
Average fertility rate in Teec Nos Pos is 36.0 births per 1,000 women. Women in the age bracket of 20 to 34 years have the highest fertility rate with 63.0 births per 1,000 women. Women in the age bracket of 20 to 34 years acount for 100.0% of all women with births.
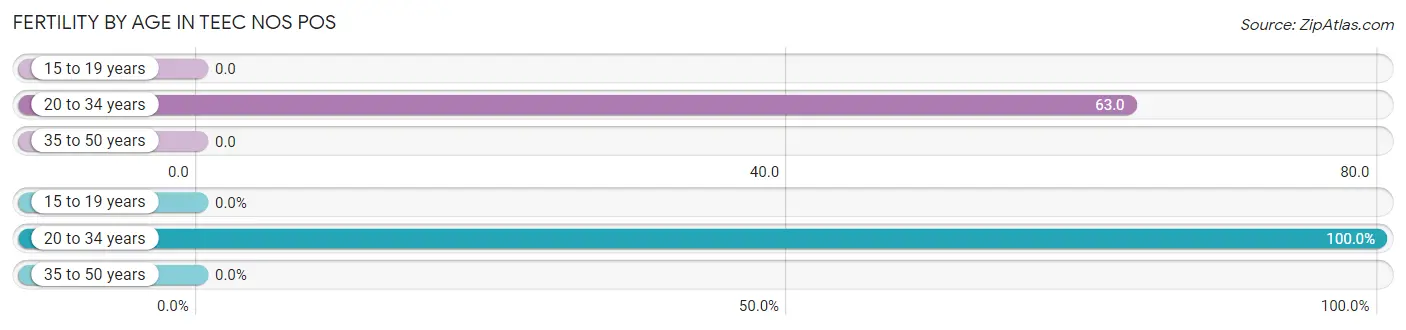
| Age Bracket | Women with Births | Births / 1,000 Women |
| 15 to 19 years | 0 (0.0%) | 0.0 |
| 20 to 34 years | 7 (100.0%) | 63.0 |
| 35 to 50 years | 0 (0.0%) | 0.0 |
| Total | 7 (100.0%) | 36.0 |
Fertility by Age by Marriage Status in Teec Nos Pos
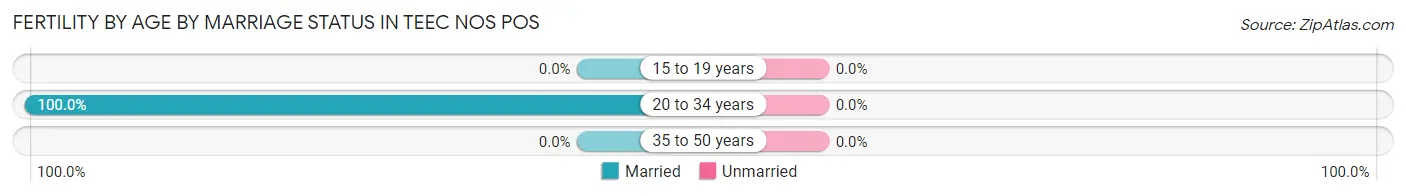
| Age Bracket | Married | Unmarried |
| 15 to 19 years | 0 (0.0%) | 0 (0.0%) |
| 20 to 34 years | 7 (100.0%) | 0 (0.0%) |
| 35 to 50 years | 0 (0.0%) | 0 (0.0%) |
| Total | 7 (100.0%) | 0 (0.0%) |
Fertility by Education in Teec Nos Pos
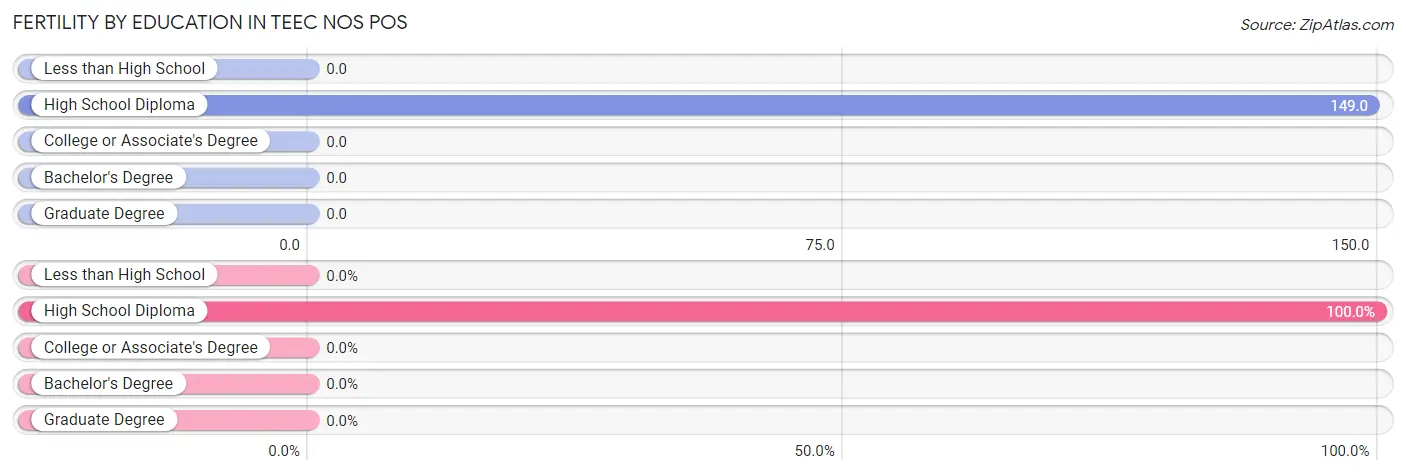
| Educational Attainment | Women with Births | Births / 1,000 Women |
| Less than High School | 0 (0.0%) | 0.0 |
| High School Diploma | 7 (100.0%) | 149.0 |
| College or Associate's Degree | 0 (0.0%) | 0.0 |
| Bachelor's Degree | 0 (0.0%) | 0.0 |
| Graduate Degree | 0 (0.0%) | 0.0 |
| Total | 7 (100.0%) | 36.0 |
Fertility by Education by Marriage Status in Teec Nos Pos
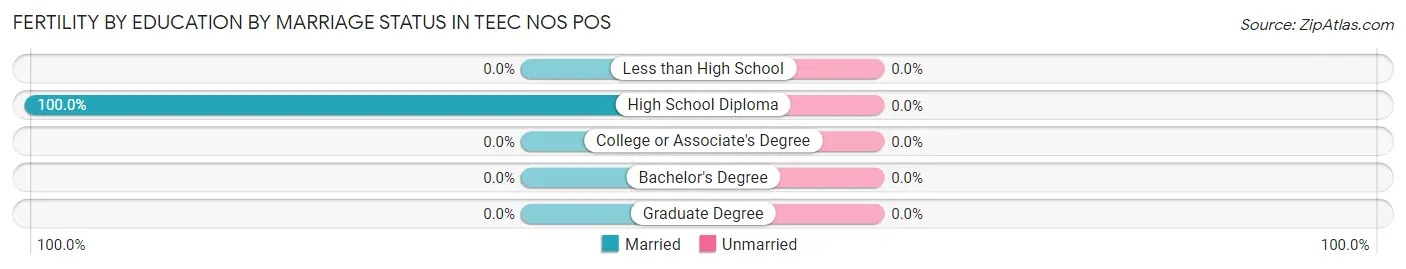
| Educational Attainment | Married | Unmarried |
| Less than High School | 0 (0.0%) | 0 (0.0%) |
| High School Diploma | 7 (100.0%) | 0 (0.0%) |
| College or Associate's Degree | 0 (0.0%) | 0 (0.0%) |
| Bachelor's Degree | 0 (0.0%) | 0 (0.0%) |
| Graduate Degree | 0 (0.0%) | 0 (0.0%) |
| Total | 7 (100.0%) | 0 (0.0%) |
Employment Characteristics in Teec Nos Pos
Employment by Class of Employer in Teec Nos Pos
Among the 207 employed individuals in Teec Nos Pos, private company employees (90 | 43.5%), federal government employees (50 | 24.1%), and local government employees (31 | 15.0%) make up the most common classes of employment.
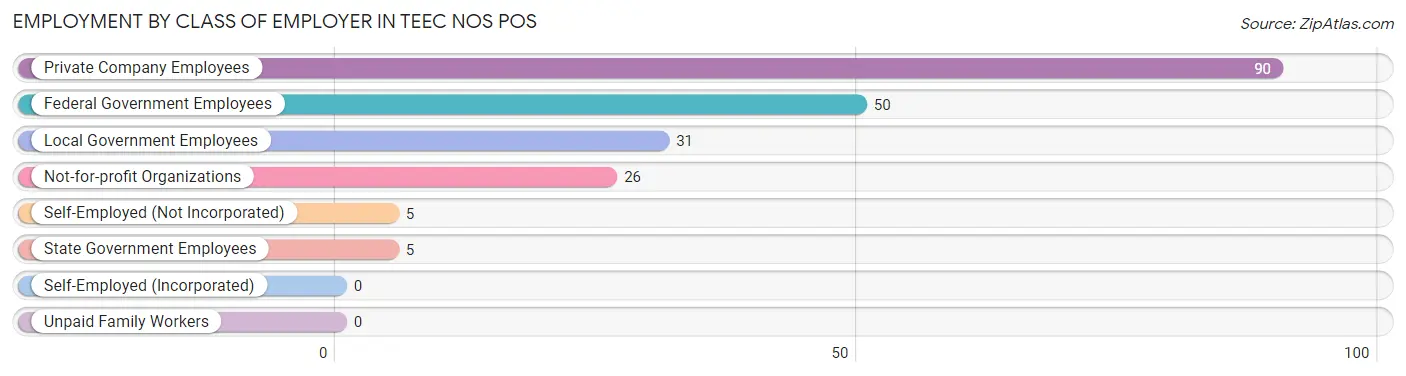
| Employer Class | # Employees | % Employees |
| Private Company Employees | 90 | 43.5% |
| Self-Employed (Incorporated) | 0 | 0.0% |
| Self-Employed (Not Incorporated) | 5 | 2.4% |
| Not-for-profit Organizations | 26 | 12.6% |
| Local Government Employees | 31 | 15.0% |
| State Government Employees | 5 | 2.4% |
| Federal Government Employees | 50 | 24.1% |
| Unpaid Family Workers | 0 | 0.0% |
| Total | 207 | 100.0% |
Employment Status by Age in Teec Nos Pos
According to the labor force statistics for Teec Nos Pos, out of the total population over 16 years of age (592), 48.0% or 284 individuals are in the labor force, with 27.1% or 77 of them unemployed. The age group with the highest labor force participation rate is 35 to 44 years, with 72.0% or 54 individuals in the labor force. Within the labor force, the 25 to 29 years age range has the highest percentage of unemployed individuals, with 100.0% or 34 of them being unemployed.
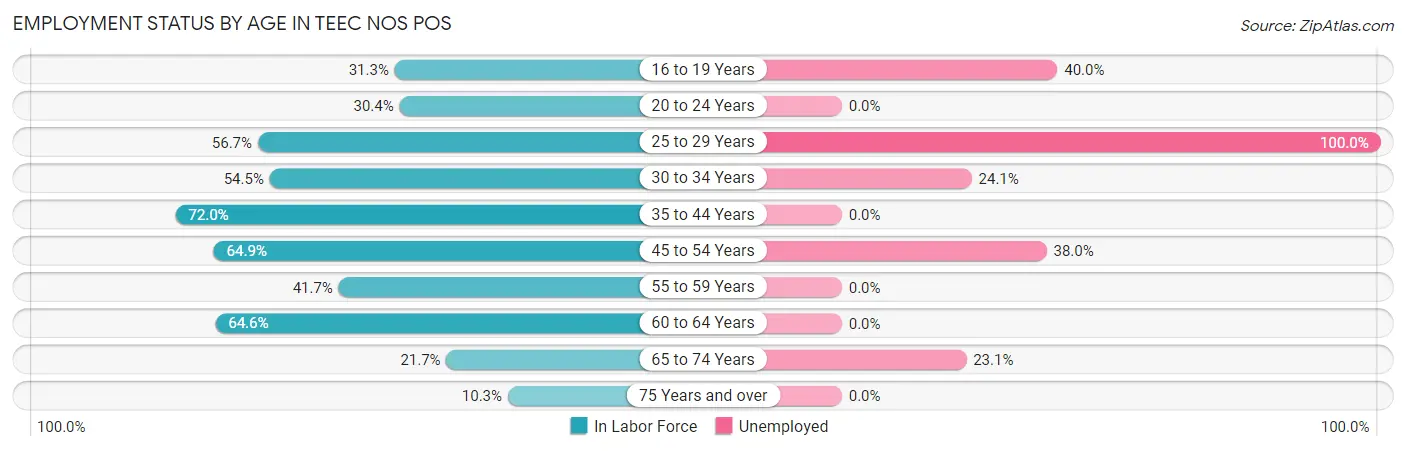
| Age Bracket | In Labor Force | Unemployed |
| 16 to 19 Years | 20 (31.3%) | 8 (40.0%) |
| 20 to 24 Years | 14 (30.4%) | 0 (0.0%) |
| 25 to 29 Years | 34 (56.7%) | 34 (100.0%) |
| 30 to 34 Years | 54 (54.5%) | 13 (24.1%) |
| 35 to 44 Years | 54 (72.0%) | 0 (0.0%) |
| 45 to 54 Years | 50 (64.9%) | 19 (38.0%) |
| 55 to 59 Years | 10 (41.7%) | 0 (0.0%) |
| 60 to 64 Years | 31 (64.6%) | 0 (0.0%) |
| 65 to 74 Years | 13 (21.7%) | 3 (23.1%) |
| 75 Years and over | 4 (10.3%) | 0 (0.0%) |
| Total | 284 (48.0%) | 77 (27.1%) |
Employment Status by Educational Attainment in Teec Nos Pos
According to labor force statistics for Teec Nos Pos, 60.8% of individuals (233) out of the total population between 25 and 64 years of age (383) are in the labor force, with 28.3% or 66 of them being unemployed. The group with the highest labor force participation rate are those with the educational attainment of bachelor's degree or higher, with 80.8% or 21 individuals in the labor force. Within the labor force, individuals with college / associate degree education have the highest percentage of unemployment, with 33.9% or 41 of them being unemployed.
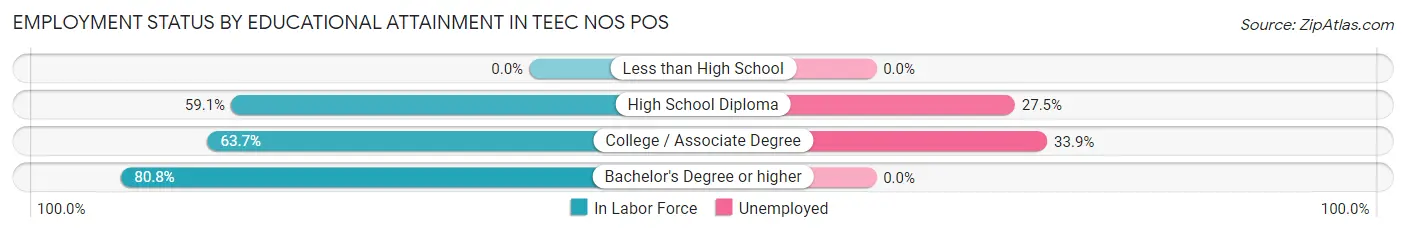
| Educational Attainment | In Labor Force | Unemployed |
| Less than High School | 0 (0.0%) | 0 (0.0%) |
| High School Diploma | 91 (59.1%) | 42 (27.5%) |
| College / Associate Degree | 121 (63.7%) | 64 (33.9%) |
| Bachelor's Degree or higher | 21 (80.8%) | 0 (0.0%) |
| Total | 233 (60.8%) | 108 (28.3%) |
Employment Occupations by Sex in Teec Nos Pos
Management, Business, Science and Arts Occupations
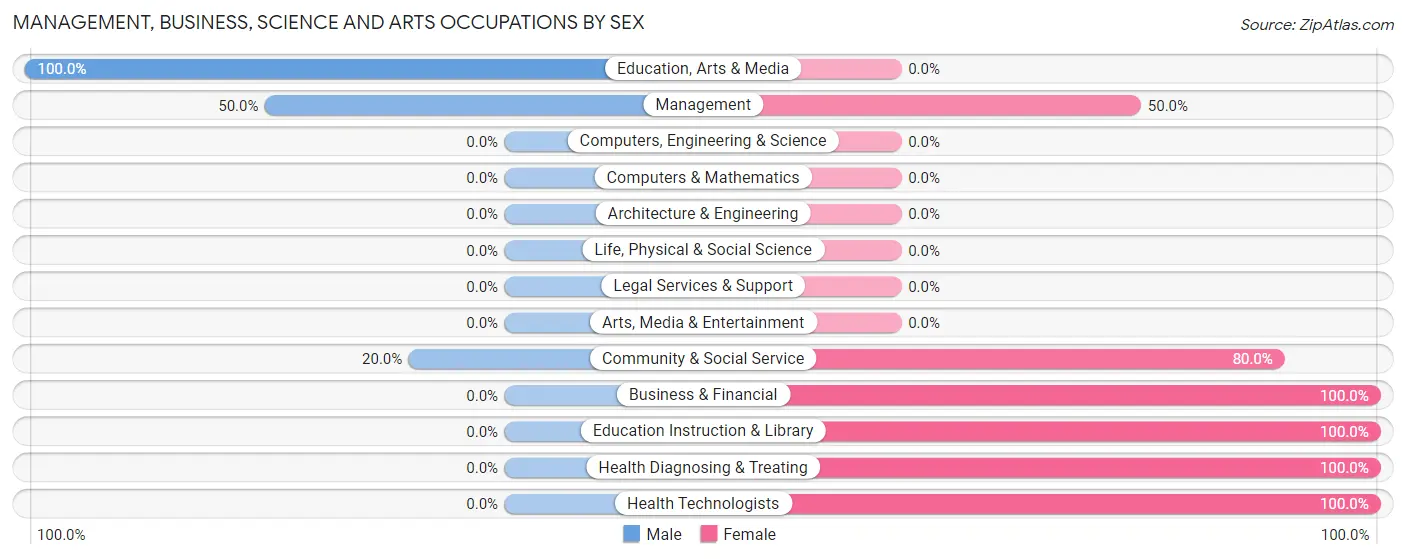
The most common Management, Business, Science and Arts occupations in Teec Nos Pos are Community & Social Service (20 | 9.7%), Education Instruction & Library (16 | 7.7%), Management (10 | 4.8%), Health Diagnosing & Treating (9 | 4.3%), and Health Technologists (6 | 2.9%).
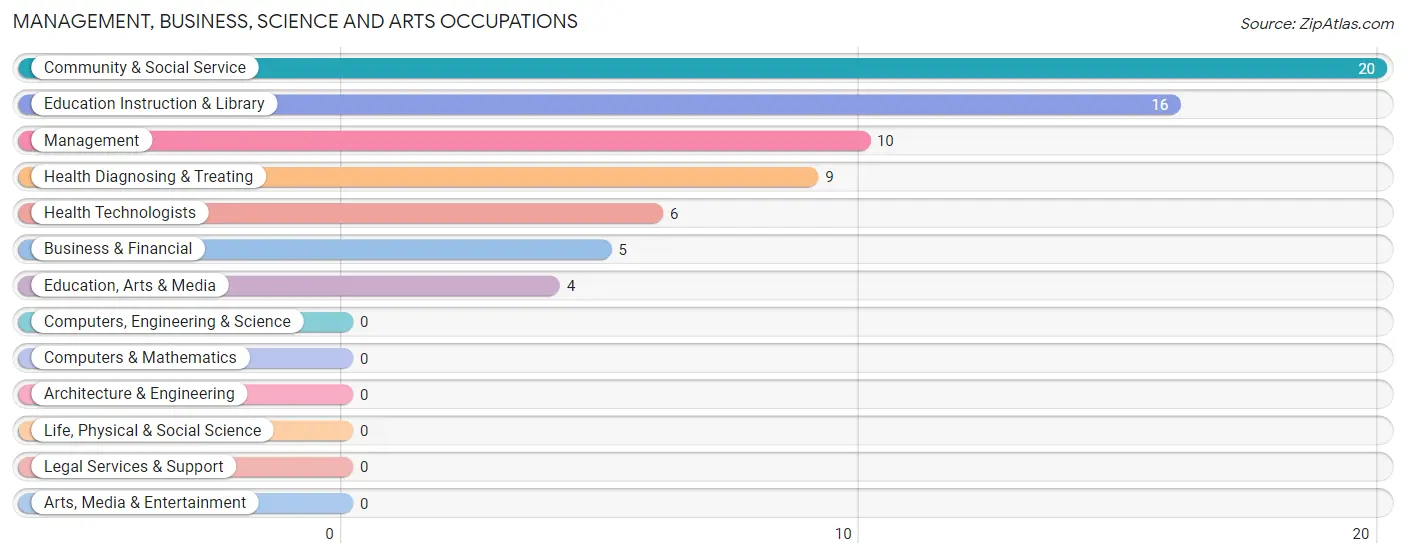
Management, Business, Science and Arts Occupations by Sex
Within the Management, Business, Science and Arts occupations in Teec Nos Pos, the most male-oriented occupations are Education, Arts & Media (100.0%), Management (50.0%), and Community & Social Service (20.0%), while the most female-oriented occupations are Business & Financial (100.0%), Education Instruction & Library (100.0%), and Health Diagnosing & Treating (100.0%).
| Occupation | Male | Female |
| Management | 5 (50.0%) | 5 (50.0%) |
| Business & Financial | 0 (0.0%) | 5 (100.0%) |
| Computers, Engineering & Science | 0 (0.0%) | 0 (0.0%) |
| Computers & Mathematics | 0 (0.0%) | 0 (0.0%) |
| Architecture & Engineering | 0 (0.0%) | 0 (0.0%) |
| Life, Physical & Social Science | 0 (0.0%) | 0 (0.0%) |
| Community & Social Service | 4 (20.0%) | 16 (80.0%) |
| Education, Arts & Media | 4 (100.0%) | 0 (0.0%) |
| Legal Services & Support | 0 (0.0%) | 0 (0.0%) |
| Education Instruction & Library | 0 (0.0%) | 16 (100.0%) |
| Arts, Media & Entertainment | 0 (0.0%) | 0 (0.0%) |
| Health Diagnosing & Treating | 0 (0.0%) | 9 (100.0%) |
| Health Technologists | 0 (0.0%) | 6 (100.0%) |
| Total (Category) | 9 (20.4%) | 35 (79.5%) |
| Total (Overall) | 85 (41.1%) | 122 (58.9%) |
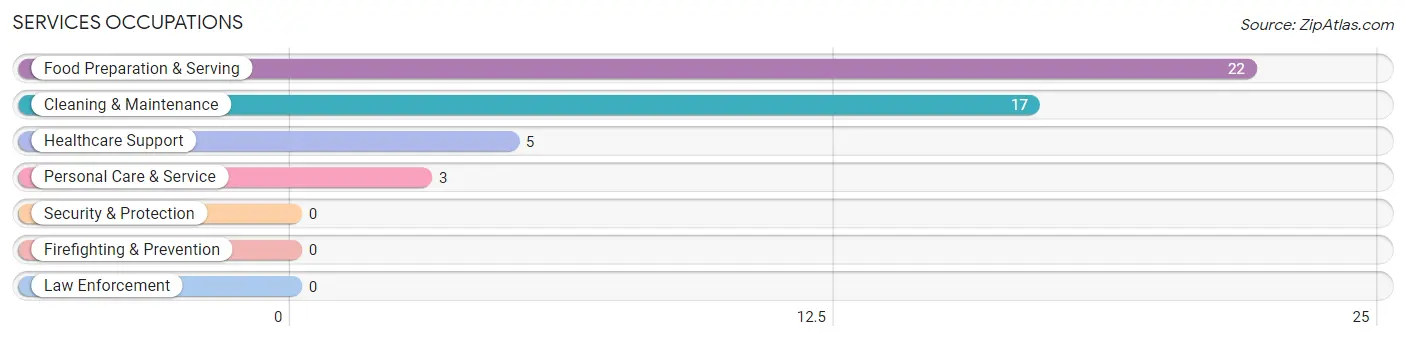
Services Occupations
The most common Services occupations in Teec Nos Pos are Food Preparation & Serving (22 | 10.6%), Cleaning & Maintenance (17 | 8.2%), Healthcare Support (5 | 2.4%), and Personal Care & Service (3 | 1.5%).
Services Occupations by Sex
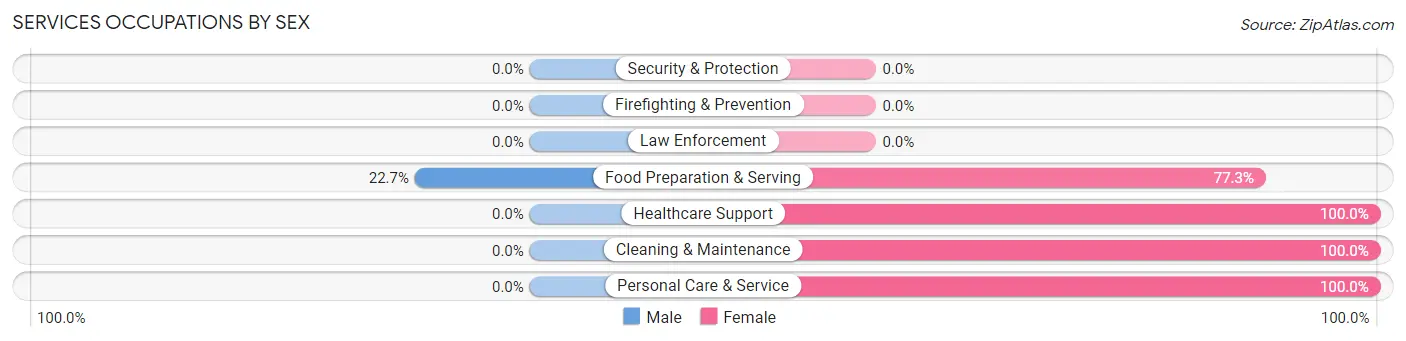
| Occupation | Male | Female |
| Healthcare Support | 0 (0.0%) | 5 (100.0%) |
| Security & Protection | 0 (0.0%) | 0 (0.0%) |
| Firefighting & Prevention | 0 (0.0%) | 0 (0.0%) |
| Law Enforcement | 0 (0.0%) | 0 (0.0%) |
| Food Preparation & Serving | 5 (22.7%) | 17 (77.3%) |
| Cleaning & Maintenance | 0 (0.0%) | 17 (100.0%) |
| Personal Care & Service | 0 (0.0%) | 3 (100.0%) |
| Total (Category) | 5 (10.6%) | 42 (89.4%) |
| Total (Overall) | 85 (41.1%) | 122 (58.9%) |
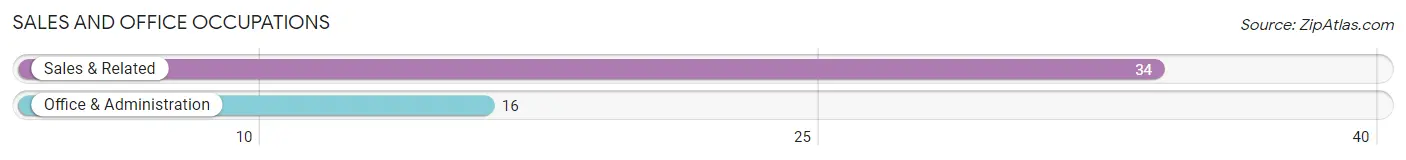
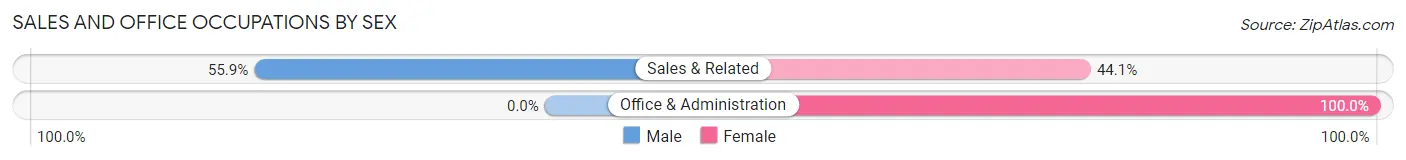
Sales and Office Occupations
The most common Sales and Office occupations in Teec Nos Pos are Sales & Related (34 | 16.4%), and Office & Administration (16 | 7.7%).
Sales and Office Occupations by Sex
| Occupation | Male | Female |
| Sales & Related | 19 (55.9%) | 15 (44.1%) |
| Office & Administration | 0 (0.0%) | 16 (100.0%) |
| Total (Category) | 19 (38.0%) | 31 (62.0%) |
| Total (Overall) | 85 (41.1%) | 122 (58.9%) |
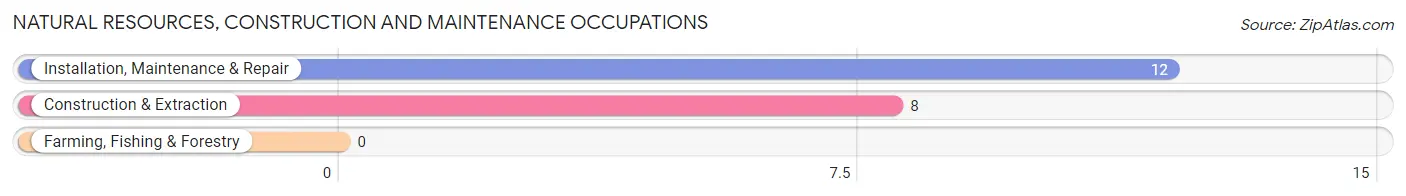
Natural Resources, Construction and Maintenance Occupations
The most common Natural Resources, Construction and Maintenance occupations in Teec Nos Pos are Installation, Maintenance & Repair (12 | 5.8%), and Construction & Extraction (8 | 3.9%).
Natural Resources, Construction and Maintenance Occupations by Sex
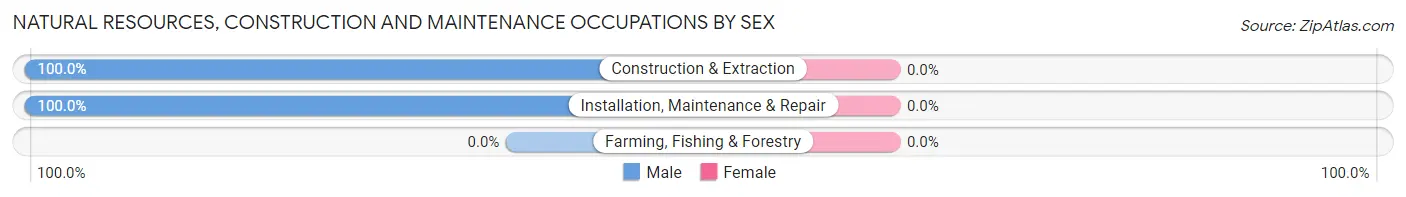
| Occupation | Male | Female |
| Farming, Fishing & Forestry | 0 (0.0%) | 0 (0.0%) |
| Construction & Extraction | 8 (100.0%) | 0 (0.0%) |
| Installation, Maintenance & Repair | 12 (100.0%) | 0 (0.0%) |
| Total (Category) | 20 (100.0%) | 0 (0.0%) |
| Total (Overall) | 85 (41.1%) | 122 (58.9%) |
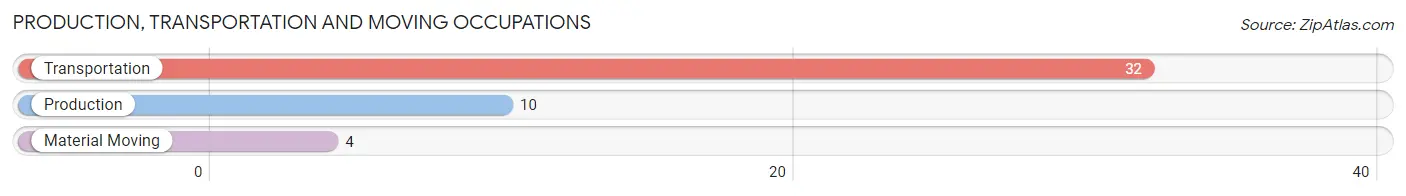
Production, Transportation and Moving Occupations
The most common Production, Transportation and Moving occupations in Teec Nos Pos are Transportation (32 | 15.5%), Production (10 | 4.8%), and Material Moving (4 | 1.9%).
Production, Transportation and Moving Occupations by Sex
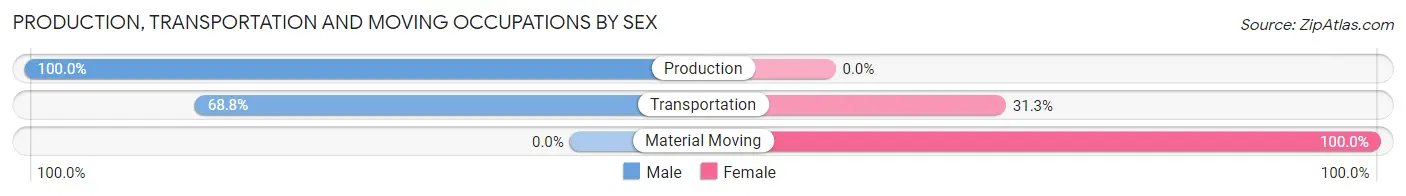
| Occupation | Male | Female |
| Production | 10 (100.0%) | 0 (0.0%) |
| Transportation | 22 (68.8%) | 10 (31.2%) |
| Material Moving | 0 (0.0%) | 4 (100.0%) |
| Total (Category) | 32 (69.6%) | 14 (30.4%) |
| Total (Overall) | 85 (41.1%) | 122 (58.9%) |
Employment Industries by Sex in Teec Nos Pos
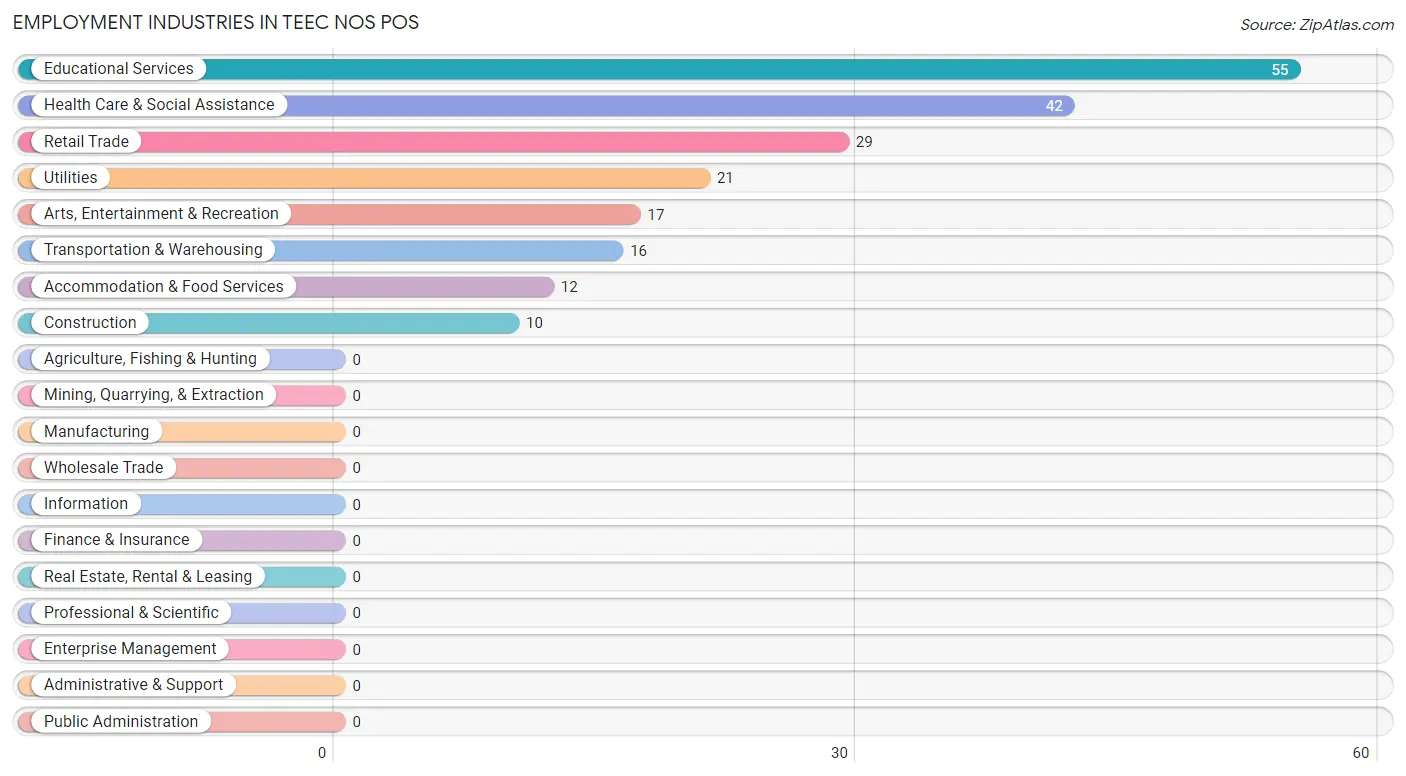
Employment Industries in Teec Nos Pos
The major employment industries in Teec Nos Pos include Educational Services (55 | 26.6%), Health Care & Social Assistance (42 | 20.3%), Retail Trade (29 | 14.0%), Utilities (21 | 10.1%), and Arts, Entertainment & Recreation (17 | 8.2%).
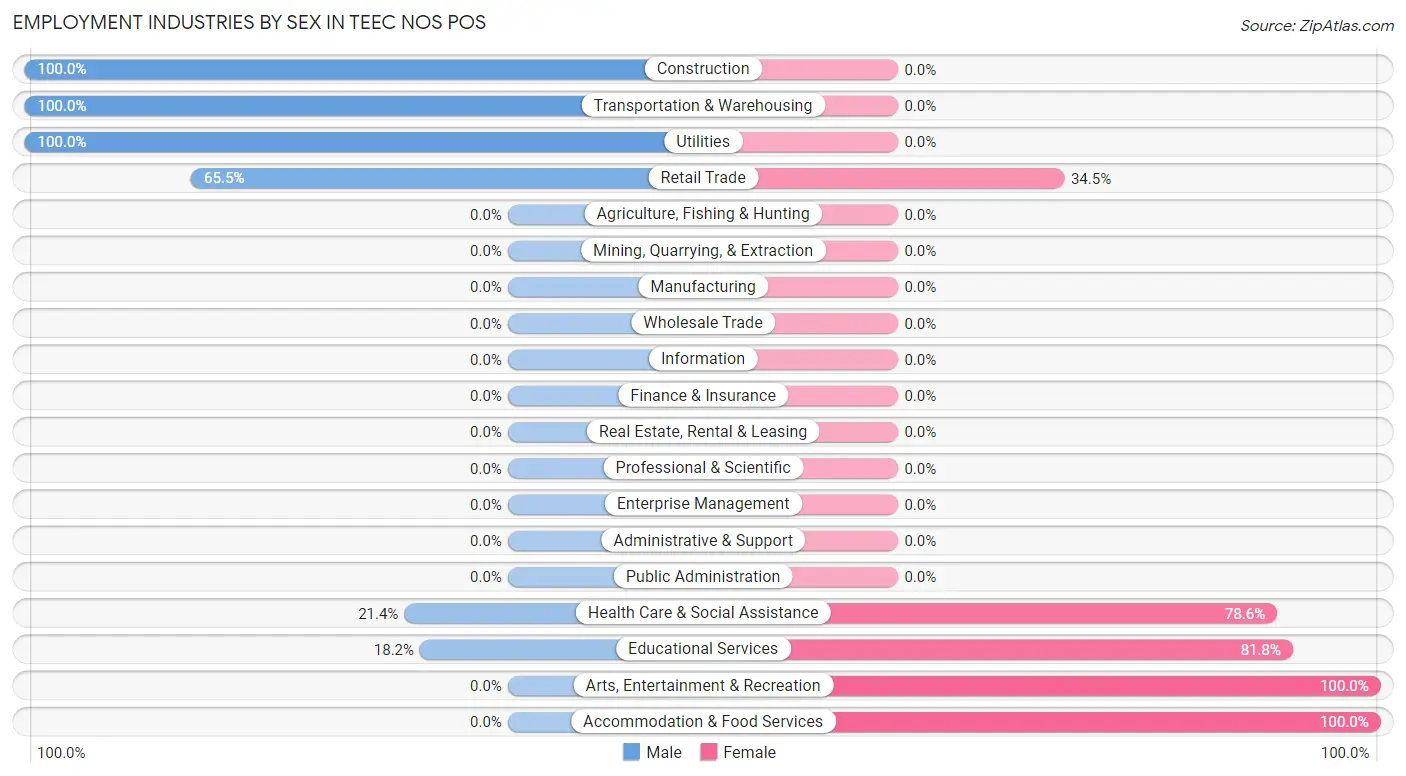
Employment Industries by Sex in Teec Nos Pos
The Teec Nos Pos industries that see more men than women are Construction (100.0%), Transportation & Warehousing (100.0%), and Utilities (100.0%), whereas the industries that tend to have a higher number of women are Arts, Entertainment & Recreation (100.0%), Accommodation & Food Services (100.0%), and Educational Services (81.8%).
| Industry | Male | Female |
| Agriculture, Fishing & Hunting | 0 (0.0%) | 0 (0.0%) |
| Mining, Quarrying, & Extraction | 0 (0.0%) | 0 (0.0%) |
| Construction | 10 (100.0%) | 0 (0.0%) |
| Manufacturing | 0 (0.0%) | 0 (0.0%) |
| Wholesale Trade | 0 (0.0%) | 0 (0.0%) |
| Retail Trade | 19 (65.5%) | 10 (34.5%) |
| Transportation & Warehousing | 16 (100.0%) | 0 (0.0%) |
| Utilities | 21 (100.0%) | 0 (0.0%) |
| Information | 0 (0.0%) | 0 (0.0%) |
| Finance & Insurance | 0 (0.0%) | 0 (0.0%) |
| Real Estate, Rental & Leasing | 0 (0.0%) | 0 (0.0%) |
| Professional & Scientific | 0 (0.0%) | 0 (0.0%) |
| Enterprise Management | 0 (0.0%) | 0 (0.0%) |
| Administrative & Support | 0 (0.0%) | 0 (0.0%) |
| Educational Services | 10 (18.2%) | 45 (81.8%) |
| Health Care & Social Assistance | 9 (21.4%) | 33 (78.6%) |
| Arts, Entertainment & Recreation | 0 (0.0%) | 17 (100.0%) |
| Accommodation & Food Services | 0 (0.0%) | 12 (100.0%) |
| Public Administration | 0 (0.0%) | 0 (0.0%) |
| Total | 85 (41.1%) | 122 (58.9%) |
Education in Teec Nos Pos
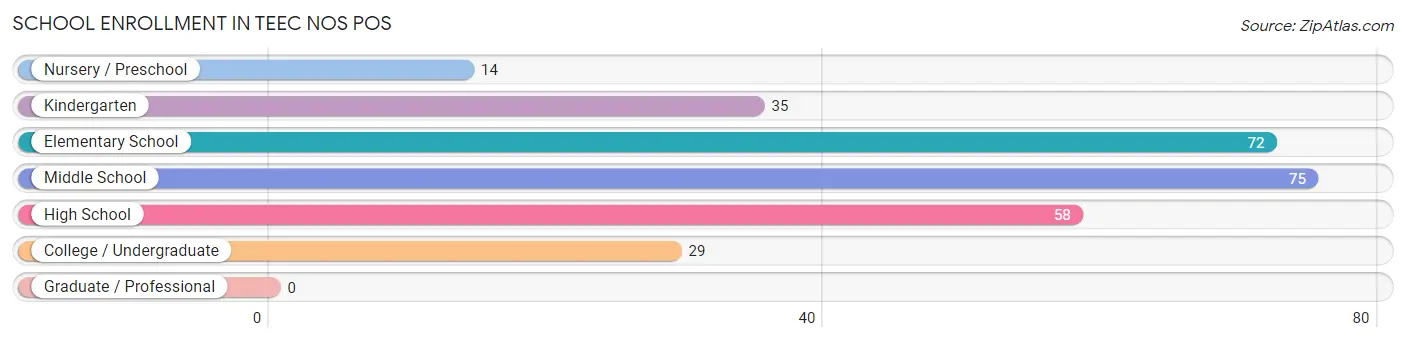
School Enrollment in Teec Nos Pos
The most common levels of schooling among the 283 students in Teec Nos Pos are middle school (75 | 26.5%), elementary school (72 | 25.4%), and high school (58 | 20.5%).
| School Level | # Students | % Students |
| Nursery / Preschool | 14 | 5.0% |
| Kindergarten | 35 | 12.4% |
| Elementary School | 72 | 25.4% |
| Middle School | 75 | 26.5% |
| High School | 58 | 20.5% |
| College / Undergraduate | 29 | 10.2% |
| Graduate / Professional | 0 | 0.0% |
| Total | 283 | 100.0% |
School Enrollment by Age by Funding Source in Teec Nos Pos
Out of a total of 283 students who are enrolled in schools in Teec Nos Pos, 8 (2.8%) attend a private institution, while the remaining 275 (97.2%) are enrolled in public schools. The age group of 5 to 9 year old has the highest likelihood of being enrolled in private schools, with 8 (9.6% in the age bracket) enrolled. Conversely, the age group of 3 to 4 year olds has the lowest likelihood of being enrolled in a private school, with 31 (100.0% in the age bracket) attending a public institution.
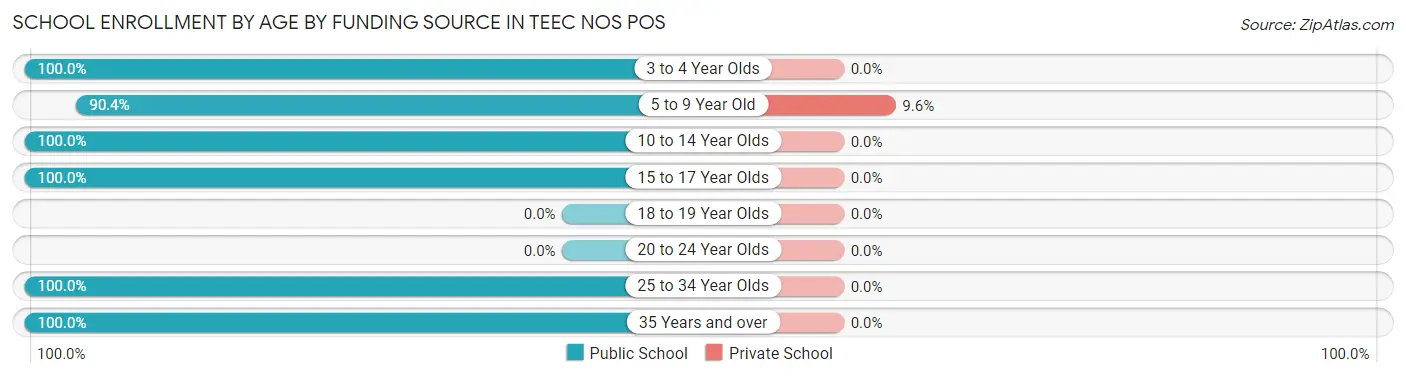
| Age Bracket | Public School | Private School |
| 3 to 4 Year Olds | 31 (100.0%) | 0 (0.0%) |
| 5 to 9 Year Old | 75 (90.4%) | 8 (9.6%) |
| 10 to 14 Year Olds | 90 (100.0%) | 0 (0.0%) |
| 15 to 17 Year Olds | 50 (100.0%) | 0 (0.0%) |
| 18 to 19 Year Olds | 0 (0.0%) | 0 (0.0%) |
| 20 to 24 Year Olds | 0 (0.0%) | 0 (0.0%) |
| 25 to 34 Year Olds | 23 (100.0%) | 0 (0.0%) |
| 35 Years and over | 6 (100.0%) | 0 (0.0%) |
| Total | 275 (97.2%) | 8 (2.8%) |
Educational Attainment by Field of Study in Teec Nos Pos
Science & technology (17 | 40.5%), education (13 | 30.9%), psychology (4 | 9.5%), arts & humanities (4 | 9.5%), and business (3 | 7.1%) are the most common fields of study among 42 individuals in Teec Nos Pos who have obtained a bachelor's degree or higher.
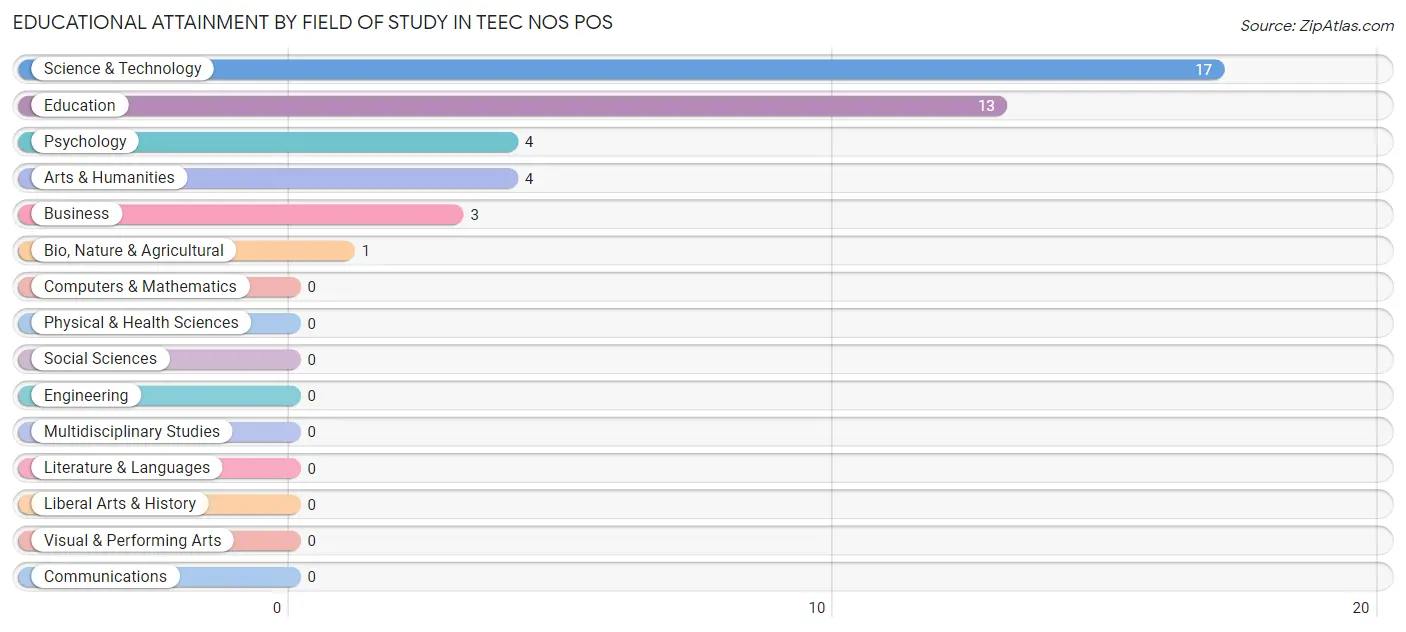
| Field of Study | # Graduates | % Graduates |
| Computers & Mathematics | 0 | 0.0% |
| Bio, Nature & Agricultural | 1 | 2.4% |
| Physical & Health Sciences | 0 | 0.0% |
| Psychology | 4 | 9.5% |
| Social Sciences | 0 | 0.0% |
| Engineering | 0 | 0.0% |
| Multidisciplinary Studies | 0 | 0.0% |
| Science & Technology | 17 | 40.5% |
| Business | 3 | 7.1% |
| Education | 13 | 30.9% |
| Literature & Languages | 0 | 0.0% |
| Liberal Arts & History | 0 | 0.0% |
| Visual & Performing Arts | 0 | 0.0% |
| Communications | 0 | 0.0% |
| Arts & Humanities | 4 | 9.5% |
| Total | 42 | 100.0% |
Transportation & Commute in Teec Nos Pos
Vehicle Availability by Sex in Teec Nos Pos
The most prevalent vehicle ownership categories in Teec Nos Pos are males with 2 vehicles (30, accounting for 35.3%) and females with 2 vehicles (33, making up 24.6%).
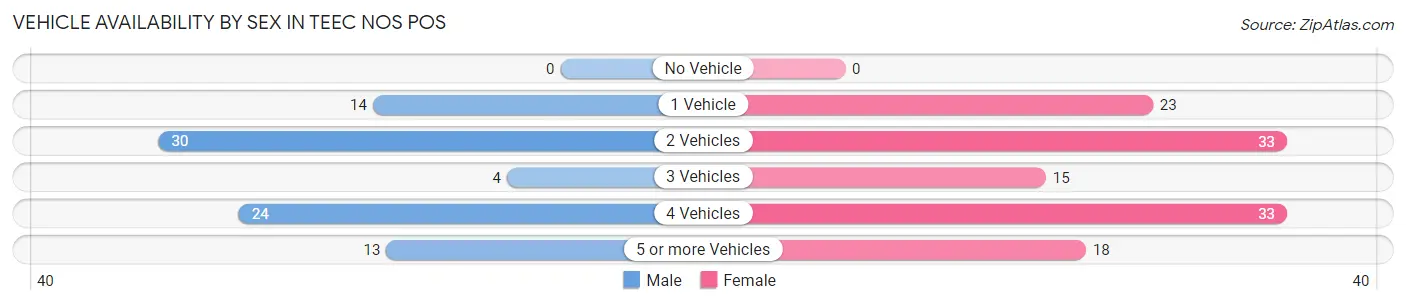
| Vehicles Available | Male | Female |
| No Vehicle | 0 (0.0%) | 0 (0.0%) |
| 1 Vehicle | 14 (16.5%) | 23 (18.9%) |
| 2 Vehicles | 30 (35.3%) | 33 (27.1%) |
| 3 Vehicles | 4 (4.7%) | 15 (12.3%) |
| 4 Vehicles | 24 (28.2%) | 33 (27.1%) |
| 5 or more Vehicles | 13 (15.3%) | 18 (14.7%) |
| Total | 85 (100.0%) | 122 (100.0%) |
Commute Time in Teec Nos Pos
The most frequently occuring commute durations in Teec Nos Pos are 60 to 89 minutes (41 commuters, 22.0%), 45 to 59 minutes (27 commuters, 14.5%), and 5 to 9 minutes (26 commuters, 14.0%).
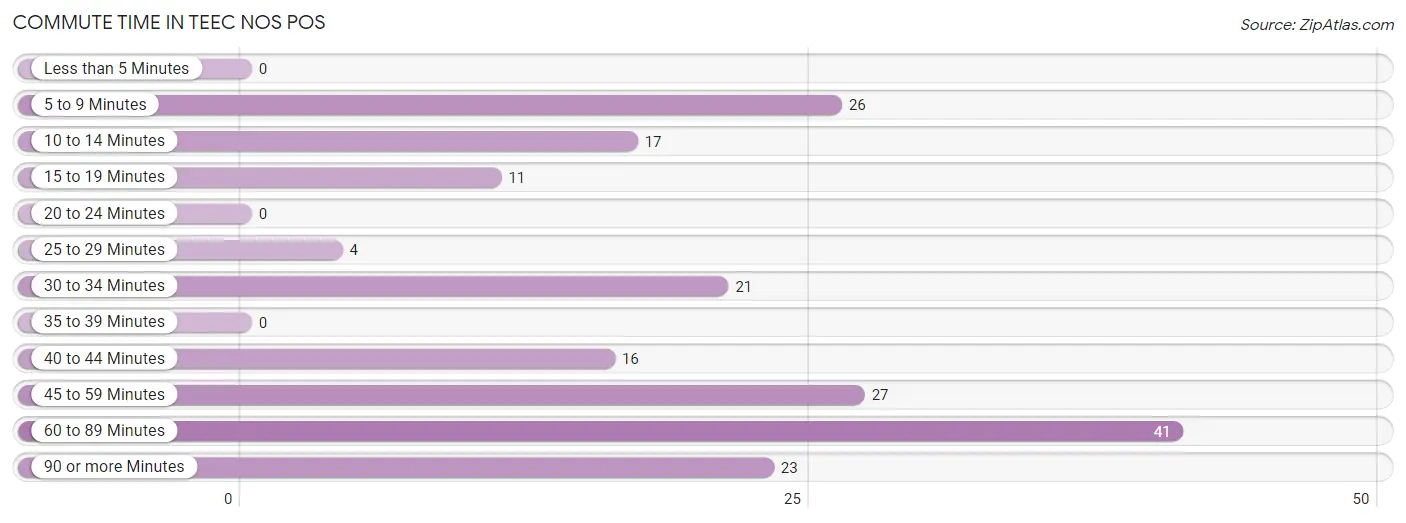
| Commute Time | # Commuters | % Commuters |
| Less than 5 Minutes | 0 | 0.0% |
| 5 to 9 Minutes | 26 | 14.0% |
| 10 to 14 Minutes | 17 | 9.1% |
| 15 to 19 Minutes | 11 | 5.9% |
| 20 to 24 Minutes | 0 | 0.0% |
| 25 to 29 Minutes | 4 | 2.1% |
| 30 to 34 Minutes | 21 | 11.3% |
| 35 to 39 Minutes | 0 | 0.0% |
| 40 to 44 Minutes | 16 | 8.6% |
| 45 to 59 Minutes | 27 | 14.5% |
| 60 to 89 Minutes | 41 | 22.0% |
| 90 or more Minutes | 23 | 12.4% |
Commute Time by Sex in Teec Nos Pos
The most common commute times in Teec Nos Pos are 60 to 89 minutes (31 commuters, 36.5%) for males and 5 to 9 minutes (23 commuters, 22.8%) for females.
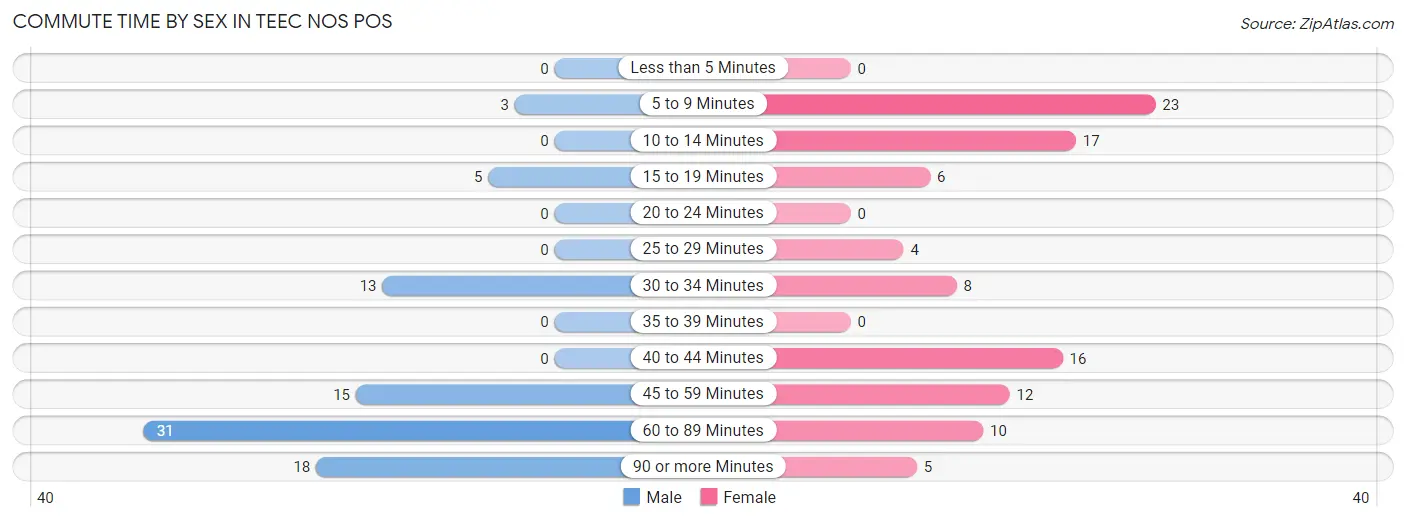
| Commute Time | Male | Female |
| Less than 5 Minutes | 0 (0.0%) | 0 (0.0%) |
| 5 to 9 Minutes | 3 (3.5%) | 23 (22.8%) |
| 10 to 14 Minutes | 0 (0.0%) | 17 (16.8%) |
| 15 to 19 Minutes | 5 (5.9%) | 6 (5.9%) |
| 20 to 24 Minutes | 0 (0.0%) | 0 (0.0%) |
| 25 to 29 Minutes | 0 (0.0%) | 4 (4.0%) |
| 30 to 34 Minutes | 13 (15.3%) | 8 (7.9%) |
| 35 to 39 Minutes | 0 (0.0%) | 0 (0.0%) |
| 40 to 44 Minutes | 0 (0.0%) | 16 (15.8%) |
| 45 to 59 Minutes | 15 (17.6%) | 12 (11.9%) |
| 60 to 89 Minutes | 31 (36.5%) | 10 (9.9%) |
| 90 or more Minutes | 18 (21.2%) | 5 (5.0%) |
Time of Departure to Work by Sex in Teec Nos Pos
The most frequent times of departure to work in Teec Nos Pos are 6:00 AM to 6:29 AM (38, 44.7%) for males and 7:00 AM to 7:29 AM (27, 26.7%) for females.
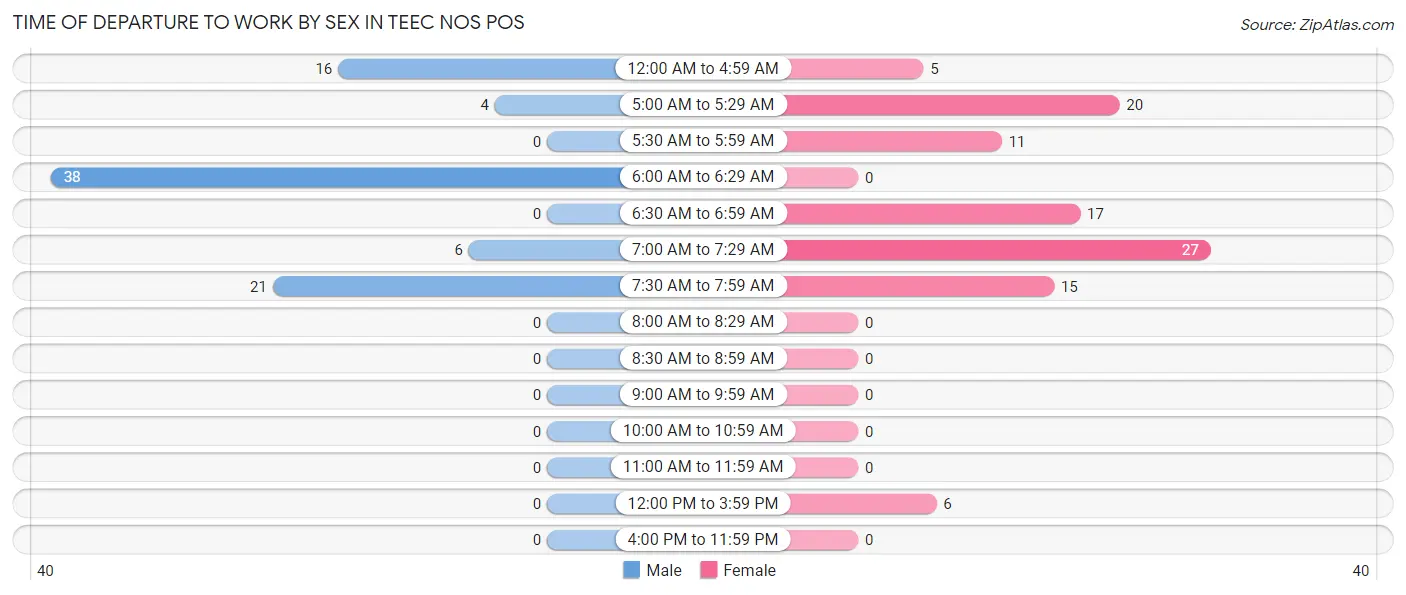
| Time of Departure | Male | Female |
| 12:00 AM to 4:59 AM | 16 (18.8%) | 5 (5.0%) |
| 5:00 AM to 5:29 AM | 4 (4.7%) | 20 (19.8%) |
| 5:30 AM to 5:59 AM | 0 (0.0%) | 11 (10.9%) |
| 6:00 AM to 6:29 AM | 38 (44.7%) | 0 (0.0%) |
| 6:30 AM to 6:59 AM | 0 (0.0%) | 17 (16.8%) |
| 7:00 AM to 7:29 AM | 6 (7.1%) | 27 (26.7%) |
| 7:30 AM to 7:59 AM | 21 (24.7%) | 15 (14.8%) |
| 8:00 AM to 8:29 AM | 0 (0.0%) | 0 (0.0%) |
| 8:30 AM to 8:59 AM | 0 (0.0%) | 0 (0.0%) |
| 9:00 AM to 9:59 AM | 0 (0.0%) | 0 (0.0%) |
| 10:00 AM to 10:59 AM | 0 (0.0%) | 0 (0.0%) |
| 11:00 AM to 11:59 AM | 0 (0.0%) | 0 (0.0%) |
| 12:00 PM to 3:59 PM | 0 (0.0%) | 6 (5.9%) |
| 4:00 PM to 11:59 PM | 0 (0.0%) | 0 (0.0%) |
| Total | 85 (100.0%) | 101 (100.0%) |
Housing Occupancy in Teec Nos Pos
Occupancy by Ownership in Teec Nos Pos
Of the total 220 dwellings in Teec Nos Pos, owner-occupied units account for 134 (60.9%), while renter-occupied units make up 86 (39.1%).
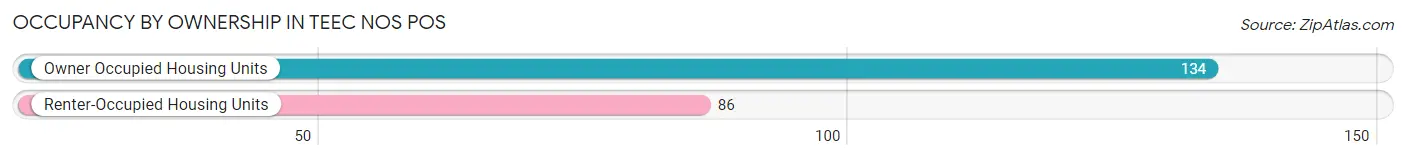
| Occupancy | # Housing Units | % Housing Units |
| Owner Occupied Housing Units | 134 | 60.9% |
| Renter-Occupied Housing Units | 86 | 39.1% |
| Total Occupied Housing Units | 220 | 100.0% |
Occupancy by Household Size in Teec Nos Pos
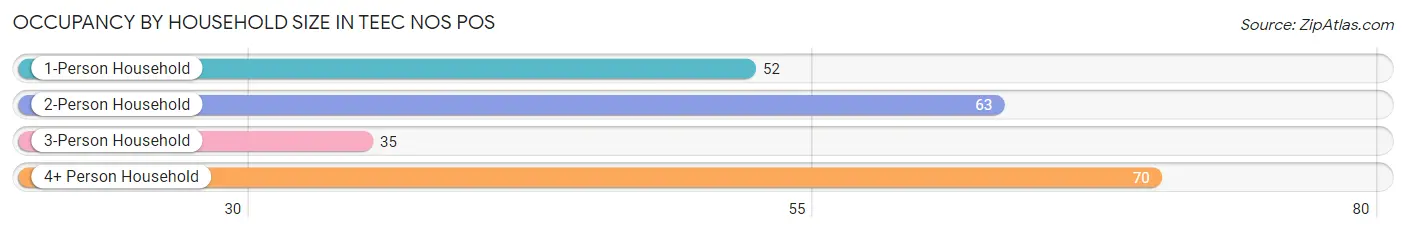
| Household Size | # Housing Units | % Housing Units |
| 1-Person Household | 52 | 23.6% |
| 2-Person Household | 63 | 28.6% |
| 3-Person Household | 35 | 15.9% |
| 4+ Person Household | 70 | 31.8% |
| Total Housing Units | 220 | 100.0% |
Occupancy by Ownership by Household Size in Teec Nos Pos
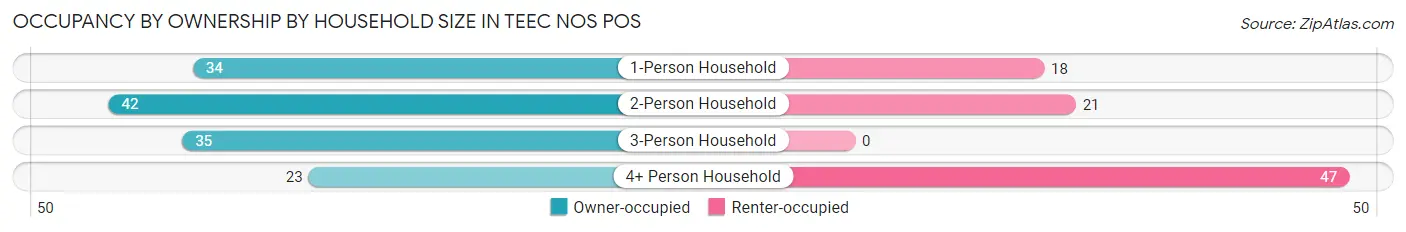
| Household Size | Owner-occupied | Renter-occupied |
| 1-Person Household | 34 (65.4%) | 18 (34.6%) |
| 2-Person Household | 42 (66.7%) | 21 (33.3%) |
| 3-Person Household | 35 (100.0%) | 0 (0.0%) |
| 4+ Person Household | 23 (32.9%) | 47 (67.1%) |
| Total Housing Units | 134 (60.9%) | 86 (39.1%) |
Occupancy by Educational Attainment in Teec Nos Pos
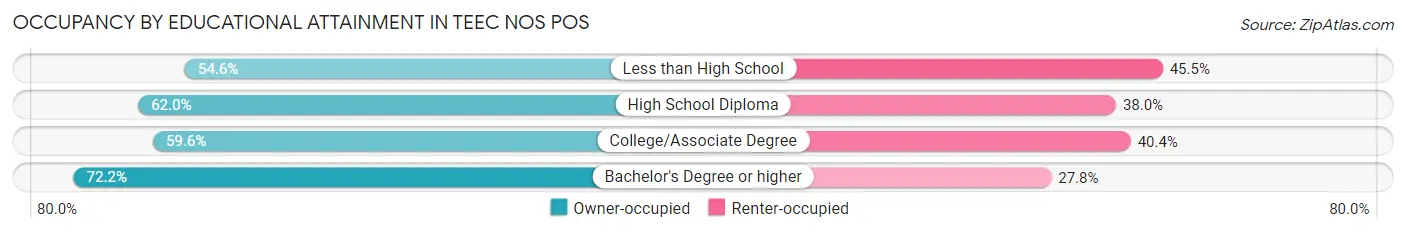
| Household Size | Owner-occupied | Renter-occupied |
| Less than High School | 12 (54.5%) | 10 (45.5%) |
| High School Diploma | 44 (62.0%) | 27 (38.0%) |
| College/Associate Degree | 65 (59.6%) | 44 (40.4%) |
| Bachelor's Degree or higher | 13 (72.2%) | 5 (27.8%) |
Occupancy by Age of Householder in Teec Nos Pos
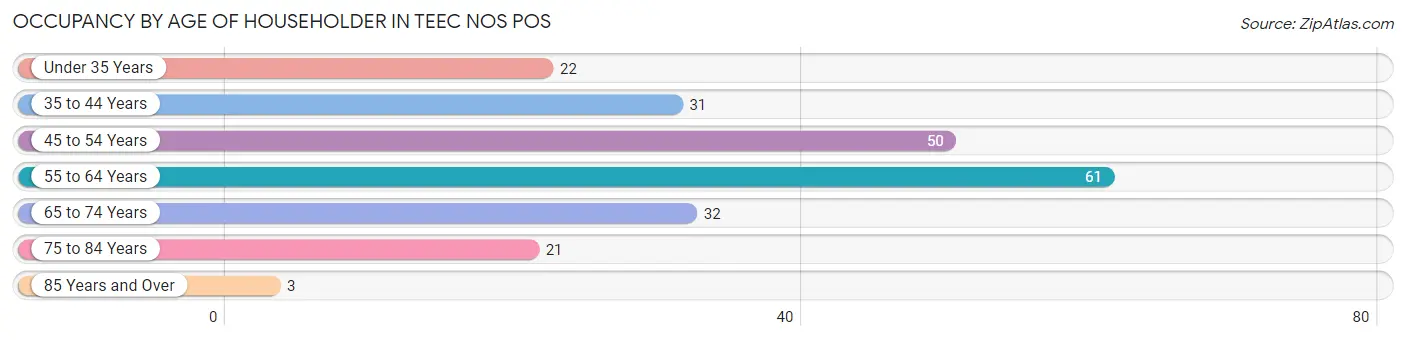
| Age Bracket | # Households | % Households |
| Under 35 Years | 22 | 10.0% |
| 35 to 44 Years | 31 | 14.1% |
| 45 to 54 Years | 50 | 22.7% |
| 55 to 64 Years | 61 | 27.7% |
| 65 to 74 Years | 32 | 14.5% |
| 75 to 84 Years | 21 | 9.6% |
| 85 Years and Over | 3 | 1.4% |
| Total | 220 | 100.0% |
Housing Finances in Teec Nos Pos
Median Income by Occupancy in Teec Nos Pos
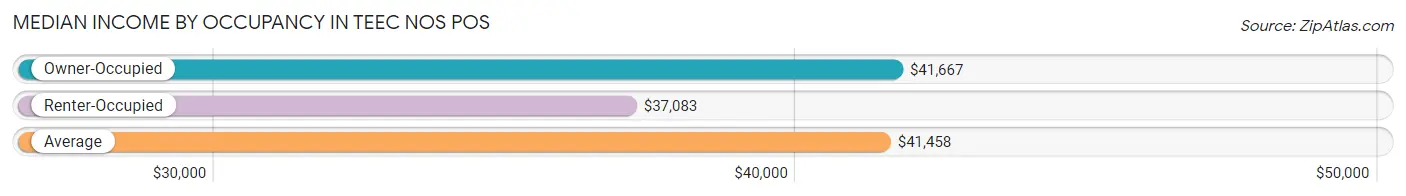
| Occupancy Type | # Households | Median Income |
| Owner-Occupied | 134 (60.9%) | $41,667 |
| Renter-Occupied | 86 (39.1%) | $37,083 |
| Average | 220 (100.0%) | $41,458 |
Occupancy by Householder Income Bracket in Teec Nos Pos
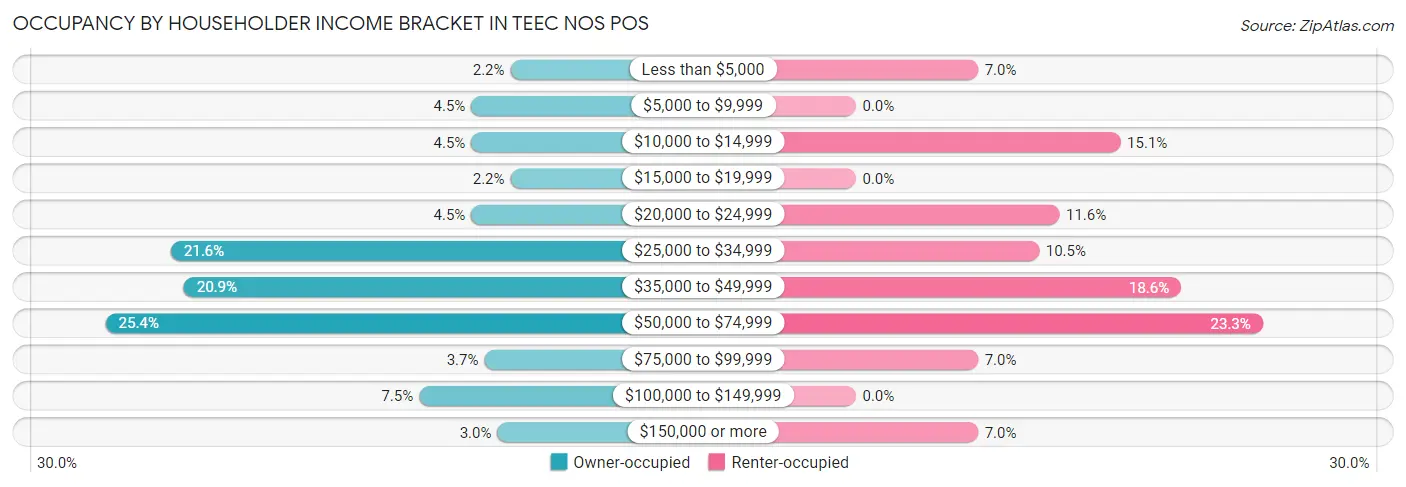
| Income Bracket | Owner-occupied | Renter-occupied |
| Less than $5,000 | 3 (2.2%) | 6 (7.0%) |
| $5,000 to $9,999 | 6 (4.5%) | 0 (0.0%) |
| $10,000 to $14,999 | 6 (4.5%) | 13 (15.1%) |
| $15,000 to $19,999 | 3 (2.2%) | 0 (0.0%) |
| $20,000 to $24,999 | 6 (4.5%) | 10 (11.6%) |
| $25,000 to $34,999 | 29 (21.6%) | 9 (10.5%) |
| $35,000 to $49,999 | 28 (20.9%) | 16 (18.6%) |
| $50,000 to $74,999 | 34 (25.4%) | 20 (23.3%) |
| $75,000 to $99,999 | 5 (3.7%) | 6 (7.0%) |
| $100,000 to $149,999 | 10 (7.5%) | 0 (0.0%) |
| $150,000 or more | 4 (3.0%) | 6 (7.0%) |
| Total | 134 (100.0%) | 86 (100.0%) |
Monthly Housing Cost Tiers in Teec Nos Pos
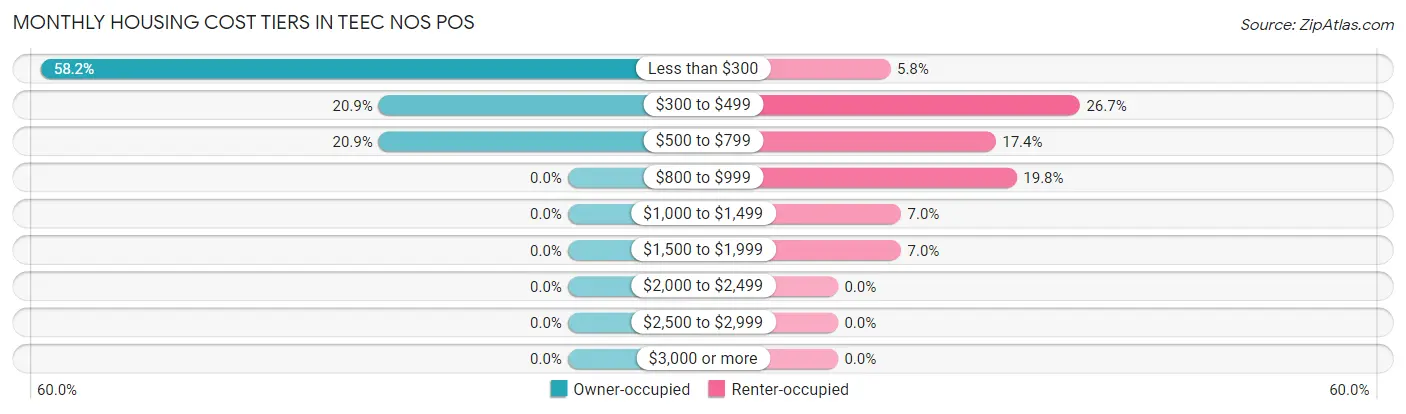
| Monthly Cost | Owner-occupied | Renter-occupied |
| Less than $300 | 78 (58.2%) | 5 (5.8%) |
| $300 to $499 | 28 (20.9%) | 23 (26.7%) |
| $500 to $799 | 28 (20.9%) | 15 (17.4%) |
| $800 to $999 | 0 (0.0%) | 17 (19.8%) |
| $1,000 to $1,499 | 0 (0.0%) | 6 (7.0%) |
| $1,500 to $1,999 | 0 (0.0%) | 6 (7.0%) |
| $2,000 to $2,499 | 0 (0.0%) | 0 (0.0%) |
| $2,500 to $2,999 | 0 (0.0%) | 0 (0.0%) |
| $3,000 or more | 0 (0.0%) | 0 (0.0%) |
| Total | 134 (100.0%) | 86 (100.0%) |
Physical Housing Characteristics in Teec Nos Pos
Housing Structures in Teec Nos Pos
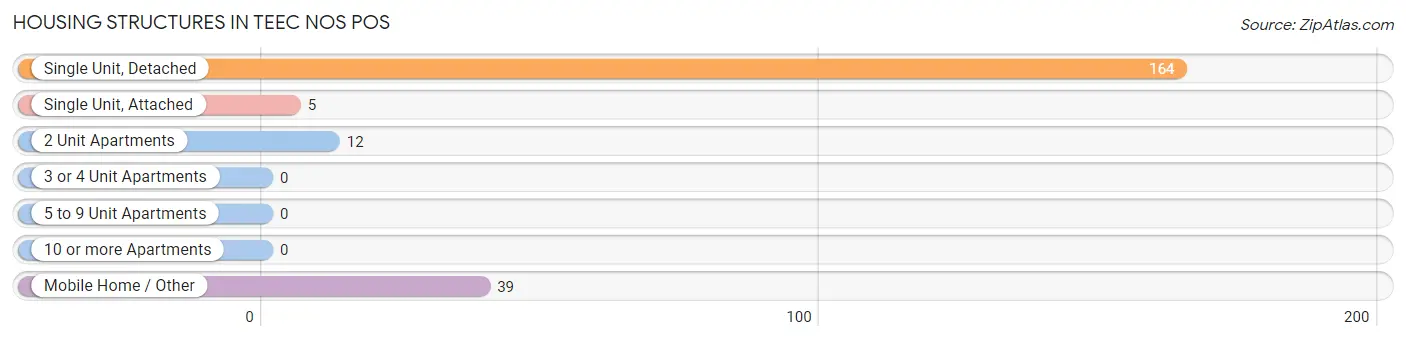
| Structure Type | # Housing Units | % Housing Units |
| Single Unit, Detached | 164 | 74.6% |
| Single Unit, Attached | 5 | 2.3% |
| 2 Unit Apartments | 12 | 5.4% |
| 3 or 4 Unit Apartments | 0 | 0.0% |
| 5 to 9 Unit Apartments | 0 | 0.0% |
| 10 or more Apartments | 0 | 0.0% |
| Mobile Home / Other | 39 | 17.7% |
| Total | 220 | 100.0% |
Housing Structures by Occupancy in Teec Nos Pos
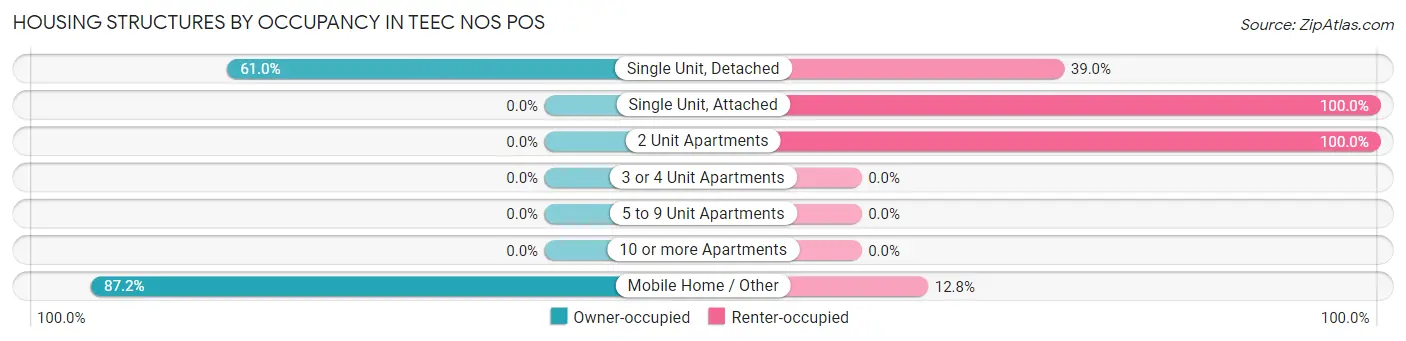
| Structure Type | Owner-occupied | Renter-occupied |
| Single Unit, Detached | 100 (61.0%) | 64 (39.0%) |
| Single Unit, Attached | 0 (0.0%) | 5 (100.0%) |
| 2 Unit Apartments | 0 (0.0%) | 12 (100.0%) |
| 3 or 4 Unit Apartments | 0 (0.0%) | 0 (0.0%) |
| 5 to 9 Unit Apartments | 0 (0.0%) | 0 (0.0%) |
| 10 or more Apartments | 0 (0.0%) | 0 (0.0%) |
| Mobile Home / Other | 34 (87.2%) | 5 (12.8%) |
| Total | 134 (60.9%) | 86 (39.1%) |
Housing Structures by Number of Rooms in Teec Nos Pos
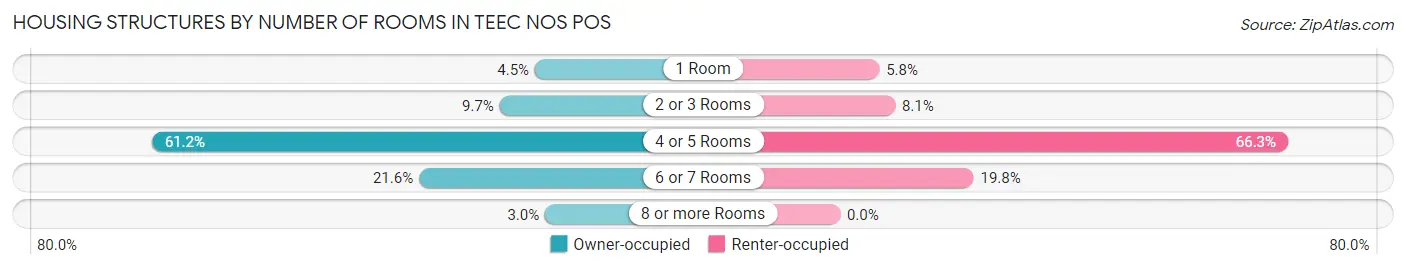
| Number of Rooms | Owner-occupied | Renter-occupied |
| 1 Room | 6 (4.5%) | 5 (5.8%) |
| 2 or 3 Rooms | 13 (9.7%) | 7 (8.1%) |
| 4 or 5 Rooms | 82 (61.2%) | 57 (66.3%) |
| 6 or 7 Rooms | 29 (21.6%) | 17 (19.8%) |
| 8 or more Rooms | 4 (3.0%) | 0 (0.0%) |
| Total | 134 (100.0%) | 86 (100.0%) |
Housing Structure by Heating Type in Teec Nos Pos
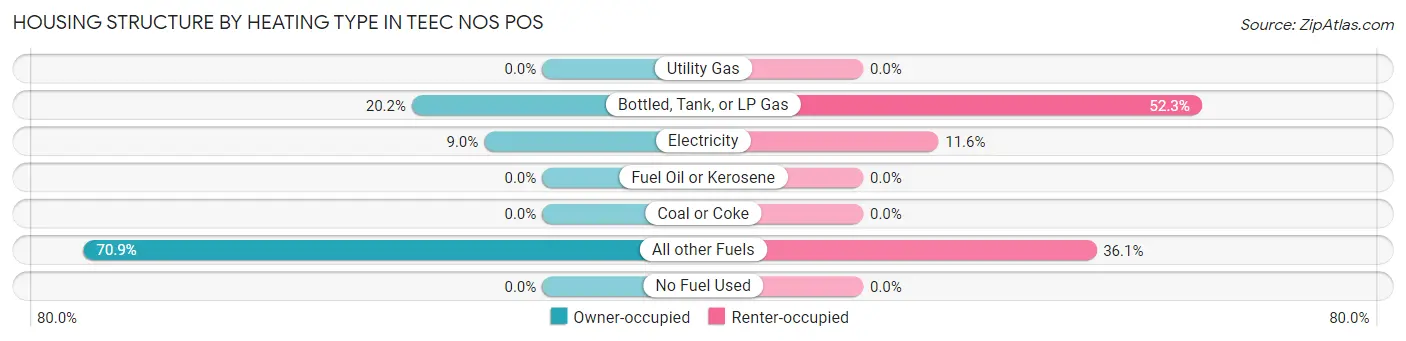
| Heating Type | Owner-occupied | Renter-occupied |
| Utility Gas | 0 (0.0%) | 0 (0.0%) |
| Bottled, Tank, or LP Gas | 27 (20.2%) | 45 (52.3%) |
| Electricity | 12 (9.0%) | 10 (11.6%) |
| Fuel Oil or Kerosene | 0 (0.0%) | 0 (0.0%) |
| Coal or Coke | 0 (0.0%) | 0 (0.0%) |
| All other Fuels | 95 (70.9%) | 31 (36.0%) |
| No Fuel Used | 0 (0.0%) | 0 (0.0%) |
| Total | 134 (100.0%) | 86 (100.0%) |
Household Vehicle Usage in Teec Nos Pos
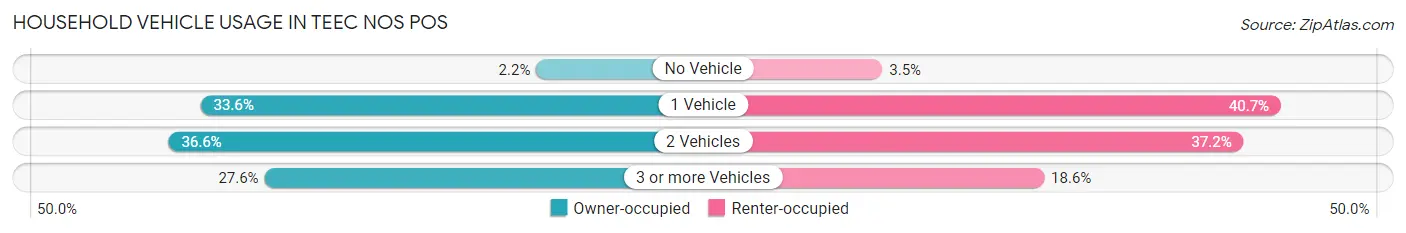
| Vehicles per Household | Owner-occupied | Renter-occupied |
| No Vehicle | 3 (2.2%) | 3 (3.5%) |
| 1 Vehicle | 45 (33.6%) | 35 (40.7%) |
| 2 Vehicles | 49 (36.6%) | 32 (37.2%) |
| 3 or more Vehicles | 37 (27.6%) | 16 (18.6%) |
| Total | 134 (100.0%) | 86 (100.0%) |
Real Estate & Mortgages in Teec Nos Pos
Real Estate and Mortgage Overview in Teec Nos Pos
| Characteristic | Without Mortgage | With Mortgage |
| Housing Units | 126 | 8 |
| Median Property Value | $82,100 | $0 |
| Median Household Income | $41,458 | $0 |
| Monthly Housing Costs | $277 | $0 |
| Real Estate Taxes | - | - |
Property Value by Mortgage Status in Teec Nos Pos
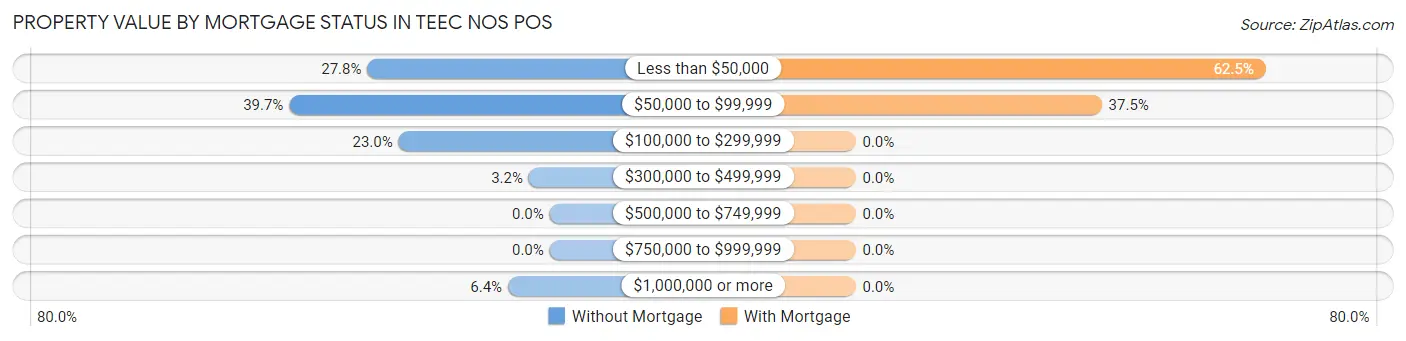
| Property Value | Without Mortgage | With Mortgage |
| Less than $50,000 | 35 (27.8%) | 5 (62.5%) |
| $50,000 to $99,999 | 50 (39.7%) | 3 (37.5%) |
| $100,000 to $299,999 | 29 (23.0%) | 0 (0.0%) |
| $300,000 to $499,999 | 4 (3.2%) | 0 (0.0%) |
| $500,000 to $749,999 | 0 (0.0%) | 0 (0.0%) |
| $750,000 to $999,999 | 0 (0.0%) | 0 (0.0%) |
| $1,000,000 or more | 8 (6.4%) | 0 (0.0%) |
| Total | 126 (100.0%) | 8 (100.0%) |
Household Income by Mortgage Status in Teec Nos Pos
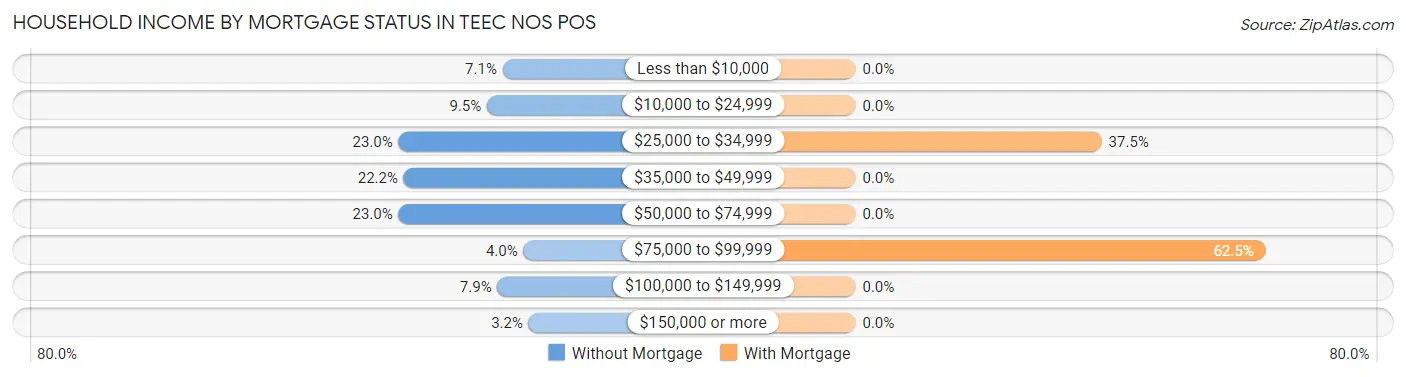
| Household Income | Without Mortgage | With Mortgage |
| Less than $10,000 | 9 (7.1%) | 0 (0.0%) |
| $10,000 to $24,999 | 12 (9.5%) | 0 (0.0%) |
| $25,000 to $34,999 | 29 (23.0%) | 3 (37.5%) |
| $35,000 to $49,999 | 28 (22.2%) | 0 (0.0%) |
| $50,000 to $74,999 | 29 (23.0%) | 0 (0.0%) |
| $75,000 to $99,999 | 5 (4.0%) | 5 (62.5%) |
| $100,000 to $149,999 | 10 (7.9%) | 0 (0.0%) |
| $150,000 or more | 4 (3.2%) | 0 (0.0%) |
| Total | 126 (100.0%) | 8 (100.0%) |
Property Value to Household Income Ratio in Teec Nos Pos
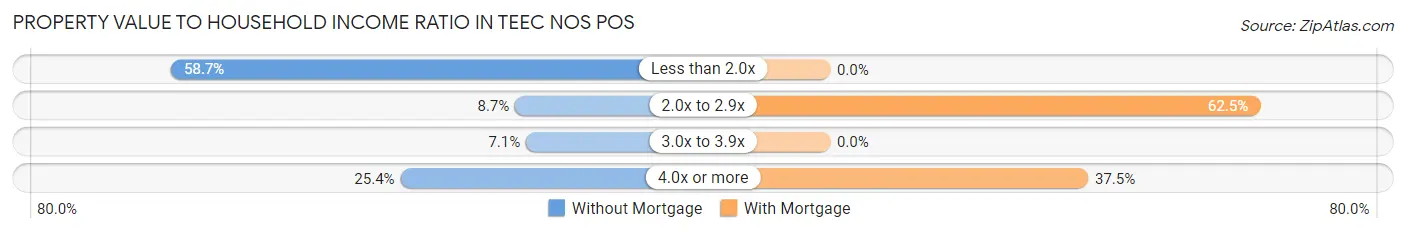
| Value-to-Income Ratio | Without Mortgage | With Mortgage |
| Less than 2.0x | 74 (58.7%) | 0 (0.0%) |
| 2.0x to 2.9x | 11 (8.7%) | 5 (62.5%) |
| 3.0x to 3.9x | 9 (7.1%) | 0 (0.0%) |
| 4.0x or more | 32 (25.4%) | 3 (37.5%) |
| Total | 126 (100.0%) | 8 (100.0%) |
Real Estate Taxes by Mortgage Status in Teec Nos Pos
| Property Taxes | Without Mortgage | With Mortgage |
| Less than $800 | 0 (0.0%) | 0 (0.0%) |
| $800 to $1,499 | 0 (0.0%) | 0 (0.0%) |
| $800 to $1,499 | 0 (0.0%) | 0 (0.0%) |
| Total | 126 (100.0%) | 8 (100.0%) |
Health & Disability in Teec Nos Pos
Health Insurance Coverage by Age in Teec Nos Pos
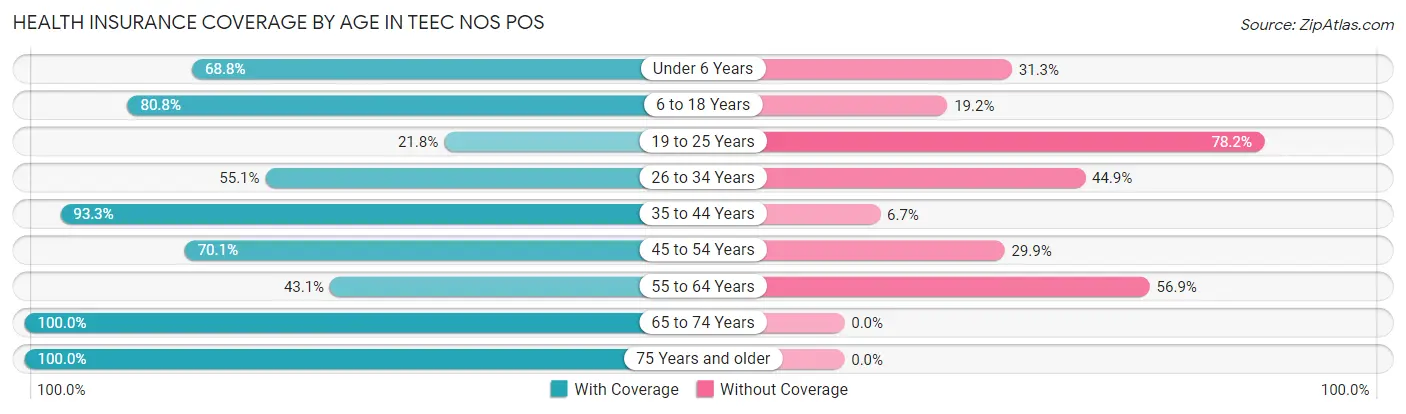
| Age Bracket | With Coverage | Without Coverage |
| Under 6 Years | 77 (68.8%) | 35 (31.2%) |
| 6 to 18 Years | 181 (80.8%) | 43 (19.2%) |
| 19 to 25 Years | 17 (21.8%) | 61 (78.2%) |
| 26 to 34 Years | 81 (55.1%) | 66 (44.9%) |
| 35 to 44 Years | 70 (93.3%) | 5 (6.7%) |
| 45 to 54 Years | 54 (70.1%) | 23 (29.9%) |
| 55 to 64 Years | 31 (43.1%) | 41 (56.9%) |
| 65 to 74 Years | 60 (100.0%) | 0 (0.0%) |
| 75 Years and older | 39 (100.0%) | 0 (0.0%) |
| Total | 610 (69.0%) | 274 (31.0%) |
Health Insurance Coverage by Citizenship Status in Teec Nos Pos
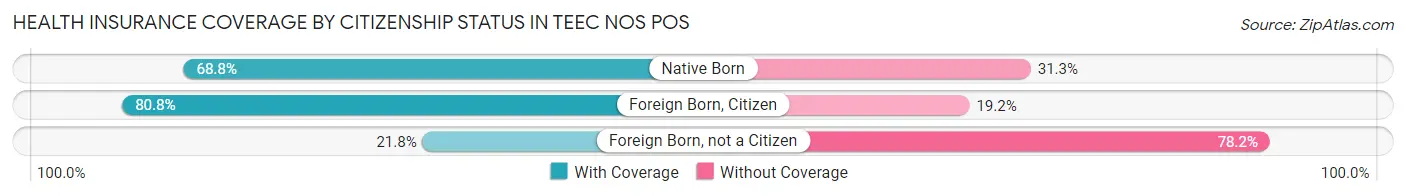
| Citizenship Status | With Coverage | Without Coverage |
| Native Born | 77 (68.8%) | 35 (31.2%) |
| Foreign Born, Citizen | 181 (80.8%) | 43 (19.2%) |
| Foreign Born, not a Citizen | 17 (21.8%) | 61 (78.2%) |
Health Insurance Coverage by Household Income in Teec Nos Pos
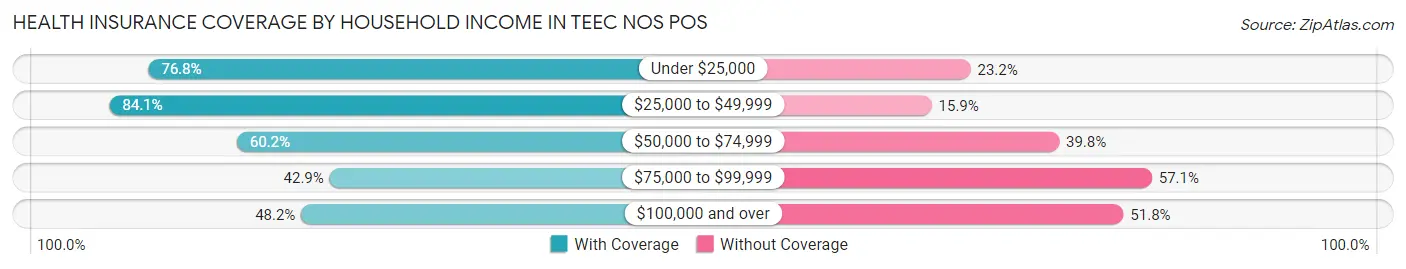
| Household Income | With Coverage | Without Coverage |
| Under $25,000 | 169 (76.8%) | 51 (23.2%) |
| $25,000 to $49,999 | 217 (84.1%) | 41 (15.9%) |
| $50,000 to $74,999 | 153 (60.2%) | 101 (39.8%) |
| $75,000 to $99,999 | 18 (42.9%) | 24 (57.1%) |
| $100,000 and over | 53 (48.2%) | 57 (51.8%) |
Public vs Private Health Insurance Coverage by Age in Teec Nos Pos
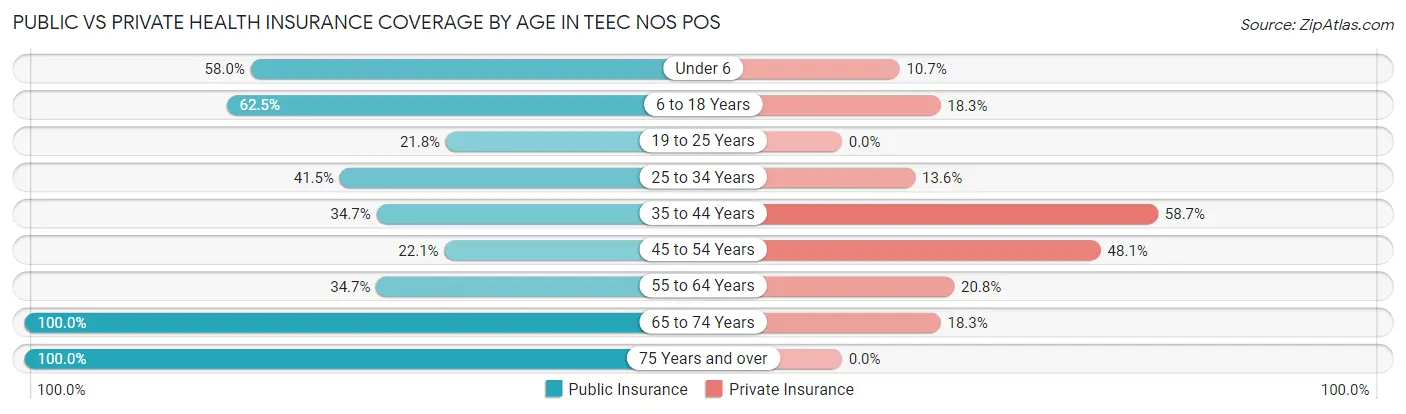
| Age Bracket | Public Insurance | Private Insurance |
| Under 6 | 65 (58.0%) | 12 (10.7%) |
| 6 to 18 Years | 140 (62.5%) | 41 (18.3%) |
| 19 to 25 Years | 17 (21.8%) | 0 (0.0%) |
| 25 to 34 Years | 61 (41.5%) | 20 (13.6%) |
| 35 to 44 Years | 26 (34.7%) | 44 (58.7%) |
| 45 to 54 Years | 17 (22.1%) | 37 (48.0%) |
| 55 to 64 Years | 25 (34.7%) | 15 (20.8%) |
| 65 to 74 Years | 60 (100.0%) | 11 (18.3%) |
| 75 Years and over | 39 (100.0%) | 0 (0.0%) |
| Total | 450 (50.9%) | 180 (20.4%) |
Disability Status by Sex by Age in Teec Nos Pos
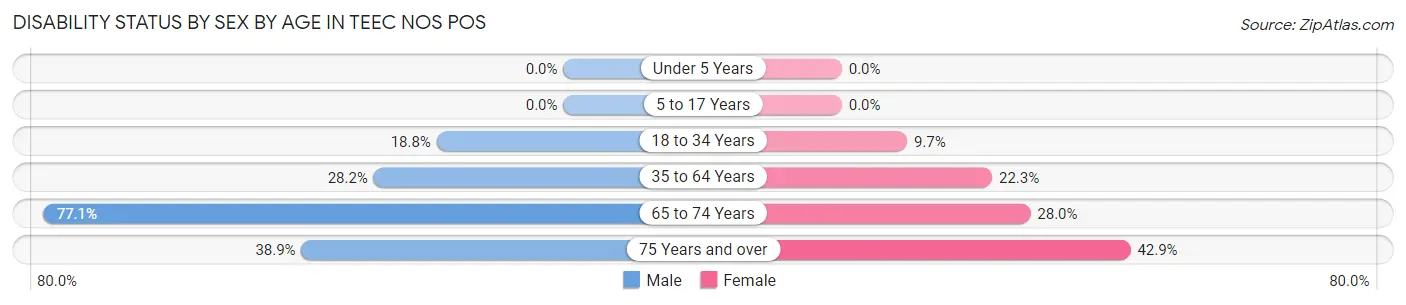
| Age Bracket | Male | Female |
| Under 5 Years | 0 (0.0%) | 0 (0.0%) |
| 5 to 17 Years | 0 (0.0%) | 0 (0.0%) |
| 18 to 34 Years | 19 (18.8%) | 12 (9.7%) |
| 35 to 64 Years | 29 (28.2%) | 27 (22.3%) |
| 65 to 74 Years | 27 (77.1%) | 7 (28.0%) |
| 75 Years and over | 7 (38.9%) | 9 (42.9%) |
Disability Class by Sex by Age in Teec Nos Pos
Disability Class: Hearing Difficulty
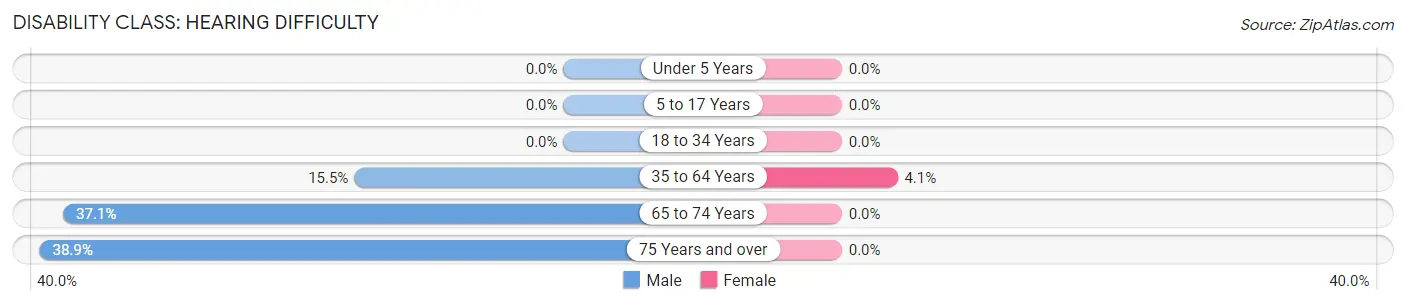
| Age Bracket | Male | Female |
| Under 5 Years | 0 (0.0%) | 0 (0.0%) |
| 5 to 17 Years | 0 (0.0%) | 0 (0.0%) |
| 18 to 34 Years | 0 (0.0%) | 0 (0.0%) |
| 35 to 64 Years | 16 (15.5%) | 5 (4.1%) |
| 65 to 74 Years | 13 (37.1%) | 0 (0.0%) |
| 75 Years and over | 7 (38.9%) | 0 (0.0%) |
Disability Class: Vision Difficulty
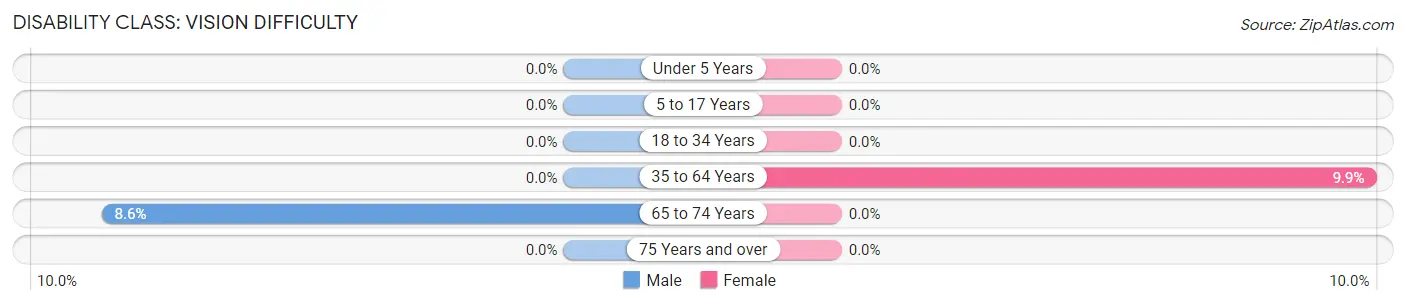
| Age Bracket | Male | Female |
| Under 5 Years | 0 (0.0%) | 0 (0.0%) |
| 5 to 17 Years | 0 (0.0%) | 0 (0.0%) |
| 18 to 34 Years | 0 (0.0%) | 0 (0.0%) |
| 35 to 64 Years | 0 (0.0%) | 12 (9.9%) |
| 65 to 74 Years | 3 (8.6%) | 0 (0.0%) |
| 75 Years and over | 0 (0.0%) | 0 (0.0%) |
Disability Class: Cognitive Difficulty
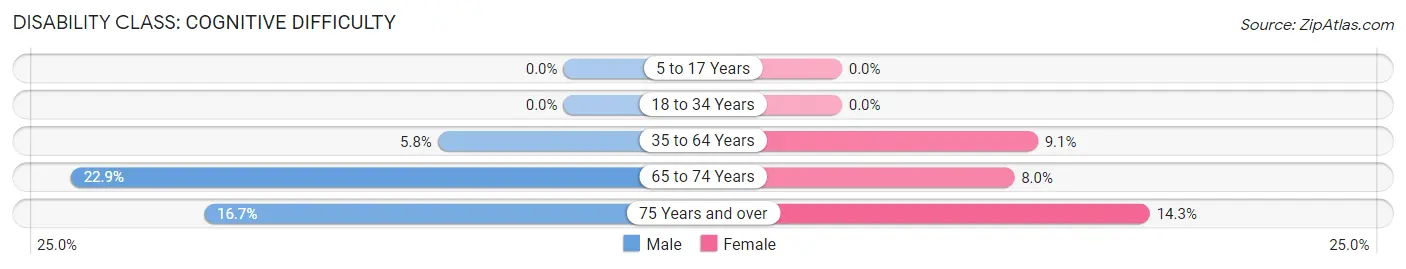
| Age Bracket | Male | Female |
| 5 to 17 Years | 0 (0.0%) | 0 (0.0%) |
| 18 to 34 Years | 0 (0.0%) | 0 (0.0%) |
| 35 to 64 Years | 6 (5.8%) | 11 (9.1%) |
| 65 to 74 Years | 8 (22.9%) | 2 (8.0%) |
| 75 Years and over | 3 (16.7%) | 3 (14.3%) |
Disability Class: Ambulatory Difficulty
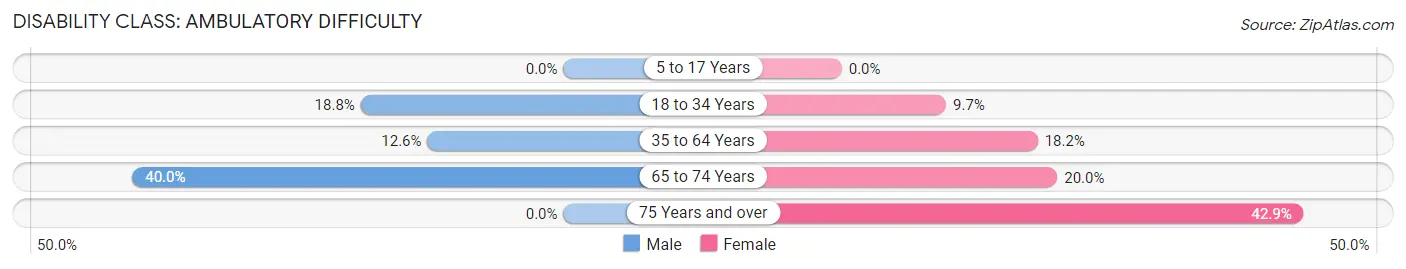
| Age Bracket | Male | Female |
| 5 to 17 Years | 0 (0.0%) | 0 (0.0%) |
| 18 to 34 Years | 19 (18.8%) | 12 (9.7%) |
| 35 to 64 Years | 13 (12.6%) | 22 (18.2%) |
| 65 to 74 Years | 14 (40.0%) | 5 (20.0%) |
| 75 Years and over | 0 (0.0%) | 9 (42.9%) |
Disability Class: Self-Care Difficulty
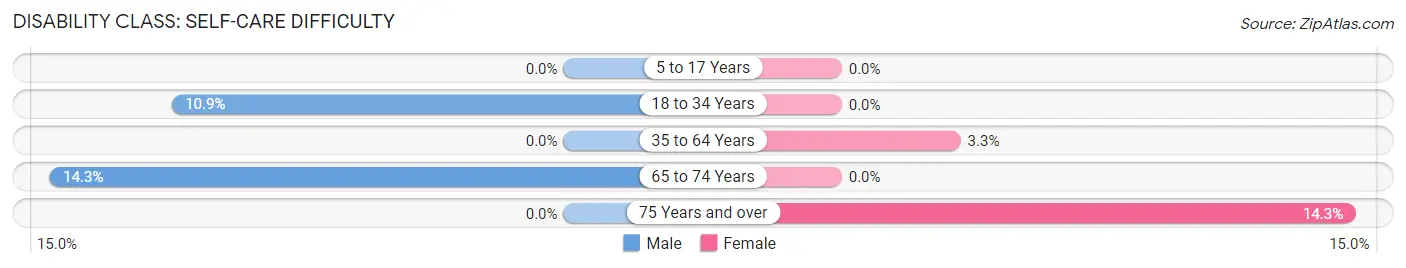
| Age Bracket | Male | Female |
| 5 to 17 Years | 0 (0.0%) | 0 (0.0%) |
| 18 to 34 Years | 11 (10.9%) | 0 (0.0%) |
| 35 to 64 Years | 0 (0.0%) | 4 (3.3%) |
| 65 to 74 Years | 5 (14.3%) | 0 (0.0%) |
| 75 Years and over | 0 (0.0%) | 3 (14.3%) |
Technology Access in Teec Nos Pos
Computing Device Access in Teec Nos Pos
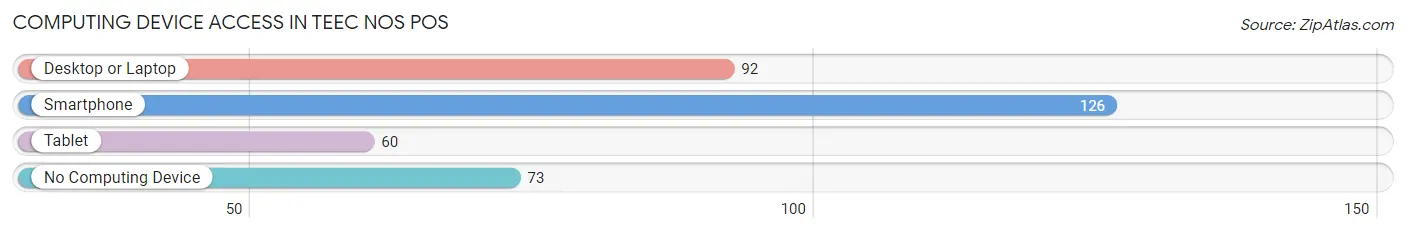
| Device Type | # Households | % Households |
| Desktop or Laptop | 92 | 41.8% |
| Smartphone | 126 | 57.3% |
| Tablet | 60 | 27.3% |
| No Computing Device | 73 | 33.2% |
| Total | 220 | 100.0% |
Internet Access in Teec Nos Pos
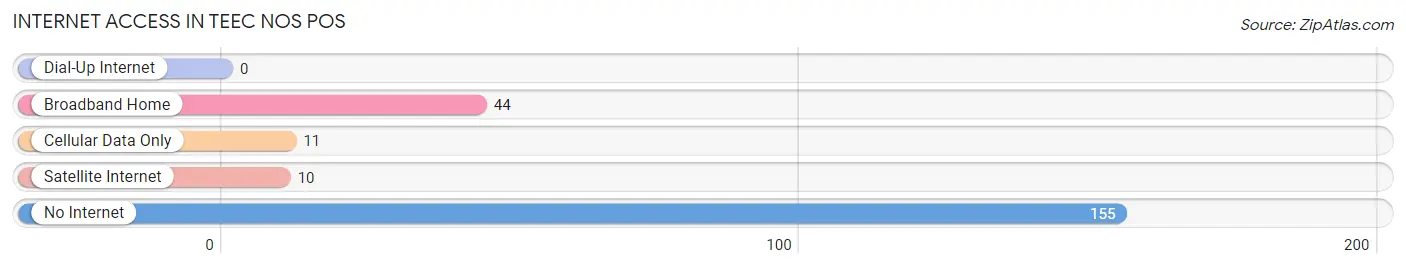
| Internet Type | # Households | % Households |
| Dial-Up Internet | 0 | 0.0% |
| Broadband Home | 44 | 20.0% |
| Cellular Data Only | 11 | 5.0% |
| Satellite Internet | 10 | 4.5% |
| No Internet | 155 | 70.5% |
| Total | 220 | 100.0% |
Teec Nos Pos Summary
Teec Nos Pos is a small unincorporated community located in Apache County, Arizona. It is situated on the Navajo Nation Reservation, near the Four Corners region of the United States. The town is located on the banks of the San Juan River, and is home to a population of approximately 500 people.
History
The area around Teec Nos Pos has been inhabited by the Navajo people for centuries. The name of the town is derived from the Navajo phrase “T’iis Názbąs”, which translates to “circle of cottonwoods”. The town was established in the late 19th century, when the Navajo people were forced to relocate to the area by the United States government. The town was originally known as “T’iis Názbąs”, but was later changed to Teec Nos Pos.
The town was initially a trading post, and was a popular stop for travelers and traders. In the early 20th century, the town began to grow and develop, and by the 1950s, it had become a popular tourist destination. The town was also home to a number of businesses, including a trading post, a hotel, and a gas station.
Geography
Teec Nos Pos is located in the Four Corners region of the United States, near the border of Arizona, New Mexico, Colorado, and Utah. The town is situated on the banks of the San Juan River, and is surrounded by the Navajo Nation Reservation. The town is located at an elevation of 5,000 feet, and has a semi-arid climate.
The town is located in a remote area, and is not easily accessible by road. The nearest major city is Farmington, New Mexico, which is located approximately 50 miles away. The town is also located near the Navajo National Monument, which is a popular tourist destination.
Economy
The economy of Teec Nos Pos is largely based on tourism and trading. The town is home to a number of businesses, including a trading post, a hotel, and a gas station. The town is also home to a number of art galleries, which feature traditional Navajo artwork.
The town is also home to a number of agricultural operations, which produce a variety of crops, including corn, beans, squash, and melons. The town is also home to a number of sheep and cattle ranches, which produce a variety of meats and dairy products.
Demographics
As of the 2010 census, the population of Teec Nos Pos was 498. The town is predominantly Native American, with the majority of the population being Navajo. The town also has a small Hispanic population, as well as a small number of White and African American residents. The median household income in the town is $25,000, and the median home value is $50,000.
Conclusion
Teec Nos Pos is a small unincorporated community located in Apache County, Arizona. It is situated on the Navajo Nation Reservation, near the Four Corners region of the United States. The town is home to a population of approximately 500 people, and is largely based on tourism and trading. The town is predominantly Native American, with the majority of the population being Navajo. The town is also home to a number of businesses, including a trading post, a hotel, and a gas station. The town is also home to a number of agricultural operations, which produce a variety of crops, including corn, beans, squash, and melons. The town is also home to a number of sheep and cattle ranches, which produce a variety of meats and dairy products.
Common Questions
What is Per Capita Income in Teec Nos Pos?
Per Capita income in Teec Nos Pos is $14,904.
What is the Median Family Income in Teec Nos Pos?
Median Family Income in Teec Nos Pos is $41,979.
What is the Median Household income in Teec Nos Pos?
Median Household Income in Teec Nos Pos is $41,458.
What is Income or Wage Gap in Teec Nos Pos?
Income or Wage Gap in Teec Nos Pos is 9.3%.
Women in Teec Nos Pos earn 90.7 cents for every dollar earned by a man.
What is Inequality or Gini Index in Teec Nos Pos?
Inequality or Gini Index in Teec Nos Pos is 0.42.
What is the Total Population of Teec Nos Pos?
Total Population of Teec Nos Pos is 884.
What is the Total Male Population of Teec Nos Pos?
Total Male Population of Teec Nos Pos is 441.
What is the Total Female Population of Teec Nos Pos?
Total Female Population of Teec Nos Pos is 443.
What is the Ratio of Males per 100 Females in Teec Nos Pos?
There are 99.55 Males per 100 Females in Teec Nos Pos.
What is the Ratio of Females per 100 Males in Teec Nos Pos?
There are 100.45 Females per 100 Males in Teec Nos Pos.
What is the Median Population Age in Teec Nos Pos?
Median Population Age in Teec Nos Pos is 28.2 Years.
What is the Average Family Size in Teec Nos Pos
Average Family Size in Teec Nos Pos is 4.7 People.
What is the Average Household Size in Teec Nos Pos
Average Household Size in Teec Nos Pos is 4.0 People.
How Large is the Labor Force in Teec Nos Pos?
There are 284 People in the Labor Forcein in Teec Nos Pos.
What is the Percentage of People in the Labor Force in Teec Nos Pos?
48.0% of People are in the Labor Force in Teec Nos Pos.
What is the Unemployment Rate in Teec Nos Pos?
Unemployment Rate in Teec Nos Pos is 27.1%.