Kykotsmovi Village, AZ Map & Demographics
Kykotsmovi Village Map
Kykotsmovi Village Overview
$20,444
PER CAPITA INCOME
$64,408
AVG FAMILY INCOME
$52,143
AVG HOUSEHOLD INCOME
1.1%
WAGE / INCOME GAP [ % ]
98.9¢/ $1
WAGE / INCOME GAP [ $ ]
0.42
INEQUALITY / GINI INDEX
887
TOTAL POPULATION
401
MALE POPULATION
486
FEMALE POPULATION
82.51
MALES / 100 FEMALES
121.20
FEMALES / 100 MALES
37.8
MEDIAN AGE
3.5
AVG FAMILY SIZE
3.0
AVG HOUSEHOLD SIZE
343
LABOR FORCE [ PEOPLE ]
47.1%
PERCENT IN LABOR FORCE
7.6%
UNEMPLOYMENT RATE
Kykotsmovi Village Zip Codes
Kykotsmovi Village Area Codes
Income in Kykotsmovi Village
Income Overview in Kykotsmovi Village
Per Capita Income in Kykotsmovi Village is $20,444, while median incomes of families and households are $64,408 and $52,143 respectively.
| Characteristic | Number | Measure |
| Per Capita Income | 887 | $20,444 |
| Median Family Income | 222 | $64,408 |
| Mean Family Income | 222 | $73,756 |
| Median Household Income | 298 | $52,143 |
| Mean Household Income | 298 | $60,614 |
| Income Deficit | 222 | $0 |
| Wage / Income Gap (%) | 887 | 1.09% |
| Wage / Income Gap ($) | 887 | 98.91¢ per $1 |
| Gini / Inequality Index | 887 | 0.42 |
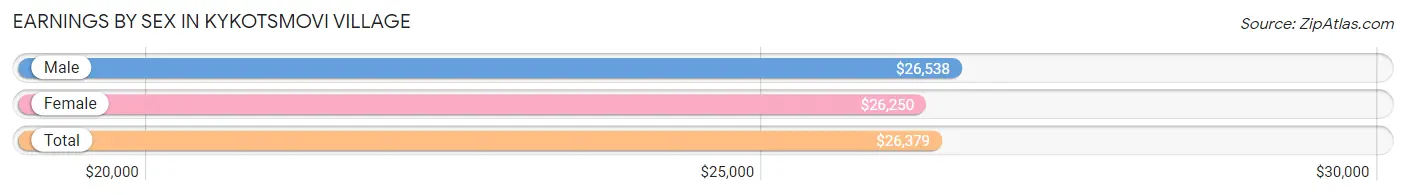
Earnings by Sex in Kykotsmovi Village
Average Earnings in Kykotsmovi Village are $26,379, $26,538 for men and $26,250 for women, a difference of 1.1%.
| Sex | Number | Average Earnings |
| Male | 208 (49.8%) | $26,538 |
| Female | 210 (50.2%) | $26,250 |
| Total | 418 (100.0%) | $26,379 |
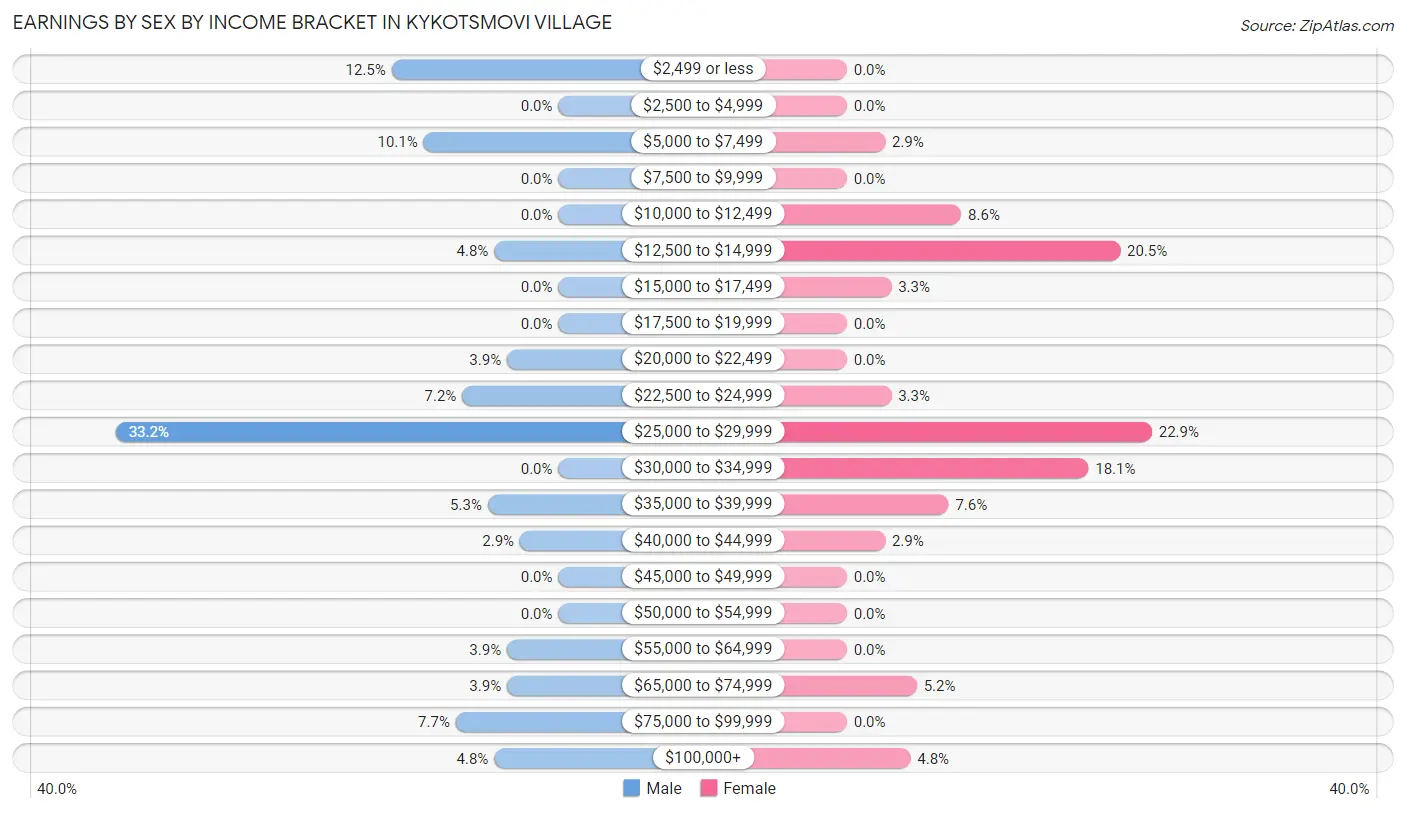
Earnings by Sex by Income Bracket in Kykotsmovi Village
The most common earnings brackets in Kykotsmovi Village are $25,000 to $29,999 for men (69 | 33.2%) and $25,000 to $29,999 for women (48 | 22.9%).
| Income | Male | Female |
| $2,499 or less | 26 (12.5%) | 0 (0.0%) |
| $2,500 to $4,999 | 0 (0.0%) | 0 (0.0%) |
| $5,000 to $7,499 | 21 (10.1%) | 6 (2.9%) |
| $7,500 to $9,999 | 0 (0.0%) | 0 (0.0%) |
| $10,000 to $12,499 | 0 (0.0%) | 18 (8.6%) |
| $12,500 to $14,999 | 10 (4.8%) | 43 (20.5%) |
| $15,000 to $17,499 | 0 (0.0%) | 7 (3.3%) |
| $17,500 to $19,999 | 0 (0.0%) | 0 (0.0%) |
| $20,000 to $22,499 | 8 (3.8%) | 0 (0.0%) |
| $22,500 to $24,999 | 15 (7.2%) | 7 (3.3%) |
| $25,000 to $29,999 | 69 (33.2%) | 48 (22.9%) |
| $30,000 to $34,999 | 0 (0.0%) | 38 (18.1%) |
| $35,000 to $39,999 | 11 (5.3%) | 16 (7.6%) |
| $40,000 to $44,999 | 6 (2.9%) | 6 (2.9%) |
| $45,000 to $49,999 | 0 (0.0%) | 0 (0.0%) |
| $50,000 to $54,999 | 0 (0.0%) | 0 (0.0%) |
| $55,000 to $64,999 | 8 (3.8%) | 0 (0.0%) |
| $65,000 to $74,999 | 8 (3.8%) | 11 (5.2%) |
| $75,000 to $99,999 | 16 (7.7%) | 0 (0.0%) |
| $100,000+ | 10 (4.8%) | 10 (4.8%) |
| Total | 208 (100.0%) | 210 (100.0%) |
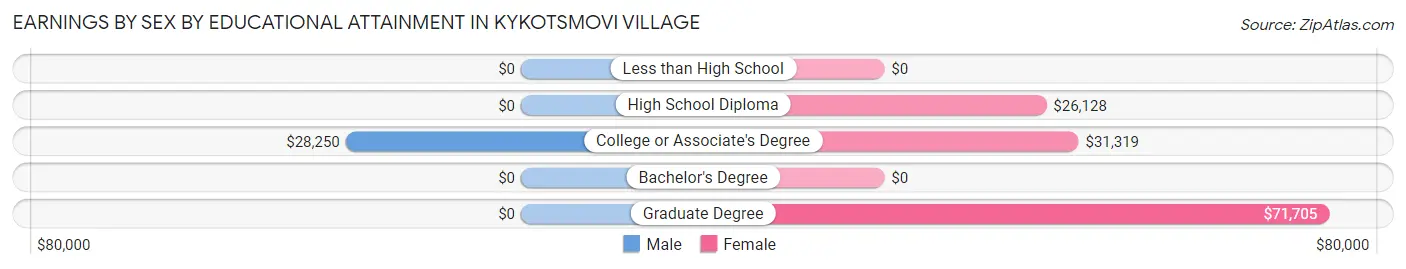
Earnings by Sex by Educational Attainment in Kykotsmovi Village
Average earnings in Kykotsmovi Village are $28,125 for men and $27,370 for women, a difference of 2.7%. Men with an educational attainment of college or associate's degree enjoy the highest average annual earnings of $28,250, while those with college or associate's degree education earn the least with $28,250. Women with an educational attainment of graduate degree earn the most with the average annual earnings of $71,705, while those with high school diploma education have the smallest earnings of $26,128.
| Educational Attainment | Male Income | Female Income |
| Less than High School | - | - |
| High School Diploma | - | - |
| College or Associate's Degree | $28,250 | $31,319 |
| Bachelor's Degree | - | - |
| Graduate Degree | - | - |
| Total | $28,125 | $27,370 |
Family Income in Kykotsmovi Village
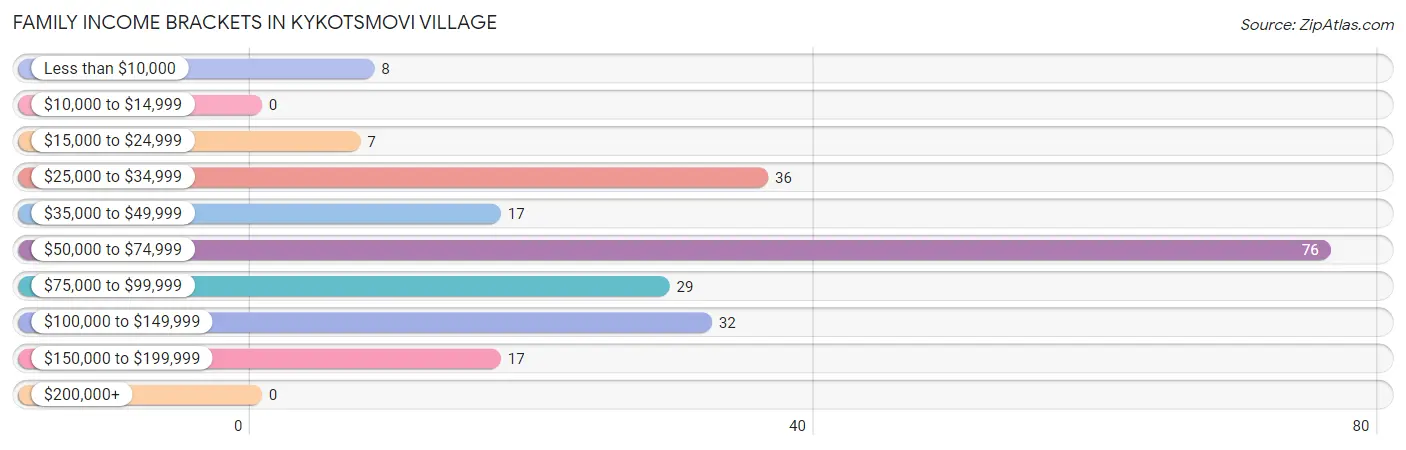
Family Income Brackets in Kykotsmovi Village
According to the Kykotsmovi Village family income data, there are 76 families falling into the $50,000 to $74,999 income range, which is the most common income bracket and makes up 34.2% of all families.
| Income Bracket | # Families | % Families |
| Less than $10,000 | 8 | 3.6% |
| $10,000 to $14,999 | 0 | 0.0% |
| $15,000 to $24,999 | 7 | 3.2% |
| $25,000 to $34,999 | 36 | 16.2% |
| $35,000 to $49,999 | 17 | 7.7% |
| $50,000 to $74,999 | 76 | 34.2% |
| $75,000 to $99,999 | 29 | 13.1% |
| $100,000 to $149,999 | 32 | 14.4% |
| $150,000 to $199,999 | 17 | 7.7% |
| $200,000+ | 0 | 0.0% |
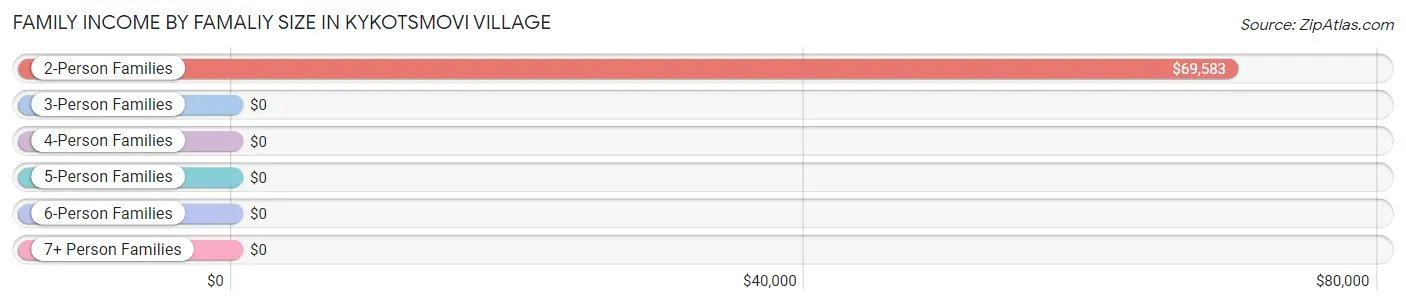
Family Income by Famaliy Size in Kykotsmovi Village
2-person families (72 | 32.4%) account for the highest median family income in Kykotsmovi Village with $69,583 per family, while 2-person families (72 | 32.4%) have the highest median income of $34,792 per family member.
| Income Bracket | # Families | Median Income |
| 2-Person Families | 72 (32.4%) | $69,583 |
| 3-Person Families | 72 (32.4%) | $0 |
| 4-Person Families | 15 (6.8%) | $0 |
| 5-Person Families | 22 (9.9%) | $0 |
| 6-Person Families | 35 (15.8%) | $0 |
| 7+ Person Families | 6 (2.7%) | $0 |
| Total | 222 (100.0%) | $64,408 |
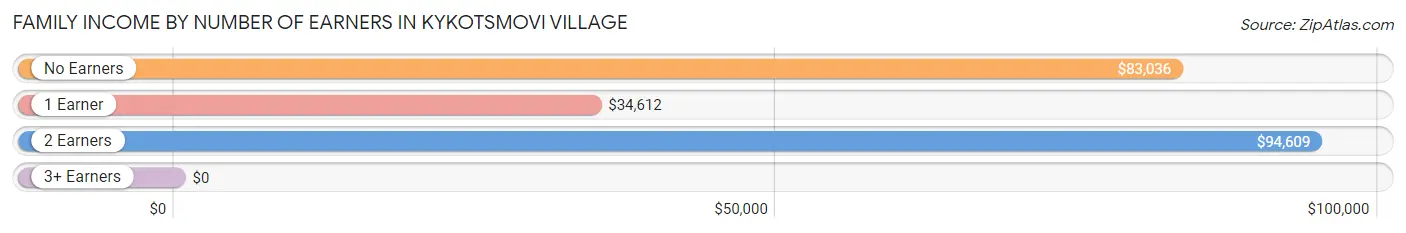
Family Income by Number of Earners in Kykotsmovi Village
| Number of Earners | # Families | Median Income |
| No Earners | 23 (10.4%) | $83,036 |
| 1 Earner | 79 (35.6%) | $34,612 |
| 2 Earners | 79 (35.6%) | $94,609 |
| 3+ Earners | 41 (18.5%) | $0 |
| Total | 222 (100.0%) | $64,408 |
Household Income in Kykotsmovi Village
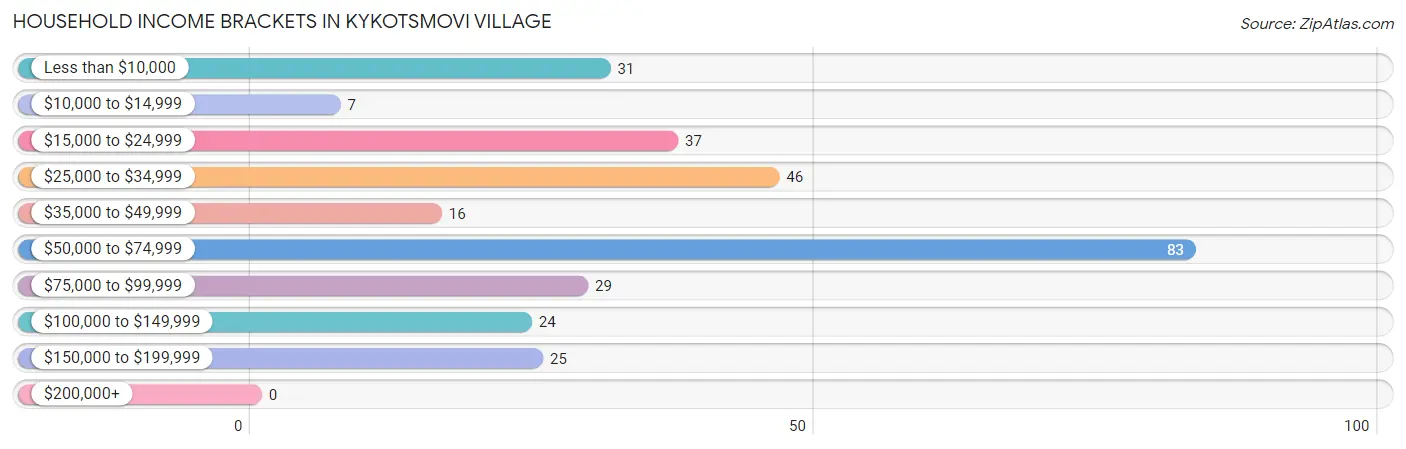
Household Income Brackets in Kykotsmovi Village
With 83 households falling in the category, the $50,000 to $74,999 income range is the most frequent in Kykotsmovi Village, accounting for 27.9% of all households.
| Income Bracket | # Households | % Households |
| Less than $10,000 | 31 | 10.4% |
| $10,000 to $14,999 | 7 | 2.3% |
| $15,000 to $24,999 | 37 | 12.4% |
| $25,000 to $34,999 | 46 | 15.4% |
| $35,000 to $49,999 | 16 | 5.4% |
| $50,000 to $74,999 | 83 | 27.9% |
| $75,000 to $99,999 | 29 | 9.7% |
| $100,000 to $149,999 | 24 | 8.1% |
| $150,000 to $199,999 | 25 | 8.4% |
| $200,000+ | 0 | 0.0% |
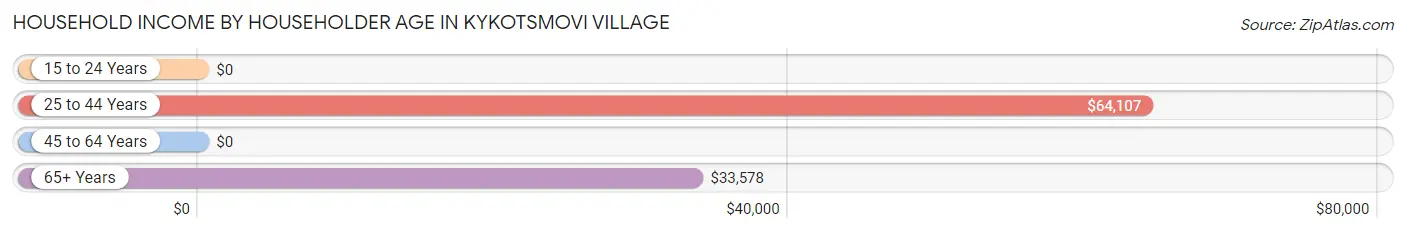
Household Income by Householder Age in Kykotsmovi Village
The median household income in Kykotsmovi Village is $52,143, with the highest median household income of $64,107 found in the 25 to 44 years age bracket for the primary householder. A total of 79 households (26.5%) fall into this category.
| Income Bracket | # Households | Median Income |
| 15 to 24 Years | 0 (0.0%) | $0 |
| 25 to 44 Years | 79 (26.5%) | $64,107 |
| 45 to 64 Years | 74 (24.8%) | $0 |
| 65+ Years | 145 (48.7%) | $33,578 |
| Total | 298 (100.0%) | $52,143 |
Poverty in Kykotsmovi Village
Income Below Poverty by Sex and Age in Kykotsmovi Village
With 9.5% poverty level for males and 6.6% for females among the residents of Kykotsmovi Village, 35 to 44 year old males and 55 to 64 year old females are the most vulnerable to poverty, with 10 males (33.3%) and 17 females (44.7%) in their respective age groups living below the poverty level.
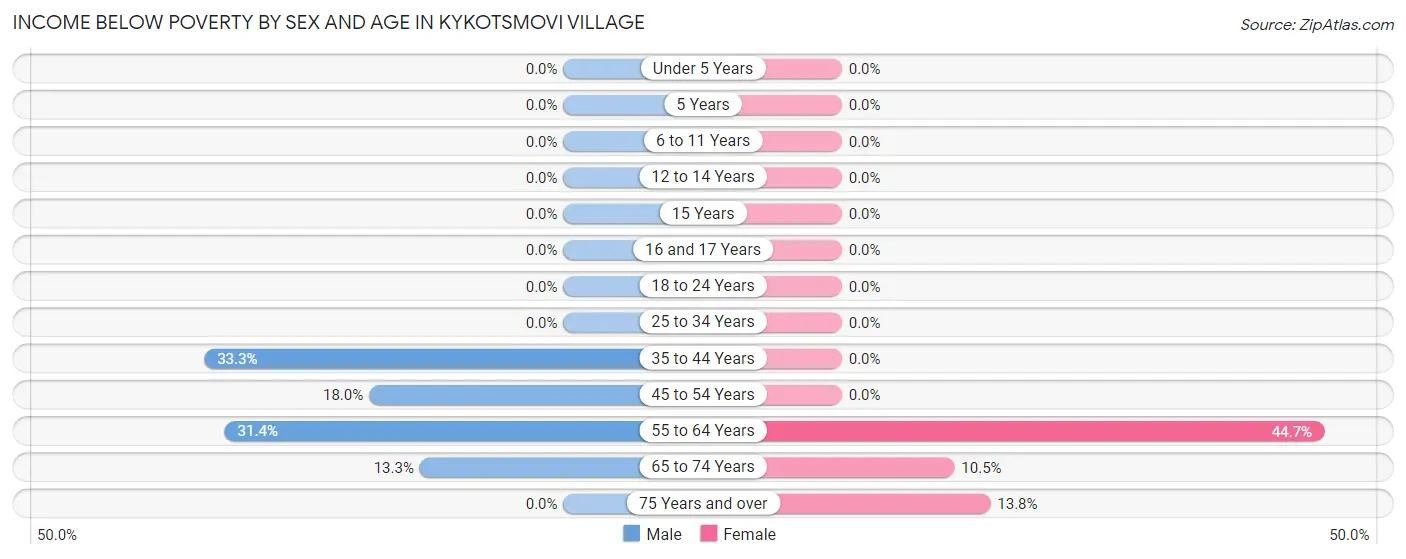
| Age Bracket | Male | Female |
| Under 5 Years | 0 (0.0%) | 0 (0.0%) |
| 5 Years | 0 (0.0%) | 0 (0.0%) |
| 6 to 11 Years | 0 (0.0%) | 0 (0.0%) |
| 12 to 14 Years | 0 (0.0%) | 0 (0.0%) |
| 15 Years | 0 (0.0%) | 0 (0.0%) |
| 16 and 17 Years | 0 (0.0%) | 0 (0.0%) |
| 18 to 24 Years | 0 (0.0%) | 0 (0.0%) |
| 25 to 34 Years | 0 (0.0%) | 0 (0.0%) |
| 35 to 44 Years | 10 (33.3%) | 0 (0.0%) |
| 45 to 54 Years | 11 (18.0%) | 0 (0.0%) |
| 55 to 64 Years | 11 (31.4%) | 17 (44.7%) |
| 65 to 74 Years | 6 (13.3%) | 7 (10.4%) |
| 75 Years and over | 0 (0.0%) | 8 (13.8%) |
| Total | 38 (9.5%) | 32 (6.6%) |
Income Above Poverty by Sex and Age in Kykotsmovi Village
According to the poverty statistics in Kykotsmovi Village, males aged under 5 years and females aged under 5 years are the age groups that are most secure financially, with 100.0% of males and 100.0% of females in these age groups living above the poverty line.
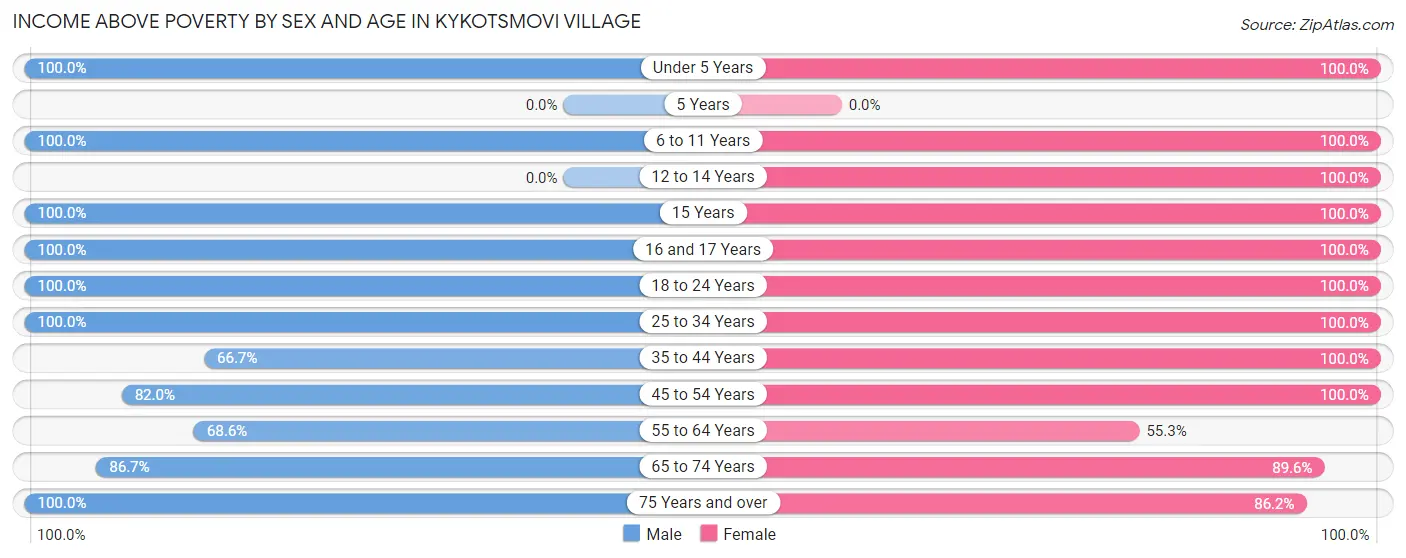
| Age Bracket | Male | Female |
| Under 5 Years | 53 (100.0%) | 40 (100.0%) |
| 5 Years | 0 (0.0%) | 0 (0.0%) |
| 6 to 11 Years | 28 (100.0%) | 16 (100.0%) |
| 12 to 14 Years | 0 (0.0%) | 5 (100.0%) |
| 15 Years | 7 (100.0%) | 9 (100.0%) |
| 16 and 17 Years | 21 (100.0%) | 14 (100.0%) |
| 18 to 24 Years | 55 (100.0%) | 107 (100.0%) |
| 25 to 34 Years | 36 (100.0%) | 14 (100.0%) |
| 35 to 44 Years | 20 (66.7%) | 84 (100.0%) |
| 45 to 54 Years | 50 (82.0%) | 34 (100.0%) |
| 55 to 64 Years | 24 (68.6%) | 21 (55.3%) |
| 65 to 74 Years | 39 (86.7%) | 60 (89.5%) |
| 75 Years and over | 30 (100.0%) | 50 (86.2%) |
| Total | 363 (90.5%) | 454 (93.4%) |
Income Below Poverty Among Married-Couple Families in Kykotsmovi Village
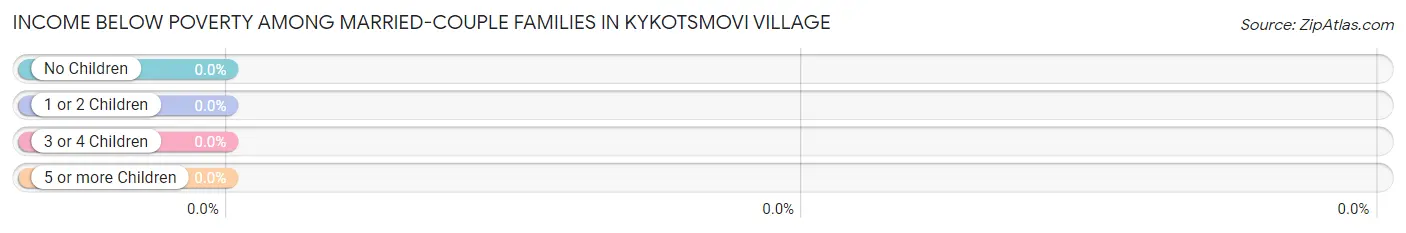
| Children | Above Poverty | Below Poverty |
| No Children | 82 (100.0%) | 0 (0.0%) |
| 1 or 2 Children | 29 (100.0%) | 0 (0.0%) |
| 3 or 4 Children | 0 (0.0%) | 0 (0.0%) |
| 5 or more Children | 0 (0.0%) | 0 (0.0%) |
| Total | 111 (100.0%) | 0 (0.0%) |
Income Below Poverty Among Single-Parent Households in Kykotsmovi Village
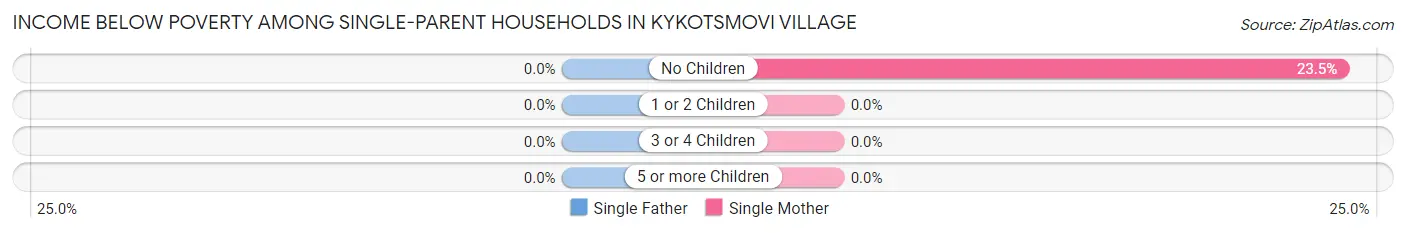
| Children | Single Father | Single Mother |
| No Children | 0 (0.0%) | 8 (23.5%) |
| 1 or 2 Children | 0 (0.0%) | 0 (0.0%) |
| 3 or 4 Children | 0 (0.0%) | 0 (0.0%) |
| 5 or more Children | 0 (0.0%) | 0 (0.0%) |
| Total | 0 (0.0%) | 8 (7.8%) |
Income Below Poverty Among Married-Couple vs Single-Parent Households in Kykotsmovi Village
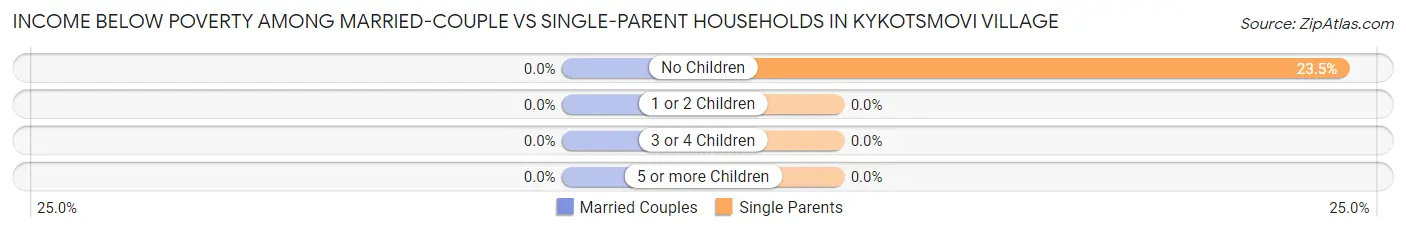
| Children | Married-Couple Families | Single-Parent Households |
| No Children | 0 (0.0%) | 8 (23.5%) |
| 1 or 2 Children | 0 (0.0%) | 0 (0.0%) |
| 3 or 4 Children | 0 (0.0%) | 0 (0.0%) |
| 5 or more Children | 0 (0.0%) | 0 (0.0%) |
| Total | 0 (0.0%) | 8 (7.2%) |
Race in Kykotsmovi Village
The most populous races in Kykotsmovi Village are Native / Alaskan (872 | 98.3%), Hispanic or Latino (16 | 1.8%), and White / Caucasian (15 | 1.7%).
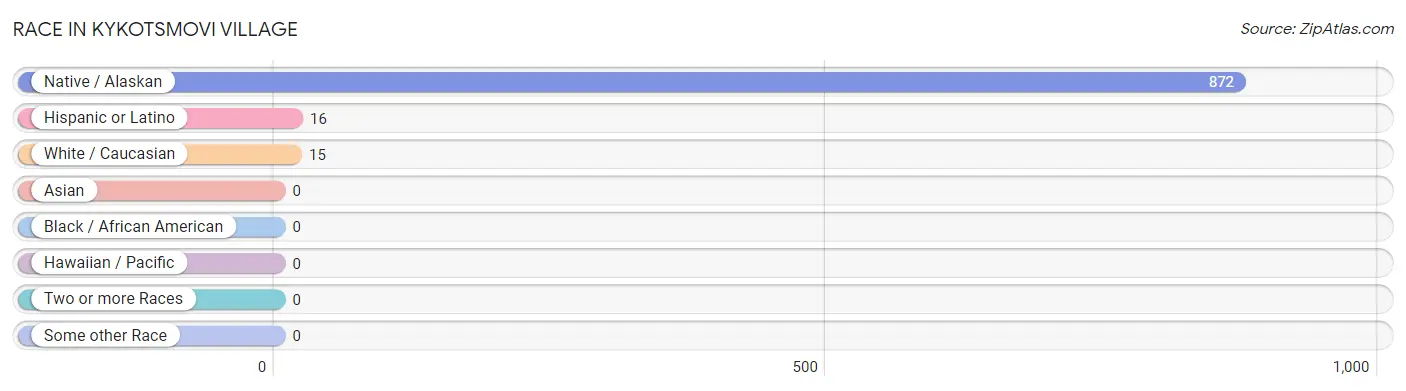
| Race | # Population | % Population |
| Asian | 0 | 0.0% |
| Black / African American | 0 | 0.0% |
| Hawaiian / Pacific | 0 | 0.0% |
| Hispanic or Latino | 16 | 1.8% |
| Native / Alaskan | 872 | 98.3% |
| White / Caucasian | 15 | 1.7% |
| Two or more Races | 0 | 0.0% |
| Some other Race | 0 | 0.0% |
| Total | 887 | 100.0% |
Ancestry in Kykotsmovi Village
The most populous ancestries reported in Kykotsmovi Village are Hopi (836 | 94.3%), Navajo (17 | 1.9%), Mexican (16 | 1.8%), English (12 | 1.3%), and Pima (10 | 1.1%), together accounting for 100.4% of all Kykotsmovi Village residents.
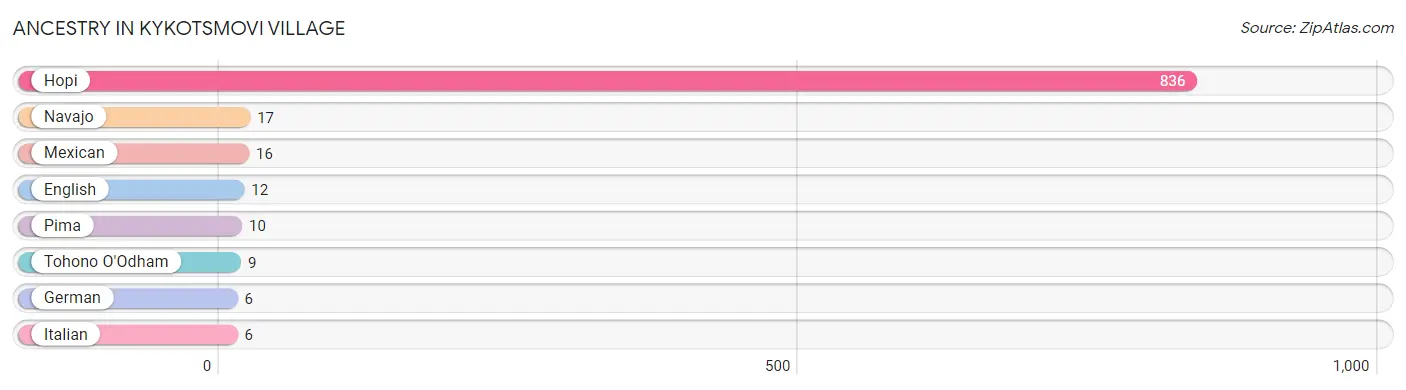
| Ancestry | # Population | % Population |
| English | 12 | 1.3% |
| German | 6 | 0.7% |
| Hopi | 836 | 94.3% |
| Italian | 6 | 0.7% |
| Mexican | 16 | 1.8% |
| Navajo | 17 | 1.9% |
| Pima | 10 | 1.1% |
| Tohono O'Odham | 9 | 1.0% | View All 8 Rows |
Immigrants in Kykotsmovi Village
The most numerous immigrant groups reported in Kykotsmovi Village came from , and Africa (6 | 0.7%), together accounting for 0.7% of all Kykotsmovi Village residents.

| Immigration Origin | # Population | % Population |
| Africa | 6 | 0.7% | View All 1 Rows |
Sex and Age in Kykotsmovi Village
Sex and Age in Kykotsmovi Village
The most populous age groups in Kykotsmovi Village are 20 to 24 Years (55 | 13.7%) for men and 15 to 19 Years (68 | 14.0%) for women.
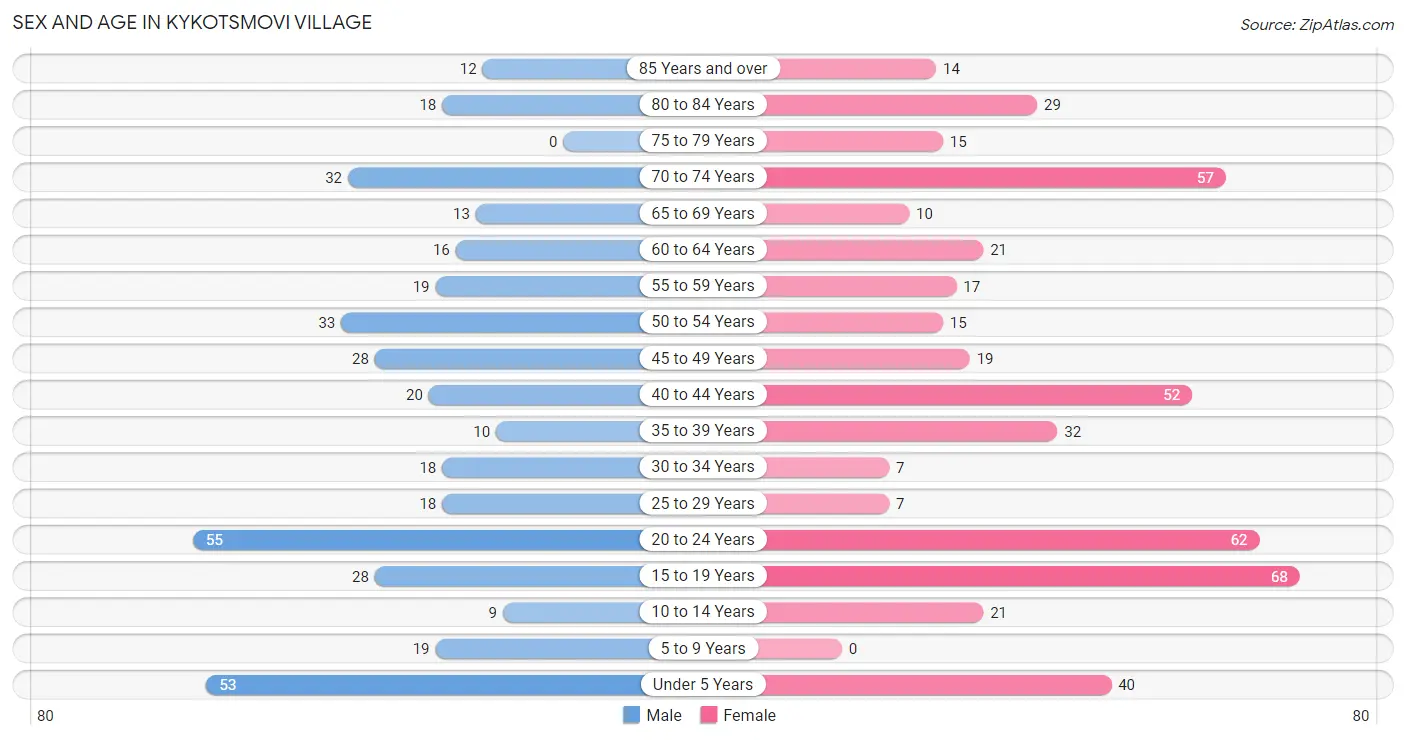
| Age Bracket | Male | Female |
| Under 5 Years | 53 (13.2%) | 40 (8.2%) |
| 5 to 9 Years | 19 (4.7%) | 0 (0.0%) |
| 10 to 14 Years | 9 (2.2%) | 21 (4.3%) |
| 15 to 19 Years | 28 (7.0%) | 68 (14.0%) |
| 20 to 24 Years | 55 (13.7%) | 62 (12.8%) |
| 25 to 29 Years | 18 (4.5%) | 7 (1.4%) |
| 30 to 34 Years | 18 (4.5%) | 7 (1.4%) |
| 35 to 39 Years | 10 (2.5%) | 32 (6.6%) |
| 40 to 44 Years | 20 (5.0%) | 52 (10.7%) |
| 45 to 49 Years | 28 (7.0%) | 19 (3.9%) |
| 50 to 54 Years | 33 (8.2%) | 15 (3.1%) |
| 55 to 59 Years | 19 (4.7%) | 17 (3.5%) |
| 60 to 64 Years | 16 (4.0%) | 21 (4.3%) |
| 65 to 69 Years | 13 (3.2%) | 10 (2.1%) |
| 70 to 74 Years | 32 (8.0%) | 57 (11.7%) |
| 75 to 79 Years | 0 (0.0%) | 15 (3.1%) |
| 80 to 84 Years | 18 (4.5%) | 29 (6.0%) |
| 85 Years and over | 12 (3.0%) | 14 (2.9%) |
| Total | 401 (100.0%) | 486 (100.0%) |
Families and Households in Kykotsmovi Village
Median Family Size in Kykotsmovi Village
The median family size in Kykotsmovi Village is 3.52 persons per family, with single female/mother families (103 | 46.4%) accounting for the largest median family size of 4.4 persons per family. On the other hand, married-couple families (111 | 50.0%) represent the smallest median family size with 2.67 persons per family.
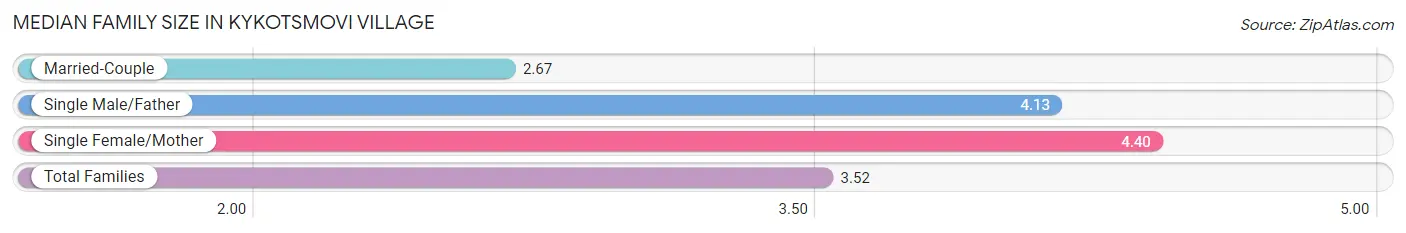
| Family Type | # Families | Family Size |
| Married-Couple | 111 (50.0%) | 2.67 |
| Single Male/Father | 8 (3.6%) | 4.13 |
| Single Female/Mother | 103 (46.4%) | 4.40 |
| Total Families | 222 (100.0%) | 3.52 |
Median Household Size in Kykotsmovi Village
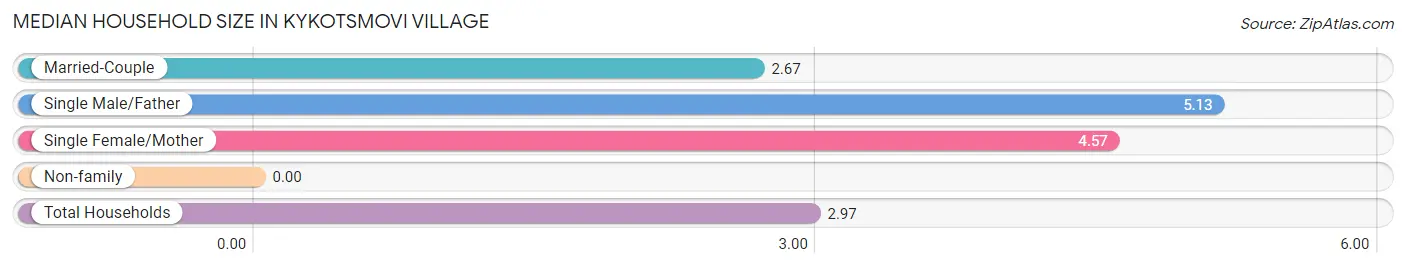
| Household Type | # Households | Household Size |
| Married-Couple | 111 (37.2%) | 2.67 |
| Single Male/Father | 8 (2.7%) | 5.13 |
| Single Female/Mother | 103 (34.6%) | 4.57 |
| Non-family | 76 (25.5%) | - |
| Total Households | 298 (100.0%) | 2.97 |
Household Size by Marriage Status in Kykotsmovi Village
Out of a total of 298 households in Kykotsmovi Village, 222 (74.5%) are family households, while 76 (25.5%) are nonfamily households. The most numerous type of family households are 3-person households, comprising 79, and the most common type of nonfamily households are 1-person households, comprising 76.
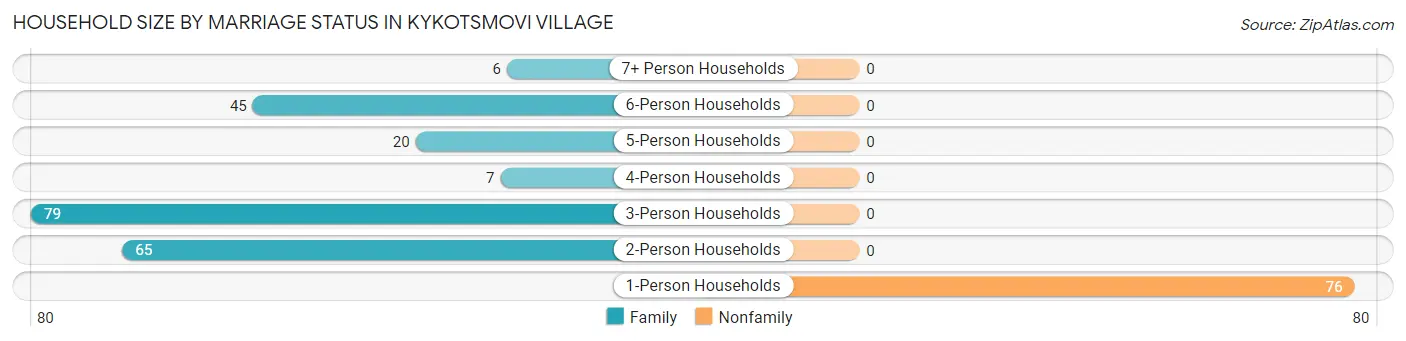
| Household Size | Family Households | Nonfamily Households |
| 1-Person Households | - | 76 (25.5%) |
| 2-Person Households | 65 (21.8%) | 0 (0.0%) |
| 3-Person Households | 79 (26.5%) | 0 (0.0%) |
| 4-Person Households | 7 (2.4%) | 0 (0.0%) |
| 5-Person Households | 20 (6.7%) | 0 (0.0%) |
| 6-Person Households | 45 (15.1%) | 0 (0.0%) |
| 7+ Person Households | 6 (2.0%) | 0 (0.0%) |
| Total | 222 (74.5%) | 76 (25.5%) |
Female Fertility in Kykotsmovi Village
Fertility by Age in Kykotsmovi Village
| Age Bracket | Women with Births | Births / 1,000 Women |
| 15 to 19 years | 0 (0.0%) | 0.0 |
| 20 to 34 years | 0 (0.0%) | 0.0 |
| 35 to 50 years | 0 (0.0%) | 0.0 |
| Total | 0 (0.0%) | 0.0 |
Fertility by Age by Marriage Status in Kykotsmovi Village
| Age Bracket | Married | Unmarried |
| 15 to 19 years | 0 (0.0%) | 0 (0.0%) |
| 20 to 34 years | 0 (0.0%) | 0 (0.0%) |
| 35 to 50 years | 0 (0.0%) | 0 (0.0%) |
| Total | 0 (0.0%) | 0 (0.0%) |
Fertility by Education in Kykotsmovi Village
| Educational Attainment | Women with Births | Births / 1,000 Women |
| Less than High School | 0 (0.0%) | 0.0 |
| High School Diploma | 0 (0.0%) | 0.0 |
| College or Associate's Degree | 0 (0.0%) | 0.0 |
| Bachelor's Degree | 0 (0.0%) | 0.0 |
| Graduate Degree | 0 (0.0%) | 0.0 |
| Total | 0 (0.0%) | 0.0 |
Fertility by Education by Marriage Status in Kykotsmovi Village
| Educational Attainment | Married | Unmarried |
| Less than High School | 0 (0.0%) | 0 (0.0%) |
| High School Diploma | 0 (0.0%) | 0 (0.0%) |
| College or Associate's Degree | 0 (0.0%) | 0 (0.0%) |
| Bachelor's Degree | 0 (0.0%) | 0 (0.0%) |
| Graduate Degree | 0 (0.0%) | 0 (0.0%) |
| Total | 0 (0.0%) | 0 (0.0%) |
Employment Characteristics in Kykotsmovi Village
Employment by Class of Employer in Kykotsmovi Village
Among the 299 employed individuals in Kykotsmovi Village, local government employees (99 | 33.1%), state government employees (67 | 22.4%), and private company employees (58 | 19.4%) make up the most common classes of employment.
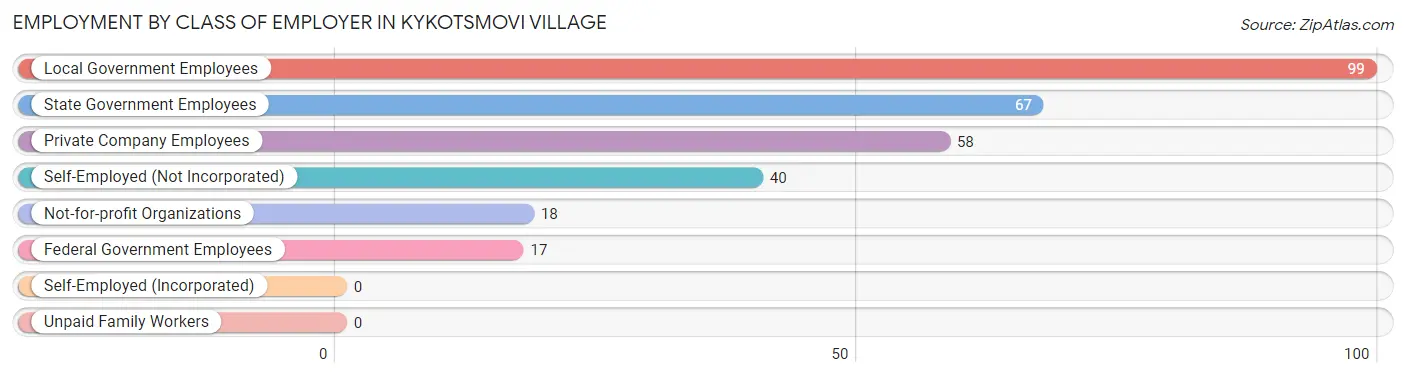
| Employer Class | # Employees | % Employees |
| Private Company Employees | 58 | 19.4% |
| Self-Employed (Incorporated) | 0 | 0.0% |
| Self-Employed (Not Incorporated) | 40 | 13.4% |
| Not-for-profit Organizations | 18 | 6.0% |
| Local Government Employees | 99 | 33.1% |
| State Government Employees | 67 | 22.4% |
| Federal Government Employees | 17 | 5.7% |
| Unpaid Family Workers | 0 | 0.0% |
| Total | 299 | 100.0% |
Employment Status by Age in Kykotsmovi Village
According to the labor force statistics for Kykotsmovi Village, out of the total population over 16 years of age (729), 47.1% or 343 individuals are in the labor force, with 7.6% or 26 of them unemployed. The age group with the highest labor force participation rate is 25 to 29 years, with 100.0% or 25 individuals in the labor force. Within the labor force, the 45 to 54 years age range has the highest percentage of unemployed individuals, with 21.3% or 16 of them being unemployed.
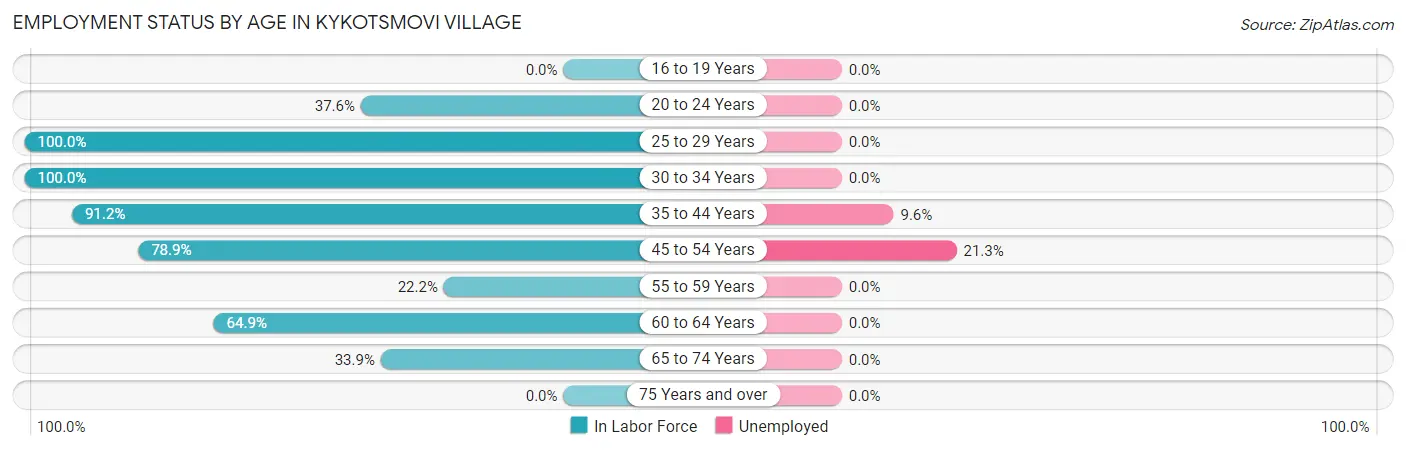
| Age Bracket | In Labor Force | Unemployed |
| 16 to 19 Years | 0 (0.0%) | 0 (0.0%) |
| 20 to 24 Years | 44 (37.6%) | 0 (0.0%) |
| 25 to 29 Years | 25 (100.0%) | 0 (0.0%) |
| 30 to 34 Years | 25 (100.0%) | 0 (0.0%) |
| 35 to 44 Years | 104 (91.2%) | 10 (9.6%) |
| 45 to 54 Years | 75 (78.9%) | 16 (21.3%) |
| 55 to 59 Years | 8 (22.2%) | 0 (0.0%) |
| 60 to 64 Years | 24 (64.9%) | 0 (0.0%) |
| 65 to 74 Years | 38 (33.9%) | 0 (0.0%) |
| 75 Years and over | 0 (0.0%) | 0 (0.0%) |
| Total | 343 (47.1%) | 26 (7.6%) |
Employment Status by Educational Attainment in Kykotsmovi Village
According to labor force statistics for Kykotsmovi Village, 78.6% of individuals (261) out of the total population between 25 and 64 years of age (332) are in the labor force, with 10.0% or 26 of them being unemployed. The group with the highest labor force participation rate are those with the educational attainment of college / associate degree, with 100.0% or 87 individuals in the labor force. Within the labor force, individuals with high school diploma education have the highest percentage of unemployment, with 20.8% or 26 of them being unemployed.
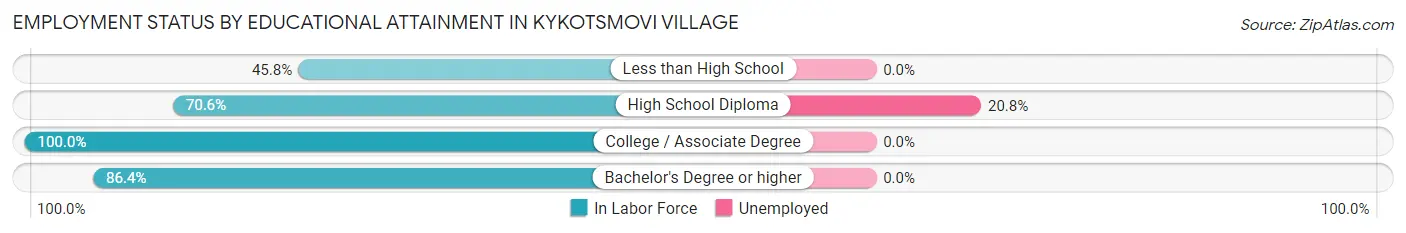
| Educational Attainment | In Labor Force | Unemployed |
| Less than High School | 11 (45.8%) | 0 (0.0%) |
| High School Diploma | 125 (70.6%) | 37 (20.8%) |
| College / Associate Degree | 87 (100.0%) | 0 (0.0%) |
| Bachelor's Degree or higher | 38 (86.4%) | 0 (0.0%) |
| Total | 261 (78.6%) | 33 (10.0%) |
Employment Occupations by Sex in Kykotsmovi Village
Management, Business, Science and Arts Occupations
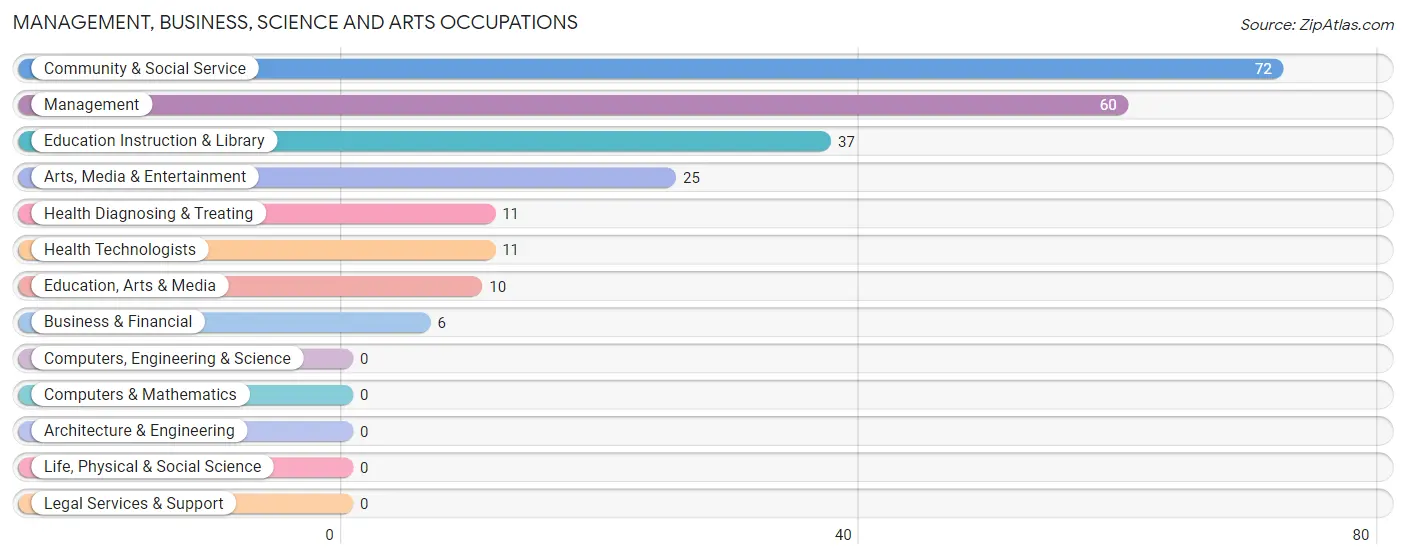
The most common Management, Business, Science and Arts occupations in Kykotsmovi Village are Community & Social Service (72 | 22.7%), Management (60 | 18.9%), Education Instruction & Library (37 | 11.7%), Arts, Media & Entertainment (25 | 7.9%), and Health Diagnosing & Treating (11 | 3.5%).
Management, Business, Science and Arts Occupations by Sex
Within the Management, Business, Science and Arts occupations in Kykotsmovi Village, the most male-oriented occupations are Management (73.3%), Arts, Media & Entertainment (56.0%), and Community & Social Service (36.1%), while the most female-oriented occupations are Business & Financial (100.0%), Education, Arts & Media (100.0%), and Health Diagnosing & Treating (100.0%).
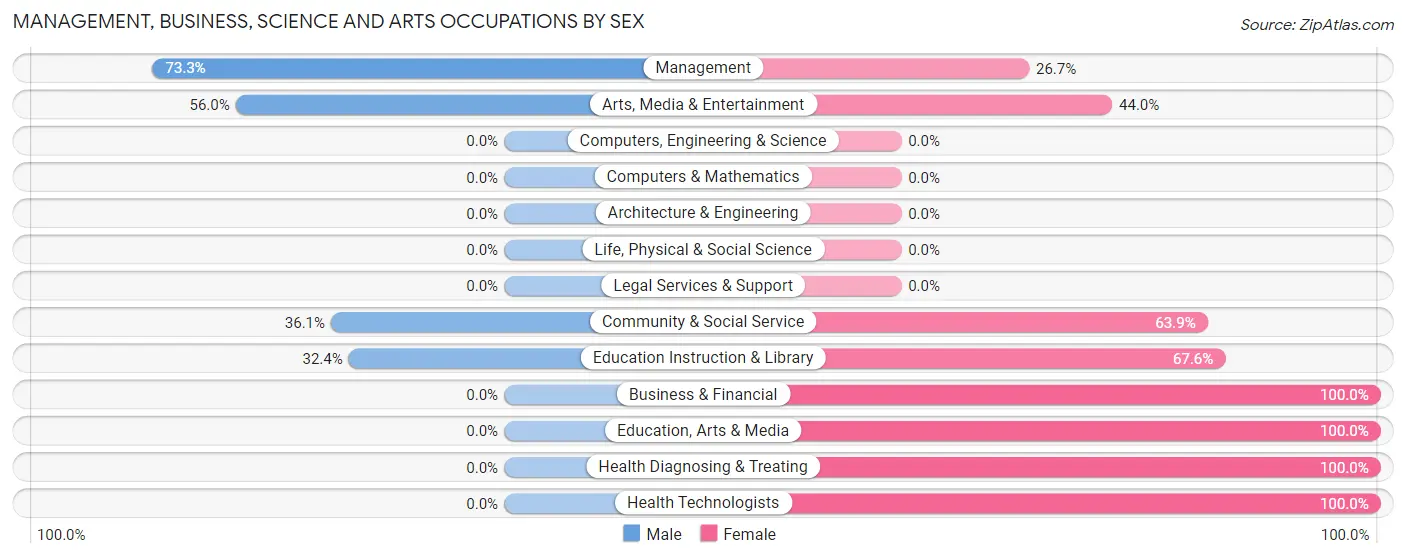
| Occupation | Male | Female |
| Management | 44 (73.3%) | 16 (26.7%) |
| Business & Financial | 0 (0.0%) | 6 (100.0%) |
| Computers, Engineering & Science | 0 (0.0%) | 0 (0.0%) |
| Computers & Mathematics | 0 (0.0%) | 0 (0.0%) |
| Architecture & Engineering | 0 (0.0%) | 0 (0.0%) |
| Life, Physical & Social Science | 0 (0.0%) | 0 (0.0%) |
| Community & Social Service | 26 (36.1%) | 46 (63.9%) |
| Education, Arts & Media | 0 (0.0%) | 10 (100.0%) |
| Legal Services & Support | 0 (0.0%) | 0 (0.0%) |
| Education Instruction & Library | 12 (32.4%) | 25 (67.6%) |
| Arts, Media & Entertainment | 14 (56.0%) | 11 (44.0%) |
| Health Diagnosing & Treating | 0 (0.0%) | 11 (100.0%) |
| Health Technologists | 0 (0.0%) | 11 (100.0%) |
| Total (Category) | 70 (47.0%) | 79 (53.0%) |
| Total (Overall) | 163 (51.4%) | 154 (48.6%) |
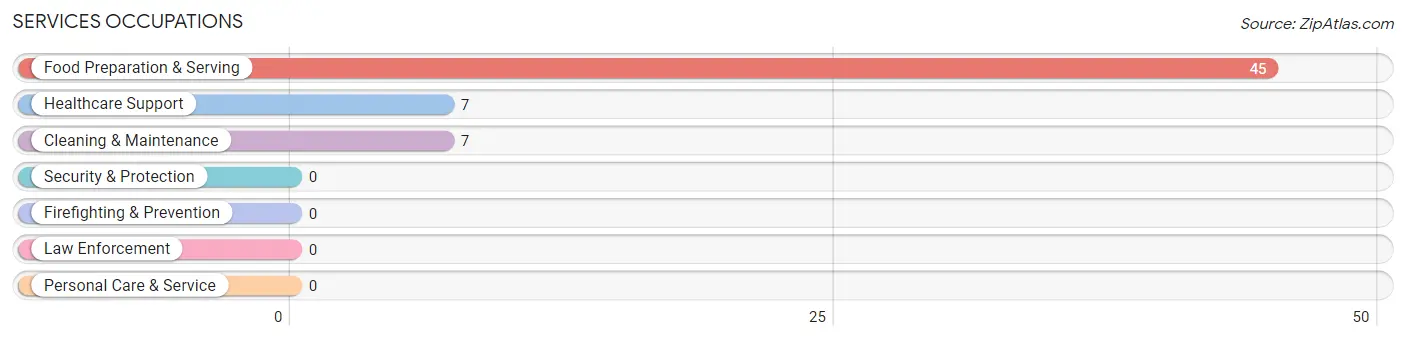
Services Occupations
The most common Services occupations in Kykotsmovi Village are Food Preparation & Serving (45 | 14.2%), Healthcare Support (7 | 2.2%), and Cleaning & Maintenance (7 | 2.2%).
Services Occupations by Sex
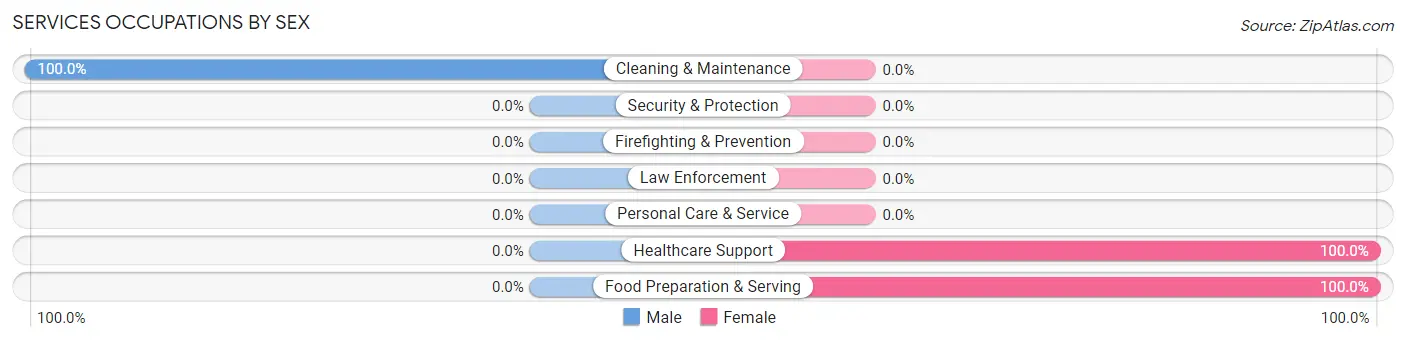
| Occupation | Male | Female |
| Healthcare Support | 0 (0.0%) | 7 (100.0%) |
| Security & Protection | 0 (0.0%) | 0 (0.0%) |
| Firefighting & Prevention | 0 (0.0%) | 0 (0.0%) |
| Law Enforcement | 0 (0.0%) | 0 (0.0%) |
| Food Preparation & Serving | 0 (0.0%) | 45 (100.0%) |
| Cleaning & Maintenance | 7 (100.0%) | 0 (0.0%) |
| Personal Care & Service | 0 (0.0%) | 0 (0.0%) |
| Total (Category) | 7 (11.9%) | 52 (88.1%) |
| Total (Overall) | 163 (51.4%) | 154 (48.6%) |
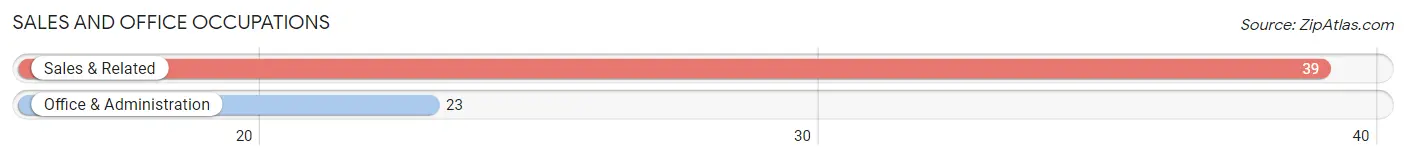
Sales and Office Occupations
The most common Sales and Office occupations in Kykotsmovi Village are Sales & Related (39 | 12.3%), and Office & Administration (23 | 7.3%).
Sales and Office Occupations by Sex
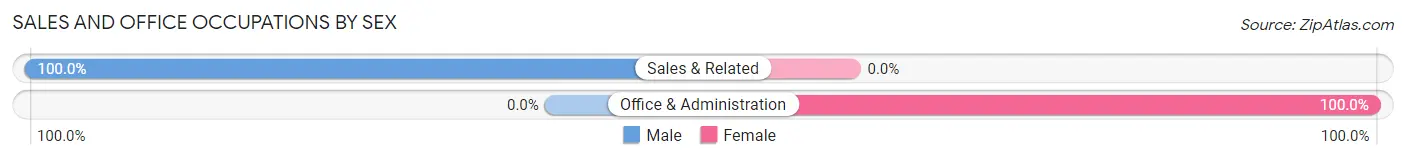
| Occupation | Male | Female |
| Sales & Related | 39 (100.0%) | 0 (0.0%) |
| Office & Administration | 0 (0.0%) | 23 (100.0%) |
| Total (Category) | 39 (62.9%) | 23 (37.1%) |
| Total (Overall) | 163 (51.4%) | 154 (48.6%) |
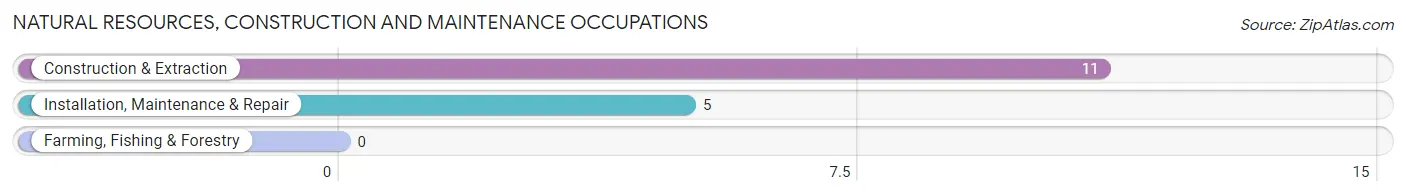
Natural Resources, Construction and Maintenance Occupations
The most common Natural Resources, Construction and Maintenance occupations in Kykotsmovi Village are Construction & Extraction (11 | 3.5%), and Installation, Maintenance & Repair (5 | 1.6%).
Natural Resources, Construction and Maintenance Occupations by Sex
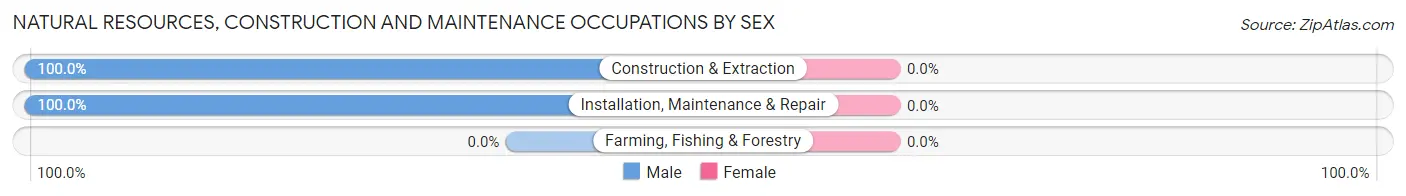
| Occupation | Male | Female |
| Farming, Fishing & Forestry | 0 (0.0%) | 0 (0.0%) |
| Construction & Extraction | 11 (100.0%) | 0 (0.0%) |
| Installation, Maintenance & Repair | 5 (100.0%) | 0 (0.0%) |
| Total (Category) | 16 (100.0%) | 0 (0.0%) |
| Total (Overall) | 163 (51.4%) | 154 (48.6%) |
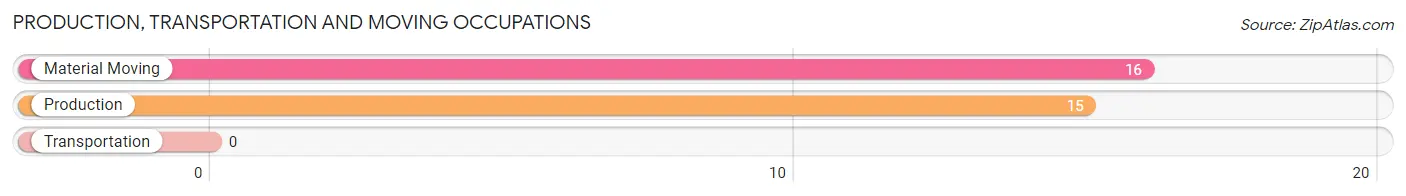
Production, Transportation and Moving Occupations
The most common Production, Transportation and Moving occupations in Kykotsmovi Village are Material Moving (16 | 5.1%), and Production (15 | 4.7%).
Production, Transportation and Moving Occupations by Sex
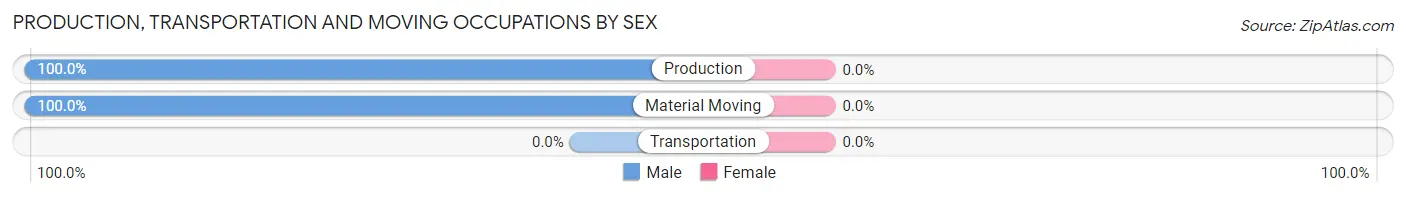
| Occupation | Male | Female |
| Production | 15 (100.0%) | 0 (0.0%) |
| Transportation | 0 (0.0%) | 0 (0.0%) |
| Material Moving | 16 (100.0%) | 0 (0.0%) |
| Total (Category) | 31 (100.0%) | 0 (0.0%) |
| Total (Overall) | 163 (51.4%) | 154 (48.6%) |
Employment Industries by Sex in Kykotsmovi Village
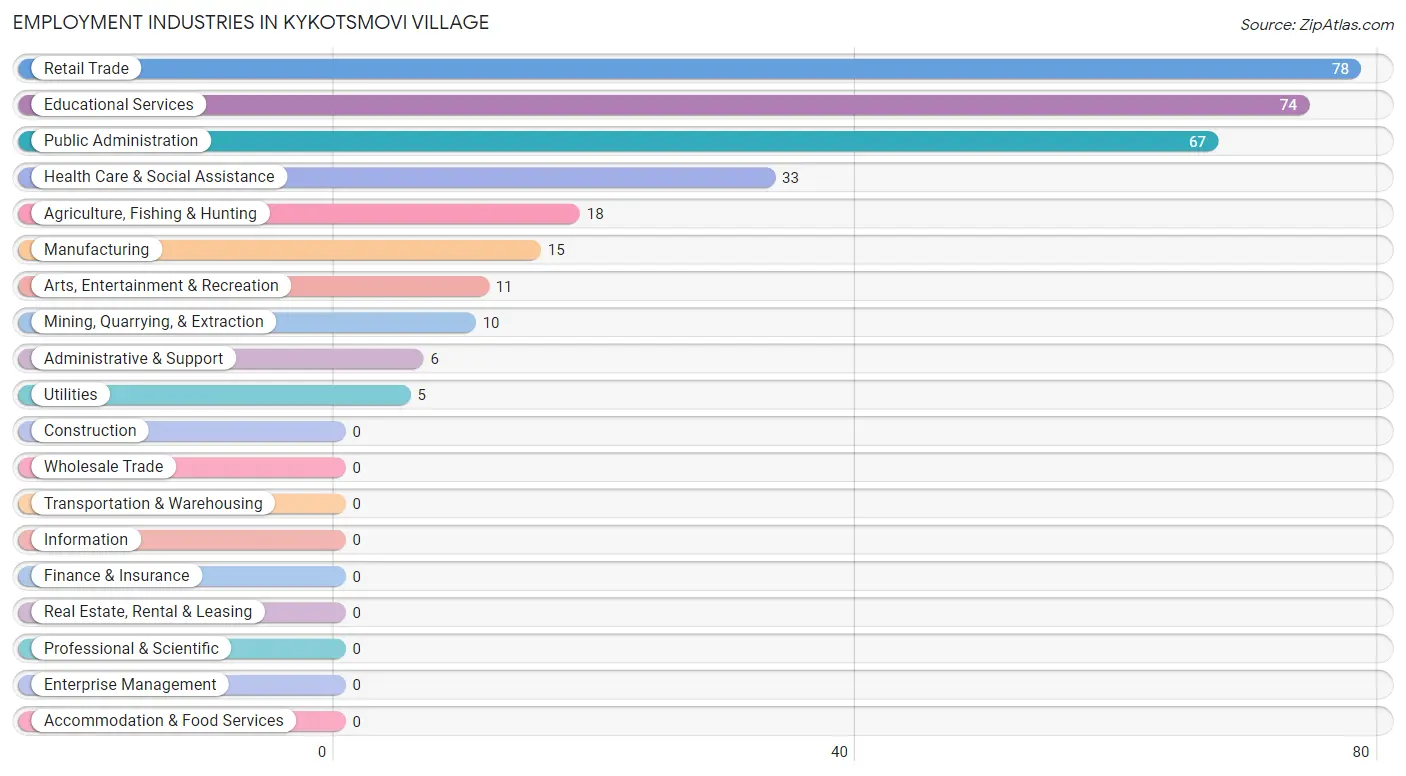
Employment Industries in Kykotsmovi Village
The major employment industries in Kykotsmovi Village include Retail Trade (78 | 24.6%), Educational Services (74 | 23.3%), Public Administration (67 | 21.1%), Health Care & Social Assistance (33 | 10.4%), and Agriculture, Fishing & Hunting (18 | 5.7%).
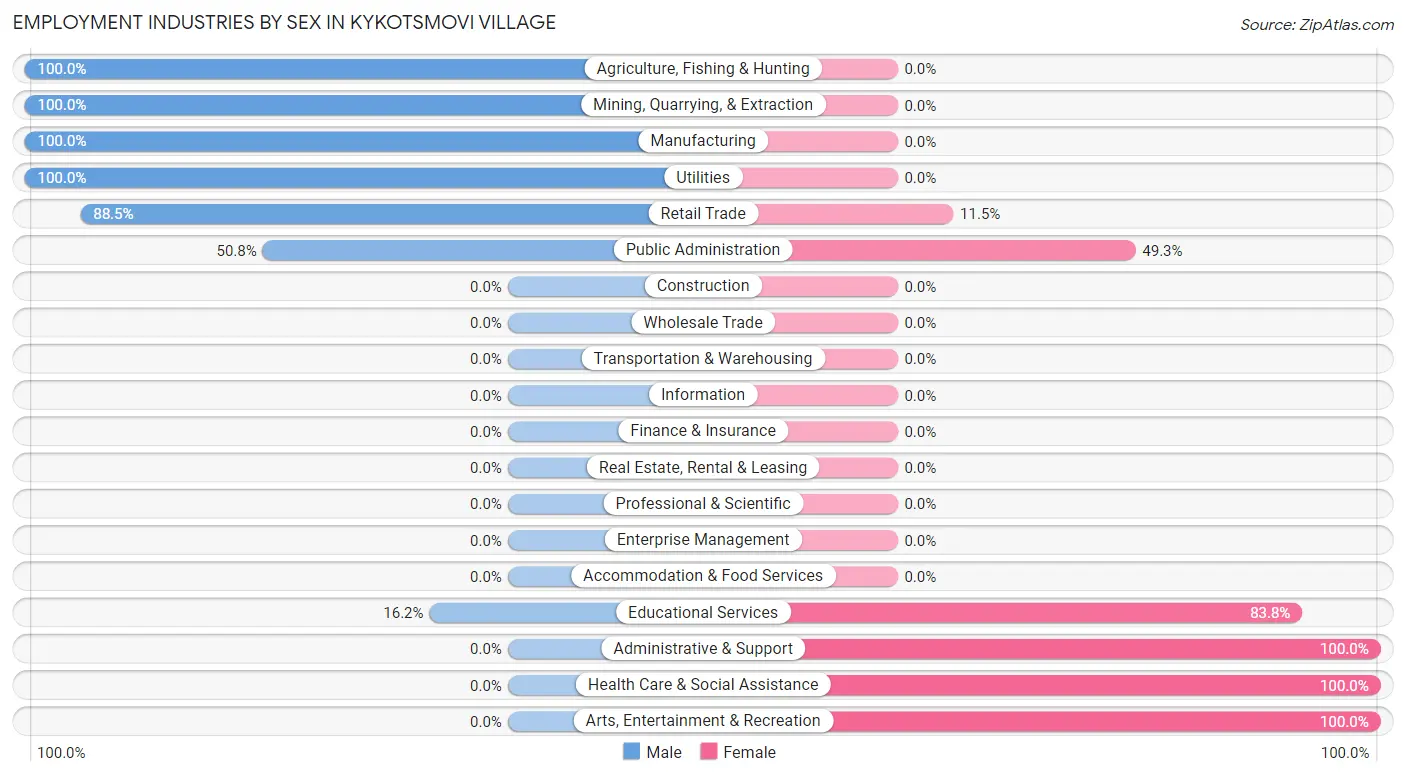
Employment Industries by Sex in Kykotsmovi Village
The Kykotsmovi Village industries that see more men than women are Agriculture, Fishing & Hunting (100.0%), Mining, Quarrying, & Extraction (100.0%), and Manufacturing (100.0%), whereas the industries that tend to have a higher number of women are Administrative & Support (100.0%), Health Care & Social Assistance (100.0%), and Arts, Entertainment & Recreation (100.0%).
| Industry | Male | Female |
| Agriculture, Fishing & Hunting | 18 (100.0%) | 0 (0.0%) |
| Mining, Quarrying, & Extraction | 10 (100.0%) | 0 (0.0%) |
| Construction | 0 (0.0%) | 0 (0.0%) |
| Manufacturing | 15 (100.0%) | 0 (0.0%) |
| Wholesale Trade | 0 (0.0%) | 0 (0.0%) |
| Retail Trade | 69 (88.5%) | 9 (11.5%) |
| Transportation & Warehousing | 0 (0.0%) | 0 (0.0%) |
| Utilities | 5 (100.0%) | 0 (0.0%) |
| Information | 0 (0.0%) | 0 (0.0%) |
| Finance & Insurance | 0 (0.0%) | 0 (0.0%) |
| Real Estate, Rental & Leasing | 0 (0.0%) | 0 (0.0%) |
| Professional & Scientific | 0 (0.0%) | 0 (0.0%) |
| Enterprise Management | 0 (0.0%) | 0 (0.0%) |
| Administrative & Support | 0 (0.0%) | 6 (100.0%) |
| Educational Services | 12 (16.2%) | 62 (83.8%) |
| Health Care & Social Assistance | 0 (0.0%) | 33 (100.0%) |
| Arts, Entertainment & Recreation | 0 (0.0%) | 11 (100.0%) |
| Accommodation & Food Services | 0 (0.0%) | 0 (0.0%) |
| Public Administration | 34 (50.7%) | 33 (49.2%) |
| Total | 163 (51.4%) | 154 (48.6%) |
Education in Kykotsmovi Village
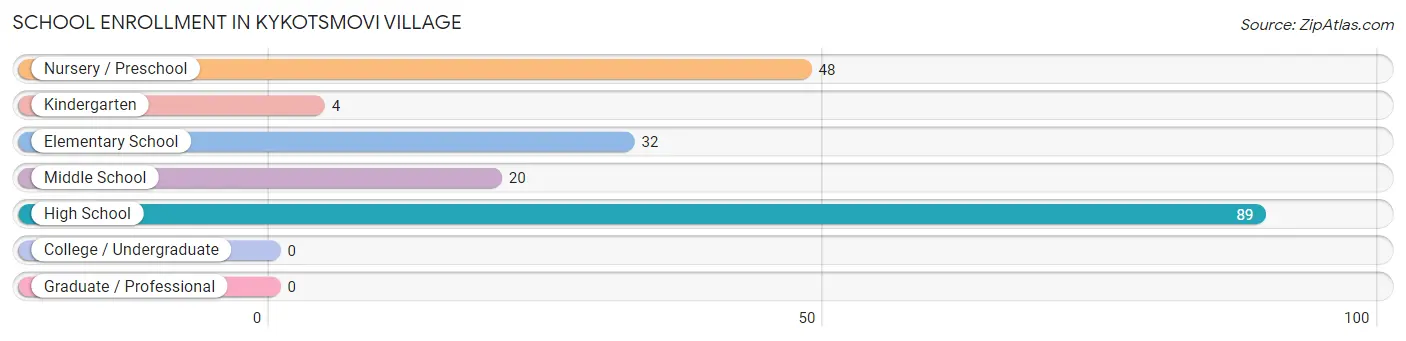
School Enrollment in Kykotsmovi Village
The most common levels of schooling among the 193 students in Kykotsmovi Village are high school (89 | 46.1%), nursery / preschool (48 | 24.9%), and elementary school (32 | 16.6%).
| School Level | # Students | % Students |
| Nursery / Preschool | 48 | 24.9% |
| Kindergarten | 4 | 2.1% |
| Elementary School | 32 | 16.6% |
| Middle School | 20 | 10.4% |
| High School | 89 | 46.1% |
| College / Undergraduate | 0 | 0.0% |
| Graduate / Professional | 0 | 0.0% |
| Total | 193 | 100.0% |
School Enrollment by Age by Funding Source in Kykotsmovi Village
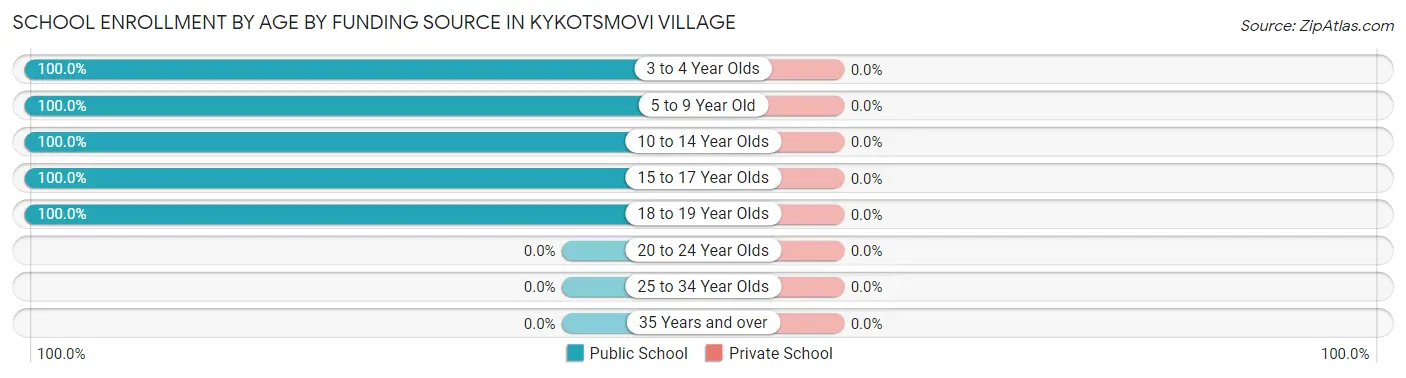
| Age Bracket | Public School | Private School |
| 3 to 4 Year Olds | 48 (100.0%) | 0 (0.0%) |
| 5 to 9 Year Old | 19 (100.0%) | 0 (0.0%) |
| 10 to 14 Year Olds | 30 (100.0%) | 0 (0.0%) |
| 15 to 17 Year Olds | 51 (100.0%) | 0 (0.0%) |
| 18 to 19 Year Olds | 45 (100.0%) | 0 (0.0%) |
| 20 to 24 Year Olds | 0 (0.0%) | 0 (0.0%) |
| 25 to 34 Year Olds | 0 (0.0%) | 0 (0.0%) |
| 35 Years and over | 0 (0.0%) | 0 (0.0%) |
| Total | 193 (100.0%) | 0 (0.0%) |
Educational Attainment by Field of Study in Kykotsmovi Village
Education (36 | 40.5%), multidisciplinary studies (11 | 12.4%), science & technology (11 | 12.4%), social sciences (7 | 7.9%), and bio, nature & agricultural (6 | 6.7%) are the most common fields of study among 89 individuals in Kykotsmovi Village who have obtained a bachelor's degree or higher.
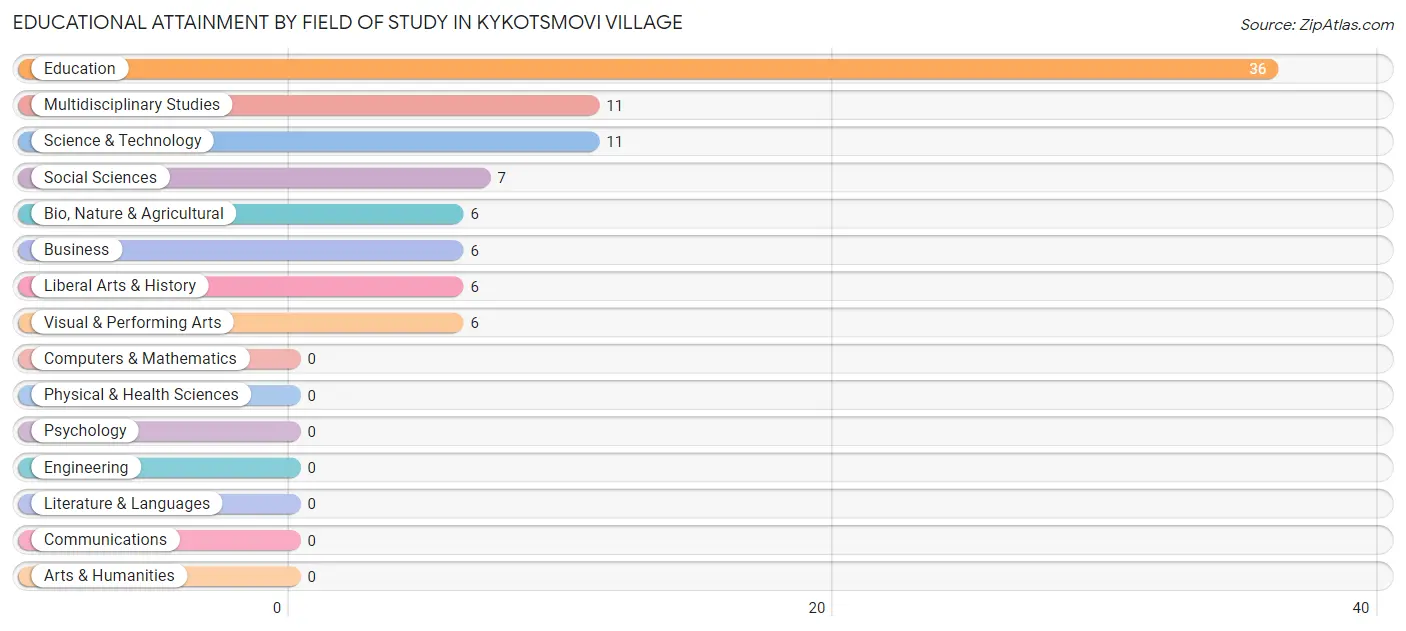
| Field of Study | # Graduates | % Graduates |
| Computers & Mathematics | 0 | 0.0% |
| Bio, Nature & Agricultural | 6 | 6.7% |
| Physical & Health Sciences | 0 | 0.0% |
| Psychology | 0 | 0.0% |
| Social Sciences | 7 | 7.9% |
| Engineering | 0 | 0.0% |
| Multidisciplinary Studies | 11 | 12.4% |
| Science & Technology | 11 | 12.4% |
| Business | 6 | 6.7% |
| Education | 36 | 40.5% |
| Literature & Languages | 0 | 0.0% |
| Liberal Arts & History | 6 | 6.7% |
| Visual & Performing Arts | 6 | 6.7% |
| Communications | 0 | 0.0% |
| Arts & Humanities | 0 | 0.0% |
| Total | 89 | 100.0% |
Transportation & Commute in Kykotsmovi Village
Vehicle Availability by Sex in Kykotsmovi Village
The most prevalent vehicle ownership categories in Kykotsmovi Village are males with 3 vehicles (78, accounting for 53.8%) and females with 3 vehicles (64, making up 50.6%).
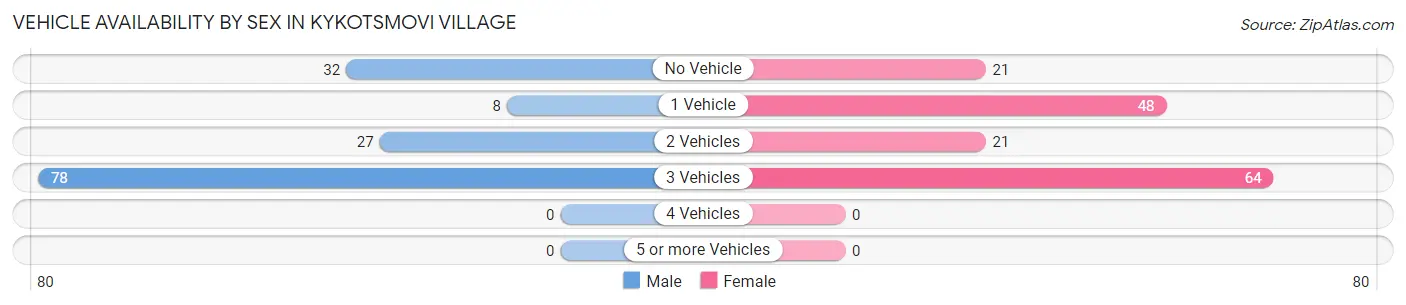
| Vehicles Available | Male | Female |
| No Vehicle | 32 (22.1%) | 21 (13.6%) |
| 1 Vehicle | 8 (5.5%) | 48 (31.2%) |
| 2 Vehicles | 27 (18.6%) | 21 (13.6%) |
| 3 Vehicles | 78 (53.8%) | 64 (41.6%) |
| 4 Vehicles | 0 (0.0%) | 0 (0.0%) |
| 5 or more Vehicles | 0 (0.0%) | 0 (0.0%) |
| Total | 145 (100.0%) | 154 (100.0%) |
Commute Time in Kykotsmovi Village
The most frequently occuring commute durations in Kykotsmovi Village are 5 to 9 minutes (136 commuters, 54.2%), 20 to 24 minutes (27 commuters, 10.8%), and 90 or more minutes (21 commuters, 8.4%).
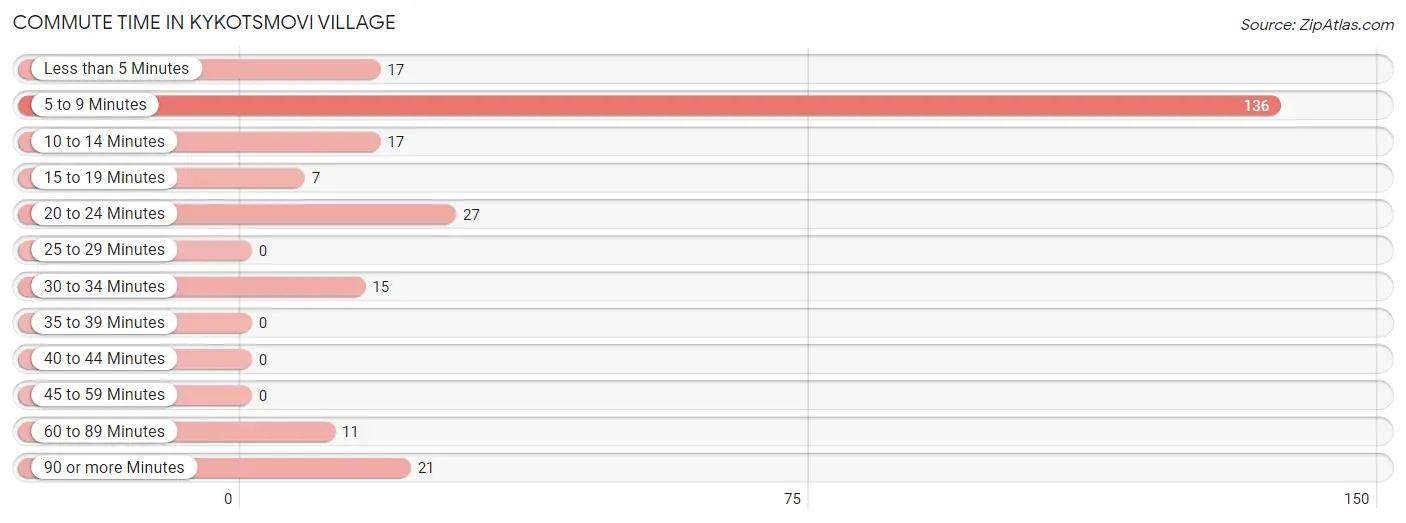
| Commute Time | # Commuters | % Commuters |
| Less than 5 Minutes | 17 | 6.8% |
| 5 to 9 Minutes | 136 | 54.2% |
| 10 to 14 Minutes | 17 | 6.8% |
| 15 to 19 Minutes | 7 | 2.8% |
| 20 to 24 Minutes | 27 | 10.8% |
| 25 to 29 Minutes | 0 | 0.0% |
| 30 to 34 Minutes | 15 | 6.0% |
| 35 to 39 Minutes | 0 | 0.0% |
| 40 to 44 Minutes | 0 | 0.0% |
| 45 to 59 Minutes | 0 | 0.0% |
| 60 to 89 Minutes | 11 | 4.4% |
| 90 or more Minutes | 21 | 8.4% |
Commute Time by Sex in Kykotsmovi Village
The most common commute times in Kykotsmovi Village are 5 to 9 minutes (63 commuters, 58.3%) for males and 5 to 9 minutes (73 commuters, 51.0%) for females.
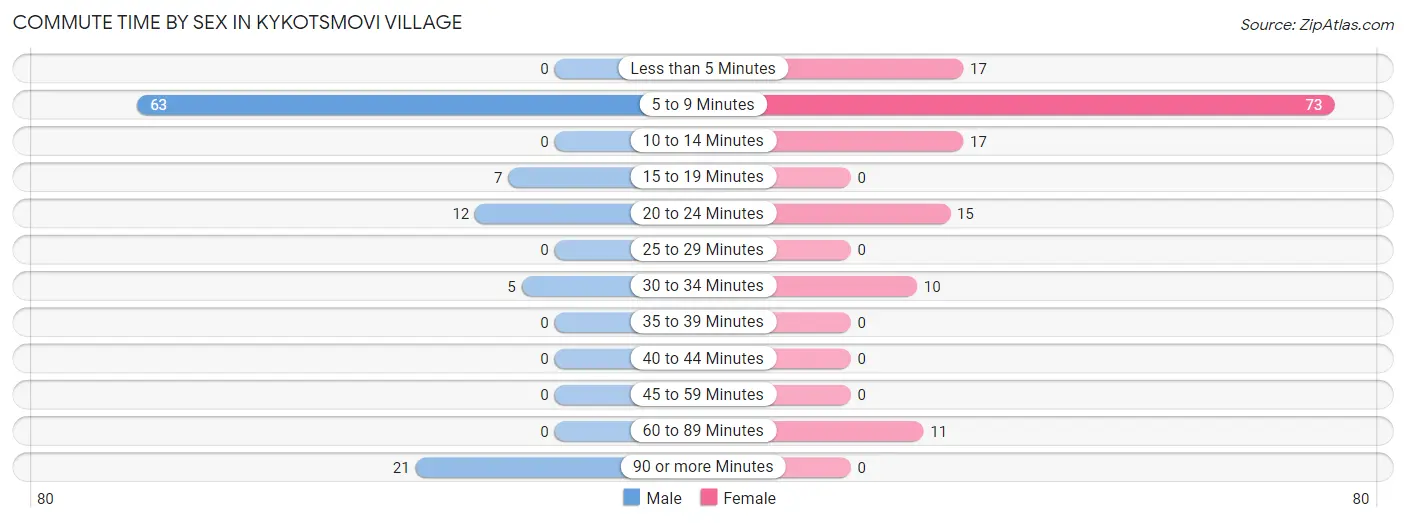
| Commute Time | Male | Female |
| Less than 5 Minutes | 0 (0.0%) | 17 (11.9%) |
| 5 to 9 Minutes | 63 (58.3%) | 73 (51.0%) |
| 10 to 14 Minutes | 0 (0.0%) | 17 (11.9%) |
| 15 to 19 Minutes | 7 (6.5%) | 0 (0.0%) |
| 20 to 24 Minutes | 12 (11.1%) | 15 (10.5%) |
| 25 to 29 Minutes | 0 (0.0%) | 0 (0.0%) |
| 30 to 34 Minutes | 5 (4.6%) | 10 (7.0%) |
| 35 to 39 Minutes | 0 (0.0%) | 0 (0.0%) |
| 40 to 44 Minutes | 0 (0.0%) | 0 (0.0%) |
| 45 to 59 Minutes | 0 (0.0%) | 0 (0.0%) |
| 60 to 89 Minutes | 0 (0.0%) | 11 (7.7%) |
| 90 or more Minutes | 21 (19.4%) | 0 (0.0%) |
Time of Departure to Work by Sex in Kykotsmovi Village
The most frequent times of departure to work in Kykotsmovi Village are 7:30 AM to 7:59 AM (54, 50.0%) for males and 5:30 AM to 5:59 AM (45, 31.5%) for females.
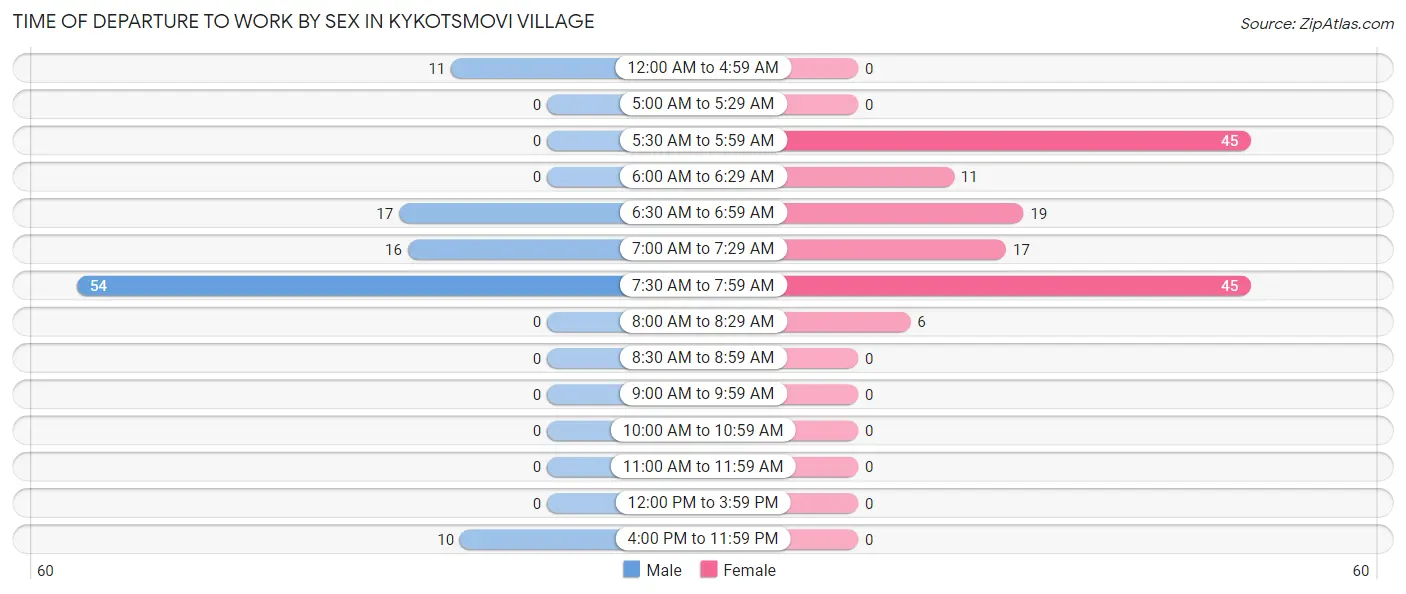
| Time of Departure | Male | Female |
| 12:00 AM to 4:59 AM | 11 (10.2%) | 0 (0.0%) |
| 5:00 AM to 5:29 AM | 0 (0.0%) | 0 (0.0%) |
| 5:30 AM to 5:59 AM | 0 (0.0%) | 45 (31.5%) |
| 6:00 AM to 6:29 AM | 0 (0.0%) | 11 (7.7%) |
| 6:30 AM to 6:59 AM | 17 (15.7%) | 19 (13.3%) |
| 7:00 AM to 7:29 AM | 16 (14.8%) | 17 (11.9%) |
| 7:30 AM to 7:59 AM | 54 (50.0%) | 45 (31.5%) |
| 8:00 AM to 8:29 AM | 0 (0.0%) | 6 (4.2%) |
| 8:30 AM to 8:59 AM | 0 (0.0%) | 0 (0.0%) |
| 9:00 AM to 9:59 AM | 0 (0.0%) | 0 (0.0%) |
| 10:00 AM to 10:59 AM | 0 (0.0%) | 0 (0.0%) |
| 11:00 AM to 11:59 AM | 0 (0.0%) | 0 (0.0%) |
| 12:00 PM to 3:59 PM | 0 (0.0%) | 0 (0.0%) |
| 4:00 PM to 11:59 PM | 10 (9.3%) | 0 (0.0%) |
| Total | 108 (100.0%) | 143 (100.0%) |
Housing Occupancy in Kykotsmovi Village
Occupancy by Ownership in Kykotsmovi Village
Of the total 298 dwellings in Kykotsmovi Village, owner-occupied units account for 267 (89.6%), while renter-occupied units make up 31 (10.4%).
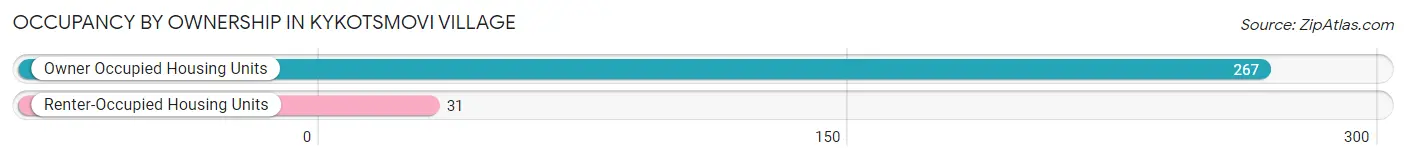
| Occupancy | # Housing Units | % Housing Units |
| Owner Occupied Housing Units | 267 | 89.6% |
| Renter-Occupied Housing Units | 31 | 10.4% |
| Total Occupied Housing Units | 298 | 100.0% |
Occupancy by Household Size in Kykotsmovi Village
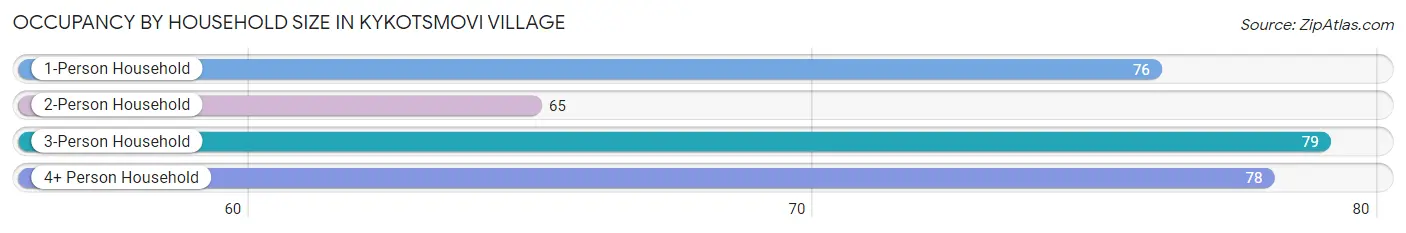
| Household Size | # Housing Units | % Housing Units |
| 1-Person Household | 76 | 25.5% |
| 2-Person Household | 65 | 21.8% |
| 3-Person Household | 79 | 26.5% |
| 4+ Person Household | 78 | 26.2% |
| Total Housing Units | 298 | 100.0% |
Occupancy by Ownership by Household Size in Kykotsmovi Village
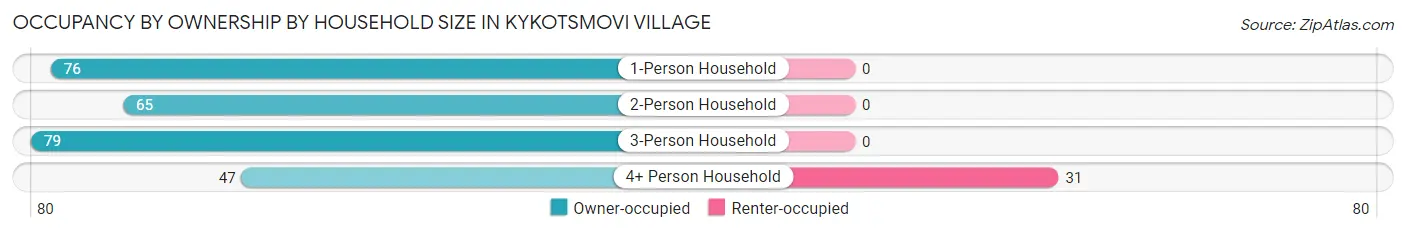
| Household Size | Owner-occupied | Renter-occupied |
| 1-Person Household | 76 (100.0%) | 0 (0.0%) |
| 2-Person Household | 65 (100.0%) | 0 (0.0%) |
| 3-Person Household | 79 (100.0%) | 0 (0.0%) |
| 4+ Person Household | 47 (60.3%) | 31 (39.7%) |
| Total Housing Units | 267 (89.6%) | 31 (10.4%) |
Occupancy by Educational Attainment in Kykotsmovi Village
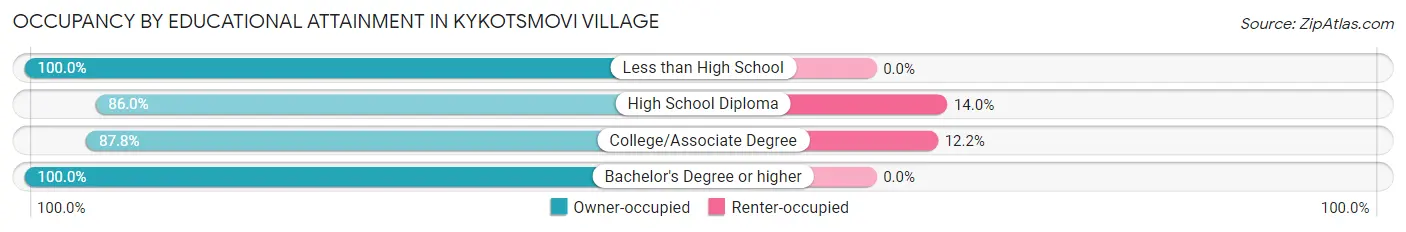
| Household Size | Owner-occupied | Renter-occupied |
| Less than High School | 11 (100.0%) | 0 (0.0%) |
| High School Diploma | 98 (86.0%) | 16 (14.0%) |
| College/Associate Degree | 108 (87.8%) | 15 (12.2%) |
| Bachelor's Degree or higher | 50 (100.0%) | 0 (0.0%) |
Occupancy by Age of Householder in Kykotsmovi Village
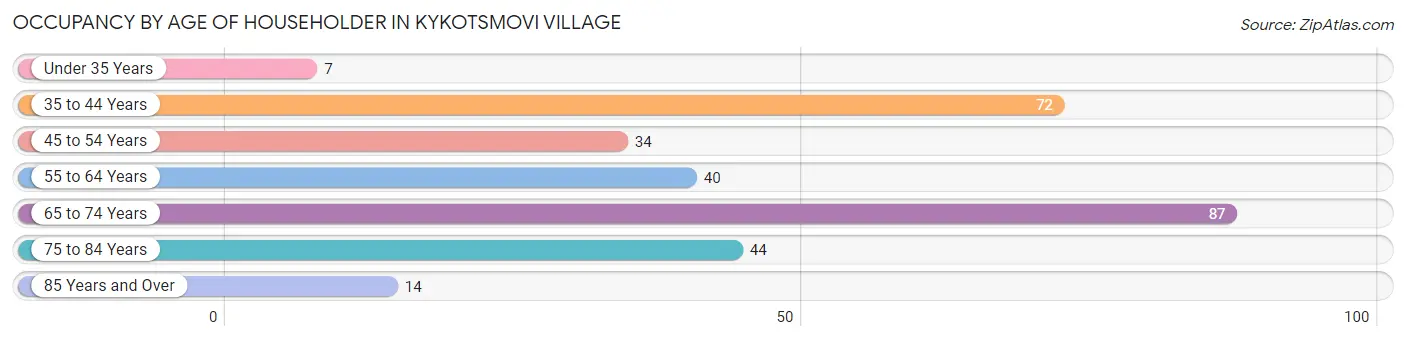
| Age Bracket | # Households | % Households |
| Under 35 Years | 7 | 2.4% |
| 35 to 44 Years | 72 | 24.2% |
| 45 to 54 Years | 34 | 11.4% |
| 55 to 64 Years | 40 | 13.4% |
| 65 to 74 Years | 87 | 29.2% |
| 75 to 84 Years | 44 | 14.8% |
| 85 Years and Over | 14 | 4.7% |
| Total | 298 | 100.0% |
Housing Finances in Kykotsmovi Village
Median Income by Occupancy in Kykotsmovi Village
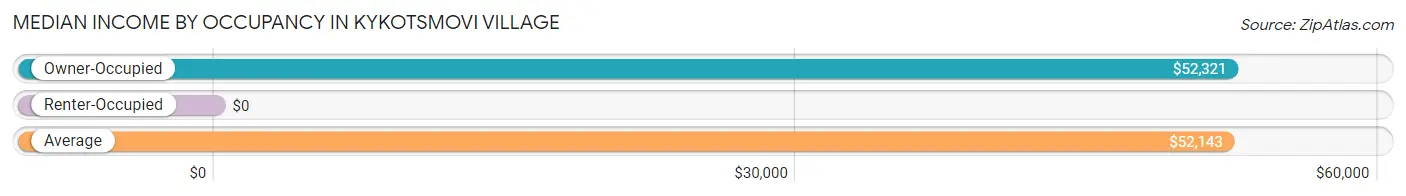
| Occupancy Type | # Households | Median Income |
| Owner-Occupied | 267 (89.6%) | $52,321 |
| Renter-Occupied | 31 (10.4%) | $0 |
| Average | 298 (100.0%) | $52,143 |
Occupancy by Householder Income Bracket in Kykotsmovi Village
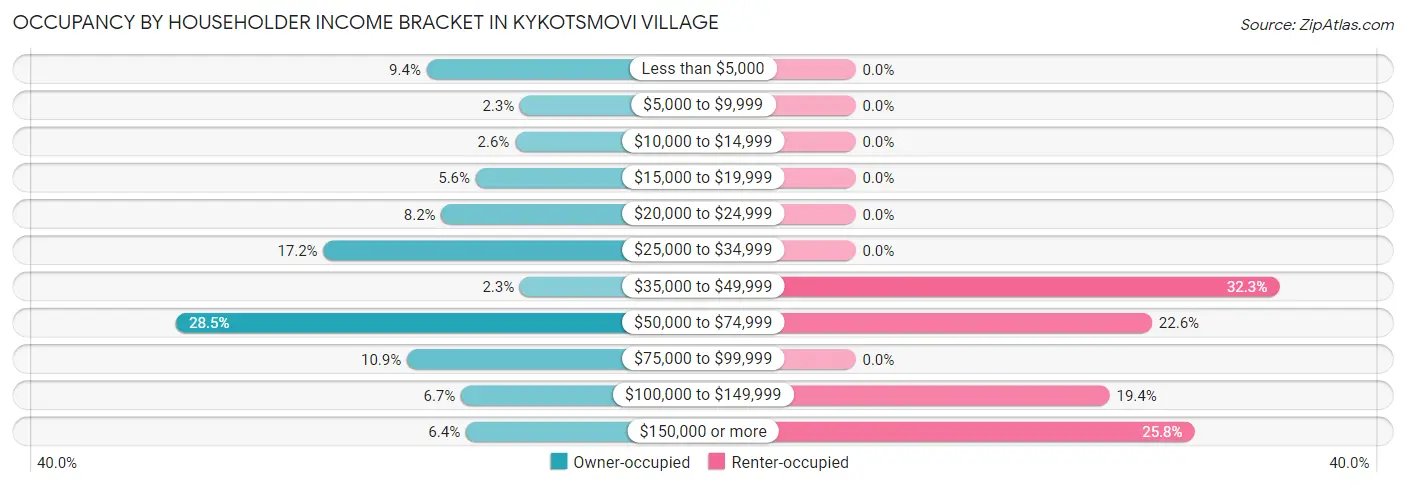
| Income Bracket | Owner-occupied | Renter-occupied |
| Less than $5,000 | 25 (9.4%) | 0 (0.0%) |
| $5,000 to $9,999 | 6 (2.2%) | 0 (0.0%) |
| $10,000 to $14,999 | 7 (2.6%) | 0 (0.0%) |
| $15,000 to $19,999 | 15 (5.6%) | 0 (0.0%) |
| $20,000 to $24,999 | 22 (8.2%) | 0 (0.0%) |
| $25,000 to $34,999 | 46 (17.2%) | 0 (0.0%) |
| $35,000 to $49,999 | 6 (2.2%) | 10 (32.3%) |
| $50,000 to $74,999 | 76 (28.5%) | 7 (22.6%) |
| $75,000 to $99,999 | 29 (10.9%) | 0 (0.0%) |
| $100,000 to $149,999 | 18 (6.7%) | 6 (19.4%) |
| $150,000 or more | 17 (6.4%) | 8 (25.8%) |
| Total | 267 (100.0%) | 31 (100.0%) |
Monthly Housing Cost Tiers in Kykotsmovi Village
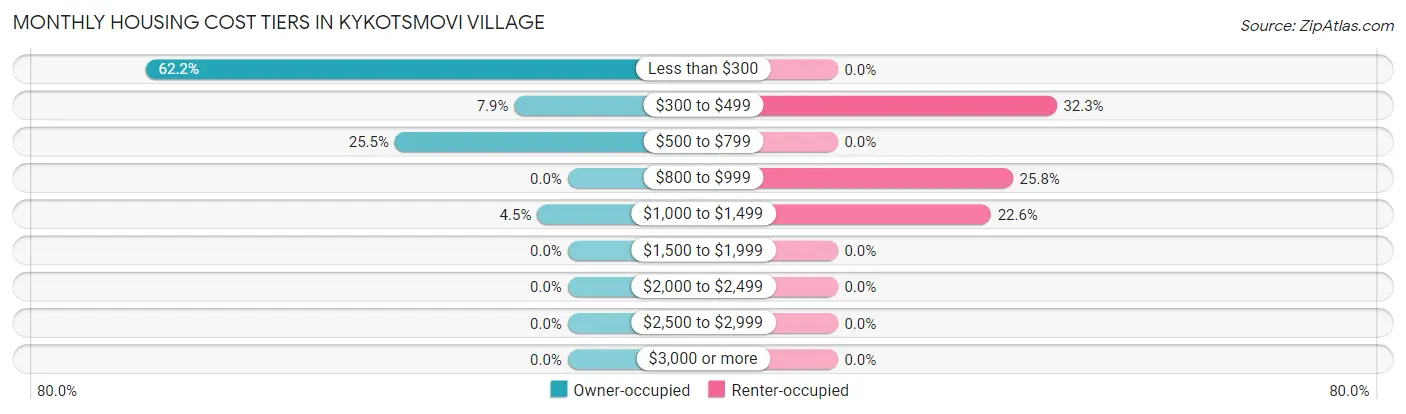
| Monthly Cost | Owner-occupied | Renter-occupied |
| Less than $300 | 166 (62.2%) | 0 (0.0%) |
| $300 to $499 | 21 (7.9%) | 10 (32.3%) |
| $500 to $799 | 68 (25.5%) | 0 (0.0%) |
| $800 to $999 | 0 (0.0%) | 8 (25.8%) |
| $1,000 to $1,499 | 12 (4.5%) | 7 (22.6%) |
| $1,500 to $1,999 | 0 (0.0%) | 0 (0.0%) |
| $2,000 to $2,499 | 0 (0.0%) | 0 (0.0%) |
| $2,500 to $2,999 | 0 (0.0%) | 0 (0.0%) |
| $3,000 or more | 0 (0.0%) | 0 (0.0%) |
| Total | 267 (100.0%) | 31 (100.0%) |
Physical Housing Characteristics in Kykotsmovi Village
Housing Structures in Kykotsmovi Village
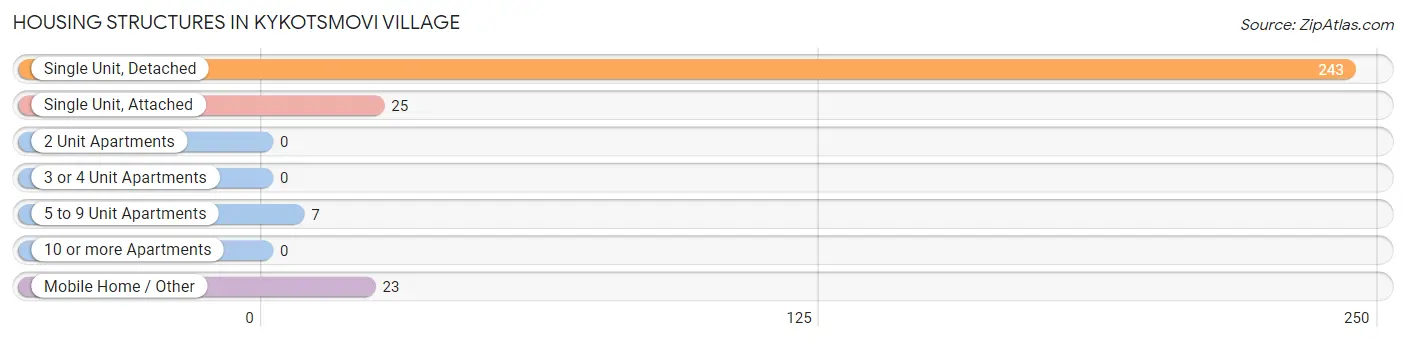
| Structure Type | # Housing Units | % Housing Units |
| Single Unit, Detached | 243 | 81.5% |
| Single Unit, Attached | 25 | 8.4% |
| 2 Unit Apartments | 0 | 0.0% |
| 3 or 4 Unit Apartments | 0 | 0.0% |
| 5 to 9 Unit Apartments | 7 | 2.4% |
| 10 or more Apartments | 0 | 0.0% |
| Mobile Home / Other | 23 | 7.7% |
| Total | 298 | 100.0% |
Housing Structures by Occupancy in Kykotsmovi Village
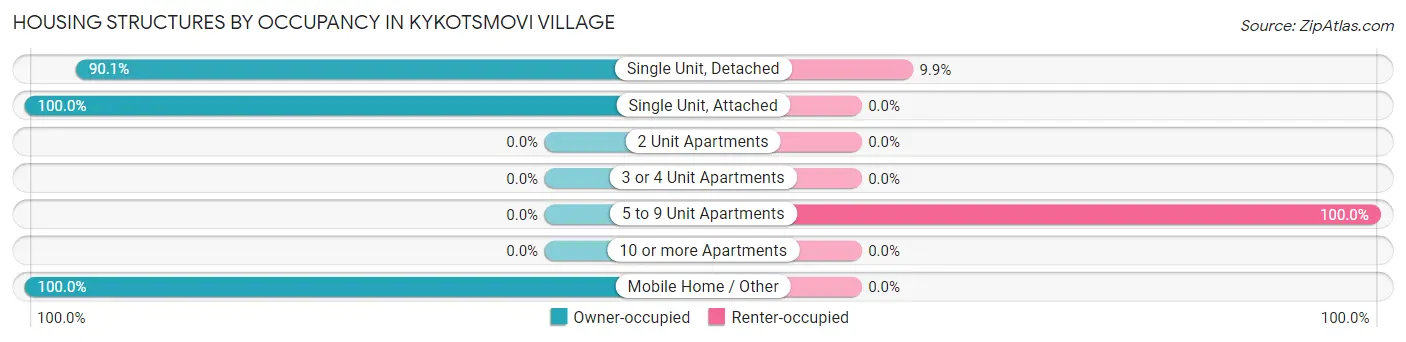
| Structure Type | Owner-occupied | Renter-occupied |
| Single Unit, Detached | 219 (90.1%) | 24 (9.9%) |
| Single Unit, Attached | 25 (100.0%) | 0 (0.0%) |
| 2 Unit Apartments | 0 (0.0%) | 0 (0.0%) |
| 3 or 4 Unit Apartments | 0 (0.0%) | 0 (0.0%) |
| 5 to 9 Unit Apartments | 0 (0.0%) | 7 (100.0%) |
| 10 or more Apartments | 0 (0.0%) | 0 (0.0%) |
| Mobile Home / Other | 23 (100.0%) | 0 (0.0%) |
| Total | 267 (89.6%) | 31 (10.4%) |
Housing Structures by Number of Rooms in Kykotsmovi Village
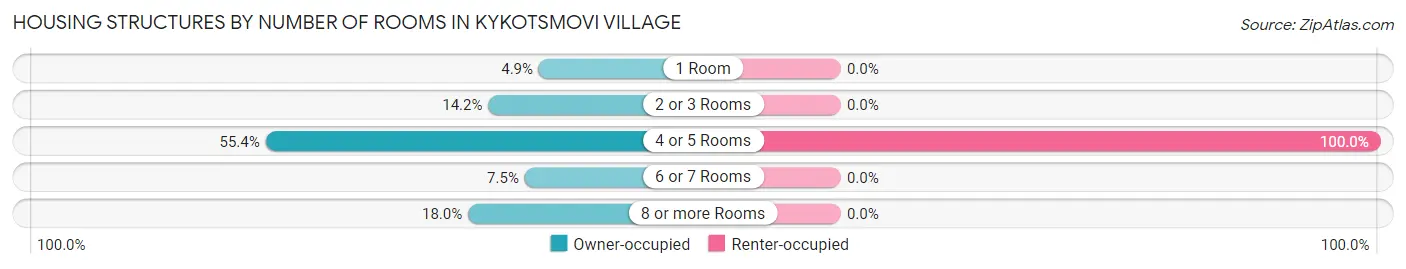
| Number of Rooms | Owner-occupied | Renter-occupied |
| 1 Room | 13 (4.9%) | 0 (0.0%) |
| 2 or 3 Rooms | 38 (14.2%) | 0 (0.0%) |
| 4 or 5 Rooms | 148 (55.4%) | 31 (100.0%) |
| 6 or 7 Rooms | 20 (7.5%) | 0 (0.0%) |
| 8 or more Rooms | 48 (18.0%) | 0 (0.0%) |
| Total | 267 (100.0%) | 31 (100.0%) |
Housing Structure by Heating Type in Kykotsmovi Village
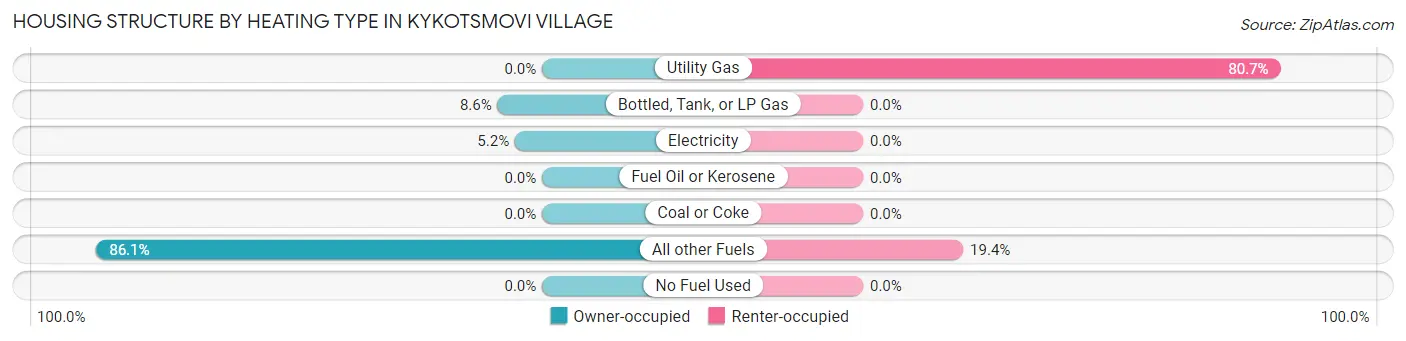
| Heating Type | Owner-occupied | Renter-occupied |
| Utility Gas | 0 (0.0%) | 25 (80.6%) |
| Bottled, Tank, or LP Gas | 23 (8.6%) | 0 (0.0%) |
| Electricity | 14 (5.2%) | 0 (0.0%) |
| Fuel Oil or Kerosene | 0 (0.0%) | 0 (0.0%) |
| Coal or Coke | 0 (0.0%) | 0 (0.0%) |
| All other Fuels | 230 (86.1%) | 6 (19.4%) |
| No Fuel Used | 0 (0.0%) | 0 (0.0%) |
| Total | 267 (100.0%) | 31 (100.0%) |
Household Vehicle Usage in Kykotsmovi Village
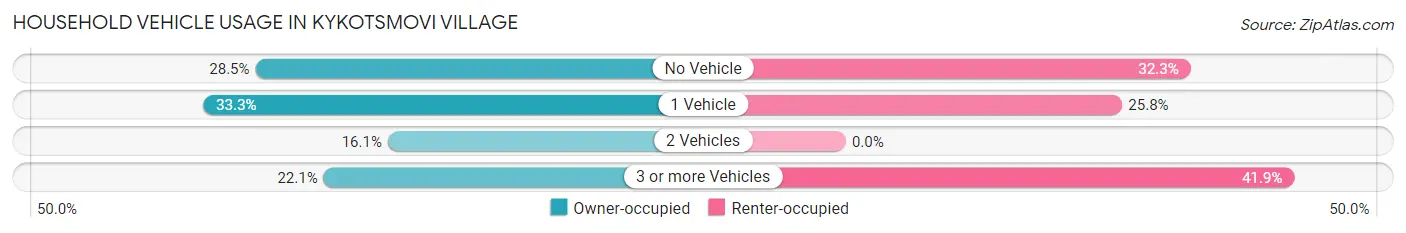
| Vehicles per Household | Owner-occupied | Renter-occupied |
| No Vehicle | 76 (28.5%) | 10 (32.3%) |
| 1 Vehicle | 89 (33.3%) | 8 (25.8%) |
| 2 Vehicles | 43 (16.1%) | 0 (0.0%) |
| 3 or more Vehicles | 59 (22.1%) | 13 (41.9%) |
| Total | 267 (100.0%) | 31 (100.0%) |
Real Estate & Mortgages in Kykotsmovi Village
Real Estate and Mortgage Overview in Kykotsmovi Village
| Characteristic | Without Mortgage | With Mortgage |
| Housing Units | 210 | 57 |
| Median Property Value | $97,100 | $209,300 |
| Median Household Income | $33,621 | $10 |
| Monthly Housing Costs | $180 | $0 |
| Real Estate Taxes | - | - |
Property Value by Mortgage Status in Kykotsmovi Village
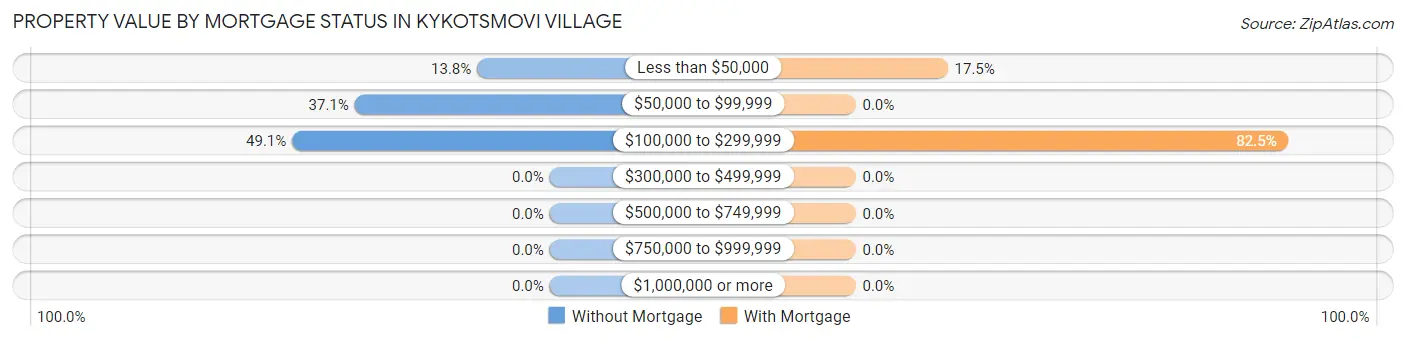
| Property Value | Without Mortgage | With Mortgage |
| Less than $50,000 | 29 (13.8%) | 10 (17.5%) |
| $50,000 to $99,999 | 78 (37.1%) | 0 (0.0%) |
| $100,000 to $299,999 | 103 (49.0%) | 47 (82.5%) |
| $300,000 to $499,999 | 0 (0.0%) | 0 (0.0%) |
| $500,000 to $749,999 | 0 (0.0%) | 0 (0.0%) |
| $750,000 to $999,999 | 0 (0.0%) | 0 (0.0%) |
| $1,000,000 or more | 0 (0.0%) | 0 (0.0%) |
| Total | 210 (100.0%) | 57 (100.0%) |
Household Income by Mortgage Status in Kykotsmovi Village
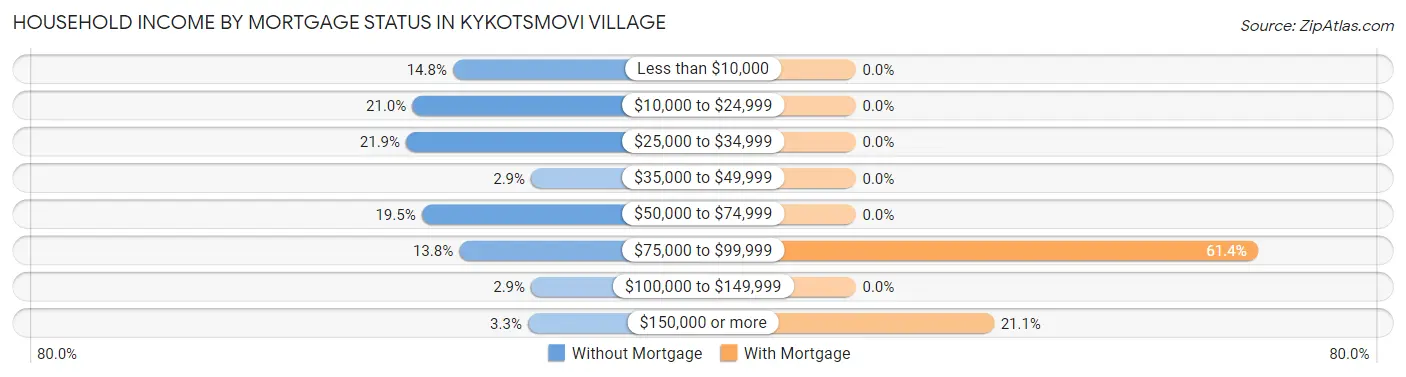
| Household Income | Without Mortgage | With Mortgage |
| Less than $10,000 | 31 (14.8%) | 0 (0.0%) |
| $10,000 to $24,999 | 44 (20.9%) | 0 (0.0%) |
| $25,000 to $34,999 | 46 (21.9%) | 0 (0.0%) |
| $35,000 to $49,999 | 6 (2.9%) | 0 (0.0%) |
| $50,000 to $74,999 | 41 (19.5%) | 0 (0.0%) |
| $75,000 to $99,999 | 29 (13.8%) | 35 (61.4%) |
| $100,000 to $149,999 | 6 (2.9%) | 0 (0.0%) |
| $150,000 or more | 7 (3.3%) | 12 (21.0%) |
| Total | 210 (100.0%) | 57 (100.0%) |
Property Value to Household Income Ratio in Kykotsmovi Village
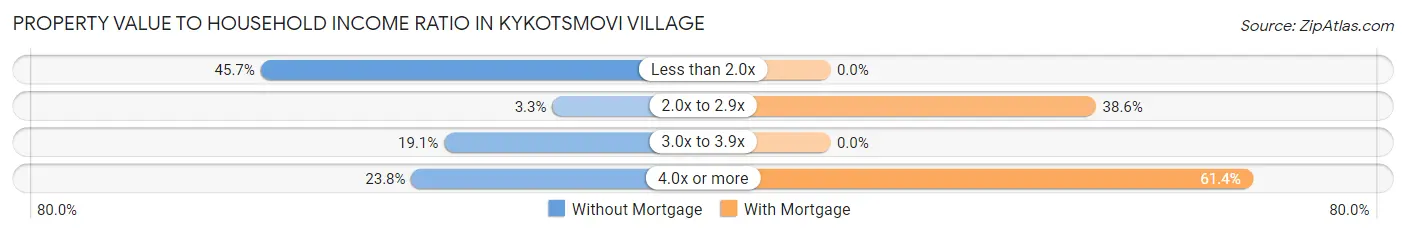
| Value-to-Income Ratio | Without Mortgage | With Mortgage |
| Less than 2.0x | 96 (45.7%) | 0 (0.0%) |
| 2.0x to 2.9x | 7 (3.3%) | 22 (38.6%) |
| 3.0x to 3.9x | 40 (19.1%) | 0 (0.0%) |
| 4.0x or more | 50 (23.8%) | 35 (61.4%) |
| Total | 210 (100.0%) | 57 (100.0%) |
Real Estate Taxes by Mortgage Status in Kykotsmovi Village
| Property Taxes | Without Mortgage | With Mortgage |
| Less than $800 | 0 (0.0%) | 0 (0.0%) |
| $800 to $1,499 | 0 (0.0%) | 0 (0.0%) |
| $800 to $1,499 | 0 (0.0%) | 0 (0.0%) |
| Total | 210 (100.0%) | 57 (100.0%) |
Health & Disability in Kykotsmovi Village
Health Insurance Coverage by Age in Kykotsmovi Village
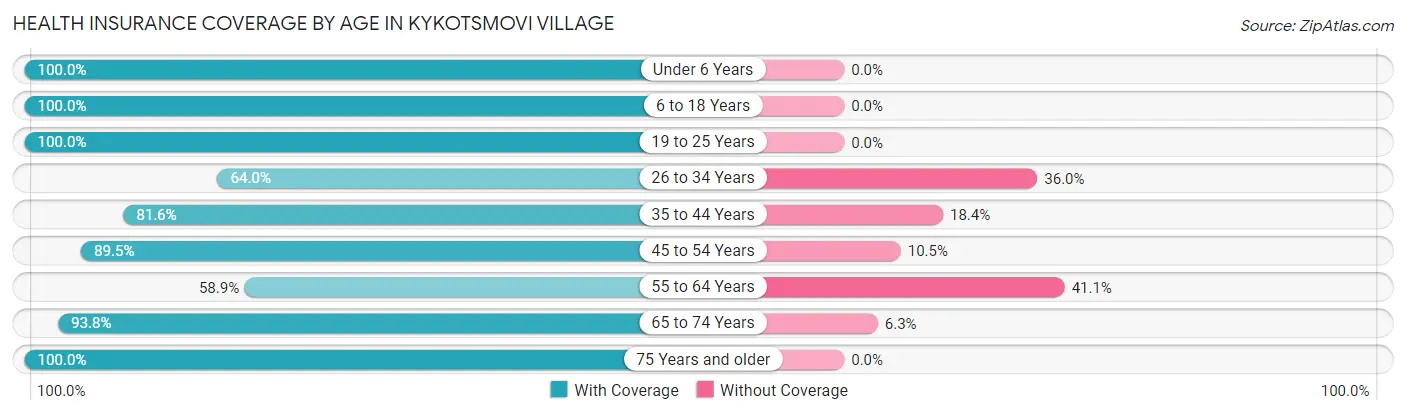
| Age Bracket | With Coverage | Without Coverage |
| Under 6 Years | 93 (100.0%) | 0 (0.0%) |
| 6 to 18 Years | 145 (100.0%) | 0 (0.0%) |
| 19 to 25 Years | 117 (100.0%) | 0 (0.0%) |
| 26 to 34 Years | 32 (64.0%) | 18 (36.0%) |
| 35 to 44 Years | 93 (81.6%) | 21 (18.4%) |
| 45 to 54 Years | 85 (89.5%) | 10 (10.5%) |
| 55 to 64 Years | 43 (58.9%) | 30 (41.1%) |
| 65 to 74 Years | 105 (93.8%) | 7 (6.2%) |
| 75 Years and older | 88 (100.0%) | 0 (0.0%) |
| Total | 801 (90.3%) | 86 (9.7%) |
Health Insurance Coverage by Citizenship Status in Kykotsmovi Village
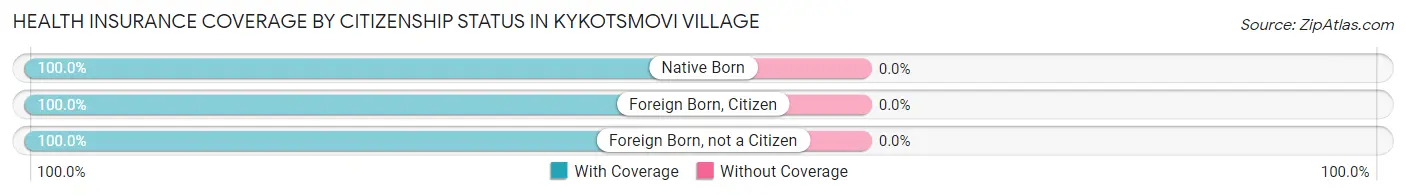
| Citizenship Status | With Coverage | Without Coverage |
| Native Born | 93 (100.0%) | 0 (0.0%) |
| Foreign Born, Citizen | 145 (100.0%) | 0 (0.0%) |
| Foreign Born, not a Citizen | 117 (100.0%) | 0 (0.0%) |
Health Insurance Coverage by Household Income in Kykotsmovi Village
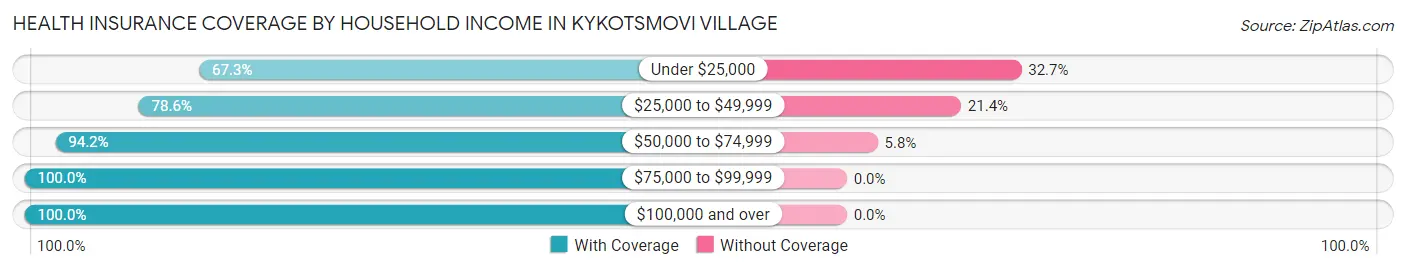
| Household Income | With Coverage | Without Coverage |
| Under $25,000 | 70 (67.3%) | 34 (32.7%) |
| $25,000 to $49,999 | 114 (78.6%) | 31 (21.4%) |
| $50,000 to $74,999 | 343 (94.2%) | 21 (5.8%) |
| $75,000 to $99,999 | 53 (100.0%) | 0 (0.0%) |
| $100,000 and over | 218 (100.0%) | 0 (0.0%) |
Public vs Private Health Insurance Coverage by Age in Kykotsmovi Village
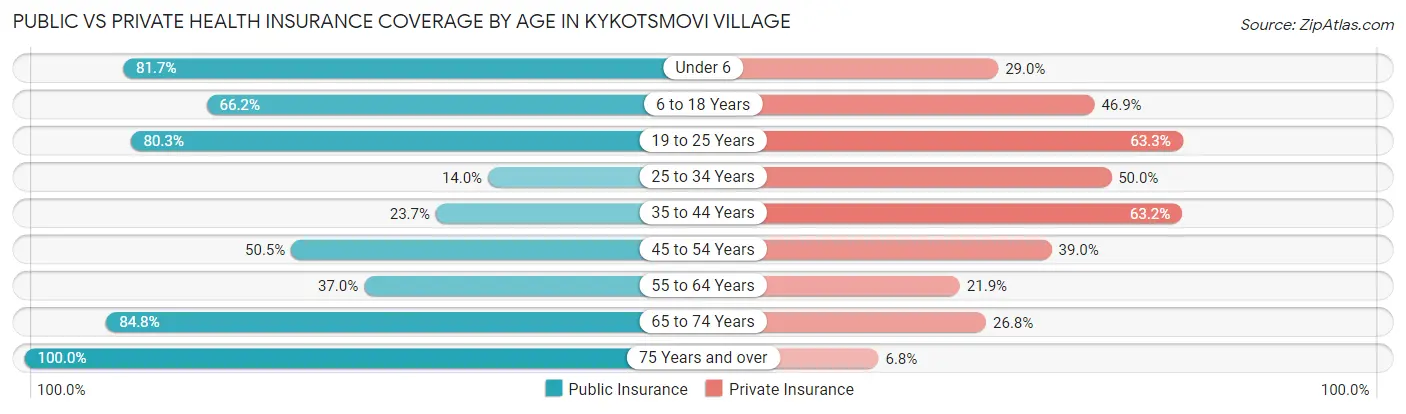
| Age Bracket | Public Insurance | Private Insurance |
| Under 6 | 76 (81.7%) | 27 (29.0%) |
| 6 to 18 Years | 96 (66.2%) | 68 (46.9%) |
| 19 to 25 Years | 94 (80.3%) | 74 (63.2%) |
| 25 to 34 Years | 7 (14.0%) | 25 (50.0%) |
| 35 to 44 Years | 27 (23.7%) | 72 (63.2%) |
| 45 to 54 Years | 48 (50.5%) | 37 (39.0%) |
| 55 to 64 Years | 27 (37.0%) | 16 (21.9%) |
| 65 to 74 Years | 95 (84.8%) | 30 (26.8%) |
| 75 Years and over | 88 (100.0%) | 6 (6.8%) |
| Total | 558 (62.9%) | 355 (40.0%) |
Disability Status by Sex by Age in Kykotsmovi Village
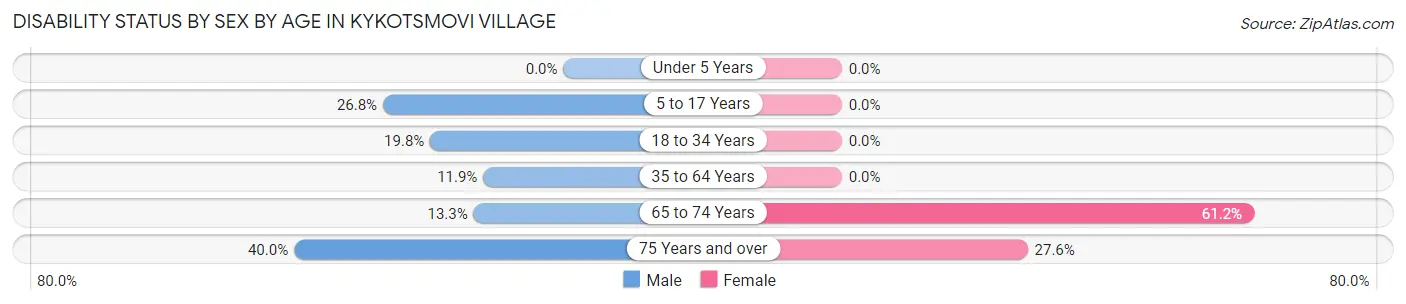
| Age Bracket | Male | Female |
| Under 5 Years | 0 (0.0%) | 0 (0.0%) |
| 5 to 17 Years | 15 (26.8%) | 0 (0.0%) |
| 18 to 34 Years | 18 (19.8%) | 0 (0.0%) |
| 35 to 64 Years | 15 (11.9%) | 0 (0.0%) |
| 65 to 74 Years | 6 (13.3%) | 41 (61.2%) |
| 75 Years and over | 12 (40.0%) | 16 (27.6%) |
Disability Class by Sex by Age in Kykotsmovi Village
Disability Class: Hearing Difficulty
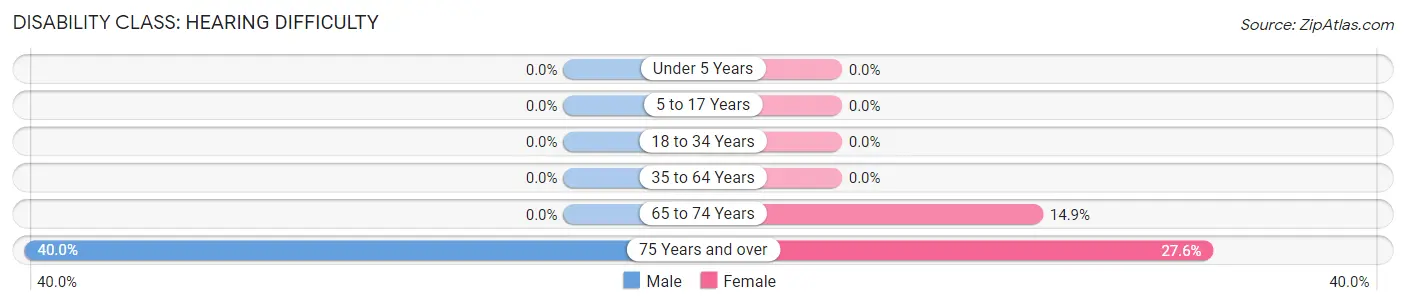
| Age Bracket | Male | Female |
| Under 5 Years | 0 (0.0%) | 0 (0.0%) |
| 5 to 17 Years | 0 (0.0%) | 0 (0.0%) |
| 18 to 34 Years | 0 (0.0%) | 0 (0.0%) |
| 35 to 64 Years | 0 (0.0%) | 0 (0.0%) |
| 65 to 74 Years | 0 (0.0%) | 10 (14.9%) |
| 75 Years and over | 12 (40.0%) | 16 (27.6%) |
Disability Class: Vision Difficulty
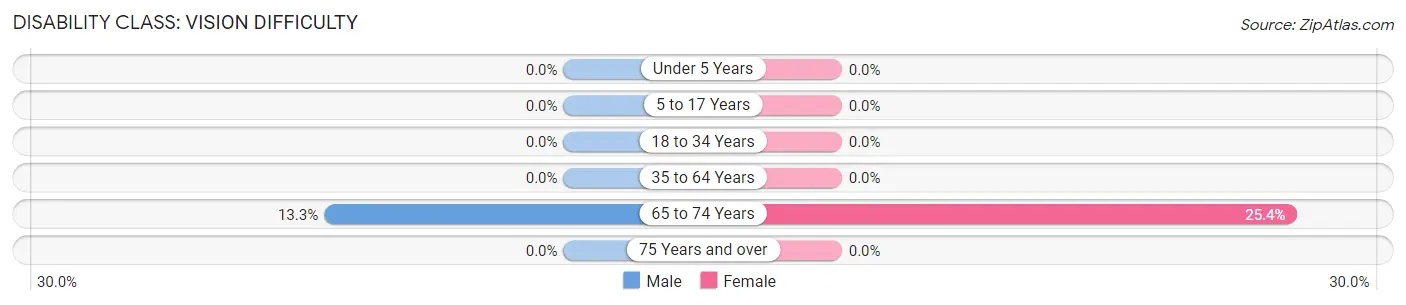
| Age Bracket | Male | Female |
| Under 5 Years | 0 (0.0%) | 0 (0.0%) |
| 5 to 17 Years | 0 (0.0%) | 0 (0.0%) |
| 18 to 34 Years | 0 (0.0%) | 0 (0.0%) |
| 35 to 64 Years | 0 (0.0%) | 0 (0.0%) |
| 65 to 74 Years | 6 (13.3%) | 17 (25.4%) |
| 75 Years and over | 0 (0.0%) | 0 (0.0%) |
Disability Class: Cognitive Difficulty
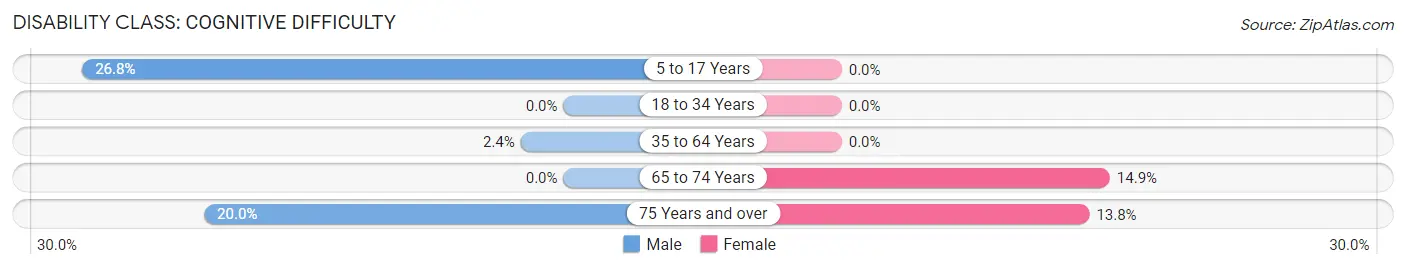
| Age Bracket | Male | Female |
| 5 to 17 Years | 15 (26.8%) | 0 (0.0%) |
| 18 to 34 Years | 0 (0.0%) | 0 (0.0%) |
| 35 to 64 Years | 3 (2.4%) | 0 (0.0%) |
| 65 to 74 Years | 0 (0.0%) | 10 (14.9%) |
| 75 Years and over | 6 (20.0%) | 8 (13.8%) |
Disability Class: Ambulatory Difficulty
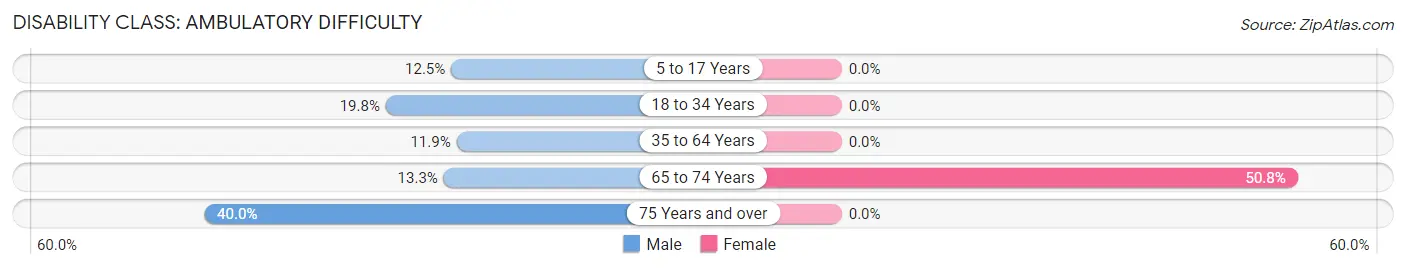
| Age Bracket | Male | Female |
| 5 to 17 Years | 7 (12.5%) | 0 (0.0%) |
| 18 to 34 Years | 18 (19.8%) | 0 (0.0%) |
| 35 to 64 Years | 15 (11.9%) | 0 (0.0%) |
| 65 to 74 Years | 6 (13.3%) | 34 (50.7%) |
| 75 Years and over | 12 (40.0%) | 0 (0.0%) |
Disability Class: Self-Care Difficulty
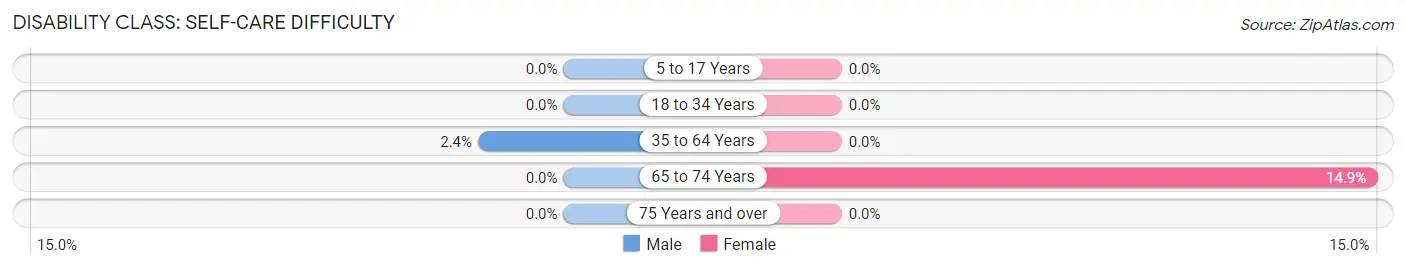
| Age Bracket | Male | Female |
| 5 to 17 Years | 0 (0.0%) | 0 (0.0%) |
| 18 to 34 Years | 0 (0.0%) | 0 (0.0%) |
| 35 to 64 Years | 3 (2.4%) | 0 (0.0%) |
| 65 to 74 Years | 0 (0.0%) | 10 (14.9%) |
| 75 Years and over | 0 (0.0%) | 0 (0.0%) |
Technology Access in Kykotsmovi Village
Computing Device Access in Kykotsmovi Village
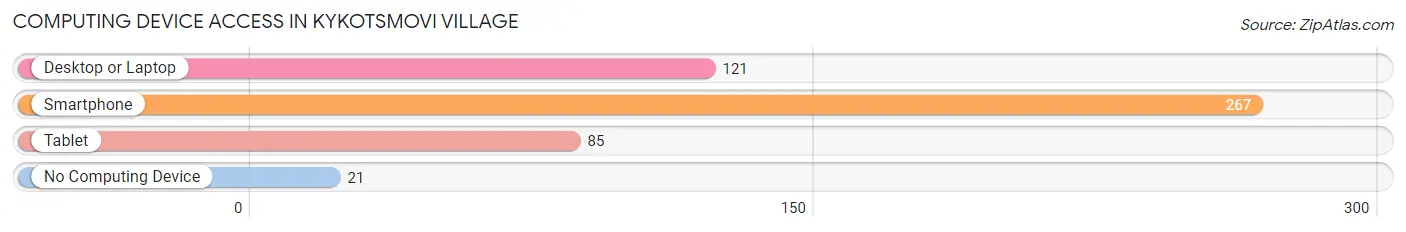
| Device Type | # Households | % Households |
| Desktop or Laptop | 121 | 40.6% |
| Smartphone | 267 | 89.6% |
| Tablet | 85 | 28.5% |
| No Computing Device | 21 | 7.0% |
| Total | 298 | 100.0% |
Internet Access in Kykotsmovi Village
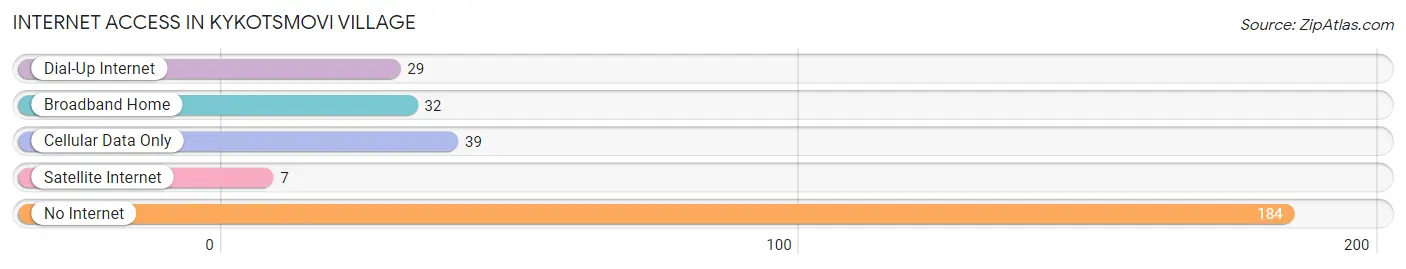
| Internet Type | # Households | % Households |
| Dial-Up Internet | 29 | 9.7% |
| Broadband Home | 32 | 10.7% |
| Cellular Data Only | 39 | 13.1% |
| Satellite Internet | 7 | 2.4% |
| No Internet | 184 | 61.7% |
| Total | 298 | 100.0% |
Kykotsmovi Village Summary
Kykotsmovi Village is a small village located on the Hopi Reservation in Arizona. It is located in the northeastern part of the state, about 20 miles east of Flagstaff. The village is home to the Hopi Tribe, a Native American tribe that has lived in the area for centuries. The village is also home to the Hopi Cultural Center, which is a museum and cultural center dedicated to preserving and sharing the history and culture of the Hopi people.
Geography
Kykotsmovi Village is located in the northeastern part of Arizona, about 20 miles east of Flagstaff. The village is situated on the Hopi Reservation, which is a large area of land that is owned and managed by the Hopi Tribe. The village is located in the high desert, with an elevation of 5,000 feet. The area is characterized by dry, hot summers and cold, snowy winters. The village is surrounded by the Hopi Buttes, which are a series of mesas and buttes that are sacred to the Hopi people.
Economy
The economy of Kykotsmovi Village is largely based on tourism. The village is home to the Hopi Cultural Center, which is a museum and cultural center dedicated to preserving and sharing the history and culture of the Hopi people. The center is a popular tourist destination, and it attracts visitors from all over the world. The village also has a number of small businesses, including restaurants, gift shops, and art galleries.
Demographics
As of the 2010 census, the population of Kykotsmovi Village was 1,072. The population is primarily Native American, with the majority of the population being Hopi. The median age of the population is 33.7 years, and the median household income is $25,000. The village has a high rate of poverty, with nearly 40% of the population living below the poverty line.
Conclusion
Kykotsmovi Village is a small village located on the Hopi Reservation in Arizona. The village is home to the Hopi Tribe, and it is a popular tourist destination due to its cultural center and other attractions. The economy of the village is largely based on tourism, and the population is primarily Native American. The village has a high rate of poverty, but it is a vibrant and culturally rich community.
Common Questions
What is Per Capita Income in Kykotsmovi Village?
Per Capita income in Kykotsmovi Village is $20,444.
What is the Median Family Income in Kykotsmovi Village?
Median Family Income in Kykotsmovi Village is $64,408.
What is the Median Household income in Kykotsmovi Village?
Median Household Income in Kykotsmovi Village is $52,143.
What is Income or Wage Gap in Kykotsmovi Village?
Income or Wage Gap in Kykotsmovi Village is 1.1%.
Women in Kykotsmovi Village earn 98.9 cents for every dollar earned by a man.
What is Inequality or Gini Index in Kykotsmovi Village?
Inequality or Gini Index in Kykotsmovi Village is 0.42.
What is the Total Population of Kykotsmovi Village?
Total Population of Kykotsmovi Village is 887.
What is the Total Male Population of Kykotsmovi Village?
Total Male Population of Kykotsmovi Village is 401.
What is the Total Female Population of Kykotsmovi Village?
Total Female Population of Kykotsmovi Village is 486.
What is the Ratio of Males per 100 Females in Kykotsmovi Village?
There are 82.51 Males per 100 Females in Kykotsmovi Village.
What is the Ratio of Females per 100 Males in Kykotsmovi Village?
There are 121.20 Females per 100 Males in Kykotsmovi Village.
What is the Median Population Age in Kykotsmovi Village?
Median Population Age in Kykotsmovi Village is 37.8 Years.
What is the Average Family Size in Kykotsmovi Village
Average Family Size in Kykotsmovi Village is 3.5 People.
What is the Average Household Size in Kykotsmovi Village
Average Household Size in Kykotsmovi Village is 3.0 People.
How Large is the Labor Force in Kykotsmovi Village?
There are 343 People in the Labor Forcein in Kykotsmovi Village.
What is the Percentage of People in the Labor Force in Kykotsmovi Village?
47.1% of People are in the Labor Force in Kykotsmovi Village.
What is the Unemployment Rate in Kykotsmovi Village?
Unemployment Rate in Kykotsmovi Village is 7.6%.