Zip Codes with the Highest Percentage of Population Employed in Food Preparation & Serving in Lake Havasu City, AZ
RELATED REPORTS & OPTIONS
Food Preparation & Serving
Lake Havasu City
Compare Zip Codes
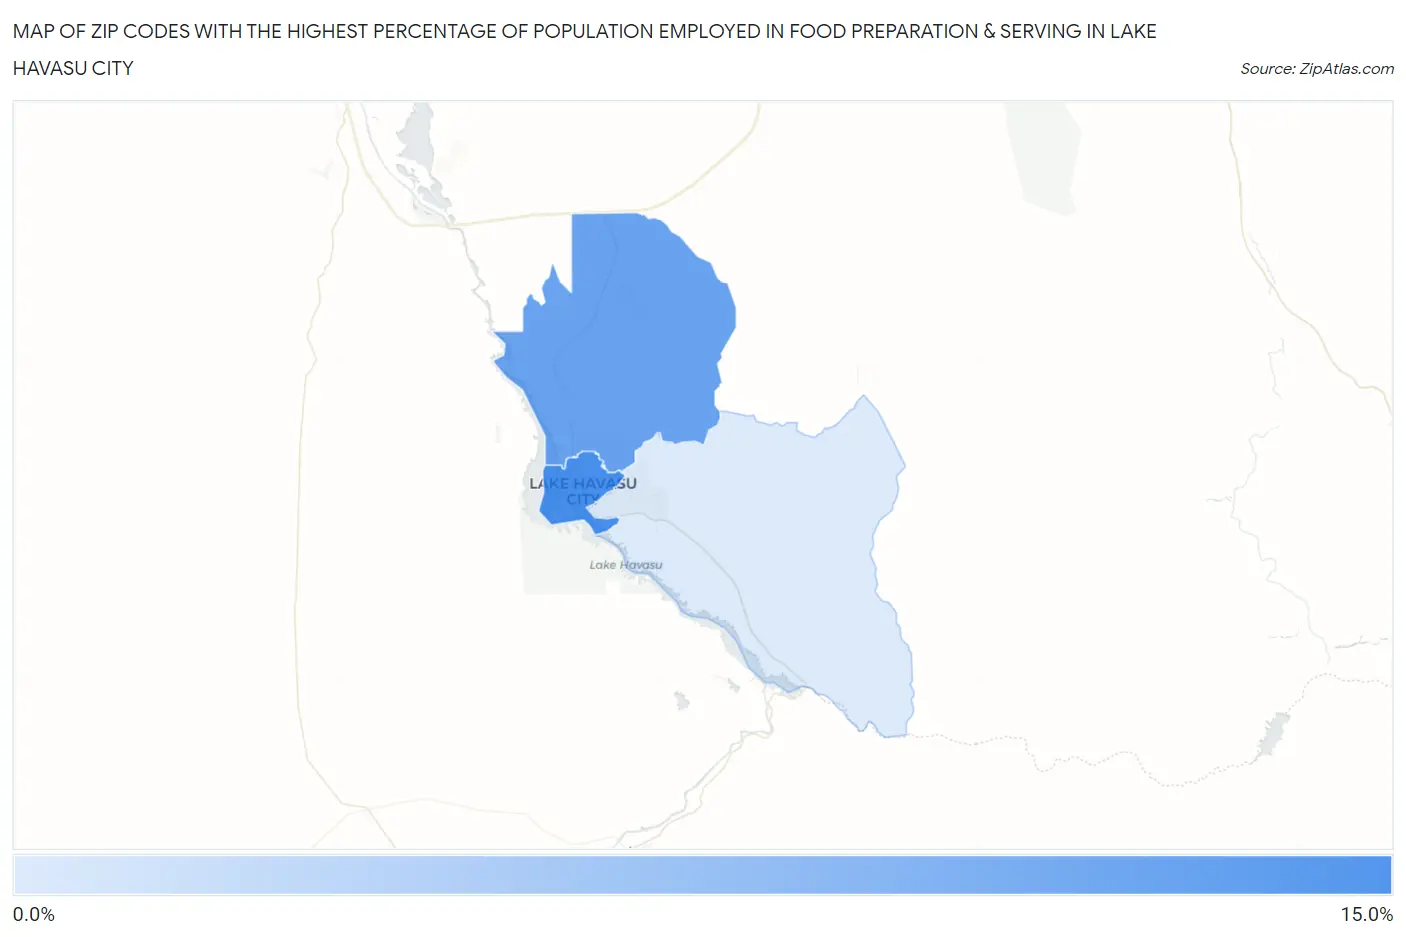
Map of Zip Codes with the Highest Percentage of Population Employed in Food Preparation & Serving in Lake Havasu City
4.6%
10.1%
Zip Codes with the Highest Percentage of Population Employed in Food Preparation & Serving in Lake Havasu City, AZ
| Zip Code | % Employed | vs State | vs National | |
| 1. | 86403 | 10.1% | 5.7%(+4.47)#47 | 5.3%(+4.86)#2,527 |
| 2. | 86404 | 8.9% | 5.7%(+3.26)#68 | 5.3%(+3.64)#3,598 |
| 3. | 86406 | 4.6% | 5.7%(-1.07)#218 | 5.3%(-0.686)#14,591 |
1
Common Questions
What are the Top Zip Codes with the Highest Percentage of Population Employed in Food Preparation & Serving in Lake Havasu City, AZ?
Top Zip Codes with the Highest Percentage of Population Employed in Food Preparation & Serving in Lake Havasu City, AZ are:
What zip code has the Highest Percentage of Population Employed in Food Preparation & Serving in Lake Havasu City, AZ?
86403 has the Highest Percentage of Population Employed in Food Preparation & Serving in Lake Havasu City, AZ with 10.1%.
What is the Percentage of Population Employed in Food Preparation & Serving in Lake Havasu City, AZ?
Percentage of Population Employed in Food Preparation & Serving in Lake Havasu City is 7.5%.
What is the Percentage of Population Employed in Food Preparation & Serving in Arizona?
Percentage of Population Employed in Food Preparation & Serving in Arizona is 5.7%.
What is the Percentage of Population Employed in Food Preparation & Serving in the United States?
Percentage of Population Employed in Food Preparation & Serving in the United States is 5.3%.