Arivaca Junction, AZ Map & Demographics
Arivaca Junction Map
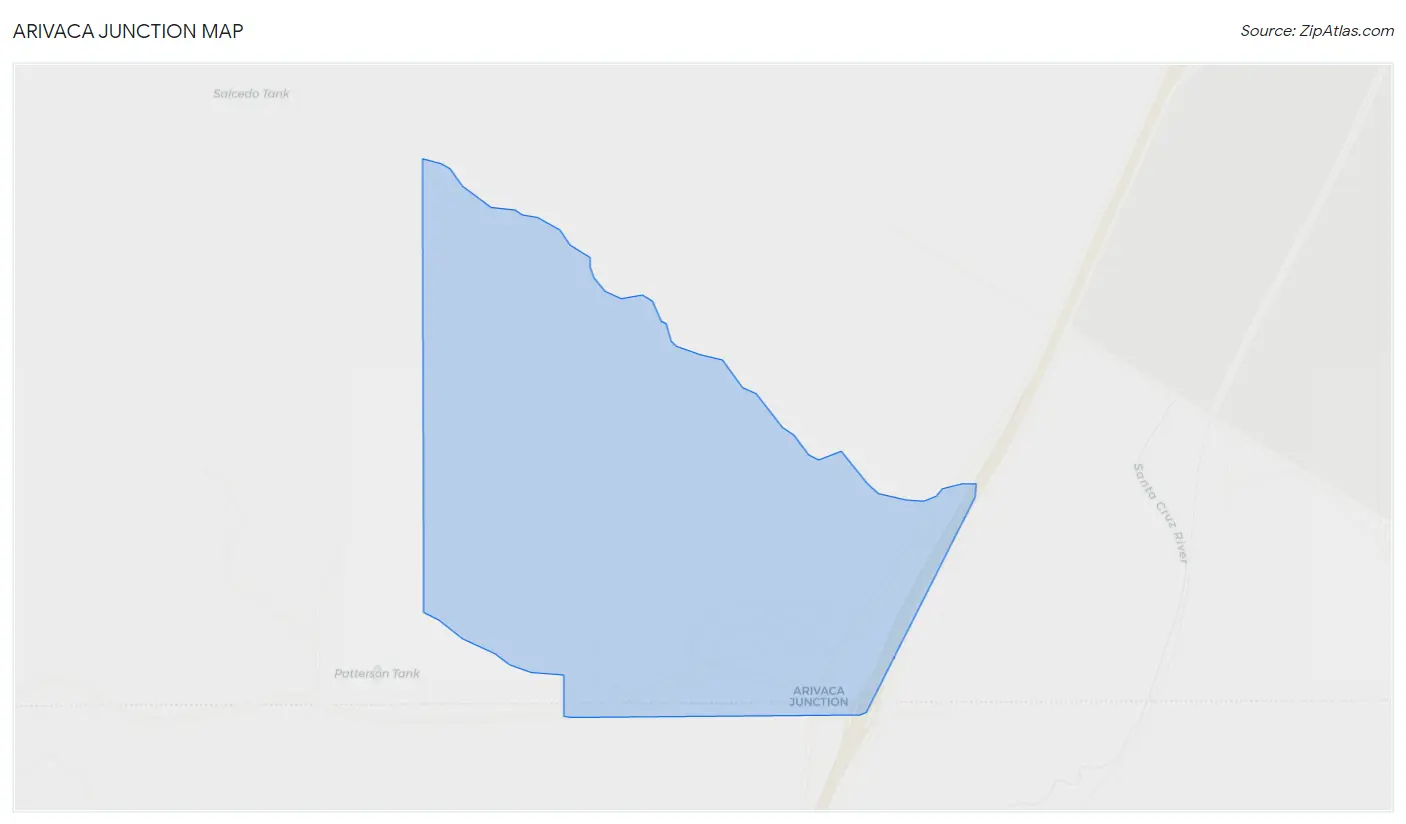
Arivaca Junction Overview
$27,106
PER CAPITA INCOME
$68,813
AVG FAMILY INCOME
$62,059
AVG HOUSEHOLD INCOME
16.7%
WAGE / INCOME GAP [ % ]
83.3¢/ $1
WAGE / INCOME GAP [ $ ]
0.23
INEQUALITY / GINI INDEX
606
TOTAL POPULATION
261
MALE POPULATION
345
FEMALE POPULATION
75.65
MALES / 100 FEMALES
132.18
FEMALES / 100 MALES
51.6
MEDIAN AGE
3.6
AVG FAMILY SIZE
2.4
AVG HOUSEHOLD SIZE
358
LABOR FORCE [ PEOPLE ]
66.9%
PERCENT IN LABOR FORCE
7.3%
UNEMPLOYMENT RATE
Income in Arivaca Junction
Income Overview in Arivaca Junction
Per Capita Income in Arivaca Junction is $27,106, while median incomes of families and households are $68,813 and $62,059 respectively.
| Characteristic | Number | Measure |
| Per Capita Income | 606 | $27,106 |
| Median Family Income | 129 | $68,813 |
| Mean Family Income | 129 | $76,305 |
| Median Household Income | 252 | $62,059 |
| Mean Household Income | 252 | $64,088 |
| Income Deficit | 129 | $0 |
| Wage / Income Gap (%) | 606 | 16.67% |
| Wage / Income Gap ($) | 606 | 83.33¢ per $1 |
| Gini / Inequality Index | 606 | 0.23 |
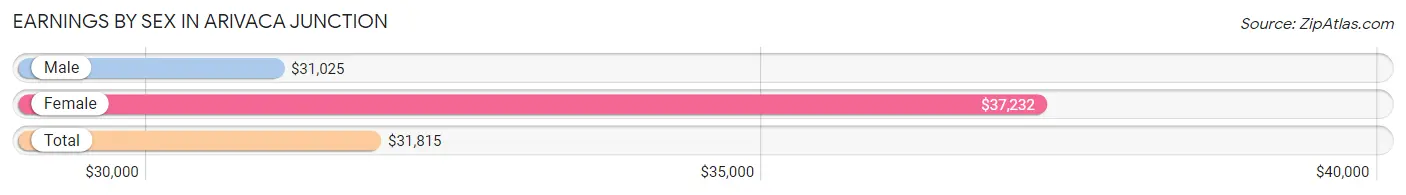
Earnings by Sex in Arivaca Junction
Average Earnings in Arivaca Junction are $31,815, $31,025 for men and $37,232 for women, a difference of 16.7%.
| Sex | Number | Average Earnings |
| Male | 107 (32.2%) | $31,025 |
| Female | 225 (67.8%) | $37,232 |
| Total | 332 (100.0%) | $31,815 |
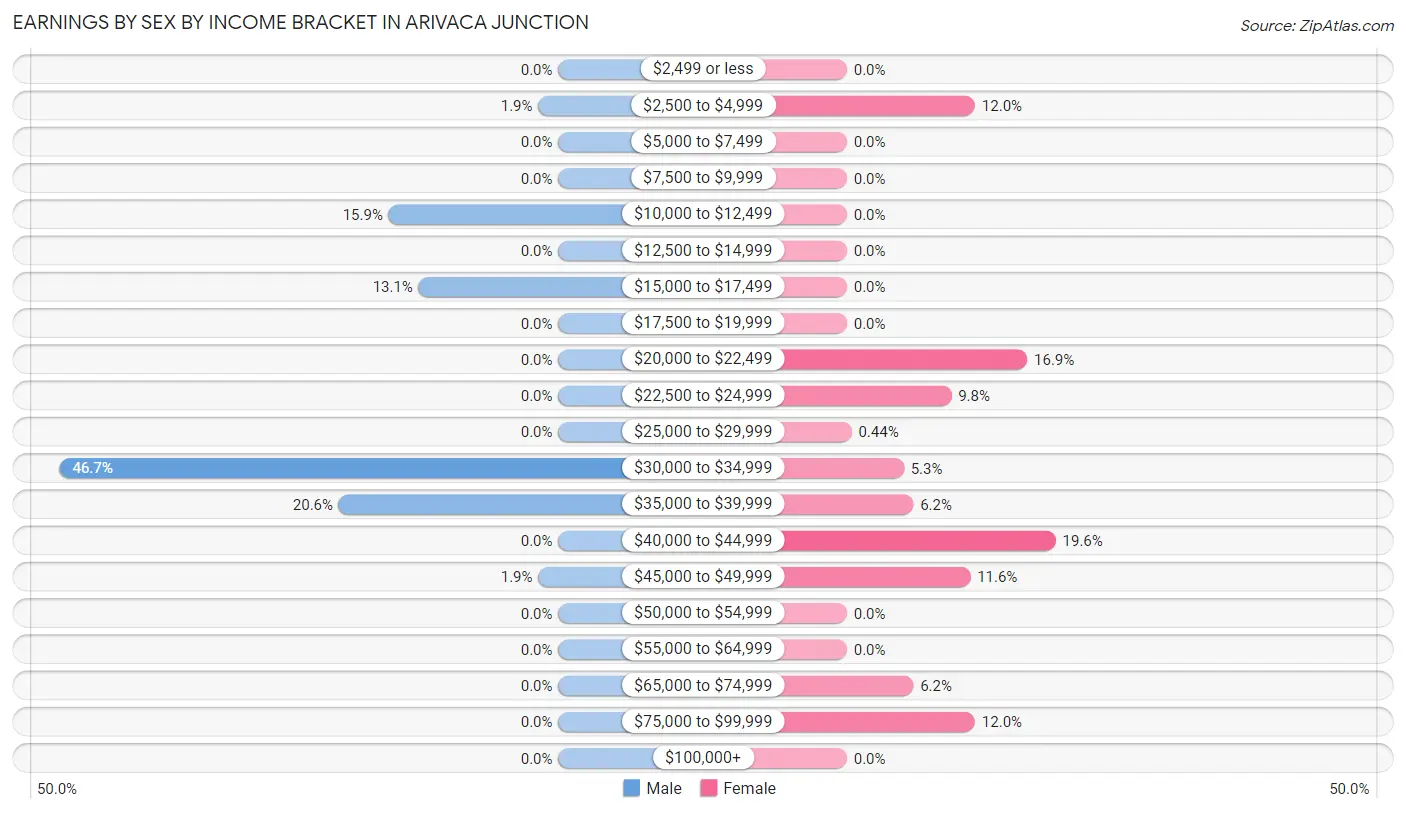
Earnings by Sex by Income Bracket in Arivaca Junction
The most common earnings brackets in Arivaca Junction are $30,000 to $34,999 for men (50 | 46.7%) and $40,000 to $44,999 for women (44 | 19.6%).
| Income | Male | Female |
| $2,499 or less | 0 (0.0%) | 0 (0.0%) |
| $2,500 to $4,999 | 2 (1.9%) | 27 (12.0%) |
| $5,000 to $7,499 | 0 (0.0%) | 0 (0.0%) |
| $7,500 to $9,999 | 0 (0.0%) | 0 (0.0%) |
| $10,000 to $12,499 | 17 (15.9%) | 0 (0.0%) |
| $12,500 to $14,999 | 0 (0.0%) | 0 (0.0%) |
| $15,000 to $17,499 | 14 (13.1%) | 0 (0.0%) |
| $17,500 to $19,999 | 0 (0.0%) | 0 (0.0%) |
| $20,000 to $22,499 | 0 (0.0%) | 38 (16.9%) |
| $22,500 to $24,999 | 0 (0.0%) | 22 (9.8%) |
| $25,000 to $29,999 | 0 (0.0%) | 1 (0.4%) |
| $30,000 to $34,999 | 50 (46.7%) | 12 (5.3%) |
| $35,000 to $39,999 | 22 (20.6%) | 14 (6.2%) |
| $40,000 to $44,999 | 0 (0.0%) | 44 (19.6%) |
| $45,000 to $49,999 | 2 (1.9%) | 26 (11.6%) |
| $50,000 to $54,999 | 0 (0.0%) | 0 (0.0%) |
| $55,000 to $64,999 | 0 (0.0%) | 0 (0.0%) |
| $65,000 to $74,999 | 0 (0.0%) | 14 (6.2%) |
| $75,000 to $99,999 | 0 (0.0%) | 27 (12.0%) |
| $100,000+ | 0 (0.0%) | 0 (0.0%) |
| Total | 107 (100.0%) | 225 (100.0%) |
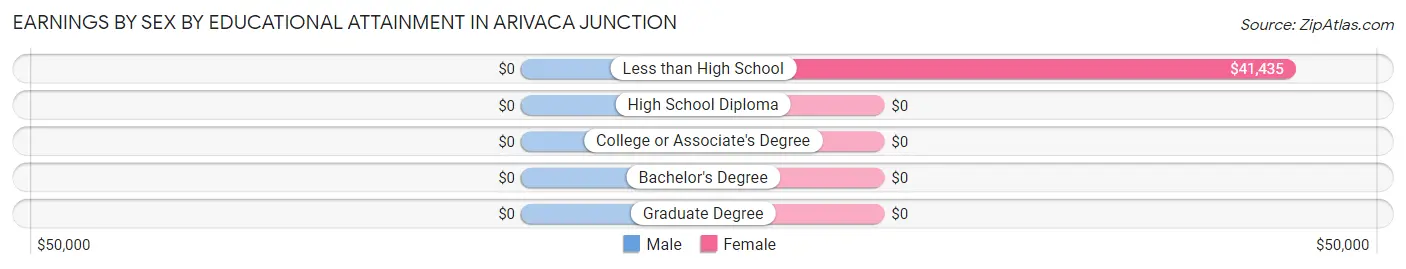
Earnings by Sex by Educational Attainment in Arivaca Junction
| Educational Attainment | Male Income | Female Income |
| Less than High School | - | - |
| High School Diploma | - | - |
| College or Associate's Degree | - | - |
| Bachelor's Degree | - | - |
| Graduate Degree | - | - |
| Total | $31,025 | $40,324 |
Family Income in Arivaca Junction
Family Income Brackets in Arivaca Junction
According to the Arivaca Junction family income data, there are 74 families falling into the $50,000 to $74,999 income range, which is the most common income bracket and makes up 57.4% of all families.
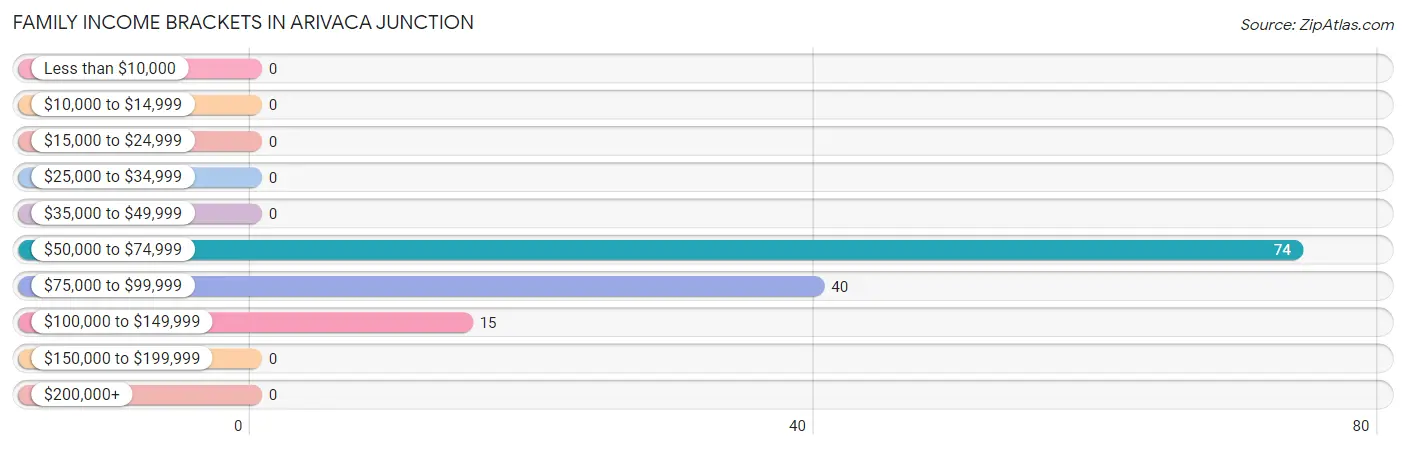
| Income Bracket | # Families | % Families |
| Less than $10,000 | 0 | 0.0% |
| $10,000 to $14,999 | 0 | 0.0% |
| $15,000 to $24,999 | 0 | 0.0% |
| $25,000 to $34,999 | 0 | 0.0% |
| $35,000 to $49,999 | 0 | 0.0% |
| $50,000 to $74,999 | 74 | 57.4% |
| $75,000 to $99,999 | 40 | 31.0% |
| $100,000 to $149,999 | 15 | 11.6% |
| $150,000 to $199,999 | 0 | 0.0% |
| $200,000+ | 0 | 0.0% |
Family Income by Famaliy Size in Arivaca Junction
4-person families (36 | 27.9%) account for the highest median family income in Arivaca Junction with $69,750 per family, while 2-person families (67 | 51.9%) have the highest median income of $31,386 per family member.
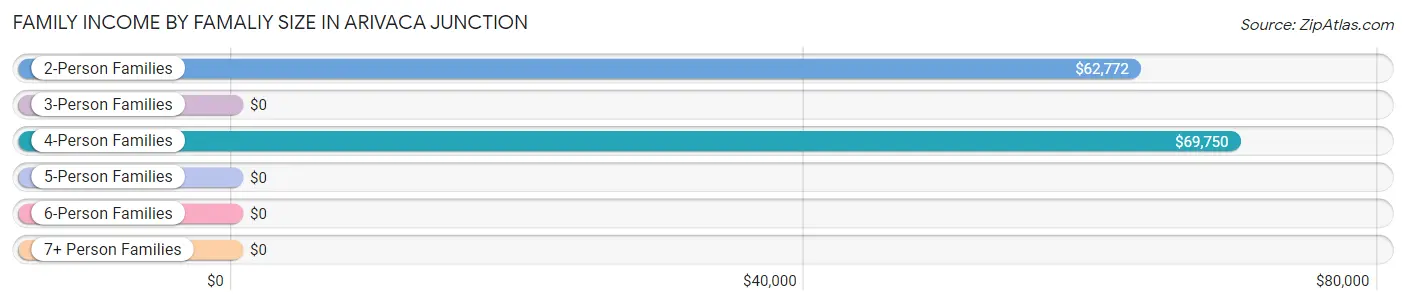
| Income Bracket | # Families | Median Income |
| 2-Person Families | 67 (51.9%) | $62,772 |
| 3-Person Families | 0 (0.0%) | $0 |
| 4-Person Families | 36 (27.9%) | $69,750 |
| 5-Person Families | 0 (0.0%) | $0 |
| 6-Person Families | 0 (0.0%) | $0 |
| 7+ Person Families | 26 (20.2%) | $0 |
| Total | 129 (100.0%) | $68,813 |
Family Income by Number of Earners in Arivaca Junction
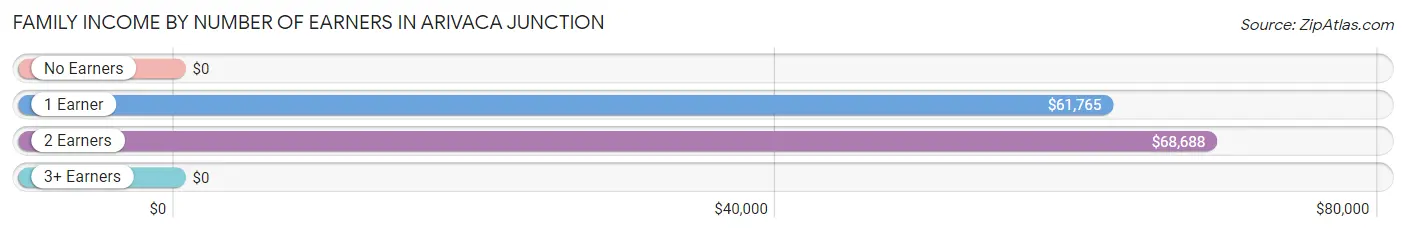
| Number of Earners | # Families | Median Income |
| No Earners | 0 (0.0%) | $0 |
| 1 Earner | 52 (40.3%) | $61,765 |
| 2 Earners | 49 (38.0%) | $68,688 |
| 3+ Earners | 28 (21.7%) | $0 |
| Total | 129 (100.0%) | $68,813 |
Household Income in Arivaca Junction
Household Income Brackets in Arivaca Junction
With 101 households falling in the category, the $50,000 to $74,999 income range is the most frequent in Arivaca Junction, accounting for 40.1% of all households.
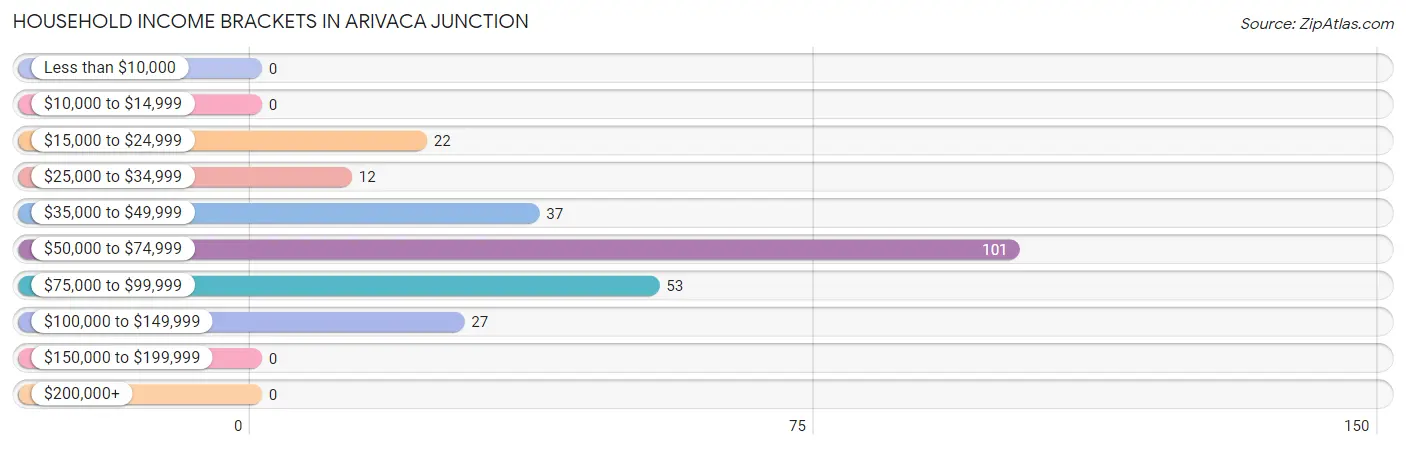
| Income Bracket | # Households | % Households |
| Less than $10,000 | 0 | 0.0% |
| $10,000 to $14,999 | 0 | 0.0% |
| $15,000 to $24,999 | 22 | 8.7% |
| $25,000 to $34,999 | 12 | 4.8% |
| $35,000 to $49,999 | 37 | 14.7% |
| $50,000 to $74,999 | 101 | 40.1% |
| $75,000 to $99,999 | 53 | 21.0% |
| $100,000 to $149,999 | 27 | 10.7% |
| $150,000 to $199,999 | 0 | 0.0% |
| $200,000+ | 0 | 0.0% |
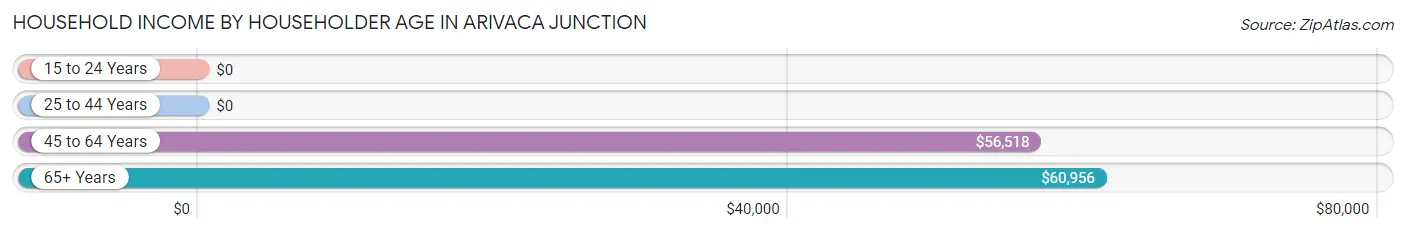
Household Income by Householder Age in Arivaca Junction
The median household income in Arivaca Junction is $62,059, with the highest median household income of $60,956 found in the 65+ years age bracket for the primary householder. A total of 111 households (44.1%) fall into this category.
| Income Bracket | # Households | Median Income |
| 15 to 24 Years | 0 (0.0%) | $0 |
| 25 to 44 Years | 26 (10.3%) | $0 |
| 45 to 64 Years | 115 (45.6%) | $56,518 |
| 65+ Years | 111 (44.1%) | $60,956 |
| Total | 252 (100.0%) | $62,059 |
Poverty in Arivaca Junction
Income Below Poverty by Sex and Age in Arivaca Junction
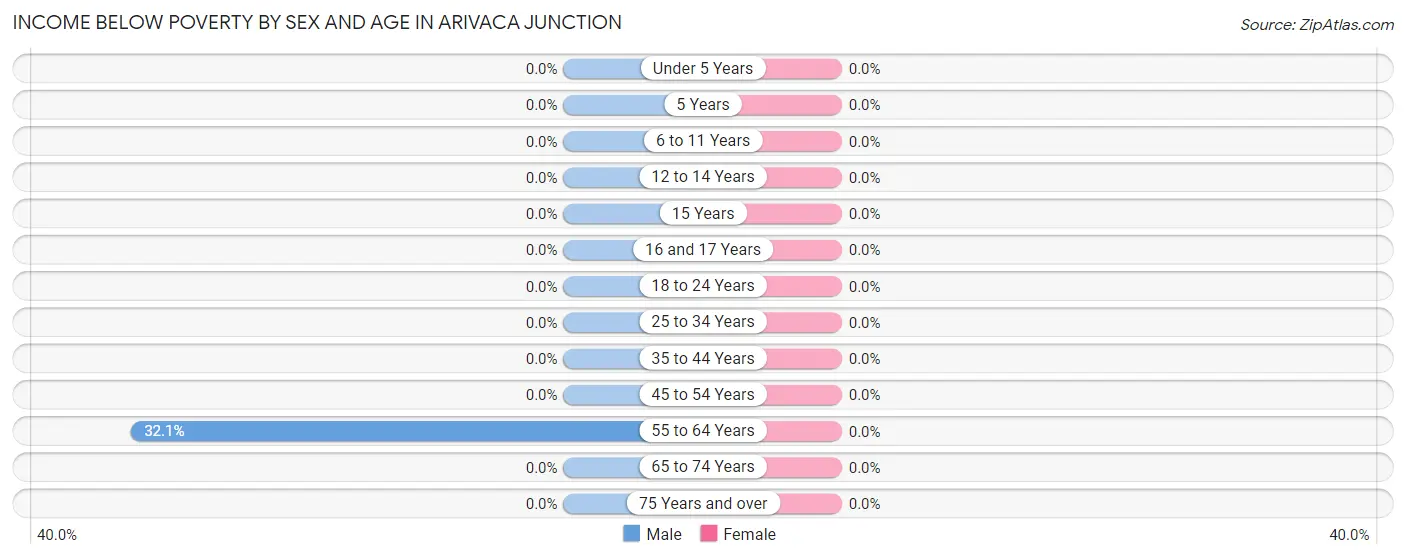
| Age Bracket | Male | Female |
| Under 5 Years | 0 (0.0%) | 0 (0.0%) |
| 5 Years | 0 (0.0%) | 0 (0.0%) |
| 6 to 11 Years | 0 (0.0%) | 0 (0.0%) |
| 12 to 14 Years | 0 (0.0%) | 0 (0.0%) |
| 15 Years | 0 (0.0%) | 0 (0.0%) |
| 16 and 17 Years | 0 (0.0%) | 0 (0.0%) |
| 18 to 24 Years | 0 (0.0%) | 0 (0.0%) |
| 25 to 34 Years | 0 (0.0%) | 0 (0.0%) |
| 35 to 44 Years | 0 (0.0%) | 0 (0.0%) |
| 45 to 54 Years | 0 (0.0%) | 0 (0.0%) |
| 55 to 64 Years | 17 (32.1%) | 0 (0.0%) |
| 65 to 74 Years | 0 (0.0%) | 0 (0.0%) |
| 75 Years and over | 0 (0.0%) | 0 (0.0%) |
| Total | 17 (6.5%) | 0 (0.0%) |
Income Above Poverty by Sex and Age in Arivaca Junction
According to the poverty statistics in Arivaca Junction, males aged under 5 years and females aged 12 to 14 years are the age groups that are most secure financially, with 100.0% of males and 100.0% of females in these age groups living above the poverty line.
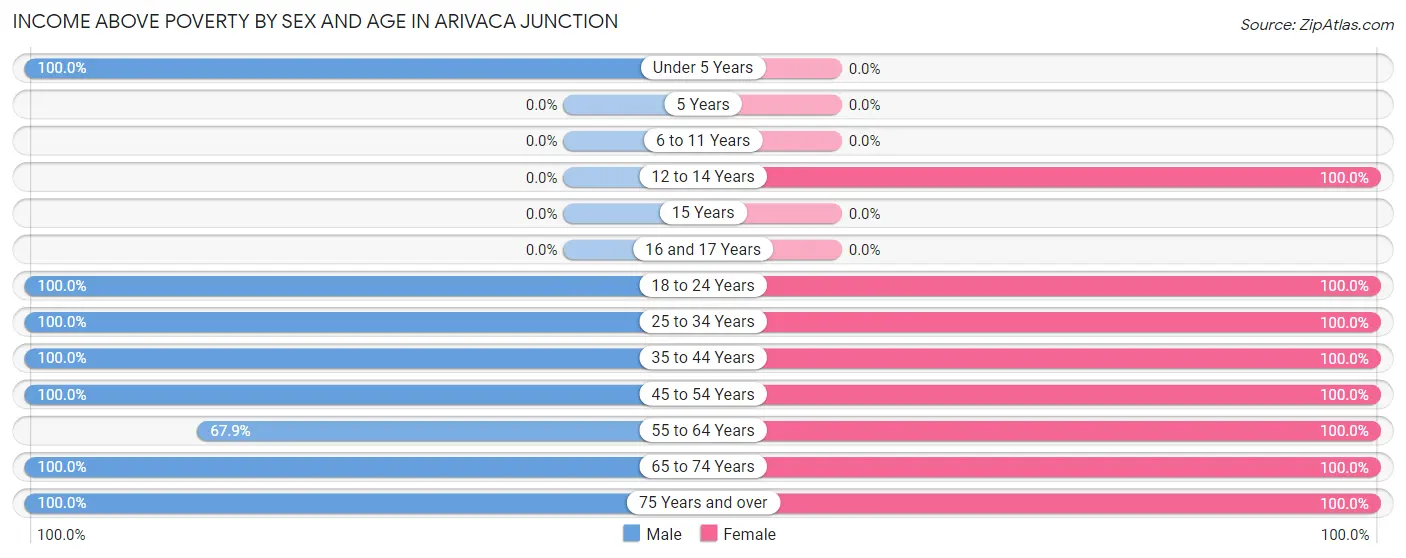
| Age Bracket | Male | Female |
| Under 5 Years | 26 (100.0%) | 0 (0.0%) |
| 5 Years | 0 (0.0%) | 0 (0.0%) |
| 6 to 11 Years | 0 (0.0%) | 0 (0.0%) |
| 12 to 14 Years | 0 (0.0%) | 45 (100.0%) |
| 15 Years | 0 (0.0%) | 0 (0.0%) |
| 16 and 17 Years | 0 (0.0%) | 0 (0.0%) |
| 18 to 24 Years | 26 (100.0%) | 44 (100.0%) |
| 25 to 34 Years | 26 (100.0%) | 15 (100.0%) |
| 35 to 44 Years | 26 (100.0%) | 48 (100.0%) |
| 45 to 54 Years | 42 (100.0%) | 28 (100.0%) |
| 55 to 64 Years | 36 (67.9%) | 76 (100.0%) |
| 65 to 74 Years | 33 (100.0%) | 49 (100.0%) |
| 75 Years and over | 29 (100.0%) | 40 (100.0%) |
| Total | 244 (93.5%) | 345 (100.0%) |
Income Below Poverty Among Married-Couple Families in Arivaca Junction
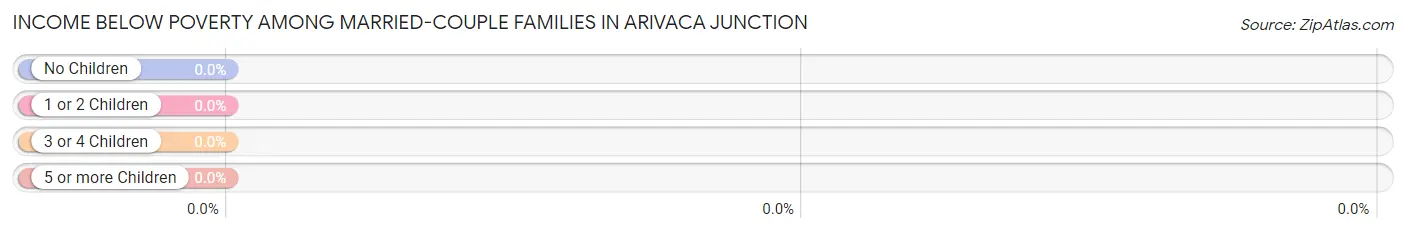
| Children | Above Poverty | Below Poverty |
| No Children | 88 (100.0%) | 0 (0.0%) |
| 1 or 2 Children | 0 (0.0%) | 0 (0.0%) |
| 3 or 4 Children | 26 (100.0%) | 0 (0.0%) |
| 5 or more Children | 0 (0.0%) | 0 (0.0%) |
| Total | 114 (100.0%) | 0 (0.0%) |
Income Below Poverty Among Single-Parent Households in Arivaca Junction
| Children | Single Father | Single Mother |
| No Children | 0 (0.0%) | 0 (0.0%) |
| 1 or 2 Children | 0 (0.0%) | 0 (0.0%) |
| 3 or 4 Children | 0 (0.0%) | 0 (0.0%) |
| 5 or more Children | 0 (0.0%) | 0 (0.0%) |
| Total | 0 (0.0%) | 0 (0.0%) |
Income Below Poverty Among Married-Couple vs Single-Parent Households in Arivaca Junction
| Children | Married-Couple Families | Single-Parent Households |
| No Children | 0 (0.0%) | 0 (0.0%) |
| 1 or 2 Children | 0 (0.0%) | 0 (0.0%) |
| 3 or 4 Children | 0 (0.0%) | 0 (0.0%) |
| 5 or more Children | 0 (0.0%) | 0 (0.0%) |
| Total | 0 (0.0%) | 0 (0.0%) |
Race in Arivaca Junction
The most populous races in Arivaca Junction are Hispanic or Latino (468 | 77.2%), Two or more Races (407 | 67.2%), and White / Caucasian (177 | 29.2%).
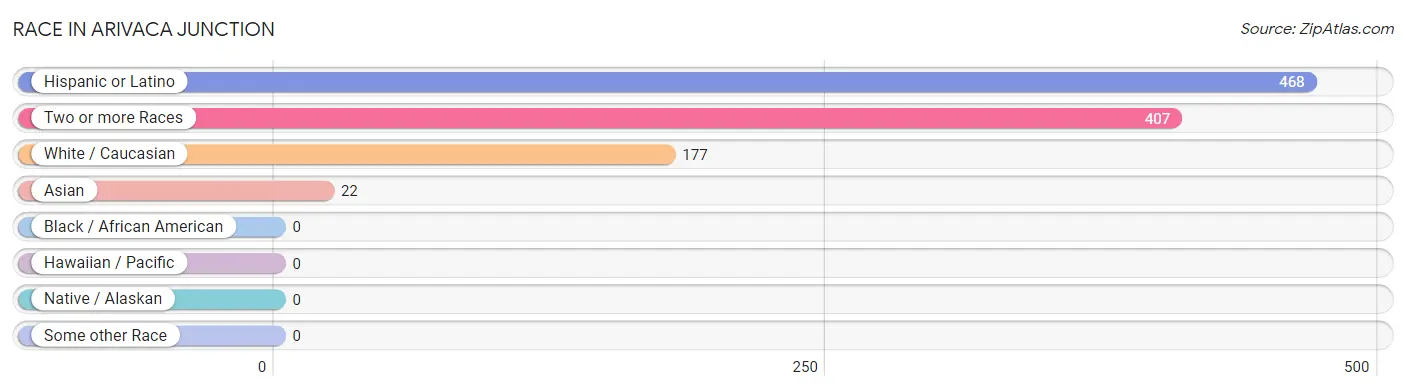
| Race | # Population | % Population |
| Asian | 22 | 3.6% |
| Black / African American | 0 | 0.0% |
| Hawaiian / Pacific | 0 | 0.0% |
| Hispanic or Latino | 468 | 77.2% |
| Native / Alaskan | 0 | 0.0% |
| White / Caucasian | 177 | 29.2% |
| Two or more Races | 407 | 67.2% |
| Some other Race | 0 | 0.0% |
| Total | 606 | 100.0% |
Ancestry in Arivaca Junction
The most populous ancestries reported in Arivaca Junction are Mexican (462 | 76.2%), Italian (49 | 8.1%), English (36 | 5.9%), French (32 | 5.3%), and Irish (31 | 5.1%), together accounting for 100.7% of all Arivaca Junction residents.
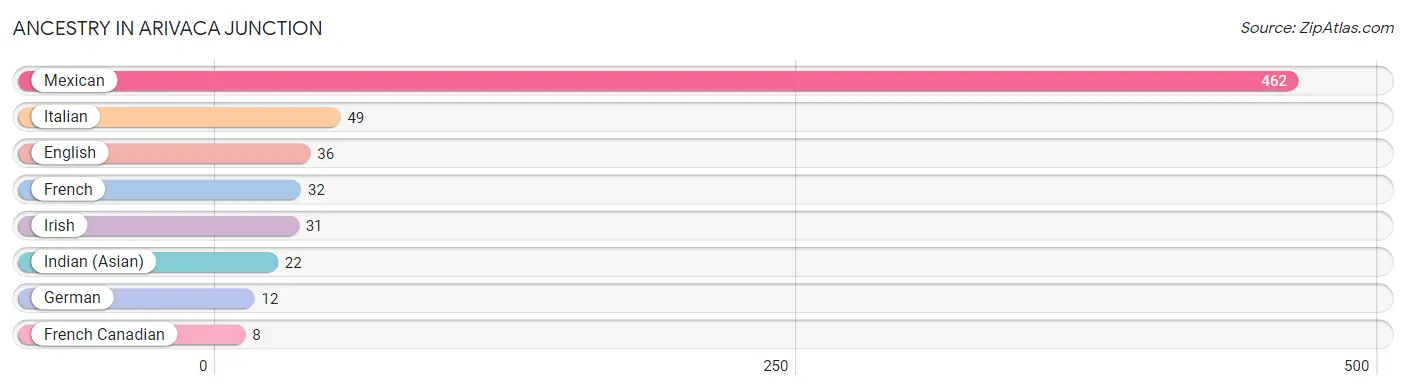
| Ancestry | # Population | % Population |
| English | 36 | 5.9% |
| French | 32 | 5.3% |
| French Canadian | 8 | 1.3% |
| German | 12 | 2.0% |
| Indian (Asian) | 22 | 3.6% |
| Irish | 31 | 5.1% |
| Italian | 49 | 8.1% |
| Mexican | 462 | 76.2% | View All 8 Rows |
Immigrants in Arivaca Junction
The most numerous immigrant groups reported in Arivaca Junction came from Central America (239 | 39.4%), Latin America (239 | 39.4%), Mexico (239 | 39.4%), Asia (22 | 3.6%), and Singapore (22 | 3.6%), together accounting for 125.6% of all Arivaca Junction residents.
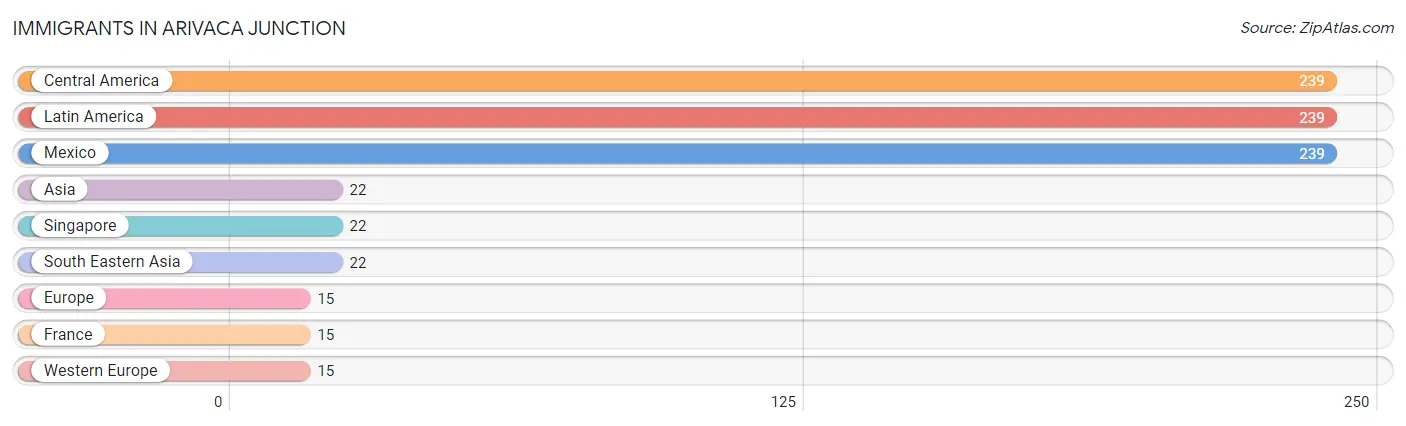
| Immigration Origin | # Population | % Population |
| Asia | 22 | 3.6% |
| Central America | 239 | 39.4% |
| Europe | 15 | 2.5% |
| France | 15 | 2.5% |
| Latin America | 239 | 39.4% |
| Mexico | 239 | 39.4% |
| Singapore | 22 | 3.6% |
| South Eastern Asia | 22 | 3.6% |
| Western Europe | 15 | 2.5% | View All 9 Rows |
Sex and Age in Arivaca Junction
Sex and Age in Arivaca Junction
The most populous age groups in Arivaca Junction are 60 to 64 Years (53 | 20.3%) for men and 60 to 64 Years (50 | 14.5%) for women.
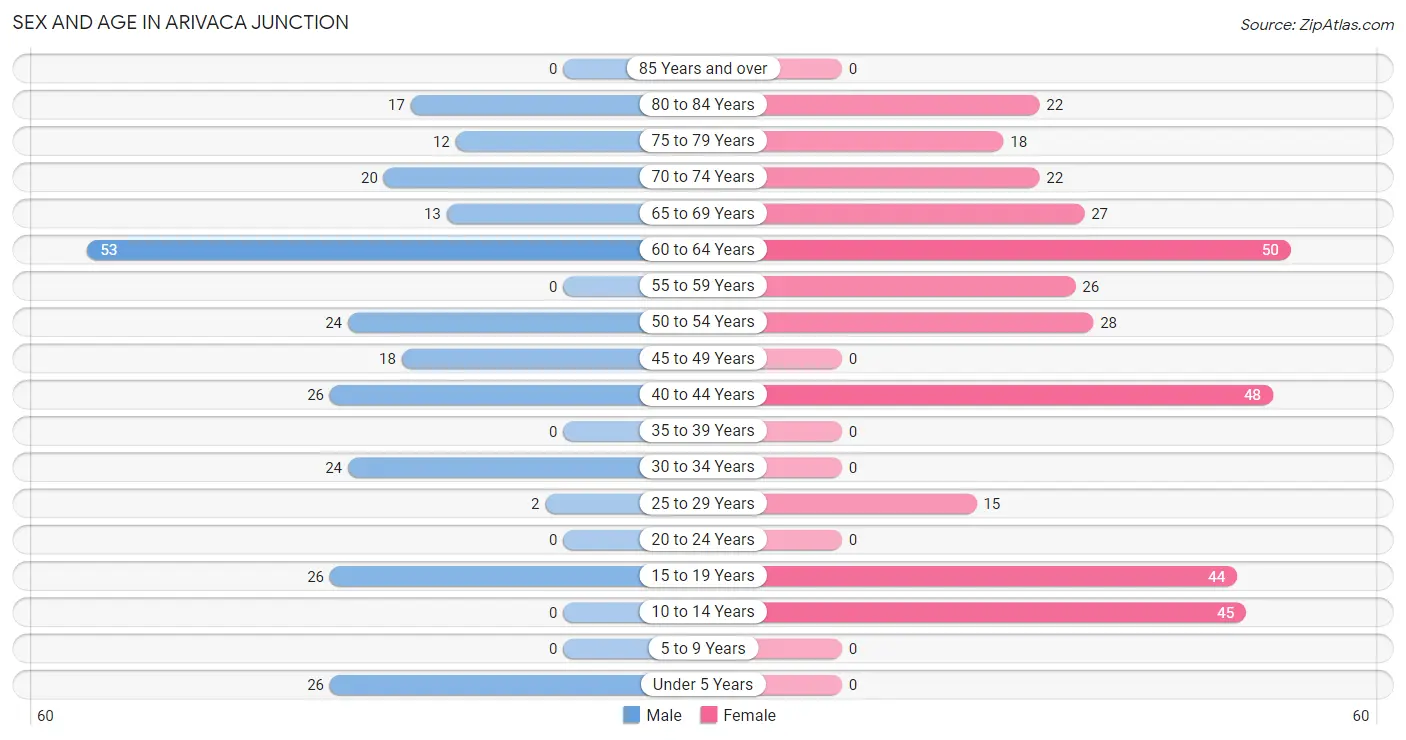
| Age Bracket | Male | Female |
| Under 5 Years | 26 (10.0%) | 0 (0.0%) |
| 5 to 9 Years | 0 (0.0%) | 0 (0.0%) |
| 10 to 14 Years | 0 (0.0%) | 45 (13.0%) |
| 15 to 19 Years | 26 (10.0%) | 44 (12.8%) |
| 20 to 24 Years | 0 (0.0%) | 0 (0.0%) |
| 25 to 29 Years | 2 (0.8%) | 15 (4.3%) |
| 30 to 34 Years | 24 (9.2%) | 0 (0.0%) |
| 35 to 39 Years | 0 (0.0%) | 0 (0.0%) |
| 40 to 44 Years | 26 (10.0%) | 48 (13.9%) |
| 45 to 49 Years | 18 (6.9%) | 0 (0.0%) |
| 50 to 54 Years | 24 (9.2%) | 28 (8.1%) |
| 55 to 59 Years | 0 (0.0%) | 26 (7.5%) |
| 60 to 64 Years | 53 (20.3%) | 50 (14.5%) |
| 65 to 69 Years | 13 (5.0%) | 27 (7.8%) |
| 70 to 74 Years | 20 (7.7%) | 22 (6.4%) |
| 75 to 79 Years | 12 (4.6%) | 18 (5.2%) |
| 80 to 84 Years | 17 (6.5%) | 22 (6.4%) |
| 85 Years and over | 0 (0.0%) | 0 (0.0%) |
| Total | 261 (100.0%) | 345 (100.0%) |
Families and Households in Arivaca Junction
Median Family Size in Arivaca Junction
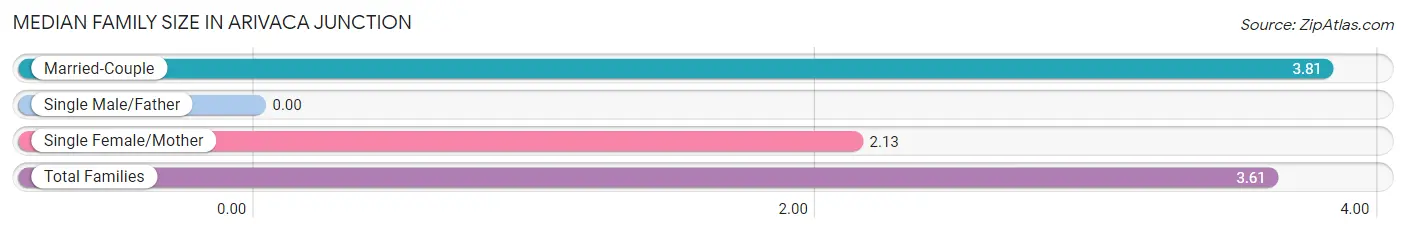
| Family Type | # Families | Family Size |
| Married-Couple | 114 (88.4%) | 3.81 |
| Single Male/Father | 0 (0.0%) | - |
| Single Female/Mother | 15 (11.6%) | 2.13 |
| Total Families | 129 (100.0%) | 3.61 |
Median Household Size in Arivaca Junction
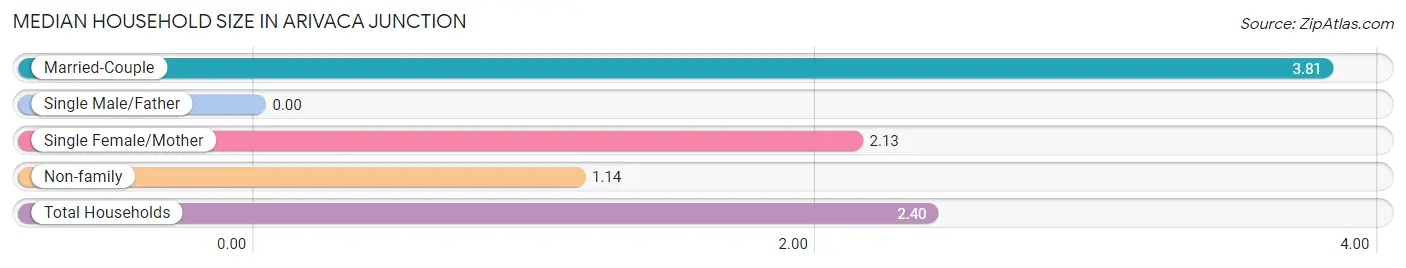
| Household Type | # Households | Household Size |
| Married-Couple | 114 (45.2%) | 3.81 |
| Single Male/Father | 0 (0.0%) | - |
| Single Female/Mother | 15 (5.9%) | 2.13 |
| Non-family | 123 (48.8%) | 1.14 |
| Total Households | 252 (100.0%) | 2.40 |
Household Size by Marriage Status in Arivaca Junction
Out of a total of 252 households in Arivaca Junction, 129 (51.2%) are family households, while 123 (48.8%) are nonfamily households. The most numerous type of family households are 2-person households, comprising 67, and the most common type of nonfamily households are 1-person households, comprising 108.
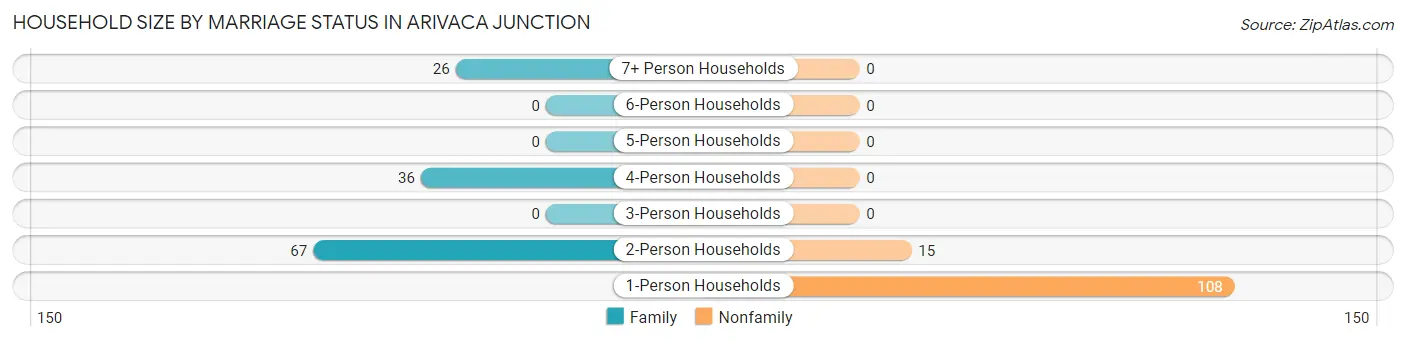
| Household Size | Family Households | Nonfamily Households |
| 1-Person Households | - | 108 (42.9%) |
| 2-Person Households | 67 (26.6%) | 15 (5.9%) |
| 3-Person Households | 0 (0.0%) | 0 (0.0%) |
| 4-Person Households | 36 (14.3%) | 0 (0.0%) |
| 5-Person Households | 0 (0.0%) | 0 (0.0%) |
| 6-Person Households | 0 (0.0%) | 0 (0.0%) |
| 7+ Person Households | 26 (10.3%) | 0 (0.0%) |
| Total | 129 (51.2%) | 123 (48.8%) |
Female Fertility in Arivaca Junction
Fertility by Age in Arivaca Junction
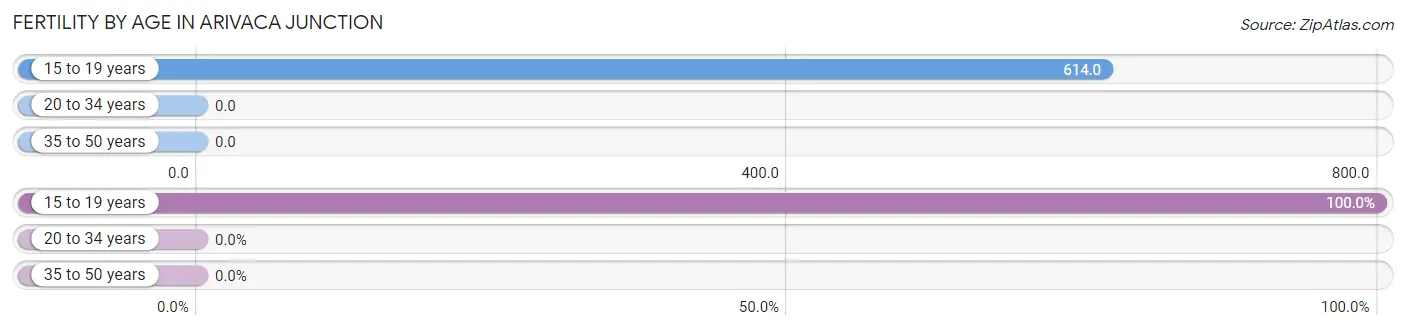
Average fertility rate in Arivaca Junction is 225.0 births per 1,000 women. Women in the age bracket of 15 to 19 years have the highest fertility rate with 614.0 births per 1,000 women. Women in the age bracket of 15 to 19 years acount for 100.0% of all women with births.
| Age Bracket | Women with Births | Births / 1,000 Women |
| 15 to 19 years | 27 (100.0%) | 614.0 |
| 20 to 34 years | 0 (0.0%) | 0.0 |
| 35 to 50 years | 0 (0.0%) | 0.0 |
| Total | 27 (100.0%) | 225.0 |
Fertility by Age by Marriage Status in Arivaca Junction

| Age Bracket | Married | Unmarried |
| 15 to 19 years | 0 (0.0%) | 27 (100.0%) |
| 20 to 34 years | 0 (0.0%) | 0 (0.0%) |
| 35 to 50 years | 0 (0.0%) | 0 (0.0%) |
| Total | 0 (0.0%) | 27 (100.0%) |
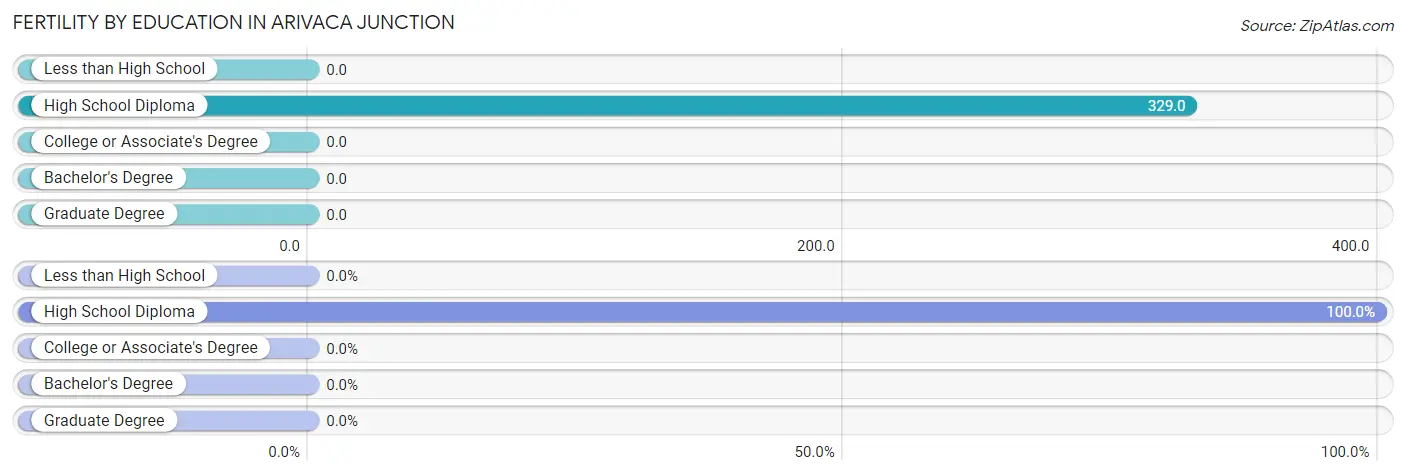
Fertility by Education in Arivaca Junction
| Educational Attainment | Women with Births | Births / 1,000 Women |
| Less than High School | 0 (0.0%) | 0.0 |
| High School Diploma | 27 (100.0%) | 329.0 |
| College or Associate's Degree | 0 (0.0%) | 0.0 |
| Bachelor's Degree | 0 (0.0%) | 0.0 |
| Graduate Degree | 0 (0.0%) | 0.0 |
| Total | 27 (100.0%) | 225.0 |
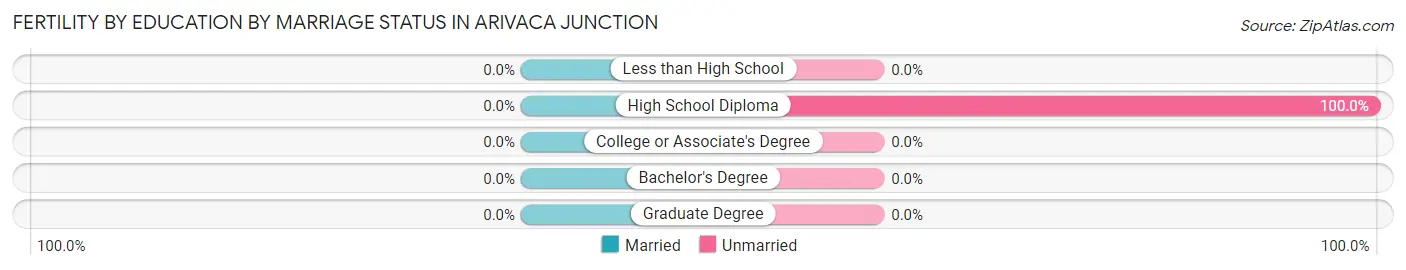
Fertility by Education by Marriage Status in Arivaca Junction
| Educational Attainment | Married | Unmarried |
| Less than High School | 0 (0.0%) | 0 (0.0%) |
| High School Diploma | 0 (0.0%) | 27 (100.0%) |
| College or Associate's Degree | 0 (0.0%) | 0 (0.0%) |
| Bachelor's Degree | 0 (0.0%) | 0 (0.0%) |
| Graduate Degree | 0 (0.0%) | 0 (0.0%) |
| Total | 0 (0.0%) | 27 (100.0%) |
Employment Characteristics in Arivaca Junction
Employment by Class of Employer in Arivaca Junction
Among the 332 employed individuals in Arivaca Junction, private company employees (174 | 52.4%), not-for-profit organizations (71 | 21.4%), and local government employees (37 | 11.1%) make up the most common classes of employment.
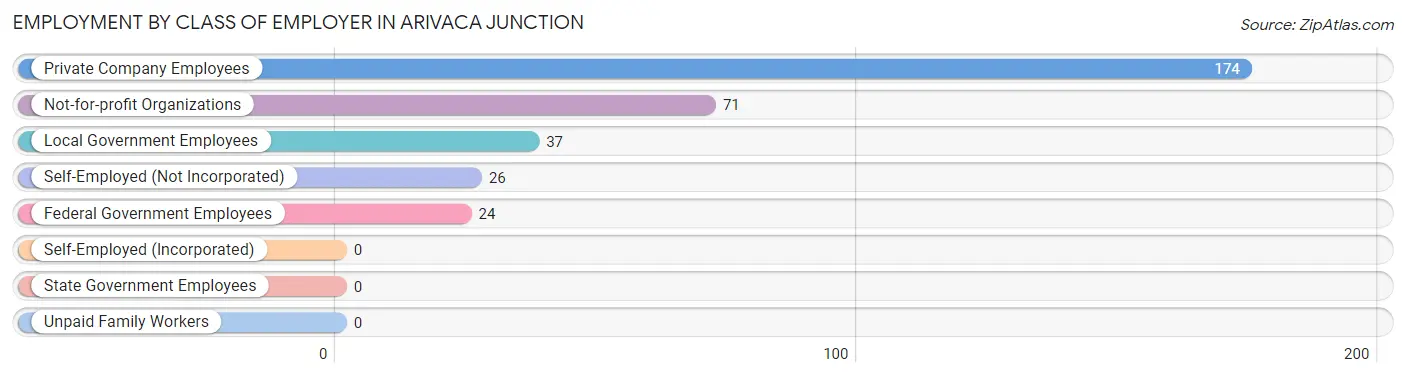
| Employer Class | # Employees | % Employees |
| Private Company Employees | 174 | 52.4% |
| Self-Employed (Incorporated) | 0 | 0.0% |
| Self-Employed (Not Incorporated) | 26 | 7.8% |
| Not-for-profit Organizations | 71 | 21.4% |
| Local Government Employees | 37 | 11.1% |
| State Government Employees | 0 | 0.0% |
| Federal Government Employees | 24 | 7.2% |
| Unpaid Family Workers | 0 | 0.0% |
| Total | 332 | 100.0% |
Employment Status by Age in Arivaca Junction
According to the labor force statistics for Arivaca Junction, out of the total population over 16 years of age (535), 66.9% or 358 individuals are in the labor force, with 7.3% or 26 of them unemployed. The age group with the highest labor force participation rate is 16 to 19 years, with 100.0% or 70 individuals in the labor force. Within the labor force, the 16 to 19 years age range has the highest percentage of unemployed individuals, with 37.1% or 26 of them being unemployed.
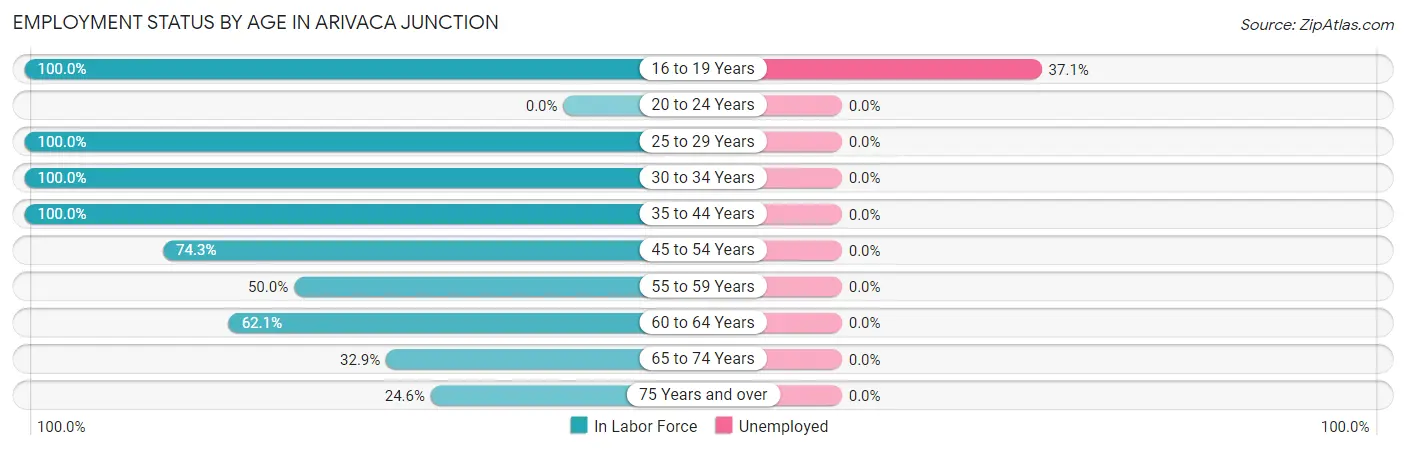
| Age Bracket | In Labor Force | Unemployed |
| 16 to 19 Years | 70 (100.0%) | 26 (37.1%) |
| 20 to 24 Years | 0 (0.0%) | 0 (0.0%) |
| 25 to 29 Years | 17 (100.0%) | 0 (0.0%) |
| 30 to 34 Years | 24 (100.0%) | 0 (0.0%) |
| 35 to 44 Years | 74 (100.0%) | 0 (0.0%) |
| 45 to 54 Years | 52 (74.3%) | 0 (0.0%) |
| 55 to 59 Years | 13 (50.0%) | 0 (0.0%) |
| 60 to 64 Years | 64 (62.1%) | 0 (0.0%) |
| 65 to 74 Years | 27 (32.9%) | 0 (0.0%) |
| 75 Years and over | 17 (24.6%) | 0 (0.0%) |
| Total | 358 (66.9%) | 26 (7.3%) |
Employment Status by Educational Attainment in Arivaca Junction
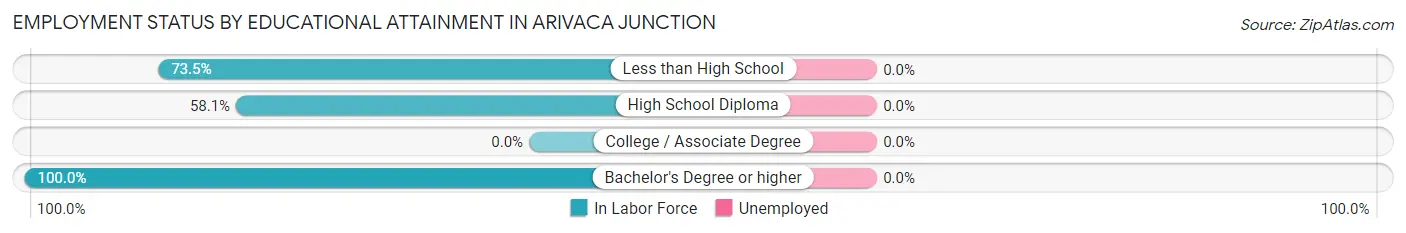
| Educational Attainment | In Labor Force | Unemployed |
| Less than High School | 86 (73.5%) | 0 (0.0%) |
| High School Diploma | 54 (58.1%) | 0 (0.0%) |
| College / Associate Degree | 0 (0.0%) | 0 (0.0%) |
| Bachelor's Degree or higher | 104 (100.0%) | 0 (0.0%) |
| Total | 244 (77.7%) | 0 (0.0%) |
Employment Occupations by Sex in Arivaca Junction
Management, Business, Science and Arts Occupations
The most common Management, Business, Science and Arts occupations in Arivaca Junction are Community & Social Service (27 | 8.1%), Education Instruction & Library (27 | 8.1%), Management (15 | 4.5%), and Business & Financial (14 | 4.2%).
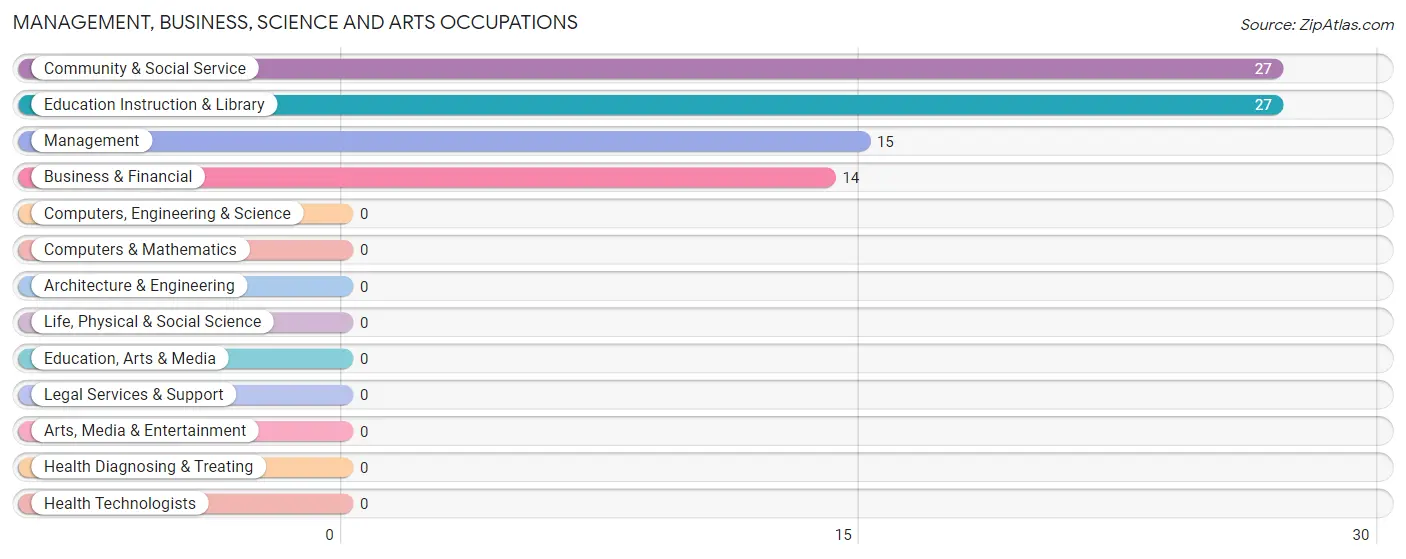
Management, Business, Science and Arts Occupations by Sex
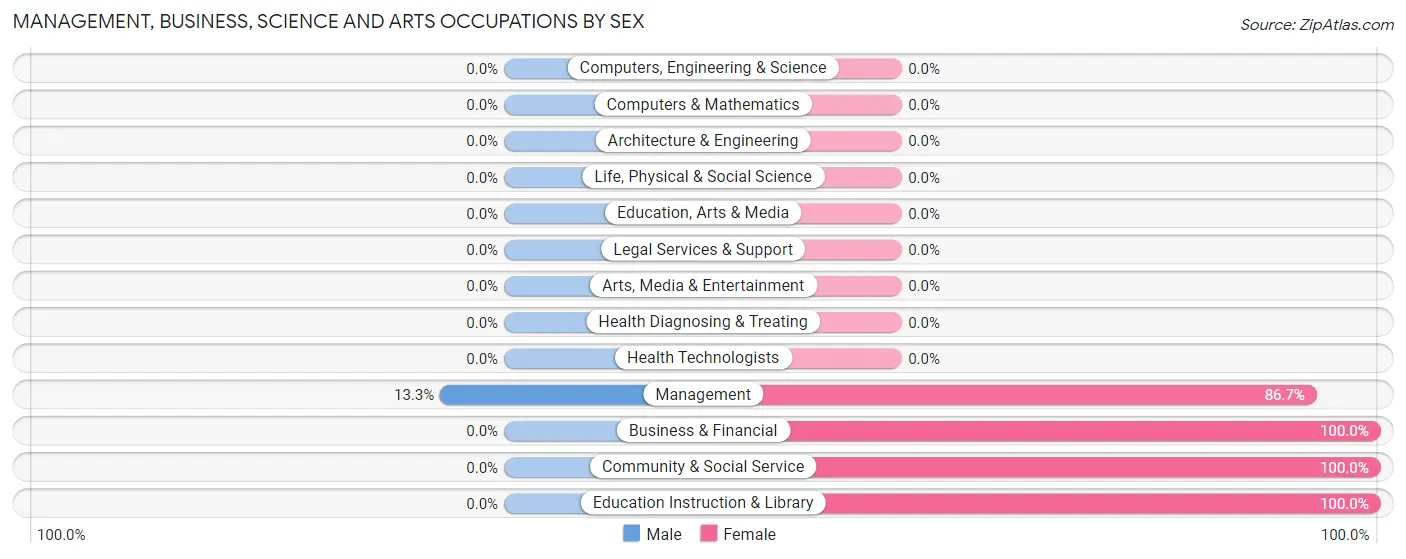
| Occupation | Male | Female |
| Management | 2 (13.3%) | 13 (86.7%) |
| Business & Financial | 0 (0.0%) | 14 (100.0%) |
| Computers, Engineering & Science | 0 (0.0%) | 0 (0.0%) |
| Computers & Mathematics | 0 (0.0%) | 0 (0.0%) |
| Architecture & Engineering | 0 (0.0%) | 0 (0.0%) |
| Life, Physical & Social Science | 0 (0.0%) | 0 (0.0%) |
| Community & Social Service | 0 (0.0%) | 27 (100.0%) |
| Education, Arts & Media | 0 (0.0%) | 0 (0.0%) |
| Legal Services & Support | 0 (0.0%) | 0 (0.0%) |
| Education Instruction & Library | 0 (0.0%) | 27 (100.0%) |
| Arts, Media & Entertainment | 0 (0.0%) | 0 (0.0%) |
| Health Diagnosing & Treating | 0 (0.0%) | 0 (0.0%) |
| Health Technologists | 0 (0.0%) | 0 (0.0%) |
| Total (Category) | 2 (3.6%) | 54 (96.4%) |
| Total (Overall) | 107 (32.2%) | 225 (67.8%) |
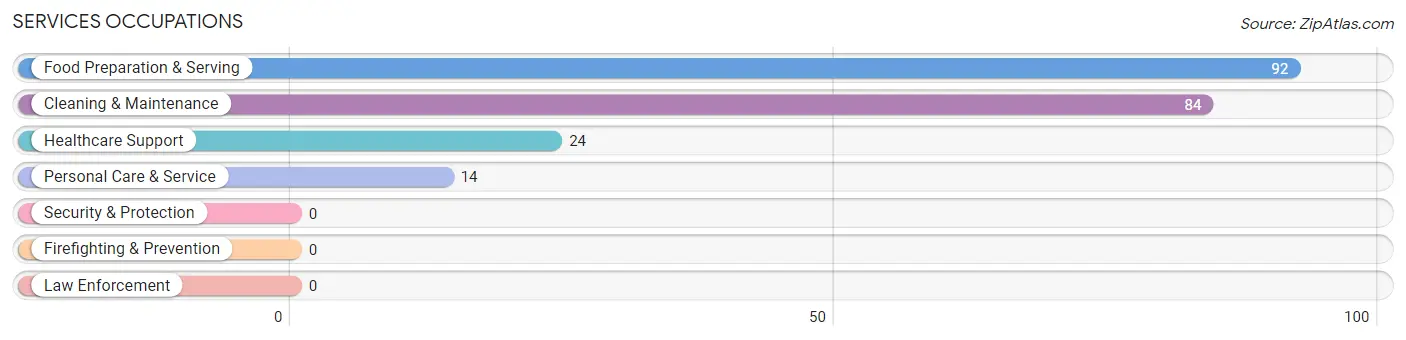
Services Occupations
The most common Services occupations in Arivaca Junction are Food Preparation & Serving (92 | 27.7%), Cleaning & Maintenance (84 | 25.3%), Healthcare Support (24 | 7.2%), and Personal Care & Service (14 | 4.2%).
Services Occupations by Sex
Within the Services occupations in Arivaca Junction, the most male-oriented occupations are Healthcare Support (100.0%), and Cleaning & Maintenance (67.9%), while the most female-oriented occupations are Food Preparation & Serving (100.0%), Personal Care & Service (100.0%), and Cleaning & Maintenance (32.1%).
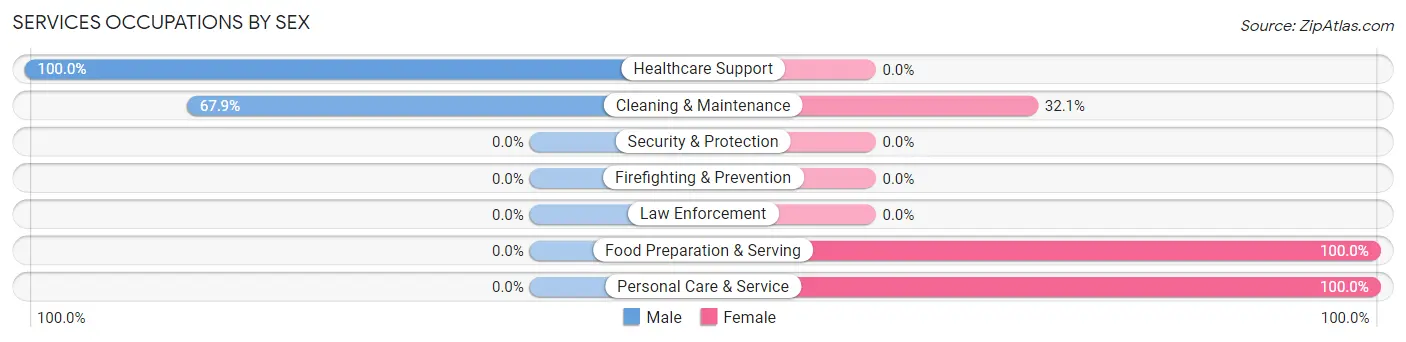
| Occupation | Male | Female |
| Healthcare Support | 24 (100.0%) | 0 (0.0%) |
| Security & Protection | 0 (0.0%) | 0 (0.0%) |
| Firefighting & Prevention | 0 (0.0%) | 0 (0.0%) |
| Law Enforcement | 0 (0.0%) | 0 (0.0%) |
| Food Preparation & Serving | 0 (0.0%) | 92 (100.0%) |
| Cleaning & Maintenance | 57 (67.9%) | 27 (32.1%) |
| Personal Care & Service | 0 (0.0%) | 14 (100.0%) |
| Total (Category) | 81 (37.9%) | 133 (62.2%) |
| Total (Overall) | 107 (32.2%) | 225 (67.8%) |
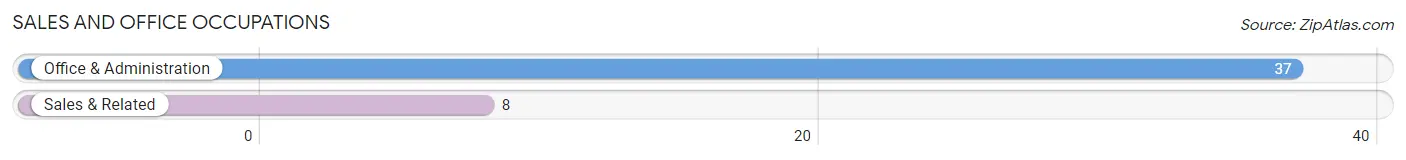
Sales and Office Occupations
The most common Sales and Office occupations in Arivaca Junction are Office & Administration (37 | 11.1%), and Sales & Related (8 | 2.4%).
Sales and Office Occupations by Sex
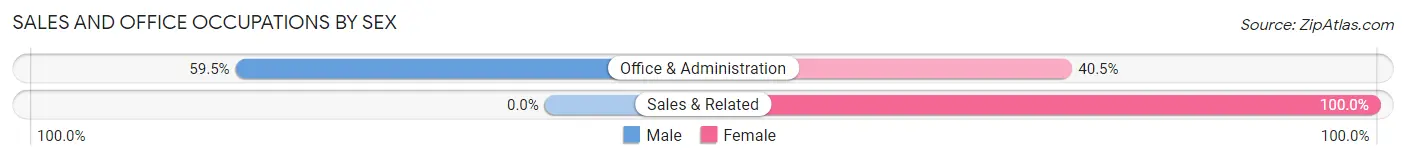
| Occupation | Male | Female |
| Sales & Related | 0 (0.0%) | 8 (100.0%) |
| Office & Administration | 22 (59.5%) | 15 (40.5%) |
| Total (Category) | 22 (48.9%) | 23 (51.1%) |
| Total (Overall) | 107 (32.2%) | 225 (67.8%) |
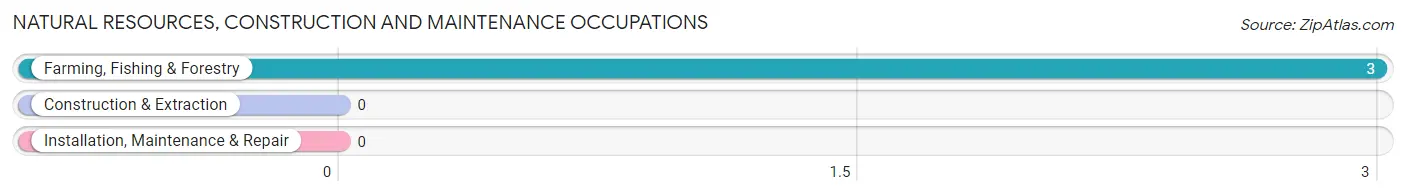
Natural Resources, Construction and Maintenance Occupations
The most common Natural Resources, Construction and Maintenance occupations in Arivaca Junction are , and Farming, Fishing & Forestry (3 | 0.9%).
Natural Resources, Construction and Maintenance Occupations by Sex
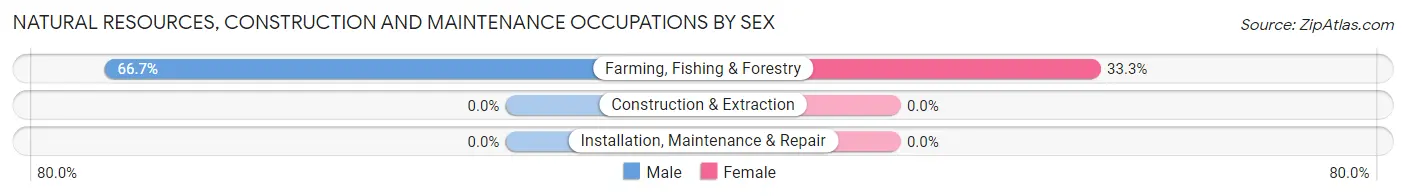
| Occupation | Male | Female |
| Farming, Fishing & Forestry | 2 (66.7%) | 1 (33.3%) |
| Construction & Extraction | 0 (0.0%) | 0 (0.0%) |
| Installation, Maintenance & Repair | 0 (0.0%) | 0 (0.0%) |
| Total (Category) | 2 (66.7%) | 1 (33.3%) |
| Total (Overall) | 107 (32.2%) | 225 (67.8%) |
Production, Transportation and Moving Occupations
The most common Production, Transportation and Moving occupations in Arivaca Junction are , and Material Moving (14 | 4.2%).
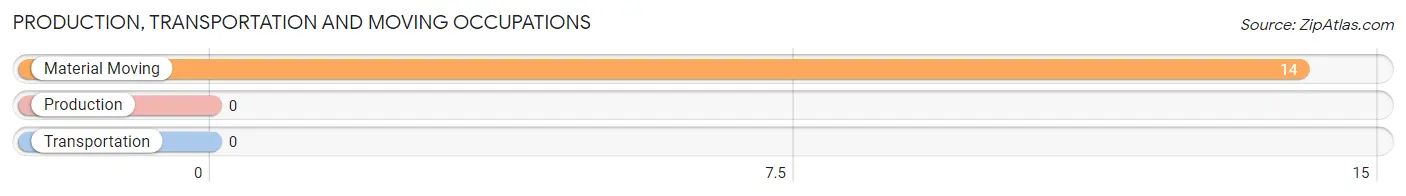
Production, Transportation and Moving Occupations by Sex
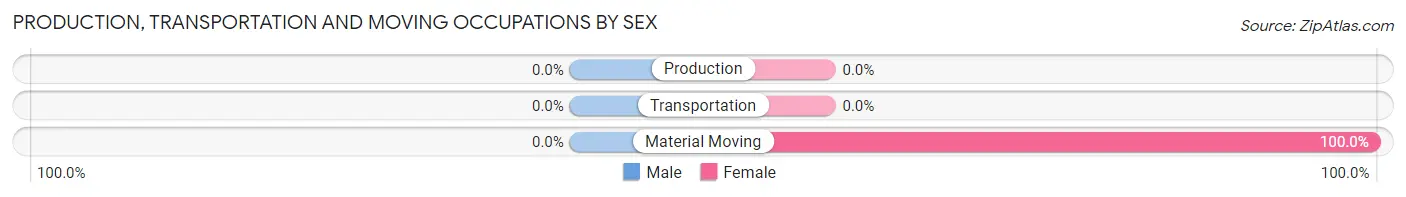
| Occupation | Male | Female |
| Production | 0 (0.0%) | 0 (0.0%) |
| Transportation | 0 (0.0%) | 0 (0.0%) |
| Material Moving | 0 (0.0%) | 14 (100.0%) |
| Total (Category) | 0 (0.0%) | 14 (100.0%) |
| Total (Overall) | 107 (32.2%) | 225 (67.8%) |
Employment Industries by Sex in Arivaca Junction
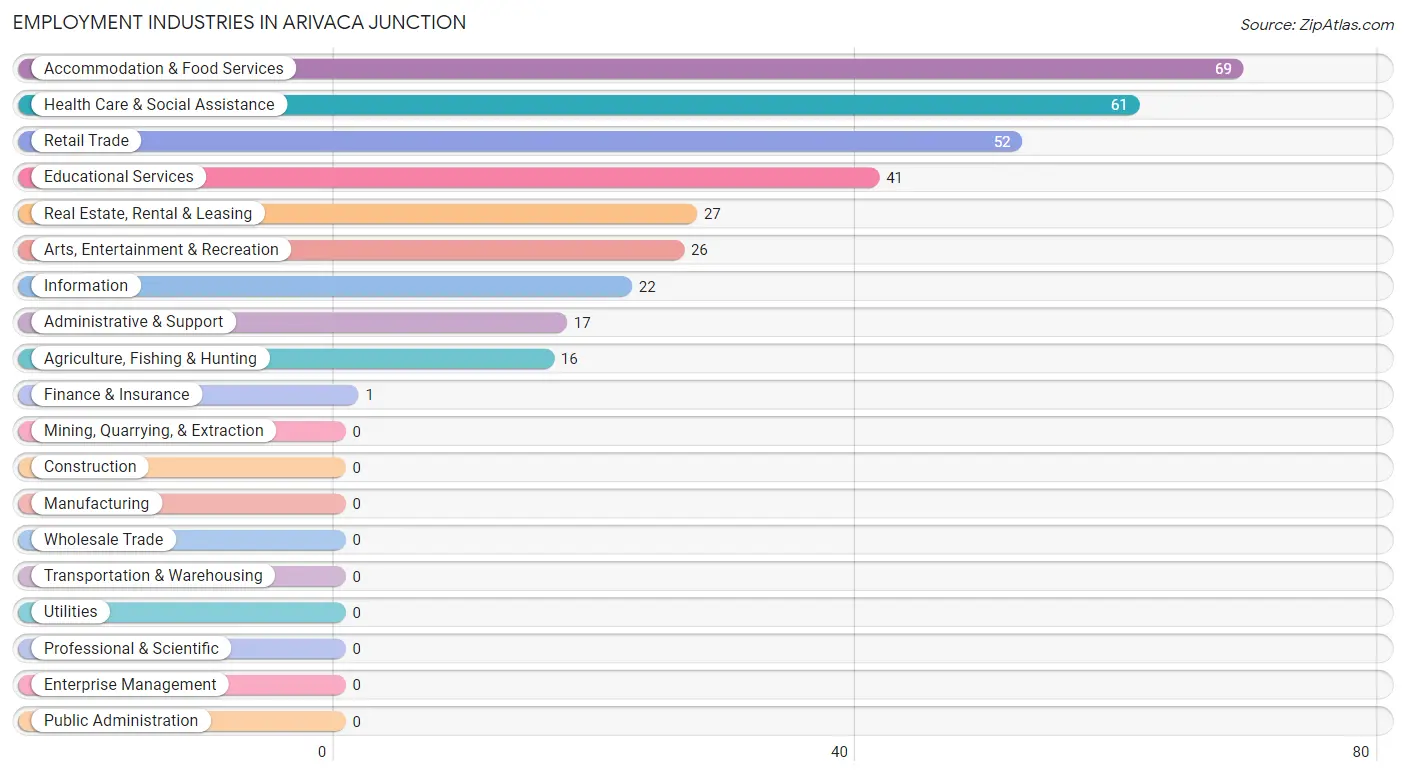
Employment Industries in Arivaca Junction
The major employment industries in Arivaca Junction include Accommodation & Food Services (69 | 20.8%), Health Care & Social Assistance (61 | 18.4%), Retail Trade (52 | 15.7%), Educational Services (41 | 12.3%), and Real Estate, Rental & Leasing (27 | 8.1%).
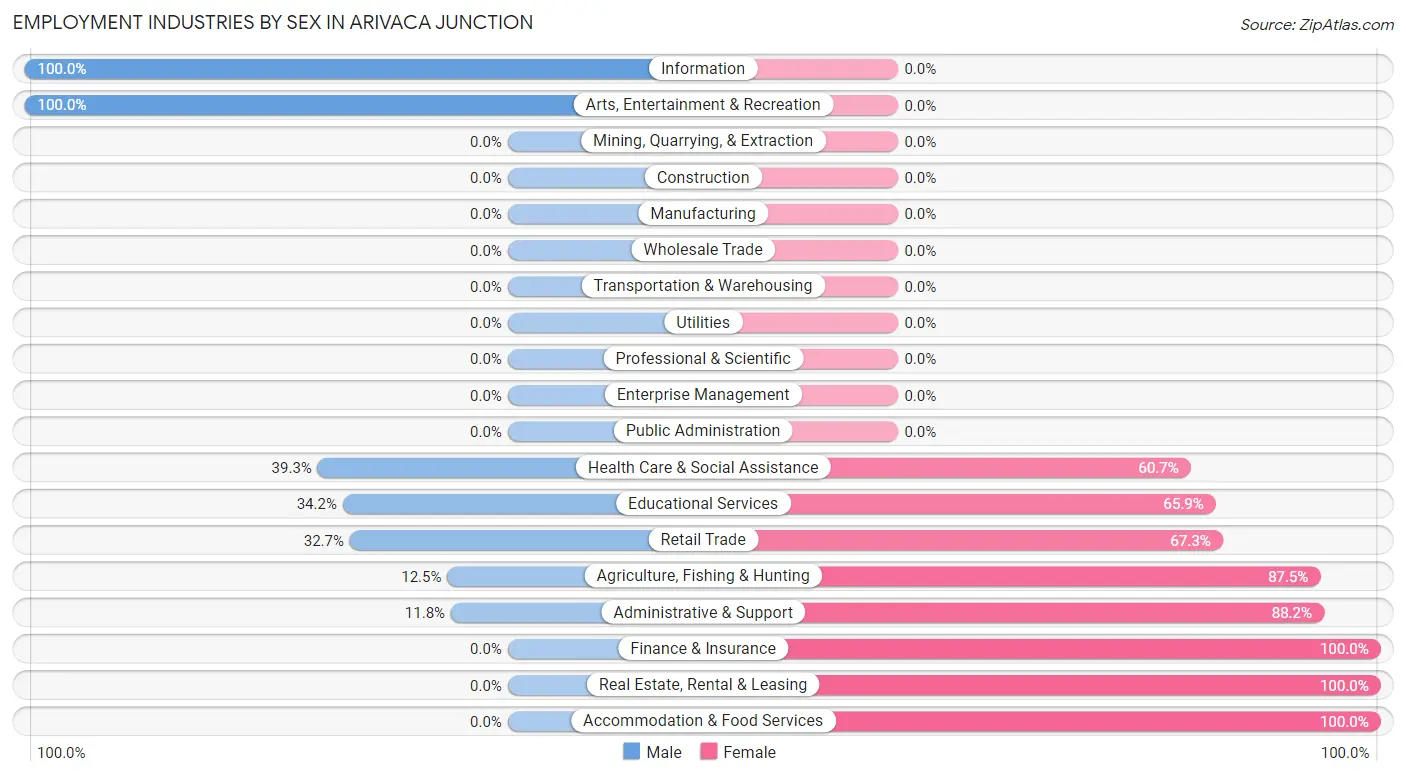
Employment Industries by Sex in Arivaca Junction
The Arivaca Junction industries that see more men than women are Information (100.0%), Arts, Entertainment & Recreation (100.0%), and Health Care & Social Assistance (39.3%), whereas the industries that tend to have a higher number of women are Finance & Insurance (100.0%), Real Estate, Rental & Leasing (100.0%), and Accommodation & Food Services (100.0%).
| Industry | Male | Female |
| Agriculture, Fishing & Hunting | 2 (12.5%) | 14 (87.5%) |
| Mining, Quarrying, & Extraction | 0 (0.0%) | 0 (0.0%) |
| Construction | 0 (0.0%) | 0 (0.0%) |
| Manufacturing | 0 (0.0%) | 0 (0.0%) |
| Wholesale Trade | 0 (0.0%) | 0 (0.0%) |
| Retail Trade | 17 (32.7%) | 35 (67.3%) |
| Transportation & Warehousing | 0 (0.0%) | 0 (0.0%) |
| Utilities | 0 (0.0%) | 0 (0.0%) |
| Information | 22 (100.0%) | 0 (0.0%) |
| Finance & Insurance | 0 (0.0%) | 1 (100.0%) |
| Real Estate, Rental & Leasing | 0 (0.0%) | 27 (100.0%) |
| Professional & Scientific | 0 (0.0%) | 0 (0.0%) |
| Enterprise Management | 0 (0.0%) | 0 (0.0%) |
| Administrative & Support | 2 (11.8%) | 15 (88.2%) |
| Educational Services | 14 (34.2%) | 27 (65.8%) |
| Health Care & Social Assistance | 24 (39.3%) | 37 (60.7%) |
| Arts, Entertainment & Recreation | 26 (100.0%) | 0 (0.0%) |
| Accommodation & Food Services | 0 (0.0%) | 69 (100.0%) |
| Public Administration | 0 (0.0%) | 0 (0.0%) |
| Total | 107 (32.2%) | 225 (67.8%) |
Education in Arivaca Junction
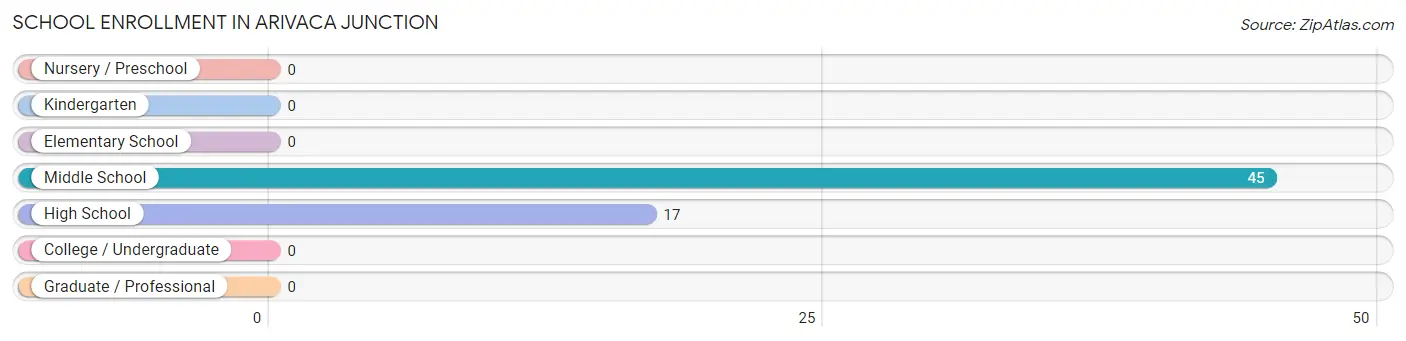
School Enrollment in Arivaca Junction
The most common levels of schooling among the 62 students in Arivaca Junction are middle school (45 | 72.6%), and high school (17 | 27.4%).
| School Level | # Students | % Students |
| Nursery / Preschool | 0 | 0.0% |
| Kindergarten | 0 | 0.0% |
| Elementary School | 0 | 0.0% |
| Middle School | 45 | 72.6% |
| High School | 17 | 27.4% |
| College / Undergraduate | 0 | 0.0% |
| Graduate / Professional | 0 | 0.0% |
| Total | 62 | 100.0% |
School Enrollment by Age by Funding Source in Arivaca Junction
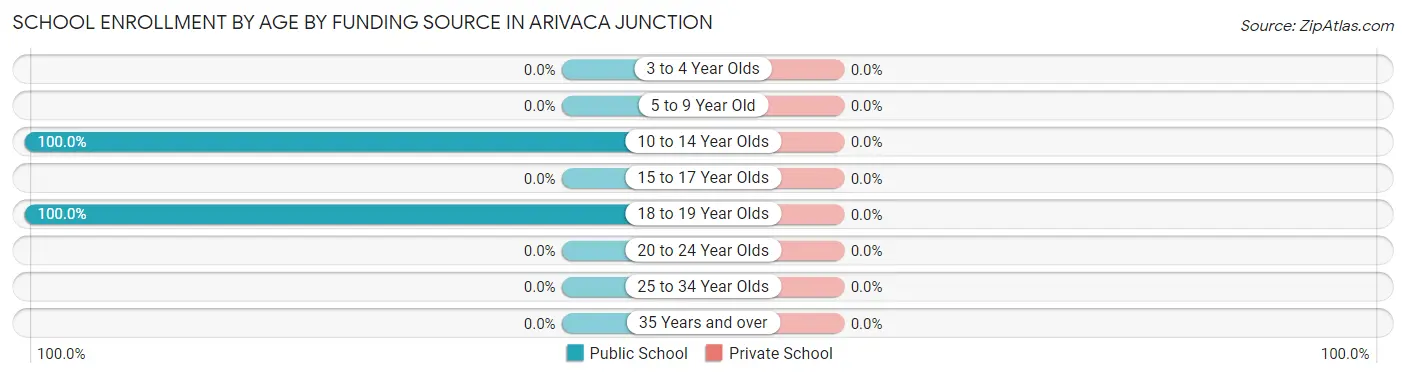
| Age Bracket | Public School | Private School |
| 3 to 4 Year Olds | 0 (0.0%) | 0 (0.0%) |
| 5 to 9 Year Old | 0 (0.0%) | 0 (0.0%) |
| 10 to 14 Year Olds | 45 (100.0%) | 0 (0.0%) |
| 15 to 17 Year Olds | 0 (0.0%) | 0 (0.0%) |
| 18 to 19 Year Olds | 17 (100.0%) | 0 (0.0%) |
| 20 to 24 Year Olds | 0 (0.0%) | 0 (0.0%) |
| 25 to 34 Year Olds | 0 (0.0%) | 0 (0.0%) |
| 35 Years and over | 0 (0.0%) | 0 (0.0%) |
| Total | 62 (100.0%) | 0 (0.0%) |
Educational Attainment by Field of Study in Arivaca Junction
Business (52 | 39.7%), social sciences (24 | 18.3%), science & technology (15 | 11.5%), education (15 | 11.5%), and bio, nature & agricultural (12 | 9.2%) are the most common fields of study among 131 individuals in Arivaca Junction who have obtained a bachelor's degree or higher.
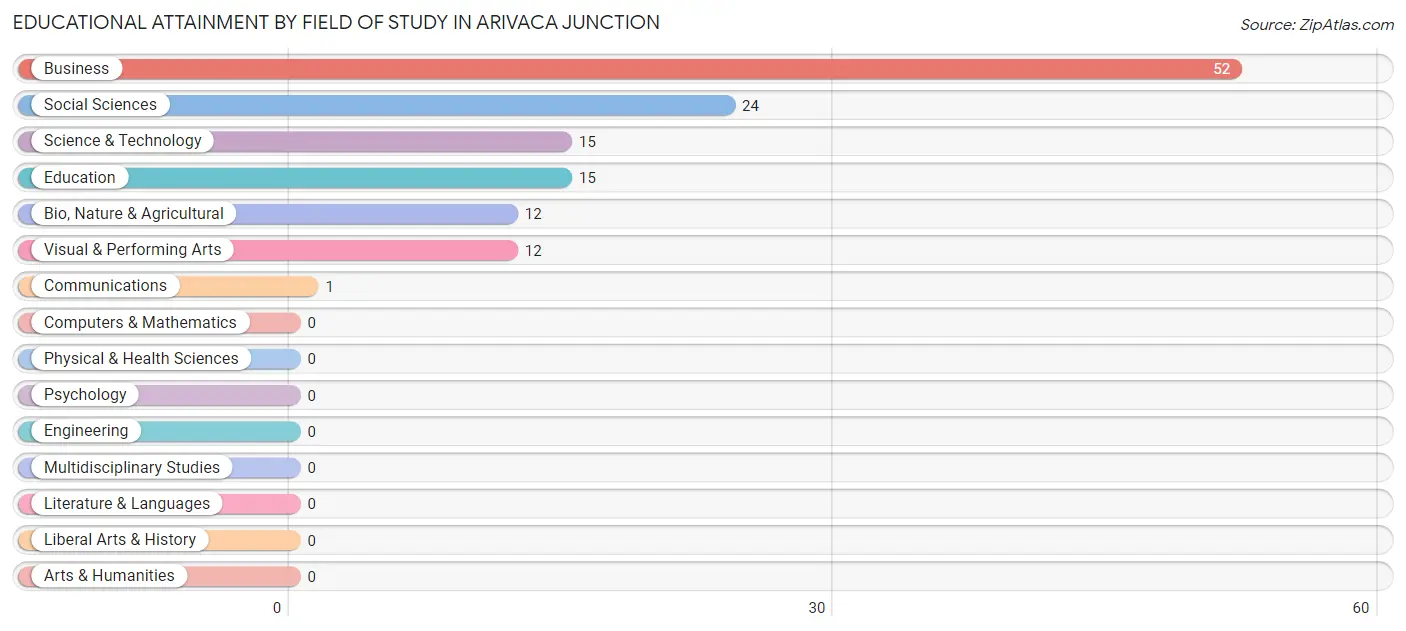
| Field of Study | # Graduates | % Graduates |
| Computers & Mathematics | 0 | 0.0% |
| Bio, Nature & Agricultural | 12 | 9.2% |
| Physical & Health Sciences | 0 | 0.0% |
| Psychology | 0 | 0.0% |
| Social Sciences | 24 | 18.3% |
| Engineering | 0 | 0.0% |
| Multidisciplinary Studies | 0 | 0.0% |
| Science & Technology | 15 | 11.5% |
| Business | 52 | 39.7% |
| Education | 15 | 11.5% |
| Literature & Languages | 0 | 0.0% |
| Liberal Arts & History | 0 | 0.0% |
| Visual & Performing Arts | 12 | 9.2% |
| Communications | 1 | 0.8% |
| Arts & Humanities | 0 | 0.0% |
| Total | 131 | 100.0% |
Transportation & Commute in Arivaca Junction
Vehicle Availability by Sex in Arivaca Junction
The most prevalent vehicle ownership categories in Arivaca Junction are males with 3 vehicles (43, accounting for 40.2%) and females with 3 vehicles (59, making up 19.1%).
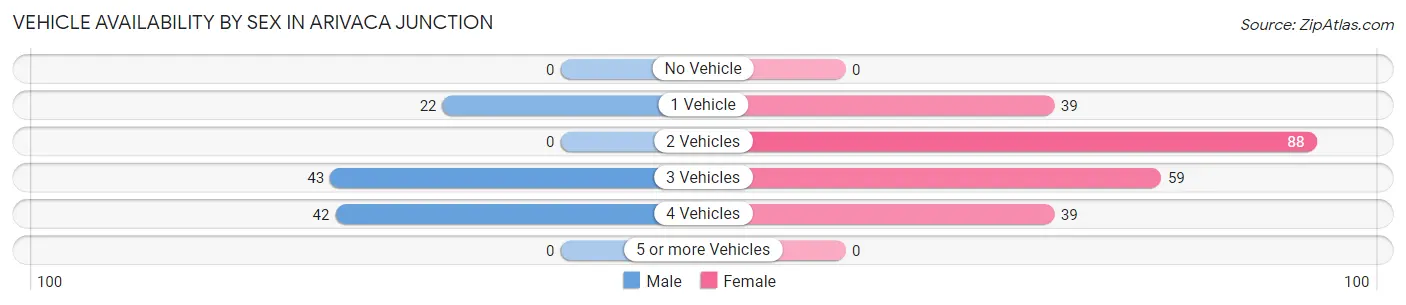
| Vehicles Available | Male | Female |
| No Vehicle | 0 (0.0%) | 0 (0.0%) |
| 1 Vehicle | 22 (20.6%) | 39 (17.3%) |
| 2 Vehicles | 0 (0.0%) | 88 (39.1%) |
| 3 Vehicles | 43 (40.2%) | 59 (26.2%) |
| 4 Vehicles | 42 (39.3%) | 39 (17.3%) |
| 5 or more Vehicles | 0 (0.0%) | 0 (0.0%) |
| Total | 107 (100.0%) | 225 (100.0%) |
Commute Time in Arivaca Junction
The most frequently occuring commute durations in Arivaca Junction are 45 to 59 minutes (91 commuters, 27.4%), 20 to 24 minutes (67 commuters, 20.2%), and 15 to 19 minutes (62 commuters, 18.7%).
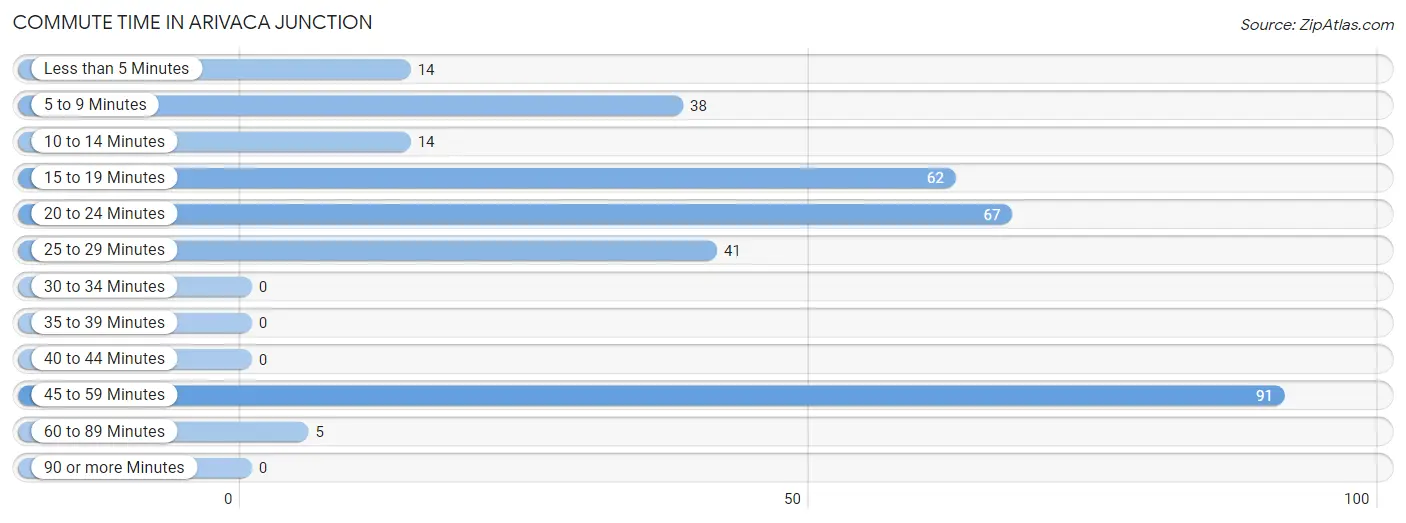
| Commute Time | # Commuters | % Commuters |
| Less than 5 Minutes | 14 | 4.2% |
| 5 to 9 Minutes | 38 | 11.5% |
| 10 to 14 Minutes | 14 | 4.2% |
| 15 to 19 Minutes | 62 | 18.7% |
| 20 to 24 Minutes | 67 | 20.2% |
| 25 to 29 Minutes | 41 | 12.3% |
| 30 to 34 Minutes | 0 | 0.0% |
| 35 to 39 Minutes | 0 | 0.0% |
| 40 to 44 Minutes | 0 | 0.0% |
| 45 to 59 Minutes | 91 | 27.4% |
| 60 to 89 Minutes | 5 | 1.5% |
| 90 or more Minutes | 0 | 0.0% |
Commute Time by Sex in Arivaca Junction
The most common commute times in Arivaca Junction are 45 to 59 minutes (63 commuters, 58.9%) for males and 15 to 19 minutes (62 commuters, 27.6%) for females.
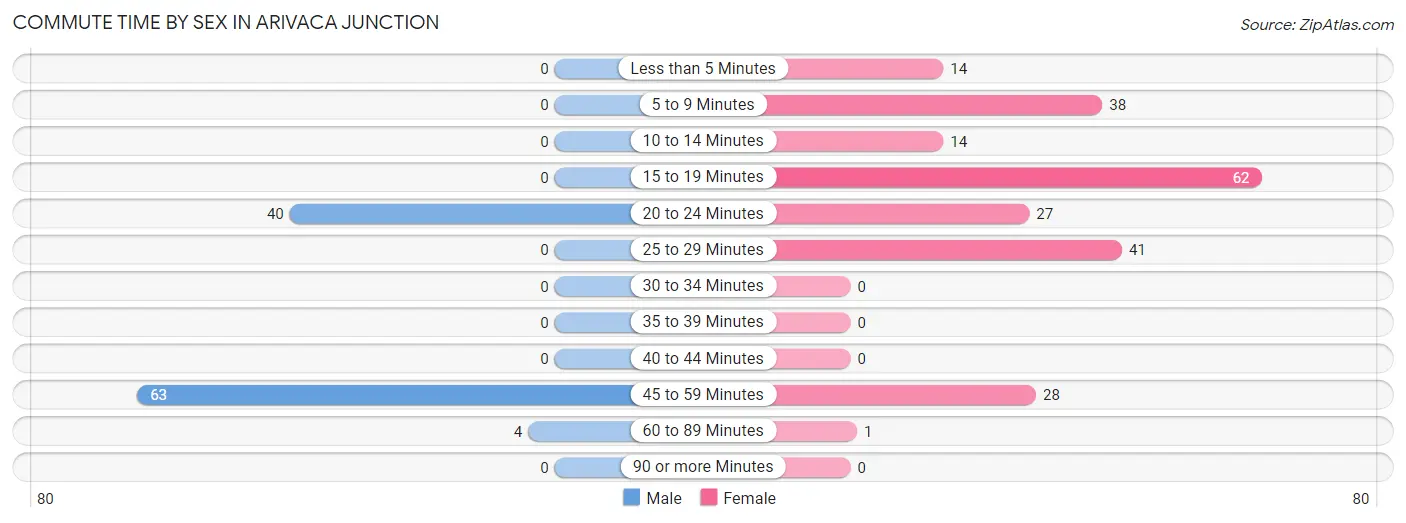
| Commute Time | Male | Female |
| Less than 5 Minutes | 0 (0.0%) | 14 (6.2%) |
| 5 to 9 Minutes | 0 (0.0%) | 38 (16.9%) |
| 10 to 14 Minutes | 0 (0.0%) | 14 (6.2%) |
| 15 to 19 Minutes | 0 (0.0%) | 62 (27.6%) |
| 20 to 24 Minutes | 40 (37.4%) | 27 (12.0%) |
| 25 to 29 Minutes | 0 (0.0%) | 41 (18.2%) |
| 30 to 34 Minutes | 0 (0.0%) | 0 (0.0%) |
| 35 to 39 Minutes | 0 (0.0%) | 0 (0.0%) |
| 40 to 44 Minutes | 0 (0.0%) | 0 (0.0%) |
| 45 to 59 Minutes | 63 (58.9%) | 28 (12.4%) |
| 60 to 89 Minutes | 4 (3.7%) | 1 (0.4%) |
| 90 or more Minutes | 0 (0.0%) | 0 (0.0%) |
Time of Departure to Work by Sex in Arivaca Junction
The most frequent times of departure to work in Arivaca Junction are 5:00 AM to 5:29 AM (38, 35.5%) for males and 5:30 AM to 5:59 AM (67, 29.8%) for females.
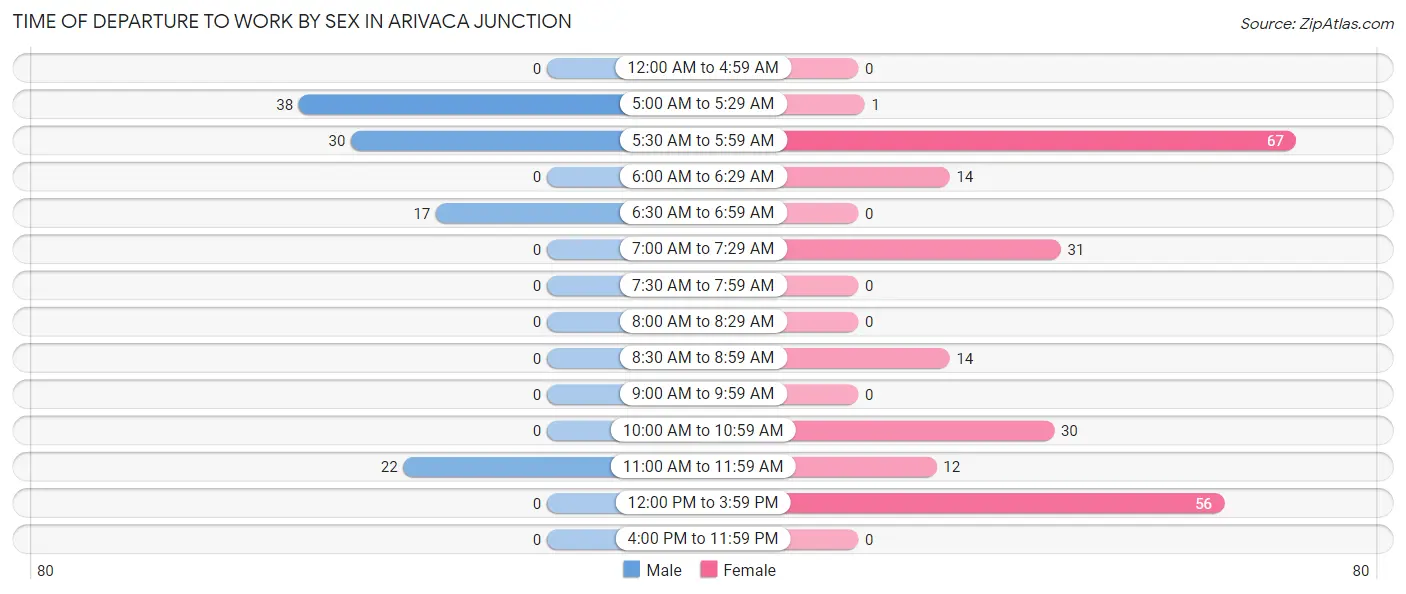
| Time of Departure | Male | Female |
| 12:00 AM to 4:59 AM | 0 (0.0%) | 0 (0.0%) |
| 5:00 AM to 5:29 AM | 38 (35.5%) | 1 (0.4%) |
| 5:30 AM to 5:59 AM | 30 (28.0%) | 67 (29.8%) |
| 6:00 AM to 6:29 AM | 0 (0.0%) | 14 (6.2%) |
| 6:30 AM to 6:59 AM | 17 (15.9%) | 0 (0.0%) |
| 7:00 AM to 7:29 AM | 0 (0.0%) | 31 (13.8%) |
| 7:30 AM to 7:59 AM | 0 (0.0%) | 0 (0.0%) |
| 8:00 AM to 8:29 AM | 0 (0.0%) | 0 (0.0%) |
| 8:30 AM to 8:59 AM | 0 (0.0%) | 14 (6.2%) |
| 9:00 AM to 9:59 AM | 0 (0.0%) | 0 (0.0%) |
| 10:00 AM to 10:59 AM | 0 (0.0%) | 30 (13.3%) |
| 11:00 AM to 11:59 AM | 22 (20.6%) | 12 (5.3%) |
| 12:00 PM to 3:59 PM | 0 (0.0%) | 56 (24.9%) |
| 4:00 PM to 11:59 PM | 0 (0.0%) | 0 (0.0%) |
| Total | 107 (100.0%) | 225 (100.0%) |
Housing Occupancy in Arivaca Junction
Occupancy by Ownership in Arivaca Junction
Of the total 252 dwellings in Arivaca Junction, owner-occupied units account for 252 (100.0%), while renter-occupied units make up 0 (0.0%).
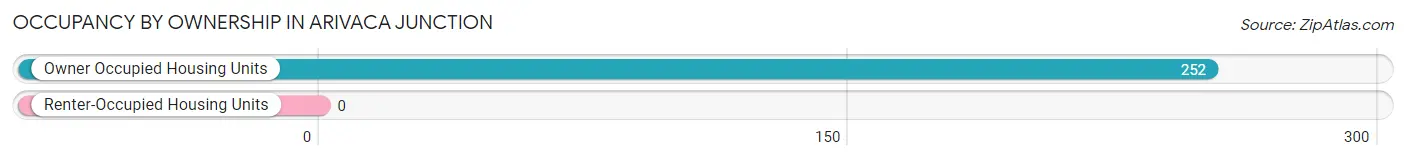
| Occupancy | # Housing Units | % Housing Units |
| Owner Occupied Housing Units | 252 | 100.0% |
| Renter-Occupied Housing Units | 0 | 0.0% |
| Total Occupied Housing Units | 252 | 100.0% |
Occupancy by Household Size in Arivaca Junction
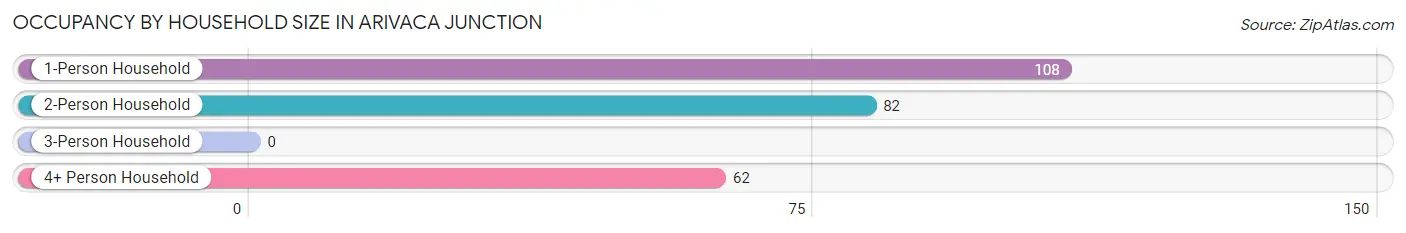
| Household Size | # Housing Units | % Housing Units |
| 1-Person Household | 108 | 42.9% |
| 2-Person Household | 82 | 32.5% |
| 3-Person Household | 0 | 0.0% |
| 4+ Person Household | 62 | 24.6% |
| Total Housing Units | 252 | 100.0% |
Occupancy by Ownership by Household Size in Arivaca Junction
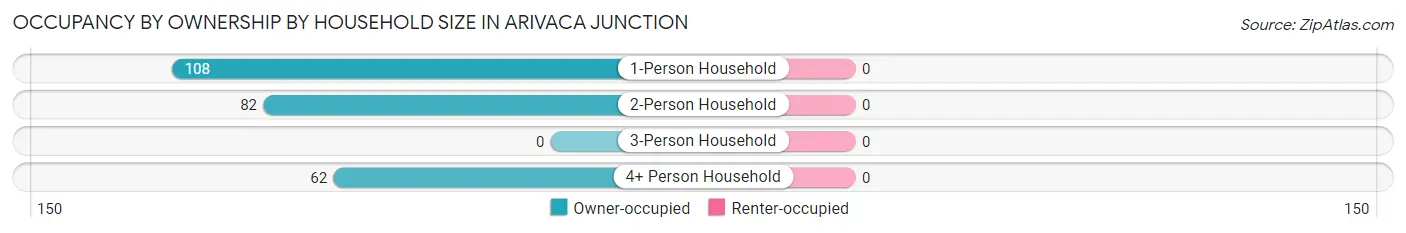
| Household Size | Owner-occupied | Renter-occupied |
| 1-Person Household | 108 (100.0%) | 0 (0.0%) |
| 2-Person Household | 82 (100.0%) | 0 (0.0%) |
| 3-Person Household | 0 (0.0%) | 0 (0.0%) |
| 4+ Person Household | 62 (100.0%) | 0 (0.0%) |
| Total Housing Units | 252 (100.0%) | 0 (0.0%) |
Occupancy by Educational Attainment in Arivaca Junction
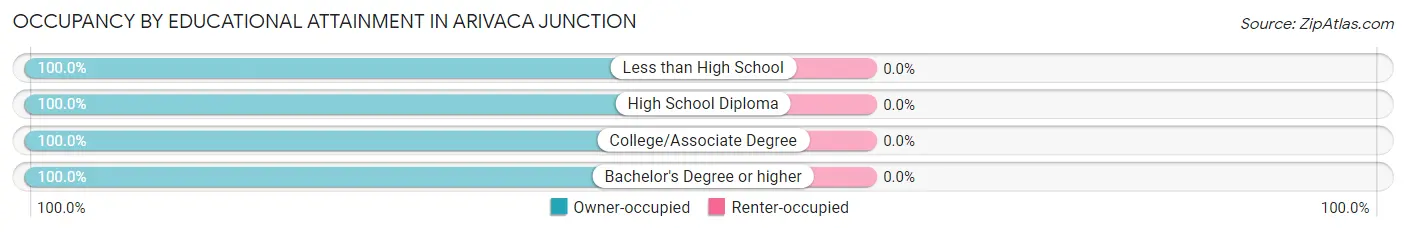
| Household Size | Owner-occupied | Renter-occupied |
| Less than High School | 101 (100.0%) | 0 (0.0%) |
| High School Diploma | 40 (100.0%) | 0 (0.0%) |
| College/Associate Degree | 22 (100.0%) | 0 (0.0%) |
| Bachelor's Degree or higher | 89 (100.0%) | 0 (0.0%) |
Occupancy by Age of Householder in Arivaca Junction
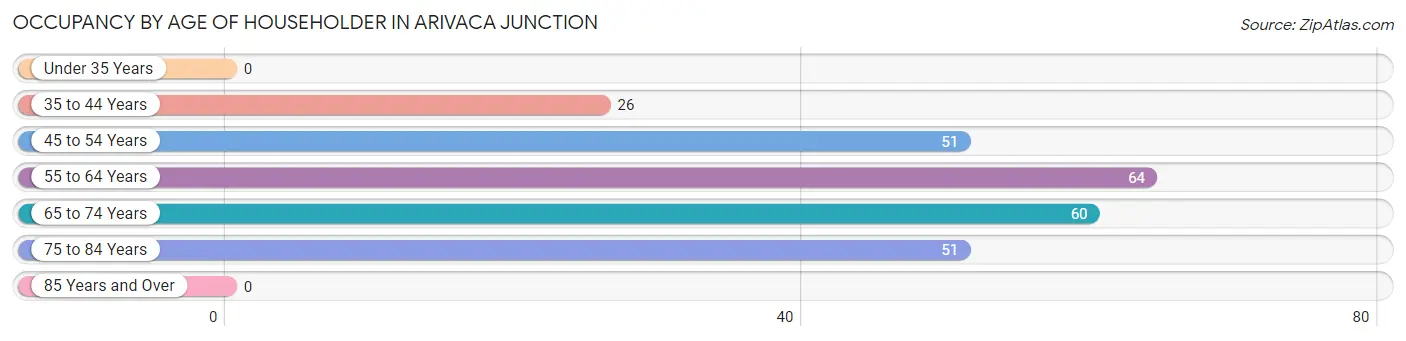
| Age Bracket | # Households | % Households |
| Under 35 Years | 0 | 0.0% |
| 35 to 44 Years | 26 | 10.3% |
| 45 to 54 Years | 51 | 20.2% |
| 55 to 64 Years | 64 | 25.4% |
| 65 to 74 Years | 60 | 23.8% |
| 75 to 84 Years | 51 | 20.2% |
| 85 Years and Over | 0 | 0.0% |
| Total | 252 | 100.0% |
Housing Finances in Arivaca Junction
Median Income by Occupancy in Arivaca Junction
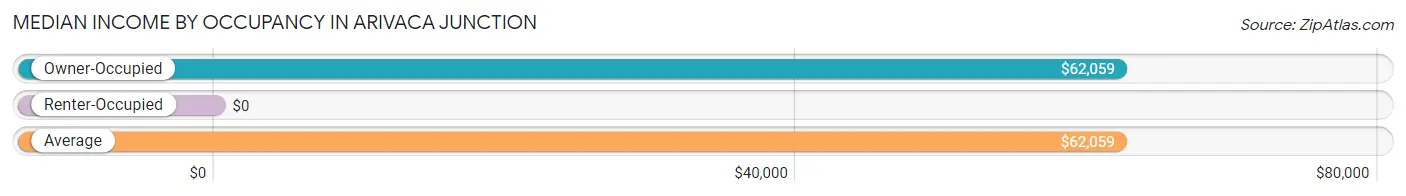
| Occupancy Type | # Households | Median Income |
| Owner-Occupied | 252 (100.0%) | $62,059 |
| Renter-Occupied | 0 (0.0%) | $0 |
| Average | 252 (100.0%) | $62,059 |
Occupancy by Householder Income Bracket in Arivaca Junction
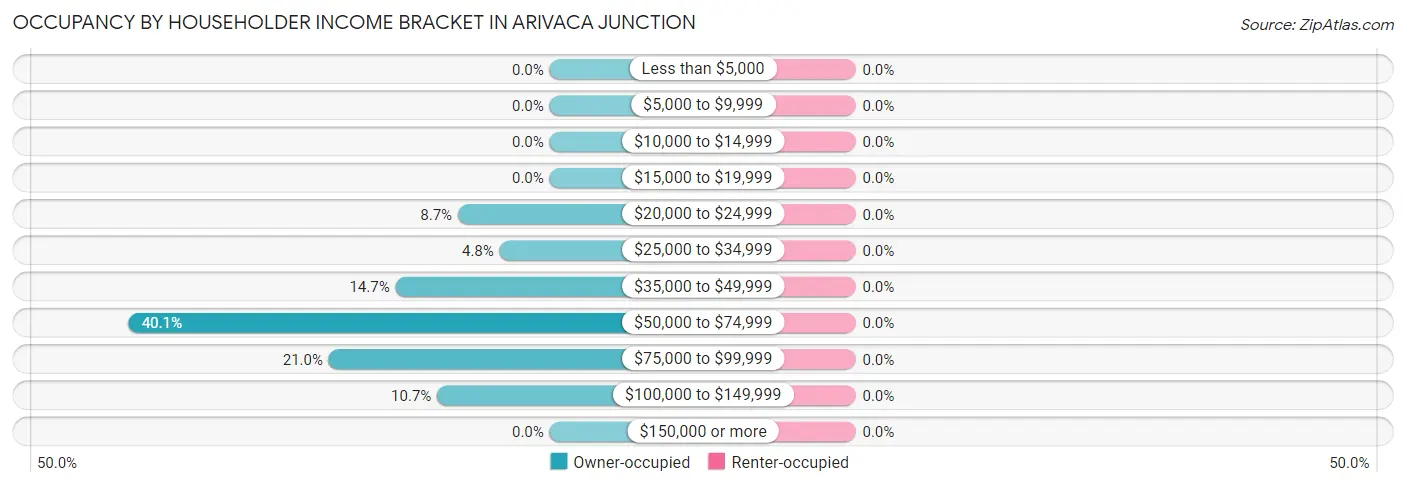
| Income Bracket | Owner-occupied | Renter-occupied |
| Less than $5,000 | 0 (0.0%) | 0 (0.0%) |
| $5,000 to $9,999 | 0 (0.0%) | 0 (0.0%) |
| $10,000 to $14,999 | 0 (0.0%) | 0 (0.0%) |
| $15,000 to $19,999 | 0 (0.0%) | 0 (0.0%) |
| $20,000 to $24,999 | 22 (8.7%) | 0 (0.0%) |
| $25,000 to $34,999 | 12 (4.8%) | 0 (0.0%) |
| $35,000 to $49,999 | 37 (14.7%) | 0 (0.0%) |
| $50,000 to $74,999 | 101 (40.1%) | 0 (0.0%) |
| $75,000 to $99,999 | 53 (21.0%) | 0 (0.0%) |
| $100,000 to $149,999 | 27 (10.7%) | 0 (0.0%) |
| $150,000 or more | 0 (0.0%) | 0 (0.0%) |
| Total | 252 (100.0%) | 0 (0.0%) |
Monthly Housing Cost Tiers in Arivaca Junction
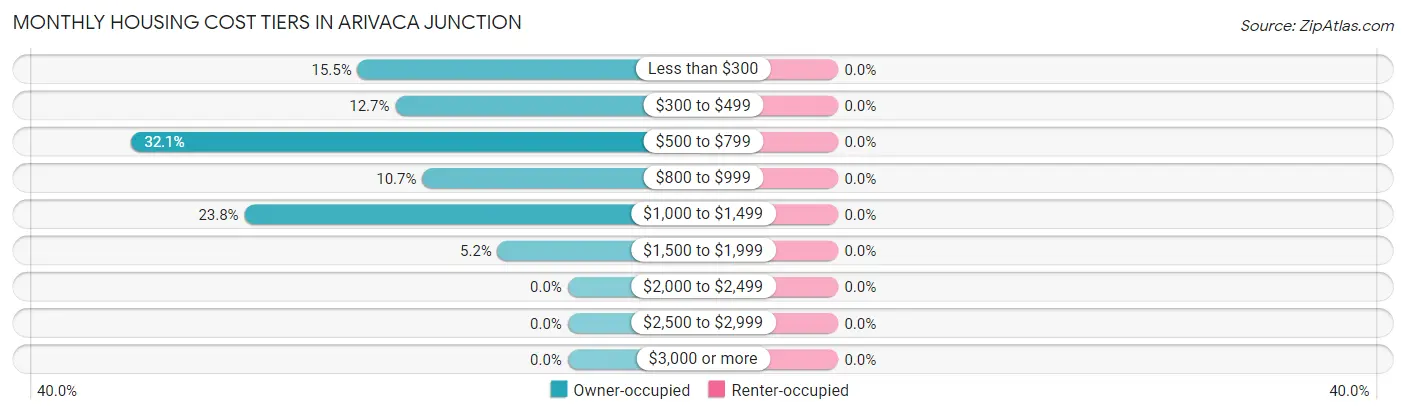
| Monthly Cost | Owner-occupied | Renter-occupied |
| Less than $300 | 39 (15.5%) | 0 (0.0%) |
| $300 to $499 | 32 (12.7%) | 0 (0.0%) |
| $500 to $799 | 81 (32.1%) | 0 (0.0%) |
| $800 to $999 | 27 (10.7%) | 0 (0.0%) |
| $1,000 to $1,499 | 60 (23.8%) | 0 (0.0%) |
| $1,500 to $1,999 | 13 (5.2%) | 0 (0.0%) |
| $2,000 to $2,499 | 0 (0.0%) | 0 (0.0%) |
| $2,500 to $2,999 | 0 (0.0%) | 0 (0.0%) |
| $3,000 or more | 0 (0.0%) | 0 (0.0%) |
| Total | 252 (100.0%) | 0 (0.0%) |
Physical Housing Characteristics in Arivaca Junction
Housing Structures in Arivaca Junction
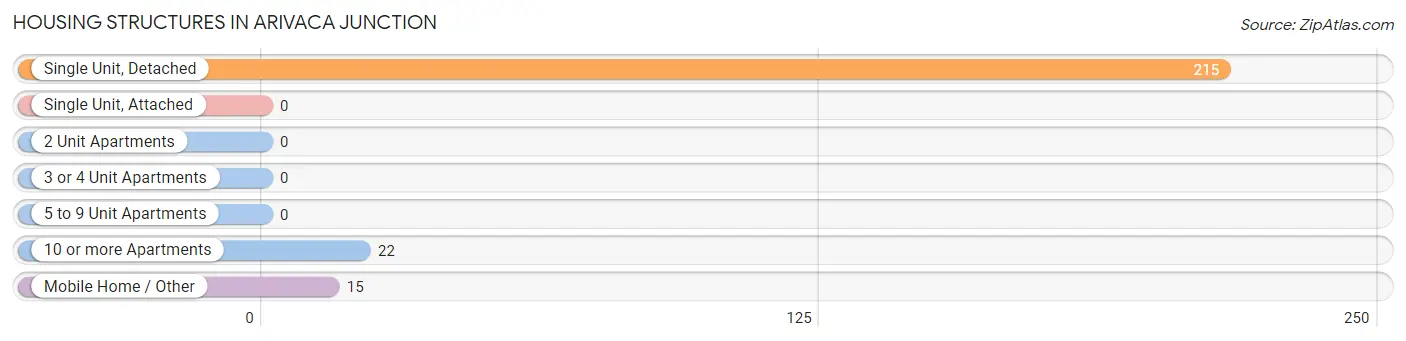
| Structure Type | # Housing Units | % Housing Units |
| Single Unit, Detached | 215 | 85.3% |
| Single Unit, Attached | 0 | 0.0% |
| 2 Unit Apartments | 0 | 0.0% |
| 3 or 4 Unit Apartments | 0 | 0.0% |
| 5 to 9 Unit Apartments | 0 | 0.0% |
| 10 or more Apartments | 22 | 8.7% |
| Mobile Home / Other | 15 | 5.9% |
| Total | 252 | 100.0% |
Housing Structures by Occupancy in Arivaca Junction
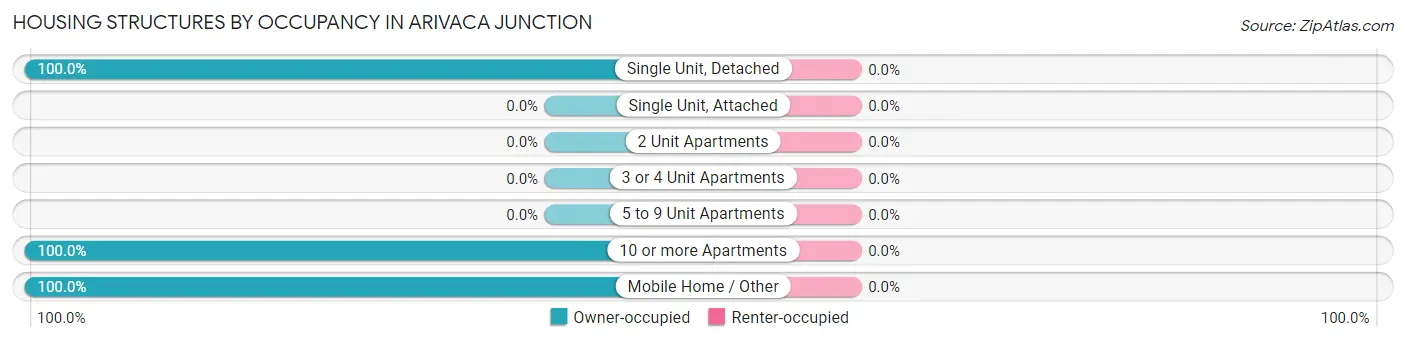
| Structure Type | Owner-occupied | Renter-occupied |
| Single Unit, Detached | 215 (100.0%) | 0 (0.0%) |
| Single Unit, Attached | 0 (0.0%) | 0 (0.0%) |
| 2 Unit Apartments | 0 (0.0%) | 0 (0.0%) |
| 3 or 4 Unit Apartments | 0 (0.0%) | 0 (0.0%) |
| 5 to 9 Unit Apartments | 0 (0.0%) | 0 (0.0%) |
| 10 or more Apartments | 22 (100.0%) | 0 (0.0%) |
| Mobile Home / Other | 15 (100.0%) | 0 (0.0%) |
| Total | 252 (100.0%) | 0 (0.0%) |
Housing Structures by Number of Rooms in Arivaca Junction
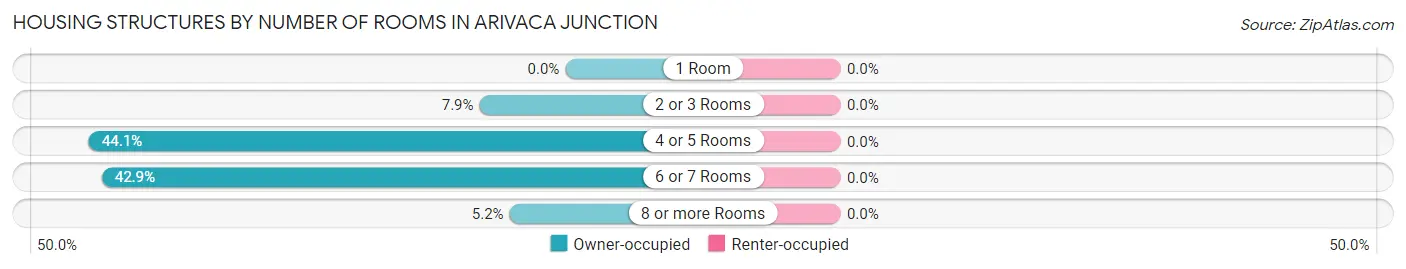
| Number of Rooms | Owner-occupied | Renter-occupied |
| 1 Room | 0 (0.0%) | 0 (0.0%) |
| 2 or 3 Rooms | 20 (7.9%) | 0 (0.0%) |
| 4 or 5 Rooms | 111 (44.1%) | 0 (0.0%) |
| 6 or 7 Rooms | 108 (42.9%) | 0 (0.0%) |
| 8 or more Rooms | 13 (5.2%) | 0 (0.0%) |
| Total | 252 (100.0%) | 0 (0.0%) |
Housing Structure by Heating Type in Arivaca Junction
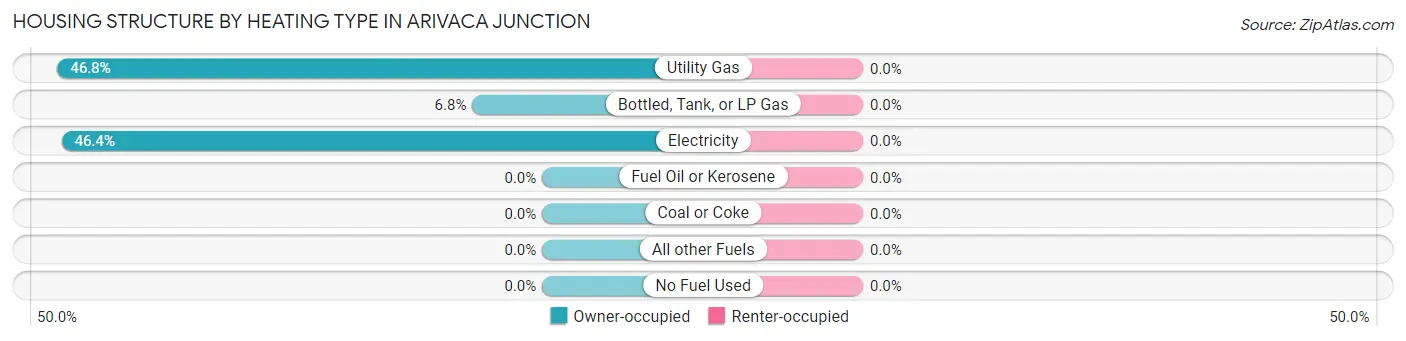
| Heating Type | Owner-occupied | Renter-occupied |
| Utility Gas | 118 (46.8%) | 0 (0.0%) |
| Bottled, Tank, or LP Gas | 17 (6.8%) | 0 (0.0%) |
| Electricity | 117 (46.4%) | 0 (0.0%) |
| Fuel Oil or Kerosene | 0 (0.0%) | 0 (0.0%) |
| Coal or Coke | 0 (0.0%) | 0 (0.0%) |
| All other Fuels | 0 (0.0%) | 0 (0.0%) |
| No Fuel Used | 0 (0.0%) | 0 (0.0%) |
| Total | 252 (100.0%) | 0 (0.0%) |
Household Vehicle Usage in Arivaca Junction
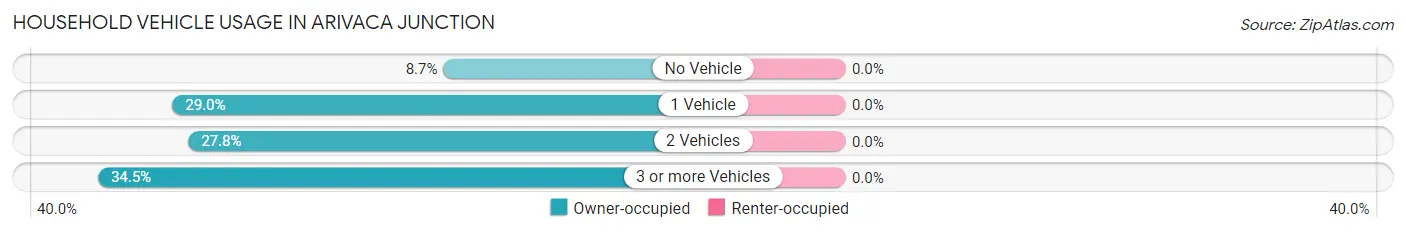
| Vehicles per Household | Owner-occupied | Renter-occupied |
| No Vehicle | 22 (8.7%) | 0 (0.0%) |
| 1 Vehicle | 73 (29.0%) | 0 (0.0%) |
| 2 Vehicles | 70 (27.8%) | 0 (0.0%) |
| 3 or more Vehicles | 87 (34.5%) | 0 (0.0%) |
| Total | 252 (100.0%) | 0 (0.0%) |
Real Estate & Mortgages in Arivaca Junction
Real Estate and Mortgage Overview in Arivaca Junction
| Characteristic | Without Mortgage | With Mortgage |
| Housing Units | 125 | 127 |
| Median Property Value | $144,300 | $201,900 |
| Median Household Income | - | - |
| Monthly Housing Costs | $365 | $0 |
| Real Estate Taxes | $907 | $0 |
Property Value by Mortgage Status in Arivaca Junction
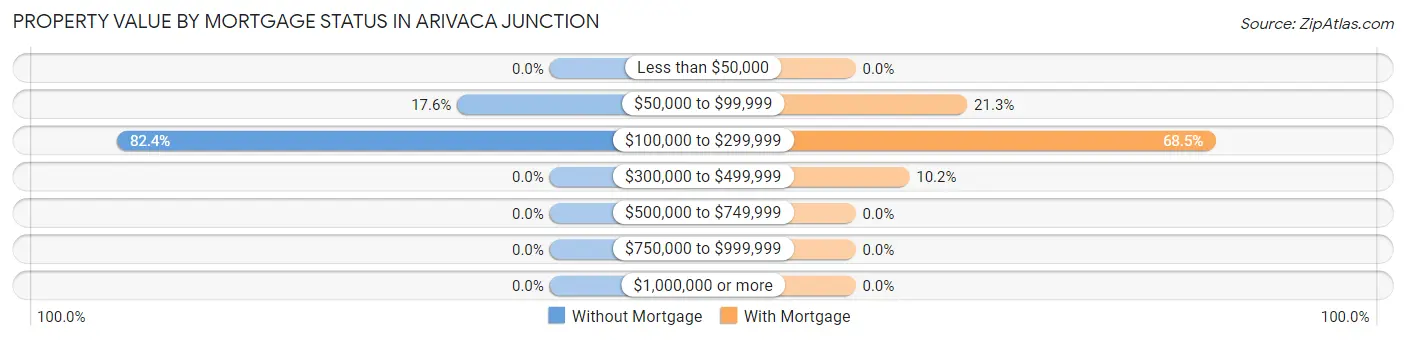
| Property Value | Without Mortgage | With Mortgage |
| Less than $50,000 | 0 (0.0%) | 0 (0.0%) |
| $50,000 to $99,999 | 22 (17.6%) | 27 (21.3%) |
| $100,000 to $299,999 | 103 (82.4%) | 87 (68.5%) |
| $300,000 to $499,999 | 0 (0.0%) | 13 (10.2%) |
| $500,000 to $749,999 | 0 (0.0%) | 0 (0.0%) |
| $750,000 to $999,999 | 0 (0.0%) | 0 (0.0%) |
| $1,000,000 or more | 0 (0.0%) | 0 (0.0%) |
| Total | 125 (100.0%) | 127 (100.0%) |
Household Income by Mortgage Status in Arivaca Junction
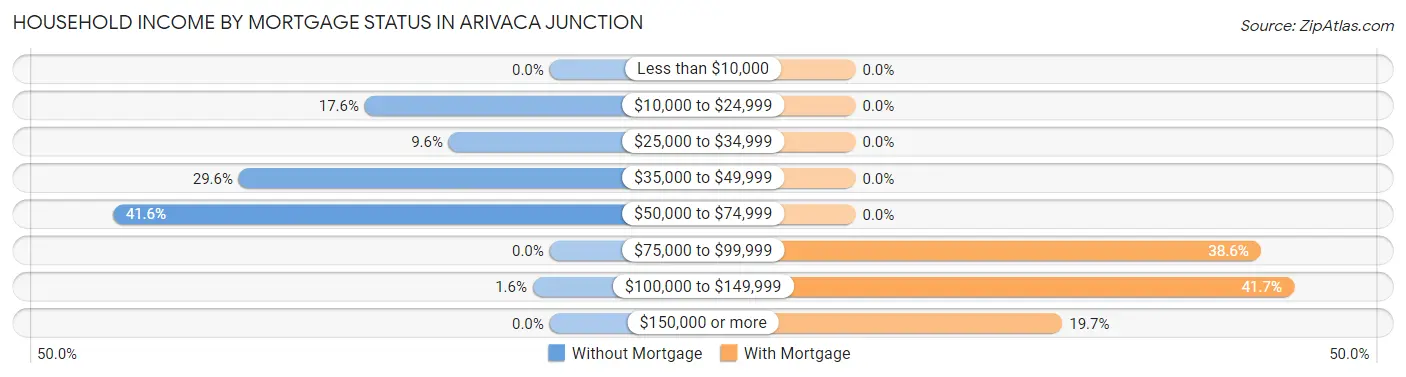
| Household Income | Without Mortgage | With Mortgage |
| Less than $10,000 | 0 (0.0%) | 0 (0.0%) |
| $10,000 to $24,999 | 22 (17.6%) | 0 (0.0%) |
| $25,000 to $34,999 | 12 (9.6%) | 0 (0.0%) |
| $35,000 to $49,999 | 37 (29.6%) | 0 (0.0%) |
| $50,000 to $74,999 | 52 (41.6%) | 0 (0.0%) |
| $75,000 to $99,999 | 0 (0.0%) | 49 (38.6%) |
| $100,000 to $149,999 | 2 (1.6%) | 53 (41.7%) |
| $150,000 or more | 0 (0.0%) | 25 (19.7%) |
| Total | 125 (100.0%) | 127 (100.0%) |
Property Value to Household Income Ratio in Arivaca Junction
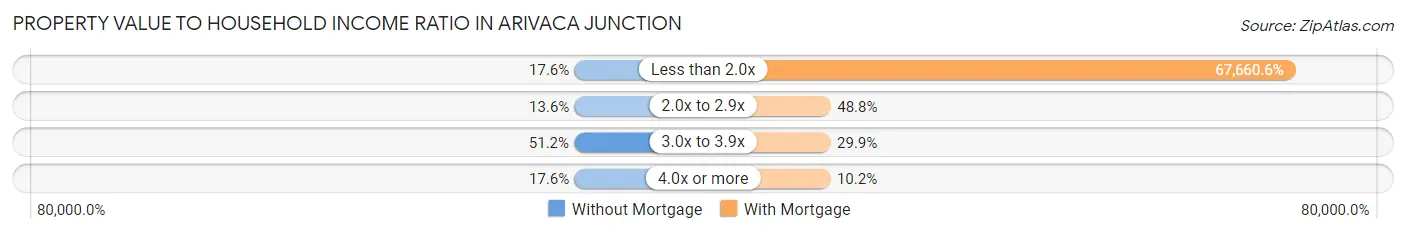
| Value-to-Income Ratio | Without Mortgage | With Mortgage |
| Less than 2.0x | 22 (17.6%) | 85,929 (67,660.6%) |
| 2.0x to 2.9x | 17 (13.6%) | 62 (48.8%) |
| 3.0x to 3.9x | 64 (51.2%) | 38 (29.9%) |
| 4.0x or more | 22 (17.6%) | 13 (10.2%) |
| Total | 125 (100.0%) | 127 (100.0%) |
Real Estate Taxes by Mortgage Status in Arivaca Junction
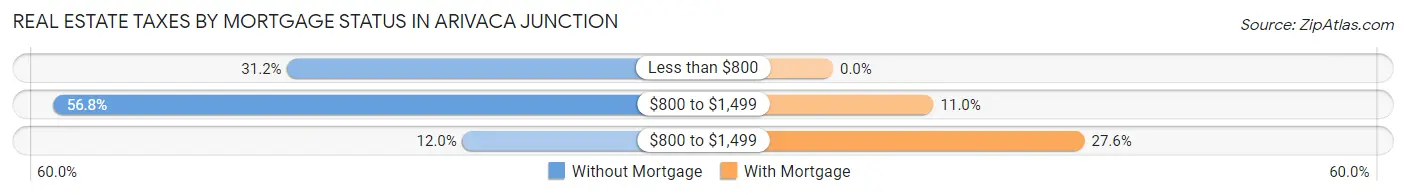
| Property Taxes | Without Mortgage | With Mortgage |
| Less than $800 | 39 (31.2%) | 0 (0.0%) |
| $800 to $1,499 | 71 (56.8%) | 14 (11.0%) |
| $800 to $1,499 | 15 (12.0%) | 35 (27.6%) |
| Total | 125 (100.0%) | 127 (100.0%) |
Health & Disability in Arivaca Junction
Health Insurance Coverage by Age in Arivaca Junction
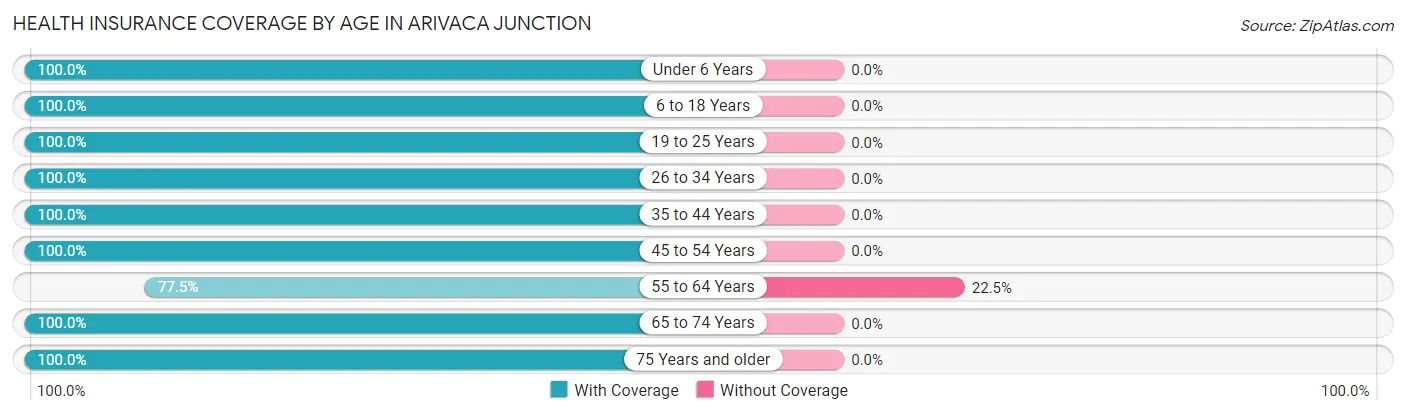
| Age Bracket | With Coverage | Without Coverage |
| Under 6 Years | 26 (100.0%) | 0 (0.0%) |
| 6 to 18 Years | 71 (100.0%) | 0 (0.0%) |
| 19 to 25 Years | 44 (100.0%) | 0 (0.0%) |
| 26 to 34 Years | 41 (100.0%) | 0 (0.0%) |
| 35 to 44 Years | 74 (100.0%) | 0 (0.0%) |
| 45 to 54 Years | 70 (100.0%) | 0 (0.0%) |
| 55 to 64 Years | 100 (77.5%) | 29 (22.5%) |
| 65 to 74 Years | 82 (100.0%) | 0 (0.0%) |
| 75 Years and older | 69 (100.0%) | 0 (0.0%) |
| Total | 577 (95.2%) | 29 (4.8%) |
Health Insurance Coverage by Citizenship Status in Arivaca Junction
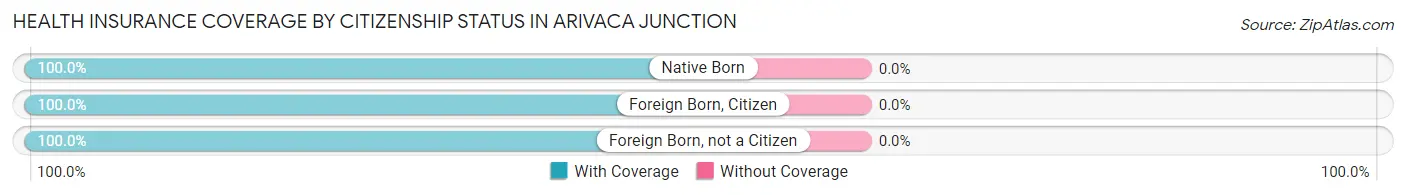
| Citizenship Status | With Coverage | Without Coverage |
| Native Born | 26 (100.0%) | 0 (0.0%) |
| Foreign Born, Citizen | 71 (100.0%) | 0 (0.0%) |
| Foreign Born, not a Citizen | 44 (100.0%) | 0 (0.0%) |
Health Insurance Coverage by Household Income in Arivaca Junction
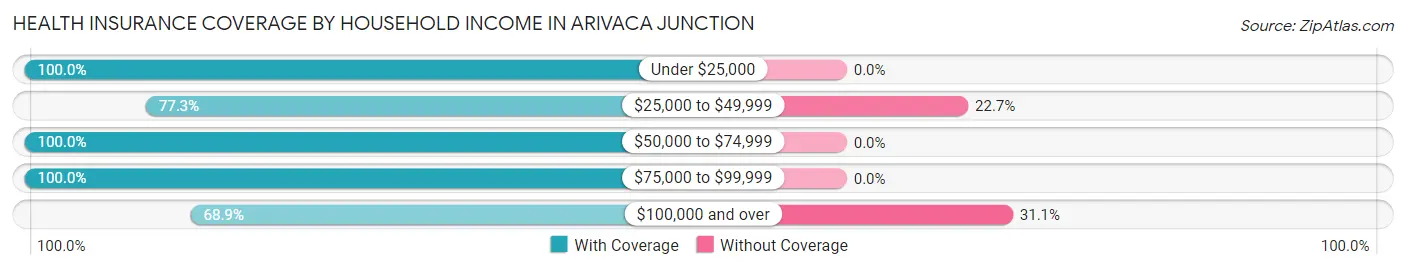
| Household Income | With Coverage | Without Coverage |
| Under $25,000 | 22 (100.0%) | 0 (0.0%) |
| $25,000 to $49,999 | 51 (77.3%) | 15 (22.7%) |
| $50,000 to $74,999 | 230 (100.0%) | 0 (0.0%) |
| $75,000 to $99,999 | 243 (100.0%) | 0 (0.0%) |
| $100,000 and over | 31 (68.9%) | 14 (31.1%) |
Public vs Private Health Insurance Coverage by Age in Arivaca Junction
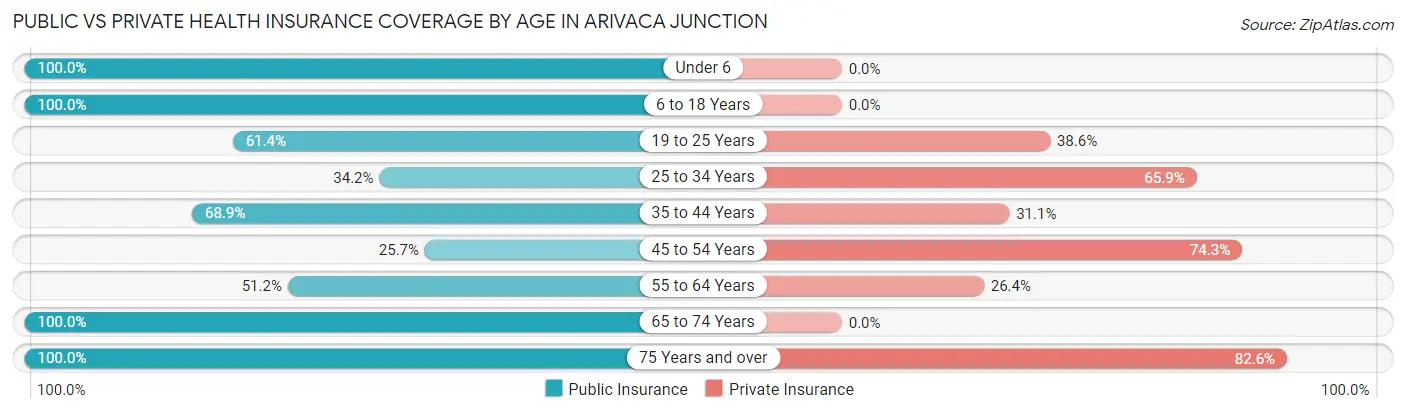
| Age Bracket | Public Insurance | Private Insurance |
| Under 6 | 26 (100.0%) | 0 (0.0%) |
| 6 to 18 Years | 71 (100.0%) | 0 (0.0%) |
| 19 to 25 Years | 27 (61.4%) | 17 (38.6%) |
| 25 to 34 Years | 14 (34.2%) | 27 (65.8%) |
| 35 to 44 Years | 51 (68.9%) | 23 (31.1%) |
| 45 to 54 Years | 18 (25.7%) | 52 (74.3%) |
| 55 to 64 Years | 66 (51.2%) | 34 (26.4%) |
| 65 to 74 Years | 82 (100.0%) | 0 (0.0%) |
| 75 Years and over | 69 (100.0%) | 57 (82.6%) |
| Total | 424 (70.0%) | 210 (34.6%) |
Disability Status by Sex by Age in Arivaca Junction
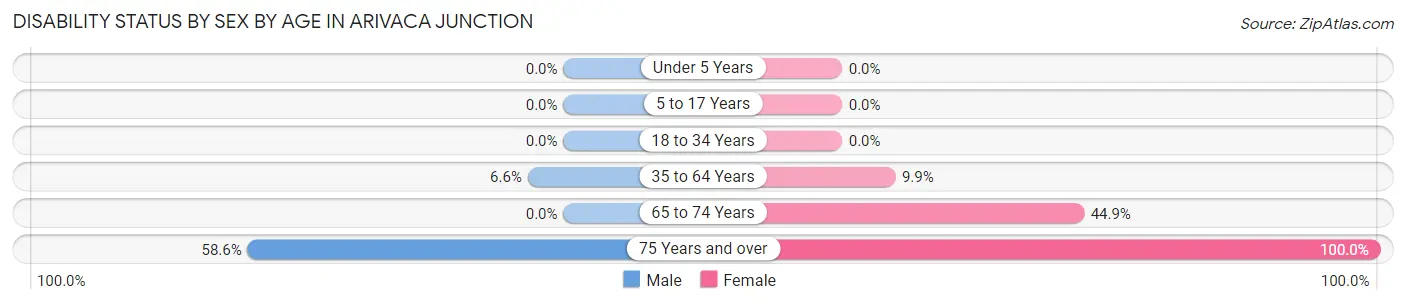
| Age Bracket | Male | Female |
| Under 5 Years | 0 (0.0%) | 0 (0.0%) |
| 5 to 17 Years | 0 (0.0%) | 0 (0.0%) |
| 18 to 34 Years | 0 (0.0%) | 0 (0.0%) |
| 35 to 64 Years | 8 (6.6%) | 15 (9.9%) |
| 65 to 74 Years | 0 (0.0%) | 22 (44.9%) |
| 75 Years and over | 17 (58.6%) | 40 (100.0%) |
Disability Class by Sex by Age in Arivaca Junction
Disability Class: Hearing Difficulty
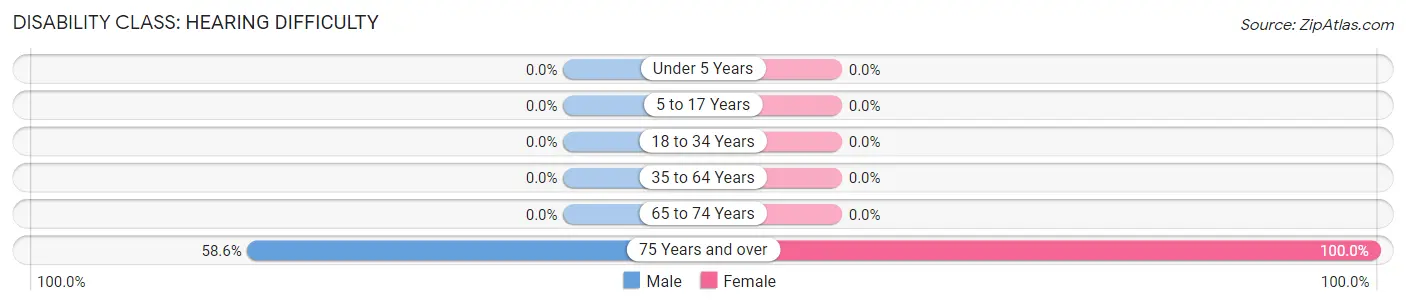
| Age Bracket | Male | Female |
| Under 5 Years | 0 (0.0%) | 0 (0.0%) |
| 5 to 17 Years | 0 (0.0%) | 0 (0.0%) |
| 18 to 34 Years | 0 (0.0%) | 0 (0.0%) |
| 35 to 64 Years | 0 (0.0%) | 0 (0.0%) |
| 65 to 74 Years | 0 (0.0%) | 0 (0.0%) |
| 75 Years and over | 17 (58.6%) | 40 (100.0%) |
Disability Class: Vision Difficulty
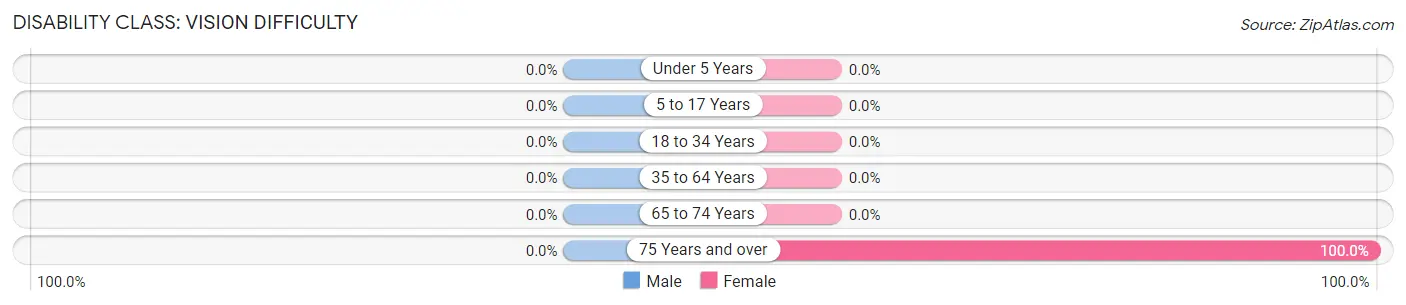
| Age Bracket | Male | Female |
| Under 5 Years | 0 (0.0%) | 0 (0.0%) |
| 5 to 17 Years | 0 (0.0%) | 0 (0.0%) |
| 18 to 34 Years | 0 (0.0%) | 0 (0.0%) |
| 35 to 64 Years | 0 (0.0%) | 0 (0.0%) |
| 65 to 74 Years | 0 (0.0%) | 0 (0.0%) |
| 75 Years and over | 0 (0.0%) | 40 (100.0%) |
Disability Class: Cognitive Difficulty
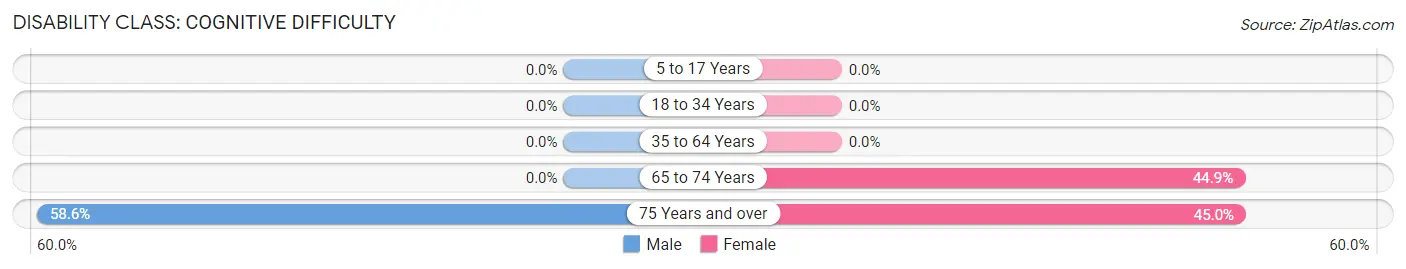
| Age Bracket | Male | Female |
| 5 to 17 Years | 0 (0.0%) | 0 (0.0%) |
| 18 to 34 Years | 0 (0.0%) | 0 (0.0%) |
| 35 to 64 Years | 0 (0.0%) | 0 (0.0%) |
| 65 to 74 Years | 0 (0.0%) | 22 (44.9%) |
| 75 Years and over | 17 (58.6%) | 18 (45.0%) |
Disability Class: Ambulatory Difficulty
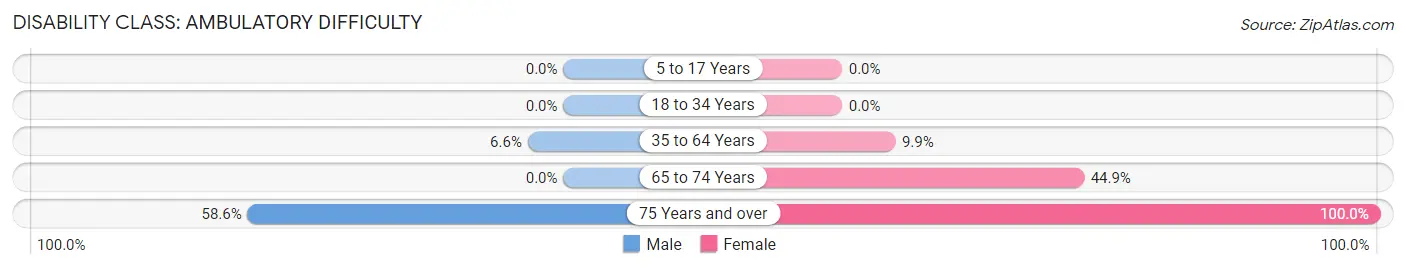
| Age Bracket | Male | Female |
| 5 to 17 Years | 0 (0.0%) | 0 (0.0%) |
| 18 to 34 Years | 0 (0.0%) | 0 (0.0%) |
| 35 to 64 Years | 8 (6.6%) | 15 (9.9%) |
| 65 to 74 Years | 0 (0.0%) | 22 (44.9%) |
| 75 Years and over | 17 (58.6%) | 40 (100.0%) |
Disability Class: Self-Care Difficulty
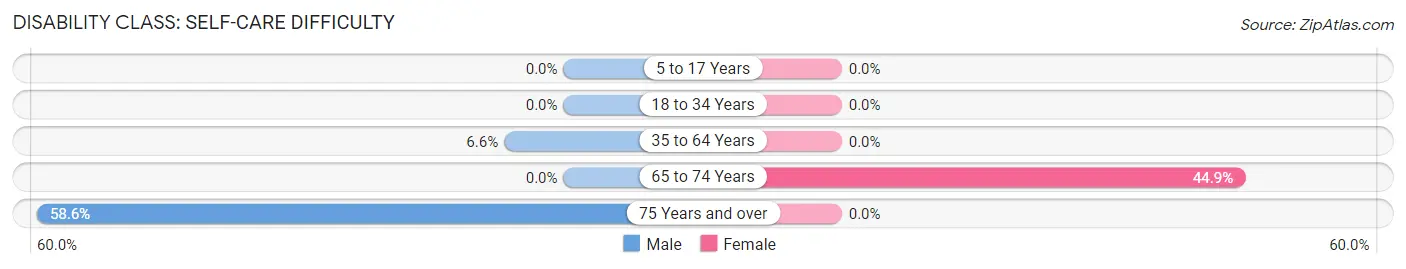
| Age Bracket | Male | Female |
| 5 to 17 Years | 0 (0.0%) | 0 (0.0%) |
| 18 to 34 Years | 0 (0.0%) | 0 (0.0%) |
| 35 to 64 Years | 8 (6.6%) | 0 (0.0%) |
| 65 to 74 Years | 0 (0.0%) | 22 (44.9%) |
| 75 Years and over | 17 (58.6%) | 0 (0.0%) |
Technology Access in Arivaca Junction
Computing Device Access in Arivaca Junction
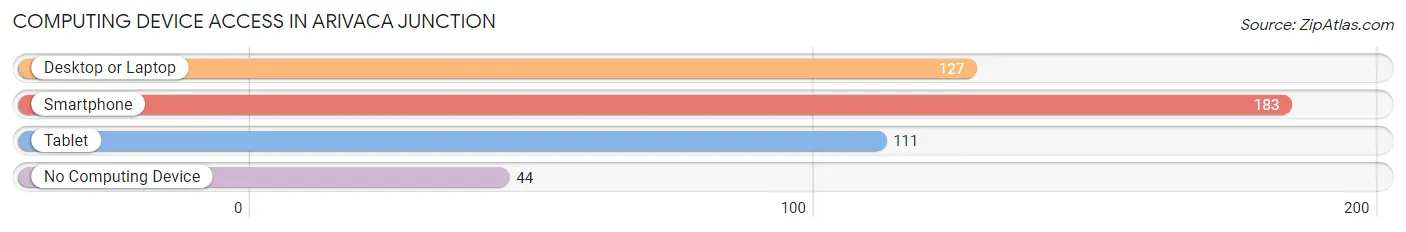
| Device Type | # Households | % Households |
| Desktop or Laptop | 127 | 50.4% |
| Smartphone | 183 | 72.6% |
| Tablet | 111 | 44.1% |
| No Computing Device | 44 | 17.5% |
| Total | 252 | 100.0% |
Internet Access in Arivaca Junction
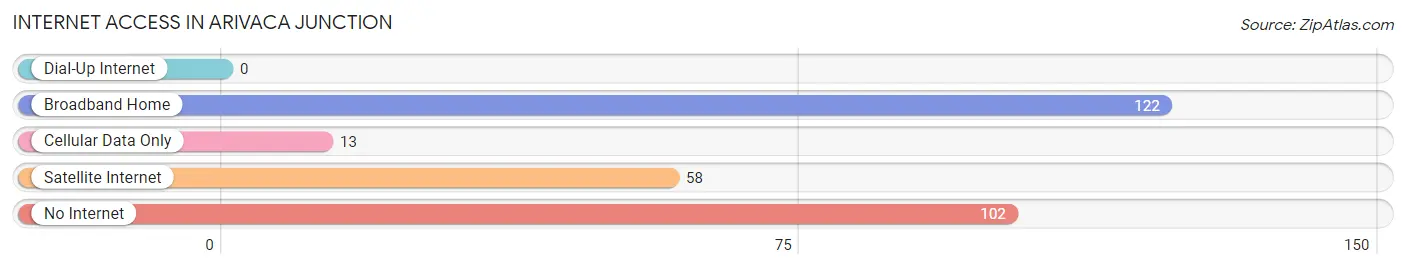
| Internet Type | # Households | % Households |
| Dial-Up Internet | 0 | 0.0% |
| Broadband Home | 122 | 48.4% |
| Cellular Data Only | 13 | 5.2% |
| Satellite Internet | 58 | 23.0% |
| No Internet | 102 | 40.5% |
| Total | 252 | 100.0% |
Arivaca Junction Summary
Arivaca Junction, Arizona is a small unincorporated community located in Pima County, Arizona, United States. It is situated in the foothills of the Santa Rita Mountains, approximately 11 miles south of the town of Amado and about 30 miles south of Tucson. The population of Arivaca Junction was estimated to be around 200 people in 2020.
History
Arivaca Junction was founded in 1881 by a group of ranchers and miners who were looking for a place to settle. The town was originally called “Arivaca”, but the name was changed to “Arivaca Junction” in 1883 when the Southern Pacific Railroad built a line through the area. The railroad brought new settlers to the area, and the town grew quickly. By the early 1900s, Arivaca Junction had become a bustling community with a post office, a school, a hotel, a general store, and several saloons.
The town’s population began to decline in the 1920s, as the railroad stopped running through the area and the mines closed. By the 1950s, the population had dwindled to just a few dozen people. In the 1970s, the town was revitalized when the Arivaca Junction Historical Society was formed. The society worked to preserve the town’s history and to promote tourism.
Geography
Arivaca Junction is located in the Sonoran Desert of southern Arizona. The town is situated in the foothills of the Santa Rita Mountains, approximately 11 miles south of the town of Amado and about 30 miles south of Tucson. The area is characterized by rolling hills, cacti, and desert vegetation. The climate is hot and dry, with temperatures ranging from the mid-90s in the summer to the mid-50s in the winter.
Economy
Arivaca Junction’s economy is largely based on tourism. The town is a popular destination for birdwatchers, hikers, and other outdoor enthusiasts. There are several bed and breakfasts in the area, as well as a few restaurants and shops. The town is also home to a small winery, which produces a variety of wines.
Demographics
As of the 2010 census, the population of Arivaca Junction was estimated to be around 200 people. The racial makeup of the town was 94.5% White, 0.5% African American, 0.5% Native American, 0.5% Asian, and 4% from other races. The median household income was $31,250, and the median age was 44.5 years.
Conclusion
Arivaca Junction is a small unincorporated community located in Pima County, Arizona. It was founded in 1881 by a group of ranchers and miners, and the town grew quickly when the Southern Pacific Railroad built a line through the area. The town’s population began to decline in the 1920s, but it was revitalized in the 1970s when the Arivaca Junction Historical Society was formed. Today, the town’s economy is largely based on tourism, and the population is estimated to be around 200 people.
Common Questions
What is Per Capita Income in Arivaca Junction?
Per Capita income in Arivaca Junction is $27,106.
What is the Median Family Income in Arivaca Junction?
Median Family Income in Arivaca Junction is $68,813.
What is the Median Household income in Arivaca Junction?
Median Household Income in Arivaca Junction is $62,059.
What is Income or Wage Gap in Arivaca Junction?
Income or Wage Gap in Arivaca Junction is 16.7%.
Women in Arivaca Junction earn 83.3 cents for every dollar earned by a man.
What is Inequality or Gini Index in Arivaca Junction?
Inequality or Gini Index in Arivaca Junction is 0.23.
What is the Total Population of Arivaca Junction?
Total Population of Arivaca Junction is 606.
What is the Total Male Population of Arivaca Junction?
Total Male Population of Arivaca Junction is 261.
What is the Total Female Population of Arivaca Junction?
Total Female Population of Arivaca Junction is 345.
What is the Ratio of Males per 100 Females in Arivaca Junction?
There are 75.65 Males per 100 Females in Arivaca Junction.
What is the Ratio of Females per 100 Males in Arivaca Junction?
There are 132.18 Females per 100 Males in Arivaca Junction.
What is the Median Population Age in Arivaca Junction?
Median Population Age in Arivaca Junction is 51.6 Years.
What is the Average Family Size in Arivaca Junction
Average Family Size in Arivaca Junction is 3.6 People.
What is the Average Household Size in Arivaca Junction
Average Household Size in Arivaca Junction is 2.4 People.
How Large is the Labor Force in Arivaca Junction?
There are 358 People in the Labor Forcein in Arivaca Junction.
What is the Percentage of People in the Labor Force in Arivaca Junction?
66.9% of People are in the Labor Force in Arivaca Junction.
What is the Unemployment Rate in Arivaca Junction?
Unemployment Rate in Arivaca Junction is 7.3%.