North Fork, AZ Map & Demographics
North Fork Map
North Fork Overview
$26,974
PER CAPITA INCOME
$82,734
AVG FAMILY INCOME
$78,942
AVG HOUSEHOLD INCOME
41.3%
WAGE / INCOME GAP [ % ]
58.7¢/ $1
WAGE / INCOME GAP [ $ ]
0.39
INEQUALITY / GINI INDEX
1,689
TOTAL POPULATION
944
MALE POPULATION
745
FEMALE POPULATION
126.71
MALES / 100 FEMALES
78.92
FEMALES / 100 MALES
42.9
MEDIAN AGE
3.5
AVG FAMILY SIZE
3.3
AVG HOUSEHOLD SIZE
778
LABOR FORCE [ PEOPLE ]
55.9%
PERCENT IN LABOR FORCE
9.9%
UNEMPLOYMENT RATE
Income in North Fork
Income Overview in North Fork
Per Capita Income in North Fork is $26,974, while median incomes of families and households are $82,734 and $78,942 respectively.
| Characteristic | Number | Measure |
| Per Capita Income | 1,689 | $26,974 |
| Median Family Income | 481 | $82,734 |
| Mean Family Income | 481 | $93,190 |
| Median Household Income | 506 | $78,942 |
| Mean Household Income | 506 | $90,494 |
| Income Deficit | 481 | $0 |
| Wage / Income Gap (%) | 1,689 | 41.35% |
| Wage / Income Gap ($) | 1,689 | 58.65¢ per $1 |
| Gini / Inequality Index | 1,689 | 0.39 |
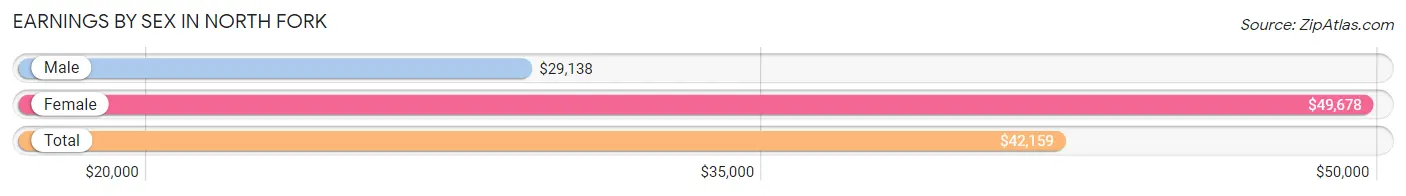
Earnings by Sex in North Fork
Average Earnings in North Fork are $42,159, $29,138 for men and $49,678 for women, a difference of 41.3%.
| Sex | Number | Average Earnings |
| Male | 426 (54.7%) | $29,138 |
| Female | 353 (45.3%) | $49,678 |
| Total | 779 (100.0%) | $42,159 |
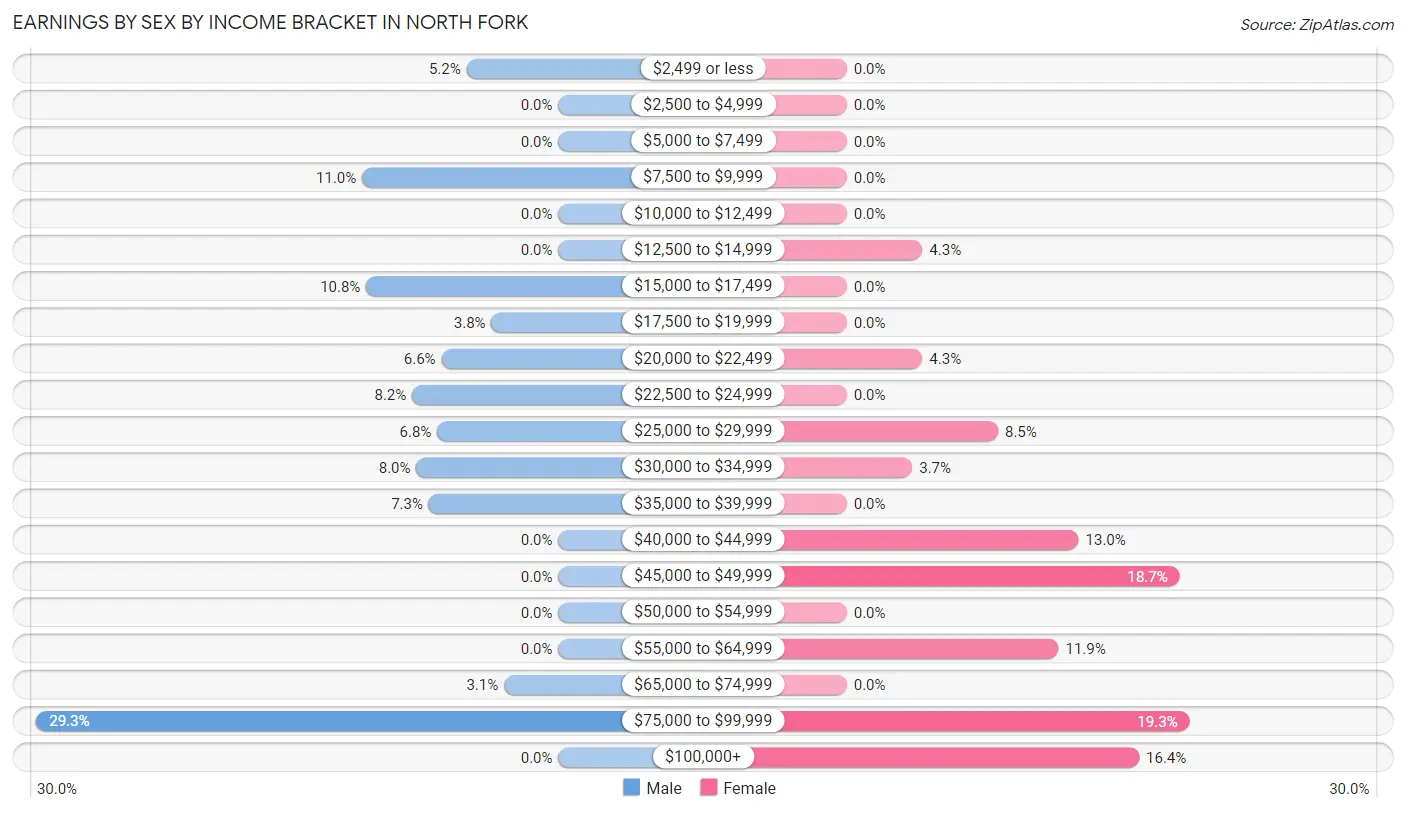
Earnings by Sex by Income Bracket in North Fork
The most common earnings brackets in North Fork are $75,000 to $99,999 for men (125 | 29.3%) and $75,000 to $99,999 for women (68 | 19.3%).
| Income | Male | Female |
| $2,499 or less | 22 (5.2%) | 0 (0.0%) |
| $2,500 to $4,999 | 0 (0.0%) | 0 (0.0%) |
| $5,000 to $7,499 | 0 (0.0%) | 0 (0.0%) |
| $7,500 to $9,999 | 47 (11.0%) | 0 (0.0%) |
| $10,000 to $12,499 | 0 (0.0%) | 0 (0.0%) |
| $12,500 to $14,999 | 0 (0.0%) | 15 (4.3%) |
| $15,000 to $17,499 | 46 (10.8%) | 0 (0.0%) |
| $17,500 to $19,999 | 16 (3.8%) | 0 (0.0%) |
| $20,000 to $22,499 | 28 (6.6%) | 15 (4.3%) |
| $22,500 to $24,999 | 35 (8.2%) | 0 (0.0%) |
| $25,000 to $29,999 | 29 (6.8%) | 30 (8.5%) |
| $30,000 to $34,999 | 34 (8.0%) | 13 (3.7%) |
| $35,000 to $39,999 | 31 (7.3%) | 0 (0.0%) |
| $40,000 to $44,999 | 0 (0.0%) | 46 (13.0%) |
| $45,000 to $49,999 | 0 (0.0%) | 66 (18.7%) |
| $50,000 to $54,999 | 0 (0.0%) | 0 (0.0%) |
| $55,000 to $64,999 | 0 (0.0%) | 42 (11.9%) |
| $65,000 to $74,999 | 13 (3.0%) | 0 (0.0%) |
| $75,000 to $99,999 | 125 (29.3%) | 68 (19.3%) |
| $100,000+ | 0 (0.0%) | 58 (16.4%) |
| Total | 426 (100.0%) | 353 (100.0%) |
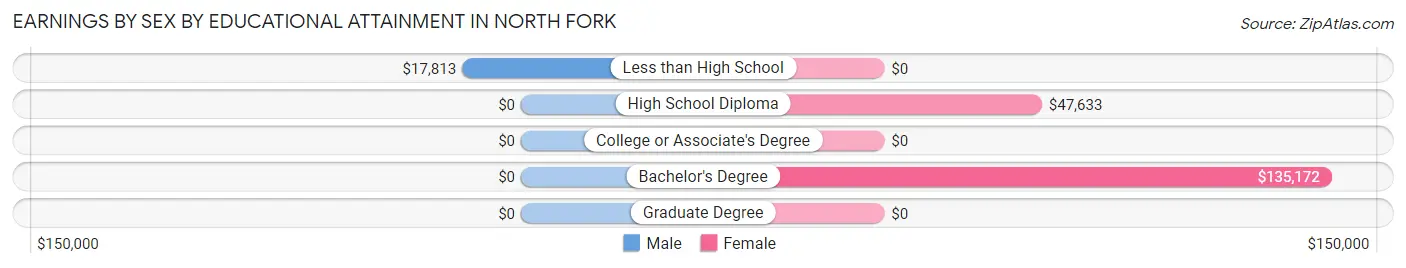
Earnings by Sex by Educational Attainment in North Fork
Average earnings in North Fork are $30,037 for men and $49,678 for women, a difference of 39.5%. Men with an educational attainment of less than high school enjoy the highest average annual earnings of $17,813, while those with less than high school education earn the least with $17,813. Women with an educational attainment of bachelor's degree earn the most with the average annual earnings of $135,172, while those with high school diploma education have the smallest earnings of $47,633.
| Educational Attainment | Male Income | Female Income |
| Less than High School | $17,813 | $0 |
| High School Diploma | - | - |
| College or Associate's Degree | - | - |
| Bachelor's Degree | - | - |
| Graduate Degree | - | - |
| Total | $30,037 | $49,678 |
Family Income in North Fork
Family Income Brackets in North Fork
According to the North Fork family income data, there are 135 families falling into the $100,000 to $149,999 income range, which is the most common income bracket and makes up 28.1% of all families. Conversely, the $25,000 to $34,999 income bracket is the least frequent group with only 14 families (2.9%) belonging to this category.
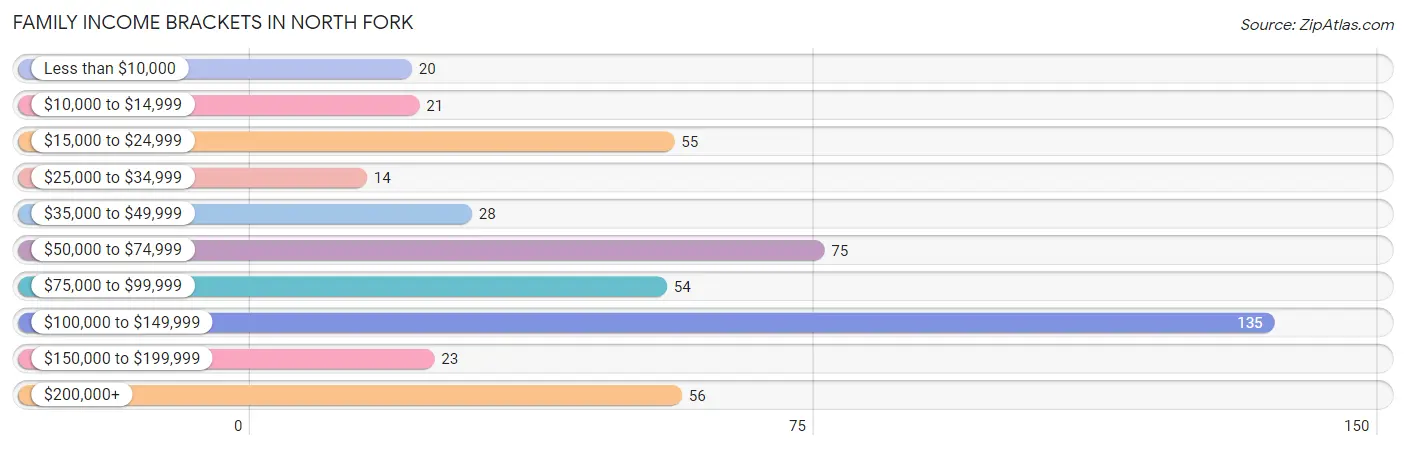
| Income Bracket | # Families | % Families |
| Less than $10,000 | 20 | 4.2% |
| $10,000 to $14,999 | 21 | 4.4% |
| $15,000 to $24,999 | 55 | 11.4% |
| $25,000 to $34,999 | 14 | 2.9% |
| $35,000 to $49,999 | 28 | 5.8% |
| $50,000 to $74,999 | 75 | 15.6% |
| $75,000 to $99,999 | 54 | 11.2% |
| $100,000 to $149,999 | 135 | 28.1% |
| $150,000 to $199,999 | 23 | 4.8% |
| $200,000+ | 56 | 11.6% |
Family Income by Famaliy Size in North Fork
3-person families (158 | 32.9%) account for the highest median family income in North Fork with $125,379 per family, while 3-person families (158 | 32.9%) have the highest median income of $41,793 per family member.
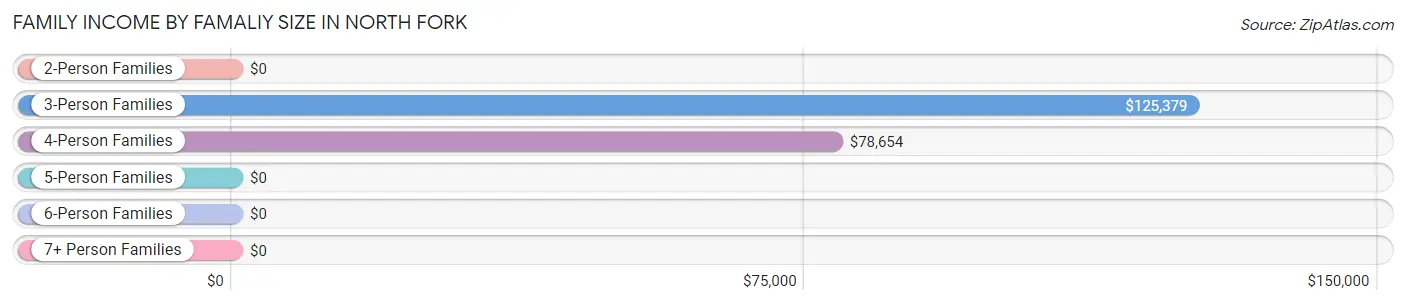
| Income Bracket | # Families | Median Income |
| 2-Person Families | 155 (32.2%) | $0 |
| 3-Person Families | 158 (32.9%) | $125,379 |
| 4-Person Families | 84 (17.5%) | $78,654 |
| 5-Person Families | 34 (7.1%) | $0 |
| 6-Person Families | 36 (7.5%) | $0 |
| 7+ Person Families | 14 (2.9%) | $0 |
| Total | 481 (100.0%) | $82,734 |
Family Income by Number of Earners in North Fork
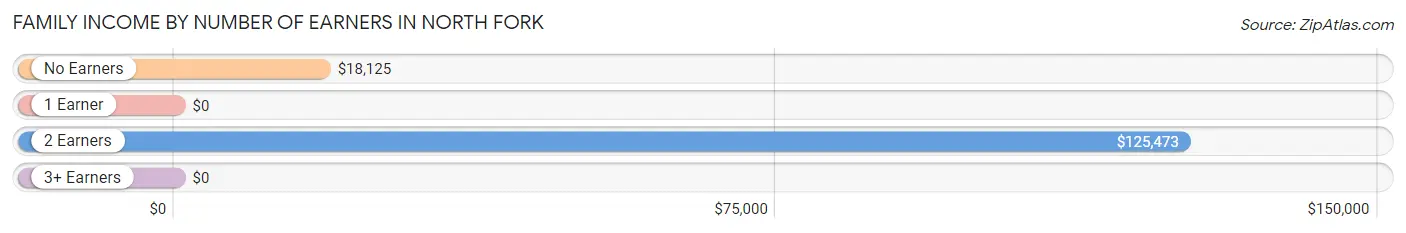
| Number of Earners | # Families | Median Income |
| No Earners | 48 (10.0%) | $18,125 |
| 1 Earner | 149 (31.0%) | $0 |
| 2 Earners | 265 (55.1%) | $125,473 |
| 3+ Earners | 19 (4.0%) | $0 |
| Total | 481 (100.0%) | $82,734 |
Household Income in North Fork
Household Income Brackets in North Fork
With 135 households falling in the category, the $100,000 to $149,999 income range is the most frequent in North Fork, accounting for 26.7% of all households. In contrast, only 14 households (2.8%) fall into the $25,000 to $34,999 income bracket, making it the least populous group.
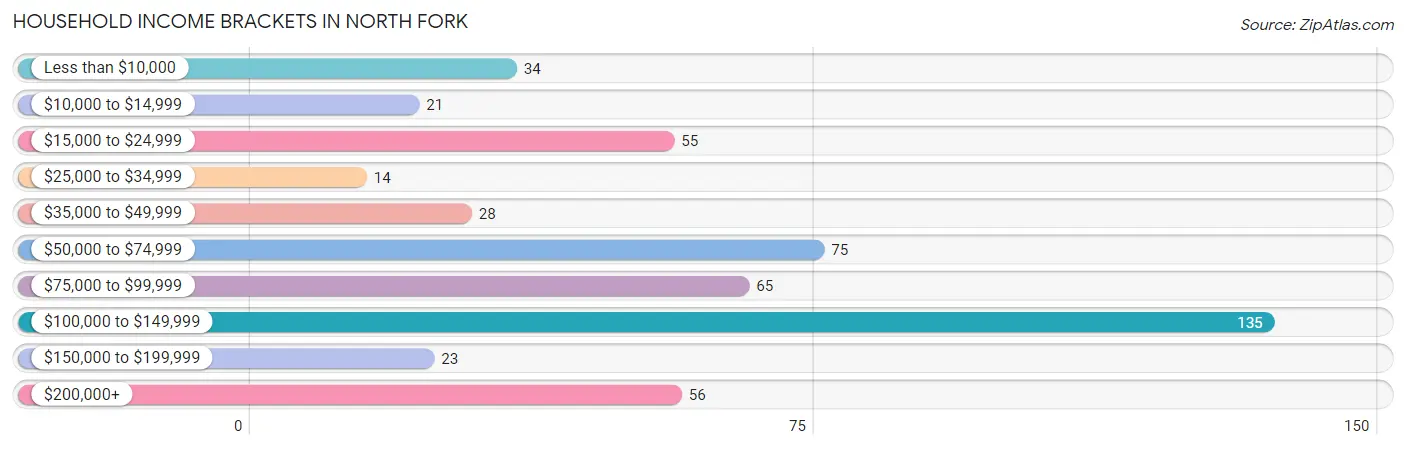
| Income Bracket | # Households | % Households |
| Less than $10,000 | 34 | 6.7% |
| $10,000 to $14,999 | 21 | 4.2% |
| $15,000 to $24,999 | 55 | 10.9% |
| $25,000 to $34,999 | 14 | 2.8% |
| $35,000 to $49,999 | 28 | 5.5% |
| $50,000 to $74,999 | 75 | 14.8% |
| $75,000 to $99,999 | 65 | 12.8% |
| $100,000 to $149,999 | 135 | 26.7% |
| $150,000 to $199,999 | 23 | 4.5% |
| $200,000+ | 56 | 11.1% |
Household Income by Householder Age in North Fork
The median household income in North Fork is $78,942, with the highest median household income of $82,734 found in the 45 to 64 years age bracket for the primary householder. A total of 299 households (59.1%) fall into this category.
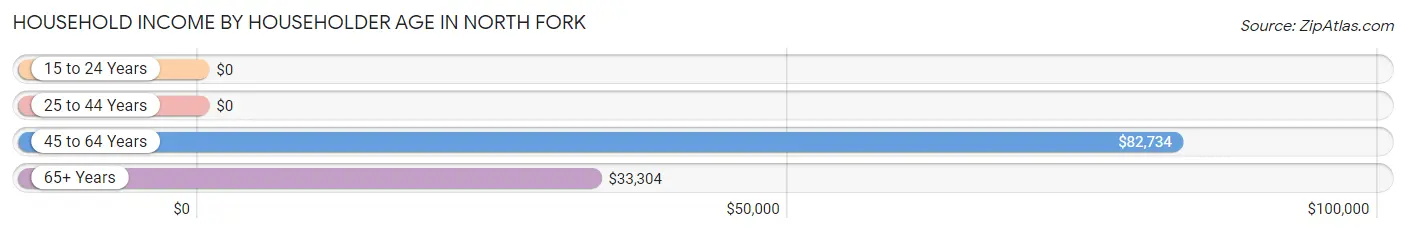
| Income Bracket | # Households | Median Income |
| 15 to 24 Years | 0 (0.0%) | $0 |
| 25 to 44 Years | 116 (22.9%) | $0 |
| 45 to 64 Years | 299 (59.1%) | $82,734 |
| 65+ Years | 91 (18.0%) | $33,304 |
| Total | 506 (100.0%) | $78,942 |
Poverty in North Fork
Income Below Poverty by Sex and Age in North Fork
With 10.2% poverty level for males and 15.3% for females among the residents of North Fork, 75 year old and over males and 45 to 54 year old females are the most vulnerable to poverty, with 12 males (50.0%) and 71 females (32.0%) in their respective age groups living below the poverty level.
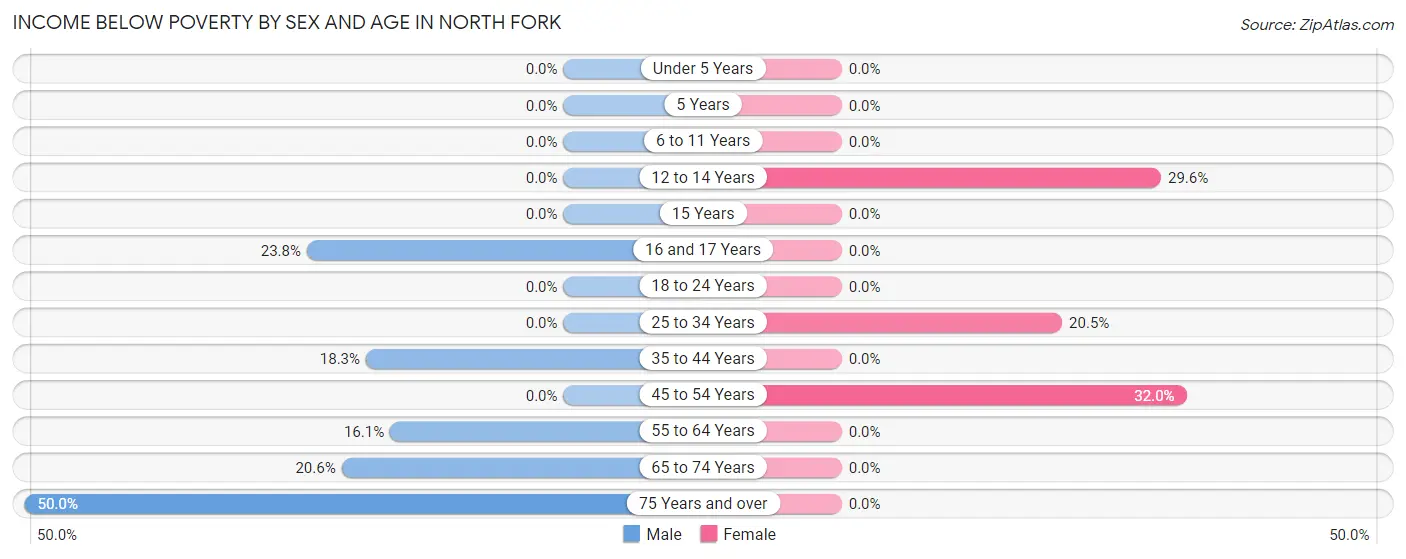
| Age Bracket | Male | Female |
| Under 5 Years | 0 (0.0%) | 0 (0.0%) |
| 5 Years | 0 (0.0%) | 0 (0.0%) |
| 6 to 11 Years | 0 (0.0%) | 0 (0.0%) |
| 12 to 14 Years | 0 (0.0%) | 16 (29.6%) |
| 15 Years | 0 (0.0%) | 0 (0.0%) |
| 16 and 17 Years | 20 (23.8%) | 0 (0.0%) |
| 18 to 24 Years | 0 (0.0%) | 0 (0.0%) |
| 25 to 34 Years | 0 (0.0%) | 27 (20.4%) |
| 35 to 44 Years | 22 (18.3%) | 0 (0.0%) |
| 45 to 54 Years | 0 (0.0%) | 71 (32.0%) |
| 55 to 64 Years | 28 (16.1%) | 0 (0.0%) |
| 65 to 74 Years | 14 (20.6%) | 0 (0.0%) |
| 75 Years and over | 12 (50.0%) | 0 (0.0%) |
| Total | 96 (10.2%) | 114 (15.3%) |
Income Above Poverty by Sex and Age in North Fork
According to the poverty statistics in North Fork, males aged under 5 years and females aged under 5 years are the age groups that are most secure financially, with 100.0% of males and 100.0% of females in these age groups living above the poverty line.
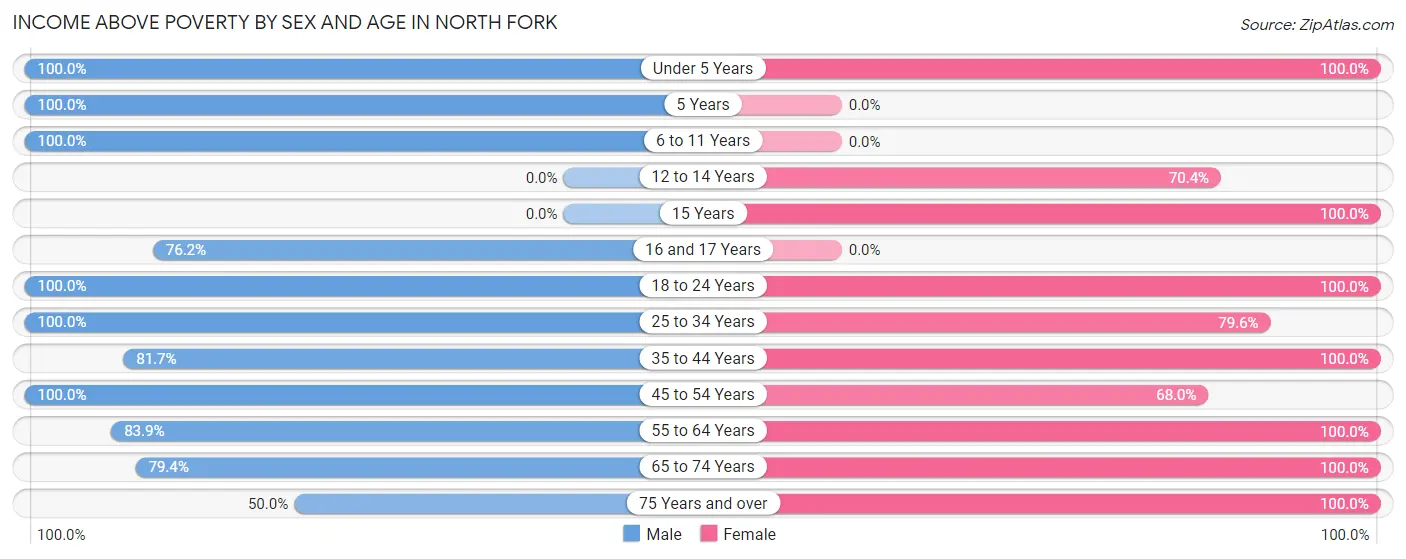
| Age Bracket | Male | Female |
| Under 5 Years | 47 (100.0%) | 16 (100.0%) |
| 5 Years | 25 (100.0%) | 0 (0.0%) |
| 6 to 11 Years | 138 (100.0%) | 0 (0.0%) |
| 12 to 14 Years | 0 (0.0%) | 38 (70.4%) |
| 15 Years | 0 (0.0%) | 18 (100.0%) |
| 16 and 17 Years | 64 (76.2%) | 0 (0.0%) |
| 18 to 24 Years | 58 (100.0%) | 65 (100.0%) |
| 25 to 34 Years | 129 (100.0%) | 105 (79.5%) |
| 35 to 44 Years | 98 (81.7%) | 41 (100.0%) |
| 45 to 54 Years | 77 (100.0%) | 151 (68.0%) |
| 55 to 64 Years | 146 (83.9%) | 132 (100.0%) |
| 65 to 74 Years | 54 (79.4%) | 50 (100.0%) |
| 75 Years and over | 12 (50.0%) | 15 (100.0%) |
| Total | 848 (89.8%) | 631 (84.7%) |
Income Below Poverty Among Married-Couple Families in North Fork
The poverty statistics for married-couple families in North Fork show that 12.3% or 48 of the total 389 families live below the poverty line. Families with no children have the highest poverty rate of 25.3%, comprising of 48 families. On the other hand, families with 1 or 2 children have the lowest poverty rate of 0.0%, which includes 0 families.
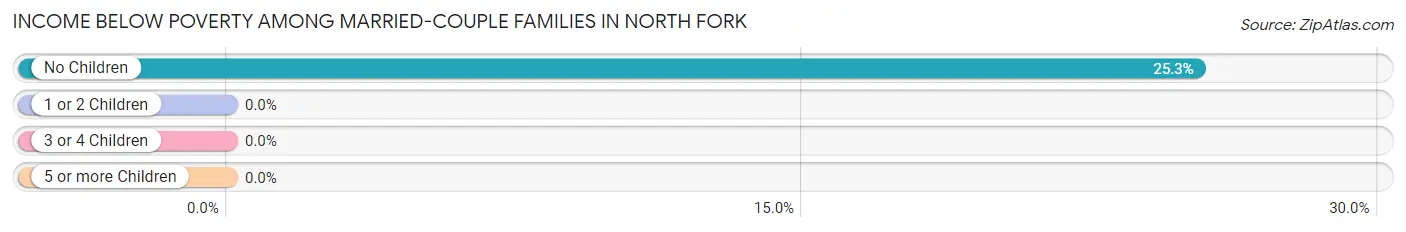
| Children | Above Poverty | Below Poverty |
| No Children | 142 (74.7%) | 48 (25.3%) |
| 1 or 2 Children | 199 (100.0%) | 0 (0.0%) |
| 3 or 4 Children | 0 (0.0%) | 0 (0.0%) |
| 5 or more Children | 0 (0.0%) | 0 (0.0%) |
| Total | 341 (87.7%) | 48 (12.3%) |
Income Below Poverty Among Single-Parent Households in North Fork
According to the poverty data in North Fork, 100.0% or 12 single-father households and 26.3% or 21 single-mother households are living below the poverty line. Among single-father households, those with 1 or 2 children have the highest poverty rate, with 12 households (100.0%) experiencing poverty. Likewise, among single-mother households, those with 1 or 2 children have the highest poverty rate, with 21 households (40.4%) falling below the poverty line.
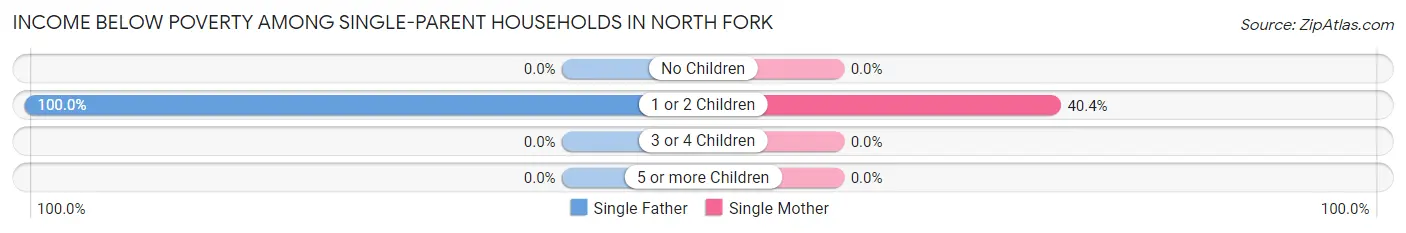
| Children | Single Father | Single Mother |
| No Children | 0 (0.0%) | 0 (0.0%) |
| 1 or 2 Children | 12 (100.0%) | 21 (40.4%) |
| 3 or 4 Children | 0 (0.0%) | 0 (0.0%) |
| 5 or more Children | 0 (0.0%) | 0 (0.0%) |
| Total | 12 (100.0%) | 21 (26.3%) |
Income Below Poverty Among Married-Couple vs Single-Parent Households in North Fork
The poverty data for North Fork shows that 48 of the married-couple family households (12.3%) and 33 of the single-parent households (35.9%) are living below the poverty level. Within the married-couple family households, those with no children have the highest poverty rate, with 48 households (25.3%) falling below the poverty line. Among the single-parent households, those with 1 or 2 children have the highest poverty rate, with 33 household (51.6%) living below poverty.
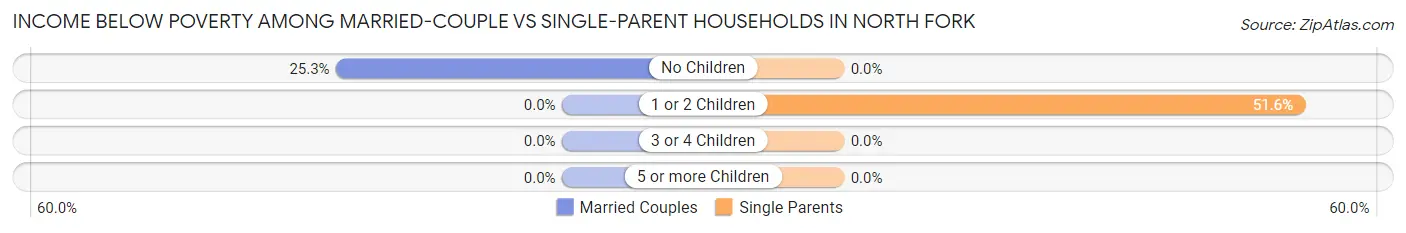
| Children | Married-Couple Families | Single-Parent Households |
| No Children | 48 (25.3%) | 0 (0.0%) |
| 1 or 2 Children | 0 (0.0%) | 33 (51.6%) |
| 3 or 4 Children | 0 (0.0%) | 0 (0.0%) |
| 5 or more Children | 0 (0.0%) | 0 (0.0%) |
| Total | 48 (12.3%) | 33 (35.9%) |
Race in North Fork
The most populous races in North Fork are Native / Alaskan (1,629 | 96.5%), and White / Caucasian (60 | 3.5%).
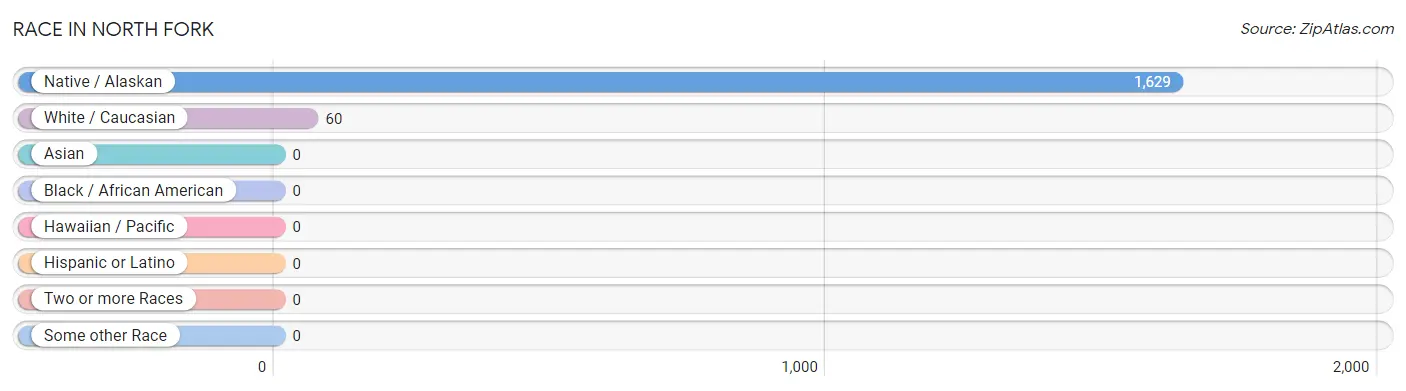
| Race | # Population | % Population |
| Asian | 0 | 0.0% |
| Black / African American | 0 | 0.0% |
| Hawaiian / Pacific | 0 | 0.0% |
| Hispanic or Latino | 0 | 0.0% |
| Native / Alaskan | 1,629 | 96.5% |
| White / Caucasian | 60 | 3.5% |
| Two or more Races | 0 | 0.0% |
| Some other Race | 0 | 0.0% |
| Total | 1,689 | 100.0% |
Ancestry in North Fork
The most populous ancestries reported in North Fork are Apache (1,318 | 78.0%), Navajo (206 | 12.2%), Sioux (14 | 0.8%), French (11 | 0.6%), and German (11 | 0.6%), together accounting for 92.4% of all North Fork residents.
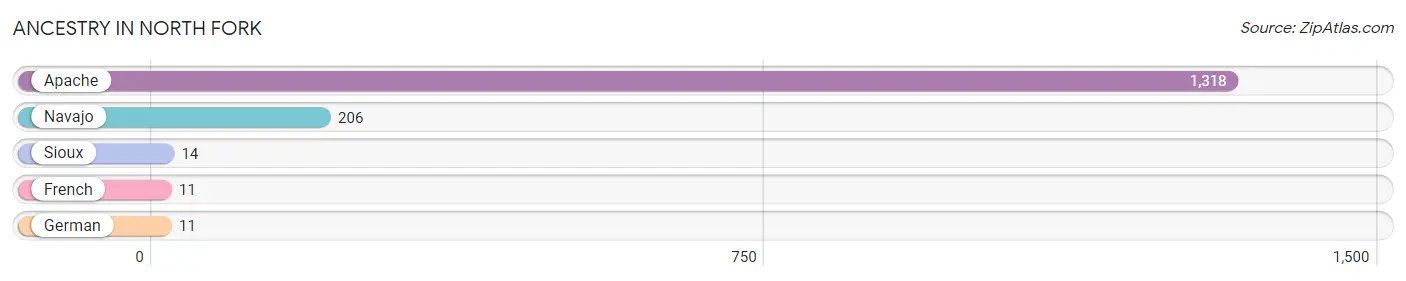
| Ancestry | # Population | % Population |
| Apache | 1,318 | 78.0% |
| French | 11 | 0.6% |
| German | 11 | 0.6% |
| Navajo | 206 | 12.2% |
| Sioux | 14 | 0.8% | View All 5 Rows |
Immigrants in North Fork

| Immigration Origin | # Population | % Population | View All 0 Rows |
Sex and Age in North Fork
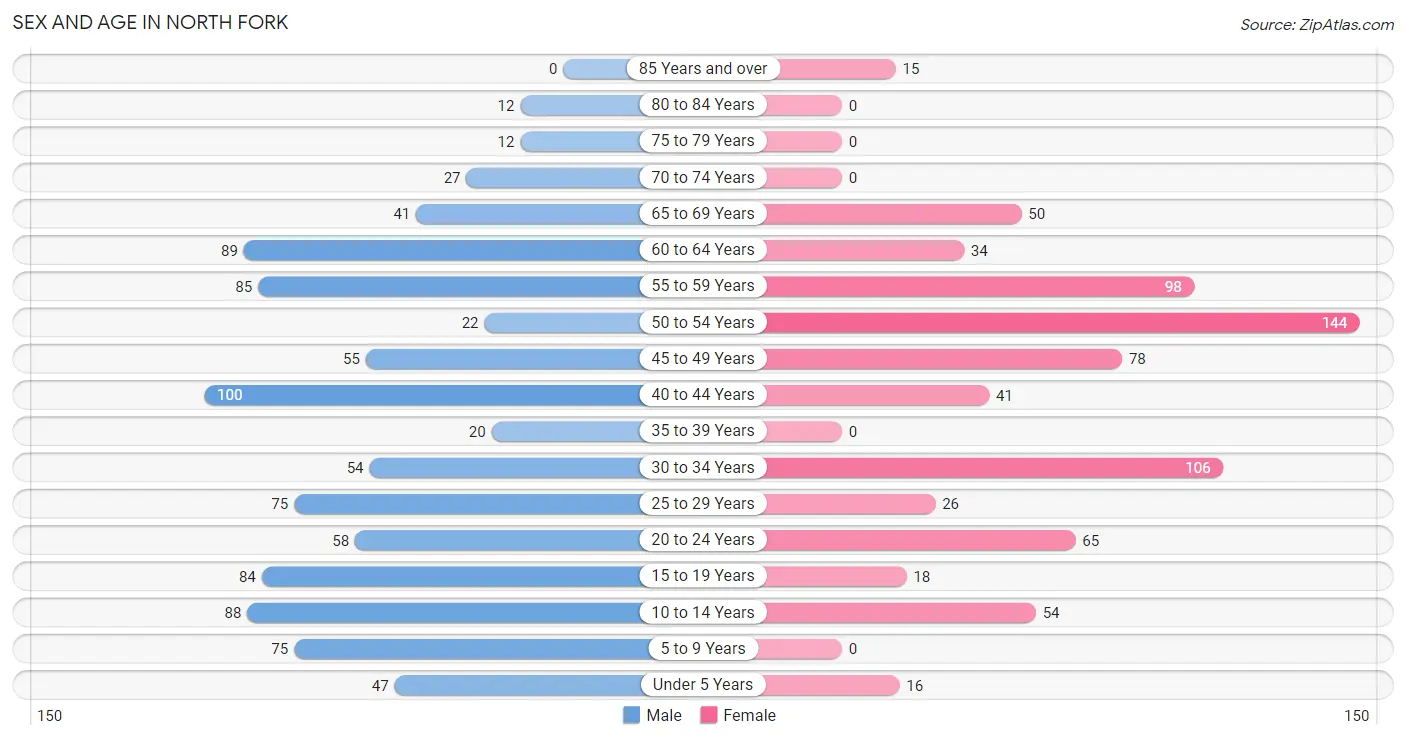
Sex and Age in North Fork
The most populous age groups in North Fork are 40 to 44 Years (100 | 10.6%) for men and 50 to 54 Years (144 | 19.3%) for women.
| Age Bracket | Male | Female |
| Under 5 Years | 47 (5.0%) | 16 (2.1%) |
| 5 to 9 Years | 75 (7.9%) | 0 (0.0%) |
| 10 to 14 Years | 88 (9.3%) | 54 (7.2%) |
| 15 to 19 Years | 84 (8.9%) | 18 (2.4%) |
| 20 to 24 Years | 58 (6.1%) | 65 (8.7%) |
| 25 to 29 Years | 75 (7.9%) | 26 (3.5%) |
| 30 to 34 Years | 54 (5.7%) | 106 (14.2%) |
| 35 to 39 Years | 20 (2.1%) | 0 (0.0%) |
| 40 to 44 Years | 100 (10.6%) | 41 (5.5%) |
| 45 to 49 Years | 55 (5.8%) | 78 (10.5%) |
| 50 to 54 Years | 22 (2.3%) | 144 (19.3%) |
| 55 to 59 Years | 85 (9.0%) | 98 (13.2%) |
| 60 to 64 Years | 89 (9.4%) | 34 (4.6%) |
| 65 to 69 Years | 41 (4.3%) | 50 (6.7%) |
| 70 to 74 Years | 27 (2.9%) | 0 (0.0%) |
| 75 to 79 Years | 12 (1.3%) | 0 (0.0%) |
| 80 to 84 Years | 12 (1.3%) | 0 (0.0%) |
| 85 Years and over | 0 (0.0%) | 15 (2.0%) |
| Total | 944 (100.0%) | 745 (100.0%) |
Families and Households in North Fork
Median Family Size in North Fork
The median family size in North Fork is 3.46 persons per family, with single female/mother families (80 | 16.6%) accounting for the largest median family size of 3.7 persons per family. On the other hand, single male/father families (12 | 2.5%) represent the smallest median family size with 2.33 persons per family.
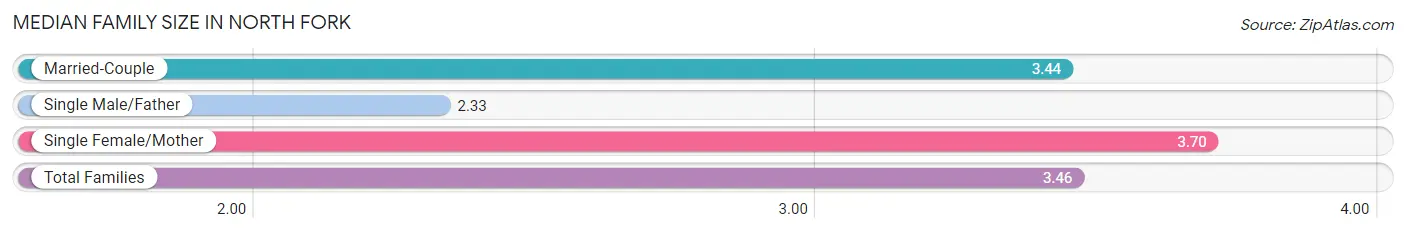
| Family Type | # Families | Family Size |
| Married-Couple | 389 (80.9%) | 3.44 |
| Single Male/Father | 12 (2.5%) | 2.33 |
| Single Female/Mother | 80 (16.6%) | 3.70 |
| Total Families | 481 (100.0%) | 3.46 |
Median Household Size in North Fork
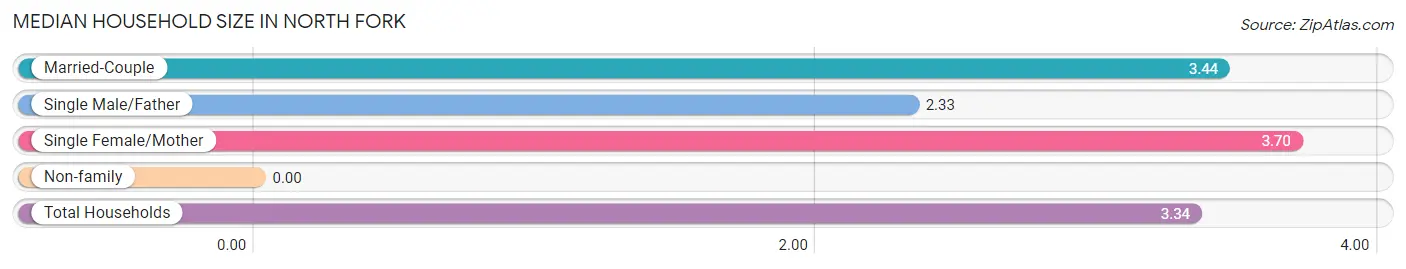
| Household Type | # Households | Household Size |
| Married-Couple | 389 (76.9%) | 3.44 |
| Single Male/Father | 12 (2.4%) | 2.33 |
| Single Female/Mother | 80 (15.8%) | 3.70 |
| Non-family | 25 (4.9%) | - |
| Total Households | 506 (100.0%) | 3.34 |
Household Size by Marriage Status in North Fork
Out of a total of 506 households in North Fork, 481 (95.1%) are family households, while 25 (4.9%) are nonfamily households. The most numerous type of family households are 3-person households, comprising 158, and the most common type of nonfamily households are 1-person households, comprising 25.
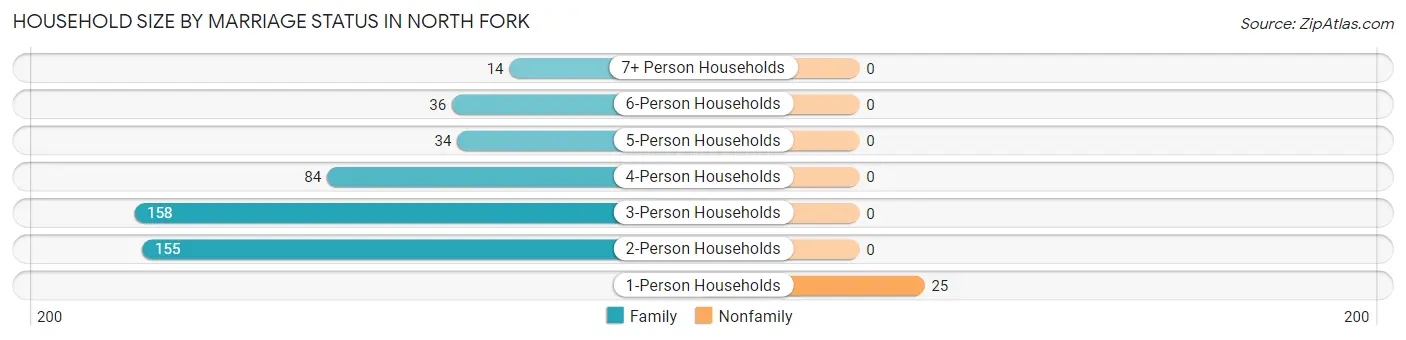
| Household Size | Family Households | Nonfamily Households |
| 1-Person Households | - | 25 (4.9%) |
| 2-Person Households | 155 (30.6%) | 0 (0.0%) |
| 3-Person Households | 158 (31.2%) | 0 (0.0%) |
| 4-Person Households | 84 (16.6%) | 0 (0.0%) |
| 5-Person Households | 34 (6.7%) | 0 (0.0%) |
| 6-Person Households | 36 (7.1%) | 0 (0.0%) |
| 7+ Person Households | 14 (2.8%) | 0 (0.0%) |
| Total | 481 (95.1%) | 25 (4.9%) |
Female Fertility in North Fork
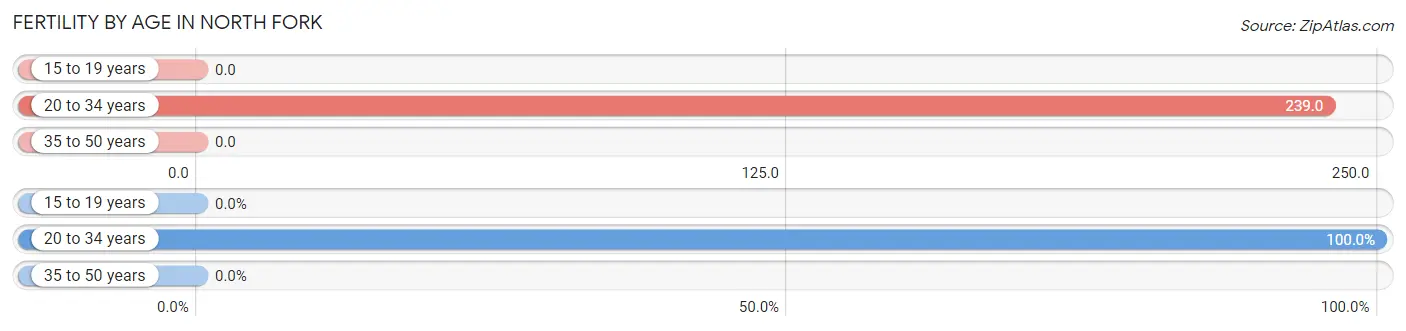
Fertility by Age in North Fork
Average fertility rate in North Fork is 134.0 births per 1,000 women. Women in the age bracket of 20 to 34 years have the highest fertility rate with 239.0 births per 1,000 women. Women in the age bracket of 20 to 34 years acount for 100.0% of all women with births.
| Age Bracket | Women with Births | Births / 1,000 Women |
| 15 to 19 years | 0 (0.0%) | 0.0 |
| 20 to 34 years | 47 (100.0%) | 239.0 |
| 35 to 50 years | 0 (0.0%) | 0.0 |
| Total | 47 (100.0%) | 134.0 |
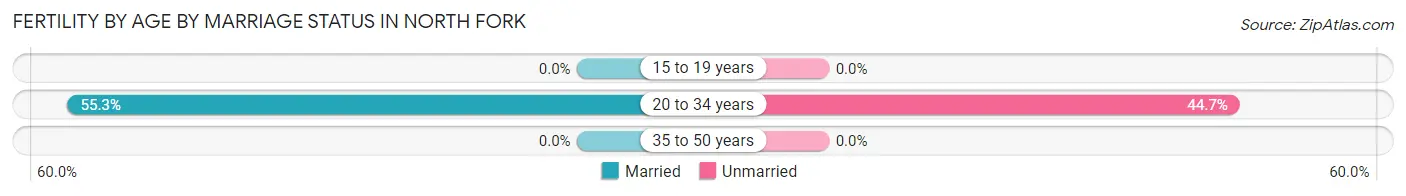
Fertility by Age by Marriage Status in North Fork
55.3% of women with births (47) in North Fork are married. The highest percentage of unmarried women with births falls into 20 to 34 years age bracket with 44.7% of them unmarried at the time of birth, while the lowest percentage of unmarried women with births belong to 20 to 34 years age bracket with 44.7% of them unmarried.
| Age Bracket | Married | Unmarried |
| 15 to 19 years | 0 (0.0%) | 0 (0.0%) |
| 20 to 34 years | 26 (55.3%) | 21 (44.7%) |
| 35 to 50 years | 0 (0.0%) | 0 (0.0%) |
| Total | 26 (55.3%) | 21 (44.7%) |
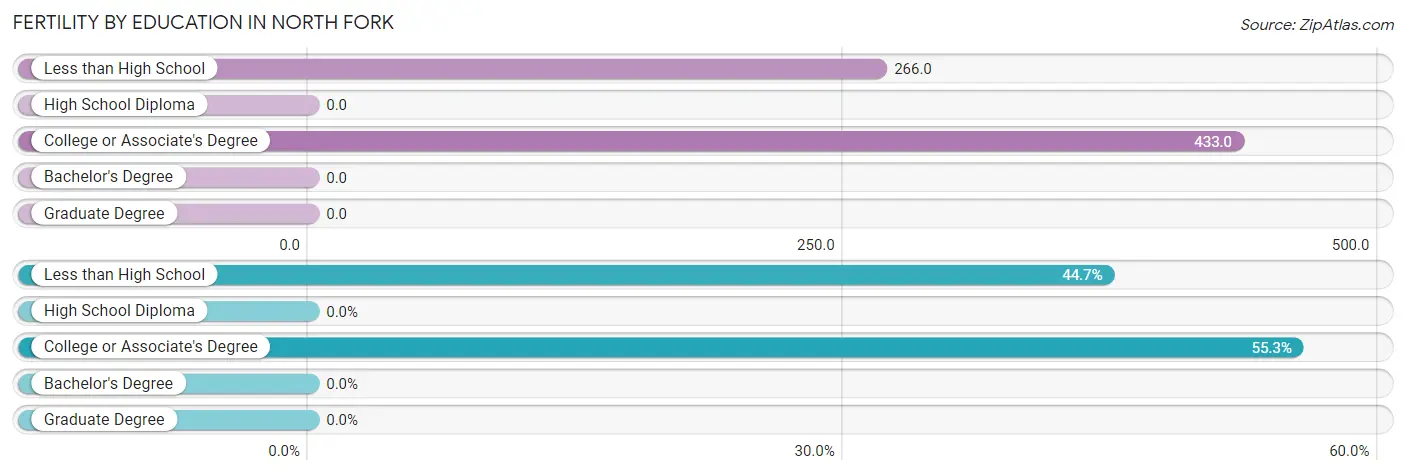
Fertility by Education in North Fork
| Educational Attainment | Women with Births | Births / 1,000 Women |
| Less than High School | 21 (44.7%) | 266.0 |
| High School Diploma | 0 (0.0%) | 0.0 |
| College or Associate's Degree | 26 (55.3%) | 433.0 |
| Bachelor's Degree | 0 (0.0%) | 0.0 |
| Graduate Degree | 0 (0.0%) | 0.0 |
| Total | 47 (100.0%) | 134.0 |
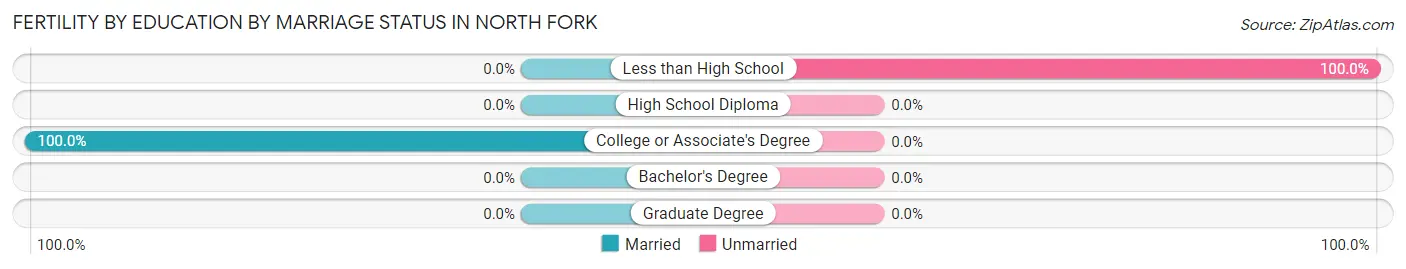
Fertility by Education by Marriage Status in North Fork
44.7% of women with births in North Fork are unmarried. Women with the educational attainment of college or associate's degree are most likely to be married with 100.0% of them married at childbirth, while women with the educational attainment of less than high school are least likely to be married with 100.0% of them unmarried at childbirth.
| Educational Attainment | Married | Unmarried |
| Less than High School | 0 (0.0%) | 21 (100.0%) |
| High School Diploma | 0 (0.0%) | 0 (0.0%) |
| College or Associate's Degree | 26 (100.0%) | 0 (0.0%) |
| Bachelor's Degree | 0 (0.0%) | 0 (0.0%) |
| Graduate Degree | 0 (0.0%) | 0 (0.0%) |
| Total | 26 (55.3%) | 21 (44.7%) |
Employment Characteristics in North Fork
Employment by Class of Employer in North Fork
Among the 700 employed individuals in North Fork, federal government employees (246 | 35.1%), local government employees (214 | 30.6%), and private company employees (114 | 16.3%) make up the most common classes of employment.
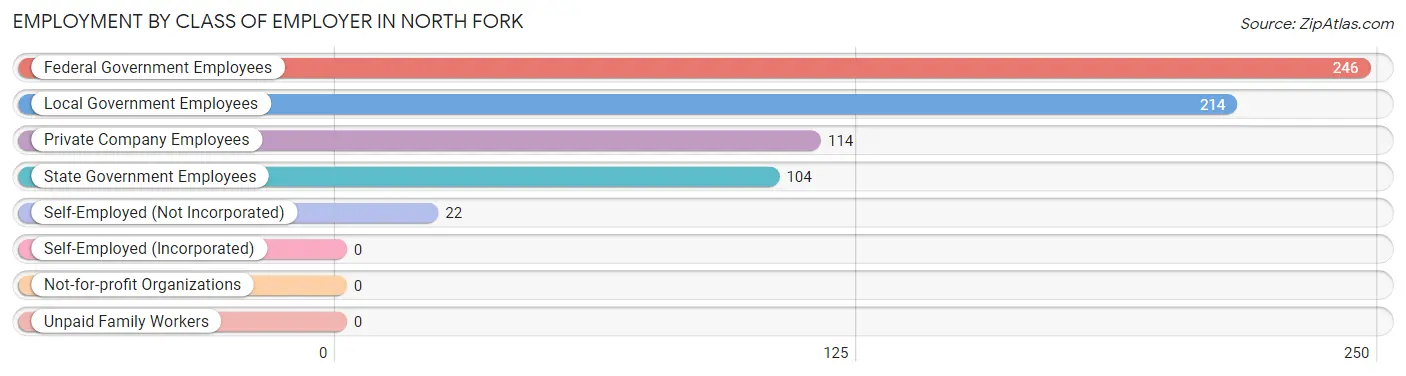
| Employer Class | # Employees | % Employees |
| Private Company Employees | 114 | 16.3% |
| Self-Employed (Incorporated) | 0 | 0.0% |
| Self-Employed (Not Incorporated) | 22 | 3.1% |
| Not-for-profit Organizations | 0 | 0.0% |
| Local Government Employees | 214 | 30.6% |
| State Government Employees | 104 | 14.9% |
| Federal Government Employees | 246 | 35.1% |
| Unpaid Family Workers | 0 | 0.0% |
| Total | 700 | 100.0% |
Employment Status by Age in North Fork
According to the labor force statistics for North Fork, out of the total population over 16 years of age (1,391), 55.9% or 778 individuals are in the labor force, with 9.9% or 77 of them unemployed. The age group with the highest labor force participation rate is 25 to 29 years, with 100.0% or 101 individuals in the labor force. Within the labor force, the 60 to 64 years age range has the highest percentage of unemployed individuals, with 47.5% or 28 of them being unemployed.
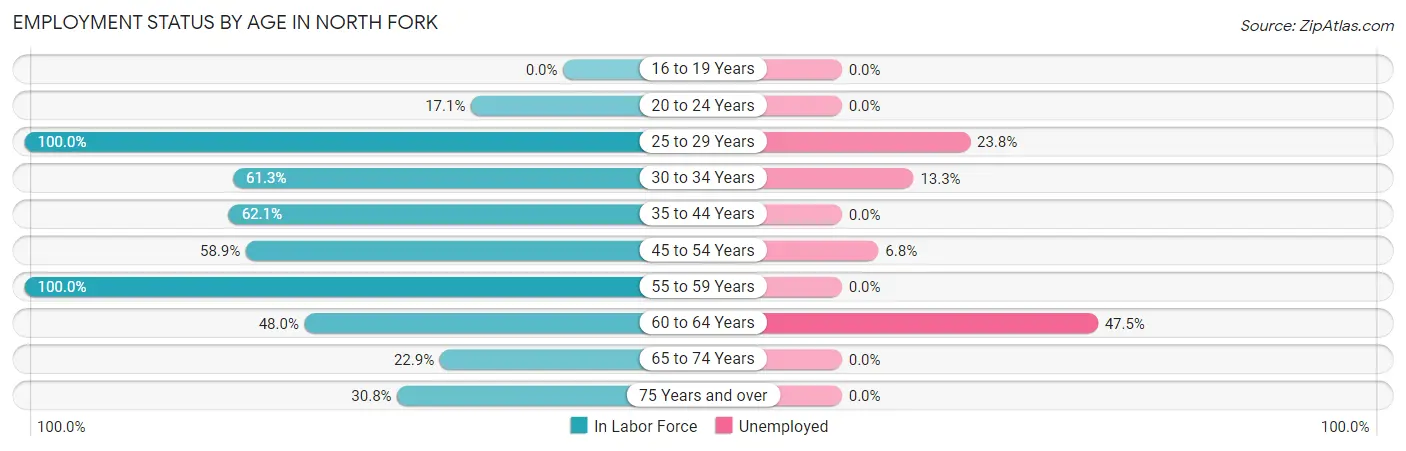
| Age Bracket | In Labor Force | Unemployed |
| 16 to 19 Years | 0 (0.0%) | 0 (0.0%) |
| 20 to 24 Years | 21 (17.1%) | 0 (0.0%) |
| 25 to 29 Years | 101 (100.0%) | 24 (23.8%) |
| 30 to 34 Years | 98 (61.3%) | 13 (13.3%) |
| 35 to 44 Years | 100 (62.1%) | 0 (0.0%) |
| 45 to 54 Years | 176 (58.9%) | 12 (6.8%) |
| 55 to 59 Years | 183 (100.0%) | 0 (0.0%) |
| 60 to 64 Years | 59 (48.0%) | 28 (47.5%) |
| 65 to 74 Years | 27 (22.9%) | 0 (0.0%) |
| 75 Years and over | 12 (30.8%) | 0 (0.0%) |
| Total | 778 (55.9%) | 77 (9.9%) |
Employment Status by Educational Attainment in North Fork
According to labor force statistics for North Fork, 69.8% of individuals (717) out of the total population between 25 and 64 years of age (1,027) are in the labor force, with 10.7% or 77 of them being unemployed. The group with the highest labor force participation rate are those with the educational attainment of bachelor's degree or higher, with 100.0% or 155 individuals in the labor force. Within the labor force, individuals with less than high school education have the highest percentage of unemployment, with 17.4% or 12 of them being unemployed.
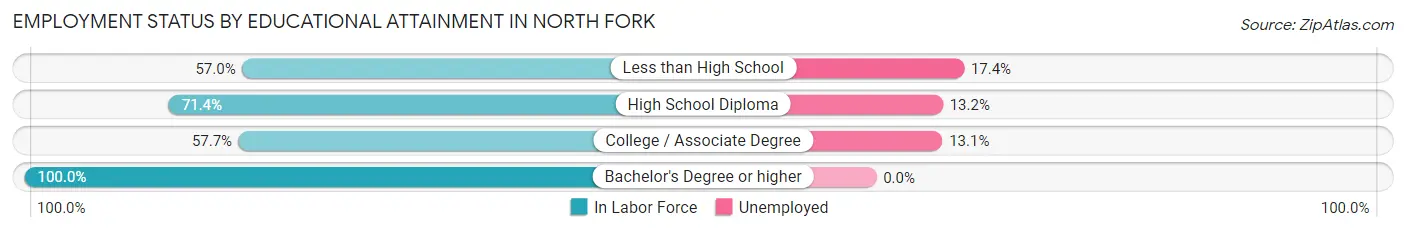
| Educational Attainment | In Labor Force | Unemployed |
| Less than High School | 69 (57.0%) | 21 (17.4%) |
| High School Diploma | 310 (71.4%) | 57 (13.2%) |
| College / Associate Degree | 183 (57.7%) | 42 (13.1%) |
| Bachelor's Degree or higher | 155 (100.0%) | 0 (0.0%) |
| Total | 717 (69.8%) | 110 (10.7%) |
Employment Occupations by Sex in North Fork
Management, Business, Science and Arts Occupations
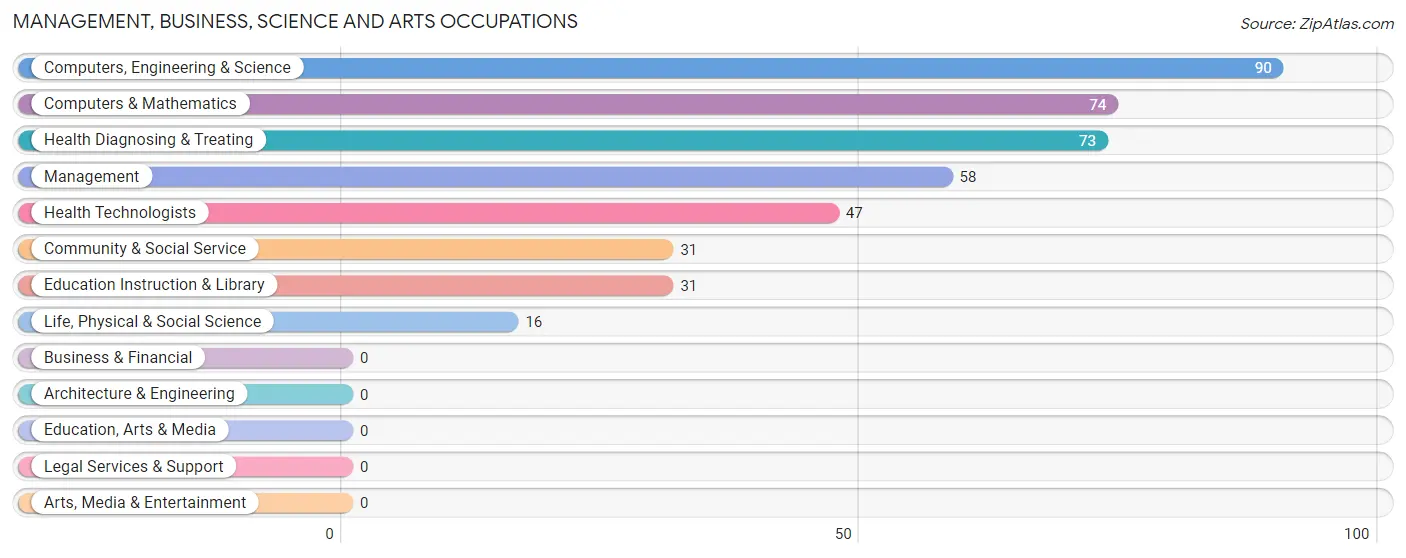
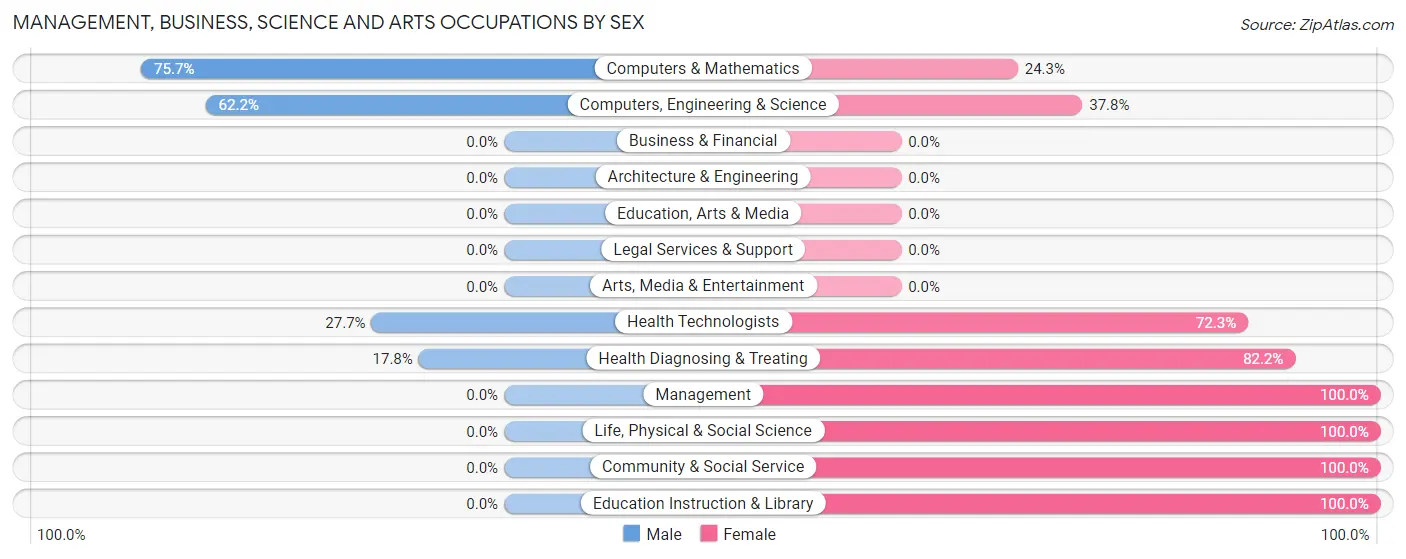
The most common Management, Business, Science and Arts occupations in North Fork are Computers, Engineering & Science (90 | 12.9%), Computers & Mathematics (74 | 10.6%), Health Diagnosing & Treating (73 | 10.4%), Management (58 | 8.3%), and Health Technologists (47 | 6.7%).
Management, Business, Science and Arts Occupations by Sex
Within the Management, Business, Science and Arts occupations in North Fork, the most male-oriented occupations are Computers & Mathematics (75.7%), Computers, Engineering & Science (62.2%), and Health Technologists (27.7%), while the most female-oriented occupations are Management (100.0%), Life, Physical & Social Science (100.0%), and Community & Social Service (100.0%).
| Occupation | Male | Female |
| Management | 0 (0.0%) | 58 (100.0%) |
| Business & Financial | 0 (0.0%) | 0 (0.0%) |
| Computers, Engineering & Science | 56 (62.2%) | 34 (37.8%) |
| Computers & Mathematics | 56 (75.7%) | 18 (24.3%) |
| Architecture & Engineering | 0 (0.0%) | 0 (0.0%) |
| Life, Physical & Social Science | 0 (0.0%) | 16 (100.0%) |
| Community & Social Service | 0 (0.0%) | 31 (100.0%) |
| Education, Arts & Media | 0 (0.0%) | 0 (0.0%) |
| Legal Services & Support | 0 (0.0%) | 0 (0.0%) |
| Education Instruction & Library | 0 (0.0%) | 31 (100.0%) |
| Arts, Media & Entertainment | 0 (0.0%) | 0 (0.0%) |
| Health Diagnosing & Treating | 13 (17.8%) | 60 (82.2%) |
| Health Technologists | 13 (27.7%) | 34 (72.3%) |
| Total (Category) | 69 (27.4%) | 183 (72.6%) |
| Total (Overall) | 373 (53.3%) | 327 (46.7%) |
Services Occupations
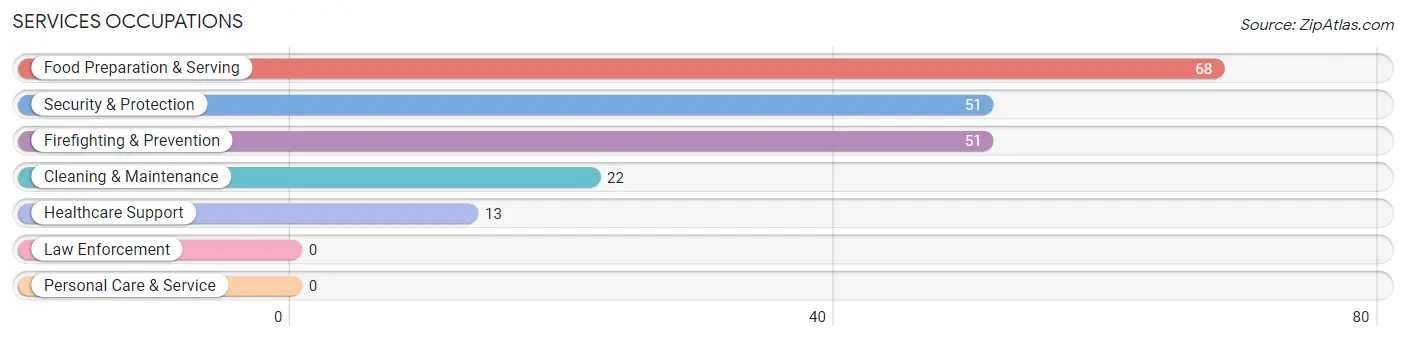
The most common Services occupations in North Fork are Food Preparation & Serving (68 | 9.7%), Security & Protection (51 | 7.3%), Firefighting & Prevention (51 | 7.3%), Cleaning & Maintenance (22 | 3.1%), and Healthcare Support (13 | 1.9%).
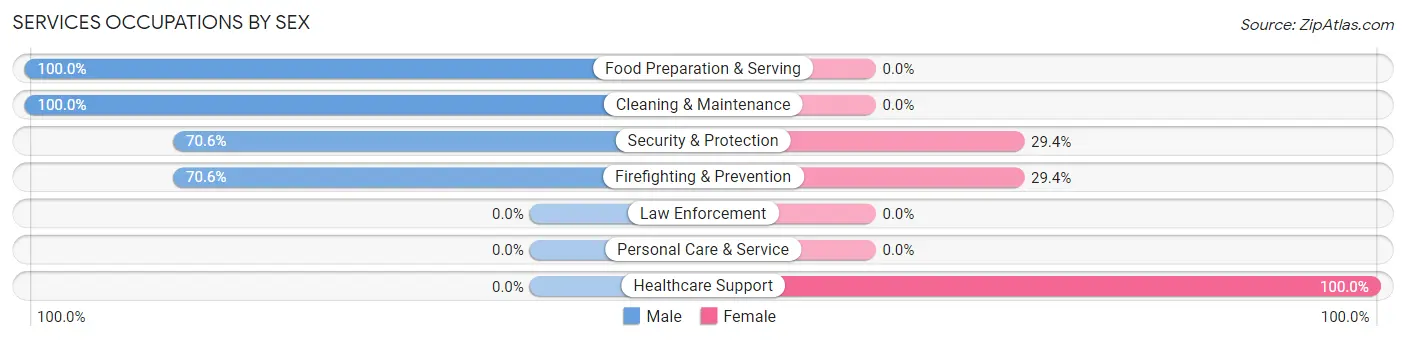
Services Occupations by Sex
Within the Services occupations in North Fork, the most male-oriented occupations are Food Preparation & Serving (100.0%), Cleaning & Maintenance (100.0%), and Security & Protection (70.6%), while the most female-oriented occupations are Healthcare Support (100.0%), Security & Protection (29.4%), and Firefighting & Prevention (29.4%).
| Occupation | Male | Female |
| Healthcare Support | 0 (0.0%) | 13 (100.0%) |
| Security & Protection | 36 (70.6%) | 15 (29.4%) |
| Firefighting & Prevention | 36 (70.6%) | 15 (29.4%) |
| Law Enforcement | 0 (0.0%) | 0 (0.0%) |
| Food Preparation & Serving | 68 (100.0%) | 0 (0.0%) |
| Cleaning & Maintenance | 22 (100.0%) | 0 (0.0%) |
| Personal Care & Service | 0 (0.0%) | 0 (0.0%) |
| Total (Category) | 126 (81.8%) | 28 (18.2%) |
| Total (Overall) | 373 (53.3%) | 327 (46.7%) |
Sales and Office Occupations
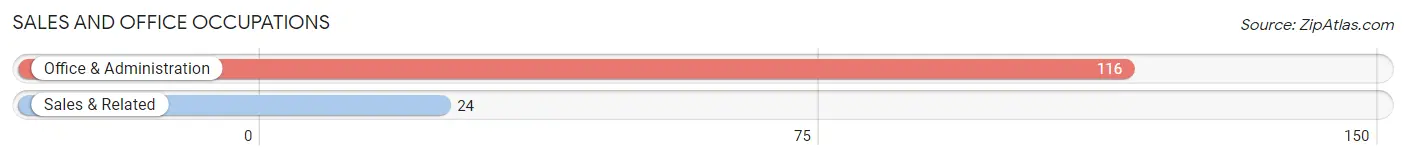
The most common Sales and Office occupations in North Fork are Office & Administration (116 | 16.6%), and Sales & Related (24 | 3.4%).
Sales and Office Occupations by Sex
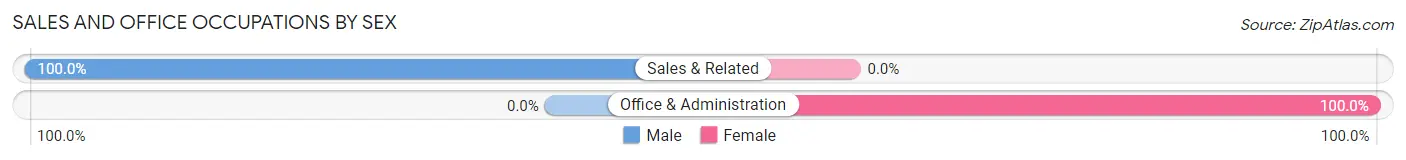
| Occupation | Male | Female |
| Sales & Related | 24 (100.0%) | 0 (0.0%) |
| Office & Administration | 0 (0.0%) | 116 (100.0%) |
| Total (Category) | 24 (17.1%) | 116 (82.9%) |
| Total (Overall) | 373 (53.3%) | 327 (46.7%) |
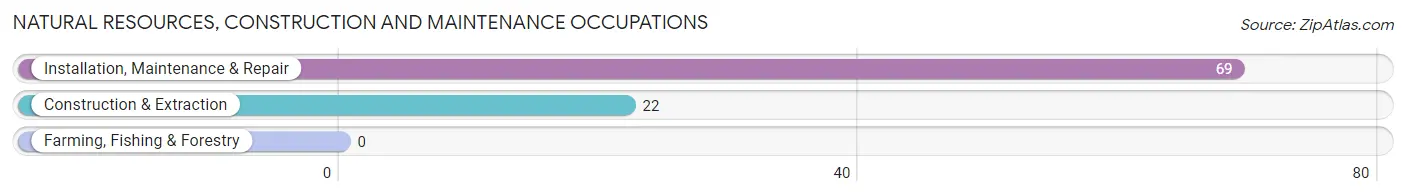
Natural Resources, Construction and Maintenance Occupations
The most common Natural Resources, Construction and Maintenance occupations in North Fork are Installation, Maintenance & Repair (69 | 9.9%), and Construction & Extraction (22 | 3.1%).
Natural Resources, Construction and Maintenance Occupations by Sex
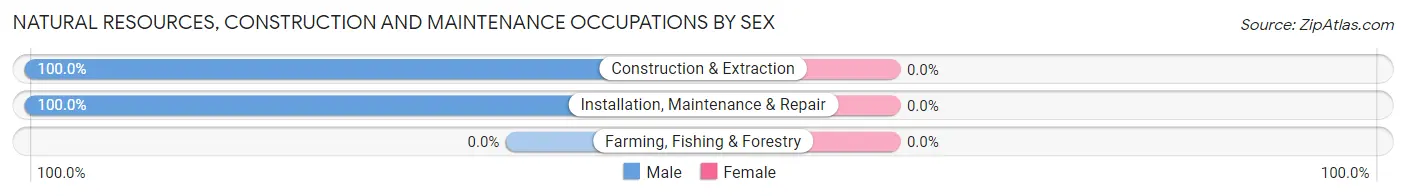
| Occupation | Male | Female |
| Farming, Fishing & Forestry | 0 (0.0%) | 0 (0.0%) |
| Construction & Extraction | 22 (100.0%) | 0 (0.0%) |
| Installation, Maintenance & Repair | 69 (100.0%) | 0 (0.0%) |
| Total (Category) | 91 (100.0%) | 0 (0.0%) |
| Total (Overall) | 373 (53.3%) | 327 (46.7%) |
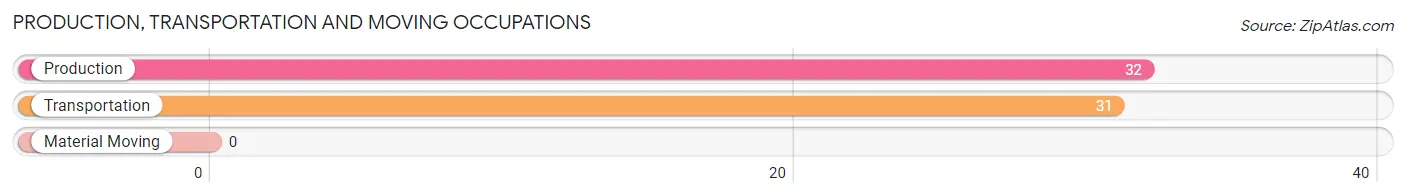
Production, Transportation and Moving Occupations
The most common Production, Transportation and Moving occupations in North Fork are Production (32 | 4.6%), and Transportation (31 | 4.4%).
Production, Transportation and Moving Occupations by Sex
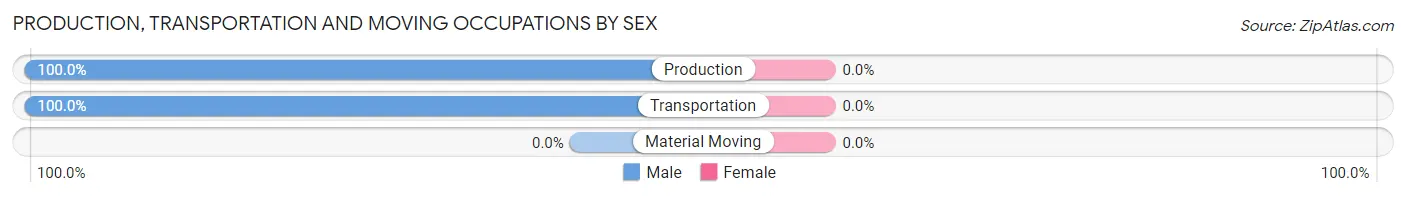
| Occupation | Male | Female |
| Production | 32 (100.0%) | 0 (0.0%) |
| Transportation | 31 (100.0%) | 0 (0.0%) |
| Material Moving | 0 (0.0%) | 0 (0.0%) |
| Total (Category) | 63 (100.0%) | 0 (0.0%) |
| Total (Overall) | 373 (53.3%) | 327 (46.7%) |
Employment Industries by Sex in North Fork
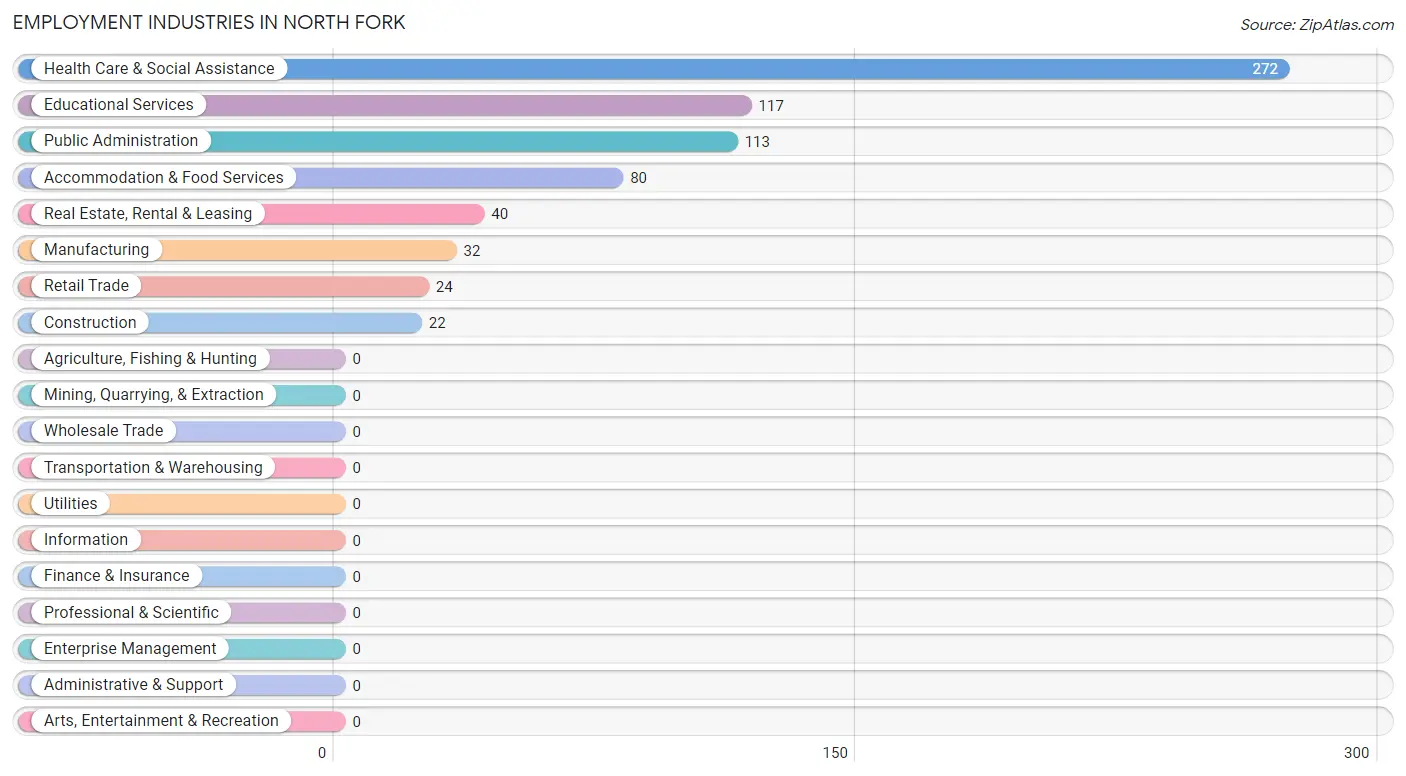
Employment Industries in North Fork
The major employment industries in North Fork include Health Care & Social Assistance (272 | 38.9%), Educational Services (117 | 16.7%), Public Administration (113 | 16.1%), Accommodation & Food Services (80 | 11.4%), and Real Estate, Rental & Leasing (40 | 5.7%).
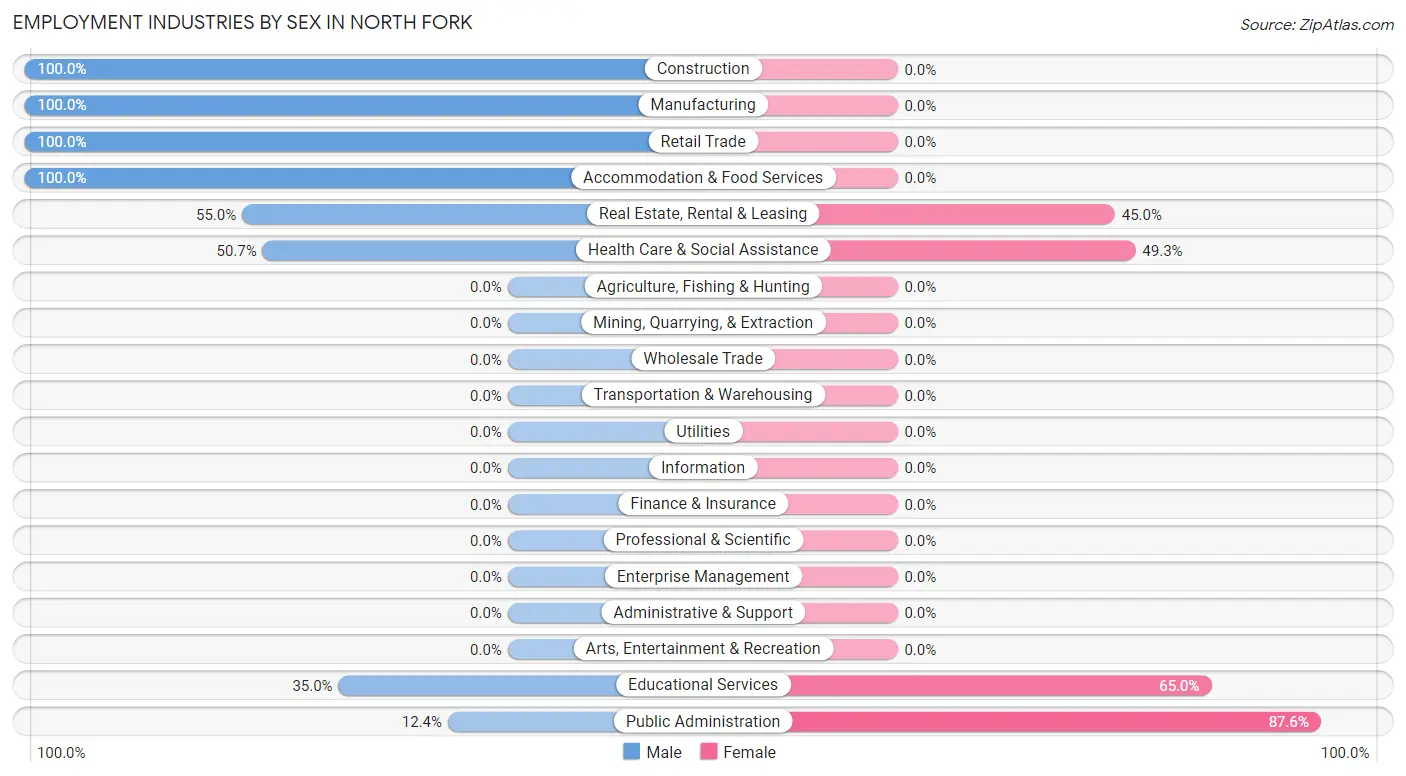
Employment Industries by Sex in North Fork
The North Fork industries that see more men than women are Construction (100.0%), Manufacturing (100.0%), and Retail Trade (100.0%), whereas the industries that tend to have a higher number of women are Public Administration (87.6%), Educational Services (65.0%), and Health Care & Social Assistance (49.3%).
| Industry | Male | Female |
| Agriculture, Fishing & Hunting | 0 (0.0%) | 0 (0.0%) |
| Mining, Quarrying, & Extraction | 0 (0.0%) | 0 (0.0%) |
| Construction | 22 (100.0%) | 0 (0.0%) |
| Manufacturing | 32 (100.0%) | 0 (0.0%) |
| Wholesale Trade | 0 (0.0%) | 0 (0.0%) |
| Retail Trade | 24 (100.0%) | 0 (0.0%) |
| Transportation & Warehousing | 0 (0.0%) | 0 (0.0%) |
| Utilities | 0 (0.0%) | 0 (0.0%) |
| Information | 0 (0.0%) | 0 (0.0%) |
| Finance & Insurance | 0 (0.0%) | 0 (0.0%) |
| Real Estate, Rental & Leasing | 22 (55.0%) | 18 (45.0%) |
| Professional & Scientific | 0 (0.0%) | 0 (0.0%) |
| Enterprise Management | 0 (0.0%) | 0 (0.0%) |
| Administrative & Support | 0 (0.0%) | 0 (0.0%) |
| Educational Services | 41 (35.0%) | 76 (65.0%) |
| Health Care & Social Assistance | 138 (50.7%) | 134 (49.3%) |
| Arts, Entertainment & Recreation | 0 (0.0%) | 0 (0.0%) |
| Accommodation & Food Services | 80 (100.0%) | 0 (0.0%) |
| Public Administration | 14 (12.4%) | 99 (87.6%) |
| Total | 373 (53.3%) | 327 (46.7%) |
Education in North Fork
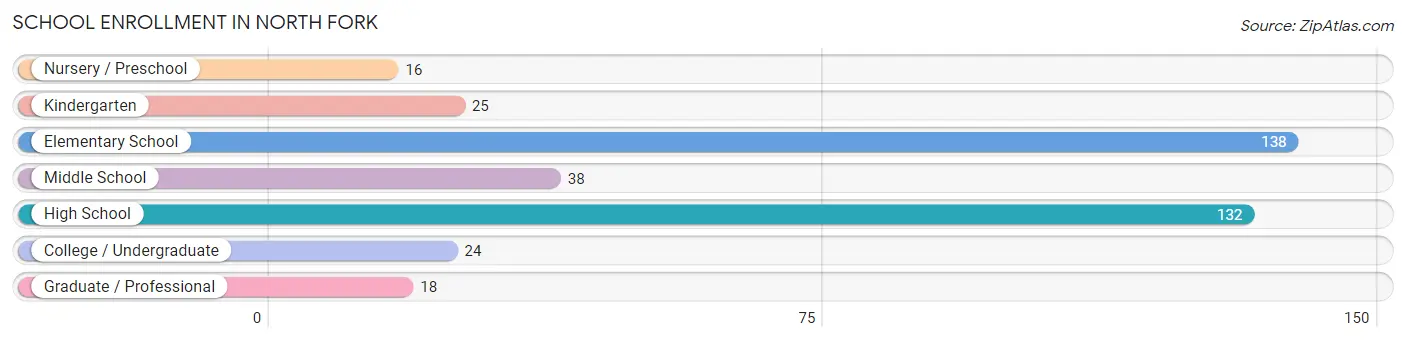
School Enrollment in North Fork
The most common levels of schooling among the 391 students in North Fork are elementary school (138 | 35.3%), high school (132 | 33.8%), and middle school (38 | 9.7%).
| School Level | # Students | % Students |
| Nursery / Preschool | 16 | 4.1% |
| Kindergarten | 25 | 6.4% |
| Elementary School | 138 | 35.3% |
| Middle School | 38 | 9.7% |
| High School | 132 | 33.8% |
| College / Undergraduate | 24 | 6.1% |
| Graduate / Professional | 18 | 4.6% |
| Total | 391 | 100.0% |
School Enrollment by Age by Funding Source in North Fork

| Age Bracket | Public School | Private School |
| 3 to 4 Year Olds | 16 (100.0%) | 0 (0.0%) |
| 5 to 9 Year Old | 75 (100.0%) | 0 (0.0%) |
| 10 to 14 Year Olds | 142 (100.0%) | 0 (0.0%) |
| 15 to 17 Year Olds | 102 (100.0%) | 0 (0.0%) |
| 18 to 19 Year Olds | 0 (0.0%) | 0 (0.0%) |
| 20 to 24 Year Olds | 0 (0.0%) | 0 (0.0%) |
| 25 to 34 Year Olds | 42 (100.0%) | 0 (0.0%) |
| 35 Years and over | 14 (100.0%) | 0 (0.0%) |
| Total | 391 (100.0%) | 0 (0.0%) |
Educational Attainment by Field of Study in North Fork
Education (74 | 47.7%), psychology (27 | 17.4%), social sciences (23 | 14.8%), computers & mathematics (18 | 11.6%), and bio, nature & agricultural (13 | 8.4%) are the most common fields of study among 155 individuals in North Fork who have obtained a bachelor's degree or higher.
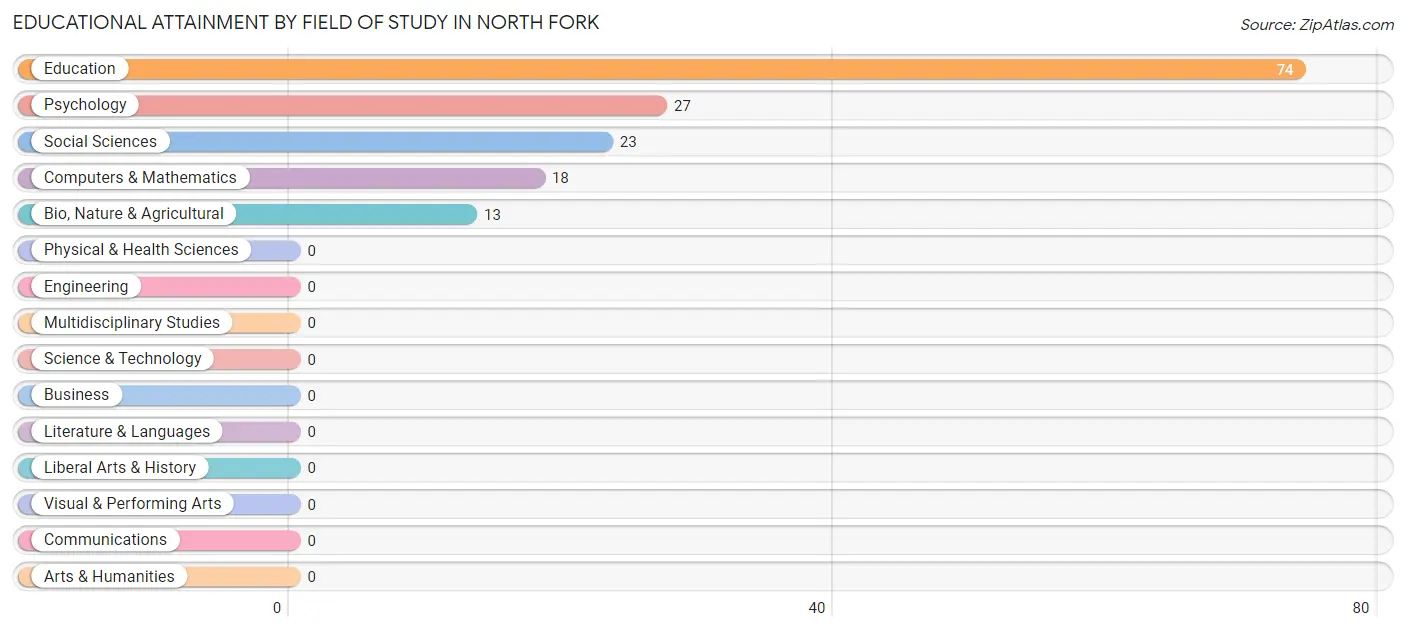
| Field of Study | # Graduates | % Graduates |
| Computers & Mathematics | 18 | 11.6% |
| Bio, Nature & Agricultural | 13 | 8.4% |
| Physical & Health Sciences | 0 | 0.0% |
| Psychology | 27 | 17.4% |
| Social Sciences | 23 | 14.8% |
| Engineering | 0 | 0.0% |
| Multidisciplinary Studies | 0 | 0.0% |
| Science & Technology | 0 | 0.0% |
| Business | 0 | 0.0% |
| Education | 74 | 47.7% |
| Literature & Languages | 0 | 0.0% |
| Liberal Arts & History | 0 | 0.0% |
| Visual & Performing Arts | 0 | 0.0% |
| Communications | 0 | 0.0% |
| Arts & Humanities | 0 | 0.0% |
| Total | 155 | 100.0% |
Transportation & Commute in North Fork
Vehicle Availability by Sex in North Fork
The most prevalent vehicle ownership categories in North Fork are males with 2 vehicles (241, accounting for 64.6%) and females with 2 vehicles (136, making up 73.7%).
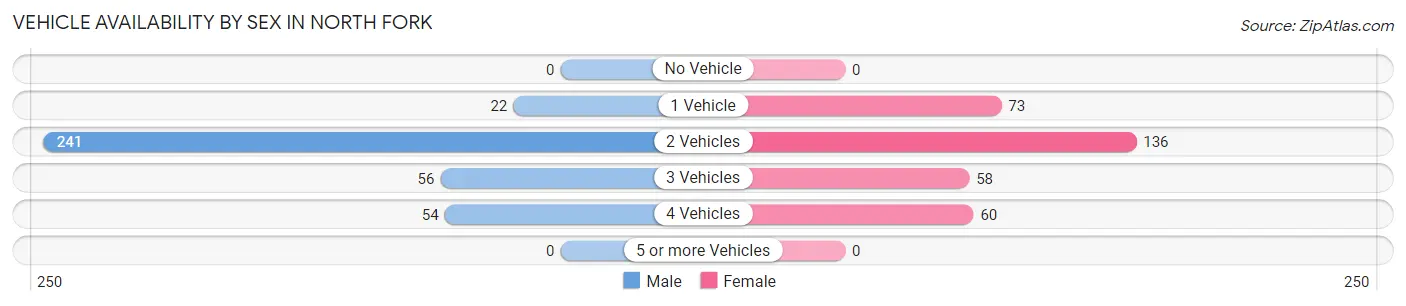
| Vehicles Available | Male | Female |
| No Vehicle | 0 (0.0%) | 0 (0.0%) |
| 1 Vehicle | 22 (5.9%) | 73 (22.3%) |
| 2 Vehicles | 241 (64.6%) | 136 (41.6%) |
| 3 Vehicles | 56 (15.0%) | 58 (17.7%) |
| 4 Vehicles | 54 (14.5%) | 60 (18.3%) |
| 5 or more Vehicles | 0 (0.0%) | 0 (0.0%) |
| Total | 373 (100.0%) | 327 (100.0%) |
Commute Time in North Fork
The most frequently occuring commute durations in North Fork are 5 to 9 minutes (193 commuters, 28.2%), less than 5 minutes (128 commuters, 18.7%), and 30 to 34 minutes (93 commuters, 13.6%).
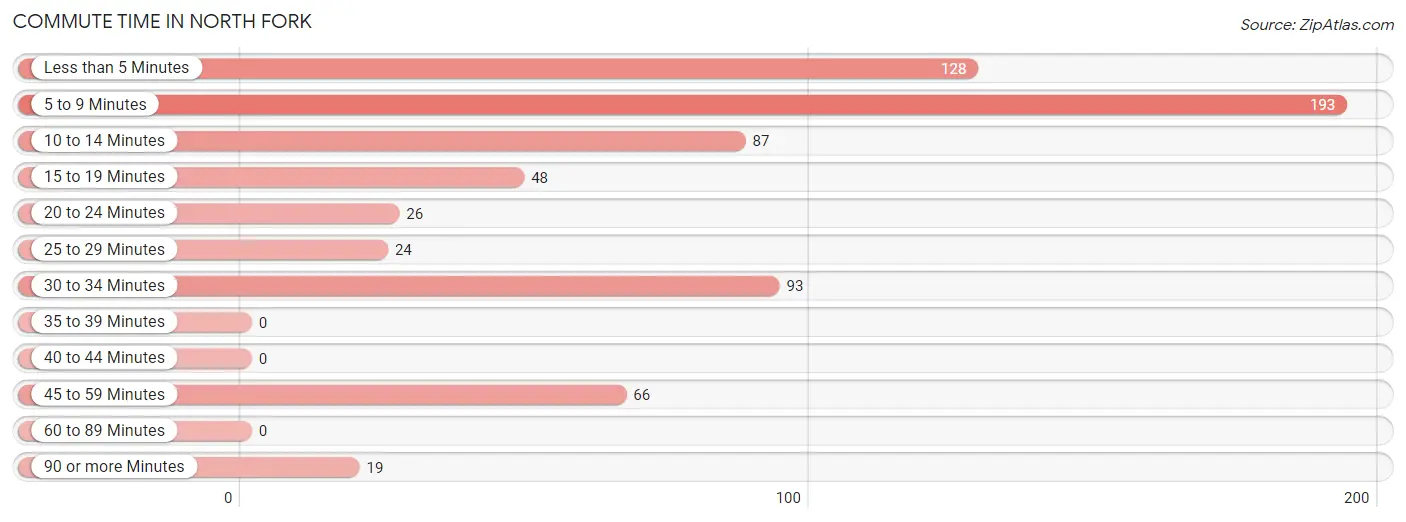
| Commute Time | # Commuters | % Commuters |
| Less than 5 Minutes | 128 | 18.7% |
| 5 to 9 Minutes | 193 | 28.2% |
| 10 to 14 Minutes | 87 | 12.7% |
| 15 to 19 Minutes | 48 | 7.0% |
| 20 to 24 Minutes | 26 | 3.8% |
| 25 to 29 Minutes | 24 | 3.5% |
| 30 to 34 Minutes | 93 | 13.6% |
| 35 to 39 Minutes | 0 | 0.0% |
| 40 to 44 Minutes | 0 | 0.0% |
| 45 to 59 Minutes | 66 | 9.7% |
| 60 to 89 Minutes | 0 | 0.0% |
| 90 or more Minutes | 19 | 2.8% |
Commute Time by Sex in North Fork
The most common commute times in North Fork are less than 5 minutes (105 commuters, 28.1%) for males and 5 to 9 minutes (102 commuters, 32.8%) for females.
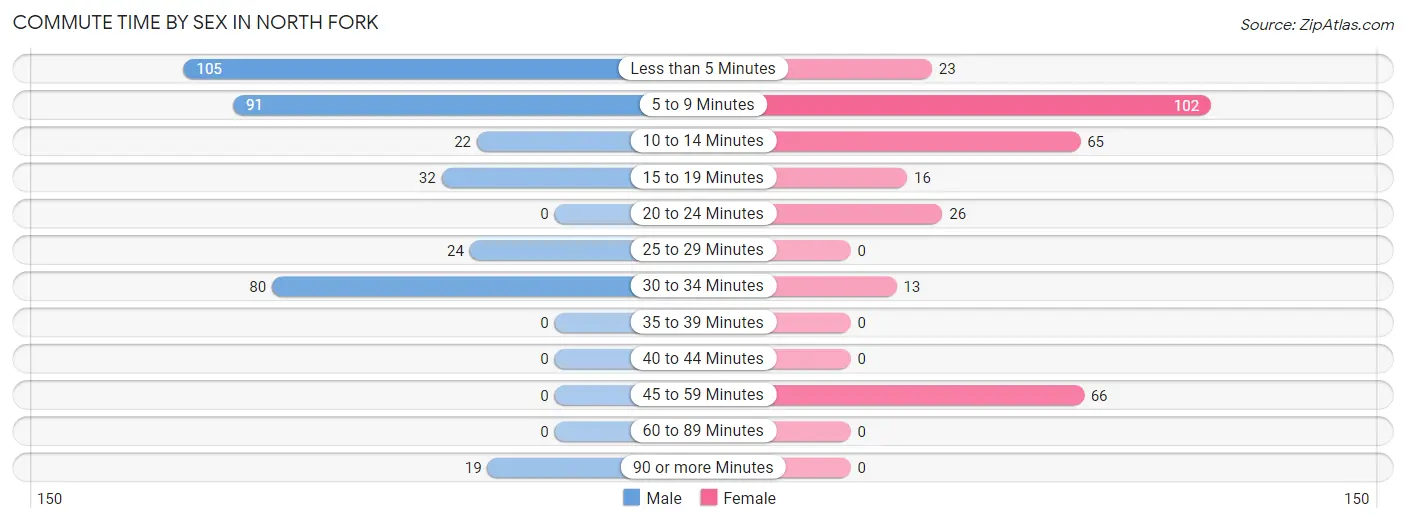
| Commute Time | Male | Female |
| Less than 5 Minutes | 105 (28.1%) | 23 (7.4%) |
| 5 to 9 Minutes | 91 (24.4%) | 102 (32.8%) |
| 10 to 14 Minutes | 22 (5.9%) | 65 (20.9%) |
| 15 to 19 Minutes | 32 (8.6%) | 16 (5.1%) |
| 20 to 24 Minutes | 0 (0.0%) | 26 (8.4%) |
| 25 to 29 Minutes | 24 (6.4%) | 0 (0.0%) |
| 30 to 34 Minutes | 80 (21.4%) | 13 (4.2%) |
| 35 to 39 Minutes | 0 (0.0%) | 0 (0.0%) |
| 40 to 44 Minutes | 0 (0.0%) | 0 (0.0%) |
| 45 to 59 Minutes | 0 (0.0%) | 66 (21.2%) |
| 60 to 89 Minutes | 0 (0.0%) | 0 (0.0%) |
| 90 or more Minutes | 19 (5.1%) | 0 (0.0%) |
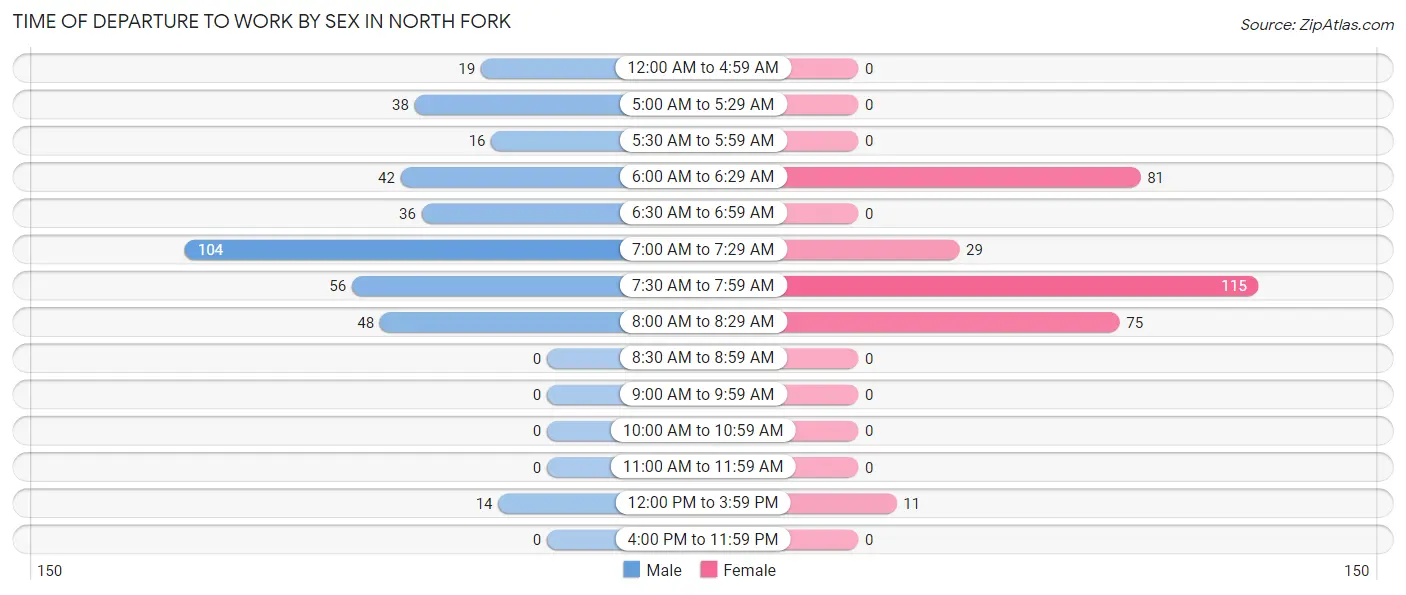
Time of Departure to Work by Sex in North Fork
The most frequent times of departure to work in North Fork are 7:00 AM to 7:29 AM (104, 27.9%) for males and 7:30 AM to 7:59 AM (115, 37.0%) for females.
| Time of Departure | Male | Female |
| 12:00 AM to 4:59 AM | 19 (5.1%) | 0 (0.0%) |
| 5:00 AM to 5:29 AM | 38 (10.2%) | 0 (0.0%) |
| 5:30 AM to 5:59 AM | 16 (4.3%) | 0 (0.0%) |
| 6:00 AM to 6:29 AM | 42 (11.3%) | 81 (26.1%) |
| 6:30 AM to 6:59 AM | 36 (9.7%) | 0 (0.0%) |
| 7:00 AM to 7:29 AM | 104 (27.9%) | 29 (9.3%) |
| 7:30 AM to 7:59 AM | 56 (15.0%) | 115 (37.0%) |
| 8:00 AM to 8:29 AM | 48 (12.9%) | 75 (24.1%) |
| 8:30 AM to 8:59 AM | 0 (0.0%) | 0 (0.0%) |
| 9:00 AM to 9:59 AM | 0 (0.0%) | 0 (0.0%) |
| 10:00 AM to 10:59 AM | 0 (0.0%) | 0 (0.0%) |
| 11:00 AM to 11:59 AM | 0 (0.0%) | 0 (0.0%) |
| 12:00 PM to 3:59 PM | 14 (3.7%) | 11 (3.5%) |
| 4:00 PM to 11:59 PM | 0 (0.0%) | 0 (0.0%) |
| Total | 373 (100.0%) | 311 (100.0%) |
Housing Occupancy in North Fork
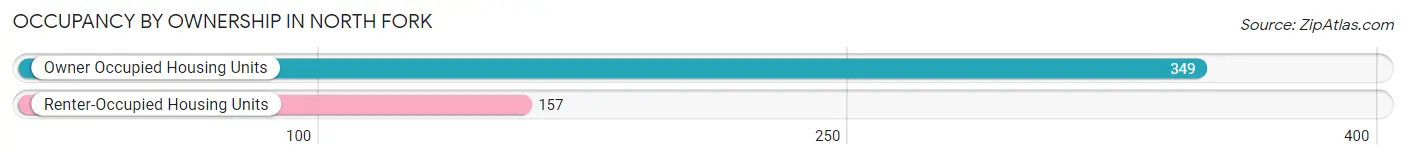
Occupancy by Ownership in North Fork
Of the total 506 dwellings in North Fork, owner-occupied units account for 349 (69.0%), while renter-occupied units make up 157 (31.0%).
| Occupancy | # Housing Units | % Housing Units |
| Owner Occupied Housing Units | 349 | 69.0% |
| Renter-Occupied Housing Units | 157 | 31.0% |
| Total Occupied Housing Units | 506 | 100.0% |
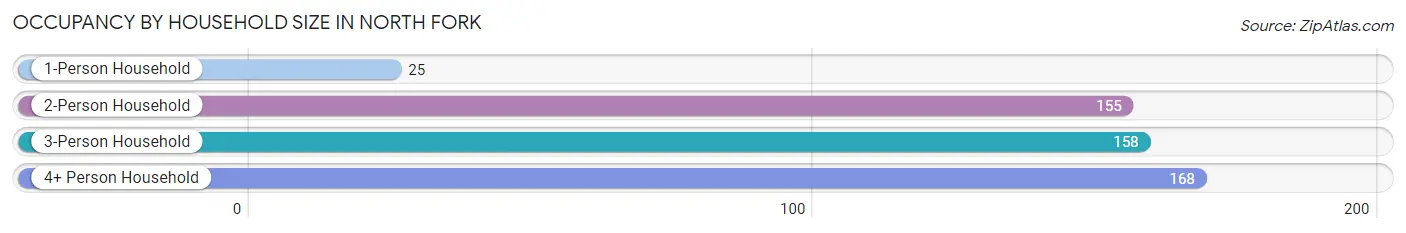
Occupancy by Household Size in North Fork
| Household Size | # Housing Units | % Housing Units |
| 1-Person Household | 25 | 4.9% |
| 2-Person Household | 155 | 30.6% |
| 3-Person Household | 158 | 31.2% |
| 4+ Person Household | 168 | 33.2% |
| Total Housing Units | 506 | 100.0% |
Occupancy by Ownership by Household Size in North Fork

| Household Size | Owner-occupied | Renter-occupied |
| 1-Person Household | 0 (0.0%) | 25 (100.0%) |
| 2-Person Household | 99 (63.9%) | 56 (36.1%) |
| 3-Person Household | 118 (74.7%) | 40 (25.3%) |
| 4+ Person Household | 132 (78.6%) | 36 (21.4%) |
| Total Housing Units | 349 (69.0%) | 157 (31.0%) |
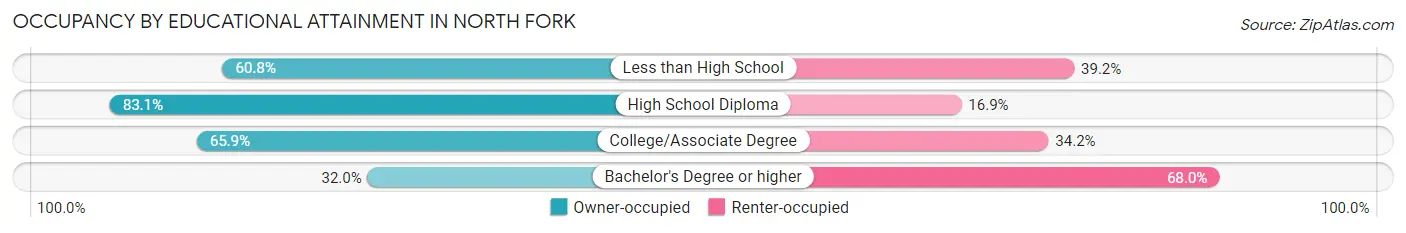
Occupancy by Educational Attainment in North Fork
| Household Size | Owner-occupied | Renter-occupied |
| Less than High School | 48 (60.8%) | 31 (39.2%) |
| High School Diploma | 177 (83.1%) | 36 (16.9%) |
| College/Associate Degree | 108 (65.8%) | 56 (34.2%) |
| Bachelor's Degree or higher | 16 (32.0%) | 34 (68.0%) |
Occupancy by Age of Householder in North Fork
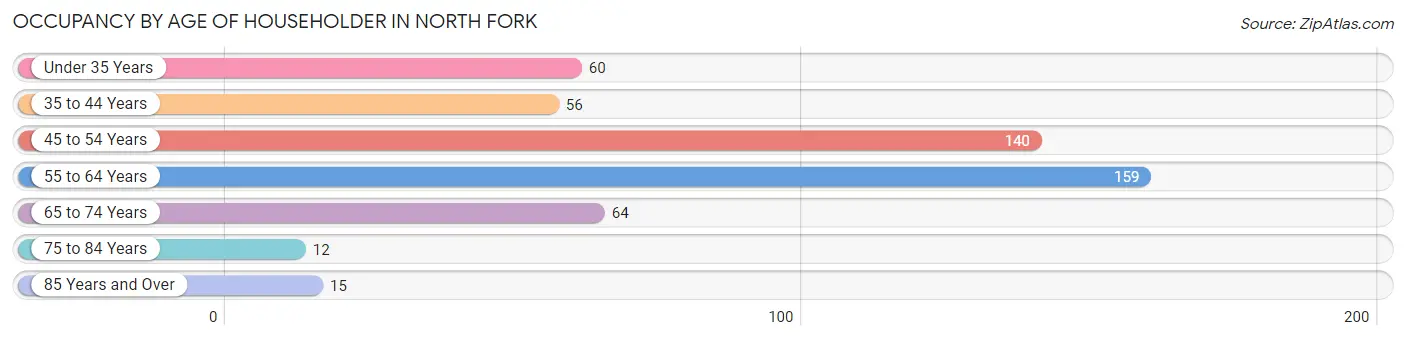
| Age Bracket | # Households | % Households |
| Under 35 Years | 60 | 11.9% |
| 35 to 44 Years | 56 | 11.1% |
| 45 to 54 Years | 140 | 27.7% |
| 55 to 64 Years | 159 | 31.4% |
| 65 to 74 Years | 64 | 12.7% |
| 75 to 84 Years | 12 | 2.4% |
| 85 Years and Over | 15 | 3.0% |
| Total | 506 | 100.0% |
Housing Finances in North Fork
Median Income by Occupancy in North Fork
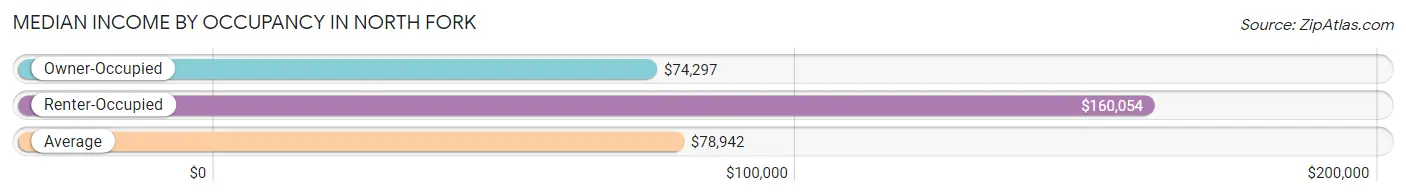
| Occupancy Type | # Households | Median Income |
| Owner-Occupied | 349 (69.0%) | $74,297 |
| Renter-Occupied | 157 (31.0%) | $160,054 |
| Average | 506 (100.0%) | $78,942 |
Occupancy by Householder Income Bracket in North Fork
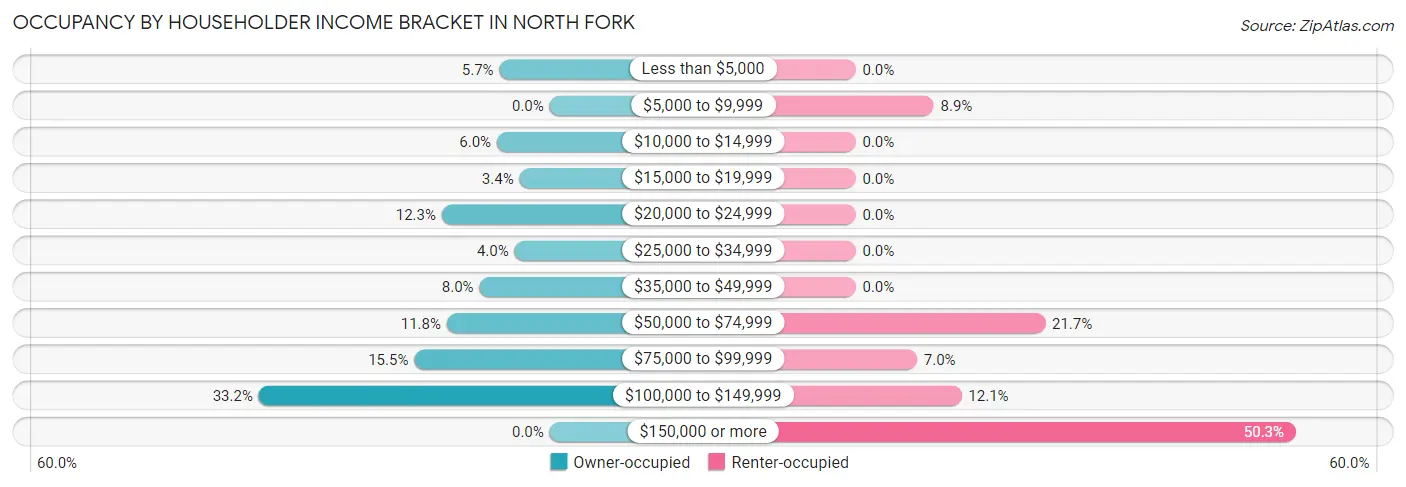
| Income Bracket | Owner-occupied | Renter-occupied |
| Less than $5,000 | 20 (5.7%) | 0 (0.0%) |
| $5,000 to $9,999 | 0 (0.0%) | 14 (8.9%) |
| $10,000 to $14,999 | 21 (6.0%) | 0 (0.0%) |
| $15,000 to $19,999 | 12 (3.4%) | 0 (0.0%) |
| $20,000 to $24,999 | 43 (12.3%) | 0 (0.0%) |
| $25,000 to $34,999 | 14 (4.0%) | 0 (0.0%) |
| $35,000 to $49,999 | 28 (8.0%) | 0 (0.0%) |
| $50,000 to $74,999 | 41 (11.7%) | 34 (21.7%) |
| $75,000 to $99,999 | 54 (15.5%) | 11 (7.0%) |
| $100,000 to $149,999 | 116 (33.2%) | 19 (12.1%) |
| $150,000 or more | 0 (0.0%) | 79 (50.3%) |
| Total | 349 (100.0%) | 157 (100.0%) |
Monthly Housing Cost Tiers in North Fork
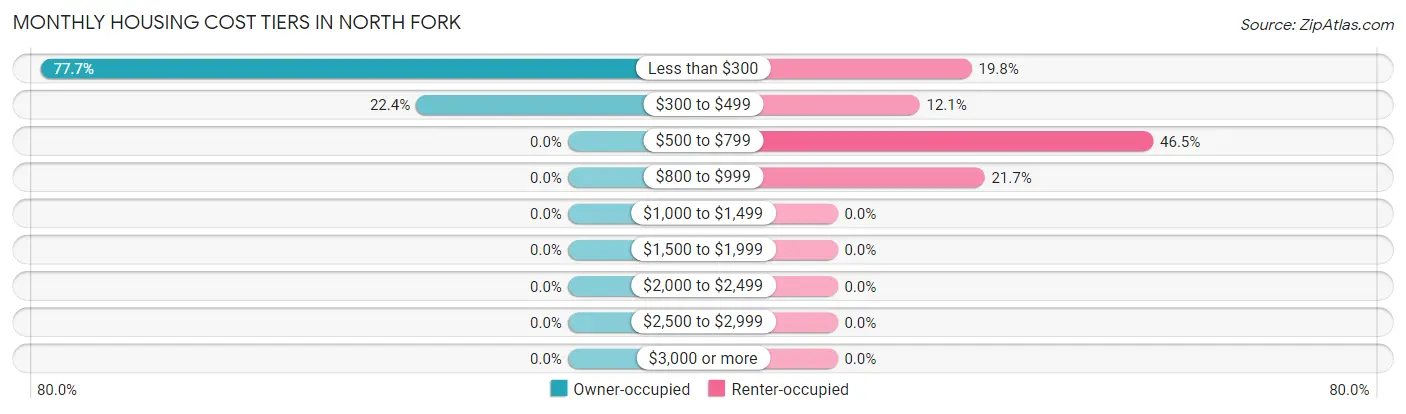
| Monthly Cost | Owner-occupied | Renter-occupied |
| Less than $300 | 271 (77.6%) | 31 (19.8%) |
| $300 to $499 | 78 (22.4%) | 19 (12.1%) |
| $500 to $799 | 0 (0.0%) | 73 (46.5%) |
| $800 to $999 | 0 (0.0%) | 34 (21.7%) |
| $1,000 to $1,499 | 0 (0.0%) | 0 (0.0%) |
| $1,500 to $1,999 | 0 (0.0%) | 0 (0.0%) |
| $2,000 to $2,499 | 0 (0.0%) | 0 (0.0%) |
| $2,500 to $2,999 | 0 (0.0%) | 0 (0.0%) |
| $3,000 or more | 0 (0.0%) | 0 (0.0%) |
| Total | 349 (100.0%) | 157 (100.0%) |
Physical Housing Characteristics in North Fork
Housing Structures in North Fork
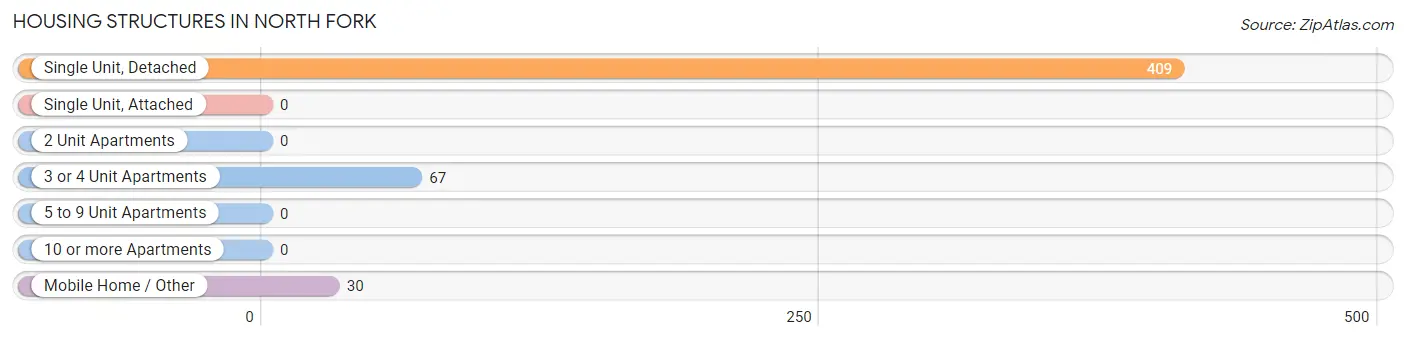
| Structure Type | # Housing Units | % Housing Units |
| Single Unit, Detached | 409 | 80.8% |
| Single Unit, Attached | 0 | 0.0% |
| 2 Unit Apartments | 0 | 0.0% |
| 3 or 4 Unit Apartments | 67 | 13.2% |
| 5 to 9 Unit Apartments | 0 | 0.0% |
| 10 or more Apartments | 0 | 0.0% |
| Mobile Home / Other | 30 | 5.9% |
| Total | 506 | 100.0% |
Housing Structures by Occupancy in North Fork
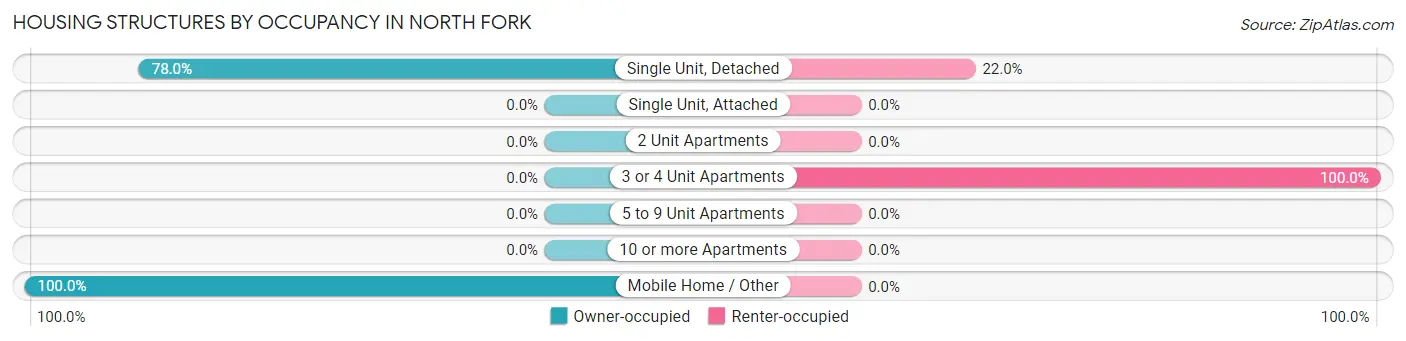
| Structure Type | Owner-occupied | Renter-occupied |
| Single Unit, Detached | 319 (78.0%) | 90 (22.0%) |
| Single Unit, Attached | 0 (0.0%) | 0 (0.0%) |
| 2 Unit Apartments | 0 (0.0%) | 0 (0.0%) |
| 3 or 4 Unit Apartments | 0 (0.0%) | 67 (100.0%) |
| 5 to 9 Unit Apartments | 0 (0.0%) | 0 (0.0%) |
| 10 or more Apartments | 0 (0.0%) | 0 (0.0%) |
| Mobile Home / Other | 30 (100.0%) | 0 (0.0%) |
| Total | 349 (69.0%) | 157 (31.0%) |
Housing Structures by Number of Rooms in North Fork
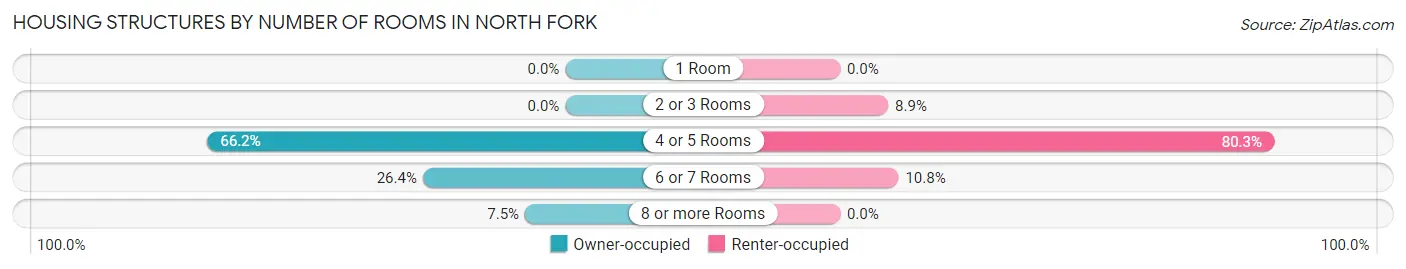
| Number of Rooms | Owner-occupied | Renter-occupied |
| 1 Room | 0 (0.0%) | 0 (0.0%) |
| 2 or 3 Rooms | 0 (0.0%) | 14 (8.9%) |
| 4 or 5 Rooms | 231 (66.2%) | 126 (80.2%) |
| 6 or 7 Rooms | 92 (26.4%) | 17 (10.8%) |
| 8 or more Rooms | 26 (7.4%) | 0 (0.0%) |
| Total | 349 (100.0%) | 157 (100.0%) |
Housing Structure by Heating Type in North Fork
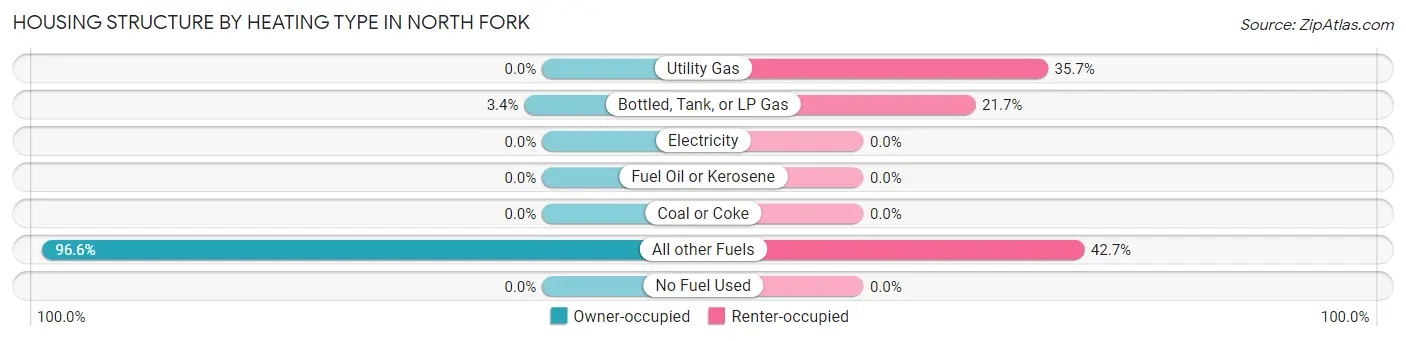
| Heating Type | Owner-occupied | Renter-occupied |
| Utility Gas | 0 (0.0%) | 56 (35.7%) |
| Bottled, Tank, or LP Gas | 12 (3.4%) | 34 (21.7%) |
| Electricity | 0 (0.0%) | 0 (0.0%) |
| Fuel Oil or Kerosene | 0 (0.0%) | 0 (0.0%) |
| Coal or Coke | 0 (0.0%) | 0 (0.0%) |
| All other Fuels | 337 (96.6%) | 67 (42.7%) |
| No Fuel Used | 0 (0.0%) | 0 (0.0%) |
| Total | 349 (100.0%) | 157 (100.0%) |
Household Vehicle Usage in North Fork
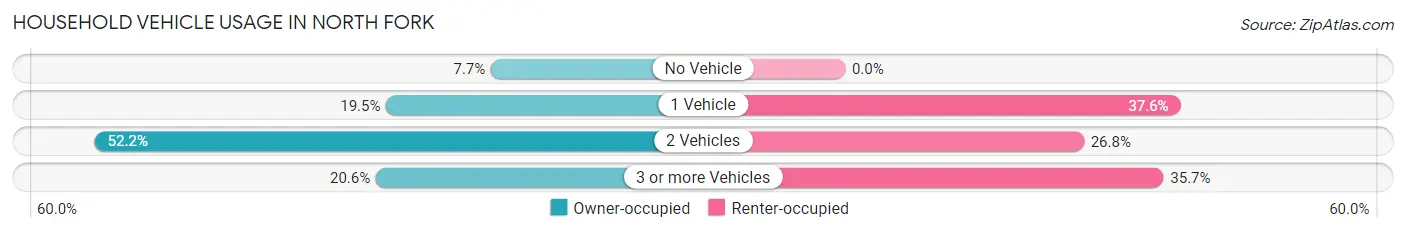
| Vehicles per Household | Owner-occupied | Renter-occupied |
| No Vehicle | 27 (7.7%) | 0 (0.0%) |
| 1 Vehicle | 68 (19.5%) | 59 (37.6%) |
| 2 Vehicles | 182 (52.1%) | 42 (26.8%) |
| 3 or more Vehicles | 72 (20.6%) | 56 (35.7%) |
| Total | 349 (100.0%) | 157 (100.0%) |
Real Estate & Mortgages in North Fork
Real Estate and Mortgage Overview in North Fork
| Characteristic | Without Mortgage | With Mortgage |
| Housing Units | 349 | 0 |
| Median Property Value | $81,500 | $0 |
| Median Household Income | $74,297 | $0 |
| Monthly Housing Costs | $244 | $0 |
| Real Estate Taxes | - | - |
Property Value by Mortgage Status in North Fork
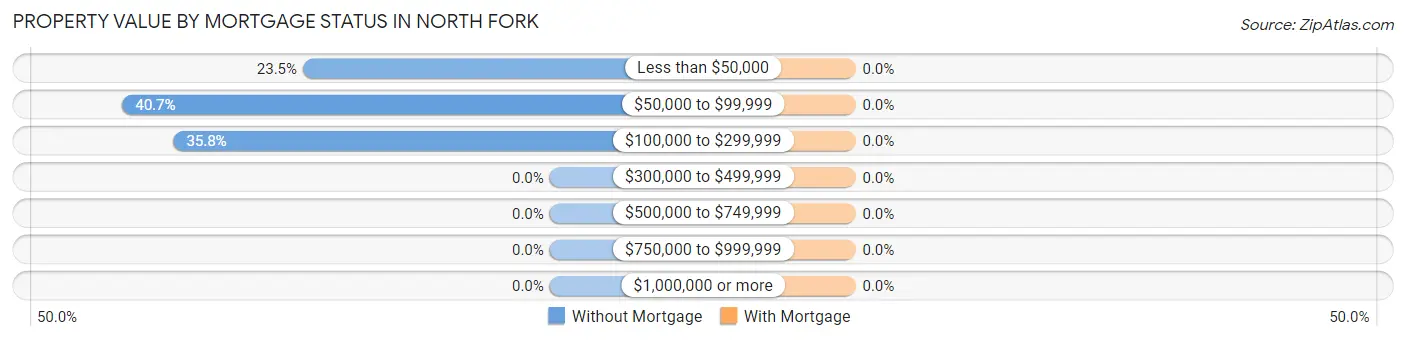
| Property Value | Without Mortgage | With Mortgage |
| Less than $50,000 | 82 (23.5%) | 0 (0.0%) |
| $50,000 to $99,999 | 142 (40.7%) | 0 (0.0%) |
| $100,000 to $299,999 | 125 (35.8%) | 0 (0.0%) |
| $300,000 to $499,999 | 0 (0.0%) | 0 (0.0%) |
| $500,000 to $749,999 | 0 (0.0%) | 0 (0.0%) |
| $750,000 to $999,999 | 0 (0.0%) | 0 (0.0%) |
| $1,000,000 or more | 0 (0.0%) | 0 (0.0%) |
| Total | 349 (100.0%) | 0 (0.0%) |
Household Income by Mortgage Status in North Fork
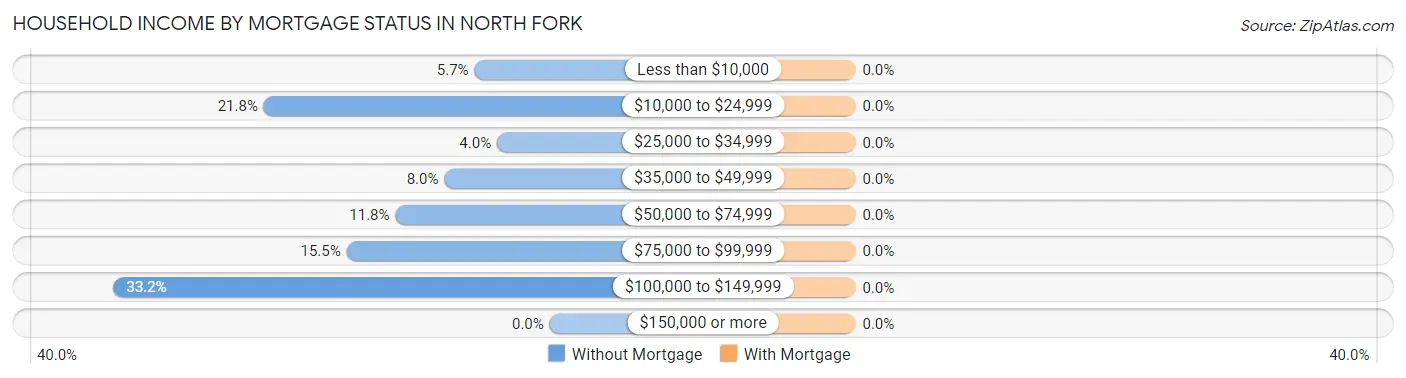
| Household Income | Without Mortgage | With Mortgage |
| Less than $10,000 | 20 (5.7%) | 0 (0.0%) |
| $10,000 to $24,999 | 76 (21.8%) | 0 (0.0%) |
| $25,000 to $34,999 | 14 (4.0%) | 0 (0.0%) |
| $35,000 to $49,999 | 28 (8.0%) | 0 (0.0%) |
| $50,000 to $74,999 | 41 (11.7%) | 0 (0.0%) |
| $75,000 to $99,999 | 54 (15.5%) | 0 (0.0%) |
| $100,000 to $149,999 | 116 (33.2%) | 0 (0.0%) |
| $150,000 or more | 0 (0.0%) | 0 (0.0%) |
| Total | 349 (100.0%) | 0 (0.0%) |
Property Value to Household Income Ratio in North Fork
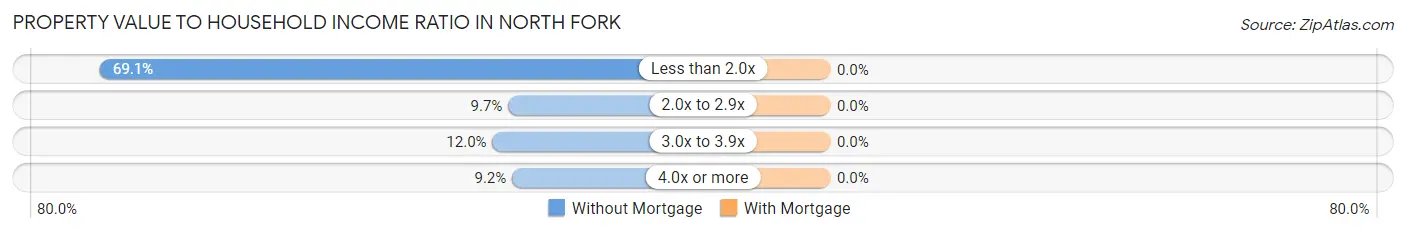
| Value-to-Income Ratio | Without Mortgage | With Mortgage |
| Less than 2.0x | 241 (69.1%) | 0 (0.0%) |
| 2.0x to 2.9x | 34 (9.7%) | 0 (0.0%) |
| 3.0x to 3.9x | 42 (12.0%) | 0 (0.0%) |
| 4.0x or more | 32 (9.2%) | 0 (0.0%) |
| Total | 349 (100.0%) | 0 (0.0%) |
Real Estate Taxes by Mortgage Status in North Fork
| Property Taxes | Without Mortgage | With Mortgage |
| Less than $800 | 0 (0.0%) | 0 (0.0%) |
| $800 to $1,499 | 0 (0.0%) | 0 (0.0%) |
| $800 to $1,499 | 0 (0.0%) | 0 (0.0%) |
| Total | 349 (100.0%) | 0 (0.0%) |
Health & Disability in North Fork
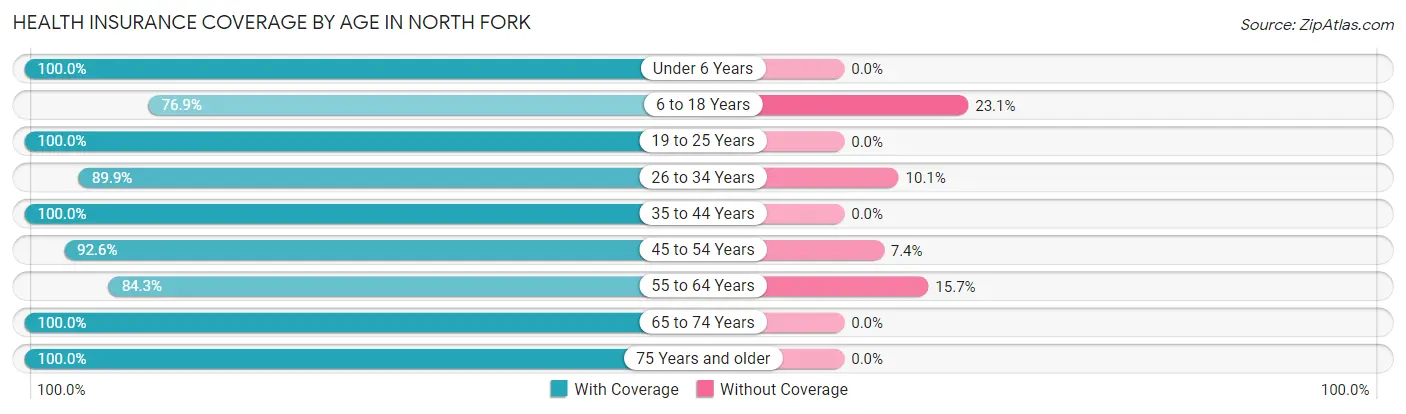
Health Insurance Coverage by Age in North Fork
| Age Bracket | With Coverage | Without Coverage |
| Under 6 Years | 88 (100.0%) | 0 (0.0%) |
| 6 to 18 Years | 226 (76.9%) | 68 (23.1%) |
| 19 to 25 Years | 147 (100.0%) | 0 (0.0%) |
| 26 to 34 Years | 213 (89.9%) | 24 (10.1%) |
| 35 to 44 Years | 161 (100.0%) | 0 (0.0%) |
| 45 to 54 Years | 277 (92.6%) | 22 (7.4%) |
| 55 to 64 Years | 258 (84.3%) | 48 (15.7%) |
| 65 to 74 Years | 118 (100.0%) | 0 (0.0%) |
| 75 Years and older | 39 (100.0%) | 0 (0.0%) |
| Total | 1,527 (90.4%) | 162 (9.6%) |
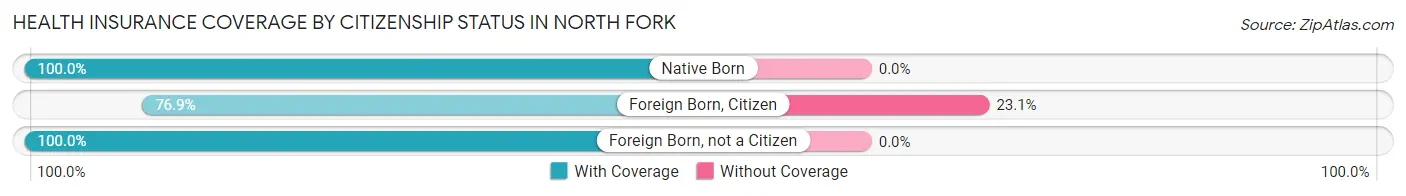
Health Insurance Coverage by Citizenship Status in North Fork
| Citizenship Status | With Coverage | Without Coverage |
| Native Born | 88 (100.0%) | 0 (0.0%) |
| Foreign Born, Citizen | 226 (76.9%) | 68 (23.1%) |
| Foreign Born, not a Citizen | 147 (100.0%) | 0 (0.0%) |
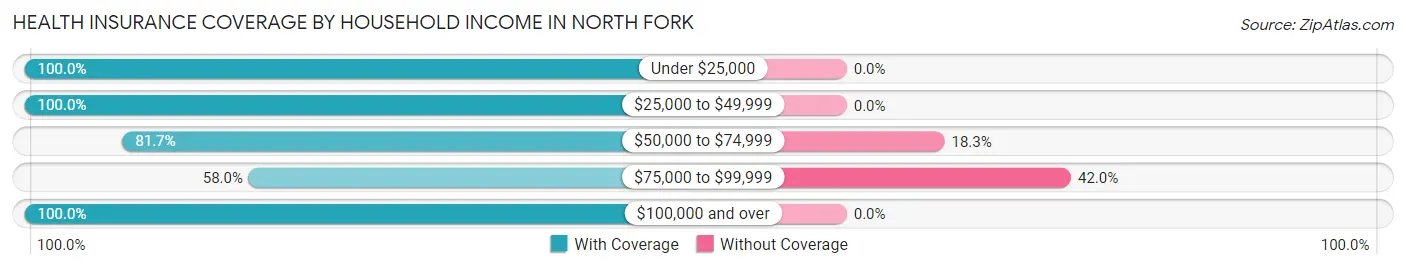
Health Insurance Coverage by Household Income in North Fork
| Household Income | With Coverage | Without Coverage |
| Under $25,000 | 240 (100.0%) | 0 (0.0%) |
| $25,000 to $49,999 | 155 (100.0%) | 0 (0.0%) |
| $50,000 to $74,999 | 312 (81.7%) | 70 (18.3%) |
| $75,000 to $99,999 | 127 (58.0%) | 92 (42.0%) |
| $100,000 and over | 693 (100.0%) | 0 (0.0%) |
Public vs Private Health Insurance Coverage by Age in North Fork
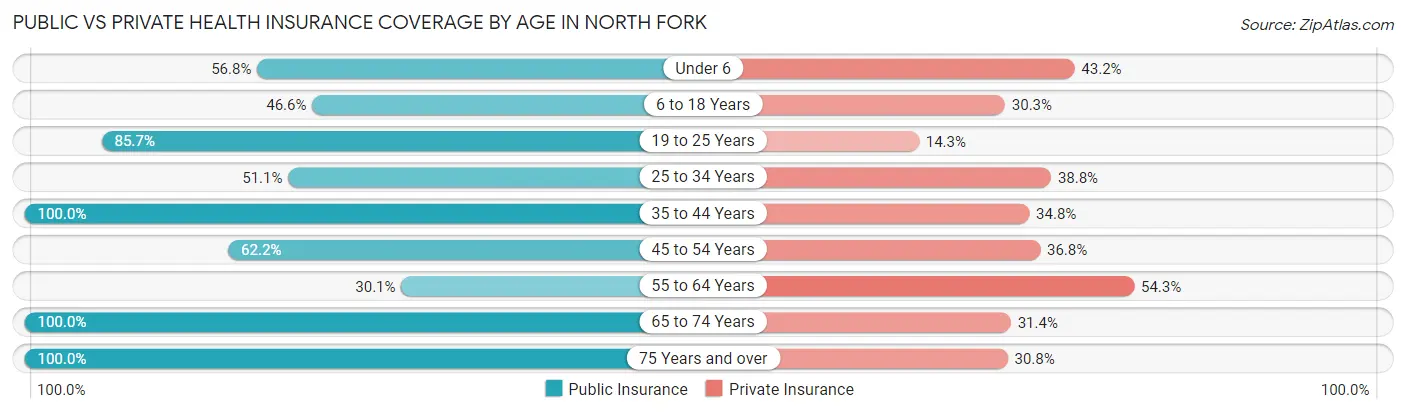
| Age Bracket | Public Insurance | Private Insurance |
| Under 6 | 50 (56.8%) | 38 (43.2%) |
| 6 to 18 Years | 137 (46.6%) | 89 (30.3%) |
| 19 to 25 Years | 126 (85.7%) | 21 (14.3%) |
| 25 to 34 Years | 121 (51.0%) | 92 (38.8%) |
| 35 to 44 Years | 161 (100.0%) | 56 (34.8%) |
| 45 to 54 Years | 186 (62.2%) | 110 (36.8%) |
| 55 to 64 Years | 92 (30.1%) | 166 (54.2%) |
| 65 to 74 Years | 118 (100.0%) | 37 (31.4%) |
| 75 Years and over | 39 (100.0%) | 12 (30.8%) |
| Total | 1,030 (61.0%) | 621 (36.8%) |
Disability Status by Sex by Age in North Fork
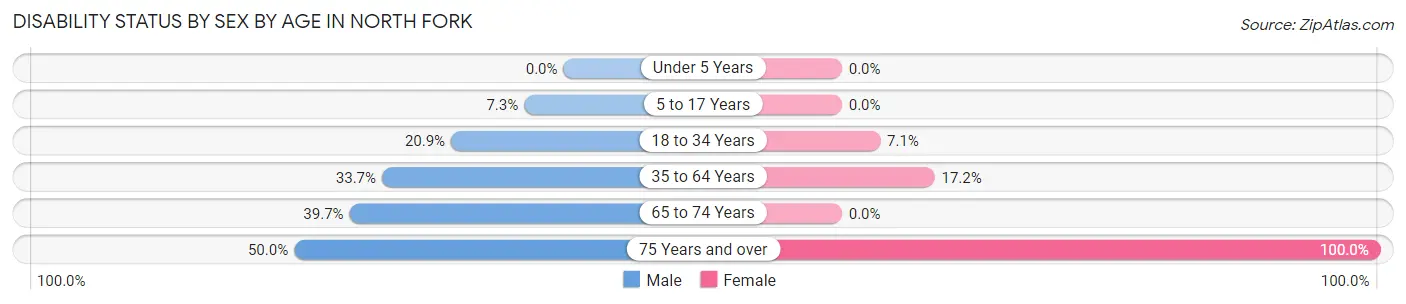
| Age Bracket | Male | Female |
| Under 5 Years | 0 (0.0%) | 0 (0.0%) |
| 5 to 17 Years | 18 (7.3%) | 0 (0.0%) |
| 18 to 34 Years | 39 (20.9%) | 14 (7.1%) |
| 35 to 64 Years | 125 (33.7%) | 68 (17.2%) |
| 65 to 74 Years | 27 (39.7%) | 0 (0.0%) |
| 75 Years and over | 12 (50.0%) | 15 (100.0%) |
Disability Class by Sex by Age in North Fork
Disability Class: Hearing Difficulty
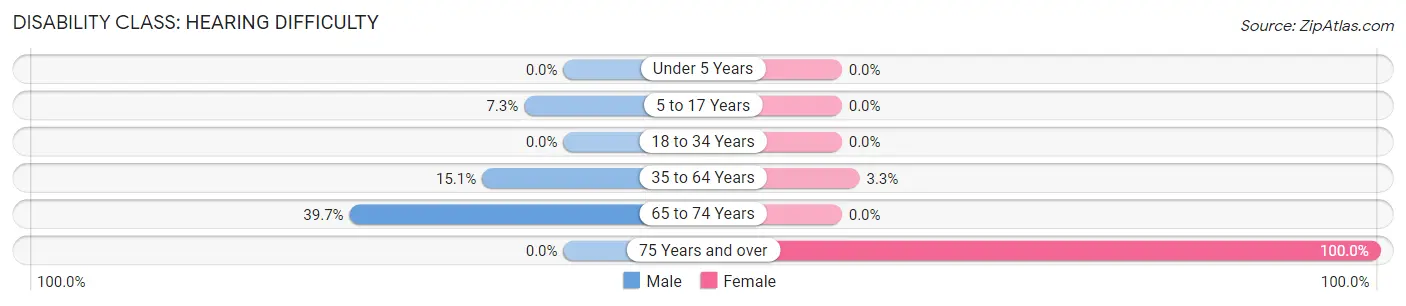
| Age Bracket | Male | Female |
| Under 5 Years | 0 (0.0%) | 0 (0.0%) |
| 5 to 17 Years | 18 (7.3%) | 0 (0.0%) |
| 18 to 34 Years | 0 (0.0%) | 0 (0.0%) |
| 35 to 64 Years | 56 (15.1%) | 13 (3.3%) |
| 65 to 74 Years | 27 (39.7%) | 0 (0.0%) |
| 75 Years and over | 0 (0.0%) | 15 (100.0%) |
Disability Class: Vision Difficulty
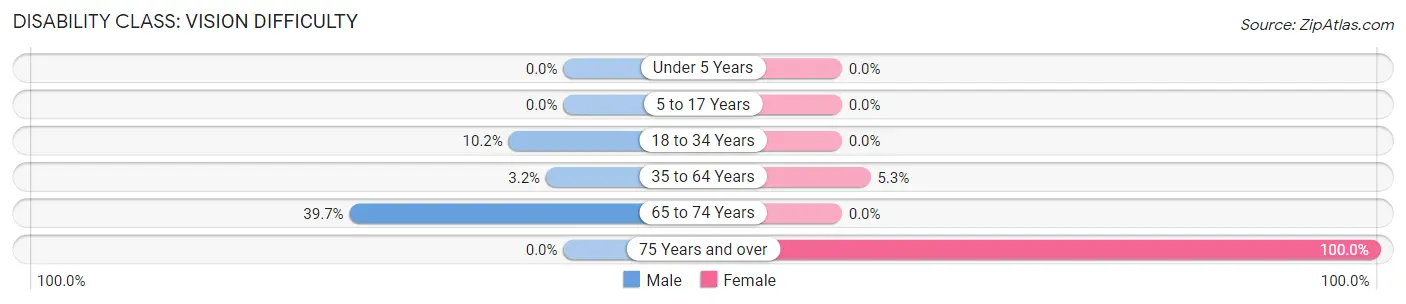
| Age Bracket | Male | Female |
| Under 5 Years | 0 (0.0%) | 0 (0.0%) |
| 5 to 17 Years | 0 (0.0%) | 0 (0.0%) |
| 18 to 34 Years | 19 (10.2%) | 0 (0.0%) |
| 35 to 64 Years | 12 (3.2%) | 21 (5.3%) |
| 65 to 74 Years | 27 (39.7%) | 0 (0.0%) |
| 75 Years and over | 0 (0.0%) | 15 (100.0%) |
Disability Class: Cognitive Difficulty
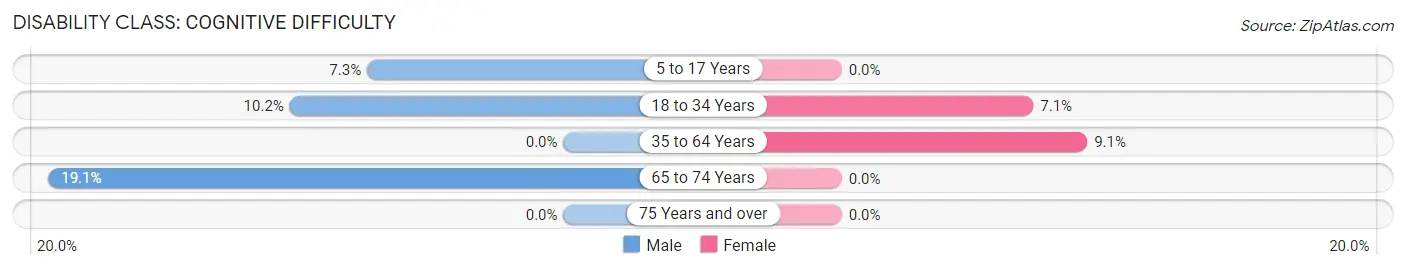
| Age Bracket | Male | Female |
| 5 to 17 Years | 18 (7.3%) | 0 (0.0%) |
| 18 to 34 Years | 19 (10.2%) | 14 (7.1%) |
| 35 to 64 Years | 0 (0.0%) | 36 (9.1%) |
| 65 to 74 Years | 13 (19.1%) | 0 (0.0%) |
| 75 Years and over | 0 (0.0%) | 0 (0.0%) |
Disability Class: Ambulatory Difficulty
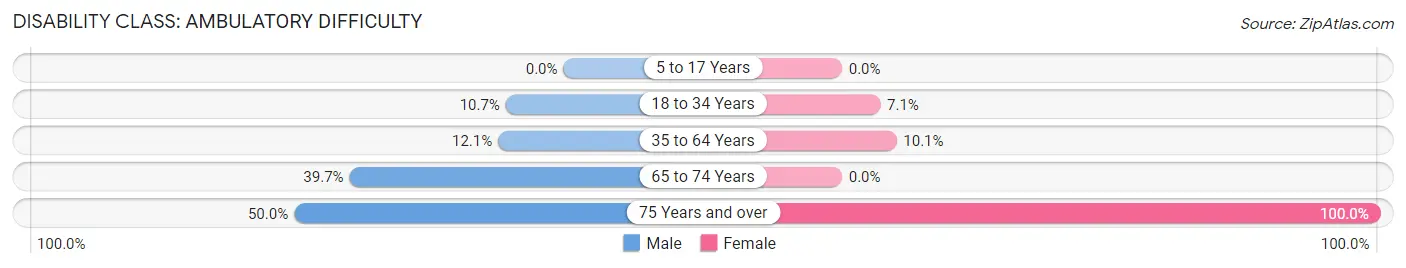
| Age Bracket | Male | Female |
| 5 to 17 Years | 0 (0.0%) | 0 (0.0%) |
| 18 to 34 Years | 20 (10.7%) | 14 (7.1%) |
| 35 to 64 Years | 45 (12.1%) | 40 (10.1%) |
| 65 to 74 Years | 27 (39.7%) | 0 (0.0%) |
| 75 Years and over | 12 (50.0%) | 15 (100.0%) |
Disability Class: Self-Care Difficulty
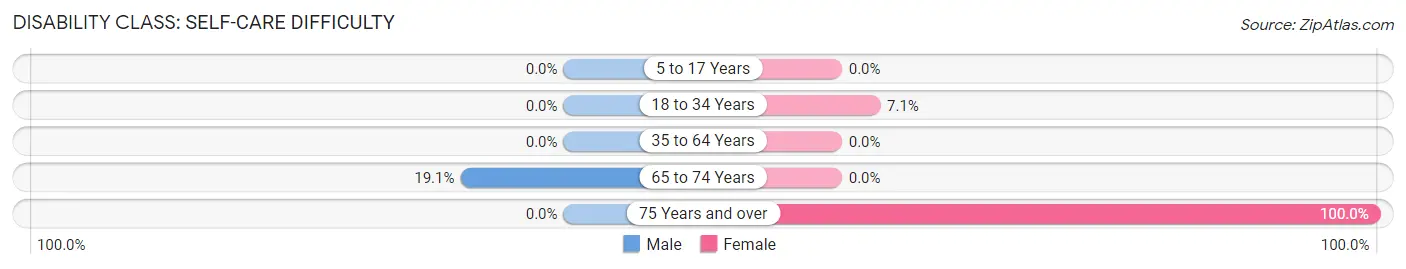
| Age Bracket | Male | Female |
| 5 to 17 Years | 0 (0.0%) | 0 (0.0%) |
| 18 to 34 Years | 0 (0.0%) | 14 (7.1%) |
| 35 to 64 Years | 0 (0.0%) | 0 (0.0%) |
| 65 to 74 Years | 13 (19.1%) | 0 (0.0%) |
| 75 Years and over | 0 (0.0%) | 15 (100.0%) |
Technology Access in North Fork
Computing Device Access in North Fork
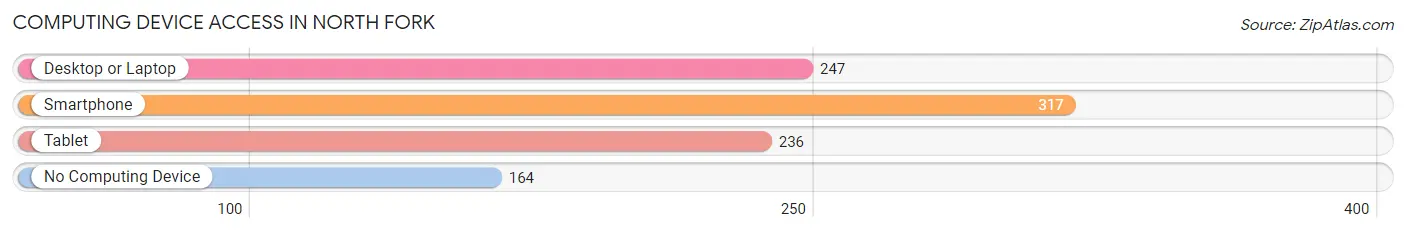
| Device Type | # Households | % Households |
| Desktop or Laptop | 247 | 48.8% |
| Smartphone | 317 | 62.6% |
| Tablet | 236 | 46.6% |
| No Computing Device | 164 | 32.4% |
| Total | 506 | 100.0% |
Internet Access in North Fork
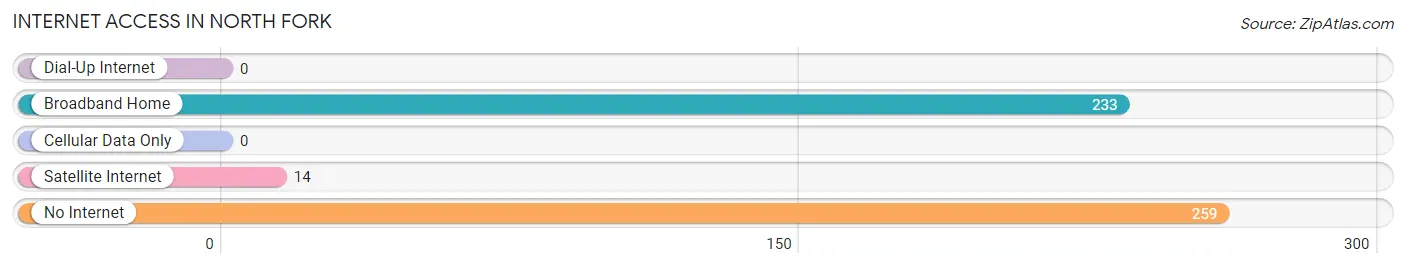
| Internet Type | # Households | % Households |
| Dial-Up Internet | 0 | 0.0% |
| Broadband Home | 233 | 46.1% |
| Cellular Data Only | 0 | 0.0% |
| Satellite Internet | 14 | 2.8% |
| No Internet | 259 | 51.2% |
| Total | 506 | 100.0% |
North Fork Summary
History
North Fork is a small unincorporated community located in Apache County, Arizona. It is situated in the White Mountains of Arizona, approximately 20 miles east of the town of Show Low. The area was first settled in the late 1800s by Mormon pioneers, who established a small farming community. The town was officially established in 1891, and was named after the nearby North Fork of the Little Colorado River.
The town was initially a small farming community, with the main crops being potatoes, corn, and hay. In the early 1900s, the town began to grow as a logging and timber industry developed in the area. The timber industry was the main source of employment for the town until the 1950s, when the industry began to decline.
In the late 1950s, the town began to experience a resurgence in population as the nearby ski resort, Sunrise Park, began to attract tourists and vacationers. The ski resort is now the main source of employment and tourism for the town.
Geography
North Fork is located in the White Mountains of Arizona, approximately 20 miles east of the town of Show Low. The town is situated at an elevation of 6,400 feet, and is surrounded by the Apache-Sitgreaves National Forest. The area is known for its scenic beauty, with the nearby White Mountains providing a stunning backdrop.
The climate in North Fork is generally mild, with temperatures ranging from the mid-30s in the winter to the mid-80s in the summer. The area receives an average of 20 inches of precipitation per year, with most of it falling in the form of snow in the winter months.
Economy
The economy of North Fork is largely based on tourism and recreation. The nearby ski resort, Sunrise Park, is the main source of employment and tourism for the town. The resort offers skiing, snowboarding, and other winter activities, as well as summer activities such as hiking, fishing, and camping.
In addition to the ski resort, the town also has a few small businesses, including a general store, a gas station, and a few restaurants. The town also has a post office and a small library.
Demographics
As of the 2010 census, the population of North Fork was 1,072. The racial makeup of the town was 95.3% White, 0.7% Native American, 0.3% Asian, 0.2% African American, and 3.5% from other races. The median household income was $37,500, and the median age was 44.
Conclusion
North Fork is a small unincorporated community located in Apache County, Arizona. It is situated in the White Mountains of Arizona, approximately 20 miles east of the town of Show Low. The town was first settled in the late 1800s by Mormon pioneers, and was officially established in 1891. The economy of North Fork is largely based on tourism and recreation, with the nearby ski resort, Sunrise Park, being the main source of employment and tourism for the town. As of the 2010 census, the population of North Fork was 1,072. The racial makeup of the town was 95.3% White, 0.7% Native American, 0.3% Asian, 0.2% African American, and 3.5% from other races. The median household income was $37,500, and the median age was 44.
Common Questions
What is Per Capita Income in North Fork?
Per Capita income in North Fork is $26,974.
What is the Median Family Income in North Fork?
Median Family Income in North Fork is $82,734.
What is the Median Household income in North Fork?
Median Household Income in North Fork is $78,942.
What is Income or Wage Gap in North Fork?
Income or Wage Gap in North Fork is 41.3%.
Women in North Fork earn 58.7 cents for every dollar earned by a man.
What is Inequality or Gini Index in North Fork?
Inequality or Gini Index in North Fork is 0.39.
What is the Total Population of North Fork?
Total Population of North Fork is 1,689.
What is the Total Male Population of North Fork?
Total Male Population of North Fork is 944.
What is the Total Female Population of North Fork?
Total Female Population of North Fork is 745.
What is the Ratio of Males per 100 Females in North Fork?
There are 126.71 Males per 100 Females in North Fork.
What is the Ratio of Females per 100 Males in North Fork?
There are 78.92 Females per 100 Males in North Fork.
What is the Median Population Age in North Fork?
Median Population Age in North Fork is 42.9 Years.
What is the Average Family Size in North Fork
Average Family Size in North Fork is 3.5 People.
What is the Average Household Size in North Fork
Average Household Size in North Fork is 3.3 People.
How Large is the Labor Force in North Fork?
There are 778 People in the Labor Forcein in North Fork.
What is the Percentage of People in the Labor Force in North Fork?
55.9% of People are in the Labor Force in North Fork.
What is the Unemployment Rate in North Fork?
Unemployment Rate in North Fork is 9.9%.