Tombstone, AZ Map & Demographics
Tombstone Map
Tombstone Overview
$30,851
PER CAPITA INCOME
$72,083
AVG FAMILY INCOME
$46,667
AVG HOUSEHOLD INCOME
24.0%
WAGE / INCOME GAP [ % ]
76.0¢/ $1
WAGE / INCOME GAP [ $ ]
0.41
INEQUALITY / GINI INDEX
1,046
TOTAL POPULATION
492
MALE POPULATION
554
FEMALE POPULATION
88.81
MALES / 100 FEMALES
112.60
FEMALES / 100 MALES
59.6
MEDIAN AGE
2.6
AVG FAMILY SIZE
2.0
AVG HOUSEHOLD SIZE
417
LABOR FORCE [ PEOPLE ]
44.9%
PERCENT IN LABOR FORCE
2.9%
UNEMPLOYMENT RATE
Tombstone Zip Codes
Tombstone Area Codes
Income in Tombstone
Income Overview in Tombstone
Per Capita Income in Tombstone is $30,851, while median incomes of families and households are $72,083 and $46,667 respectively.
| Characteristic | Number | Measure |
| Per Capita Income | 1,046 | $30,851 |
| Median Family Income | 277 | $72,083 |
| Mean Family Income | 277 | $80,926 |
| Median Household Income | 526 | $46,667 |
| Mean Household Income | 526 | $60,230 |
| Income Deficit | 277 | $0 |
| Wage / Income Gap (%) | 1,046 | 24.03% |
| Wage / Income Gap ($) | 1,046 | 75.97¢ per $1 |
| Gini / Inequality Index | 1,046 | 0.41 |
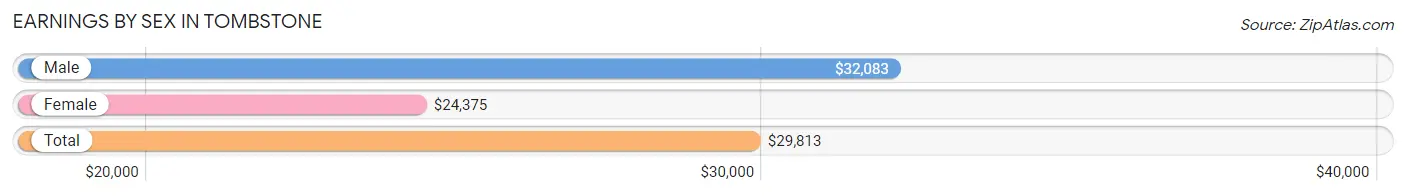
Earnings by Sex in Tombstone
Average Earnings in Tombstone are $29,813, $32,083 for men and $24,375 for women, a difference of 24.0%.
| Sex | Number | Average Earnings |
| Male | 194 (44.2%) | $32,083 |
| Female | 245 (55.8%) | $24,375 |
| Total | 439 (100.0%) | $29,813 |
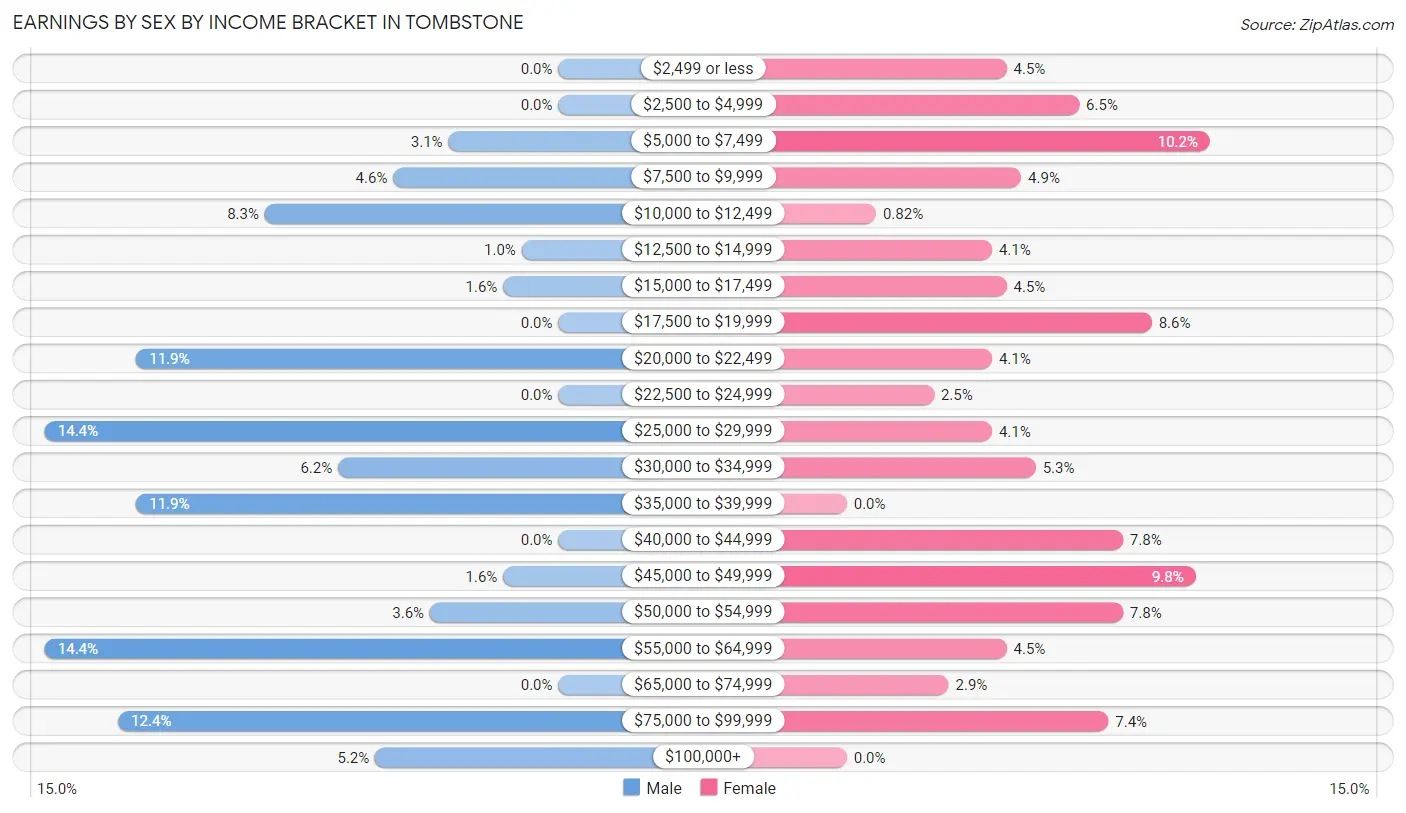
Earnings by Sex by Income Bracket in Tombstone
The most common earnings brackets in Tombstone are $25,000 to $29,999 for men (28 | 14.4%) and $5,000 to $7,499 for women (25 | 10.2%).
| Income | Male | Female |
| $2,499 or less | 0 (0.0%) | 11 (4.5%) |
| $2,500 to $4,999 | 0 (0.0%) | 16 (6.5%) |
| $5,000 to $7,499 | 6 (3.1%) | 25 (10.2%) |
| $7,500 to $9,999 | 9 (4.6%) | 12 (4.9%) |
| $10,000 to $12,499 | 16 (8.3%) | 2 (0.8%) |
| $12,500 to $14,999 | 2 (1.0%) | 10 (4.1%) |
| $15,000 to $17,499 | 3 (1.5%) | 11 (4.5%) |
| $17,500 to $19,999 | 0 (0.0%) | 21 (8.6%) |
| $20,000 to $22,499 | 23 (11.9%) | 10 (4.1%) |
| $22,500 to $24,999 | 0 (0.0%) | 6 (2.5%) |
| $25,000 to $29,999 | 28 (14.4%) | 10 (4.1%) |
| $30,000 to $34,999 | 12 (6.2%) | 13 (5.3%) |
| $35,000 to $39,999 | 23 (11.9%) | 0 (0.0%) |
| $40,000 to $44,999 | 0 (0.0%) | 19 (7.8%) |
| $45,000 to $49,999 | 3 (1.5%) | 24 (9.8%) |
| $50,000 to $54,999 | 7 (3.6%) | 19 (7.8%) |
| $55,000 to $64,999 | 28 (14.4%) | 11 (4.5%) |
| $65,000 to $74,999 | 0 (0.0%) | 7 (2.9%) |
| $75,000 to $99,999 | 24 (12.4%) | 18 (7.3%) |
| $100,000+ | 10 (5.1%) | 0 (0.0%) |
| Total | 194 (100.0%) | 245 (100.0%) |
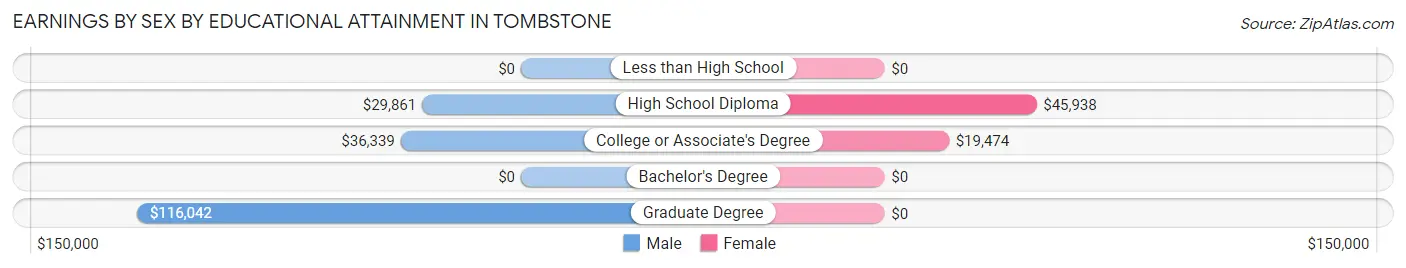
Earnings by Sex by Educational Attainment in Tombstone
Average earnings in Tombstone are $36,071 for men and $22,917 for women, a difference of 36.5%. Men with an educational attainment of graduate degree enjoy the highest average annual earnings of $116,042, while those with high school diploma education earn the least with $29,861. Women with an educational attainment of high school diploma earn the most with the average annual earnings of $45,938, while those with college or associate's degree education have the smallest earnings of $19,474.
| Educational Attainment | Male Income | Female Income |
| Less than High School | - | - |
| High School Diploma | $29,861 | $45,938 |
| College or Associate's Degree | $36,339 | $19,474 |
| Bachelor's Degree | - | - |
| Graduate Degree | $116,042 | $0 |
| Total | $36,071 | $22,917 |
Family Income in Tombstone
Family Income Brackets in Tombstone
According to the Tombstone family income data, there are 66 families falling into the $50,000 to $74,999 income range, which is the most common income bracket and makes up 23.8% of all families.
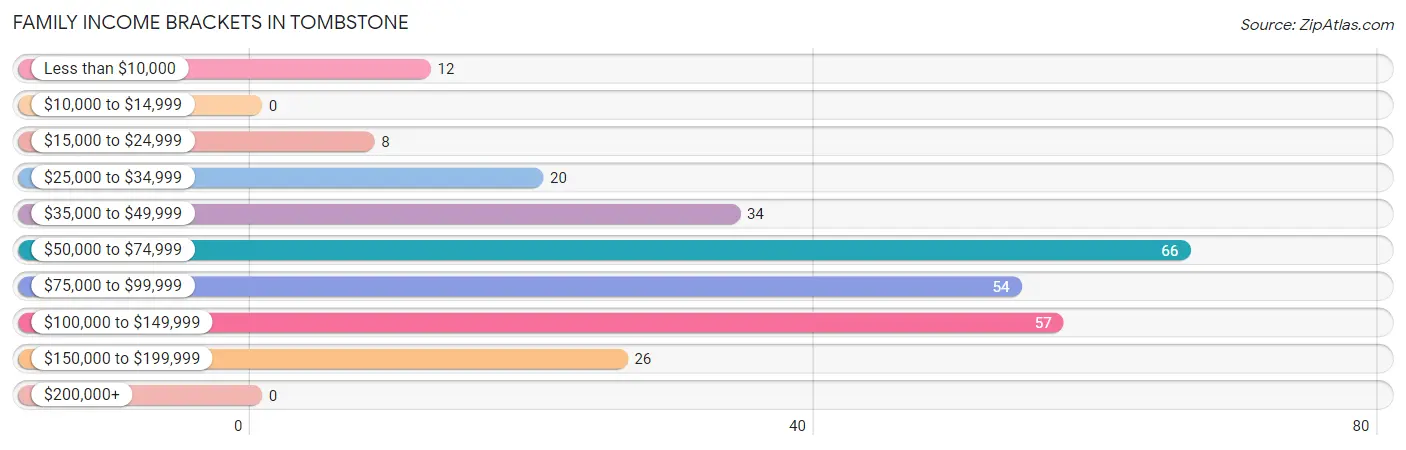
| Income Bracket | # Families | % Families |
| Less than $10,000 | 12 | 4.3% |
| $10,000 to $14,999 | 0 | 0.0% |
| $15,000 to $24,999 | 8 | 2.9% |
| $25,000 to $34,999 | 20 | 7.2% |
| $35,000 to $49,999 | 34 | 12.3% |
| $50,000 to $74,999 | 66 | 23.8% |
| $75,000 to $99,999 | 54 | 19.5% |
| $100,000 to $149,999 | 57 | 20.6% |
| $150,000 to $199,999 | 26 | 9.4% |
| $200,000+ | 0 | 0.0% |
Family Income by Famaliy Size in Tombstone
5-person families (35 | 12.6%) account for the highest median family income in Tombstone with $118,750 per family, while 2-person families (196 | 70.8%) have the highest median income of $32,000 per family member.
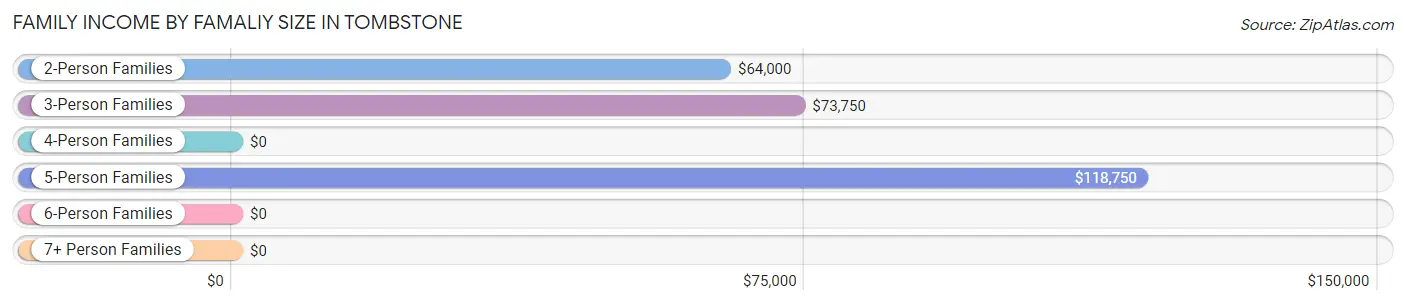
| Income Bracket | # Families | Median Income |
| 2-Person Families | 196 (70.8%) | $64,000 |
| 3-Person Families | 44 (15.9%) | $73,750 |
| 4-Person Families | 0 (0.0%) | $0 |
| 5-Person Families | 35 (12.6%) | $118,750 |
| 6-Person Families | 0 (0.0%) | $0 |
| 7+ Person Families | 2 (0.7%) | $0 |
| Total | 277 (100.0%) | $72,083 |
Family Income by Number of Earners in Tombstone
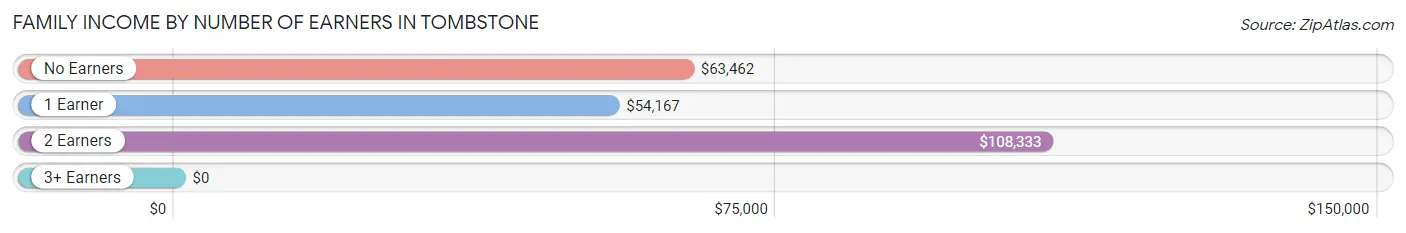
| Number of Earners | # Families | Median Income |
| No Earners | 118 (42.6%) | $63,462 |
| 1 Earner | 60 (21.7%) | $54,167 |
| 2 Earners | 80 (28.9%) | $108,333 |
| 3+ Earners | 19 (6.9%) | $0 |
| Total | 277 (100.0%) | $72,083 |
Household Income in Tombstone
Household Income Brackets in Tombstone
With 104 households falling in the category, the $50,000 to $74,999 income range is the most frequent in Tombstone, accounting for 19.8% of all households.
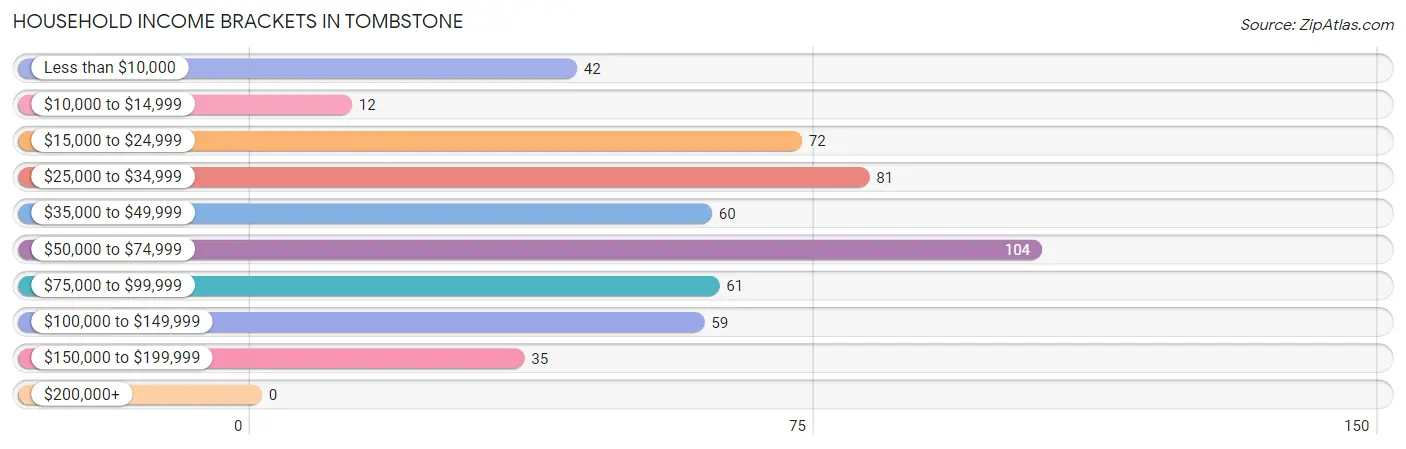
| Income Bracket | # Households | % Households |
| Less than $10,000 | 42 | 8.0% |
| $10,000 to $14,999 | 12 | 2.3% |
| $15,000 to $24,999 | 72 | 13.7% |
| $25,000 to $34,999 | 81 | 15.4% |
| $35,000 to $49,999 | 60 | 11.4% |
| $50,000 to $74,999 | 104 | 19.8% |
| $75,000 to $99,999 | 61 | 11.6% |
| $100,000 to $149,999 | 59 | 11.2% |
| $150,000 to $199,999 | 35 | 6.7% |
| $200,000+ | 0 | 0.0% |
Household Income by Householder Age in Tombstone
The median household income in Tombstone is $46,667, with the highest median household income of $41,667 found in the 65+ years age bracket for the primary householder. A total of 310 households (58.9%) fall into this category. Meanwhile, the 15 to 24 years age bracket for the primary householder has the lowest median household income of $0, with 7 households (1.3%) in this group.
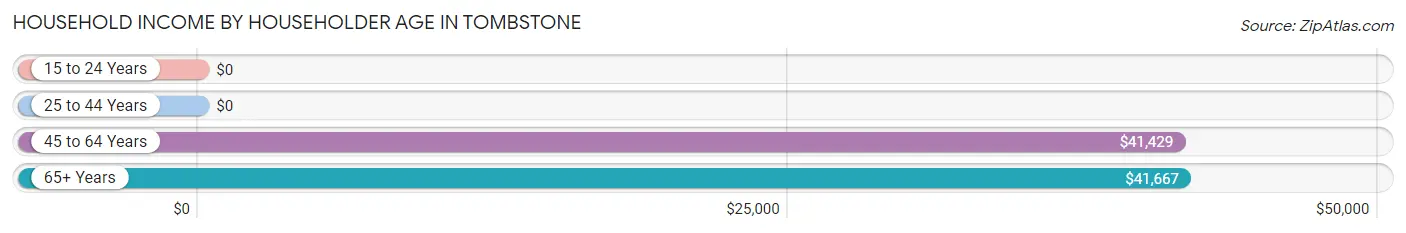
| Income Bracket | # Households | Median Income |
| 15 to 24 Years | 7 (1.3%) | $0 |
| 25 to 44 Years | 75 (14.3%) | $0 |
| 45 to 64 Years | 134 (25.5%) | $41,429 |
| 65+ Years | 310 (58.9%) | $41,667 |
| Total | 526 (100.0%) | $46,667 |
Poverty in Tombstone
Income Below Poverty by Sex and Age in Tombstone
With 10.2% poverty level for males and 9.8% for females among the residents of Tombstone, 15 year old males and 35 to 44 year old females are the most vulnerable to poverty, with 10 males (100.0%) and 12 females (21.8%) in their respective age groups living below the poverty level.
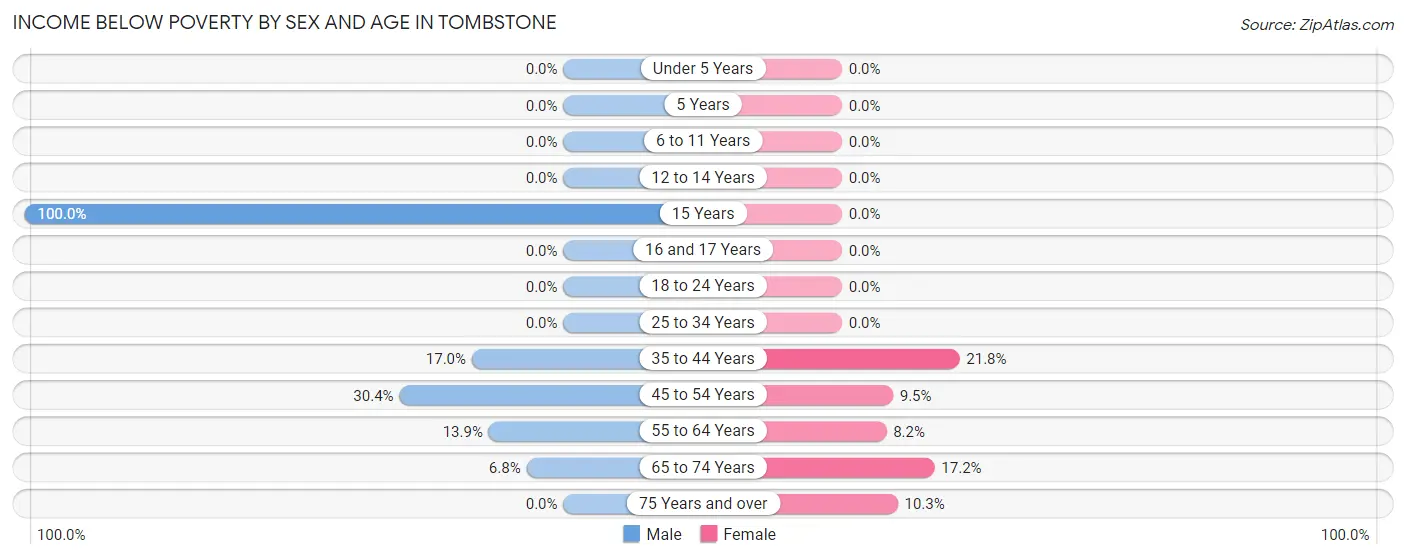
| Age Bracket | Male | Female |
| Under 5 Years | 0 (0.0%) | 0 (0.0%) |
| 5 Years | 0 (0.0%) | 0 (0.0%) |
| 6 to 11 Years | 0 (0.0%) | 0 (0.0%) |
| 12 to 14 Years | 0 (0.0%) | 0 (0.0%) |
| 15 Years | 10 (100.0%) | 0 (0.0%) |
| 16 and 17 Years | 0 (0.0%) | 0 (0.0%) |
| 18 to 24 Years | 0 (0.0%) | 0 (0.0%) |
| 25 to 34 Years | 0 (0.0%) | 0 (0.0%) |
| 35 to 44 Years | 9 (17.0%) | 12 (21.8%) |
| 45 to 54 Years | 14 (30.4%) | 7 (9.5%) |
| 55 to 64 Years | 9 (13.9%) | 7 (8.2%) |
| 65 to 74 Years | 8 (6.8%) | 22 (17.2%) |
| 75 Years and over | 0 (0.0%) | 6 (10.3%) |
| Total | 50 (10.2%) | 54 (9.8%) |
Income Above Poverty by Sex and Age in Tombstone
According to the poverty statistics in Tombstone, males aged under 5 years and females aged under 5 years are the age groups that are most secure financially, with 100.0% of males and 100.0% of females in these age groups living above the poverty line.
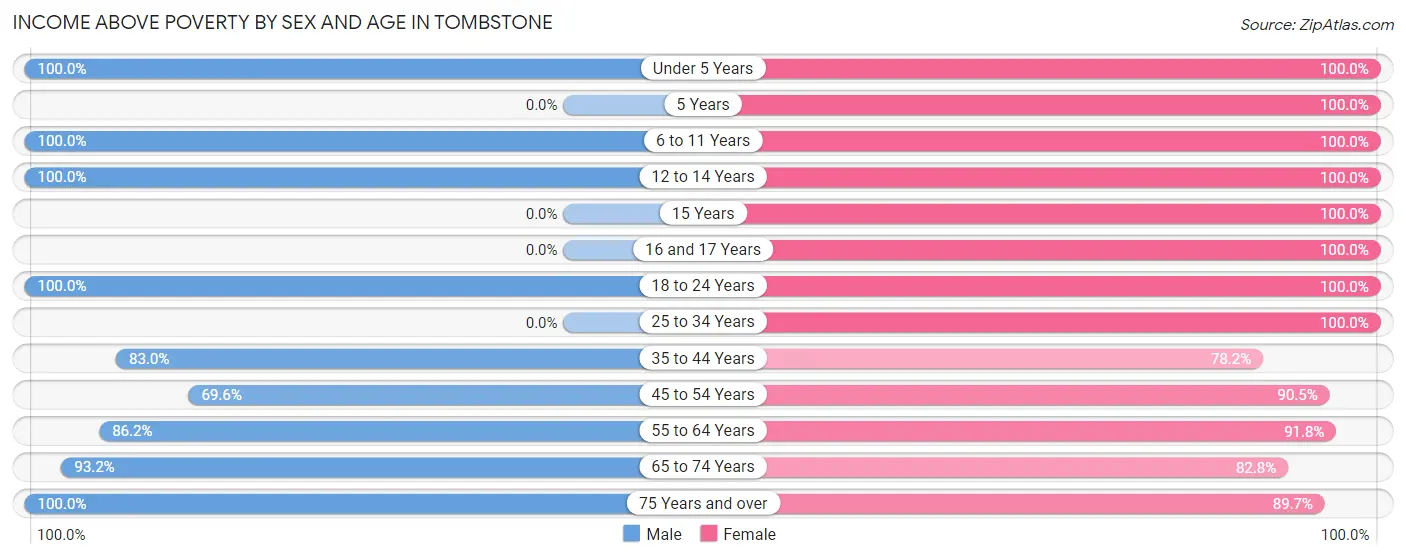
| Age Bracket | Male | Female |
| Under 5 Years | 11 (100.0%) | 13 (100.0%) |
| 5 Years | 0 (0.0%) | 19 (100.0%) |
| 6 to 11 Years | 18 (100.0%) | 28 (100.0%) |
| 12 to 14 Years | 9 (100.0%) | 8 (100.0%) |
| 15 Years | 0 (0.0%) | 2 (100.0%) |
| 16 and 17 Years | 0 (0.0%) | 15 (100.0%) |
| 18 to 24 Years | 24 (100.0%) | 29 (100.0%) |
| 25 to 34 Years | 0 (0.0%) | 40 (100.0%) |
| 35 to 44 Years | 44 (83.0%) | 43 (78.2%) |
| 45 to 54 Years | 32 (69.6%) | 67 (90.5%) |
| 55 to 64 Years | 56 (86.2%) | 78 (91.8%) |
| 65 to 74 Years | 109 (93.2%) | 106 (82.8%) |
| 75 Years and over | 139 (100.0%) | 52 (89.7%) |
| Total | 442 (89.8%) | 500 (90.2%) |
Income Below Poverty Among Married-Couple Families in Tombstone
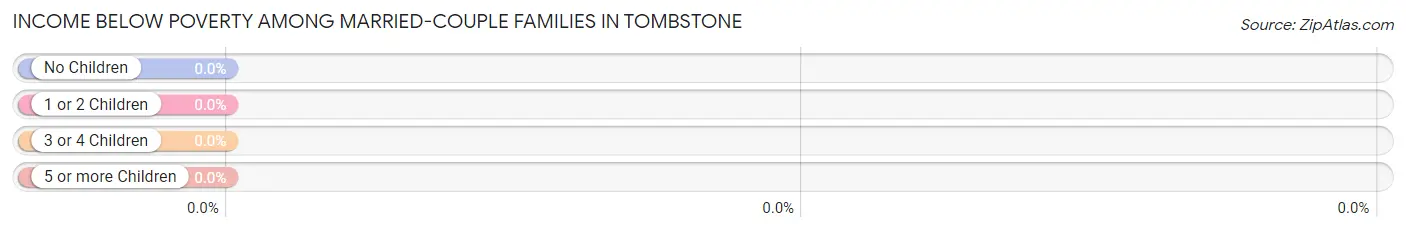
| Children | Above Poverty | Below Poverty |
| No Children | 194 (100.0%) | 0 (0.0%) |
| 1 or 2 Children | 23 (100.0%) | 0 (0.0%) |
| 3 or 4 Children | 18 (100.0%) | 0 (0.0%) |
| 5 or more Children | 0 (0.0%) | 0 (0.0%) |
| Total | 235 (100.0%) | 0 (0.0%) |
Income Below Poverty Among Single-Parent Households in Tombstone
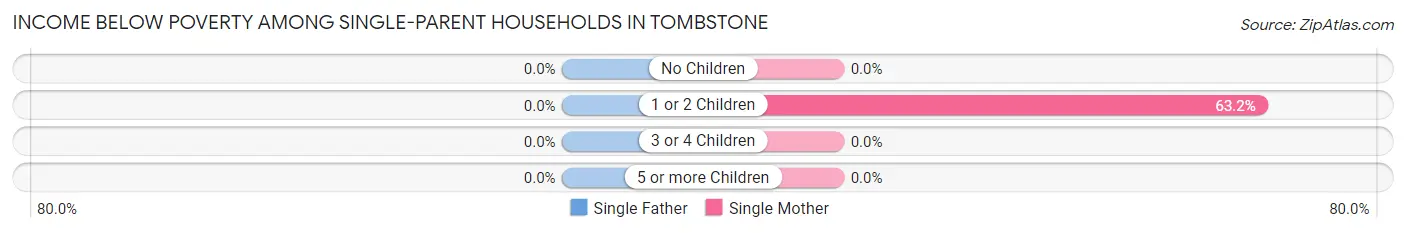
| Children | Single Father | Single Mother |
| No Children | 0 (0.0%) | 0 (0.0%) |
| 1 or 2 Children | 0 (0.0%) | 12 (63.2%) |
| 3 or 4 Children | 0 (0.0%) | 0 (0.0%) |
| 5 or more Children | 0 (0.0%) | 0 (0.0%) |
| Total | 0 (0.0%) | 12 (48.0%) |
Income Below Poverty Among Married-Couple vs Single-Parent Households in Tombstone
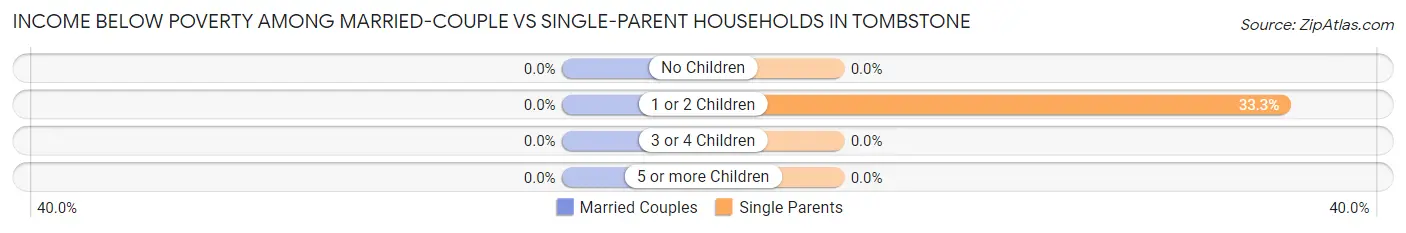
| Children | Married-Couple Families | Single-Parent Households |
| No Children | 0 (0.0%) | 0 (0.0%) |
| 1 or 2 Children | 0 (0.0%) | 12 (33.3%) |
| 3 or 4 Children | 0 (0.0%) | 0 (0.0%) |
| 5 or more Children | 0 (0.0%) | 0 (0.0%) |
| Total | 0 (0.0%) | 12 (28.6%) |
Race in Tombstone
The most populous races in Tombstone are White / Caucasian (959 | 91.7%), Hispanic or Latino (147 | 14.1%), and Two or more Races (85 | 8.1%).
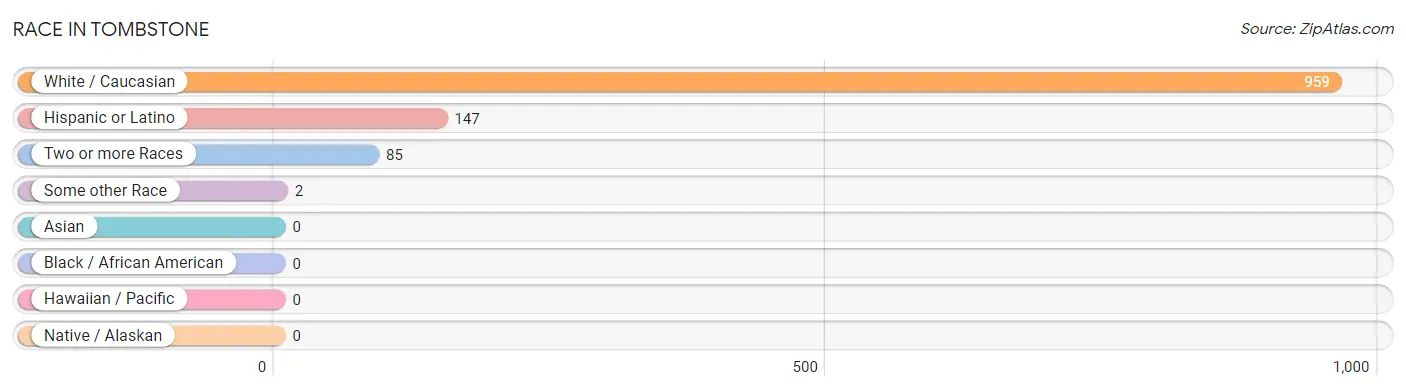
| Race | # Population | % Population |
| Asian | 0 | 0.0% |
| Black / African American | 0 | 0.0% |
| Hawaiian / Pacific | 0 | 0.0% |
| Hispanic or Latino | 147 | 14.1% |
| Native / Alaskan | 0 | 0.0% |
| White / Caucasian | 959 | 91.7% |
| Two or more Races | 85 | 8.1% |
| Some other Race | 2 | 0.2% |
| Total | 1,046 | 100.0% |
Ancestry in Tombstone
The most populous ancestries reported in Tombstone are Irish (233 | 22.3%), German (156 | 14.9%), English (150 | 14.3%), Mexican (139 | 13.3%), and Italian (40 | 3.8%), together accounting for 68.6% of all Tombstone residents.
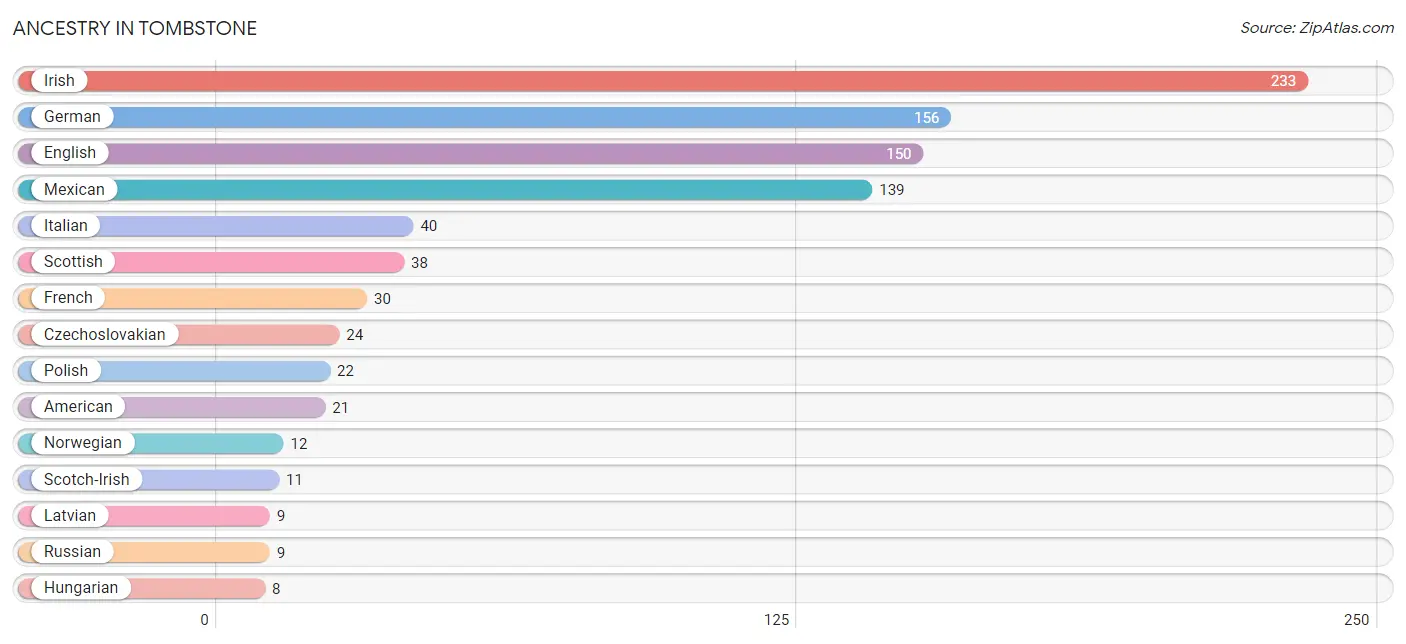
| Ancestry | # Population | % Population |
| American | 21 | 2.0% |
| Apache | 2 | 0.2% |
| Arab | 6 | 0.6% |
| Belgian | 3 | 0.3% |
| British | 3 | 0.3% |
| Cherokee | 2 | 0.2% |
| Comanche | 3 | 0.3% |
| Czechoslovakian | 24 | 2.3% |
| Dutch | 7 | 0.7% |
| English | 150 | 14.3% |
| European | 4 | 0.4% |
| French | 30 | 2.9% |
| German | 156 | 14.9% |
| Hungarian | 8 | 0.8% |
| Irish | 233 | 22.3% |
| Italian | 40 | 3.8% |
| Latvian | 9 | 0.9% |
| Lebanese | 6 | 0.6% |
| Lithuanian | 4 | 0.4% |
| Luxembourger | 3 | 0.3% |
| Mexican | 139 | 13.3% |
| Navajo | 2 | 0.2% |
| Norwegian | 12 | 1.1% |
| Polish | 22 | 2.1% |
| Russian | 9 | 0.9% |
| Scandinavian | 8 | 0.8% |
| Scotch-Irish | 11 | 1.1% |
| Scottish | 38 | 3.6% |
| Slovak | 6 | 0.6% |
| Spaniard | 3 | 0.3% |
| Swedish | 6 | 0.6% |
| Ukrainian | 7 | 0.7% |
| Welsh | 3 | 0.3% | View All 33 Rows |
Immigrants in Tombstone
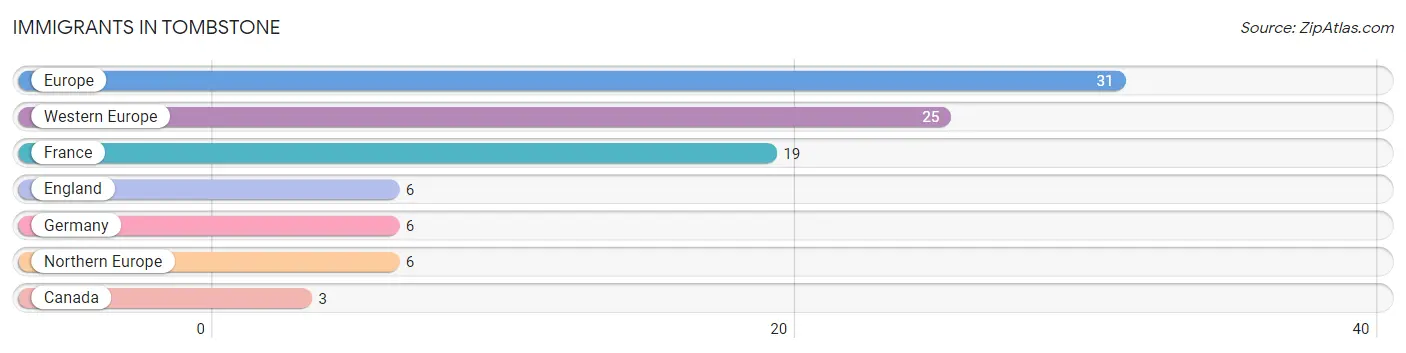
The most numerous immigrant groups reported in Tombstone came from Europe (31 | 3.0%), Western Europe (25 | 2.4%), France (19 | 1.8%), England (6 | 0.6%), and Germany (6 | 0.6%), together accounting for 8.3% of all Tombstone residents.
| Immigration Origin | # Population | % Population |
| Canada | 3 | 0.3% |
| England | 6 | 0.6% |
| Europe | 31 | 3.0% |
| France | 19 | 1.8% |
| Germany | 6 | 0.6% |
| Northern Europe | 6 | 0.6% |
| Western Europe | 25 | 2.4% | View All 7 Rows |
Sex and Age in Tombstone
Sex and Age in Tombstone
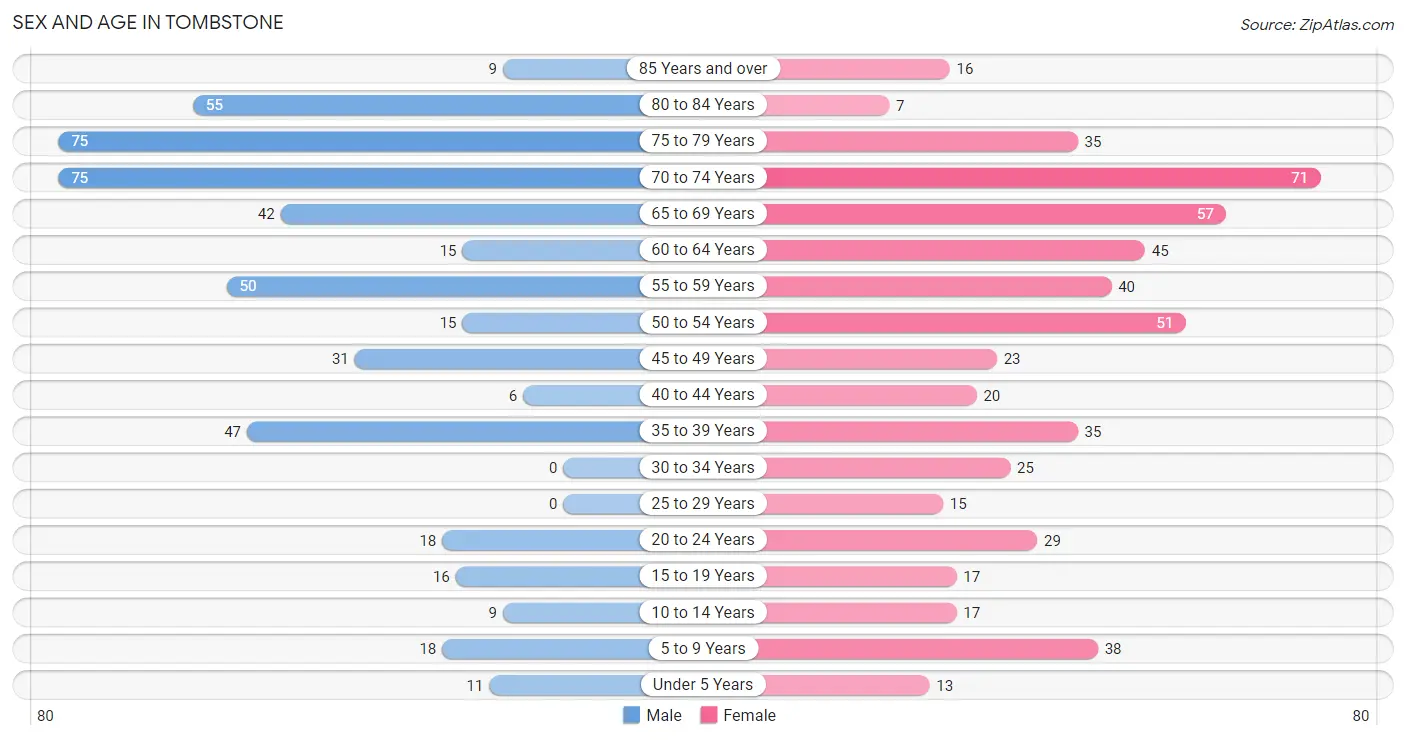
The most populous age groups in Tombstone are 70 to 74 Years (75 | 15.2%) for men and 70 to 74 Years (71 | 12.8%) for women.
| Age Bracket | Male | Female |
| Under 5 Years | 11 (2.2%) | 13 (2.4%) |
| 5 to 9 Years | 18 (3.7%) | 38 (6.9%) |
| 10 to 14 Years | 9 (1.8%) | 17 (3.1%) |
| 15 to 19 Years | 16 (3.3%) | 17 (3.1%) |
| 20 to 24 Years | 18 (3.7%) | 29 (5.2%) |
| 25 to 29 Years | 0 (0.0%) | 15 (2.7%) |
| 30 to 34 Years | 0 (0.0%) | 25 (4.5%) |
| 35 to 39 Years | 47 (9.6%) | 35 (6.3%) |
| 40 to 44 Years | 6 (1.2%) | 20 (3.6%) |
| 45 to 49 Years | 31 (6.3%) | 23 (4.2%) |
| 50 to 54 Years | 15 (3.0%) | 51 (9.2%) |
| 55 to 59 Years | 50 (10.2%) | 40 (7.2%) |
| 60 to 64 Years | 15 (3.0%) | 45 (8.1%) |
| 65 to 69 Years | 42 (8.5%) | 57 (10.3%) |
| 70 to 74 Years | 75 (15.2%) | 71 (12.8%) |
| 75 to 79 Years | 75 (15.2%) | 35 (6.3%) |
| 80 to 84 Years | 55 (11.2%) | 7 (1.3%) |
| 85 Years and over | 9 (1.8%) | 16 (2.9%) |
| Total | 492 (100.0%) | 554 (100.0%) |
Families and Households in Tombstone
Median Family Size in Tombstone
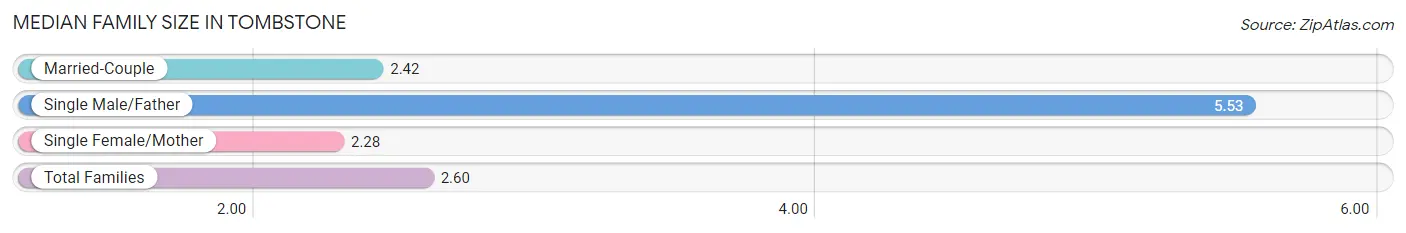
The median family size in Tombstone is 2.60 persons per family, with single male/father families (17 | 6.1%) accounting for the largest median family size of 5.53 persons per family. On the other hand, single female/mother families (25 | 9.0%) represent the smallest median family size with 2.28 persons per family.
| Family Type | # Families | Family Size |
| Married-Couple | 235 (84.8%) | 2.42 |
| Single Male/Father | 17 (6.1%) | 5.53 |
| Single Female/Mother | 25 (9.0%) | 2.28 |
| Total Families | 277 (100.0%) | 2.60 |
Median Household Size in Tombstone
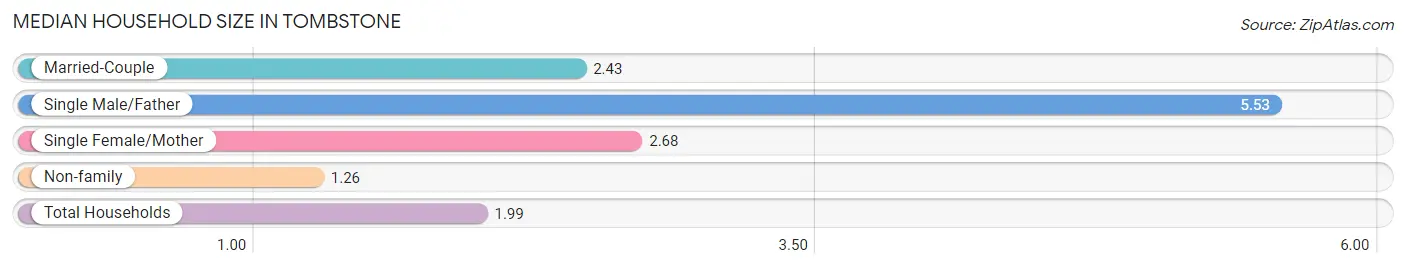
The median household size in Tombstone is 1.99 persons per household, with single male/father households (17 | 3.2%) accounting for the largest median household size of 5.53 persons per household. non-family households (249 | 47.3%) represent the smallest median household size with 1.26 persons per household.
| Household Type | # Households | Household Size |
| Married-Couple | 235 (44.7%) | 2.43 |
| Single Male/Father | 17 (3.2%) | 5.53 |
| Single Female/Mother | 25 (4.8%) | 2.68 |
| Non-family | 249 (47.3%) | 1.26 |
| Total Households | 526 (100.0%) | 1.99 |
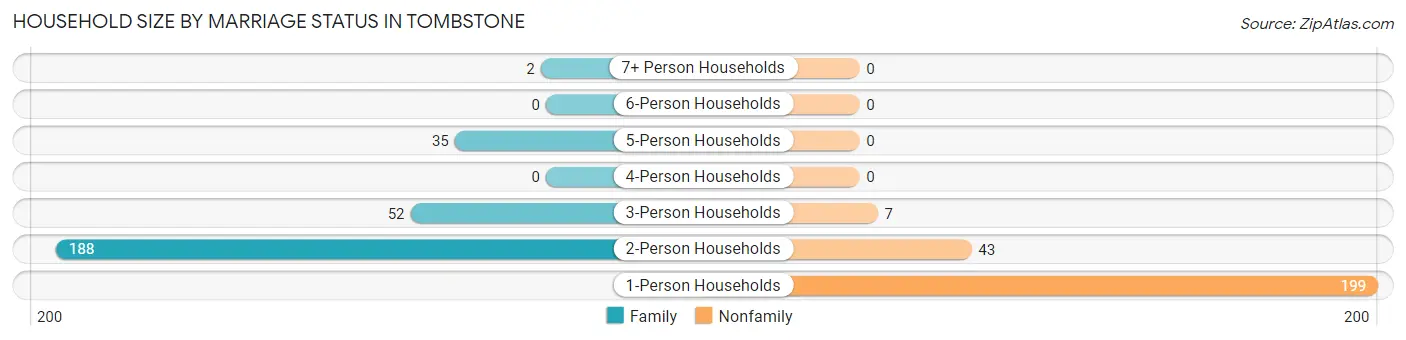
Household Size by Marriage Status in Tombstone
Out of a total of 526 households in Tombstone, 277 (52.7%) are family households, while 249 (47.3%) are nonfamily households. The most numerous type of family households are 2-person households, comprising 188, and the most common type of nonfamily households are 1-person households, comprising 199.
| Household Size | Family Households | Nonfamily Households |
| 1-Person Households | - | 199 (37.8%) |
| 2-Person Households | 188 (35.7%) | 43 (8.2%) |
| 3-Person Households | 52 (9.9%) | 7 (1.3%) |
| 4-Person Households | 0 (0.0%) | 0 (0.0%) |
| 5-Person Households | 35 (6.7%) | 0 (0.0%) |
| 6-Person Households | 0 (0.0%) | 0 (0.0%) |
| 7+ Person Households | 2 (0.4%) | 0 (0.0%) |
| Total | 277 (52.7%) | 249 (47.3%) |
Female Fertility in Tombstone
Fertility by Age in Tombstone
| Age Bracket | Women with Births | Births / 1,000 Women |
| 15 to 19 years | 0 (0.0%) | 0.0 |
| 20 to 34 years | 0 (0.0%) | 0.0 |
| 35 to 50 years | 0 (0.0%) | 0.0 |
| Total | 0 (0.0%) | 0.0 |
Fertility by Age by Marriage Status in Tombstone
| Age Bracket | Married | Unmarried |
| 15 to 19 years | 0 (0.0%) | 0 (0.0%) |
| 20 to 34 years | 0 (0.0%) | 0 (0.0%) |
| 35 to 50 years | 0 (0.0%) | 0 (0.0%) |
| Total | 0 (0.0%) | 0 (0.0%) |
Fertility by Education in Tombstone
| Educational Attainment | Women with Births | Births / 1,000 Women |
| Less than High School | 0 (0.0%) | 0.0 |
| High School Diploma | 0 (0.0%) | 0.0 |
| College or Associate's Degree | 0 (0.0%) | 0.0 |
| Bachelor's Degree | 0 (0.0%) | 0.0 |
| Graduate Degree | 0 (0.0%) | 0.0 |
| Total | 0 (0.0%) | 0.0 |
Fertility by Education by Marriage Status in Tombstone
| Educational Attainment | Married | Unmarried |
| Less than High School | 0 (0.0%) | 0 (0.0%) |
| High School Diploma | 0 (0.0%) | 0 (0.0%) |
| College or Associate's Degree | 0 (0.0%) | 0 (0.0%) |
| Bachelor's Degree | 0 (0.0%) | 0 (0.0%) |
| Graduate Degree | 0 (0.0%) | 0 (0.0%) |
| Total | 0 (0.0%) | 0 (0.0%) |
Employment Characteristics in Tombstone
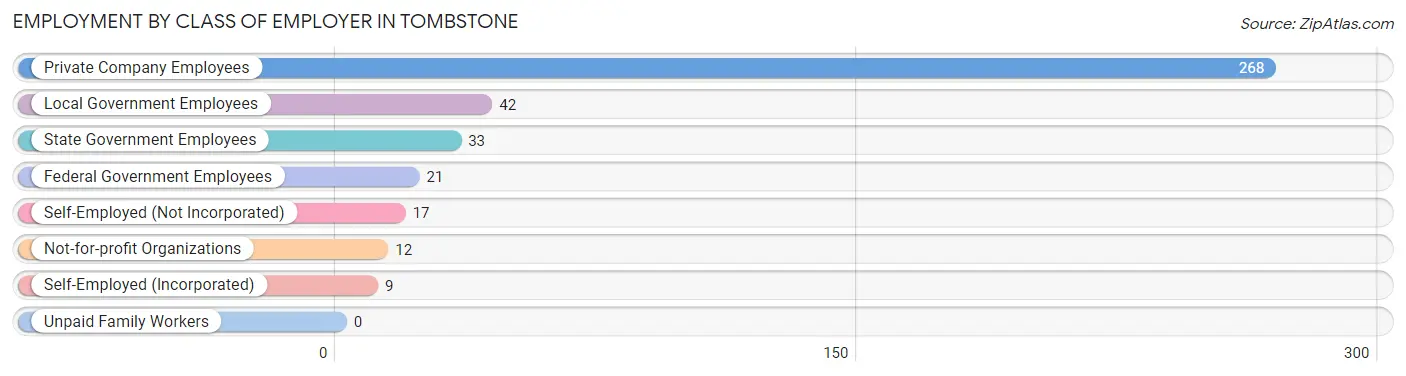
Employment by Class of Employer in Tombstone
Among the 402 employed individuals in Tombstone, private company employees (268 | 66.7%), local government employees (42 | 10.4%), and state government employees (33 | 8.2%) make up the most common classes of employment.
| Employer Class | # Employees | % Employees |
| Private Company Employees | 268 | 66.7% |
| Self-Employed (Incorporated) | 9 | 2.2% |
| Self-Employed (Not Incorporated) | 17 | 4.2% |
| Not-for-profit Organizations | 12 | 3.0% |
| Local Government Employees | 42 | 10.4% |
| State Government Employees | 33 | 8.2% |
| Federal Government Employees | 21 | 5.2% |
| Unpaid Family Workers | 0 | 0.0% |
| Total | 402 | 100.0% |
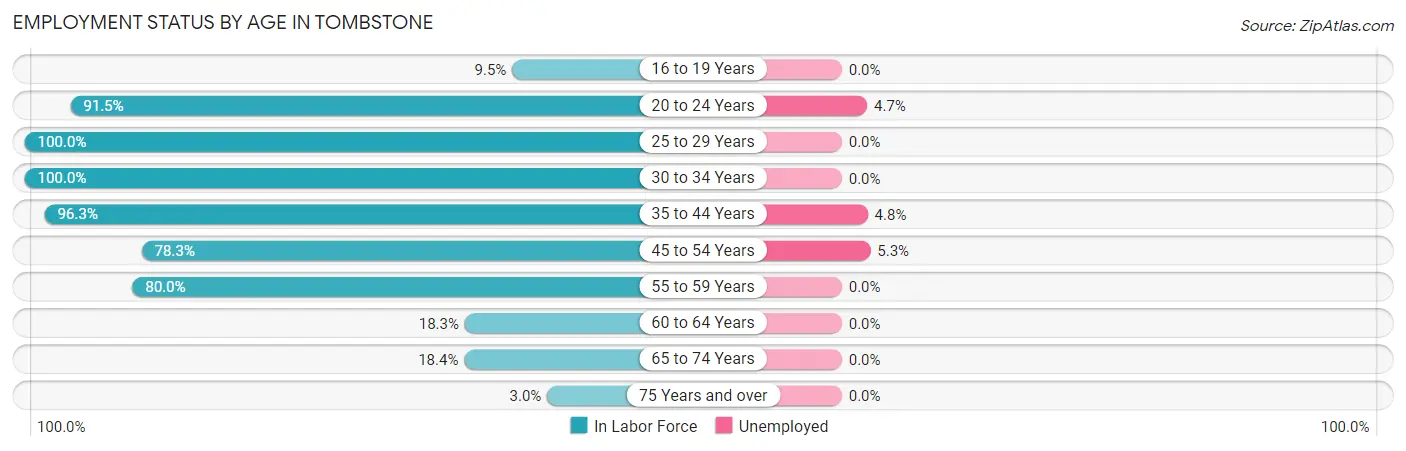
Employment Status by Age in Tombstone
According to the labor force statistics for Tombstone, out of the total population over 16 years of age (928), 44.9% or 417 individuals are in the labor force, with 2.9% or 12 of them unemployed. The age group with the highest labor force participation rate is 25 to 29 years, with 100.0% or 15 individuals in the labor force. Within the labor force, the 45 to 54 years age range has the highest percentage of unemployed individuals, with 5.3% or 5 of them being unemployed.
| Age Bracket | In Labor Force | Unemployed |
| 16 to 19 Years | 2 (9.5%) | 0 (0.0%) |
| 20 to 24 Years | 43 (91.5%) | 2 (4.7%) |
| 25 to 29 Years | 15 (100.0%) | 0 (0.0%) |
| 30 to 34 Years | 25 (100.0%) | 0 (0.0%) |
| 35 to 44 Years | 104 (96.3%) | 5 (4.8%) |
| 45 to 54 Years | 94 (78.3%) | 5 (5.3%) |
| 55 to 59 Years | 72 (80.0%) | 0 (0.0%) |
| 60 to 64 Years | 11 (18.3%) | 0 (0.0%) |
| 65 to 74 Years | 45 (18.4%) | 0 (0.0%) |
| 75 Years and over | 6 (3.0%) | 0 (0.0%) |
| Total | 417 (44.9%) | 12 (2.9%) |
Employment Status by Educational Attainment in Tombstone
According to labor force statistics for Tombstone, 76.8% of individuals (321) out of the total population between 25 and 64 years of age (418) are in the labor force, with 3.1% or 10 of them being unemployed. The group with the highest labor force participation rate are those with the educational attainment of less than high school, with 100.0% or 13 individuals in the labor force. Within the labor force, individuals with less than high school education have the highest percentage of unemployment, with 38.5% or 5 of them being unemployed.
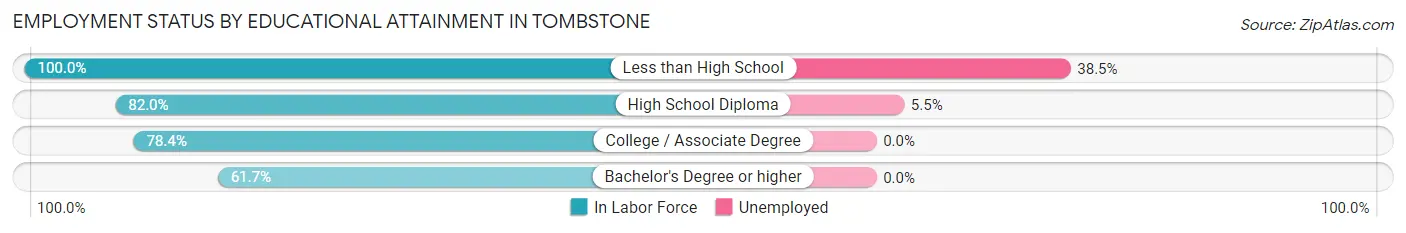
| Educational Attainment | In Labor Force | Unemployed |
| Less than High School | 13 (100.0%) | 5 (38.5%) |
| High School Diploma | 91 (82.0%) | 6 (5.5%) |
| College / Associate Degree | 167 (78.4%) | 0 (0.0%) |
| Bachelor's Degree or higher | 50 (61.7%) | 0 (0.0%) |
| Total | 321 (76.8%) | 13 (3.1%) |
Employment Occupations by Sex in Tombstone
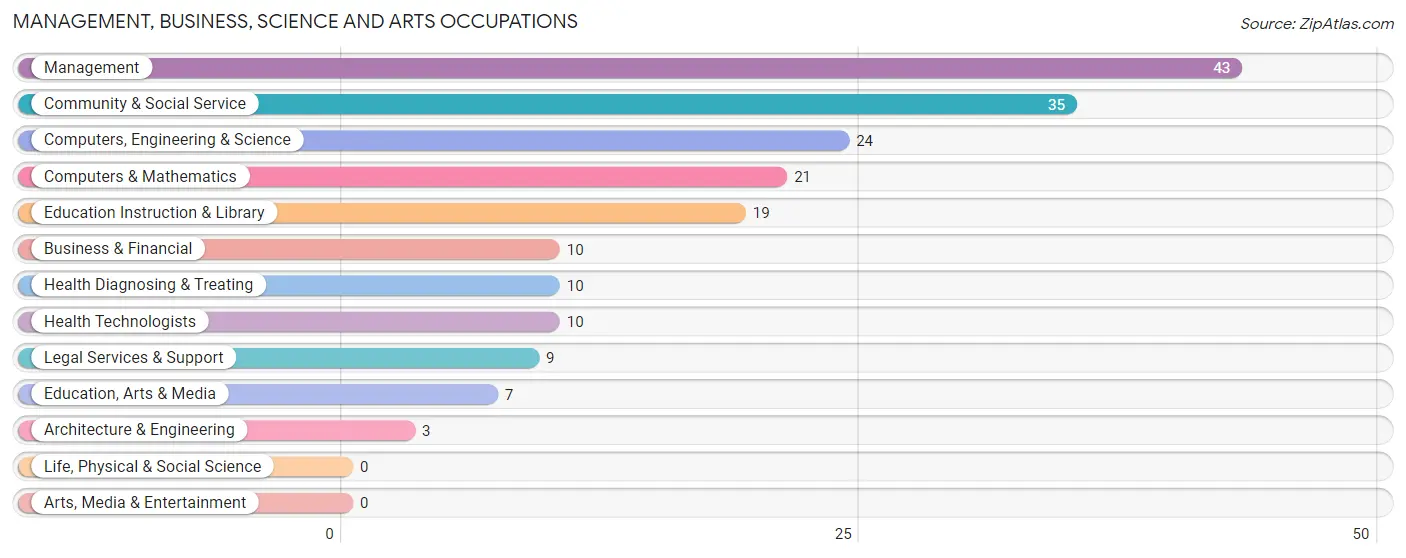
Management, Business, Science and Arts Occupations
The most common Management, Business, Science and Arts occupations in Tombstone are Management (43 | 10.6%), Community & Social Service (35 | 8.6%), Computers, Engineering & Science (24 | 5.9%), Computers & Mathematics (21 | 5.2%), and Education Instruction & Library (19 | 4.7%).
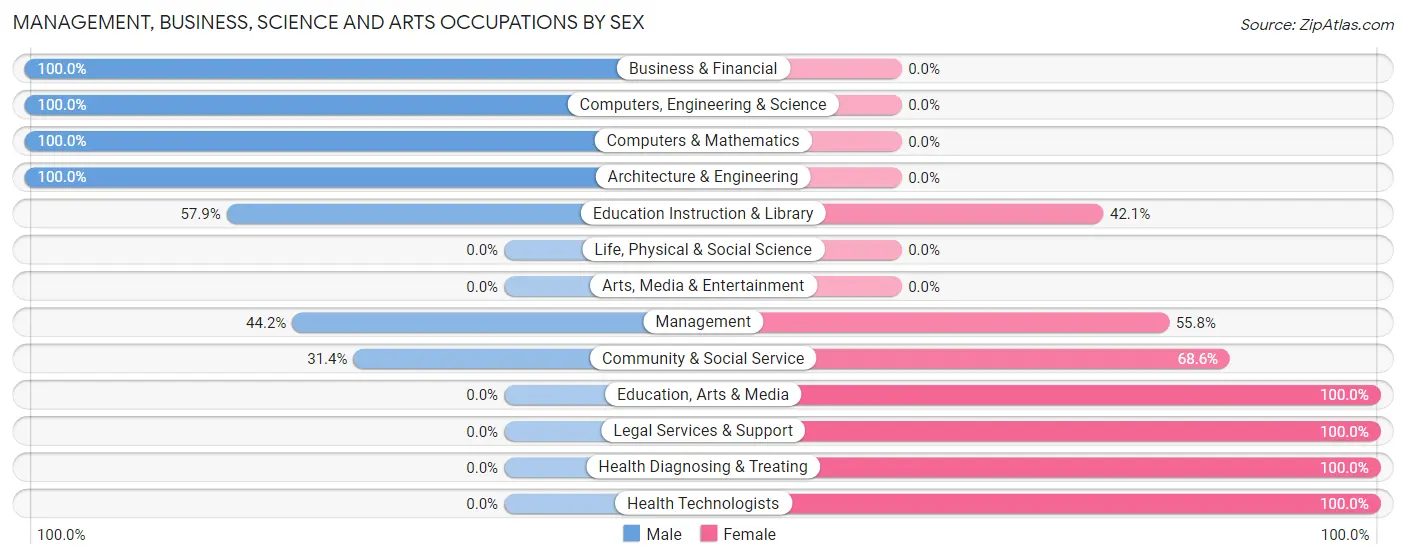
Management, Business, Science and Arts Occupations by Sex
Within the Management, Business, Science and Arts occupations in Tombstone, the most male-oriented occupations are Business & Financial (100.0%), Computers, Engineering & Science (100.0%), and Computers & Mathematics (100.0%), while the most female-oriented occupations are Education, Arts & Media (100.0%), Legal Services & Support (100.0%), and Health Diagnosing & Treating (100.0%).
| Occupation | Male | Female |
| Management | 19 (44.2%) | 24 (55.8%) |
| Business & Financial | 10 (100.0%) | 0 (0.0%) |
| Computers, Engineering & Science | 24 (100.0%) | 0 (0.0%) |
| Computers & Mathematics | 21 (100.0%) | 0 (0.0%) |
| Architecture & Engineering | 3 (100.0%) | 0 (0.0%) |
| Life, Physical & Social Science | 0 (0.0%) | 0 (0.0%) |
| Community & Social Service | 11 (31.4%) | 24 (68.6%) |
| Education, Arts & Media | 0 (0.0%) | 7 (100.0%) |
| Legal Services & Support | 0 (0.0%) | 9 (100.0%) |
| Education Instruction & Library | 11 (57.9%) | 8 (42.1%) |
| Arts, Media & Entertainment | 0 (0.0%) | 0 (0.0%) |
| Health Diagnosing & Treating | 0 (0.0%) | 10 (100.0%) |
| Health Technologists | 0 (0.0%) | 10 (100.0%) |
| Total (Category) | 64 (52.5%) | 58 (47.5%) |
| Total (Overall) | 184 (45.4%) | 221 (54.6%) |
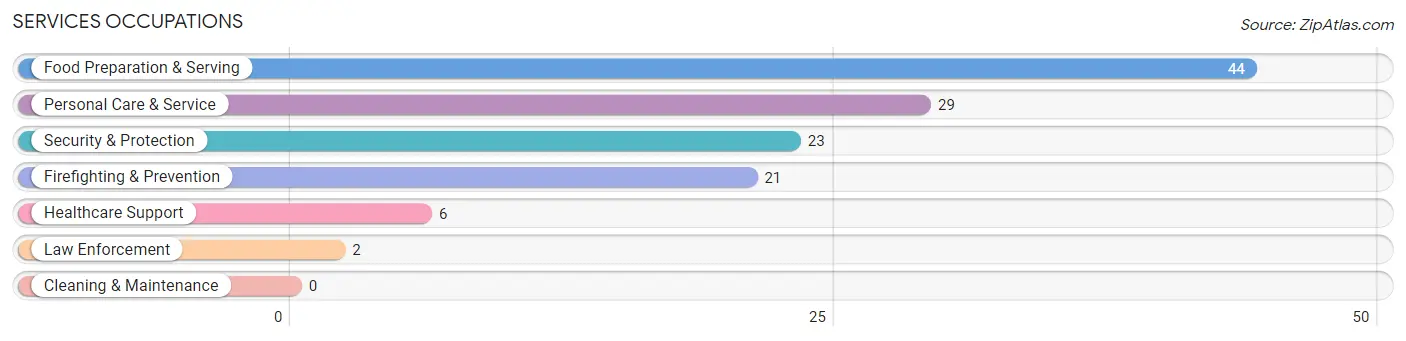
Services Occupations
The most common Services occupations in Tombstone are Food Preparation & Serving (44 | 10.9%), Personal Care & Service (29 | 7.2%), Security & Protection (23 | 5.7%), Firefighting & Prevention (21 | 5.2%), and Healthcare Support (6 | 1.5%).
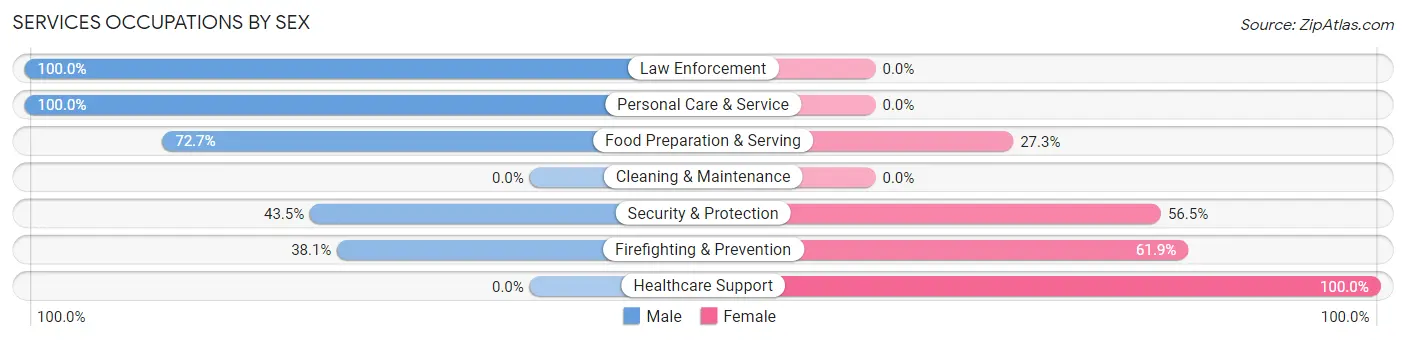
Services Occupations by Sex
Within the Services occupations in Tombstone, the most male-oriented occupations are Law Enforcement (100.0%), Personal Care & Service (100.0%), and Food Preparation & Serving (72.7%), while the most female-oriented occupations are Healthcare Support (100.0%), Firefighting & Prevention (61.9%), and Security & Protection (56.5%).
| Occupation | Male | Female |
| Healthcare Support | 0 (0.0%) | 6 (100.0%) |
| Security & Protection | 10 (43.5%) | 13 (56.5%) |
| Firefighting & Prevention | 8 (38.1%) | 13 (61.9%) |
| Law Enforcement | 2 (100.0%) | 0 (0.0%) |
| Food Preparation & Serving | 32 (72.7%) | 12 (27.3%) |
| Cleaning & Maintenance | 0 (0.0%) | 0 (0.0%) |
| Personal Care & Service | 29 (100.0%) | 0 (0.0%) |
| Total (Category) | 71 (69.6%) | 31 (30.4%) |
| Total (Overall) | 184 (45.4%) | 221 (54.6%) |
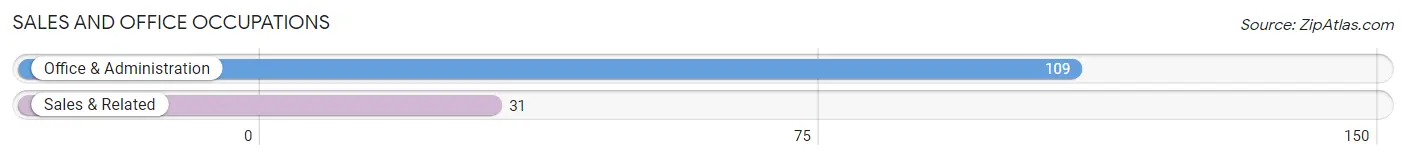
Sales and Office Occupations
The most common Sales and Office occupations in Tombstone are Office & Administration (109 | 26.9%), and Sales & Related (31 | 7.6%).
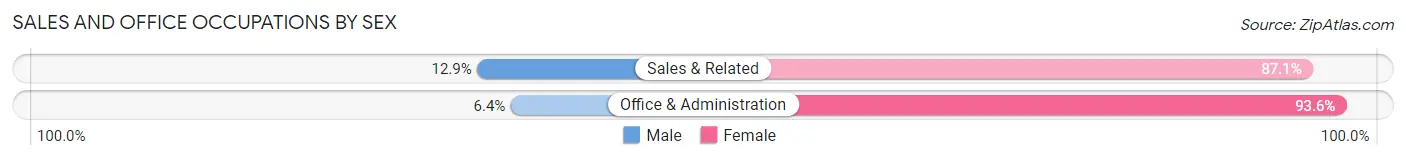
Sales and Office Occupations by Sex
| Occupation | Male | Female |
| Sales & Related | 4 (12.9%) | 27 (87.1%) |
| Office & Administration | 7 (6.4%) | 102 (93.6%) |
| Total (Category) | 11 (7.9%) | 129 (92.1%) |
| Total (Overall) | 184 (45.4%) | 221 (54.6%) |
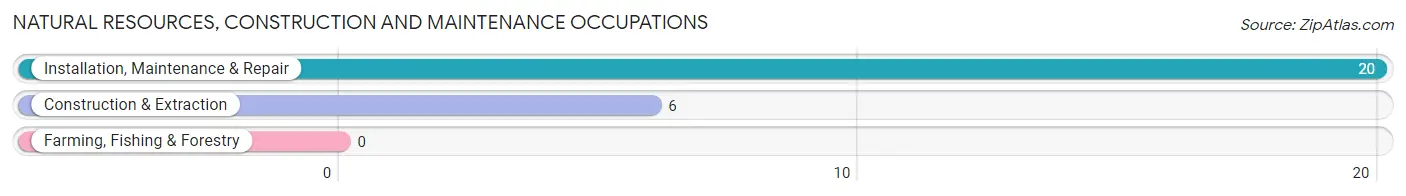
Natural Resources, Construction and Maintenance Occupations
The most common Natural Resources, Construction and Maintenance occupations in Tombstone are Installation, Maintenance & Repair (20 | 4.9%), and Construction & Extraction (6 | 1.5%).
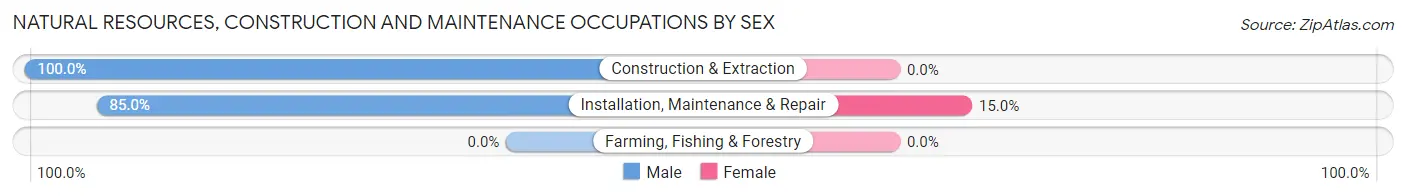
Natural Resources, Construction and Maintenance Occupations by Sex
| Occupation | Male | Female |
| Farming, Fishing & Forestry | 0 (0.0%) | 0 (0.0%) |
| Construction & Extraction | 6 (100.0%) | 0 (0.0%) |
| Installation, Maintenance & Repair | 17 (85.0%) | 3 (15.0%) |
| Total (Category) | 23 (88.5%) | 3 (11.5%) |
| Total (Overall) | 184 (45.4%) | 221 (54.6%) |
Production, Transportation and Moving Occupations
The most common Production, Transportation and Moving occupations in Tombstone are Production (13 | 3.2%), and Material Moving (2 | 0.5%).
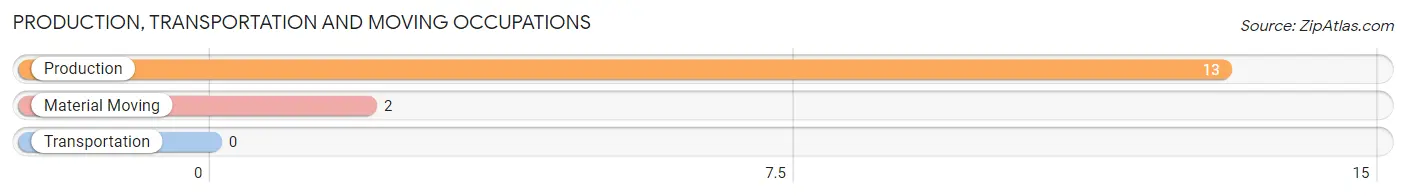
Production, Transportation and Moving Occupations by Sex
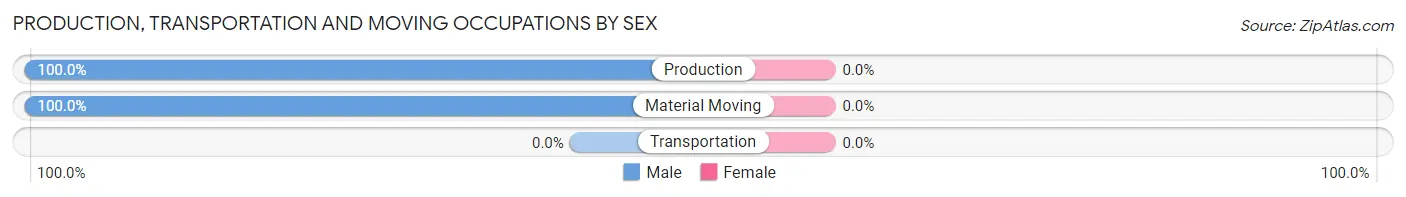
| Occupation | Male | Female |
| Production | 13 (100.0%) | 0 (0.0%) |
| Transportation | 0 (0.0%) | 0 (0.0%) |
| Material Moving | 2 (100.0%) | 0 (0.0%) |
| Total (Category) | 15 (100.0%) | 0 (0.0%) |
| Total (Overall) | 184 (45.4%) | 221 (54.6%) |
Employment Industries by Sex in Tombstone
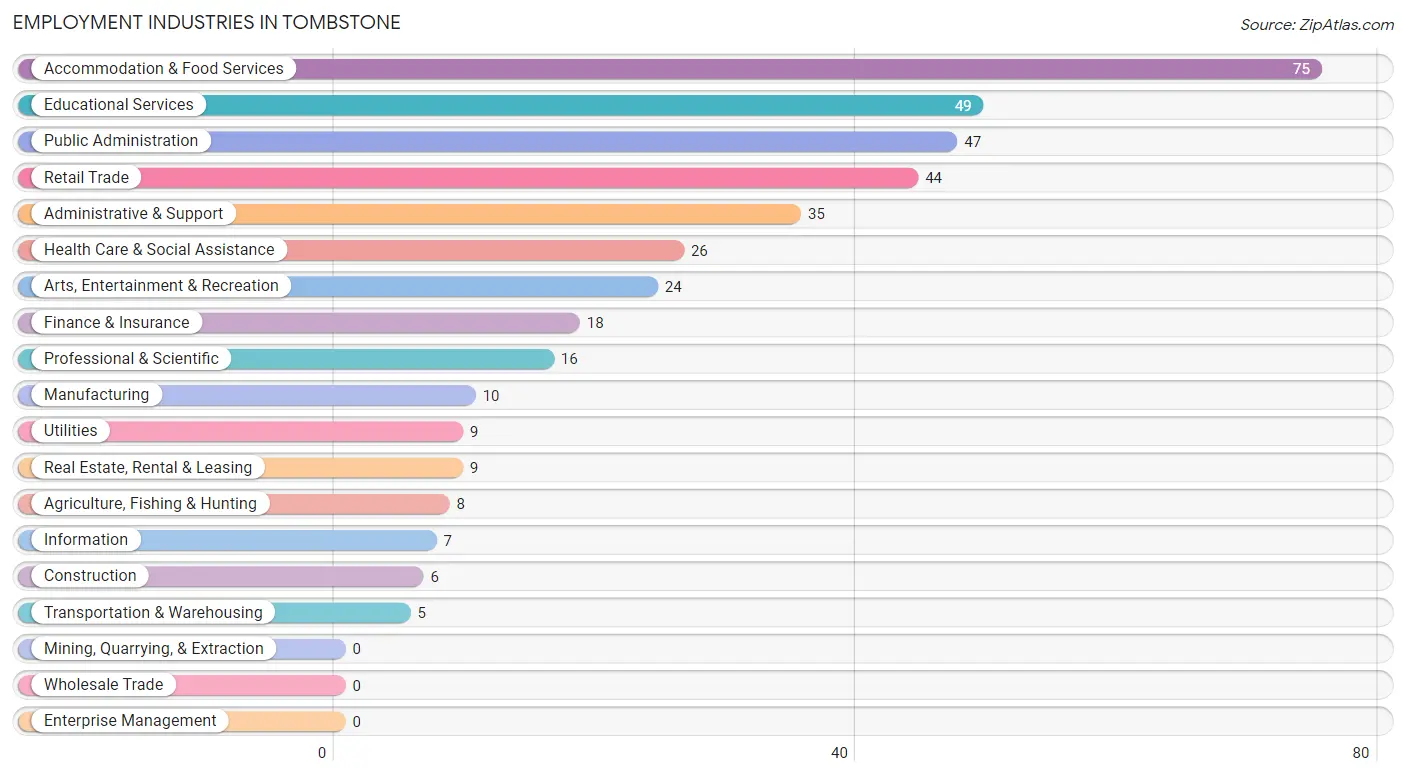
Employment Industries in Tombstone
The major employment industries in Tombstone include Accommodation & Food Services (75 | 18.5%), Educational Services (49 | 12.1%), Public Administration (47 | 11.6%), Retail Trade (44 | 10.9%), and Administrative & Support (35 | 8.6%).
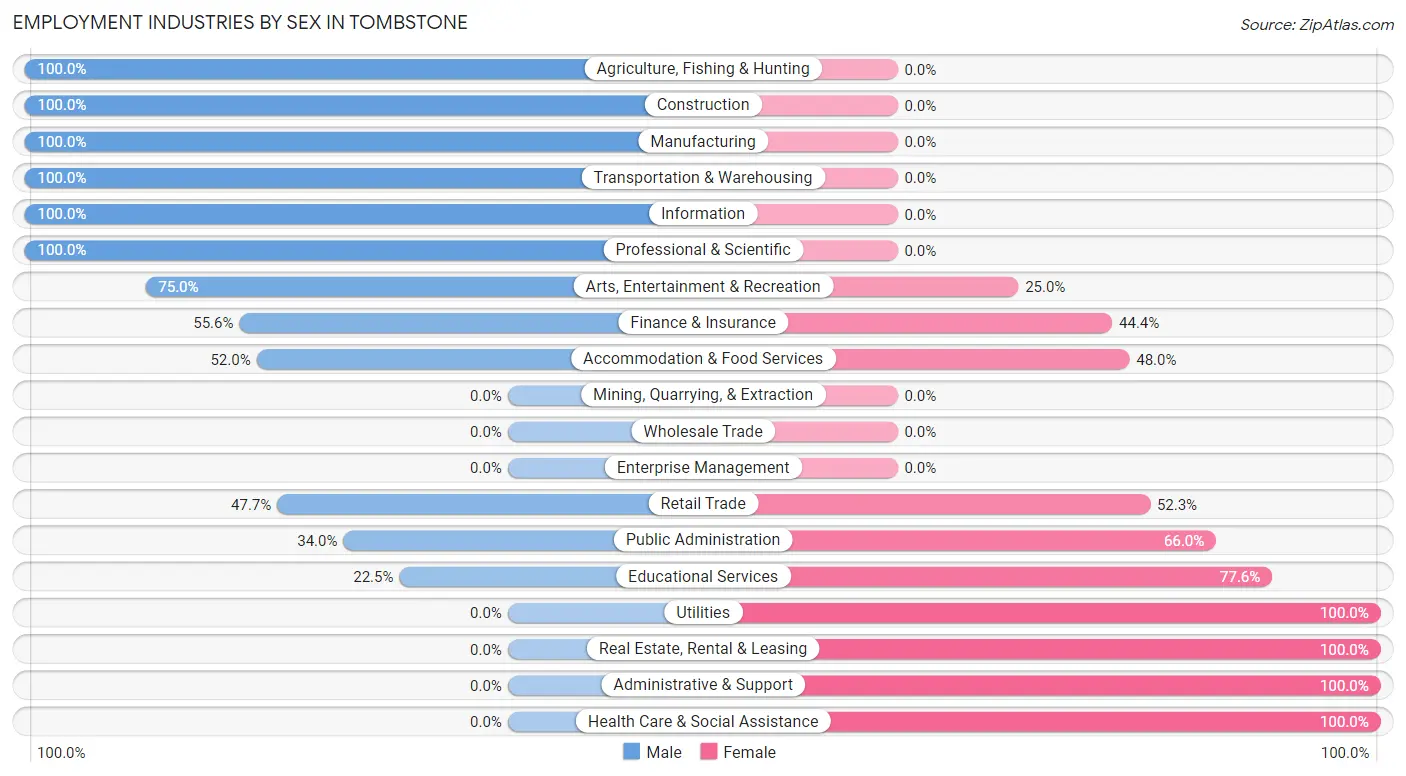
Employment Industries by Sex in Tombstone
The Tombstone industries that see more men than women are Agriculture, Fishing & Hunting (100.0%), Construction (100.0%), and Manufacturing (100.0%), whereas the industries that tend to have a higher number of women are Utilities (100.0%), Real Estate, Rental & Leasing (100.0%), and Administrative & Support (100.0%).
| Industry | Male | Female |
| Agriculture, Fishing & Hunting | 8 (100.0%) | 0 (0.0%) |
| Mining, Quarrying, & Extraction | 0 (0.0%) | 0 (0.0%) |
| Construction | 6 (100.0%) | 0 (0.0%) |
| Manufacturing | 10 (100.0%) | 0 (0.0%) |
| Wholesale Trade | 0 (0.0%) | 0 (0.0%) |
| Retail Trade | 21 (47.7%) | 23 (52.3%) |
| Transportation & Warehousing | 5 (100.0%) | 0 (0.0%) |
| Utilities | 0 (0.0%) | 9 (100.0%) |
| Information | 7 (100.0%) | 0 (0.0%) |
| Finance & Insurance | 10 (55.6%) | 8 (44.4%) |
| Real Estate, Rental & Leasing | 0 (0.0%) | 9 (100.0%) |
| Professional & Scientific | 16 (100.0%) | 0 (0.0%) |
| Enterprise Management | 0 (0.0%) | 0 (0.0%) |
| Administrative & Support | 0 (0.0%) | 35 (100.0%) |
| Educational Services | 11 (22.5%) | 38 (77.5%) |
| Health Care & Social Assistance | 0 (0.0%) | 26 (100.0%) |
| Arts, Entertainment & Recreation | 18 (75.0%) | 6 (25.0%) |
| Accommodation & Food Services | 39 (52.0%) | 36 (48.0%) |
| Public Administration | 16 (34.0%) | 31 (66.0%) |
| Total | 184 (45.4%) | 221 (54.6%) |
Education in Tombstone
School Enrollment in Tombstone
The most common levels of schooling among the 173 students in Tombstone are college / undergraduate (55 | 31.8%), high school (41 | 23.7%), and elementary school (37 | 21.4%).
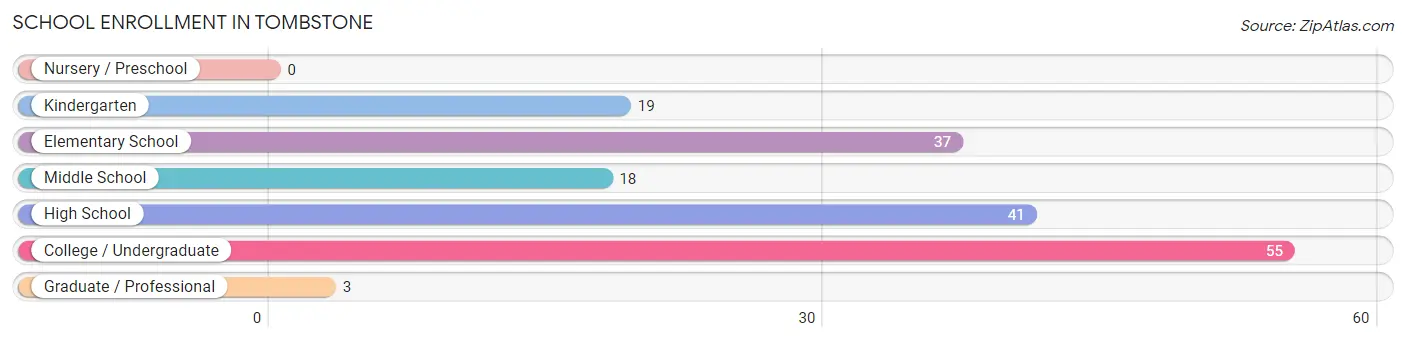
| School Level | # Students | % Students |
| Nursery / Preschool | 0 | 0.0% |
| Kindergarten | 19 | 11.0% |
| Elementary School | 37 | 21.4% |
| Middle School | 18 | 10.4% |
| High School | 41 | 23.7% |
| College / Undergraduate | 55 | 31.8% |
| Graduate / Professional | 3 | 1.7% |
| Total | 173 | 100.0% |
School Enrollment by Age by Funding Source in Tombstone
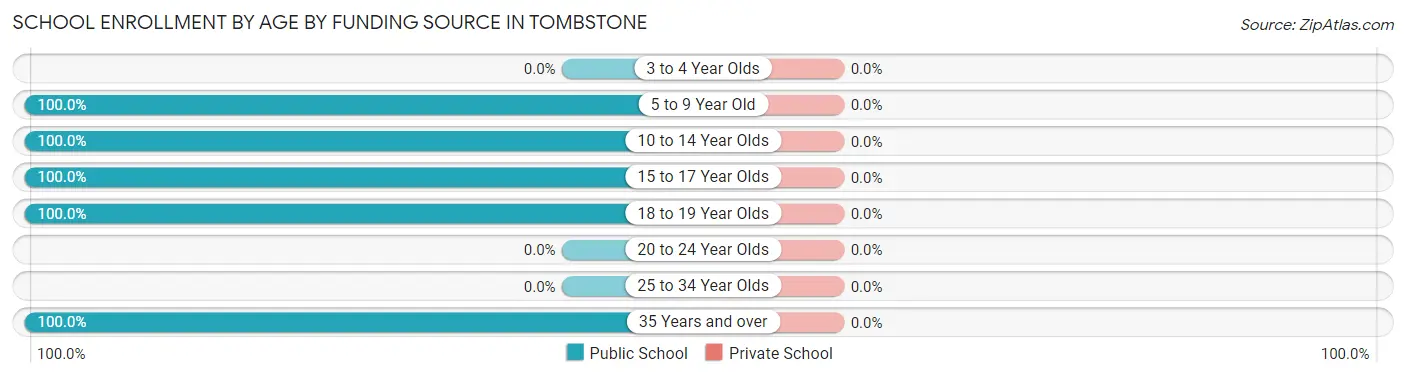
| Age Bracket | Public School | Private School |
| 3 to 4 Year Olds | 0 (0.0%) | 0 (0.0%) |
| 5 to 9 Year Old | 56 (100.0%) | 0 (0.0%) |
| 10 to 14 Year Olds | 26 (100.0%) | 0 (0.0%) |
| 15 to 17 Year Olds | 27 (100.0%) | 0 (0.0%) |
| 18 to 19 Year Olds | 6 (100.0%) | 0 (0.0%) |
| 20 to 24 Year Olds | 0 (0.0%) | 0 (0.0%) |
| 25 to 34 Year Olds | 0 (0.0%) | 0 (0.0%) |
| 35 Years and over | 58 (100.0%) | 0 (0.0%) |
| Total | 173 (100.0%) | 0 (0.0%) |
Educational Attainment by Field of Study in Tombstone
Business (40 | 27.2%), education (33 | 22.5%), physical & health sciences (16 | 10.9%), social sciences (13 | 8.8%), and arts & humanities (13 | 8.8%) are the most common fields of study among 147 individuals in Tombstone who have obtained a bachelor's degree or higher.
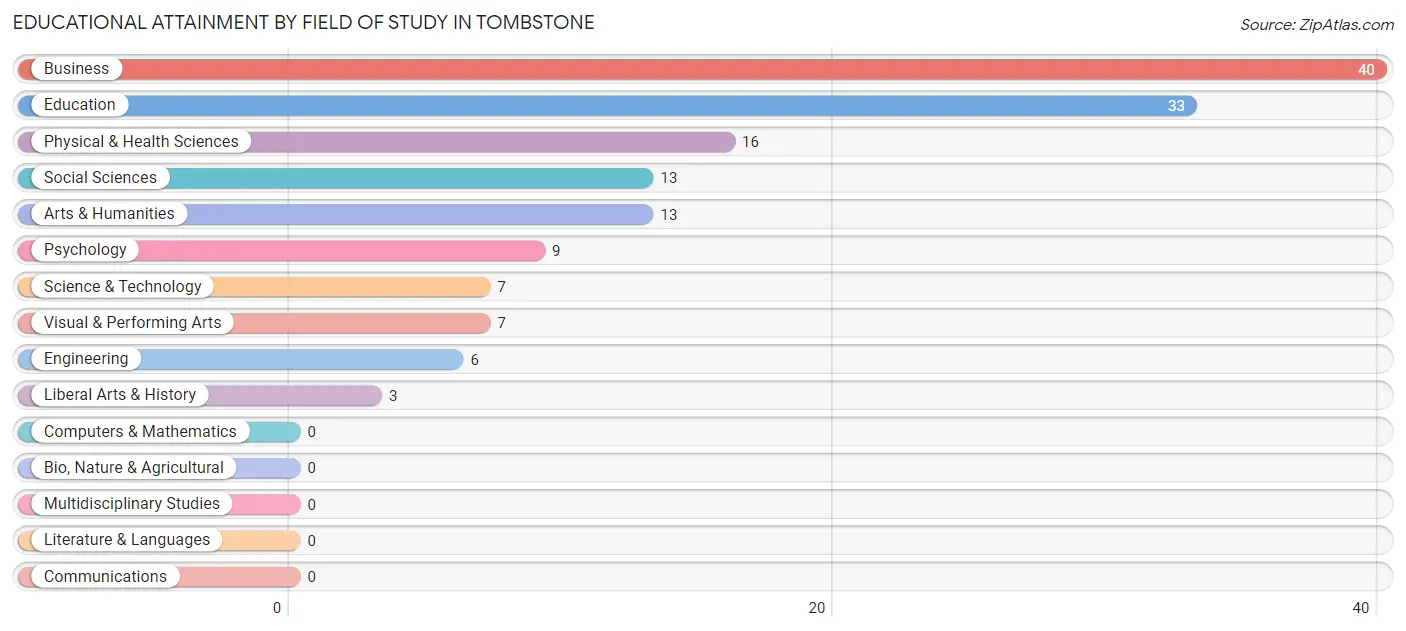
| Field of Study | # Graduates | % Graduates |
| Computers & Mathematics | 0 | 0.0% |
| Bio, Nature & Agricultural | 0 | 0.0% |
| Physical & Health Sciences | 16 | 10.9% |
| Psychology | 9 | 6.1% |
| Social Sciences | 13 | 8.8% |
| Engineering | 6 | 4.1% |
| Multidisciplinary Studies | 0 | 0.0% |
| Science & Technology | 7 | 4.8% |
| Business | 40 | 27.2% |
| Education | 33 | 22.5% |
| Literature & Languages | 0 | 0.0% |
| Liberal Arts & History | 3 | 2.0% |
| Visual & Performing Arts | 7 | 4.8% |
| Communications | 0 | 0.0% |
| Arts & Humanities | 13 | 8.8% |
| Total | 147 | 100.0% |
Transportation & Commute in Tombstone
Vehicle Availability by Sex in Tombstone
The most prevalent vehicle ownership categories in Tombstone are males with 2 vehicles (63, accounting for 34.8%) and females with 2 vehicles (70, making up 28.5%).
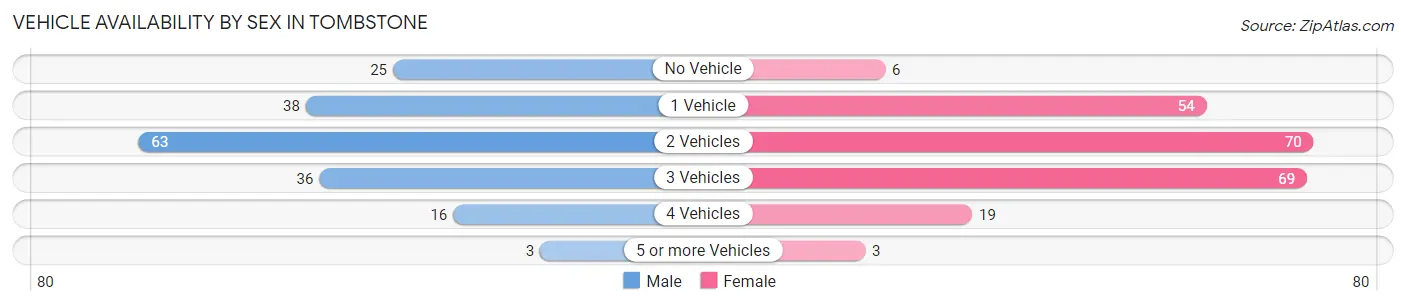
| Vehicles Available | Male | Female |
| No Vehicle | 25 (13.8%) | 6 (2.7%) |
| 1 Vehicle | 38 (21.0%) | 54 (24.4%) |
| 2 Vehicles | 63 (34.8%) | 70 (31.7%) |
| 3 Vehicles | 36 (19.9%) | 69 (31.2%) |
| 4 Vehicles | 16 (8.8%) | 19 (8.6%) |
| 5 or more Vehicles | 3 (1.7%) | 3 (1.4%) |
| Total | 181 (100.0%) | 221 (100.0%) |
Commute Time in Tombstone
The most frequently occuring commute durations in Tombstone are 5 to 9 minutes (100 commuters, 27.1%), 10 to 14 minutes (73 commuters, 19.8%), and 30 to 34 minutes (70 commuters, 19.0%).
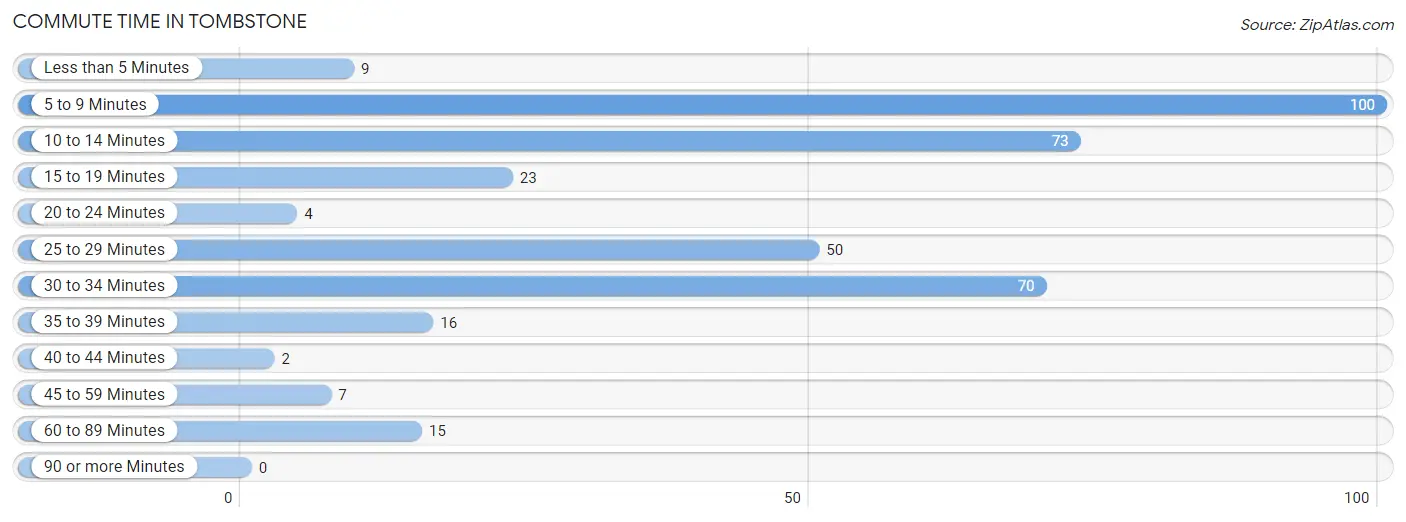
| Commute Time | # Commuters | % Commuters |
| Less than 5 Minutes | 9 | 2.4% |
| 5 to 9 Minutes | 100 | 27.1% |
| 10 to 14 Minutes | 73 | 19.8% |
| 15 to 19 Minutes | 23 | 6.2% |
| 20 to 24 Minutes | 4 | 1.1% |
| 25 to 29 Minutes | 50 | 13.6% |
| 30 to 34 Minutes | 70 | 19.0% |
| 35 to 39 Minutes | 16 | 4.3% |
| 40 to 44 Minutes | 2 | 0.5% |
| 45 to 59 Minutes | 7 | 1.9% |
| 60 to 89 Minutes | 15 | 4.1% |
| 90 or more Minutes | 0 | 0.0% |
Commute Time by Sex in Tombstone
The most common commute times in Tombstone are 10 to 14 minutes (53 commuters, 32.3%) for males and 5 to 9 minutes (68 commuters, 33.2%) for females.
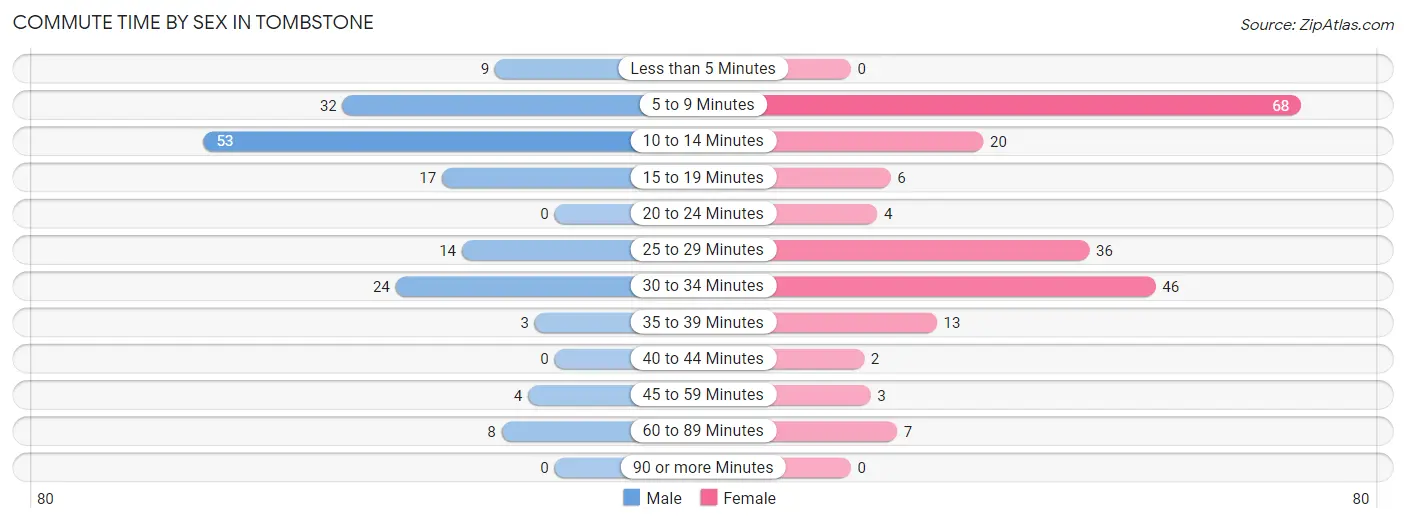
| Commute Time | Male | Female |
| Less than 5 Minutes | 9 (5.5%) | 0 (0.0%) |
| 5 to 9 Minutes | 32 (19.5%) | 68 (33.2%) |
| 10 to 14 Minutes | 53 (32.3%) | 20 (9.8%) |
| 15 to 19 Minutes | 17 (10.4%) | 6 (2.9%) |
| 20 to 24 Minutes | 0 (0.0%) | 4 (1.9%) |
| 25 to 29 Minutes | 14 (8.5%) | 36 (17.6%) |
| 30 to 34 Minutes | 24 (14.6%) | 46 (22.4%) |
| 35 to 39 Minutes | 3 (1.8%) | 13 (6.3%) |
| 40 to 44 Minutes | 0 (0.0%) | 2 (1.0%) |
| 45 to 59 Minutes | 4 (2.4%) | 3 (1.5%) |
| 60 to 89 Minutes | 8 (4.9%) | 7 (3.4%) |
| 90 or more Minutes | 0 (0.0%) | 0 (0.0%) |
Time of Departure to Work by Sex in Tombstone
The most frequent times of departure to work in Tombstone are 12:00 PM to 3:59 PM (31, 18.9%) for males and 7:00 AM to 7:29 AM (30, 14.6%) for females.
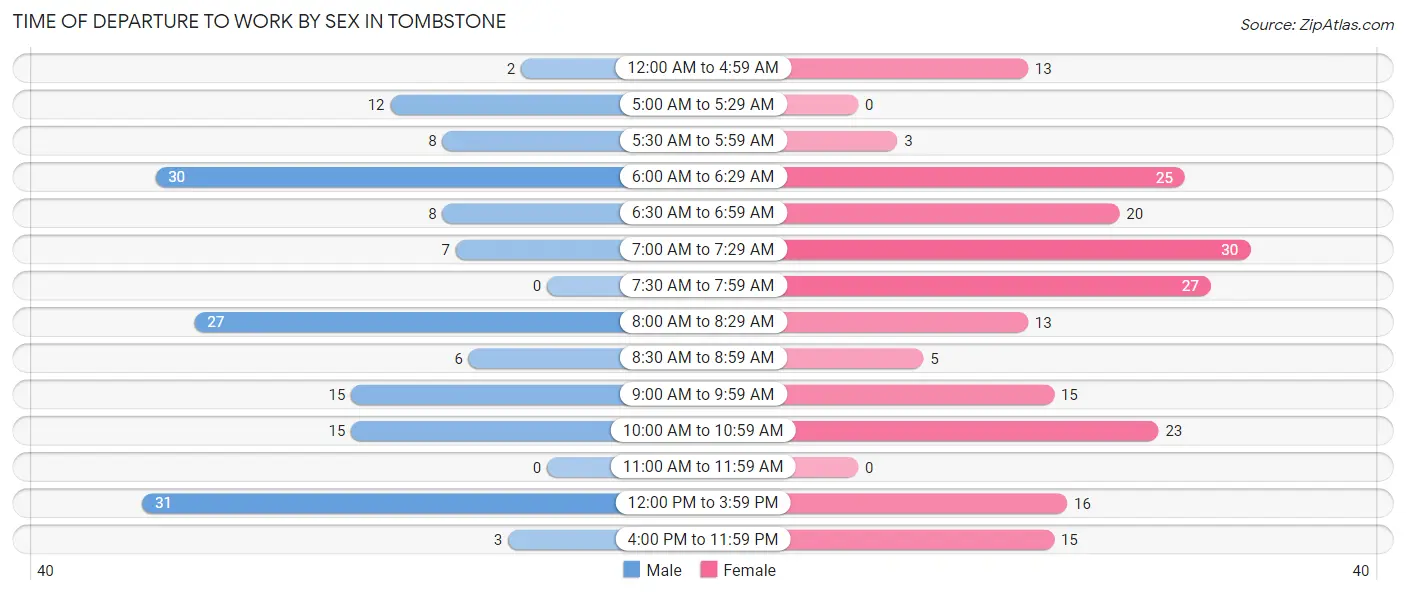
| Time of Departure | Male | Female |
| 12:00 AM to 4:59 AM | 2 (1.2%) | 13 (6.3%) |
| 5:00 AM to 5:29 AM | 12 (7.3%) | 0 (0.0%) |
| 5:30 AM to 5:59 AM | 8 (4.9%) | 3 (1.5%) |
| 6:00 AM to 6:29 AM | 30 (18.3%) | 25 (12.2%) |
| 6:30 AM to 6:59 AM | 8 (4.9%) | 20 (9.8%) |
| 7:00 AM to 7:29 AM | 7 (4.3%) | 30 (14.6%) |
| 7:30 AM to 7:59 AM | 0 (0.0%) | 27 (13.2%) |
| 8:00 AM to 8:29 AM | 27 (16.5%) | 13 (6.3%) |
| 8:30 AM to 8:59 AM | 6 (3.7%) | 5 (2.4%) |
| 9:00 AM to 9:59 AM | 15 (9.1%) | 15 (7.3%) |
| 10:00 AM to 10:59 AM | 15 (9.1%) | 23 (11.2%) |
| 11:00 AM to 11:59 AM | 0 (0.0%) | 0 (0.0%) |
| 12:00 PM to 3:59 PM | 31 (18.9%) | 16 (7.8%) |
| 4:00 PM to 11:59 PM | 3 (1.8%) | 15 (7.3%) |
| Total | 164 (100.0%) | 205 (100.0%) |
Housing Occupancy in Tombstone
Occupancy by Ownership in Tombstone
Of the total 526 dwellings in Tombstone, owner-occupied units account for 361 (68.6%), while renter-occupied units make up 165 (31.4%).
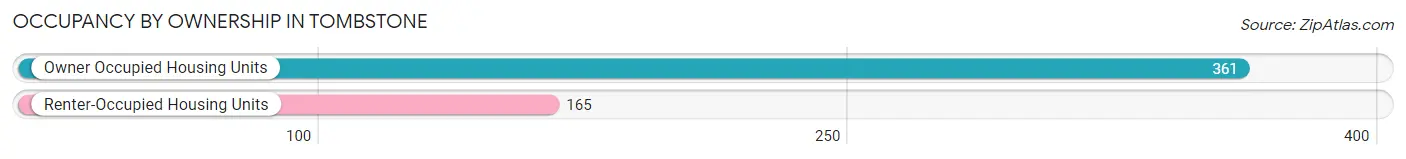
| Occupancy | # Housing Units | % Housing Units |
| Owner Occupied Housing Units | 361 | 68.6% |
| Renter-Occupied Housing Units | 165 | 31.4% |
| Total Occupied Housing Units | 526 | 100.0% |
Occupancy by Household Size in Tombstone
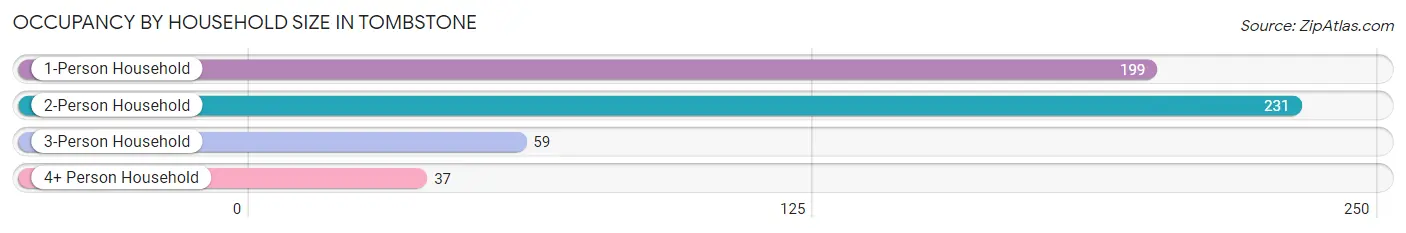
| Household Size | # Housing Units | % Housing Units |
| 1-Person Household | 199 | 37.8% |
| 2-Person Household | 231 | 43.9% |
| 3-Person Household | 59 | 11.2% |
| 4+ Person Household | 37 | 7.0% |
| Total Housing Units | 526 | 100.0% |
Occupancy by Ownership by Household Size in Tombstone
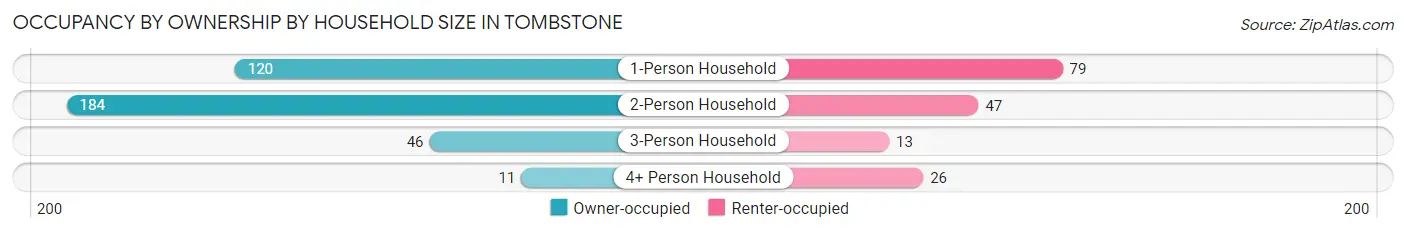
| Household Size | Owner-occupied | Renter-occupied |
| 1-Person Household | 120 (60.3%) | 79 (39.7%) |
| 2-Person Household | 184 (79.6%) | 47 (20.3%) |
| 3-Person Household | 46 (78.0%) | 13 (22.0%) |
| 4+ Person Household | 11 (29.7%) | 26 (70.3%) |
| Total Housing Units | 361 (68.6%) | 165 (31.4%) |
Occupancy by Educational Attainment in Tombstone
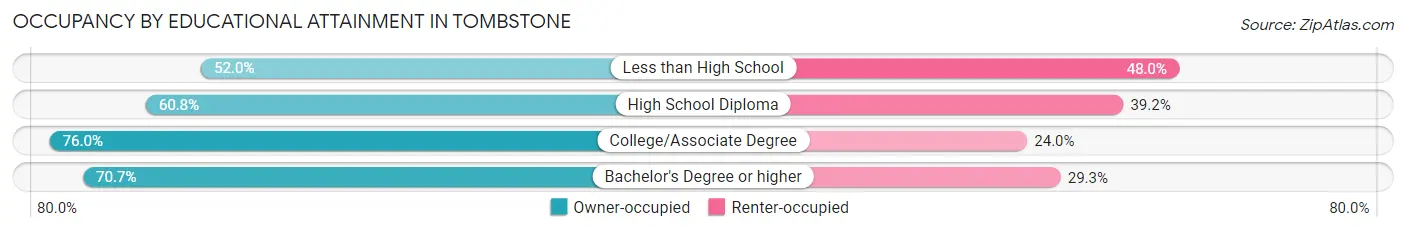
| Household Size | Owner-occupied | Renter-occupied |
| Less than High School | 13 (52.0%) | 12 (48.0%) |
| High School Diploma | 110 (60.8%) | 71 (39.2%) |
| College/Associate Degree | 168 (76.0%) | 53 (24.0%) |
| Bachelor's Degree or higher | 70 (70.7%) | 29 (29.3%) |
Occupancy by Age of Householder in Tombstone
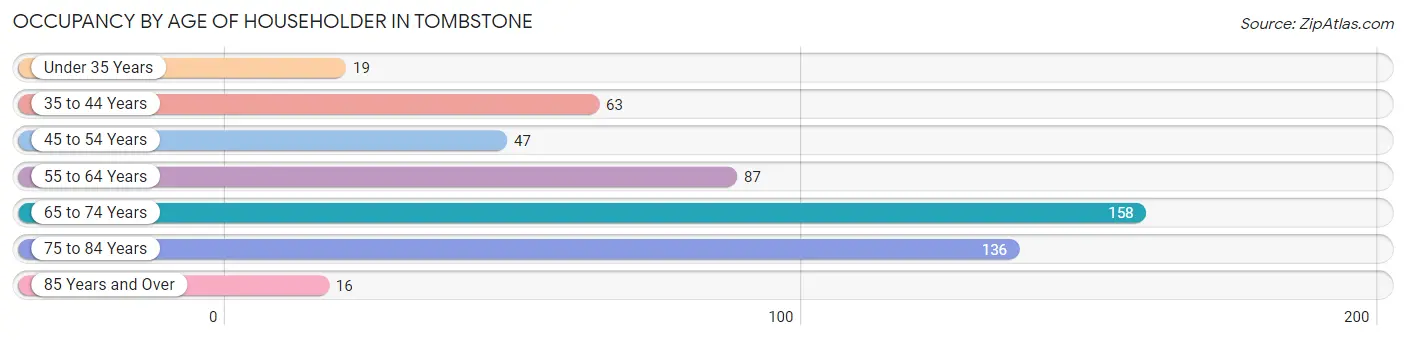
| Age Bracket | # Households | % Households |
| Under 35 Years | 19 | 3.6% |
| 35 to 44 Years | 63 | 12.0% |
| 45 to 54 Years | 47 | 8.9% |
| 55 to 64 Years | 87 | 16.5% |
| 65 to 74 Years | 158 | 30.0% |
| 75 to 84 Years | 136 | 25.9% |
| 85 Years and Over | 16 | 3.0% |
| Total | 526 | 100.0% |
Housing Finances in Tombstone
Median Income by Occupancy in Tombstone
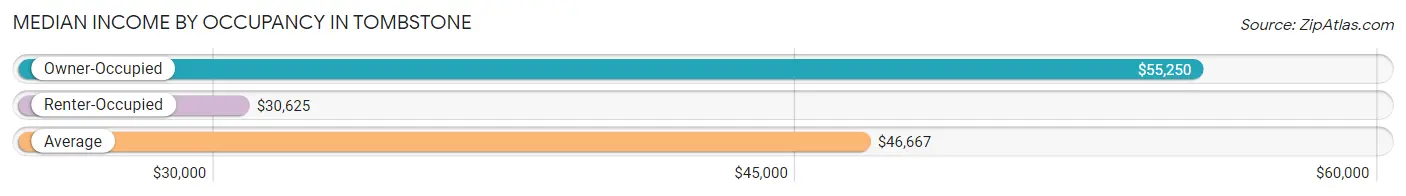
| Occupancy Type | # Households | Median Income |
| Owner-Occupied | 361 (68.6%) | $55,250 |
| Renter-Occupied | 165 (31.4%) | $30,625 |
| Average | 526 (100.0%) | $46,667 |
Occupancy by Householder Income Bracket in Tombstone
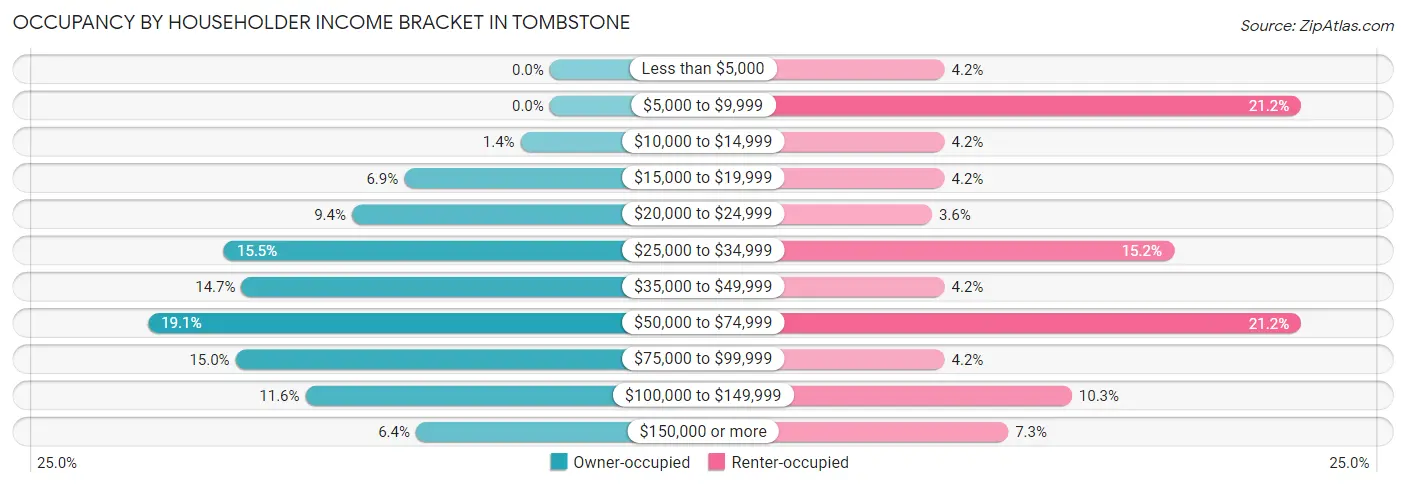
| Income Bracket | Owner-occupied | Renter-occupied |
| Less than $5,000 | 0 (0.0%) | 7 (4.2%) |
| $5,000 to $9,999 | 0 (0.0%) | 35 (21.2%) |
| $10,000 to $14,999 | 5 (1.4%) | 7 (4.2%) |
| $15,000 to $19,999 | 25 (6.9%) | 7 (4.2%) |
| $20,000 to $24,999 | 34 (9.4%) | 6 (3.6%) |
| $25,000 to $34,999 | 56 (15.5%) | 25 (15.1%) |
| $35,000 to $49,999 | 53 (14.7%) | 7 (4.2%) |
| $50,000 to $74,999 | 69 (19.1%) | 35 (21.2%) |
| $75,000 to $99,999 | 54 (15.0%) | 7 (4.2%) |
| $100,000 to $149,999 | 42 (11.6%) | 17 (10.3%) |
| $150,000 or more | 23 (6.4%) | 12 (7.3%) |
| Total | 361 (100.0%) | 165 (100.0%) |
Monthly Housing Cost Tiers in Tombstone
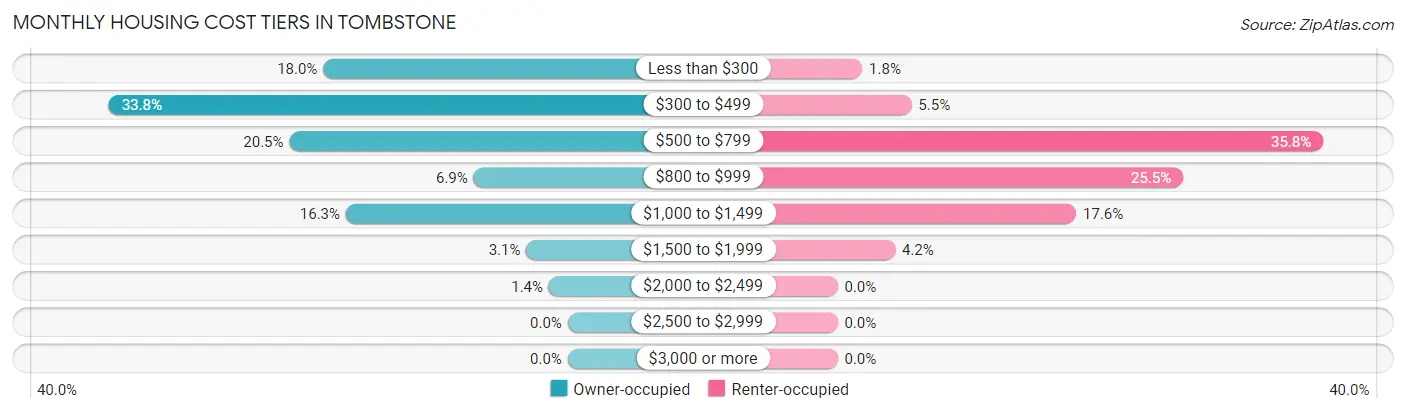
| Monthly Cost | Owner-occupied | Renter-occupied |
| Less than $300 | 65 (18.0%) | 3 (1.8%) |
| $300 to $499 | 122 (33.8%) | 9 (5.4%) |
| $500 to $799 | 74 (20.5%) | 59 (35.8%) |
| $800 to $999 | 25 (6.9%) | 42 (25.5%) |
| $1,000 to $1,499 | 59 (16.3%) | 29 (17.6%) |
| $1,500 to $1,999 | 11 (3.0%) | 7 (4.2%) |
| $2,000 to $2,499 | 5 (1.4%) | 0 (0.0%) |
| $2,500 to $2,999 | 0 (0.0%) | 0 (0.0%) |
| $3,000 or more | 0 (0.0%) | 0 (0.0%) |
| Total | 361 (100.0%) | 165 (100.0%) |
Physical Housing Characteristics in Tombstone
Housing Structures in Tombstone
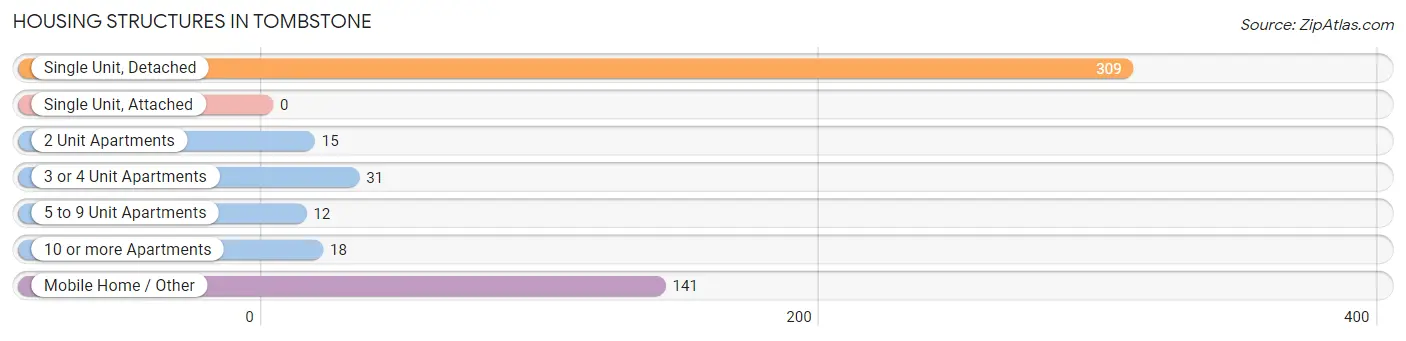
| Structure Type | # Housing Units | % Housing Units |
| Single Unit, Detached | 309 | 58.8% |
| Single Unit, Attached | 0 | 0.0% |
| 2 Unit Apartments | 15 | 2.9% |
| 3 or 4 Unit Apartments | 31 | 5.9% |
| 5 to 9 Unit Apartments | 12 | 2.3% |
| 10 or more Apartments | 18 | 3.4% |
| Mobile Home / Other | 141 | 26.8% |
| Total | 526 | 100.0% |
Housing Structures by Occupancy in Tombstone
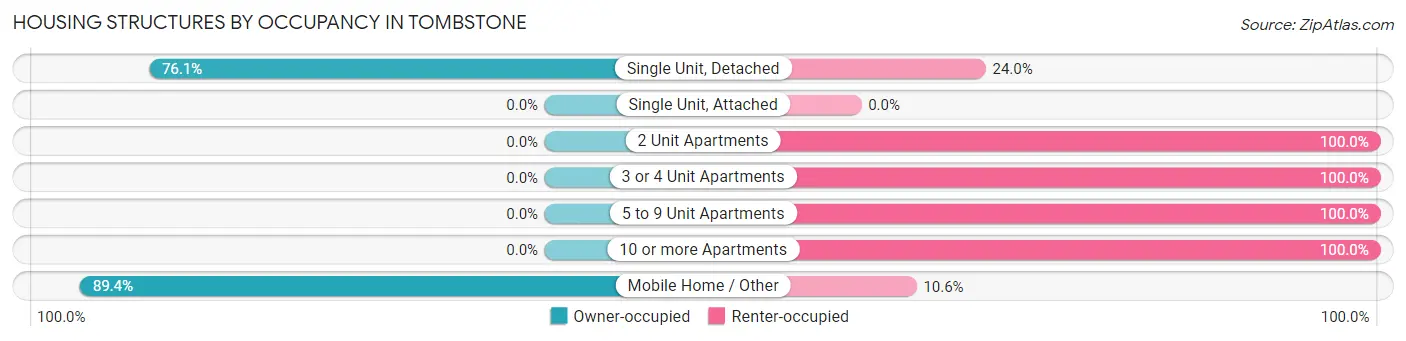
| Structure Type | Owner-occupied | Renter-occupied |
| Single Unit, Detached | 235 (76.0%) | 74 (23.9%) |
| Single Unit, Attached | 0 (0.0%) | 0 (0.0%) |
| 2 Unit Apartments | 0 (0.0%) | 15 (100.0%) |
| 3 or 4 Unit Apartments | 0 (0.0%) | 31 (100.0%) |
| 5 to 9 Unit Apartments | 0 (0.0%) | 12 (100.0%) |
| 10 or more Apartments | 0 (0.0%) | 18 (100.0%) |
| Mobile Home / Other | 126 (89.4%) | 15 (10.6%) |
| Total | 361 (68.6%) | 165 (31.4%) |
Housing Structures by Number of Rooms in Tombstone
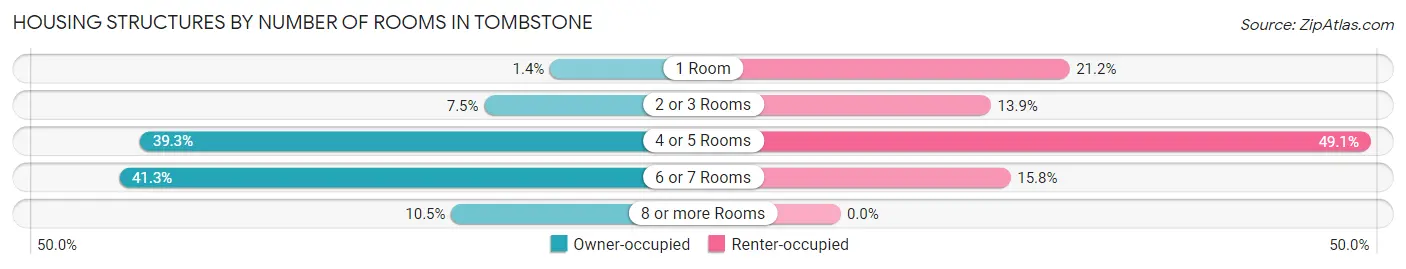
| Number of Rooms | Owner-occupied | Renter-occupied |
| 1 Room | 5 (1.4%) | 35 (21.2%) |
| 2 or 3 Rooms | 27 (7.5%) | 23 (13.9%) |
| 4 or 5 Rooms | 142 (39.3%) | 81 (49.1%) |
| 6 or 7 Rooms | 149 (41.3%) | 26 (15.8%) |
| 8 or more Rooms | 38 (10.5%) | 0 (0.0%) |
| Total | 361 (100.0%) | 165 (100.0%) |
Housing Structure by Heating Type in Tombstone
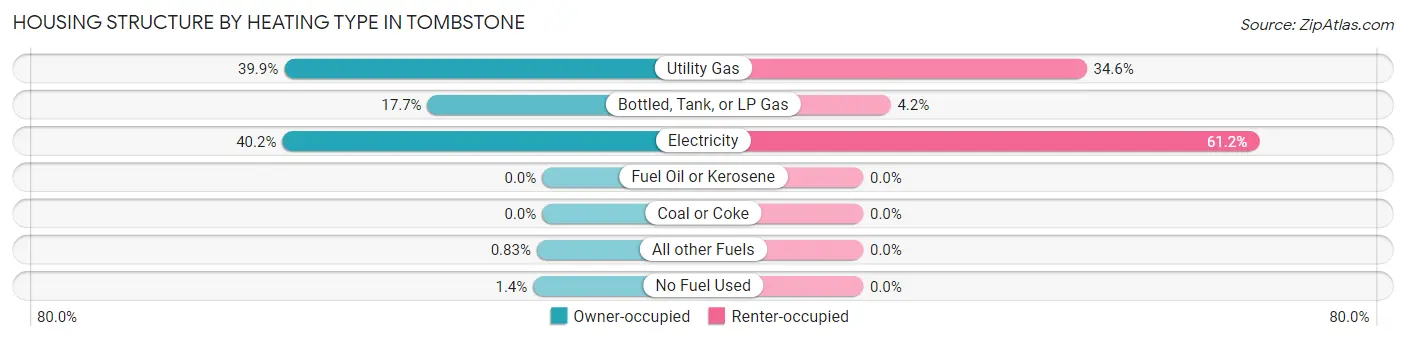
| Heating Type | Owner-occupied | Renter-occupied |
| Utility Gas | 144 (39.9%) | 57 (34.5%) |
| Bottled, Tank, or LP Gas | 64 (17.7%) | 7 (4.2%) |
| Electricity | 145 (40.2%) | 101 (61.2%) |
| Fuel Oil or Kerosene | 0 (0.0%) | 0 (0.0%) |
| Coal or Coke | 0 (0.0%) | 0 (0.0%) |
| All other Fuels | 3 (0.8%) | 0 (0.0%) |
| No Fuel Used | 5 (1.4%) | 0 (0.0%) |
| Total | 361 (100.0%) | 165 (100.0%) |
Household Vehicle Usage in Tombstone
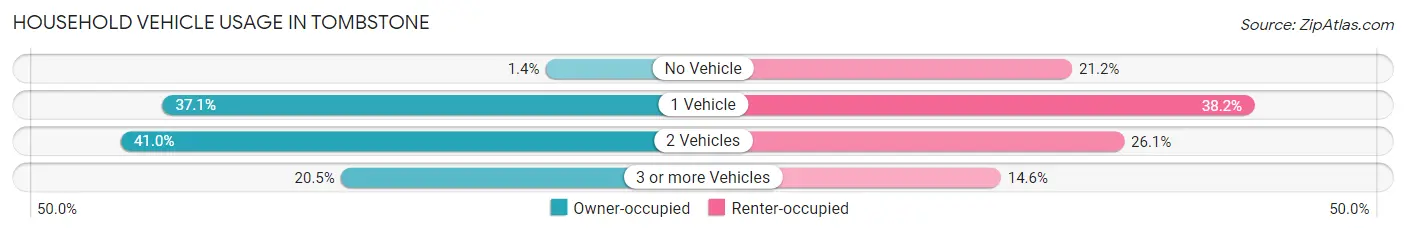
| Vehicles per Household | Owner-occupied | Renter-occupied |
| No Vehicle | 5 (1.4%) | 35 (21.2%) |
| 1 Vehicle | 134 (37.1%) | 63 (38.2%) |
| 2 Vehicles | 148 (41.0%) | 43 (26.1%) |
| 3 or more Vehicles | 74 (20.5%) | 24 (14.5%) |
| Total | 361 (100.0%) | 165 (100.0%) |
Real Estate & Mortgages in Tombstone
Real Estate and Mortgage Overview in Tombstone
| Characteristic | Without Mortgage | With Mortgage |
| Housing Units | 206 | 155 |
| Median Property Value | $144,100 | $138,000 |
| Median Household Income | $39,167 | $17 |
| Monthly Housing Costs | $359 | $0 |
| Real Estate Taxes | $839 | $0 |
Property Value by Mortgage Status in Tombstone
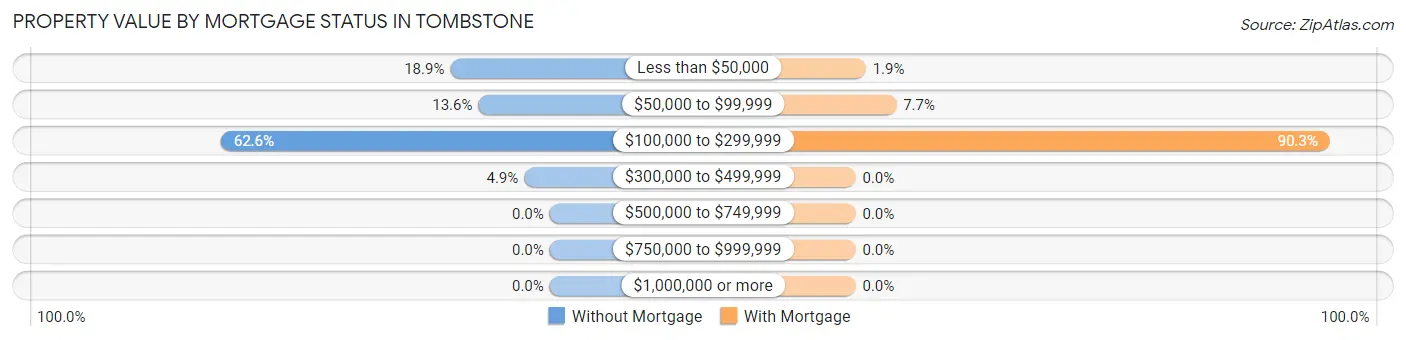
| Property Value | Without Mortgage | With Mortgage |
| Less than $50,000 | 39 (18.9%) | 3 (1.9%) |
| $50,000 to $99,999 | 28 (13.6%) | 12 (7.7%) |
| $100,000 to $299,999 | 129 (62.6%) | 140 (90.3%) |
| $300,000 to $499,999 | 10 (4.9%) | 0 (0.0%) |
| $500,000 to $749,999 | 0 (0.0%) | 0 (0.0%) |
| $750,000 to $999,999 | 0 (0.0%) | 0 (0.0%) |
| $1,000,000 or more | 0 (0.0%) | 0 (0.0%) |
| Total | 206 (100.0%) | 155 (100.0%) |
Household Income by Mortgage Status in Tombstone
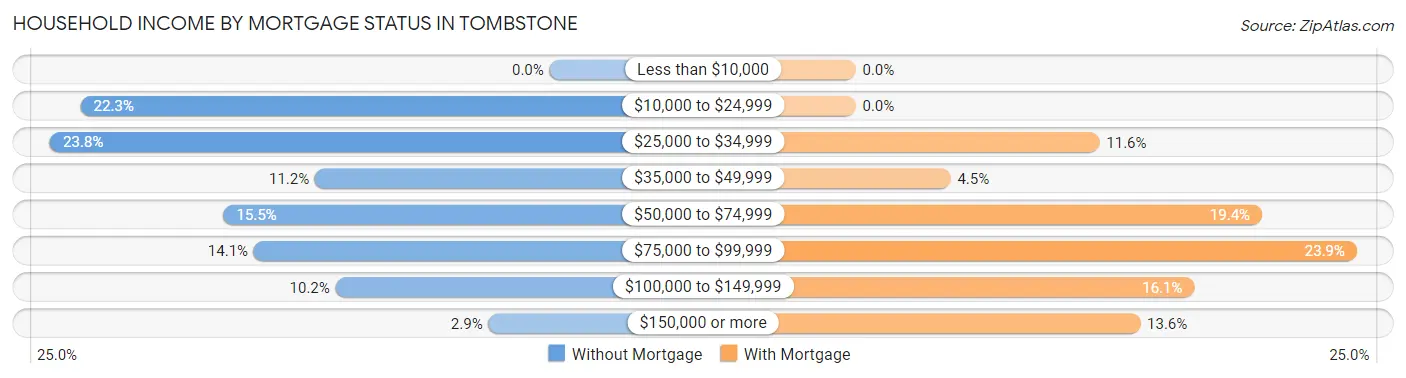
| Household Income | Without Mortgage | With Mortgage |
| Less than $10,000 | 0 (0.0%) | 0 (0.0%) |
| $10,000 to $24,999 | 46 (22.3%) | 0 (0.0%) |
| $25,000 to $34,999 | 49 (23.8%) | 18 (11.6%) |
| $35,000 to $49,999 | 23 (11.2%) | 7 (4.5%) |
| $50,000 to $74,999 | 32 (15.5%) | 30 (19.4%) |
| $75,000 to $99,999 | 29 (14.1%) | 37 (23.9%) |
| $100,000 to $149,999 | 21 (10.2%) | 25 (16.1%) |
| $150,000 or more | 6 (2.9%) | 21 (13.6%) |
| Total | 206 (100.0%) | 155 (100.0%) |
Property Value to Household Income Ratio in Tombstone
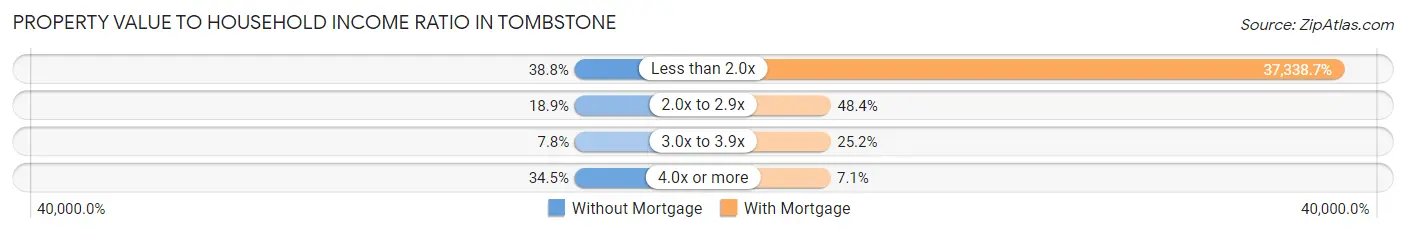
| Value-to-Income Ratio | Without Mortgage | With Mortgage |
| Less than 2.0x | 80 (38.8%) | 57,875 (37,338.7%) |
| 2.0x to 2.9x | 39 (18.9%) | 75 (48.4%) |
| 3.0x to 3.9x | 16 (7.8%) | 39 (25.2%) |
| 4.0x or more | 71 (34.5%) | 11 (7.1%) |
| Total | 206 (100.0%) | 155 (100.0%) |
Real Estate Taxes by Mortgage Status in Tombstone
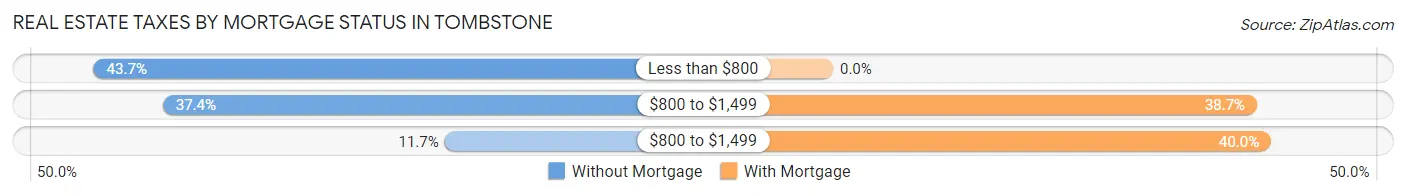
| Property Taxes | Without Mortgage | With Mortgage |
| Less than $800 | 90 (43.7%) | 0 (0.0%) |
| $800 to $1,499 | 77 (37.4%) | 60 (38.7%) |
| $800 to $1,499 | 24 (11.7%) | 62 (40.0%) |
| Total | 206 (100.0%) | 155 (100.0%) |
Health & Disability in Tombstone
Health Insurance Coverage by Age in Tombstone
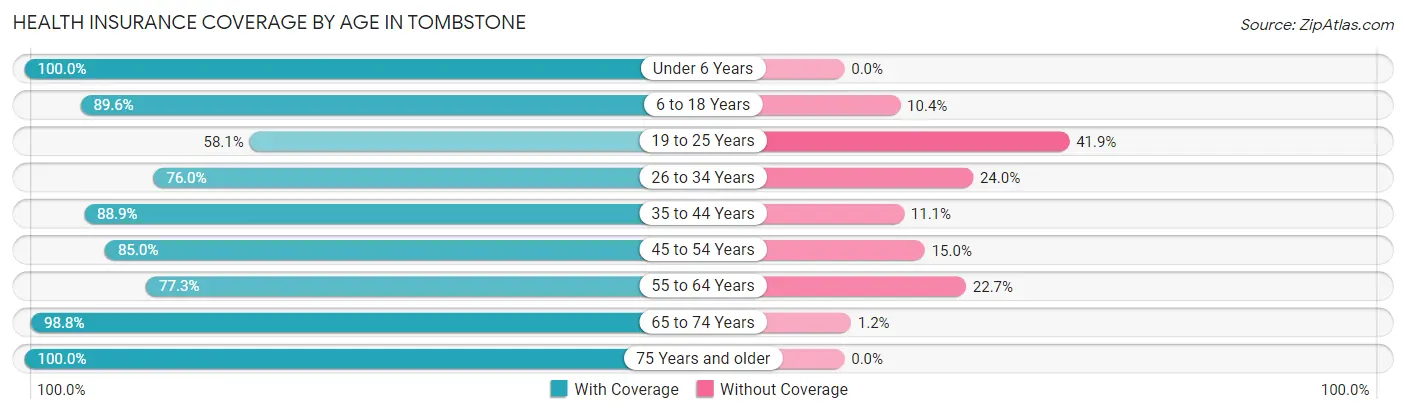
| Age Bracket | With Coverage | Without Coverage |
| Under 6 Years | 43 (100.0%) | 0 (0.0%) |
| 6 to 18 Years | 86 (89.6%) | 10 (10.4%) |
| 19 to 25 Years | 36 (58.1%) | 26 (41.9%) |
| 26 to 34 Years | 19 (76.0%) | 6 (24.0%) |
| 35 to 44 Years | 96 (88.9%) | 12 (11.1%) |
| 45 to 54 Years | 102 (85.0%) | 18 (15.0%) |
| 55 to 64 Years | 116 (77.3%) | 34 (22.7%) |
| 65 to 74 Years | 242 (98.8%) | 3 (1.2%) |
| 75 Years and older | 197 (100.0%) | 0 (0.0%) |
| Total | 937 (89.6%) | 109 (10.4%) |
Health Insurance Coverage by Citizenship Status in Tombstone
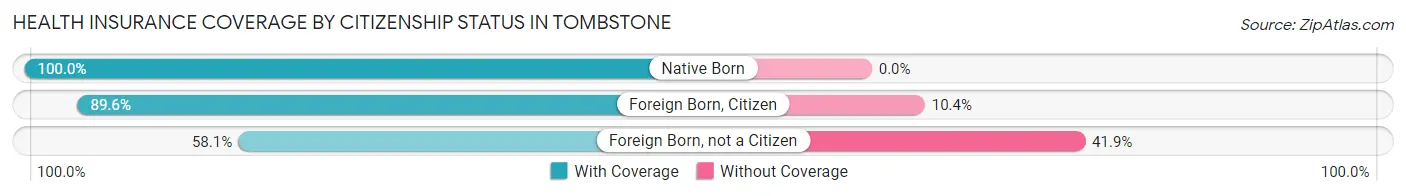
| Citizenship Status | With Coverage | Without Coverage |
| Native Born | 43 (100.0%) | 0 (0.0%) |
| Foreign Born, Citizen | 86 (89.6%) | 10 (10.4%) |
| Foreign Born, not a Citizen | 36 (58.1%) | 26 (41.9%) |
Health Insurance Coverage by Household Income in Tombstone
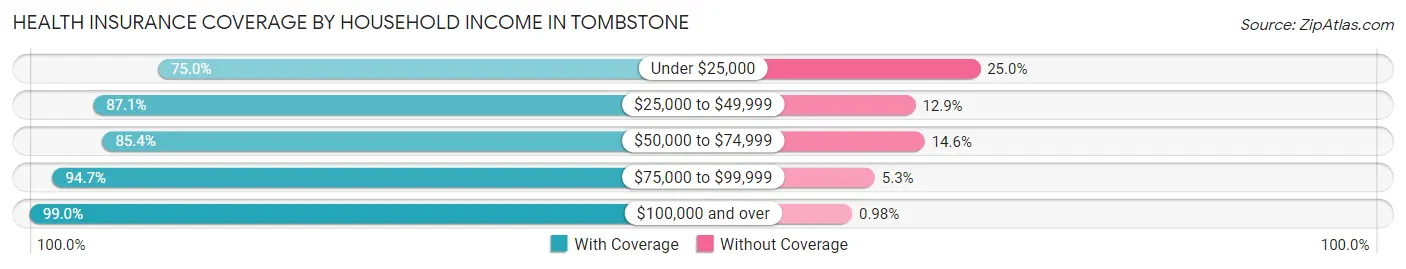
| Household Income | With Coverage | Without Coverage |
| Under $25,000 | 114 (75.0%) | 38 (25.0%) |
| $25,000 to $49,999 | 183 (87.1%) | 27 (12.9%) |
| $50,000 to $74,999 | 193 (85.4%) | 33 (14.6%) |
| $75,000 to $99,999 | 144 (94.7%) | 8 (5.3%) |
| $100,000 and over | 303 (99.0%) | 3 (1.0%) |
Public vs Private Health Insurance Coverage by Age in Tombstone
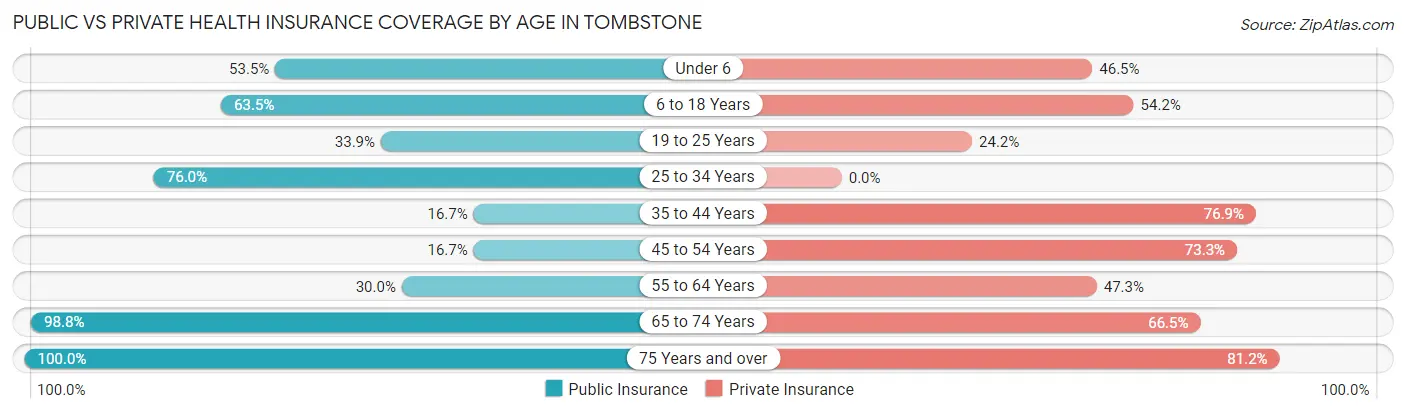
| Age Bracket | Public Insurance | Private Insurance |
| Under 6 | 23 (53.5%) | 20 (46.5%) |
| 6 to 18 Years | 61 (63.5%) | 52 (54.2%) |
| 19 to 25 Years | 21 (33.9%) | 15 (24.2%) |
| 25 to 34 Years | 19 (76.0%) | 0 (0.0%) |
| 35 to 44 Years | 18 (16.7%) | 83 (76.8%) |
| 45 to 54 Years | 20 (16.7%) | 88 (73.3%) |
| 55 to 64 Years | 45 (30.0%) | 71 (47.3%) |
| 65 to 74 Years | 242 (98.8%) | 163 (66.5%) |
| 75 Years and over | 197 (100.0%) | 160 (81.2%) |
| Total | 646 (61.8%) | 652 (62.3%) |
Disability Status by Sex by Age in Tombstone
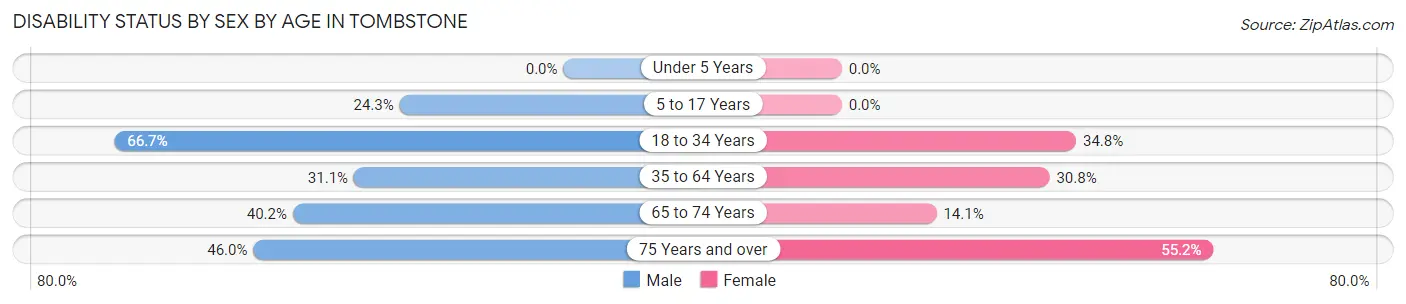
| Age Bracket | Male | Female |
| Under 5 Years | 0 (0.0%) | 0 (0.0%) |
| 5 to 17 Years | 9 (24.3%) | 0 (0.0%) |
| 18 to 34 Years | 16 (66.7%) | 24 (34.8%) |
| 35 to 64 Years | 51 (31.1%) | 66 (30.8%) |
| 65 to 74 Years | 47 (40.2%) | 18 (14.1%) |
| 75 Years and over | 64 (46.0%) | 32 (55.2%) |
Disability Class by Sex by Age in Tombstone
Disability Class: Hearing Difficulty
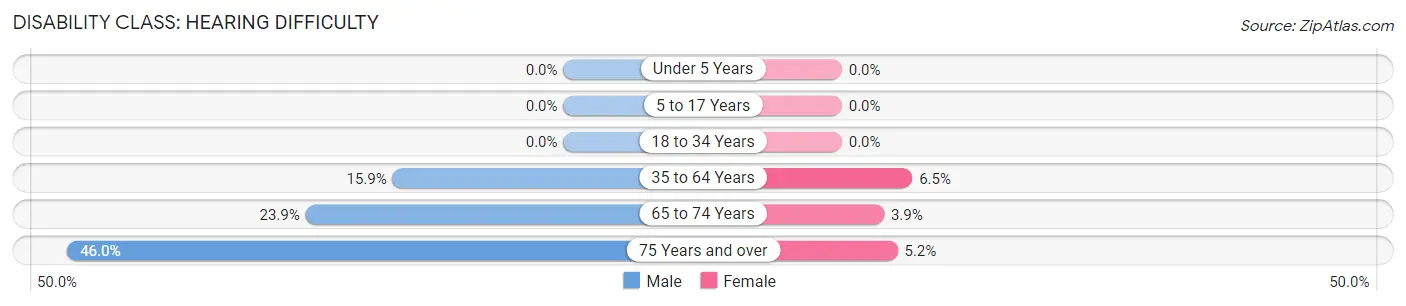
| Age Bracket | Male | Female |
| Under 5 Years | 0 (0.0%) | 0 (0.0%) |
| 5 to 17 Years | 0 (0.0%) | 0 (0.0%) |
| 18 to 34 Years | 0 (0.0%) | 0 (0.0%) |
| 35 to 64 Years | 26 (15.9%) | 14 (6.5%) |
| 65 to 74 Years | 28 (23.9%) | 5 (3.9%) |
| 75 Years and over | 64 (46.0%) | 3 (5.2%) |
Disability Class: Vision Difficulty
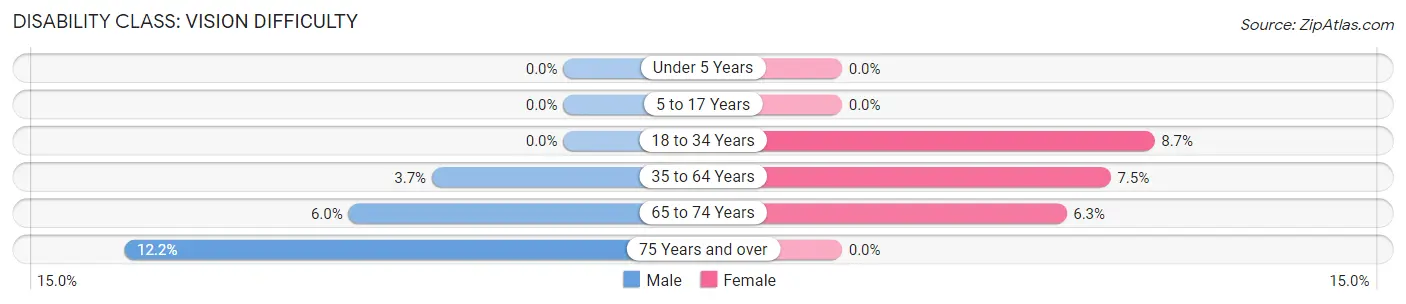
| Age Bracket | Male | Female |
| Under 5 Years | 0 (0.0%) | 0 (0.0%) |
| 5 to 17 Years | 0 (0.0%) | 0 (0.0%) |
| 18 to 34 Years | 0 (0.0%) | 6 (8.7%) |
| 35 to 64 Years | 6 (3.7%) | 16 (7.5%) |
| 65 to 74 Years | 7 (6.0%) | 8 (6.2%) |
| 75 Years and over | 17 (12.2%) | 0 (0.0%) |
Disability Class: Cognitive Difficulty
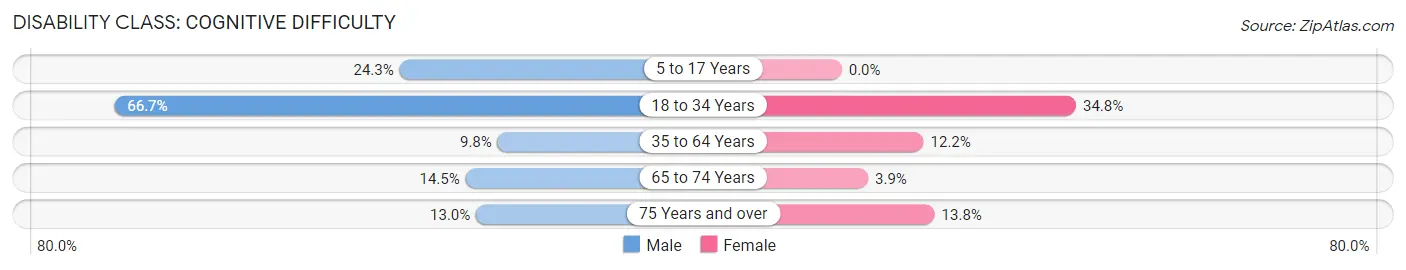
| Age Bracket | Male | Female |
| 5 to 17 Years | 9 (24.3%) | 0 (0.0%) |
| 18 to 34 Years | 16 (66.7%) | 24 (34.8%) |
| 35 to 64 Years | 16 (9.8%) | 26 (12.1%) |
| 65 to 74 Years | 17 (14.5%) | 5 (3.9%) |
| 75 Years and over | 18 (13.0%) | 8 (13.8%) |
Disability Class: Ambulatory Difficulty
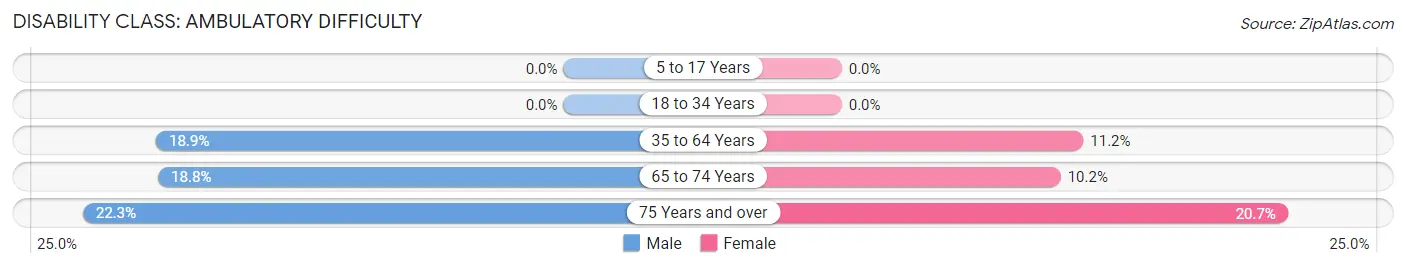
| Age Bracket | Male | Female |
| 5 to 17 Years | 0 (0.0%) | 0 (0.0%) |
| 18 to 34 Years | 0 (0.0%) | 0 (0.0%) |
| 35 to 64 Years | 31 (18.9%) | 24 (11.2%) |
| 65 to 74 Years | 22 (18.8%) | 13 (10.2%) |
| 75 Years and over | 31 (22.3%) | 12 (20.7%) |
Disability Class: Self-Care Difficulty
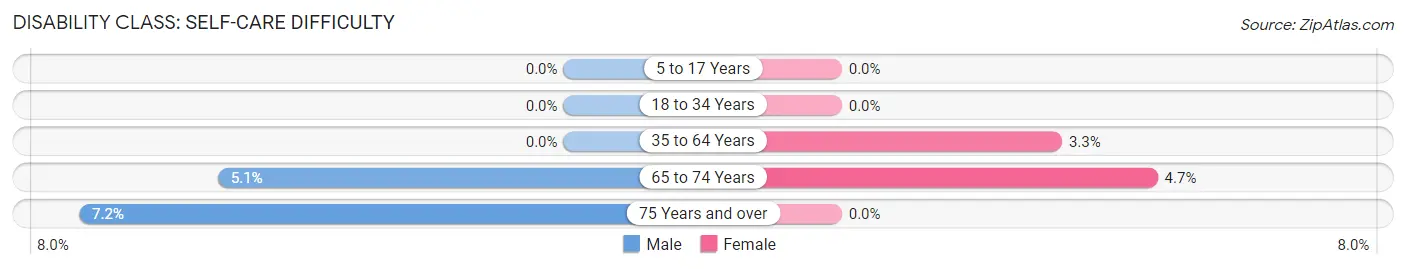
| Age Bracket | Male | Female |
| 5 to 17 Years | 0 (0.0%) | 0 (0.0%) |
| 18 to 34 Years | 0 (0.0%) | 0 (0.0%) |
| 35 to 64 Years | 0 (0.0%) | 7 (3.3%) |
| 65 to 74 Years | 6 (5.1%) | 6 (4.7%) |
| 75 Years and over | 10 (7.2%) | 0 (0.0%) |
Technology Access in Tombstone
Computing Device Access in Tombstone
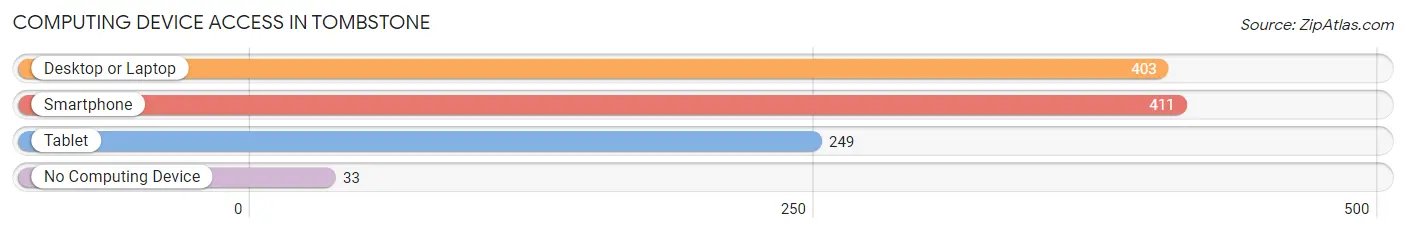
| Device Type | # Households | % Households |
| Desktop or Laptop | 403 | 76.6% |
| Smartphone | 411 | 78.1% |
| Tablet | 249 | 47.3% |
| No Computing Device | 33 | 6.3% |
| Total | 526 | 100.0% |
Internet Access in Tombstone
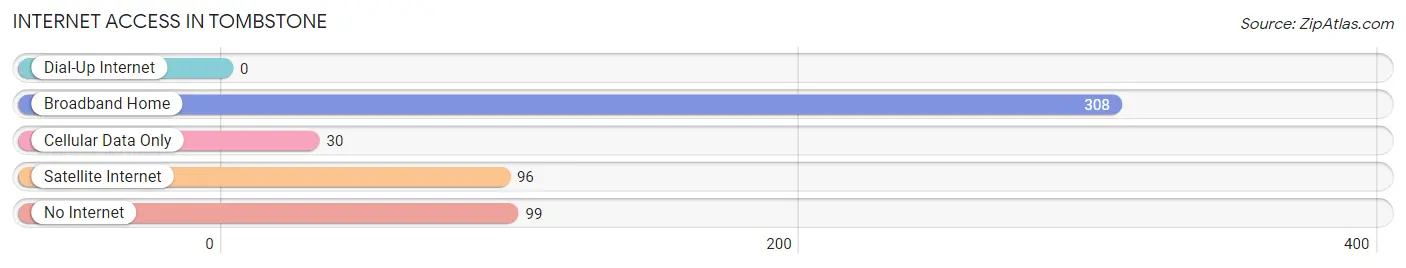
| Internet Type | # Households | % Households |
| Dial-Up Internet | 0 | 0.0% |
| Broadband Home | 308 | 58.6% |
| Cellular Data Only | 30 | 5.7% |
| Satellite Internet | 96 | 18.2% |
| No Internet | 99 | 18.8% |
| Total | 526 | 100.0% |
Tombstone Summary
Tombstone, Arizona is a small town located in Cochise County in the southeastern corner of the state. It is best known for its role in the Wild West, as it was the site of the famous Gunfight at the O.K. Corral in 1881. The town has a rich history, unique geography, and a diverse economy and population.
History
Tombstone was founded in 1879 by Ed Schieffelin, a prospector who had been warned by the U.S. Army that all he would find in the area was his own tombstone. He found silver instead, and the town quickly grew as prospectors flocked to the area. The town was incorporated in 1881 and soon became a bustling mining town with a population of over 14,000.
The town is most famous for the Gunfight at the O.K. Corral, which took place on October 26, 1881. The gunfight was between the Earp brothers and the Clanton-McLaury gang, and resulted in the deaths of three of the gang members. The gunfight has become a symbol of the Wild West and has been featured in numerous films and television shows.
Tombstone continued to thrive until the late 1890s, when the silver mines began to run dry. The population began to decline and by 1910, it had dropped to just over 1,500. The town continued to decline until the 1950s, when it began to attract tourists due to its Wild West history. The town has since become a popular tourist destination, and its population has grown to over 1,800.
Geography
Tombstone is located in the southeastern corner of Arizona, in Cochise County. It is situated in the San Pedro Valley, at an elevation of 4,400 feet. The town is surrounded by the Dragoon Mountains to the east and the Huachuca Mountains to the west. The San Pedro River runs through the valley, providing a source of water for the town.
The climate in Tombstone is semi-arid, with hot summers and mild winters. The average high temperature in July is 95°F, and the average low temperature in January is 33°F. The town receives an average of 12 inches of precipitation per year, most of which falls in the summer months.
Economy
Tombstone’s economy is largely based on tourism. The town is a popular destination for visitors interested in its Wild West history, and it is home to numerous attractions, including the O.K. Corral, Boot Hill Cemetery, and the Bird Cage Theater. The town also has several restaurants, hotels, and shops catering to tourists.
In addition to tourism, Tombstone is also home to several small businesses, including a winery, a brewery, and a distillery. The town also has a small manufacturing sector, which produces a variety of products, including furniture, clothing, and jewelry.
Demographics
As of the 2010 census, the population of Tombstone was 1,857. The town is predominantly white, with 78.3% of the population identifying as such. The next largest racial group is Hispanic or Latino, at 17.3%. The median household income in Tombstone is $37,917, and the median age is 44.7. The town has a poverty rate of 17.3%, which is higher than the national average.
Tombstone is a small town with a rich history, unique geography, and a diverse economy and population. It is best known for its role in the Wild West, and it continues to attract visitors interested in its history and culture. The town has a variety of attractions and businesses, and its population is diverse and growing.
Common Questions
What is Per Capita Income in Tombstone?
Per Capita income in Tombstone is $30,851.
What is the Median Family Income in Tombstone?
Median Family Income in Tombstone is $72,083.
What is the Median Household income in Tombstone?
Median Household Income in Tombstone is $46,667.
What is Income or Wage Gap in Tombstone?
Income or Wage Gap in Tombstone is 24.0%.
Women in Tombstone earn 76.0 cents for every dollar earned by a man.
What is Inequality or Gini Index in Tombstone?
Inequality or Gini Index in Tombstone is 0.41.
What is the Total Population of Tombstone?
Total Population of Tombstone is 1,046.
What is the Total Male Population of Tombstone?
Total Male Population of Tombstone is 492.
What is the Total Female Population of Tombstone?
Total Female Population of Tombstone is 554.
What is the Ratio of Males per 100 Females in Tombstone?
There are 88.81 Males per 100 Females in Tombstone.
What is the Ratio of Females per 100 Males in Tombstone?
There are 112.60 Females per 100 Males in Tombstone.
What is the Median Population Age in Tombstone?
Median Population Age in Tombstone is 59.6 Years.
What is the Average Family Size in Tombstone
Average Family Size in Tombstone is 2.6 People.
What is the Average Household Size in Tombstone
Average Household Size in Tombstone is 2.0 People.
How Large is the Labor Force in Tombstone?
There are 417 People in the Labor Forcein in Tombstone.
What is the Percentage of People in the Labor Force in Tombstone?
44.9% of People are in the Labor Force in Tombstone.
What is the Unemployment Rate in Tombstone?
Unemployment Rate in Tombstone is 2.9%.