Summit, AZ Map & Demographics
Summit Map
Summit Overview
$19,767
PER CAPITA INCOME
$43,877
AVG FAMILY INCOME
$42,133
AVG HOUSEHOLD INCOME
43.5%
WAGE / INCOME GAP [ % ]
56.5¢/ $1
WAGE / INCOME GAP [ $ ]
$9,422
FAMILY INCOME DEFICIT
0.40
INEQUALITY / GINI INDEX
5,022
TOTAL POPULATION
2,700
MALE POPULATION
2,322
FEMALE POPULATION
116.28
MALES / 100 FEMALES
86.00
FEMALES / 100 MALES
40.9
MEDIAN AGE
4.0
AVG FAMILY SIZE
3.6
AVG HOUSEHOLD SIZE
2,402
LABOR FORCE [ PEOPLE ]
57.5%
PERCENT IN LABOR FORCE
28.0%
UNEMPLOYMENT RATE
Income in Summit
Income Overview in Summit
Per Capita Income in Summit is $19,767, while median incomes of families and households are $43,877 and $42,133 respectively.
| Characteristic | Number | Measure |
| Per Capita Income | 5,022 | $19,767 |
| Median Family Income | 1,098 | $43,877 |
| Mean Family Income | 1,098 | $57,773 |
| Median Household Income | 1,386 | $42,133 |
| Mean Household Income | 1,386 | $53,388 |
| Income Deficit | 1,098 | $9,422 |
| Wage / Income Gap (%) | 5,022 | 43.52% |
| Wage / Income Gap ($) | 5,022 | 56.48¢ per $1 |
| Gini / Inequality Index | 5,022 | 0.40 |
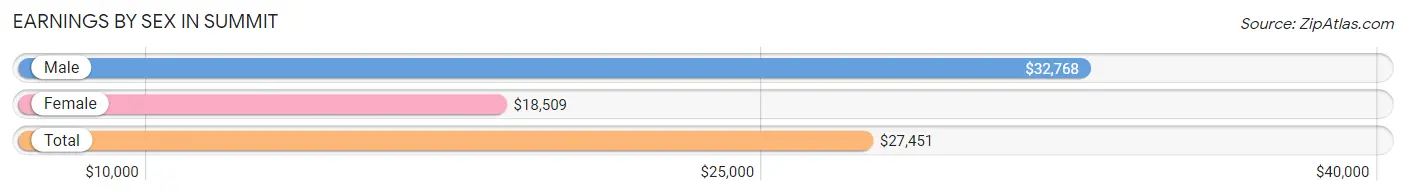
Earnings by Sex in Summit
Average Earnings in Summit are $27,451, $32,768 for men and $18,509 for women, a difference of 43.5%.
| Sex | Number | Average Earnings |
| Male | 1,364 (61.3%) | $32,768 |
| Female | 863 (38.8%) | $18,509 |
| Total | 2,227 (100.0%) | $27,451 |
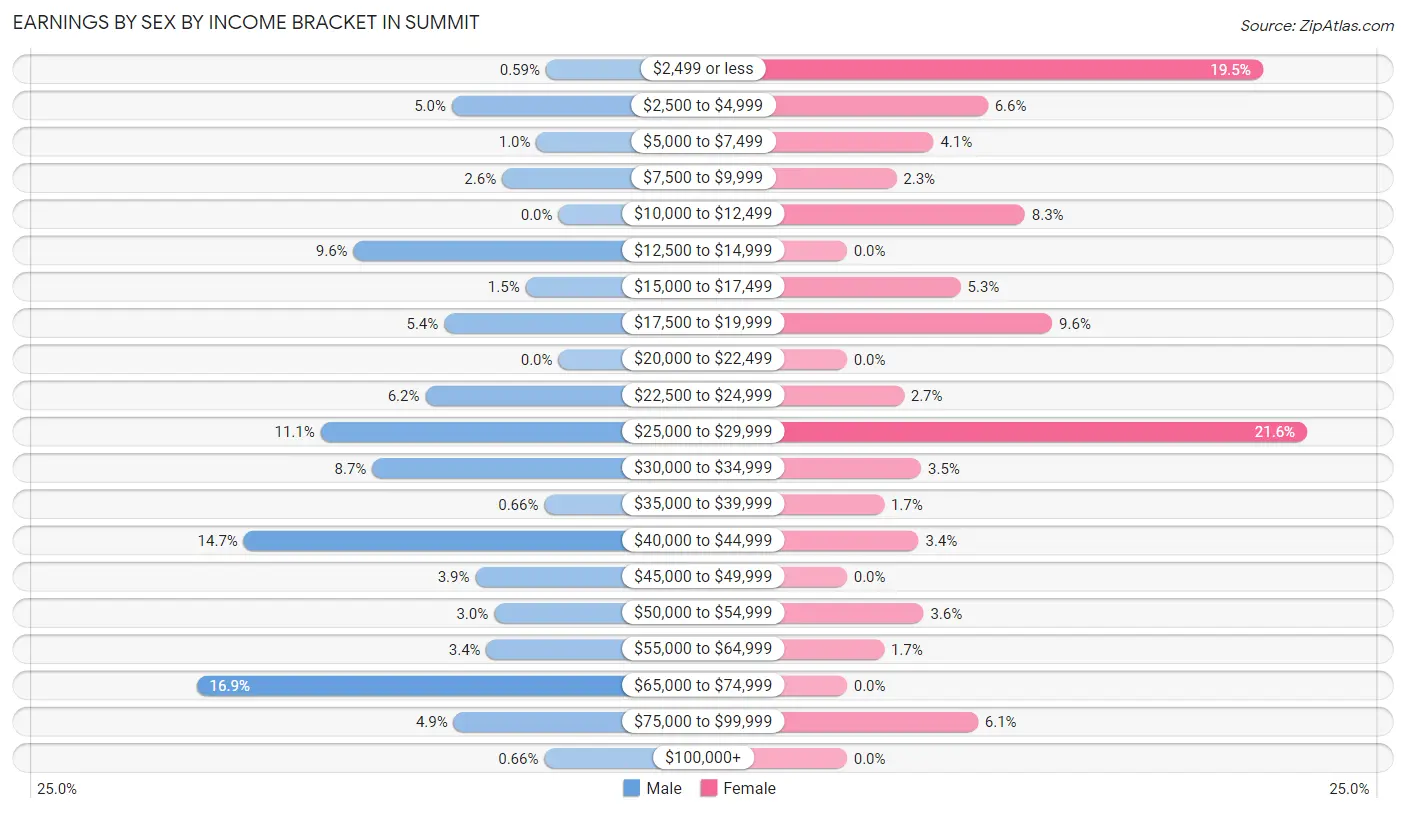
Earnings by Sex by Income Bracket in Summit
The most common earnings brackets in Summit are $65,000 to $74,999 for men (231 | 16.9%) and $25,000 to $29,999 for women (186 | 21.5%).
| Income | Male | Female |
| $2,499 or less | 8 (0.6%) | 168 (19.5%) |
| $2,500 to $4,999 | 68 (5.0%) | 57 (6.6%) |
| $5,000 to $7,499 | 14 (1.0%) | 35 (4.1%) |
| $7,500 to $9,999 | 36 (2.6%) | 20 (2.3%) |
| $10,000 to $12,499 | 0 (0.0%) | 72 (8.3%) |
| $12,500 to $14,999 | 131 (9.6%) | 0 (0.0%) |
| $15,000 to $17,499 | 21 (1.5%) | 46 (5.3%) |
| $17,500 to $19,999 | 73 (5.3%) | 83 (9.6%) |
| $20,000 to $22,499 | 0 (0.0%) | 0 (0.0%) |
| $22,500 to $24,999 | 85 (6.2%) | 23 (2.7%) |
| $25,000 to $29,999 | 152 (11.1%) | 186 (21.5%) |
| $30,000 to $34,999 | 119 (8.7%) | 30 (3.5%) |
| $35,000 to $39,999 | 9 (0.7%) | 15 (1.7%) |
| $40,000 to $44,999 | 201 (14.7%) | 29 (3.4%) |
| $45,000 to $49,999 | 53 (3.9%) | 0 (0.0%) |
| $50,000 to $54,999 | 41 (3.0%) | 31 (3.6%) |
| $55,000 to $64,999 | 46 (3.4%) | 15 (1.7%) |
| $65,000 to $74,999 | 231 (16.9%) | 0 (0.0%) |
| $75,000 to $99,999 | 67 (4.9%) | 53 (6.1%) |
| $100,000+ | 9 (0.7%) | 0 (0.0%) |
| Total | 1,364 (100.0%) | 863 (100.0%) |
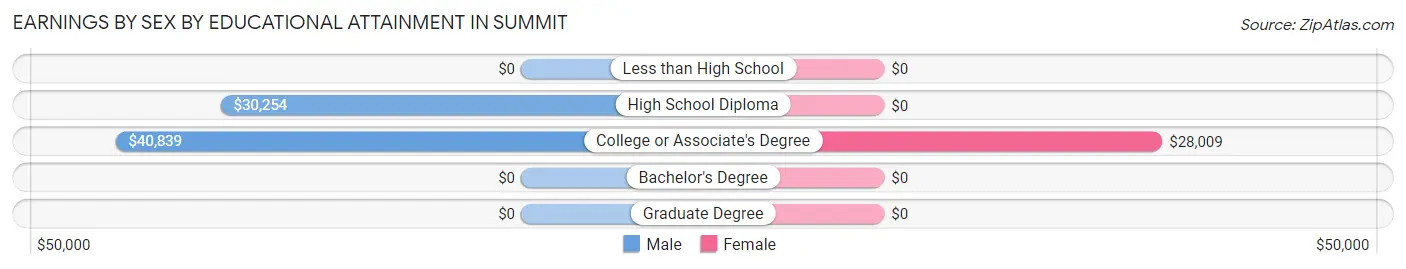
Earnings by Sex by Educational Attainment in Summit
Average earnings in Summit are $40,926 for men and $25,161 for women, a difference of 38.5%. Men with an educational attainment of college or associate's degree enjoy the highest average annual earnings of $40,839, while those with high school diploma education earn the least with $30,254. Women with an educational attainment of college or associate's degree earn the most with the average annual earnings of $28,009, while those with college or associate's degree education have the smallest earnings of $28,009.
| Educational Attainment | Male Income | Female Income |
| Less than High School | - | - |
| High School Diploma | $30,254 | $0 |
| College or Associate's Degree | $40,839 | $28,009 |
| Bachelor's Degree | - | - |
| Graduate Degree | - | - |
| Total | $40,926 | $25,161 |
Family Income in Summit
Family Income Brackets in Summit
According to the Summit family income data, there are 284 families falling into the $35,000 to $49,999 income range, which is the most common income bracket and makes up 25.9% of all families. Conversely, the $200,000+ income bracket is the least frequent group with only 9 families (0.8%) belonging to this category.
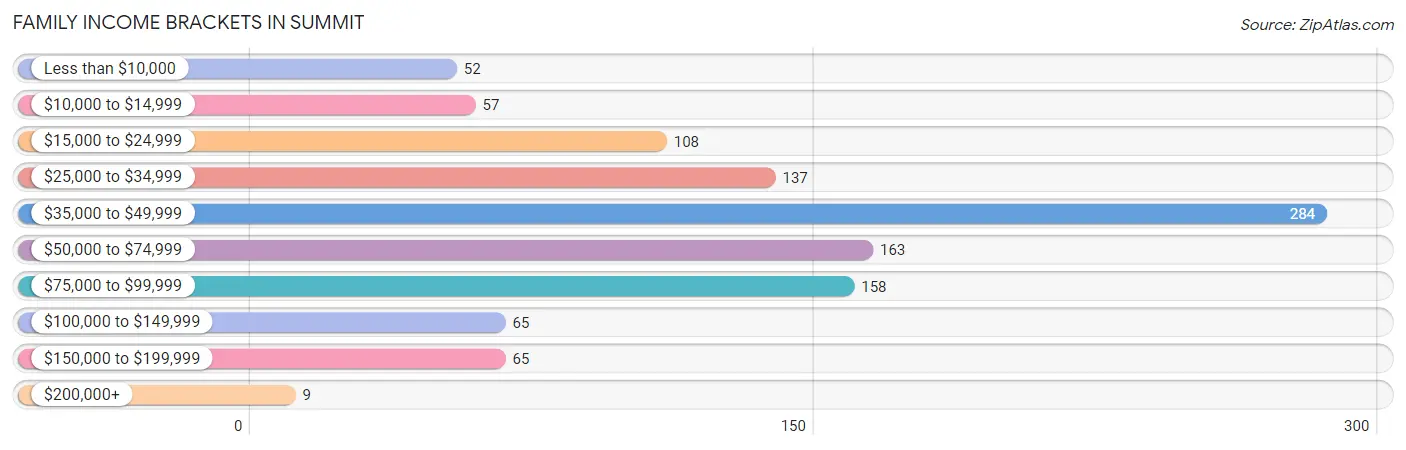
| Income Bracket | # Families | % Families |
| Less than $10,000 | 52 | 4.7% |
| $10,000 to $14,999 | 57 | 5.2% |
| $15,000 to $24,999 | 108 | 9.8% |
| $25,000 to $34,999 | 137 | 12.5% |
| $35,000 to $49,999 | 284 | 25.9% |
| $50,000 to $74,999 | 163 | 14.8% |
| $75,000 to $99,999 | 158 | 14.4% |
| $100,000 to $149,999 | 65 | 5.9% |
| $150,000 to $199,999 | 65 | 5.9% |
| $200,000+ | 9 | 0.8% |
Family Income by Famaliy Size in Summit
3-person families (248 | 22.6%) account for the highest median family income in Summit with $56,250 per family, while 2-person families (406 | 37.0%) have the highest median income of $20,729 per family member.
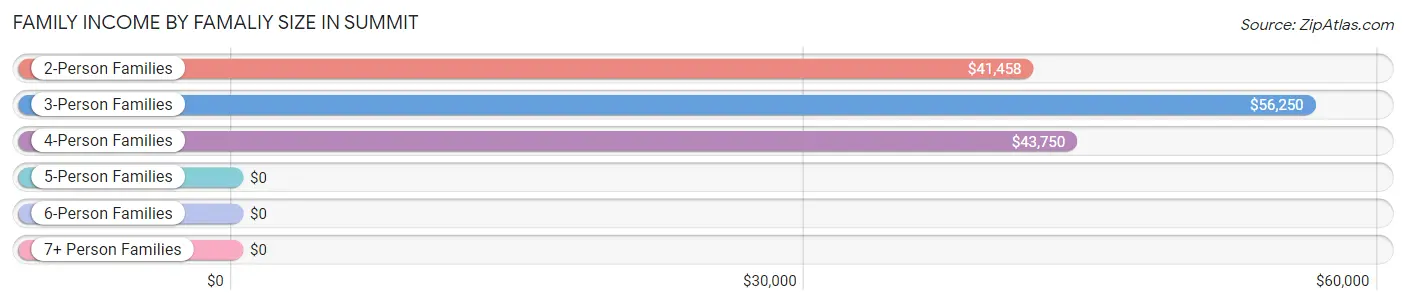
| Income Bracket | # Families | Median Income |
| 2-Person Families | 406 (37.0%) | $41,458 |
| 3-Person Families | 248 (22.6%) | $56,250 |
| 4-Person Families | 294 (26.8%) | $43,750 |
| 5-Person Families | 91 (8.3%) | $0 |
| 6-Person Families | 53 (4.8%) | $0 |
| 7+ Person Families | 6 (0.5%) | $0 |
| Total | 1,098 (100.0%) | $43,877 |
Family Income by Number of Earners in Summit
The median family income in Summit is $43,877, with families comprising 3+ earners (129) having the highest median family income of $96,417, while families with 1 earner (633) have the lowest median family income of $40,641, accounting for 11.7% and 57.7% of families, respectively.
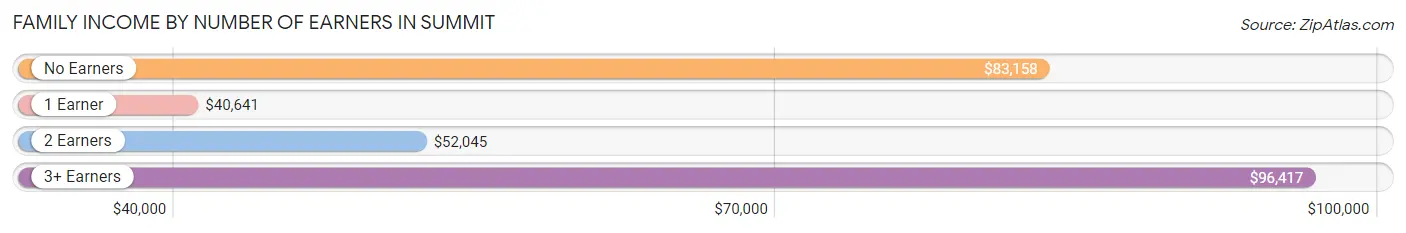
| Number of Earners | # Families | Median Income |
| No Earners | 66 (6.0%) | $83,158 |
| 1 Earner | 633 (57.7%) | $40,641 |
| 2 Earners | 270 (24.6%) | $52,045 |
| 3+ Earners | 129 (11.7%) | $96,417 |
| Total | 1,098 (100.0%) | $43,877 |
Household Income in Summit
Household Income Brackets in Summit
With 258 households falling in the category, the $35,000 to $49,999 income range is the most frequent in Summit, accounting for 18.6% of all households. In contrast, only 8 households (0.6%) fall into the $200,000+ income bracket, making it the least populous group.
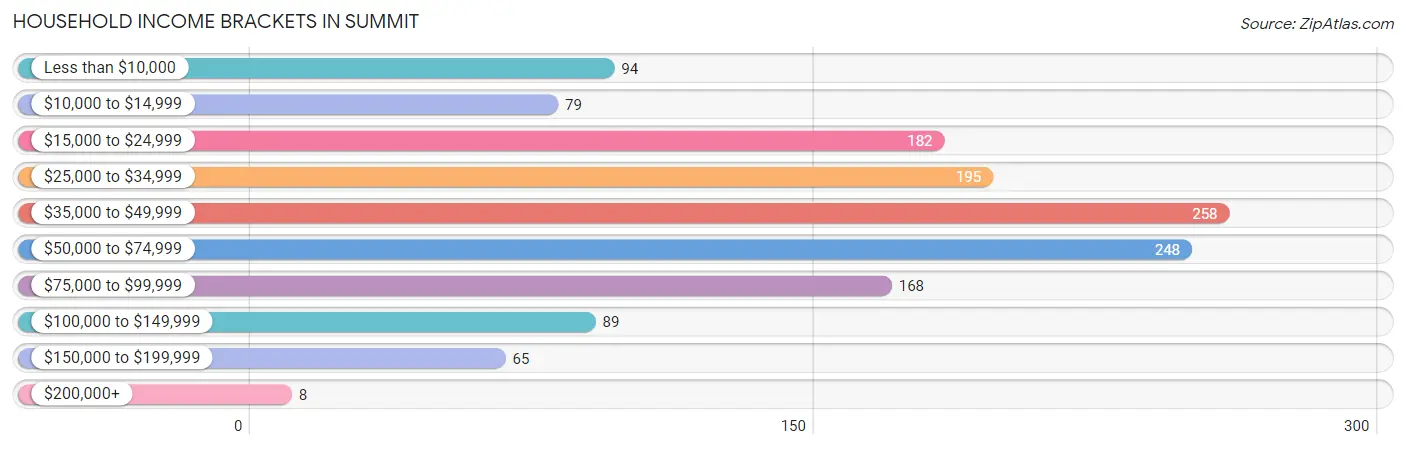
| Income Bracket | # Households | % Households |
| Less than $10,000 | 94 | 6.8% |
| $10,000 to $14,999 | 79 | 5.7% |
| $15,000 to $24,999 | 182 | 13.1% |
| $25,000 to $34,999 | 195 | 14.1% |
| $35,000 to $49,999 | 258 | 18.6% |
| $50,000 to $74,999 | 248 | 17.9% |
| $75,000 to $99,999 | 168 | 12.1% |
| $100,000 to $149,999 | 89 | 6.4% |
| $150,000 to $199,999 | 65 | 4.7% |
| $200,000+ | 8 | 0.6% |
Household Income by Householder Age in Summit
The median household income in Summit is $42,133, with the highest median household income of $55,313 found in the 65+ years age bracket for the primary householder. A total of 274 households (19.8%) fall into this category. Meanwhile, the 15 to 24 years age bracket for the primary householder has the lowest median household income of $30,565, with 76 households (5.5%) in this group.
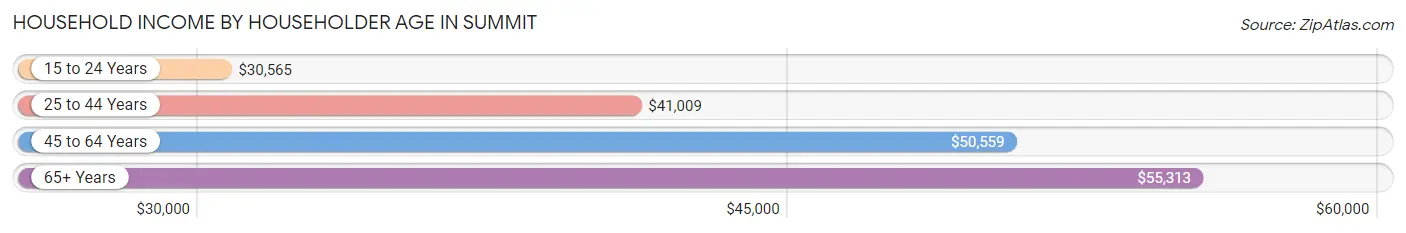
| Income Bracket | # Households | Median Income |
| 15 to 24 Years | 76 (5.5%) | $30,565 |
| 25 to 44 Years | 452 (32.6%) | $41,009 |
| 45 to 64 Years | 584 (42.1%) | $50,559 |
| 65+ Years | 274 (19.8%) | $55,313 |
| Total | 1,386 (100.0%) | $42,133 |
Poverty in Summit
Income Below Poverty by Sex and Age in Summit
With 20.3% poverty level for males and 45.1% for females among the residents of Summit, 15 year old males and 5 year old females are the most vulnerable to poverty, with 19 males (100.0%) and 22 females (100.0%) in their respective age groups living below the poverty level.
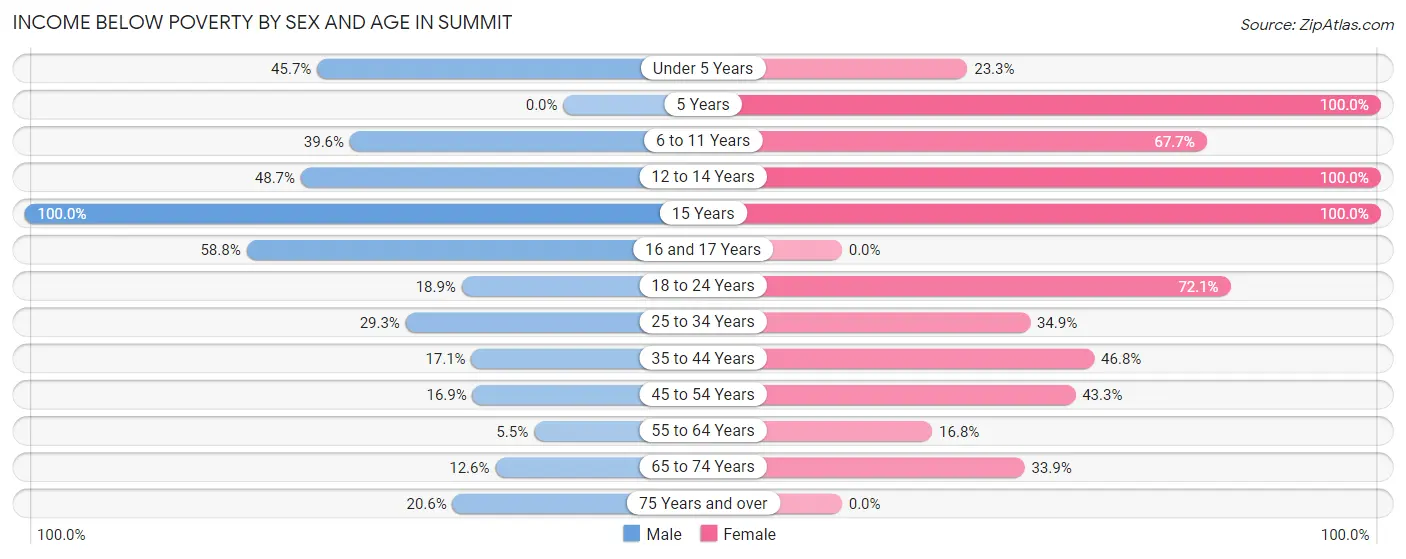
| Age Bracket | Male | Female |
| Under 5 Years | 69 (45.7%) | 24 (23.3%) |
| 5 Years | 0 (0.0%) | 22 (100.0%) |
| 6 to 11 Years | 86 (39.6%) | 109 (67.7%) |
| 12 to 14 Years | 19 (48.7%) | 86 (100.0%) |
| 15 Years | 19 (100.0%) | 47 (100.0%) |
| 16 and 17 Years | 10 (58.8%) | 0 (0.0%) |
| 18 to 24 Years | 50 (18.9%) | 321 (72.1%) |
| 25 to 34 Years | 115 (29.3%) | 73 (34.9%) |
| 35 to 44 Years | 43 (17.1%) | 111 (46.8%) |
| 45 to 54 Years | 60 (16.9%) | 104 (43.3%) |
| 55 to 64 Years | 43 (5.4%) | 53 (16.8%) |
| 65 to 74 Years | 12 (12.6%) | 98 (33.9%) |
| 75 Years and over | 22 (20.6%) | 0 (0.0%) |
| Total | 548 (20.3%) | 1,048 (45.1%) |
Income Above Poverty by Sex and Age in Summit
According to the poverty statistics in Summit, males aged 55 to 64 years and females aged 16 and 17 years are the age groups that are most secure financially, with 94.6% of males and 100.0% of females in these age groups living above the poverty line.
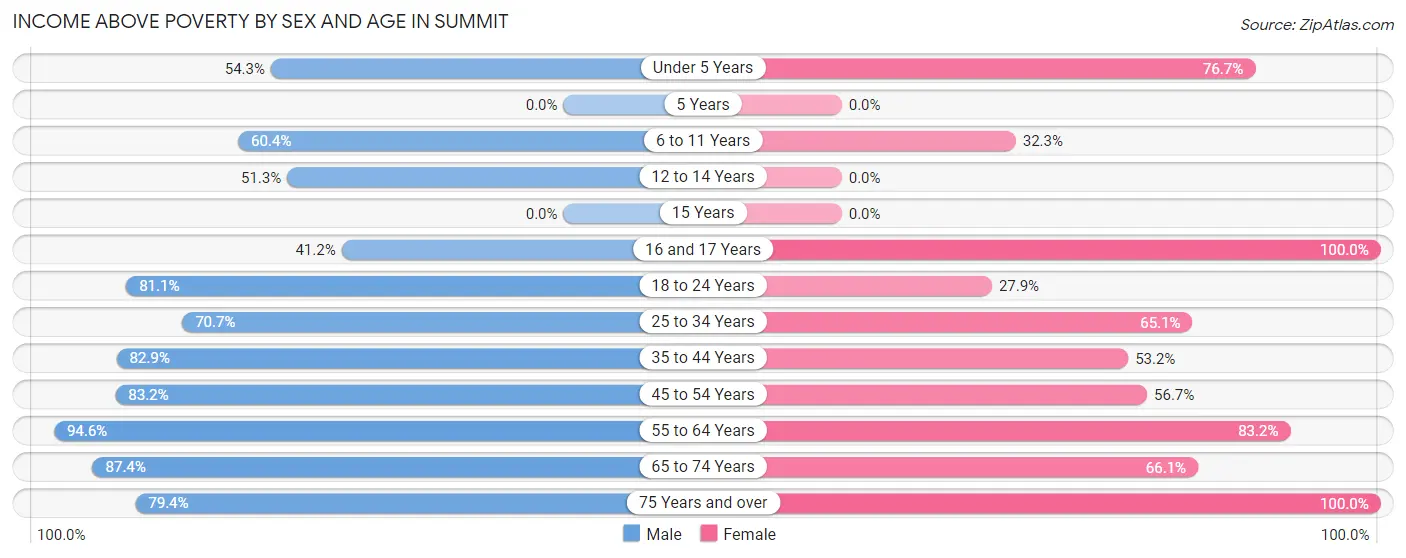
| Age Bracket | Male | Female |
| Under 5 Years | 82 (54.3%) | 79 (76.7%) |
| 5 Years | 0 (0.0%) | 0 (0.0%) |
| 6 to 11 Years | 131 (60.4%) | 52 (32.3%) |
| 12 to 14 Years | 20 (51.3%) | 0 (0.0%) |
| 15 Years | 0 (0.0%) | 0 (0.0%) |
| 16 and 17 Years | 7 (41.2%) | 55 (100.0%) |
| 18 to 24 Years | 215 (81.1%) | 124 (27.9%) |
| 25 to 34 Years | 278 (70.7%) | 136 (65.1%) |
| 35 to 44 Years | 209 (82.9%) | 126 (53.2%) |
| 45 to 54 Years | 296 (83.2%) | 136 (56.7%) |
| 55 to 64 Years | 746 (94.6%) | 263 (83.2%) |
| 65 to 74 Years | 83 (87.4%) | 191 (66.1%) |
| 75 Years and over | 85 (79.4%) | 112 (100.0%) |
| Total | 2,152 (79.7%) | 1,274 (54.9%) |
Income Below Poverty Among Married-Couple Families in Summit
The poverty statistics for married-couple families in Summit show that 11.4% or 67 of the total 590 families live below the poverty line. Families with 3 or 4 children have the highest poverty rate of 65.6%, comprising of 21 families. On the other hand, families with no children have the lowest poverty rate of 5.5%, which includes 21 families.
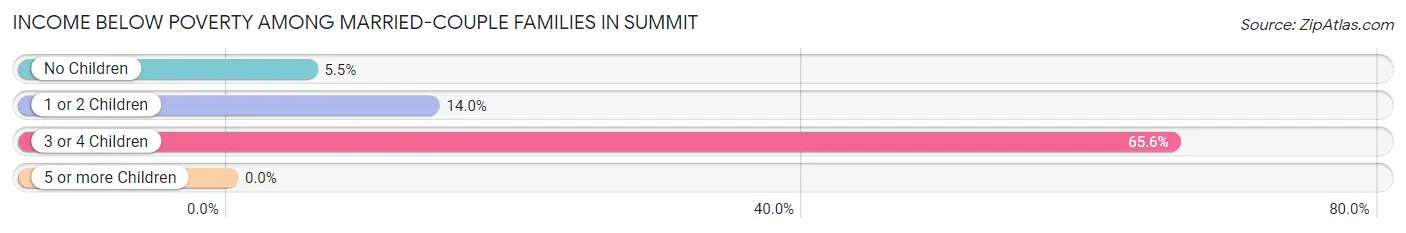
| Children | Above Poverty | Below Poverty |
| No Children | 359 (94.5%) | 21 (5.5%) |
| 1 or 2 Children | 153 (86.0%) | 25 (14.0%) |
| 3 or 4 Children | 11 (34.4%) | 21 (65.6%) |
| 5 or more Children | 0 (0.0%) | 0 (0.0%) |
| Total | 523 (88.6%) | 67 (11.4%) |
Income Below Poverty Among Single-Parent Households in Summit
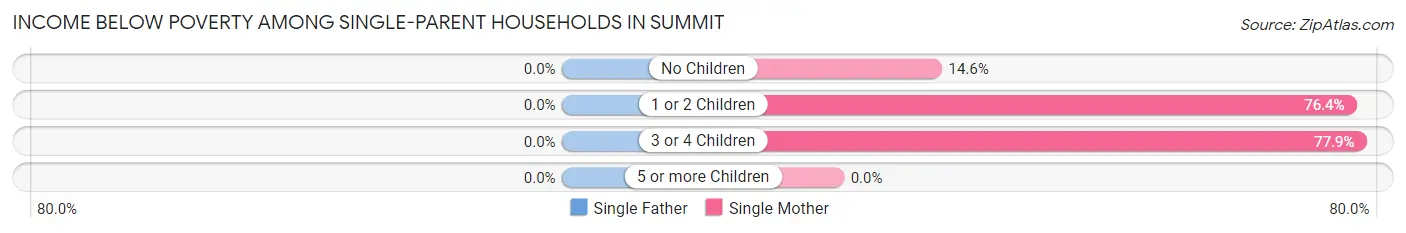
| Children | Single Father | Single Mother |
| No Children | 0 (0.0%) | 21 (14.6%) |
| 1 or 2 Children | 0 (0.0%) | 110 (76.4%) |
| 3 or 4 Children | 0 (0.0%) | 81 (77.9%) |
| 5 or more Children | 0 (0.0%) | 0 (0.0%) |
| Total | 0 (0.0%) | 212 (54.1%) |
Income Below Poverty Among Married-Couple vs Single-Parent Households in Summit
The poverty data for Summit shows that 67 of the married-couple family households (11.4%) and 212 of the single-parent households (41.7%) are living below the poverty level. Within the married-couple family households, those with 3 or 4 children have the highest poverty rate, with 21 households (65.6%) falling below the poverty line. Among the single-parent households, those with 3 or 4 children have the highest poverty rate, with 81 household (77.9%) living below poverty.
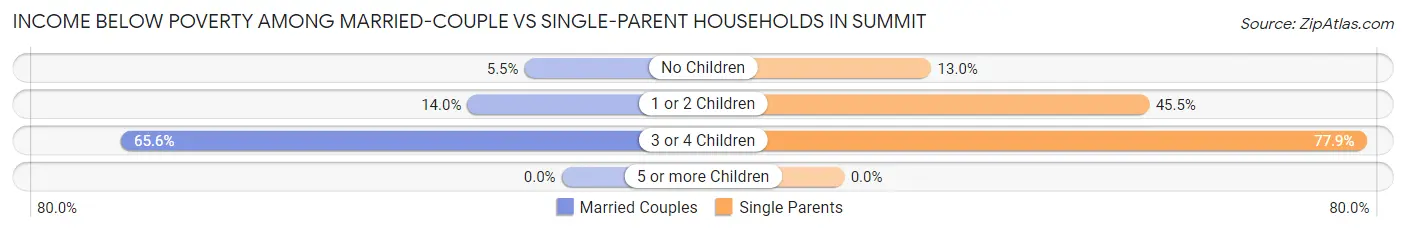
| Children | Married-Couple Families | Single-Parent Households |
| No Children | 21 (5.5%) | 21 (13.0%) |
| 1 or 2 Children | 25 (14.0%) | 110 (45.5%) |
| 3 or 4 Children | 21 (65.6%) | 81 (77.9%) |
| 5 or more Children | 0 (0.0%) | 0 (0.0%) |
| Total | 67 (11.4%) | 212 (41.7%) |
Race in Summit
The most populous races in Summit are Hispanic or Latino (4,445 | 88.5%), Some other Race (1,721 | 34.3%), and Two or more Races (1,676 | 33.4%).
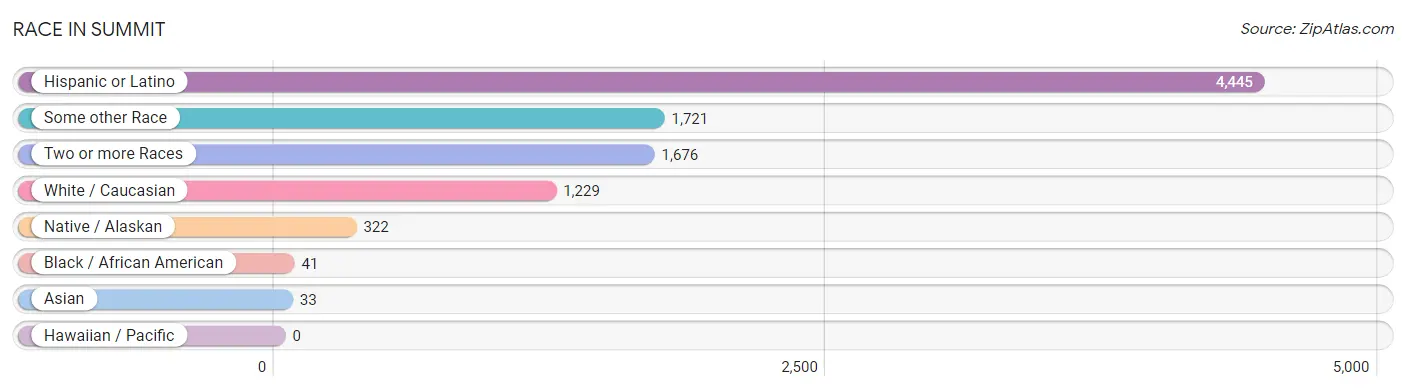
| Race | # Population | % Population |
| Asian | 33 | 0.7% |
| Black / African American | 41 | 0.8% |
| Hawaiian / Pacific | 0 | 0.0% |
| Hispanic or Latino | 4,445 | 88.5% |
| Native / Alaskan | 322 | 6.4% |
| White / Caucasian | 1,229 | 24.5% |
| Two or more Races | 1,676 | 33.4% |
| Some other Race | 1,721 | 34.3% |
| Total | 5,022 | 100.0% |
Ancestry in Summit
The most populous ancestries reported in Summit are Mexican (3,644 | 72.6%), Spaniard (691 | 13.8%), American (217 | 4.3%), Tohono O'Odham (115 | 2.3%), and Yaqui (109 | 2.2%), together accounting for 95.1% of all Summit residents.
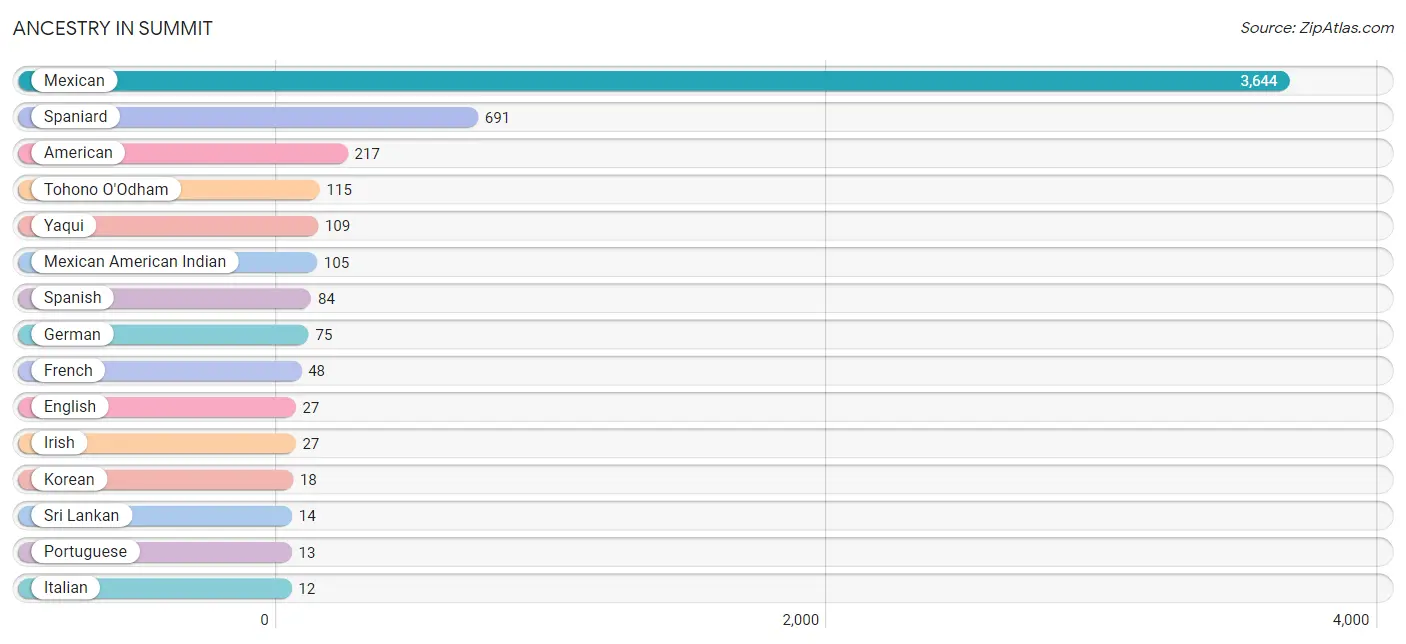
| Ancestry | # Population | % Population |
| American | 217 | 4.3% |
| Apache | 8 | 0.2% |
| Cuban | 10 | 0.2% |
| English | 27 | 0.5% |
| European | 6 | 0.1% |
| French | 48 | 1.0% |
| German | 75 | 1.5% |
| Irish | 27 | 0.5% |
| Italian | 12 | 0.2% |
| Korean | 18 | 0.4% |
| Mexican | 3,644 | 72.6% |
| Mexican American Indian | 105 | 2.1% |
| Polish | 1 | 0.0% |
| Portuguese | 13 | 0.3% |
| Puerto Rican | 1 | 0.0% |
| Scotch-Irish | 9 | 0.2% |
| Spaniard | 691 | 13.8% |
| Spanish | 84 | 1.7% |
| Sri Lankan | 14 | 0.3% |
| Thai | 9 | 0.2% |
| Tohono O'Odham | 115 | 2.3% |
| Yaqui | 109 | 2.2% | View All 22 Rows |
Immigrants in Summit
The most numerous immigrant groups reported in Summit came from Latin America (1,455 | 29.0%), Central America (1,436 | 28.6%), Mexico (1,431 | 28.5%), Caribbean (19 | 0.4%), and Asia (14 | 0.3%), together accounting for 86.7% of all Summit residents.
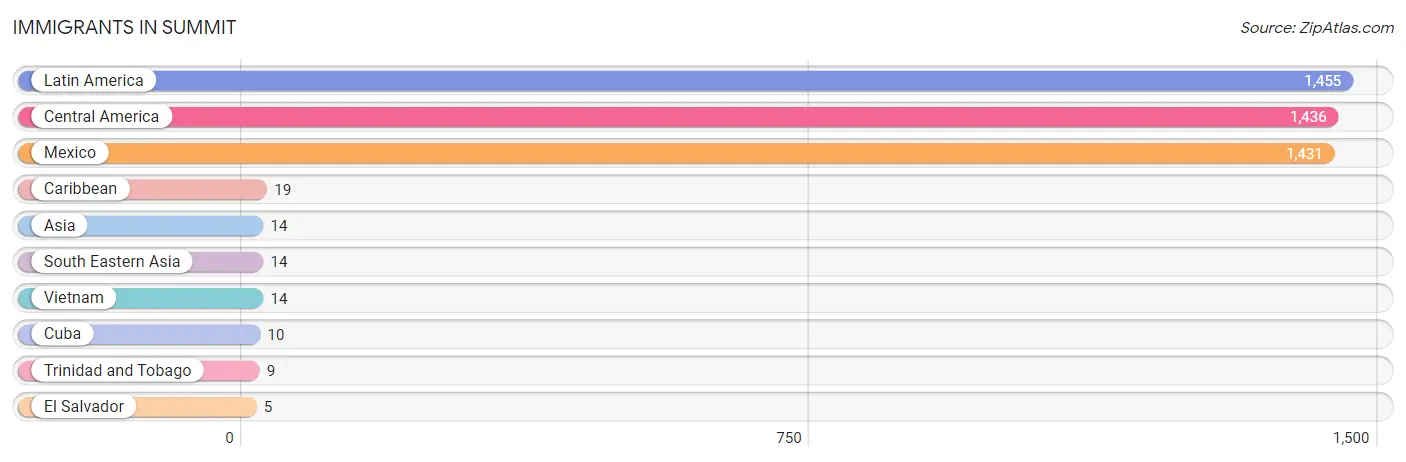
| Immigration Origin | # Population | % Population |
| Asia | 14 | 0.3% |
| Caribbean | 19 | 0.4% |
| Central America | 1,436 | 28.6% |
| Cuba | 10 | 0.2% |
| El Salvador | 5 | 0.1% |
| Latin America | 1,455 | 29.0% |
| Mexico | 1,431 | 28.5% |
| South Eastern Asia | 14 | 0.3% |
| Trinidad and Tobago | 9 | 0.2% |
| Vietnam | 14 | 0.3% | View All 10 Rows |
Sex and Age in Summit
Sex and Age in Summit
The most populous age groups in Summit are 55 to 59 Years (630 | 23.3%) for men and 20 to 24 Years (355 | 15.3%) for women.
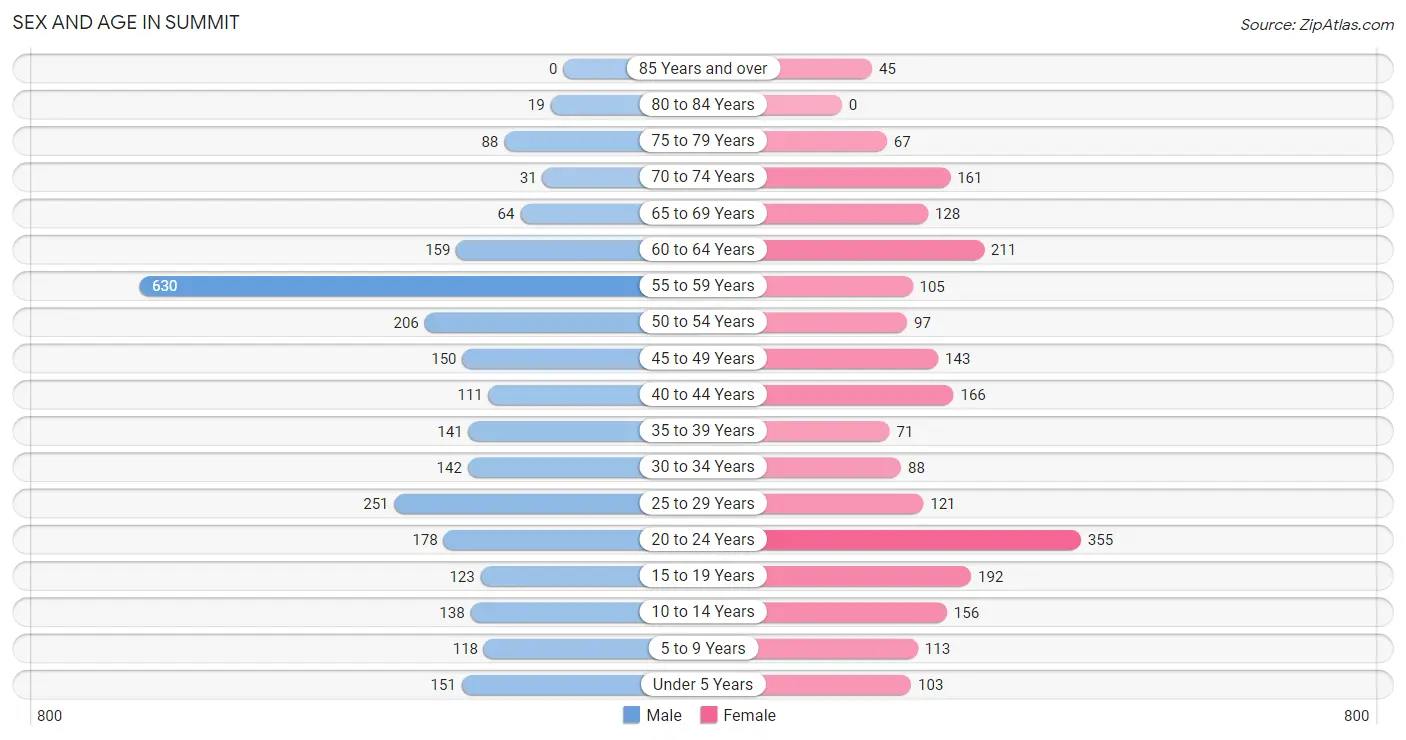
| Age Bracket | Male | Female |
| Under 5 Years | 151 (5.6%) | 103 (4.4%) |
| 5 to 9 Years | 118 (4.4%) | 113 (4.9%) |
| 10 to 14 Years | 138 (5.1%) | 156 (6.7%) |
| 15 to 19 Years | 123 (4.6%) | 192 (8.3%) |
| 20 to 24 Years | 178 (6.6%) | 355 (15.3%) |
| 25 to 29 Years | 251 (9.3%) | 121 (5.2%) |
| 30 to 34 Years | 142 (5.3%) | 88 (3.8%) |
| 35 to 39 Years | 141 (5.2%) | 71 (3.1%) |
| 40 to 44 Years | 111 (4.1%) | 166 (7.1%) |
| 45 to 49 Years | 150 (5.6%) | 143 (6.2%) |
| 50 to 54 Years | 206 (7.6%) | 97 (4.2%) |
| 55 to 59 Years | 630 (23.3%) | 105 (4.5%) |
| 60 to 64 Years | 159 (5.9%) | 211 (9.1%) |
| 65 to 69 Years | 64 (2.4%) | 128 (5.5%) |
| 70 to 74 Years | 31 (1.1%) | 161 (6.9%) |
| 75 to 79 Years | 88 (3.3%) | 67 (2.9%) |
| 80 to 84 Years | 19 (0.7%) | 0 (0.0%) |
| 85 Years and over | 0 (0.0%) | 45 (1.9%) |
| Total | 2,700 (100.0%) | 2,322 (100.0%) |
Families and Households in Summit
Median Family Size in Summit
The median family size in Summit is 3.96 persons per family, with single female/mother families (392 | 35.7%) accounting for the largest median family size of 4.93 persons per family. On the other hand, single male/father families (116 | 10.6%) represent the smallest median family size with 1.84 persons per family.
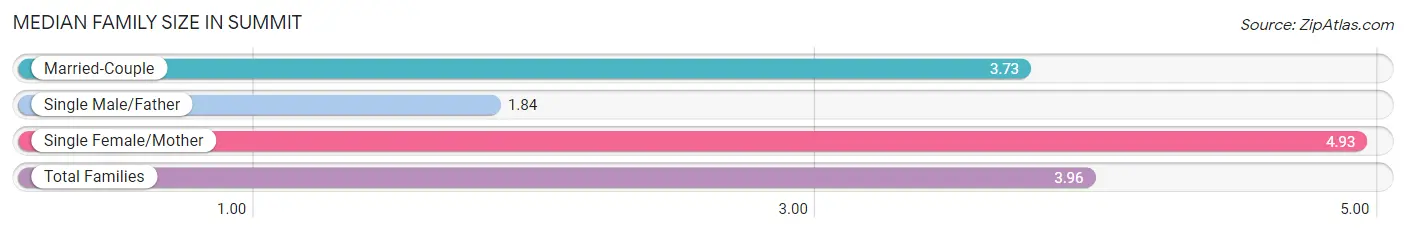
| Family Type | # Families | Family Size |
| Married-Couple | 590 (53.7%) | 3.73 |
| Single Male/Father | 116 (10.6%) | 1.84 |
| Single Female/Mother | 392 (35.7%) | 4.93 |
| Total Families | 1,098 (100.0%) | 3.96 |
Median Household Size in Summit
The median household size in Summit is 3.62 persons per household, with single female/mother households (392 | 28.3%) accounting for the largest median household size of 5.17 persons per household. non-family households (288 | 20.8%) represent the smallest median household size with 1.33 persons per household.
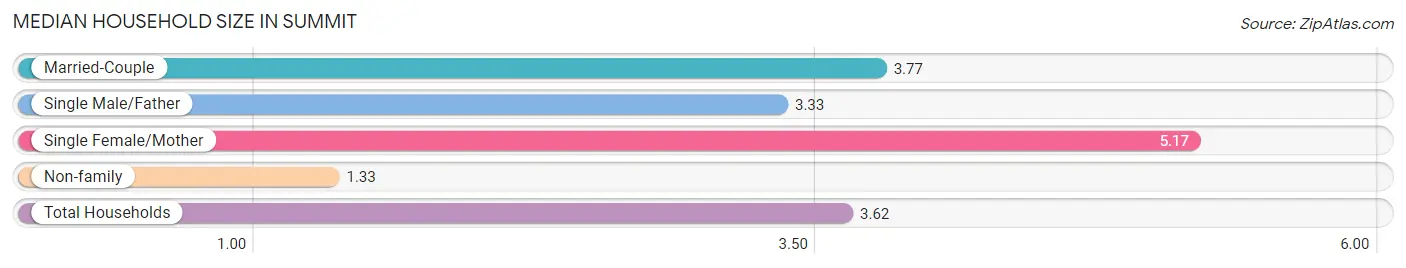
| Household Type | # Households | Household Size |
| Married-Couple | 590 (42.6%) | 3.77 |
| Single Male/Father | 116 (8.4%) | 3.33 |
| Single Female/Mother | 392 (28.3%) | 5.17 |
| Non-family | 288 (20.8%) | 1.33 |
| Total Households | 1,386 (100.0%) | 3.62 |
Household Size by Marriage Status in Summit
Out of a total of 1,386 households in Summit, 1,098 (79.2%) are family households, while 288 (20.8%) are nonfamily households. The most numerous type of family households are 3-person households, comprising 322, and the most common type of nonfamily households are 1-person households, comprising 191.
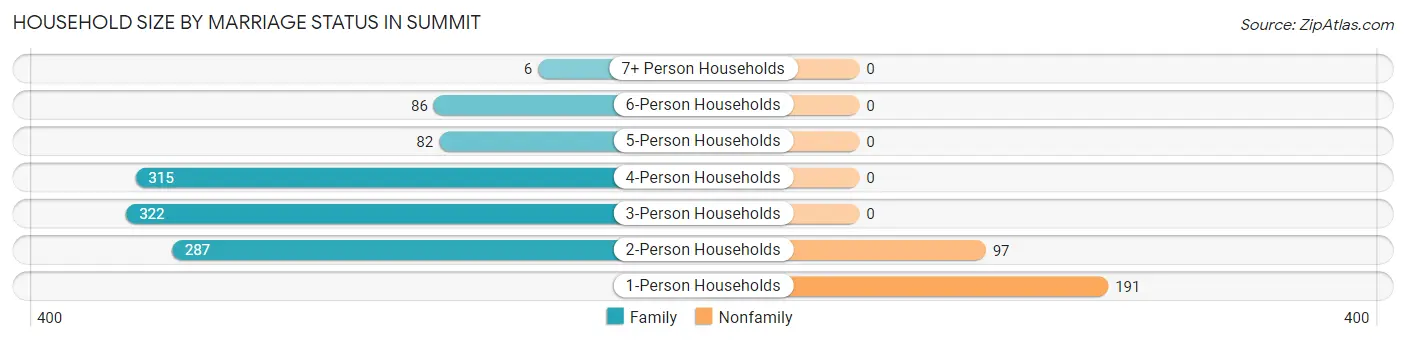
| Household Size | Family Households | Nonfamily Households |
| 1-Person Households | - | 191 (13.8%) |
| 2-Person Households | 287 (20.7%) | 97 (7.0%) |
| 3-Person Households | 322 (23.2%) | 0 (0.0%) |
| 4-Person Households | 315 (22.7%) | 0 (0.0%) |
| 5-Person Households | 82 (5.9%) | 0 (0.0%) |
| 6-Person Households | 86 (6.2%) | 0 (0.0%) |
| 7+ Person Households | 6 (0.4%) | 0 (0.0%) |
| Total | 1,098 (79.2%) | 288 (20.8%) |
Female Fertility in Summit
Fertility by Age in Summit
Average fertility rate in Summit is 193.0 births per 1,000 women. Women in the age bracket of 20 to 34 years have the highest fertility rate with 378.0 births per 1,000 women. Women in the age bracket of 20 to 34 years acount for 95.5% of all women with births.
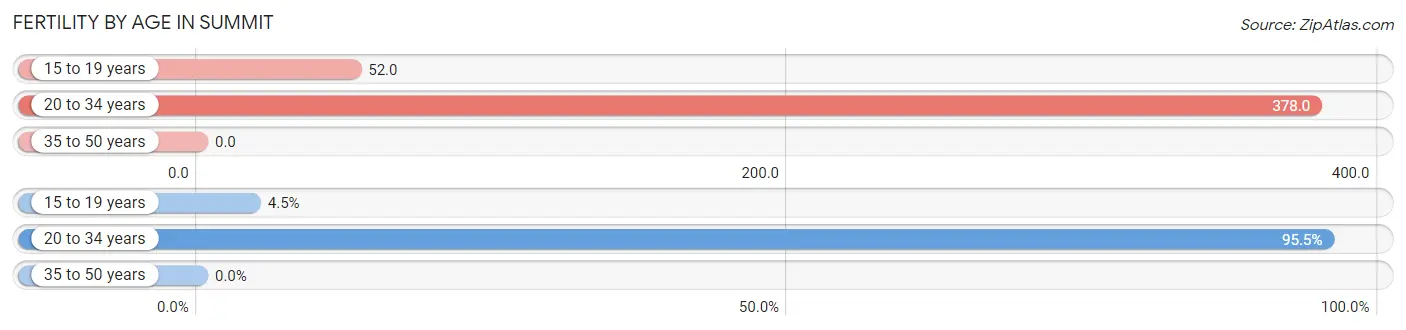
| Age Bracket | Women with Births | Births / 1,000 Women |
| 15 to 19 years | 10 (4.5%) | 52.0 |
| 20 to 34 years | 213 (95.5%) | 378.0 |
| 35 to 50 years | 0 (0.0%) | 0.0 |
| Total | 223 (100.0%) | 193.0 |
Fertility by Age by Marriage Status in Summit
4.5% of women with births (223) in Summit are married. The highest percentage of unmarried women with births falls into 20 to 34 years age bracket with 100.0% of them unmarried at the time of birth, while the lowest percentage of unmarried women with births belong to 15 to 19 years age bracket with 0.0% of them unmarried.
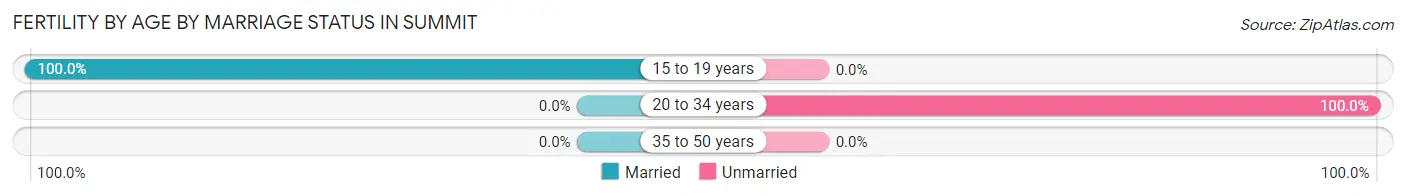
| Age Bracket | Married | Unmarried |
| 15 to 19 years | 10 (100.0%) | 0 (0.0%) |
| 20 to 34 years | 0 (0.0%) | 213 (100.0%) |
| 35 to 50 years | 0 (0.0%) | 0 (0.0%) |
| Total | 10 (4.5%) | 213 (95.5%) |
Fertility by Education in Summit
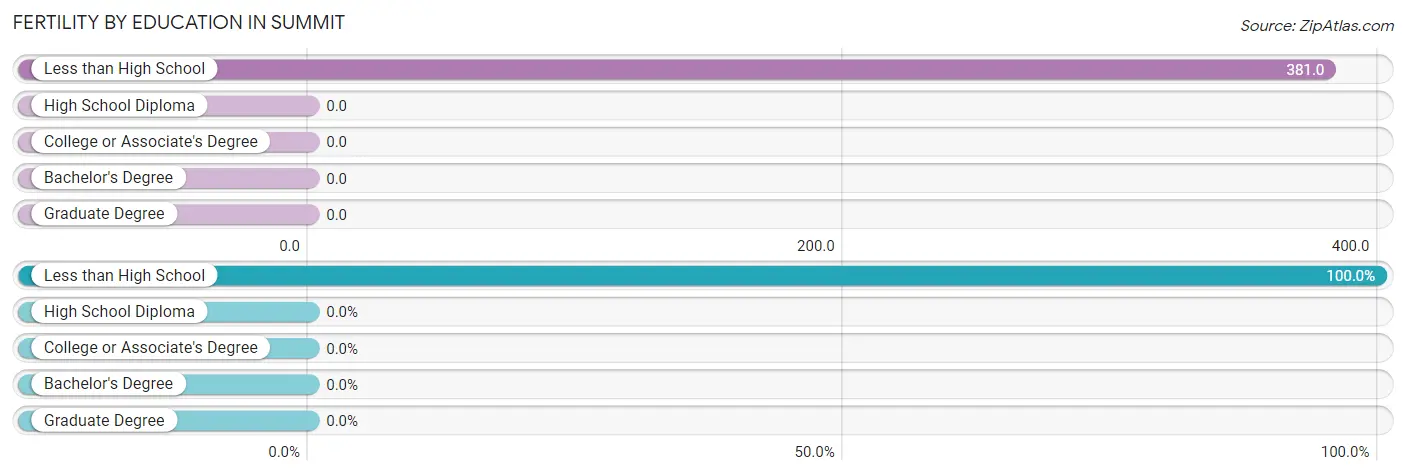
| Educational Attainment | Women with Births | Births / 1,000 Women |
| Less than High School | 223 (100.0%) | 381.0 |
| High School Diploma | 0 (0.0%) | 0.0 |
| College or Associate's Degree | 0 (0.0%) | 0.0 |
| Bachelor's Degree | 0 (0.0%) | 0.0 |
| Graduate Degree | 0 (0.0%) | 0.0 |
| Total | 223 (100.0%) | 193.0 |
Fertility by Education by Marriage Status in Summit
95.5% of women with births in Summit are unmarried. Women with the educational attainment of less than high school are most likely to be married with 4.5% of them married at childbirth, while women with the educational attainment of less than high school are least likely to be married with 95.5% of them unmarried at childbirth.
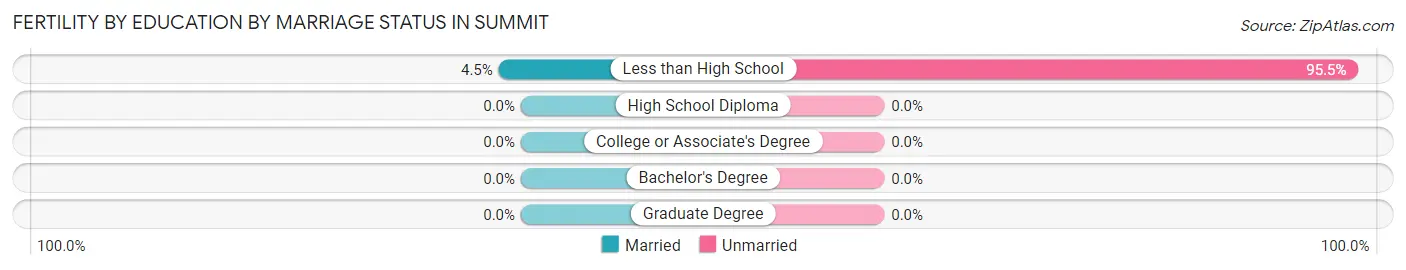
| Educational Attainment | Married | Unmarried |
| Less than High School | 10 (4.5%) | 213 (95.5%) |
| High School Diploma | 0 (0.0%) | 0 (0.0%) |
| College or Associate's Degree | 0 (0.0%) | 0 (0.0%) |
| Bachelor's Degree | 0 (0.0%) | 0 (0.0%) |
| Graduate Degree | 0 (0.0%) | 0 (0.0%) |
| Total | 10 (4.5%) | 213 (95.5%) |
Employment Characteristics in Summit
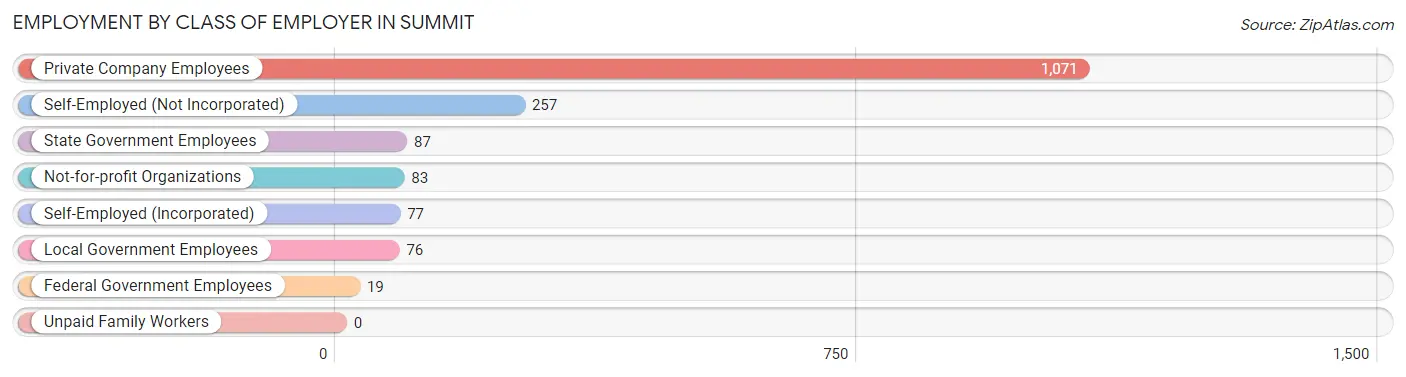
Employment by Class of Employer in Summit
Among the 1,670 employed individuals in Summit, private company employees (1,071 | 64.1%), self-employed (not incorporated) (257 | 15.4%), and state government employees (87 | 5.2%) make up the most common classes of employment.
| Employer Class | # Employees | % Employees |
| Private Company Employees | 1,071 | 64.1% |
| Self-Employed (Incorporated) | 77 | 4.6% |
| Self-Employed (Not Incorporated) | 257 | 15.4% |
| Not-for-profit Organizations | 83 | 5.0% |
| Local Government Employees | 76 | 4.5% |
| State Government Employees | 87 | 5.2% |
| Federal Government Employees | 19 | 1.1% |
| Unpaid Family Workers | 0 | 0.0% |
| Total | 1,670 | 100.0% |
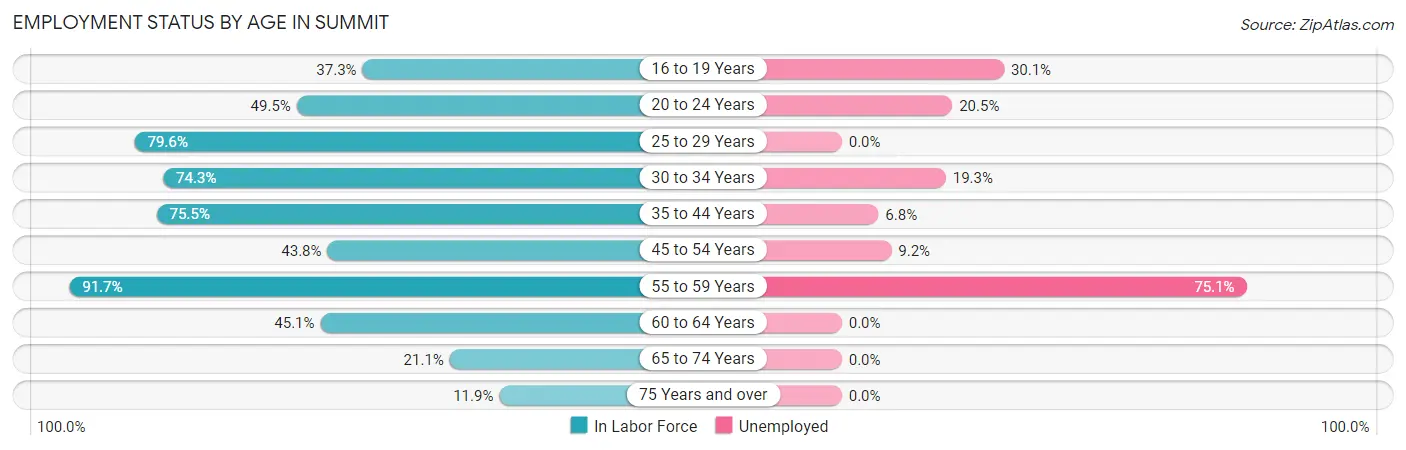
Employment Status by Age in Summit
According to the labor force statistics for Summit, out of the total population over 16 years of age (4,177), 57.5% or 2,402 individuals are in the labor force, with 28.0% or 673 of them unemployed. The age group with the highest labor force participation rate is 55 to 59 years, with 91.7% or 674 individuals in the labor force. Within the labor force, the 55 to 59 years age range has the highest percentage of unemployed individuals, with 75.1% or 506 of them being unemployed.
| Age Bracket | In Labor Force | Unemployed |
| 16 to 19 Years | 93 (37.3%) | 28 (30.1%) |
| 20 to 24 Years | 264 (49.5%) | 54 (20.5%) |
| 25 to 29 Years | 296 (79.6%) | 0 (0.0%) |
| 30 to 34 Years | 171 (74.3%) | 33 (19.3%) |
| 35 to 44 Years | 369 (75.5%) | 25 (6.8%) |
| 45 to 54 Years | 261 (43.8%) | 24 (9.2%) |
| 55 to 59 Years | 674 (91.7%) | 506 (75.1%) |
| 60 to 64 Years | 167 (45.1%) | 0 (0.0%) |
| 65 to 74 Years | 81 (21.1%) | 0 (0.0%) |
| 75 Years and over | 26 (11.9%) | 0 (0.0%) |
| Total | 2,402 (57.5%) | 673 (28.0%) |
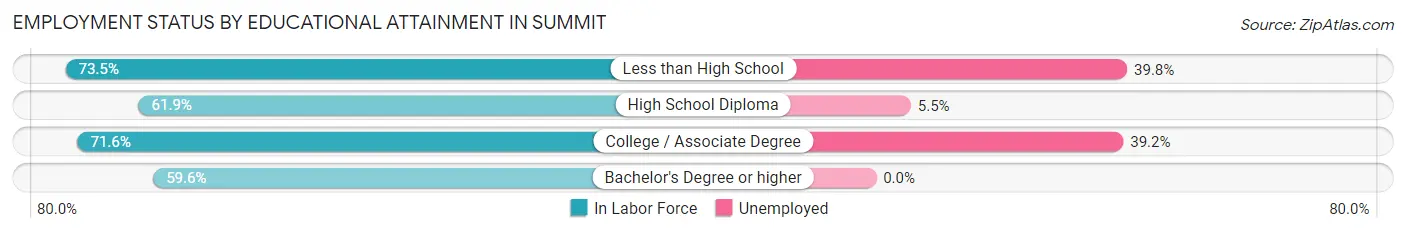
Employment Status by Educational Attainment in Summit
According to labor force statistics for Summit, 69.4% of individuals (1,938) out of the total population between 25 and 64 years of age (2,792) are in the labor force, with 30.5% or 591 of them being unemployed. The group with the highest labor force participation rate are those with the educational attainment of less than high school, with 73.5% or 789 individuals in the labor force. Within the labor force, individuals with less than high school education have the highest percentage of unemployment, with 39.8% or 314 of them being unemployed.
| Educational Attainment | In Labor Force | Unemployed |
| Less than High School | 789 (73.5%) | 427 (39.8%) |
| High School Diploma | 446 (61.9%) | 40 (5.5%) |
| College / Associate Degree | 641 (71.6%) | 351 (39.2%) |
| Bachelor's Degree or higher | 62 (59.6%) | 0 (0.0%) |
| Total | 1,938 (69.4%) | 852 (30.5%) |
Employment Occupations by Sex in Summit
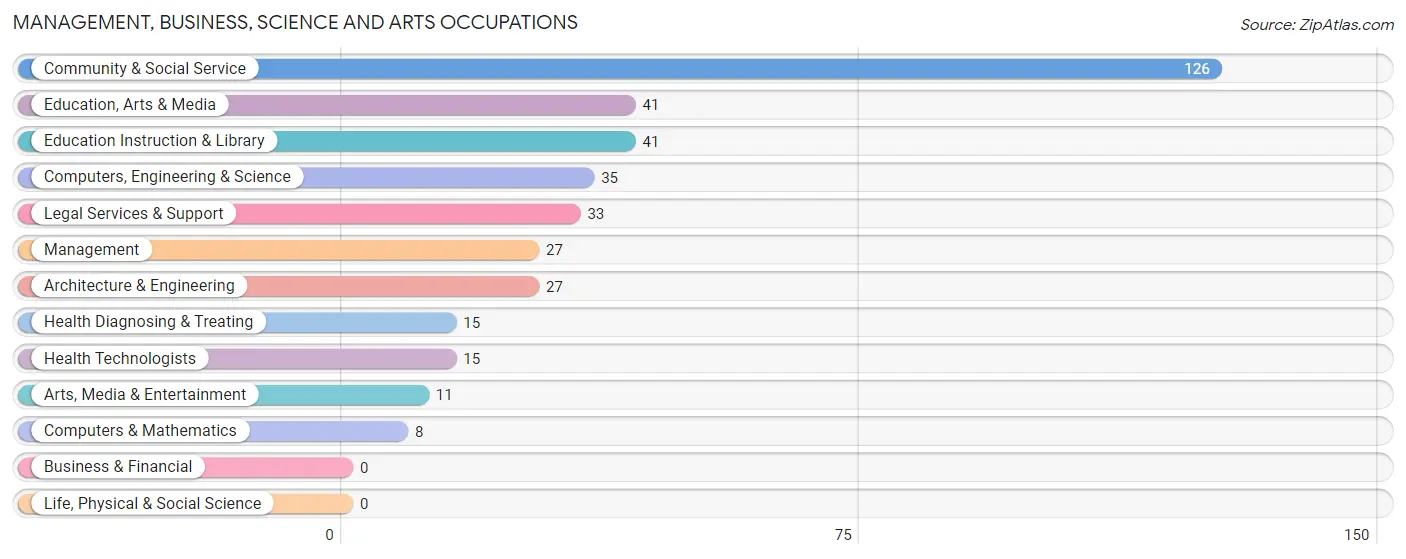
Management, Business, Science and Arts Occupations
The most common Management, Business, Science and Arts occupations in Summit are Community & Social Service (126 | 7.3%), Education, Arts & Media (41 | 2.4%), Education Instruction & Library (41 | 2.4%), Computers, Engineering & Science (35 | 2.0%), and Legal Services & Support (33 | 1.9%).
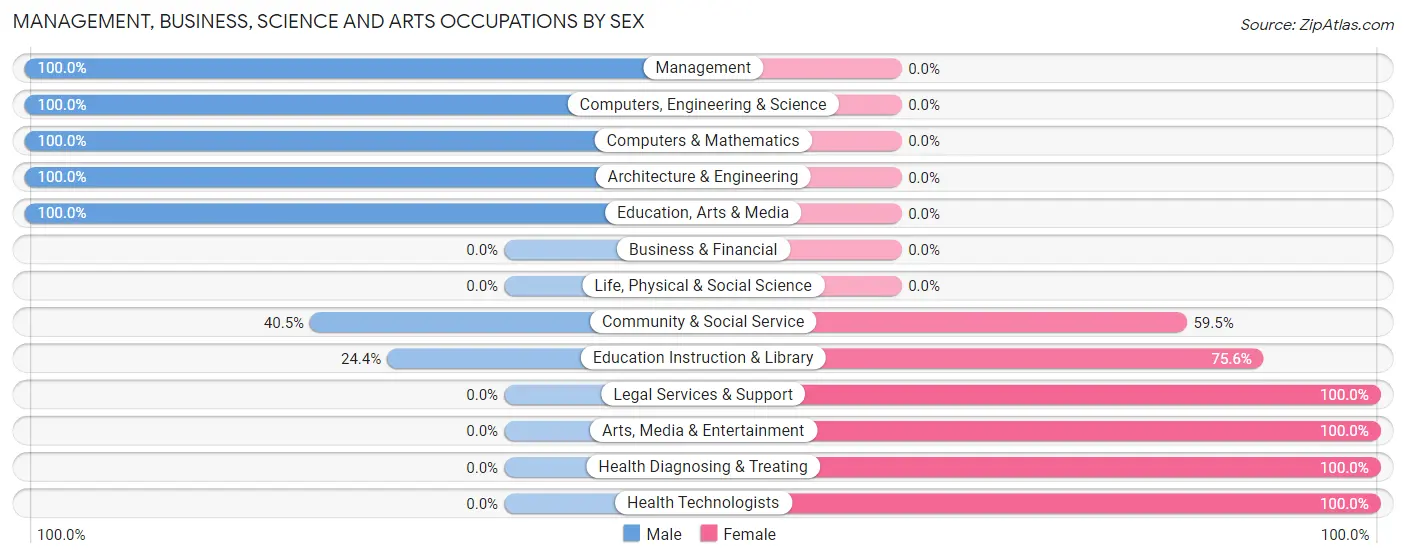
Management, Business, Science and Arts Occupations by Sex
Within the Management, Business, Science and Arts occupations in Summit, the most male-oriented occupations are Management (100.0%), Computers, Engineering & Science (100.0%), and Computers & Mathematics (100.0%), while the most female-oriented occupations are Legal Services & Support (100.0%), Arts, Media & Entertainment (100.0%), and Health Diagnosing & Treating (100.0%).
| Occupation | Male | Female |
| Management | 27 (100.0%) | 0 (0.0%) |
| Business & Financial | 0 (0.0%) | 0 (0.0%) |
| Computers, Engineering & Science | 35 (100.0%) | 0 (0.0%) |
| Computers & Mathematics | 8 (100.0%) | 0 (0.0%) |
| Architecture & Engineering | 27 (100.0%) | 0 (0.0%) |
| Life, Physical & Social Science | 0 (0.0%) | 0 (0.0%) |
| Community & Social Service | 51 (40.5%) | 75 (59.5%) |
| Education, Arts & Media | 41 (100.0%) | 0 (0.0%) |
| Legal Services & Support | 0 (0.0%) | 33 (100.0%) |
| Education Instruction & Library | 10 (24.4%) | 31 (75.6%) |
| Arts, Media & Entertainment | 0 (0.0%) | 11 (100.0%) |
| Health Diagnosing & Treating | 0 (0.0%) | 15 (100.0%) |
| Health Technologists | 0 (0.0%) | 15 (100.0%) |
| Total (Category) | 113 (55.7%) | 90 (44.3%) |
| Total (Overall) | 1,042 (60.8%) | 673 (39.2%) |
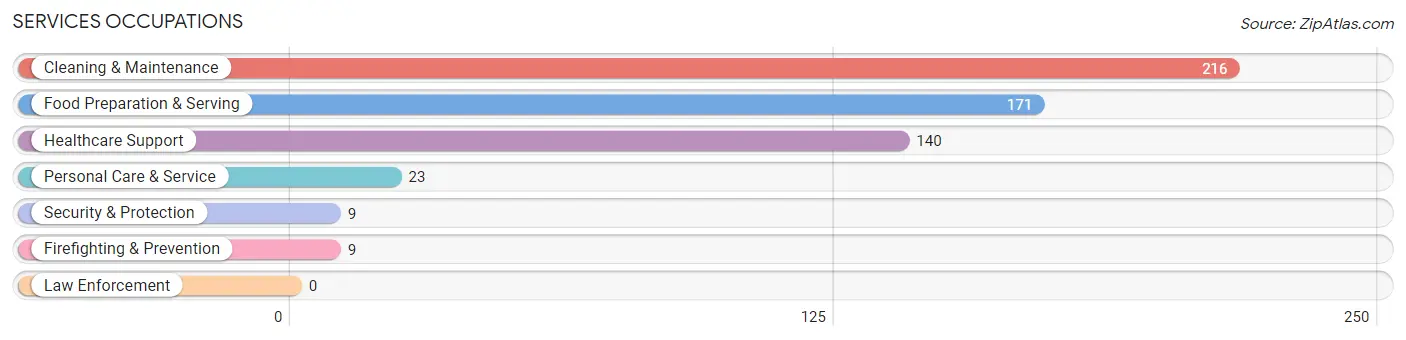
Services Occupations
The most common Services occupations in Summit are Cleaning & Maintenance (216 | 12.6%), Food Preparation & Serving (171 | 10.0%), Healthcare Support (140 | 8.2%), Personal Care & Service (23 | 1.3%), and Security & Protection (9 | 0.5%).
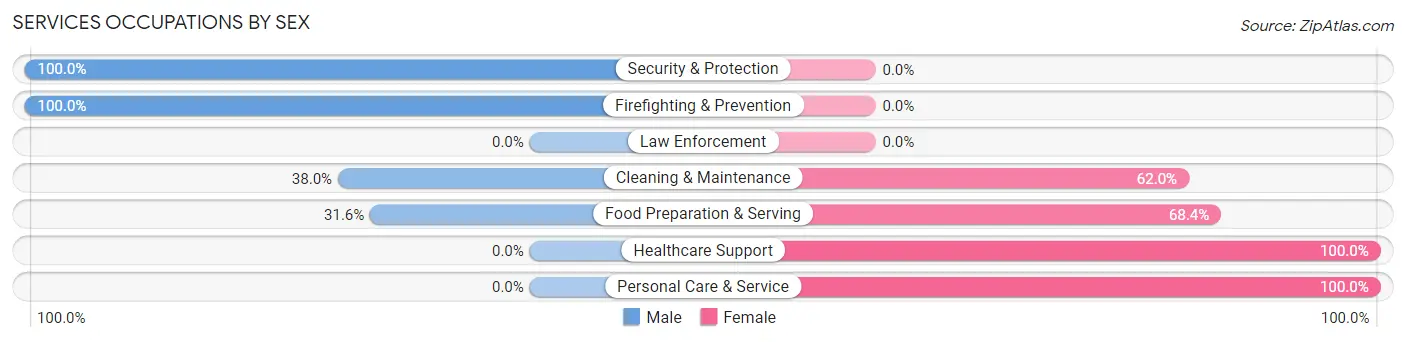
Services Occupations by Sex
Within the Services occupations in Summit, the most male-oriented occupations are Security & Protection (100.0%), Firefighting & Prevention (100.0%), and Cleaning & Maintenance (38.0%), while the most female-oriented occupations are Healthcare Support (100.0%), Personal Care & Service (100.0%), and Food Preparation & Serving (68.4%).
| Occupation | Male | Female |
| Healthcare Support | 0 (0.0%) | 140 (100.0%) |
| Security & Protection | 9 (100.0%) | 0 (0.0%) |
| Firefighting & Prevention | 9 (100.0%) | 0 (0.0%) |
| Law Enforcement | 0 (0.0%) | 0 (0.0%) |
| Food Preparation & Serving | 54 (31.6%) | 117 (68.4%) |
| Cleaning & Maintenance | 82 (38.0%) | 134 (62.0%) |
| Personal Care & Service | 0 (0.0%) | 23 (100.0%) |
| Total (Category) | 145 (25.9%) | 414 (74.1%) |
| Total (Overall) | 1,042 (60.8%) | 673 (39.2%) |
Sales and Office Occupations
The most common Sales and Office occupations in Summit are Office & Administration (142 | 8.3%), and Sales & Related (34 | 2.0%).
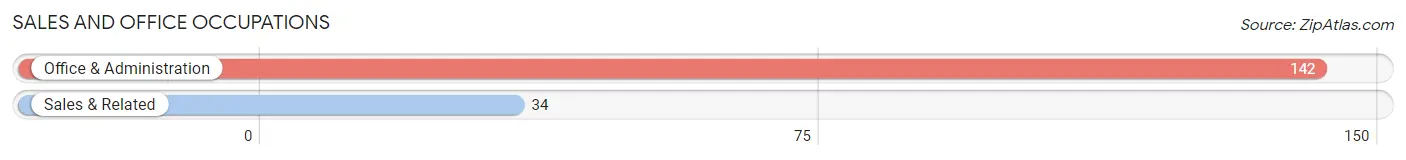
Sales and Office Occupations by Sex
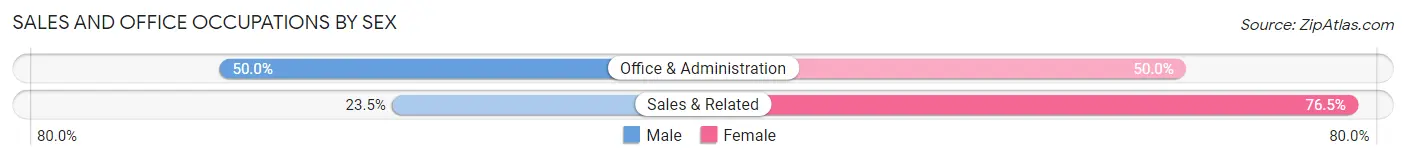
| Occupation | Male | Female |
| Sales & Related | 8 (23.5%) | 26 (76.5%) |
| Office & Administration | 71 (50.0%) | 71 (50.0%) |
| Total (Category) | 79 (44.9%) | 97 (55.1%) |
| Total (Overall) | 1,042 (60.8%) | 673 (39.2%) |
Natural Resources, Construction and Maintenance Occupations
The most common Natural Resources, Construction and Maintenance occupations in Summit are Construction & Extraction (527 | 30.7%), and Installation, Maintenance & Repair (101 | 5.9%).
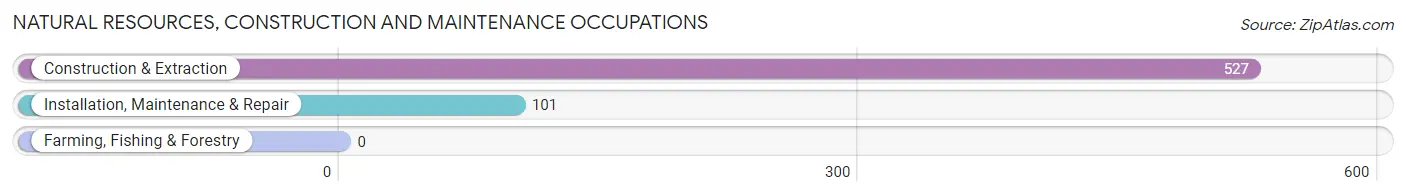
Natural Resources, Construction and Maintenance Occupations by Sex
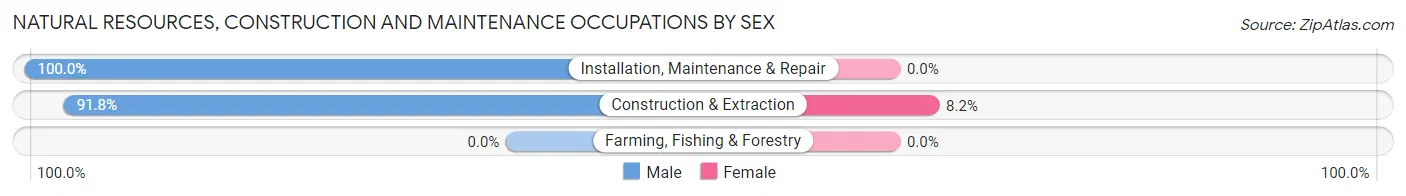
| Occupation | Male | Female |
| Farming, Fishing & Forestry | 0 (0.0%) | 0 (0.0%) |
| Construction & Extraction | 484 (91.8%) | 43 (8.2%) |
| Installation, Maintenance & Repair | 101 (100.0%) | 0 (0.0%) |
| Total (Category) | 585 (93.1%) | 43 (6.9%) |
| Total (Overall) | 1,042 (60.8%) | 673 (39.2%) |
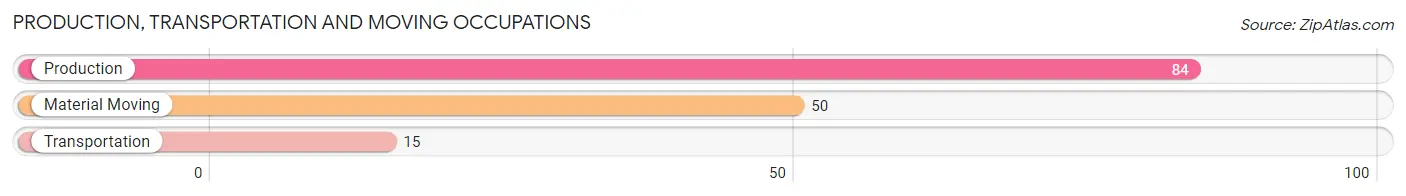
Production, Transportation and Moving Occupations
The most common Production, Transportation and Moving occupations in Summit are Production (84 | 4.9%), Material Moving (50 | 2.9%), and Transportation (15 | 0.9%).
Production, Transportation and Moving Occupations by Sex
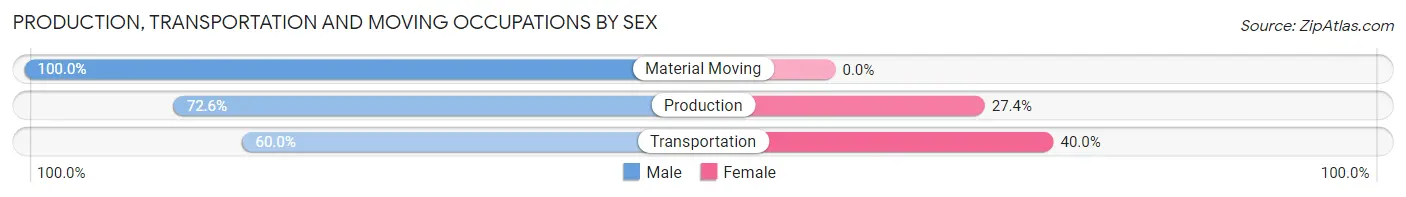
| Occupation | Male | Female |
| Production | 61 (72.6%) | 23 (27.4%) |
| Transportation | 9 (60.0%) | 6 (40.0%) |
| Material Moving | 50 (100.0%) | 0 (0.0%) |
| Total (Category) | 120 (80.5%) | 29 (19.5%) |
| Total (Overall) | 1,042 (60.8%) | 673 (39.2%) |
Employment Industries by Sex in Summit
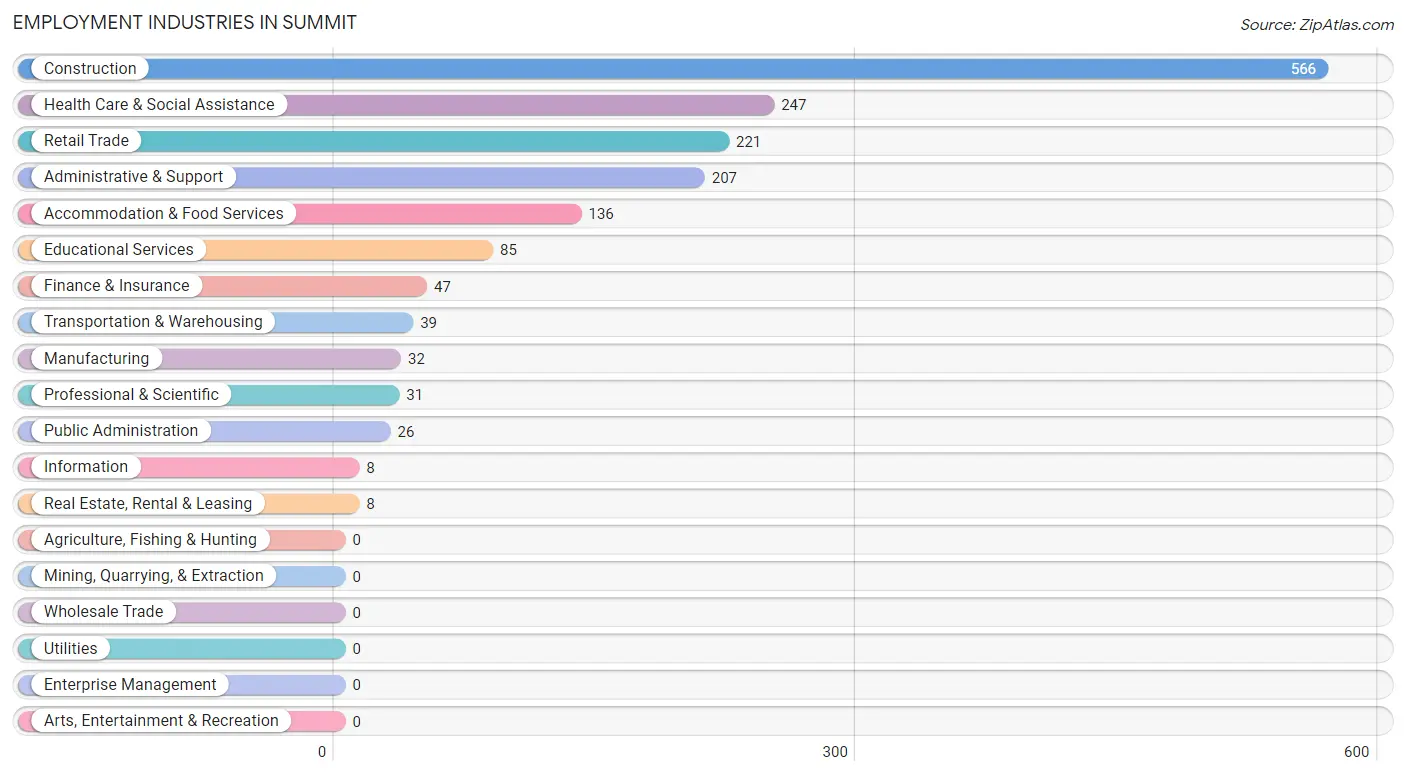
Employment Industries in Summit
The major employment industries in Summit include Construction (566 | 33.0%), Health Care & Social Assistance (247 | 14.4%), Retail Trade (221 | 12.9%), Administrative & Support (207 | 12.1%), and Accommodation & Food Services (136 | 7.9%).
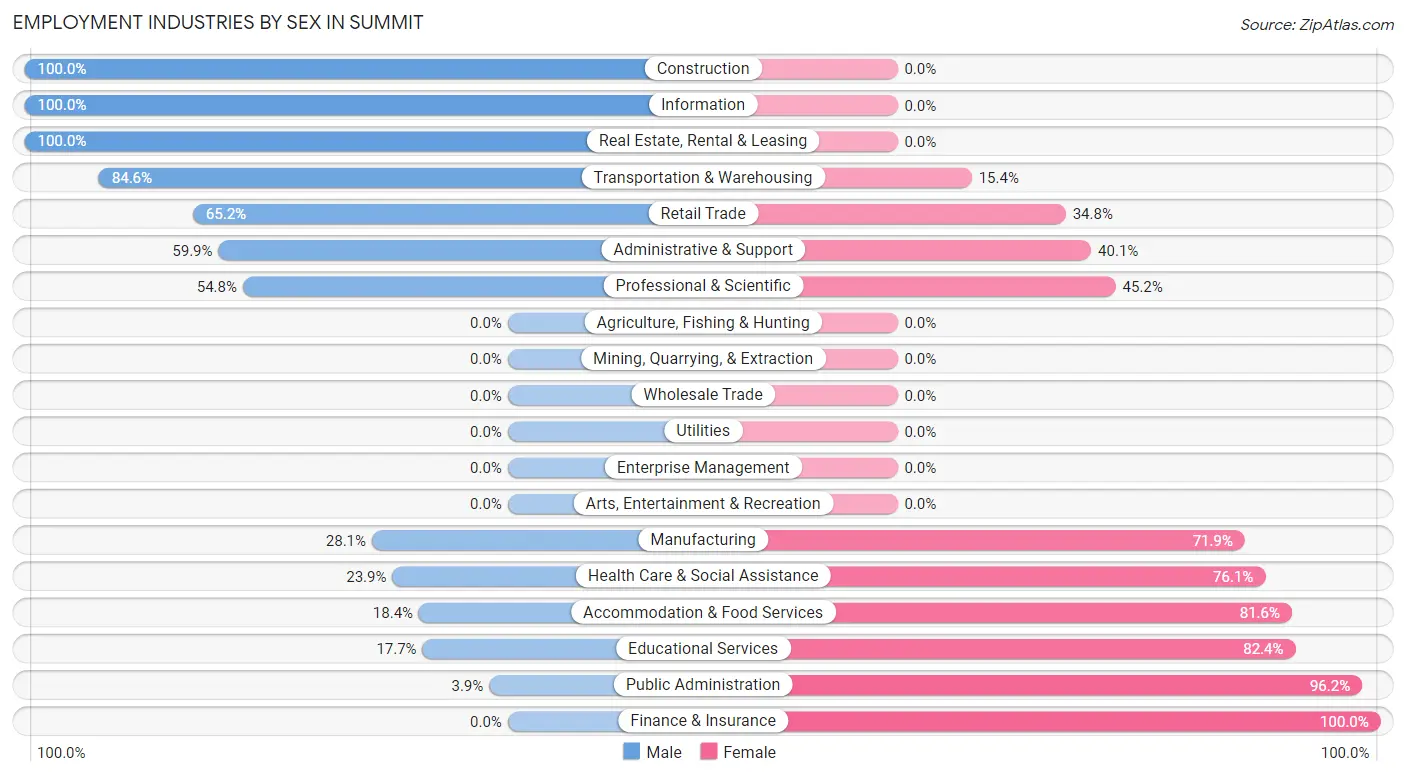
Employment Industries by Sex in Summit
The Summit industries that see more men than women are Construction (100.0%), Information (100.0%), and Real Estate, Rental & Leasing (100.0%), whereas the industries that tend to have a higher number of women are Finance & Insurance (100.0%), Public Administration (96.2%), and Educational Services (82.4%).
| Industry | Male | Female |
| Agriculture, Fishing & Hunting | 0 (0.0%) | 0 (0.0%) |
| Mining, Quarrying, & Extraction | 0 (0.0%) | 0 (0.0%) |
| Construction | 566 (100.0%) | 0 (0.0%) |
| Manufacturing | 9 (28.1%) | 23 (71.9%) |
| Wholesale Trade | 0 (0.0%) | 0 (0.0%) |
| Retail Trade | 144 (65.2%) | 77 (34.8%) |
| Transportation & Warehousing | 33 (84.6%) | 6 (15.4%) |
| Utilities | 0 (0.0%) | 0 (0.0%) |
| Information | 8 (100.0%) | 0 (0.0%) |
| Finance & Insurance | 0 (0.0%) | 47 (100.0%) |
| Real Estate, Rental & Leasing | 8 (100.0%) | 0 (0.0%) |
| Professional & Scientific | 17 (54.8%) | 14 (45.2%) |
| Enterprise Management | 0 (0.0%) | 0 (0.0%) |
| Administrative & Support | 124 (59.9%) | 83 (40.1%) |
| Educational Services | 15 (17.6%) | 70 (82.4%) |
| Health Care & Social Assistance | 59 (23.9%) | 188 (76.1%) |
| Arts, Entertainment & Recreation | 0 (0.0%) | 0 (0.0%) |
| Accommodation & Food Services | 25 (18.4%) | 111 (81.6%) |
| Public Administration | 1 (3.8%) | 25 (96.2%) |
| Total | 1,042 (60.8%) | 673 (39.2%) |
Education in Summit
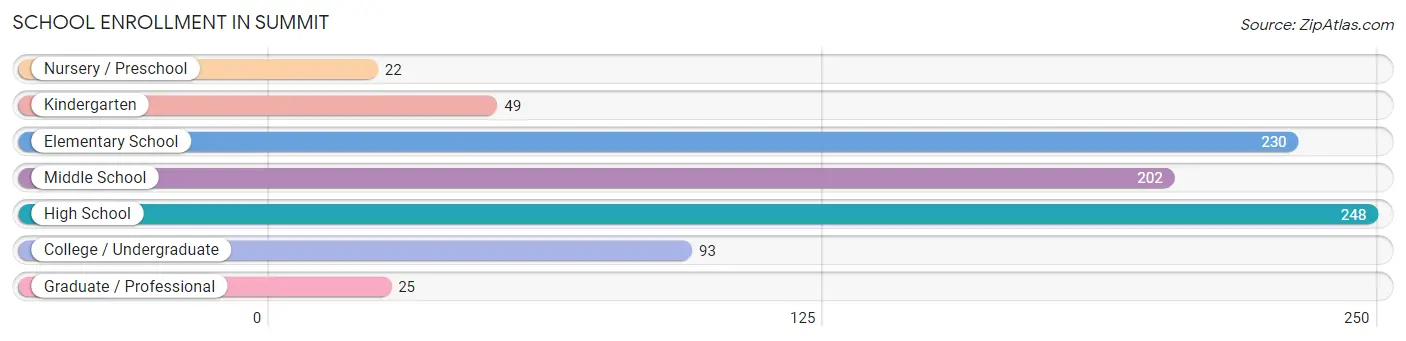
School Enrollment in Summit
The most common levels of schooling among the 869 students in Summit are high school (248 | 28.5%), elementary school (230 | 26.5%), and middle school (202 | 23.3%).
| School Level | # Students | % Students |
| Nursery / Preschool | 22 | 2.5% |
| Kindergarten | 49 | 5.6% |
| Elementary School | 230 | 26.5% |
| Middle School | 202 | 23.3% |
| High School | 248 | 28.5% |
| College / Undergraduate | 93 | 10.7% |
| Graduate / Professional | 25 | 2.9% |
| Total | 869 | 100.0% |
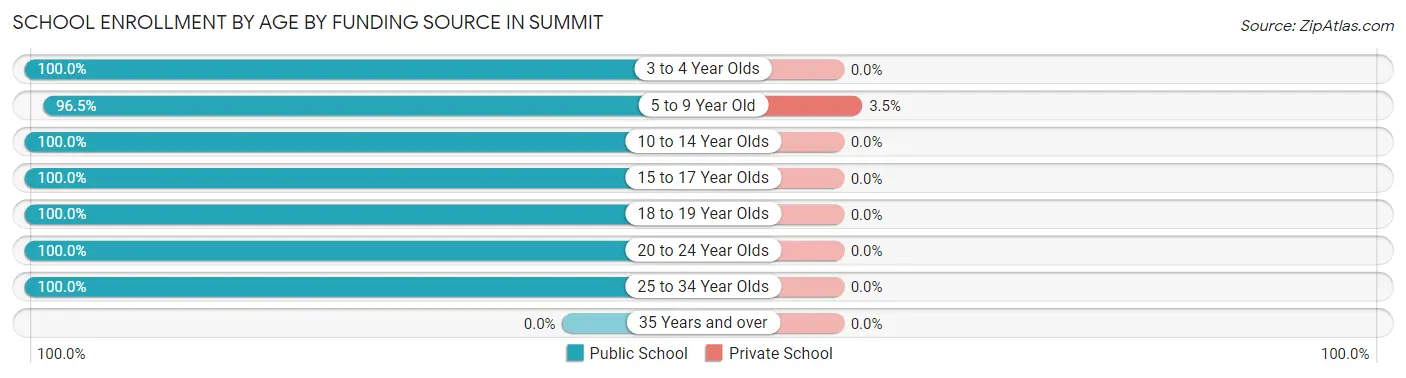
School Enrollment by Age by Funding Source in Summit
Out of a total of 869 students who are enrolled in schools in Summit, 8 (0.9%) attend a private institution, while the remaining 861 (99.1%) are enrolled in public schools. The age group of 5 to 9 year old has the highest likelihood of being enrolled in private schools, with 8 (3.5% in the age bracket) enrolled. Conversely, the age group of 3 to 4 year olds has the lowest likelihood of being enrolled in a private school, with 22 (100.0% in the age bracket) attending a public institution.
| Age Bracket | Public School | Private School |
| 3 to 4 Year Olds | 22 (100.0%) | 0 (0.0%) |
| 5 to 9 Year Old | 223 (96.5%) | 8 (3.5%) |
| 10 to 14 Year Olds | 294 (100.0%) | 0 (0.0%) |
| 15 to 17 Year Olds | 138 (100.0%) | 0 (0.0%) |
| 18 to 19 Year Olds | 104 (100.0%) | 0 (0.0%) |
| 20 to 24 Year Olds | 31 (100.0%) | 0 (0.0%) |
| 25 to 34 Year Olds | 49 (100.0%) | 0 (0.0%) |
| 35 Years and over | 0 (0.0%) | 0 (0.0%) |
| Total | 861 (99.1%) | 8 (0.9%) |
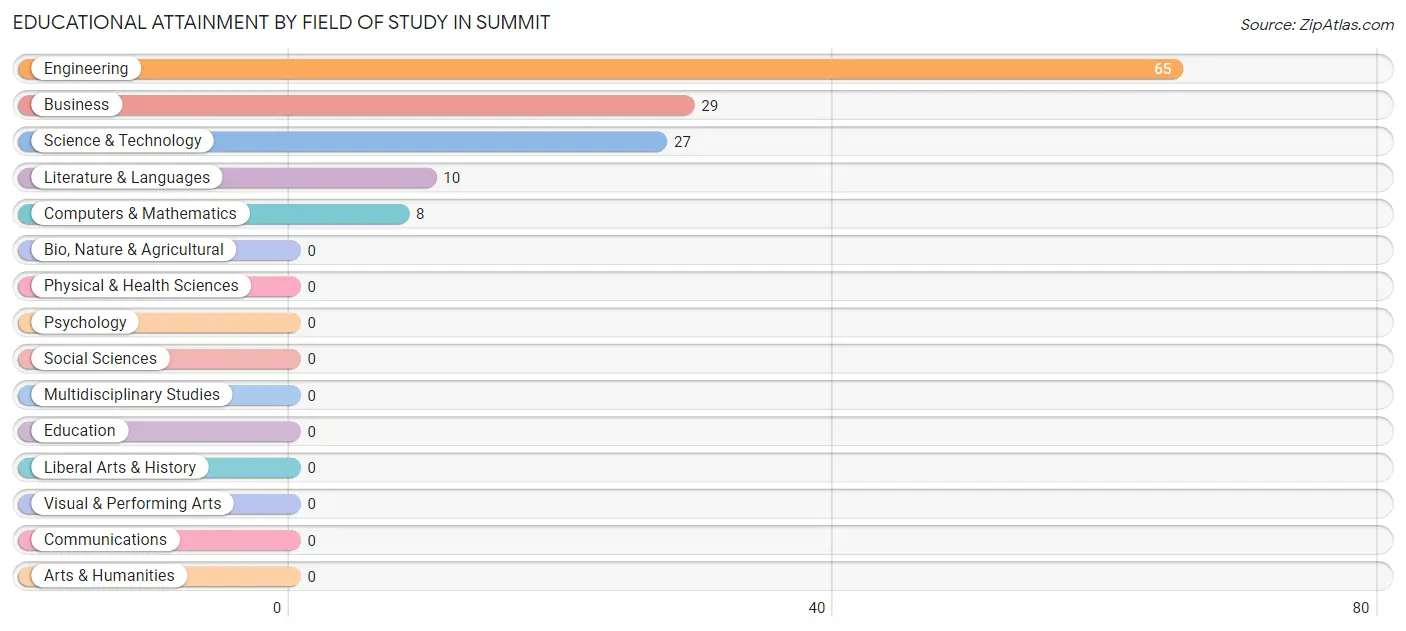
Educational Attainment by Field of Study in Summit
Engineering (65 | 46.8%), business (29 | 20.9%), science & technology (27 | 19.4%), literature & languages (10 | 7.2%), and computers & mathematics (8 | 5.8%) are the most common fields of study among 139 individuals in Summit who have obtained a bachelor's degree or higher.
| Field of Study | # Graduates | % Graduates |
| Computers & Mathematics | 8 | 5.8% |
| Bio, Nature & Agricultural | 0 | 0.0% |
| Physical & Health Sciences | 0 | 0.0% |
| Psychology | 0 | 0.0% |
| Social Sciences | 0 | 0.0% |
| Engineering | 65 | 46.8% |
| Multidisciplinary Studies | 0 | 0.0% |
| Science & Technology | 27 | 19.4% |
| Business | 29 | 20.9% |
| Education | 0 | 0.0% |
| Literature & Languages | 10 | 7.2% |
| Liberal Arts & History | 0 | 0.0% |
| Visual & Performing Arts | 0 | 0.0% |
| Communications | 0 | 0.0% |
| Arts & Humanities | 0 | 0.0% |
| Total | 139 | 100.0% |
Transportation & Commute in Summit
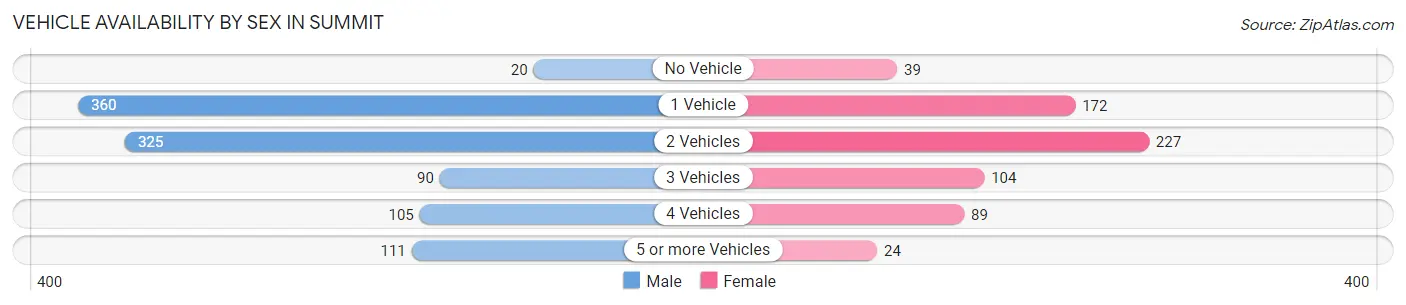
Vehicle Availability by Sex in Summit
The most prevalent vehicle ownership categories in Summit are males with 1 vehicle (360, accounting for 35.6%) and females with 1 vehicle (172, making up 55.0%).
| Vehicles Available | Male | Female |
| No Vehicle | 20 (2.0%) | 39 (5.9%) |
| 1 Vehicle | 360 (35.6%) | 172 (26.3%) |
| 2 Vehicles | 325 (32.2%) | 227 (34.7%) |
| 3 Vehicles | 90 (8.9%) | 104 (15.9%) |
| 4 Vehicles | 105 (10.4%) | 89 (13.6%) |
| 5 or more Vehicles | 111 (11.0%) | 24 (3.7%) |
| Total | 1,011 (100.0%) | 655 (100.0%) |
Commute Time in Summit
The most frequently occuring commute durations in Summit are 30 to 34 minutes (356 commuters, 22.1%), 15 to 19 minutes (339 commuters, 21.0%), and 25 to 29 minutes (267 commuters, 16.6%).
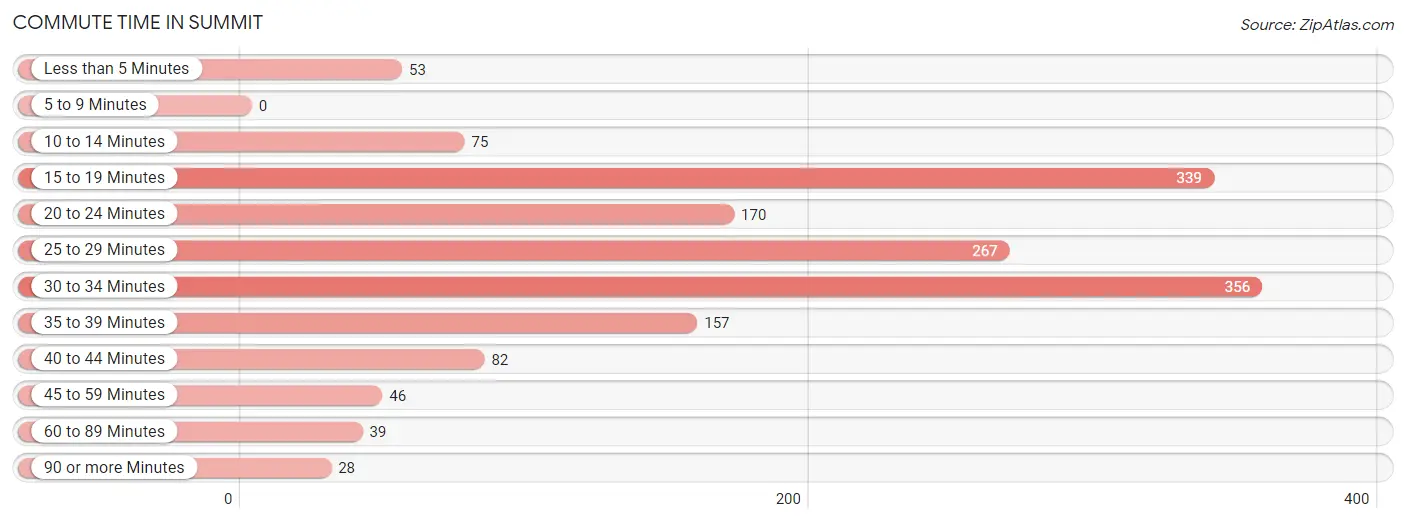
| Commute Time | # Commuters | % Commuters |
| Less than 5 Minutes | 53 | 3.3% |
| 5 to 9 Minutes | 0 | 0.0% |
| 10 to 14 Minutes | 75 | 4.6% |
| 15 to 19 Minutes | 339 | 21.0% |
| 20 to 24 Minutes | 170 | 10.5% |
| 25 to 29 Minutes | 267 | 16.6% |
| 30 to 34 Minutes | 356 | 22.1% |
| 35 to 39 Minutes | 157 | 9.7% |
| 40 to 44 Minutes | 82 | 5.1% |
| 45 to 59 Minutes | 46 | 2.9% |
| 60 to 89 Minutes | 39 | 2.4% |
| 90 or more Minutes | 28 | 1.7% |
Commute Time by Sex in Summit
The most common commute times in Summit are 15 to 19 minutes (282 commuters, 28.8%) for males and 30 to 34 minutes (136 commuters, 21.4%) for females.
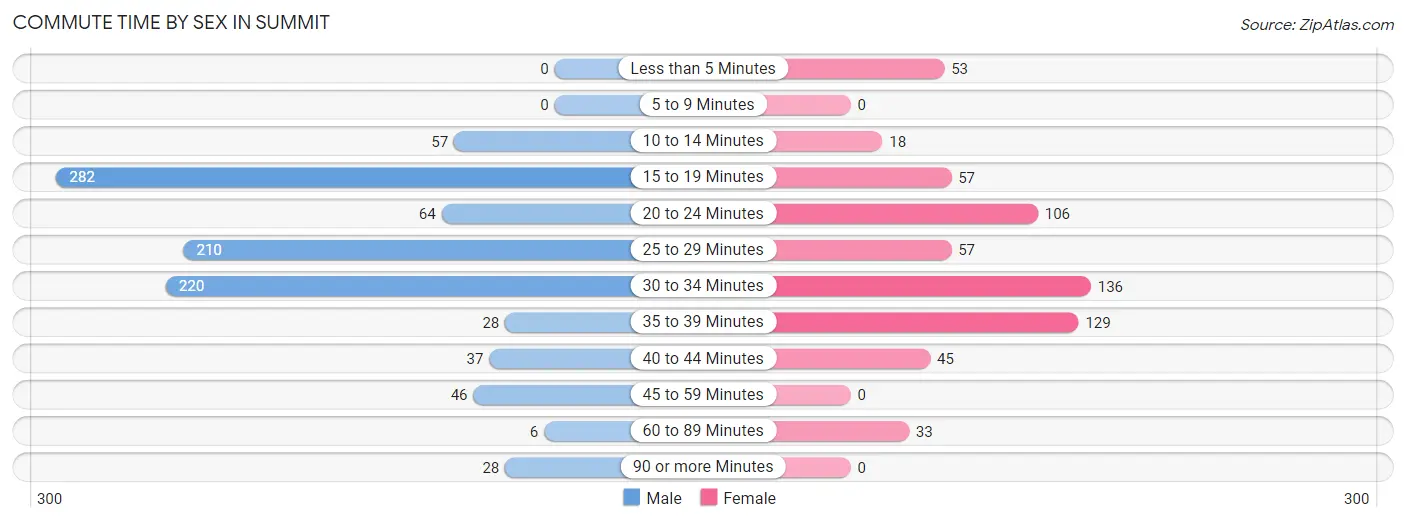
| Commute Time | Male | Female |
| Less than 5 Minutes | 0 (0.0%) | 53 (8.4%) |
| 5 to 9 Minutes | 0 (0.0%) | 0 (0.0%) |
| 10 to 14 Minutes | 57 (5.8%) | 18 (2.8%) |
| 15 to 19 Minutes | 282 (28.8%) | 57 (9.0%) |
| 20 to 24 Minutes | 64 (6.5%) | 106 (16.7%) |
| 25 to 29 Minutes | 210 (21.5%) | 57 (9.0%) |
| 30 to 34 Minutes | 220 (22.5%) | 136 (21.4%) |
| 35 to 39 Minutes | 28 (2.9%) | 129 (20.3%) |
| 40 to 44 Minutes | 37 (3.8%) | 45 (7.1%) |
| 45 to 59 Minutes | 46 (4.7%) | 0 (0.0%) |
| 60 to 89 Minutes | 6 (0.6%) | 33 (5.2%) |
| 90 or more Minutes | 28 (2.9%) | 0 (0.0%) |
Time of Departure to Work by Sex in Summit
The most frequent times of departure to work in Summit are 6:00 AM to 6:29 AM (313, 32.0%) for males and 9:00 AM to 9:59 AM (86, 13.6%) for females.
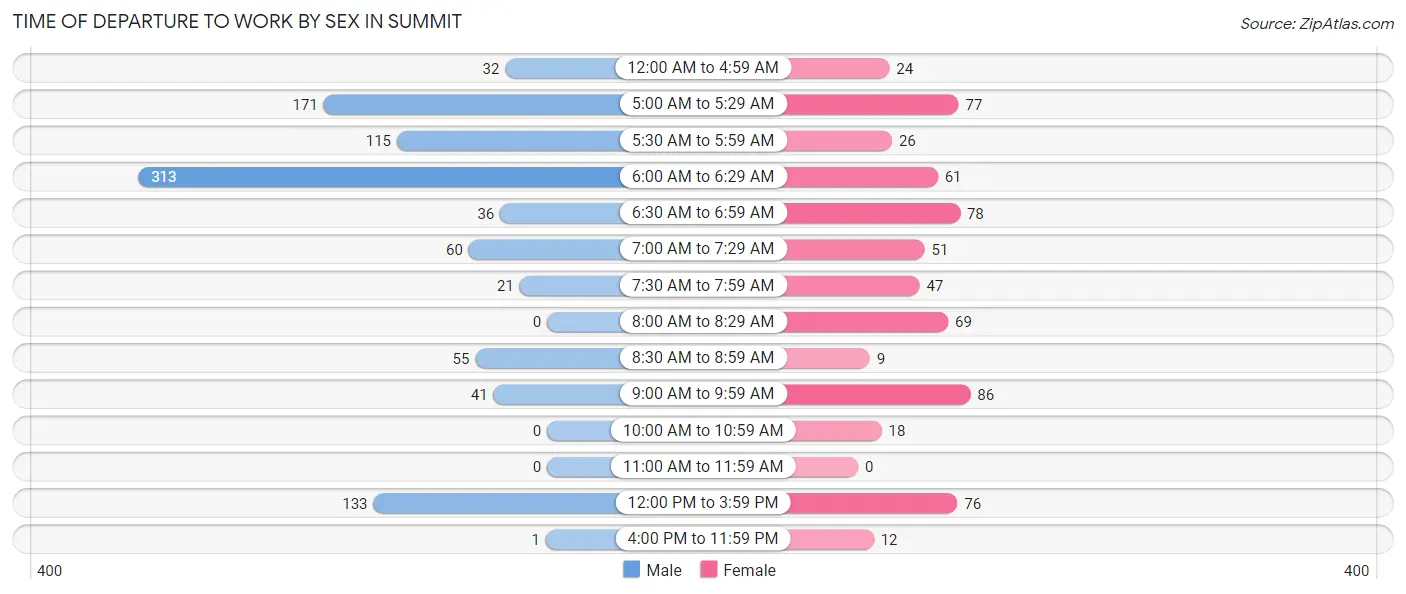
| Time of Departure | Male | Female |
| 12:00 AM to 4:59 AM | 32 (3.3%) | 24 (3.8%) |
| 5:00 AM to 5:29 AM | 171 (17.5%) | 77 (12.1%) |
| 5:30 AM to 5:59 AM | 115 (11.8%) | 26 (4.1%) |
| 6:00 AM to 6:29 AM | 313 (32.0%) | 61 (9.6%) |
| 6:30 AM to 6:59 AM | 36 (3.7%) | 78 (12.3%) |
| 7:00 AM to 7:29 AM | 60 (6.1%) | 51 (8.0%) |
| 7:30 AM to 7:59 AM | 21 (2.1%) | 47 (7.4%) |
| 8:00 AM to 8:29 AM | 0 (0.0%) | 69 (10.9%) |
| 8:30 AM to 8:59 AM | 55 (5.6%) | 9 (1.4%) |
| 9:00 AM to 9:59 AM | 41 (4.2%) | 86 (13.6%) |
| 10:00 AM to 10:59 AM | 0 (0.0%) | 18 (2.8%) |
| 11:00 AM to 11:59 AM | 0 (0.0%) | 0 (0.0%) |
| 12:00 PM to 3:59 PM | 133 (13.6%) | 76 (12.0%) |
| 4:00 PM to 11:59 PM | 1 (0.1%) | 12 (1.9%) |
| Total | 978 (100.0%) | 634 (100.0%) |
Housing Occupancy in Summit
Occupancy by Ownership in Summit
Of the total 1,386 dwellings in Summit, owner-occupied units account for 980 (70.7%), while renter-occupied units make up 406 (29.3%).
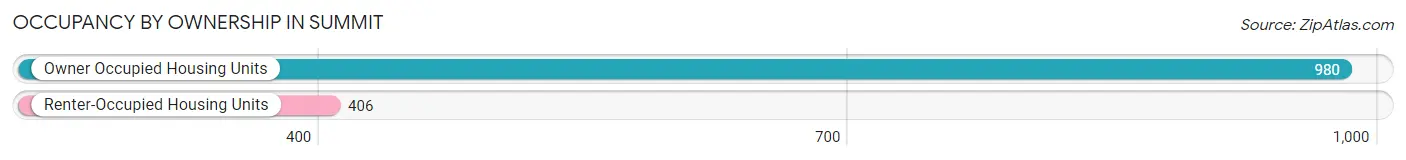
| Occupancy | # Housing Units | % Housing Units |
| Owner Occupied Housing Units | 980 | 70.7% |
| Renter-Occupied Housing Units | 406 | 29.3% |
| Total Occupied Housing Units | 1,386 | 100.0% |
Occupancy by Household Size in Summit
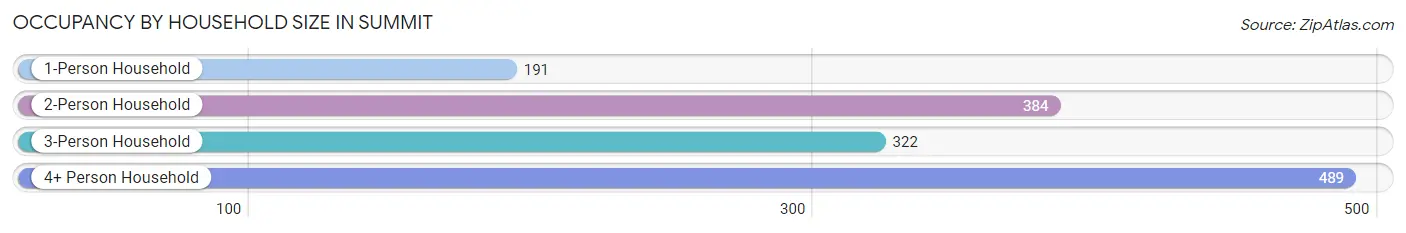
| Household Size | # Housing Units | % Housing Units |
| 1-Person Household | 191 | 13.8% |
| 2-Person Household | 384 | 27.7% |
| 3-Person Household | 322 | 23.2% |
| 4+ Person Household | 489 | 35.3% |
| Total Housing Units | 1,386 | 100.0% |
Occupancy by Ownership by Household Size in Summit

| Household Size | Owner-occupied | Renter-occupied |
| 1-Person Household | 113 (59.2%) | 78 (40.8%) |
| 2-Person Household | 287 (74.7%) | 97 (25.3%) |
| 3-Person Household | 193 (59.9%) | 129 (40.1%) |
| 4+ Person Household | 387 (79.1%) | 102 (20.9%) |
| Total Housing Units | 980 (70.7%) | 406 (29.3%) |
Occupancy by Educational Attainment in Summit
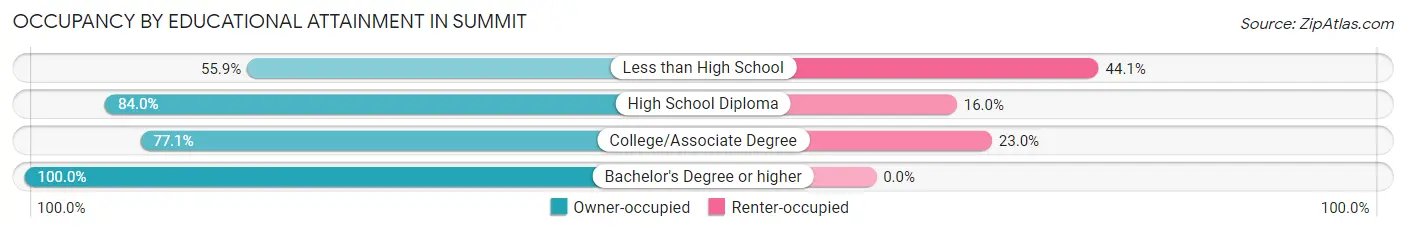
| Household Size | Owner-occupied | Renter-occupied |
| Less than High School | 341 (55.9%) | 269 (44.1%) |
| High School Diploma | 368 (84.0%) | 70 (16.0%) |
| College/Associate Degree | 225 (77.0%) | 67 (23.0%) |
| Bachelor's Degree or higher | 46 (100.0%) | 0 (0.0%) |
Occupancy by Age of Householder in Summit
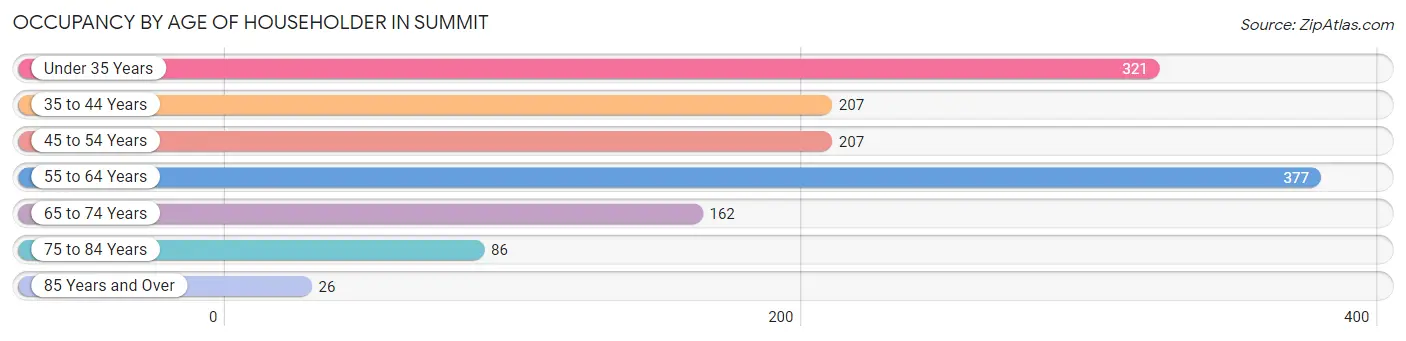
| Age Bracket | # Households | % Households |
| Under 35 Years | 321 | 23.2% |
| 35 to 44 Years | 207 | 14.9% |
| 45 to 54 Years | 207 | 14.9% |
| 55 to 64 Years | 377 | 27.2% |
| 65 to 74 Years | 162 | 11.7% |
| 75 to 84 Years | 86 | 6.2% |
| 85 Years and Over | 26 | 1.9% |
| Total | 1,386 | 100.0% |
Housing Finances in Summit
Median Income by Occupancy in Summit
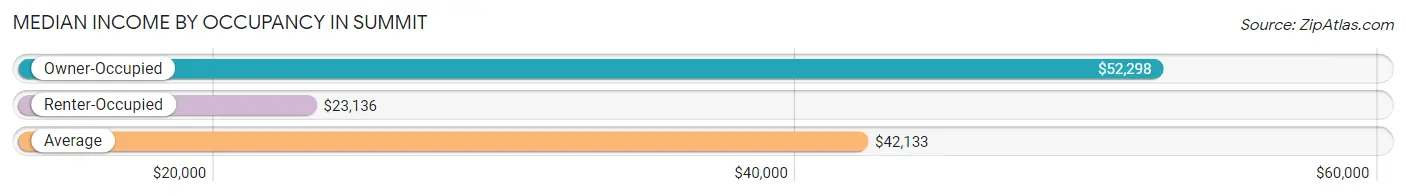
| Occupancy Type | # Households | Median Income |
| Owner-Occupied | 980 (70.7%) | $52,298 |
| Renter-Occupied | 406 (29.3%) | $23,136 |
| Average | 1,386 (100.0%) | $42,133 |
Occupancy by Householder Income Bracket in Summit
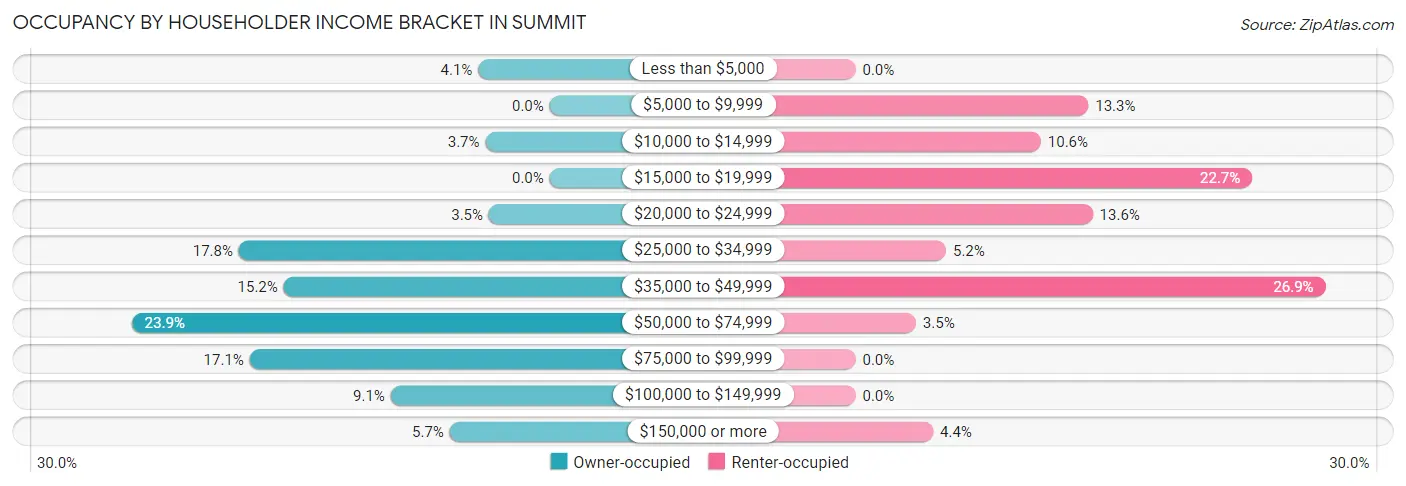
| Income Bracket | Owner-occupied | Renter-occupied |
| Less than $5,000 | 40 (4.1%) | 0 (0.0%) |
| $5,000 to $9,999 | 0 (0.0%) | 54 (13.3%) |
| $10,000 to $14,999 | 36 (3.7%) | 43 (10.6%) |
| $15,000 to $19,999 | 0 (0.0%) | 92 (22.7%) |
| $20,000 to $24,999 | 34 (3.5%) | 55 (13.6%) |
| $25,000 to $34,999 | 174 (17.8%) | 21 (5.2%) |
| $35,000 to $49,999 | 149 (15.2%) | 109 (26.9%) |
| $50,000 to $74,999 | 234 (23.9%) | 14 (3.5%) |
| $75,000 to $99,999 | 168 (17.1%) | 0 (0.0%) |
| $100,000 to $149,999 | 89 (9.1%) | 0 (0.0%) |
| $150,000 or more | 56 (5.7%) | 18 (4.4%) |
| Total | 980 (100.0%) | 406 (100.0%) |
Monthly Housing Cost Tiers in Summit
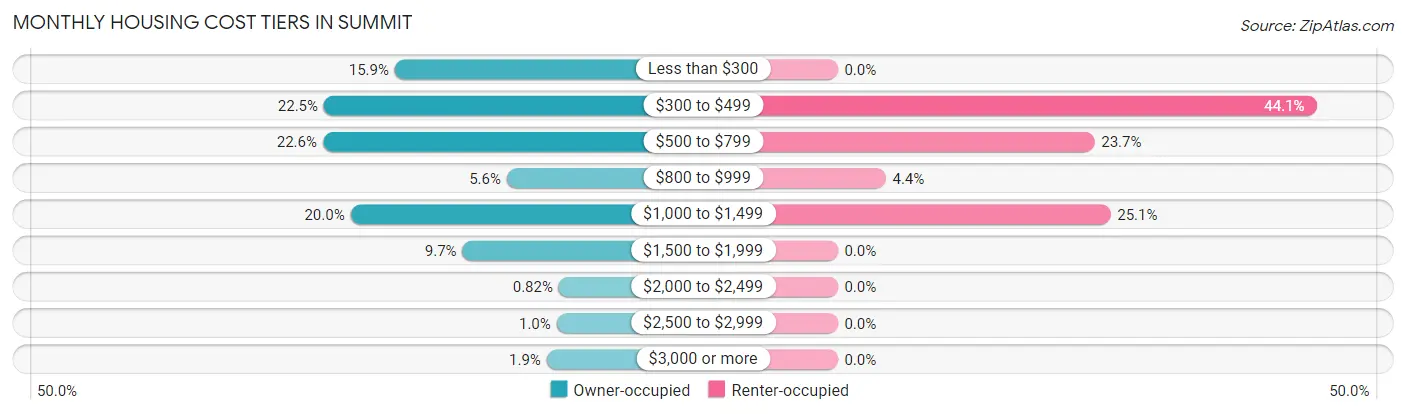
| Monthly Cost | Owner-occupied | Renter-occupied |
| Less than $300 | 156 (15.9%) | 0 (0.0%) |
| $300 to $499 | 220 (22.5%) | 179 (44.1%) |
| $500 to $799 | 221 (22.6%) | 96 (23.6%) |
| $800 to $999 | 55 (5.6%) | 18 (4.4%) |
| $1,000 to $1,499 | 196 (20.0%) | 102 (25.1%) |
| $1,500 to $1,999 | 95 (9.7%) | 0 (0.0%) |
| $2,000 to $2,499 | 8 (0.8%) | 0 (0.0%) |
| $2,500 to $2,999 | 10 (1.0%) | 0 (0.0%) |
| $3,000 or more | 19 (1.9%) | 0 (0.0%) |
| Total | 980 (100.0%) | 406 (100.0%) |
Physical Housing Characteristics in Summit
Housing Structures in Summit
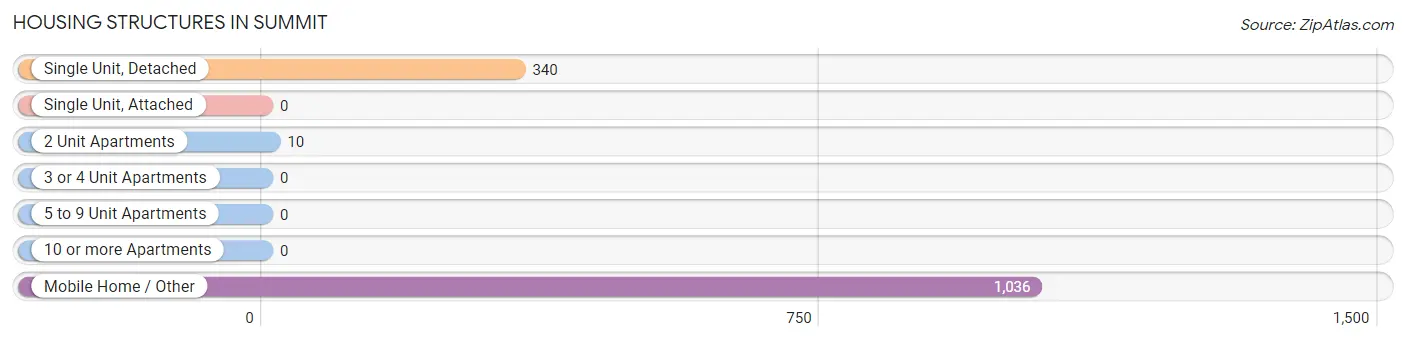
| Structure Type | # Housing Units | % Housing Units |
| Single Unit, Detached | 340 | 24.5% |
| Single Unit, Attached | 0 | 0.0% |
| 2 Unit Apartments | 10 | 0.7% |
| 3 or 4 Unit Apartments | 0 | 0.0% |
| 5 to 9 Unit Apartments | 0 | 0.0% |
| 10 or more Apartments | 0 | 0.0% |
| Mobile Home / Other | 1,036 | 74.8% |
| Total | 1,386 | 100.0% |
Housing Structures by Occupancy in Summit
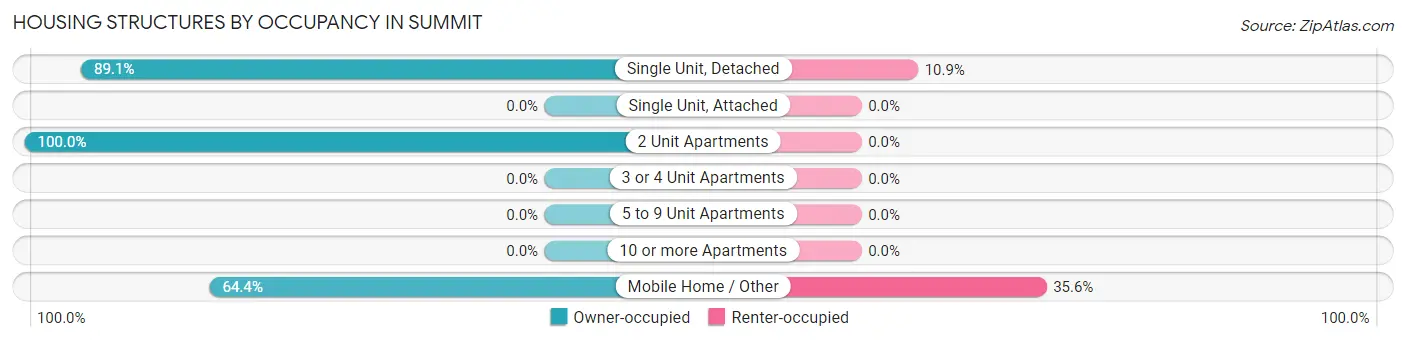
| Structure Type | Owner-occupied | Renter-occupied |
| Single Unit, Detached | 303 (89.1%) | 37 (10.9%) |
| Single Unit, Attached | 0 (0.0%) | 0 (0.0%) |
| 2 Unit Apartments | 10 (100.0%) | 0 (0.0%) |
| 3 or 4 Unit Apartments | 0 (0.0%) | 0 (0.0%) |
| 5 to 9 Unit Apartments | 0 (0.0%) | 0 (0.0%) |
| 10 or more Apartments | 0 (0.0%) | 0 (0.0%) |
| Mobile Home / Other | 667 (64.4%) | 369 (35.6%) |
| Total | 980 (70.7%) | 406 (29.3%) |
Housing Structures by Number of Rooms in Summit
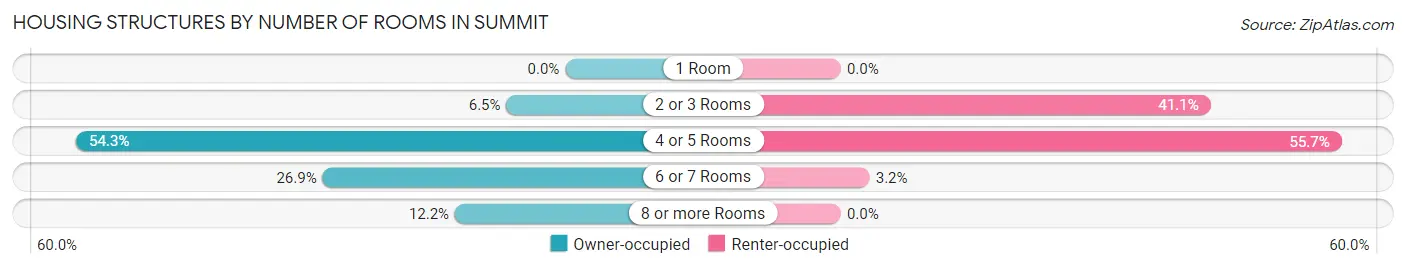
| Number of Rooms | Owner-occupied | Renter-occupied |
| 1 Room | 0 (0.0%) | 0 (0.0%) |
| 2 or 3 Rooms | 64 (6.5%) | 167 (41.1%) |
| 4 or 5 Rooms | 532 (54.3%) | 226 (55.7%) |
| 6 or 7 Rooms | 264 (26.9%) | 13 (3.2%) |
| 8 or more Rooms | 120 (12.2%) | 0 (0.0%) |
| Total | 980 (100.0%) | 406 (100.0%) |
Housing Structure by Heating Type in Summit
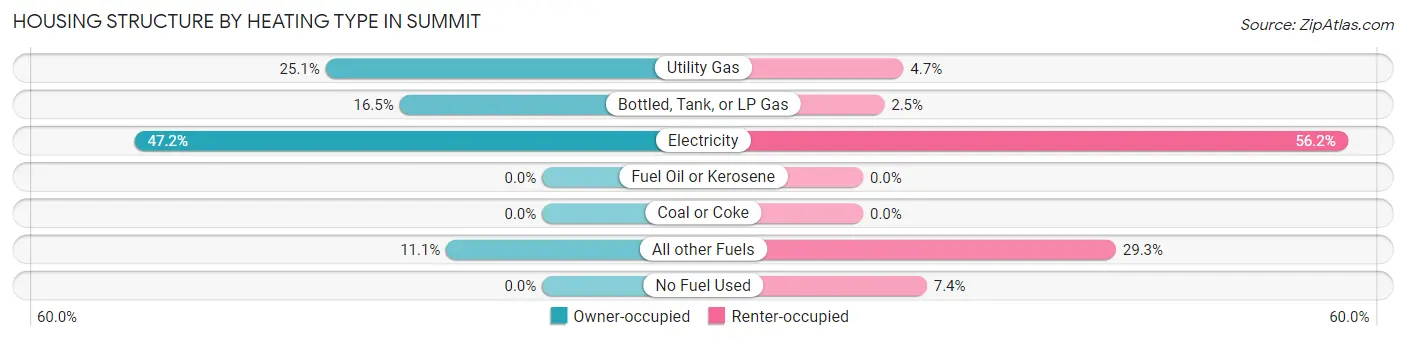
| Heating Type | Owner-occupied | Renter-occupied |
| Utility Gas | 246 (25.1%) | 19 (4.7%) |
| Bottled, Tank, or LP Gas | 162 (16.5%) | 10 (2.5%) |
| Electricity | 463 (47.2%) | 228 (56.2%) |
| Fuel Oil or Kerosene | 0 (0.0%) | 0 (0.0%) |
| Coal or Coke | 0 (0.0%) | 0 (0.0%) |
| All other Fuels | 109 (11.1%) | 119 (29.3%) |
| No Fuel Used | 0 (0.0%) | 30 (7.4%) |
| Total | 980 (100.0%) | 406 (100.0%) |
Household Vehicle Usage in Summit
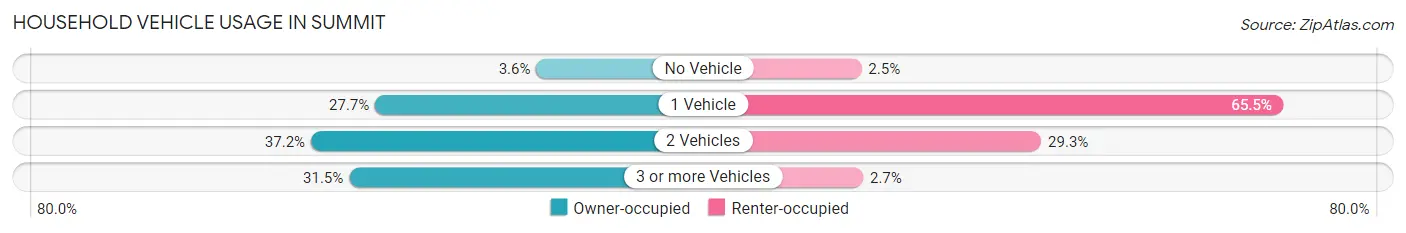
| Vehicles per Household | Owner-occupied | Renter-occupied |
| No Vehicle | 35 (3.6%) | 10 (2.5%) |
| 1 Vehicle | 271 (27.7%) | 266 (65.5%) |
| 2 Vehicles | 365 (37.2%) | 119 (29.3%) |
| 3 or more Vehicles | 309 (31.5%) | 11 (2.7%) |
| Total | 980 (100.0%) | 406 (100.0%) |
Real Estate & Mortgages in Summit
Real Estate and Mortgage Overview in Summit
| Characteristic | Without Mortgage | With Mortgage |
| Housing Units | 537 | 443 |
| Median Property Value | $86,800 | $147,900 |
| Median Household Income | $44,250 | $41 |
| Monthly Housing Costs | $396 | $19 |
| Real Estate Taxes | $751 | $0 |
Property Value by Mortgage Status in Summit
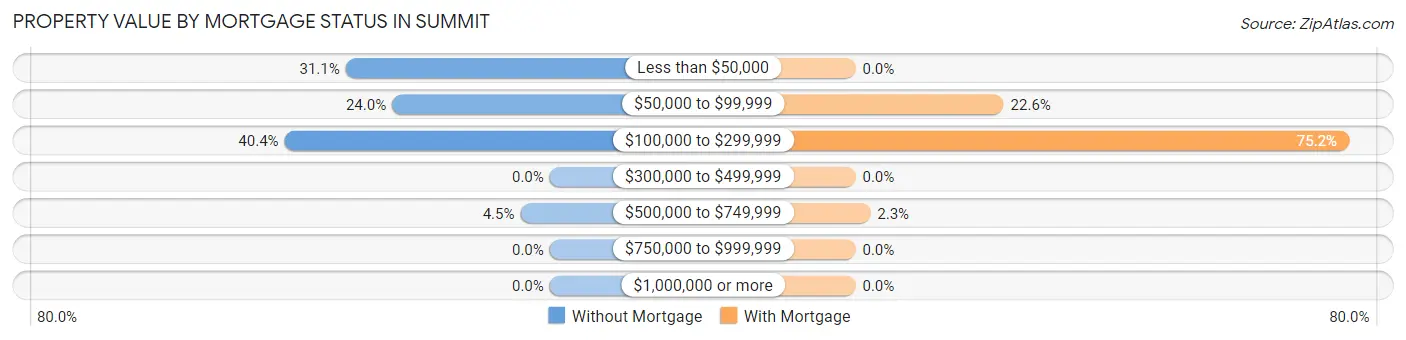
| Property Value | Without Mortgage | With Mortgage |
| Less than $50,000 | 167 (31.1%) | 0 (0.0%) |
| $50,000 to $99,999 | 129 (24.0%) | 100 (22.6%) |
| $100,000 to $299,999 | 217 (40.4%) | 333 (75.2%) |
| $300,000 to $499,999 | 0 (0.0%) | 0 (0.0%) |
| $500,000 to $749,999 | 24 (4.5%) | 10 (2.3%) |
| $750,000 to $999,999 | 0 (0.0%) | 0 (0.0%) |
| $1,000,000 or more | 0 (0.0%) | 0 (0.0%) |
| Total | 537 (100.0%) | 443 (100.0%) |
Household Income by Mortgage Status in Summit
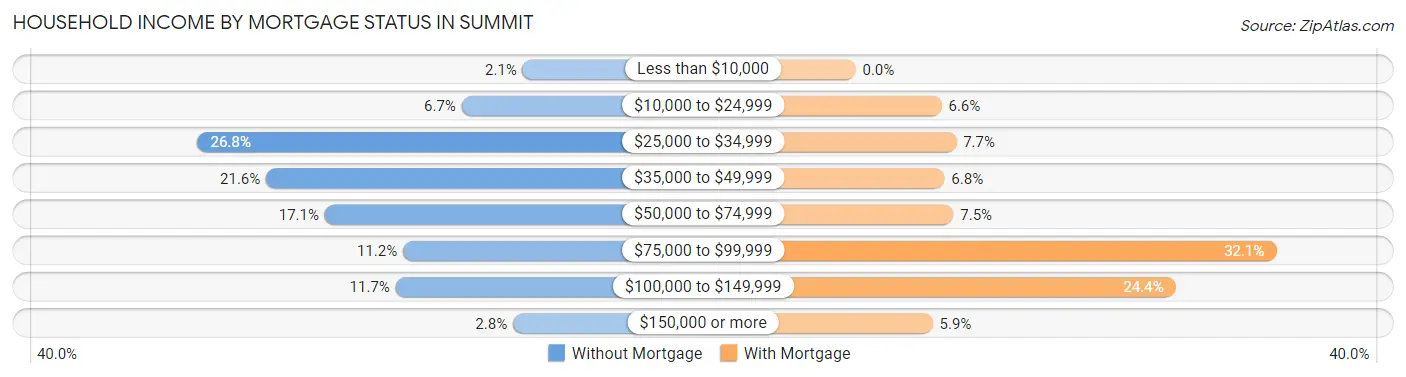
| Household Income | Without Mortgage | With Mortgage |
| Less than $10,000 | 11 (2.1%) | 0 (0.0%) |
| $10,000 to $24,999 | 36 (6.7%) | 29 (6.6%) |
| $25,000 to $34,999 | 144 (26.8%) | 34 (7.7%) |
| $35,000 to $49,999 | 116 (21.6%) | 30 (6.8%) |
| $50,000 to $74,999 | 92 (17.1%) | 33 (7.4%) |
| $75,000 to $99,999 | 60 (11.2%) | 142 (32.1%) |
| $100,000 to $149,999 | 63 (11.7%) | 108 (24.4%) |
| $150,000 or more | 15 (2.8%) | 26 (5.9%) |
| Total | 537 (100.0%) | 443 (100.0%) |
Property Value to Household Income Ratio in Summit
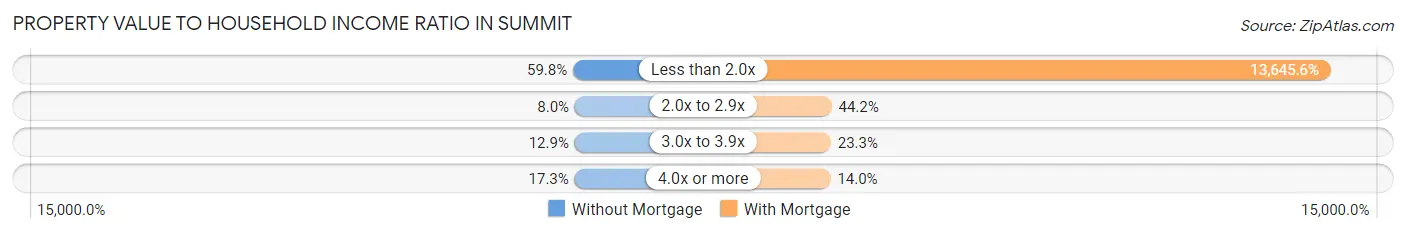
| Value-to-Income Ratio | Without Mortgage | With Mortgage |
| Less than 2.0x | 321 (59.8%) | 60,450 (13,645.6%) |
| 2.0x to 2.9x | 43 (8.0%) | 196 (44.2%) |
| 3.0x to 3.9x | 69 (12.9%) | 103 (23.3%) |
| 4.0x or more | 93 (17.3%) | 62 (14.0%) |
| Total | 537 (100.0%) | 443 (100.0%) |
Real Estate Taxes by Mortgage Status in Summit
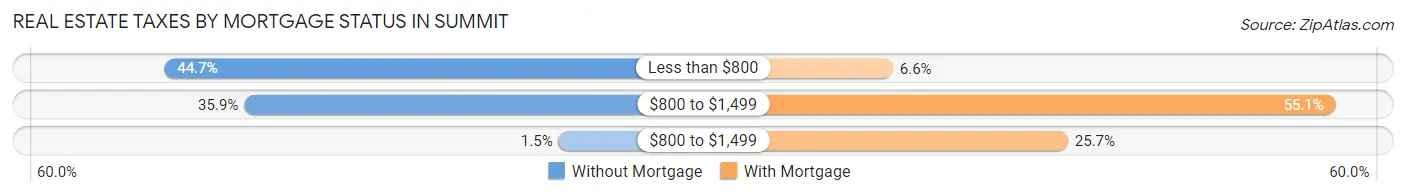
| Property Taxes | Without Mortgage | With Mortgage |
| Less than $800 | 240 (44.7%) | 29 (6.6%) |
| $800 to $1,499 | 193 (35.9%) | 244 (55.1%) |
| $800 to $1,499 | 8 (1.5%) | 114 (25.7%) |
| Total | 537 (100.0%) | 443 (100.0%) |
Health & Disability in Summit
Health Insurance Coverage by Age in Summit
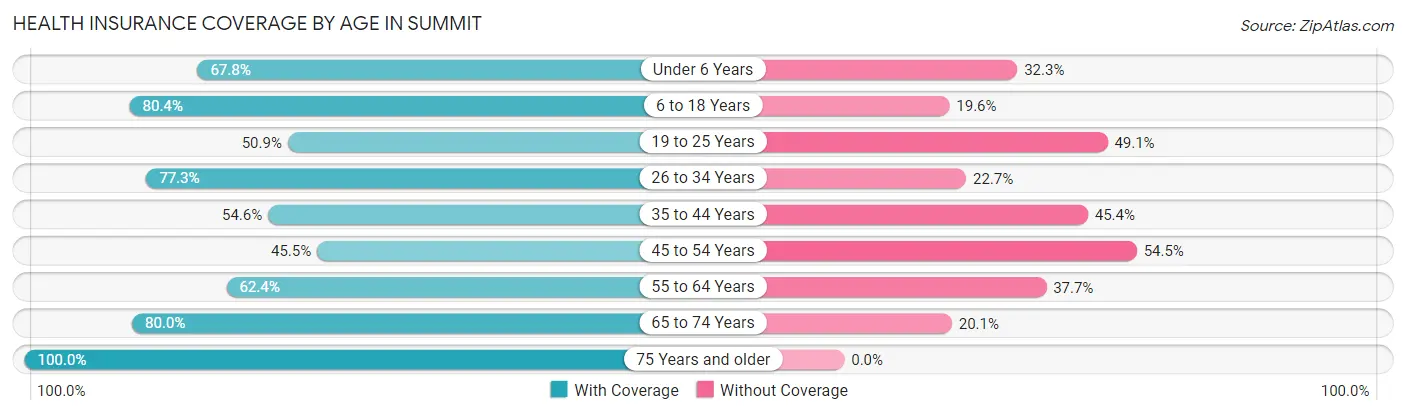
| Age Bracket | With Coverage | Without Coverage |
| Under 6 Years | 187 (67.7%) | 89 (32.3%) |
| 6 to 18 Years | 632 (80.4%) | 154 (19.6%) |
| 19 to 25 Years | 302 (50.9%) | 291 (49.1%) |
| 26 to 34 Years | 429 (77.3%) | 126 (22.7%) |
| 35 to 44 Years | 267 (54.6%) | 222 (45.4%) |
| 45 to 54 Years | 271 (45.5%) | 325 (54.5%) |
| 55 to 64 Years | 689 (62.4%) | 416 (37.7%) |
| 65 to 74 Years | 307 (79.9%) | 77 (20.1%) |
| 75 Years and older | 219 (100.0%) | 0 (0.0%) |
| Total | 3,303 (66.0%) | 1,700 (34.0%) |
Health Insurance Coverage by Citizenship Status in Summit
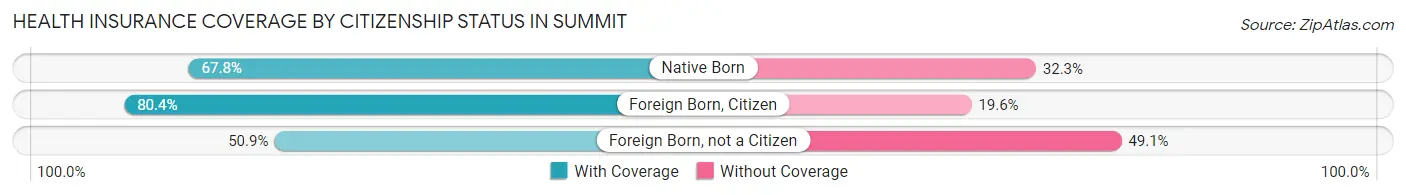
| Citizenship Status | With Coverage | Without Coverage |
| Native Born | 187 (67.7%) | 89 (32.3%) |
| Foreign Born, Citizen | 632 (80.4%) | 154 (19.6%) |
| Foreign Born, not a Citizen | 302 (50.9%) | 291 (49.1%) |
Health Insurance Coverage by Household Income in Summit
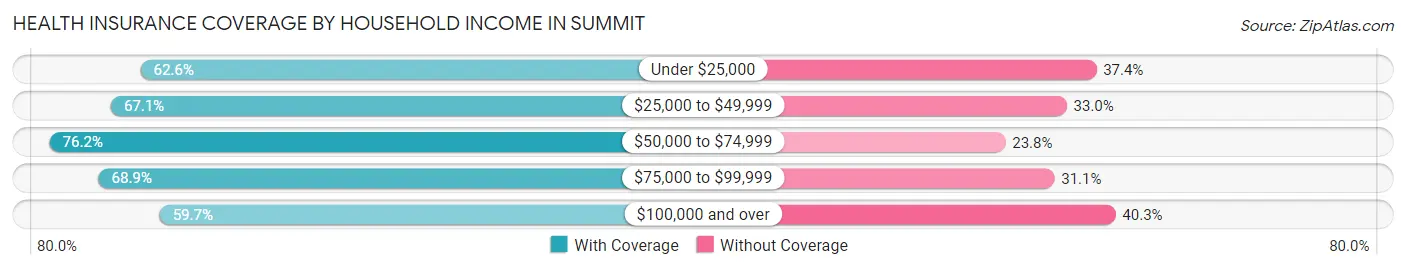
| Household Income | With Coverage | Without Coverage |
| Under $25,000 | 635 (62.6%) | 379 (37.4%) |
| $25,000 to $49,999 | 991 (67.0%) | 487 (33.0%) |
| $50,000 to $74,999 | 536 (76.2%) | 167 (23.8%) |
| $75,000 to $99,999 | 443 (68.9%) | 200 (31.1%) |
| $100,000 and over | 693 (59.7%) | 467 (40.3%) |
Public vs Private Health Insurance Coverage by Age in Summit
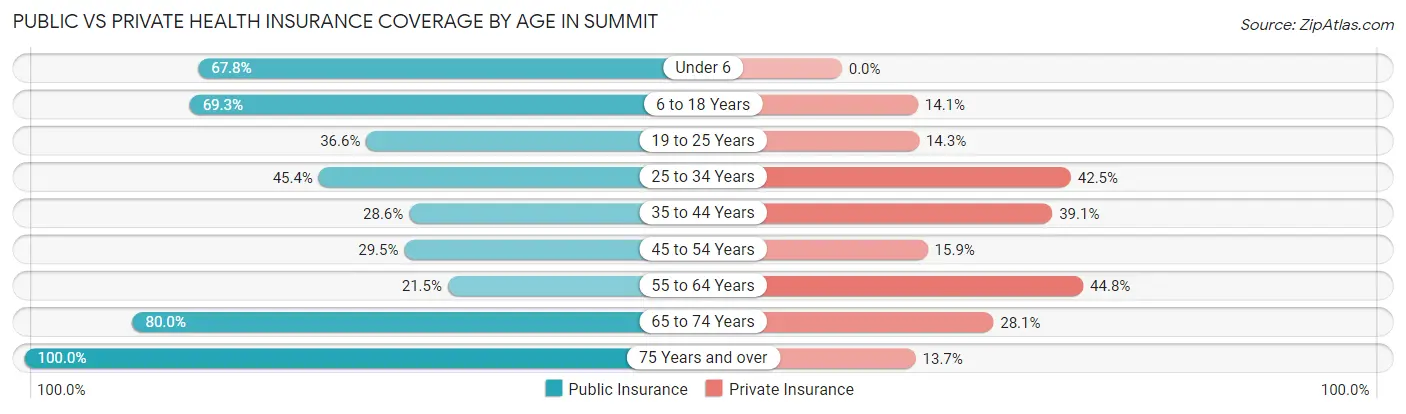
| Age Bracket | Public Insurance | Private Insurance |
| Under 6 | 187 (67.7%) | 0 (0.0%) |
| 6 to 18 Years | 545 (69.3%) | 111 (14.1%) |
| 19 to 25 Years | 217 (36.6%) | 85 (14.3%) |
| 25 to 34 Years | 252 (45.4%) | 236 (42.5%) |
| 35 to 44 Years | 140 (28.6%) | 191 (39.1%) |
| 45 to 54 Years | 176 (29.5%) | 95 (15.9%) |
| 55 to 64 Years | 237 (21.4%) | 495 (44.8%) |
| 65 to 74 Years | 307 (79.9%) | 108 (28.1%) |
| 75 Years and over | 219 (100.0%) | 30 (13.7%) |
| Total | 2,280 (45.6%) | 1,351 (27.0%) |
Disability Status by Sex by Age in Summit
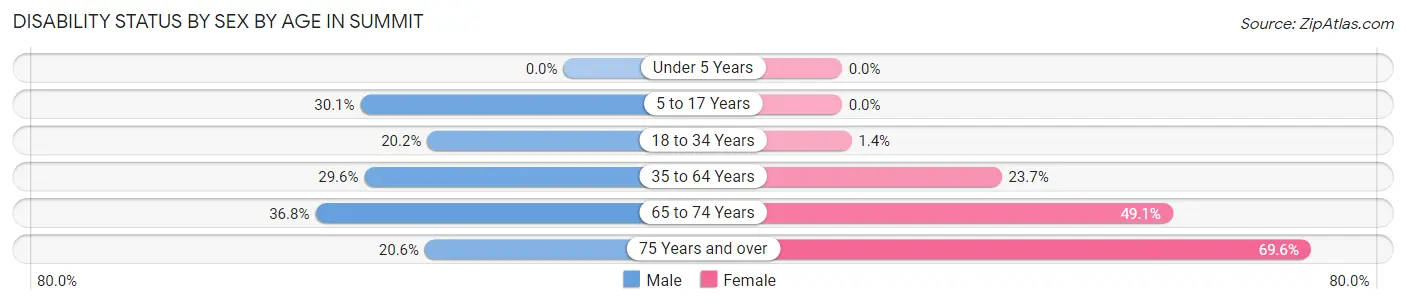
| Age Bracket | Male | Female |
| Under 5 Years | 0 (0.0%) | 0 (0.0%) |
| 5 to 17 Years | 88 (30.1%) | 0 (0.0%) |
| 18 to 34 Years | 133 (20.2%) | 9 (1.4%) |
| 35 to 64 Years | 413 (29.6%) | 188 (23.7%) |
| 65 to 74 Years | 35 (36.8%) | 142 (49.1%) |
| 75 Years and over | 22 (20.6%) | 78 (69.6%) |
Disability Class by Sex by Age in Summit
Disability Class: Hearing Difficulty
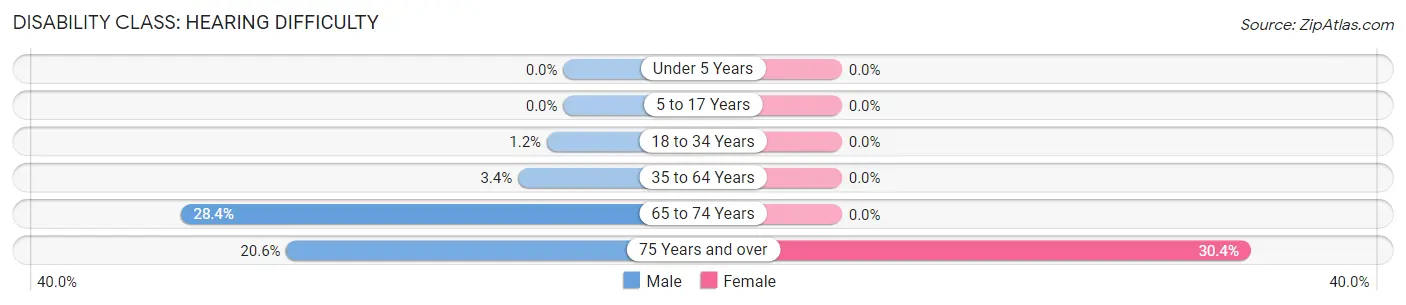
| Age Bracket | Male | Female |
| Under 5 Years | 0 (0.0%) | 0 (0.0%) |
| 5 to 17 Years | 0 (0.0%) | 0 (0.0%) |
| 18 to 34 Years | 8 (1.2%) | 0 (0.0%) |
| 35 to 64 Years | 47 (3.4%) | 0 (0.0%) |
| 65 to 74 Years | 27 (28.4%) | 0 (0.0%) |
| 75 Years and over | 22 (20.6%) | 34 (30.4%) |
Disability Class: Vision Difficulty
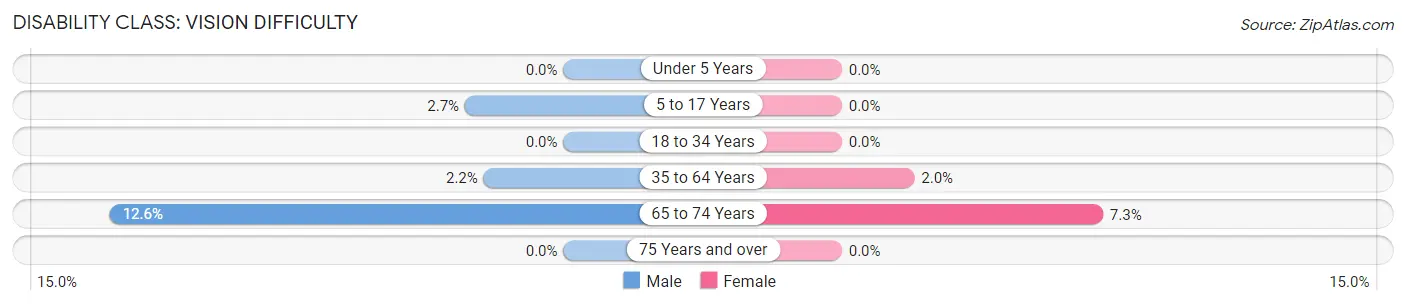
| Age Bracket | Male | Female |
| Under 5 Years | 0 (0.0%) | 0 (0.0%) |
| 5 to 17 Years | 8 (2.7%) | 0 (0.0%) |
| 18 to 34 Years | 0 (0.0%) | 0 (0.0%) |
| 35 to 64 Years | 31 (2.2%) | 16 (2.0%) |
| 65 to 74 Years | 12 (12.6%) | 21 (7.3%) |
| 75 Years and over | 0 (0.0%) | 0 (0.0%) |
Disability Class: Cognitive Difficulty
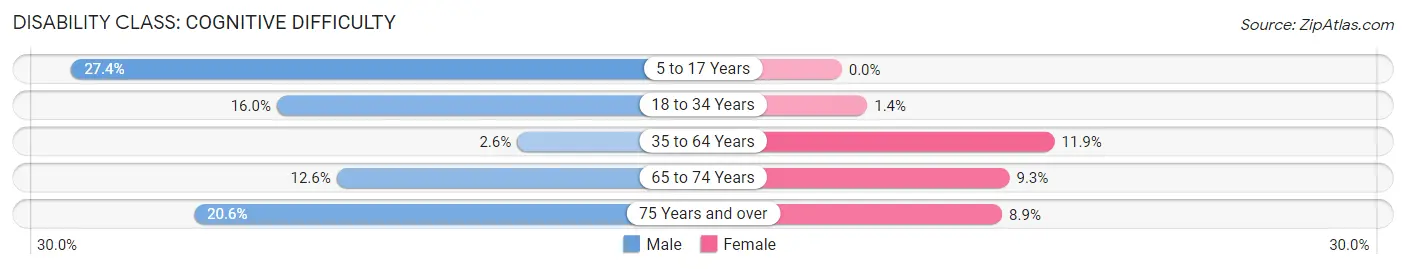
| Age Bracket | Male | Female |
| 5 to 17 Years | 80 (27.4%) | 0 (0.0%) |
| 18 to 34 Years | 105 (16.0%) | 9 (1.4%) |
| 35 to 64 Years | 36 (2.6%) | 94 (11.8%) |
| 65 to 74 Years | 12 (12.6%) | 27 (9.3%) |
| 75 Years and over | 22 (20.6%) | 10 (8.9%) |
Disability Class: Ambulatory Difficulty
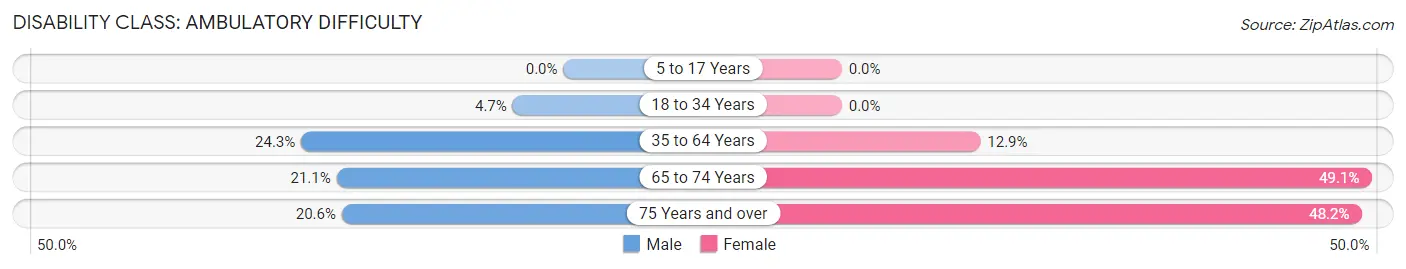
| Age Bracket | Male | Female |
| 5 to 17 Years | 0 (0.0%) | 0 (0.0%) |
| 18 to 34 Years | 31 (4.7%) | 0 (0.0%) |
| 35 to 64 Years | 340 (24.3%) | 102 (12.9%) |
| 65 to 74 Years | 20 (21.0%) | 142 (49.1%) |
| 75 Years and over | 22 (20.6%) | 54 (48.2%) |
Disability Class: Self-Care Difficulty
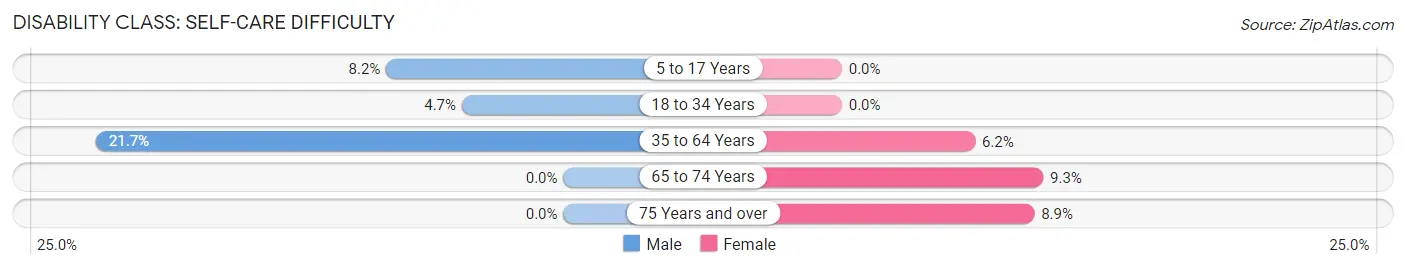
| Age Bracket | Male | Female |
| 5 to 17 Years | 24 (8.2%) | 0 (0.0%) |
| 18 to 34 Years | 31 (4.7%) | 0 (0.0%) |
| 35 to 64 Years | 303 (21.7%) | 49 (6.2%) |
| 65 to 74 Years | 0 (0.0%) | 27 (9.3%) |
| 75 Years and over | 0 (0.0%) | 10 (8.9%) |
Technology Access in Summit
Computing Device Access in Summit
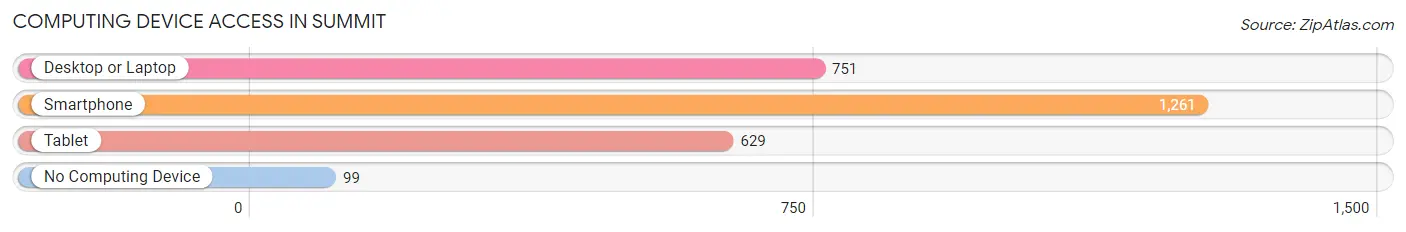
| Device Type | # Households | % Households |
| Desktop or Laptop | 751 | 54.2% |
| Smartphone | 1,261 | 91.0% |
| Tablet | 629 | 45.4% |
| No Computing Device | 99 | 7.1% |
| Total | 1,386 | 100.0% |
Internet Access in Summit
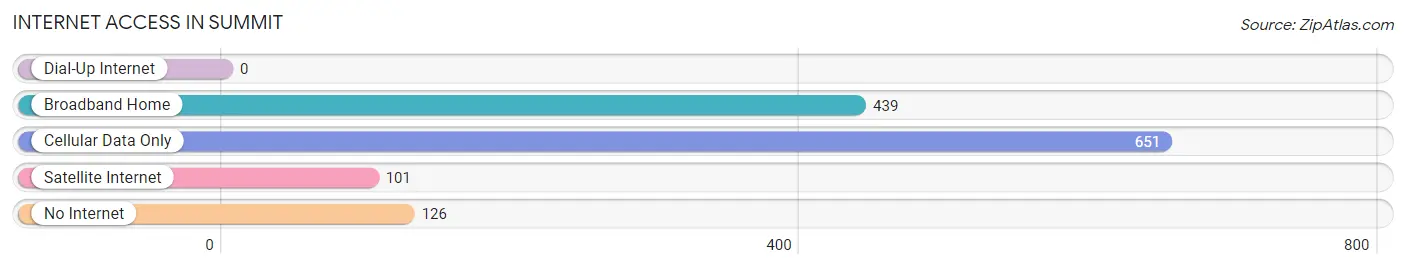
| Internet Type | # Households | % Households |
| Dial-Up Internet | 0 | 0.0% |
| Broadband Home | 439 | 31.7% |
| Cellular Data Only | 651 | 47.0% |
| Satellite Internet | 101 | 7.3% |
| No Internet | 126 | 9.1% |
| Total | 1,386 | 100.0% |
Summit Summary
Summit is a small unincorporated community located in the White Mountains of Arizona. It is situated in Navajo County, approximately 20 miles east of Show Low and 30 miles west of the New Mexico border. The community is located at an elevation of 6,890 feet and is surrounded by the Apache-Sitgreaves National Forest.
History
The area around Summit was first settled in the late 1800s by ranchers and farmers. The first post office was established in the area in 1891 and the community was officially named Summit in 1895. The name was chosen to reflect the high elevation of the area.
In the early 1900s, the area around Summit was home to a number of small mining operations. The most successful of these was the Summit Mining Company, which operated from 1906 to 1912. The company mined copper, lead, and zinc from the nearby hills.
In the 1920s, the area around Summit began to attract tourists. The first hotel in the area was built in 1924 and the first ski area was established in the 1930s. The ski area, known as the Summit Ski Bowl, operated until the late 1950s.
Geography
Summit is located in the White Mountains of Arizona. The area is characterized by rolling hills and dense forests. The highest point in the area is the summit of Mount Baldy, which rises to an elevation of 11,403 feet.
The climate in Summit is generally mild, with temperatures ranging from the low 30s in the winter to the mid-80s in the summer. The area receives an average of 20 inches of precipitation per year, with most of it falling in the form of snow in the winter months.
Economy
The economy of Summit is largely based on tourism. The area is home to a number of resorts, campgrounds, and other recreational facilities. The nearby ski area, the Summit Ski Bowl, is a popular destination for winter sports enthusiasts.
In addition to tourism, the area around Summit is home to a number of small businesses. These include restaurants, stores, and other services.
Demographics
As of the 2010 census, the population of Summit was 1,093. The racial makeup of the community was 95.3% White, 0.7% Native American, 0.3% Asian, 0.2% African American, and 3.5% from other races.
The median household income in Summit was $37,500, and the median family income was $41,250. The per capita income was $19,845. Approximately 11.3% of the population was below the poverty line.
Common Questions
What is Per Capita Income in Summit?
Per Capita income in Summit is $19,767.
What is the Median Family Income in Summit?
Median Family Income in Summit is $43,877.
What is the Median Household income in Summit?
Median Household Income in Summit is $42,133.
What is Income or Wage Gap in Summit?
Income or Wage Gap in Summit is 43.5%.
Women in Summit earn 56.5 cents for every dollar earned by a man.
What is Family Income Deficit in Summit?
Family Income Deficit in Summit is $9,422.
Families that are below poverty line in Summit earn $9,422 less on average than the poverty threshold level.
What is Inequality or Gini Index in Summit?
Inequality or Gini Index in Summit is 0.40.
What is the Total Population of Summit?
Total Population of Summit is 5,022.
What is the Total Male Population of Summit?
Total Male Population of Summit is 2,700.
What is the Total Female Population of Summit?
Total Female Population of Summit is 2,322.
What is the Ratio of Males per 100 Females in Summit?
There are 116.28 Males per 100 Females in Summit.
What is the Ratio of Females per 100 Males in Summit?
There are 86.00 Females per 100 Males in Summit.
What is the Median Population Age in Summit?
Median Population Age in Summit is 40.9 Years.
What is the Average Family Size in Summit
Average Family Size in Summit is 4.0 People.
What is the Average Household Size in Summit
Average Household Size in Summit is 3.6 People.
How Large is the Labor Force in Summit?
There are 2,402 People in the Labor Forcein in Summit.
What is the Percentage of People in the Labor Force in Summit?
57.5% of People are in the Labor Force in Summit.
What is the Unemployment Rate in Summit?
Unemployment Rate in Summit is 28.0%.