Pisinemo, AZ Map & Demographics
Pisinemo Map
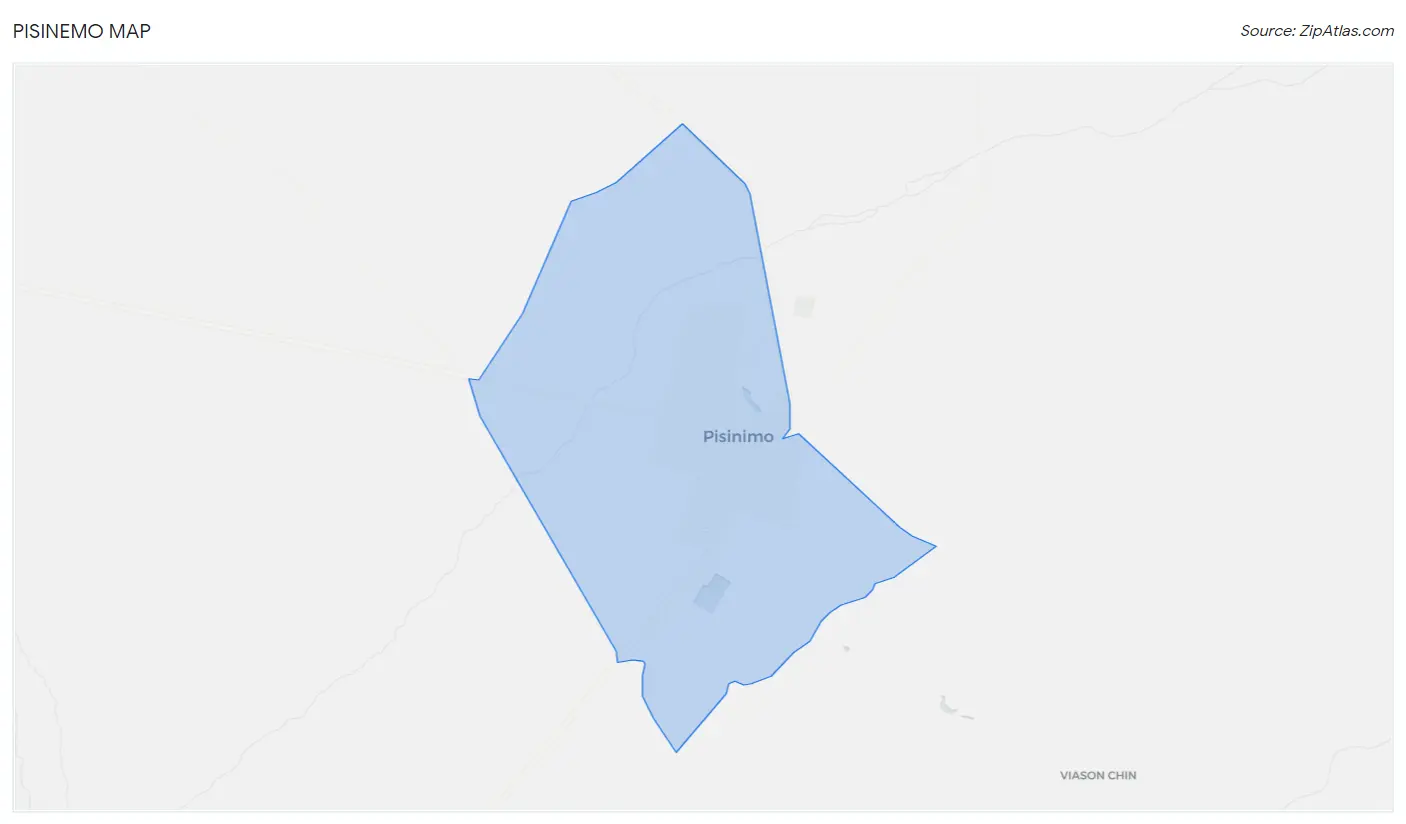
Pisinemo Overview
$7,885
PER CAPITA INCOME
$28,563
AVG FAMILY INCOME
$19,643
AVG HOUSEHOLD INCOME
0.48
INEQUALITY / GINI INDEX
353
TOTAL POPULATION
167
MALE POPULATION
186
FEMALE POPULATION
89.78
MALES / 100 FEMALES
111.38
FEMALES / 100 MALES
22.6
MEDIAN AGE
4.4
AVG FAMILY SIZE
3.5
AVG HOUSEHOLD SIZE
104
LABOR FORCE [ PEOPLE ]
43.3%
PERCENT IN LABOR FORCE
35.6%
UNEMPLOYMENT RATE
Pisinemo Area Codes
Income in Pisinemo
Income Overview in Pisinemo
Per Capita Income in Pisinemo is $7,885, while median incomes of families and households are $28,563 and $19,643 respectively.
| Characteristic | Number | Measure |
| Per Capita Income | 353 | $7,885 |
| Median Family Income | 69 | $28,563 |
| Mean Family Income | 69 | $36,751 |
| Median Household Income | 102 | $19,643 |
| Mean Household Income | 102 | $28,162 |
| Income Deficit | 69 | $0 |
| Wage / Income Gap (%) | 353 | 0.00% |
| Wage / Income Gap ($) | 353 | 100.00¢ per $1 |
| Gini / Inequality Index | 353 | 0.48 |
Earnings by Sex in Pisinemo
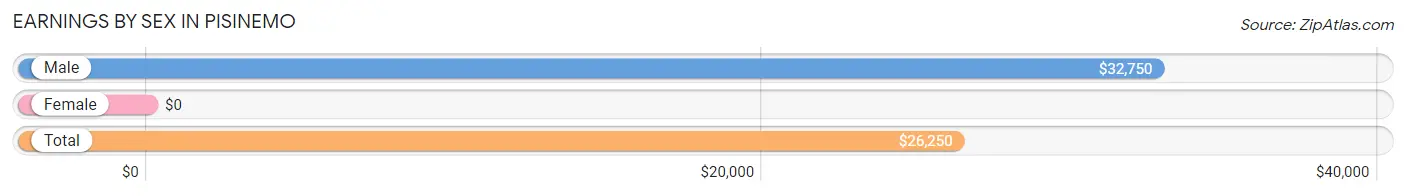
| Sex | Number | Average Earnings |
| Male | 30 (39.0%) | $32,750 |
| Female | 47 (61.0%) | $0 |
| Total | 77 (100.0%) | $26,250 |
Earnings by Sex by Income Bracket in Pisinemo
The most common earnings brackets in Pisinemo are $30,000 to $34,999 for men (10 | 33.3%) and $2,499 or less for women (10 | 21.3%).
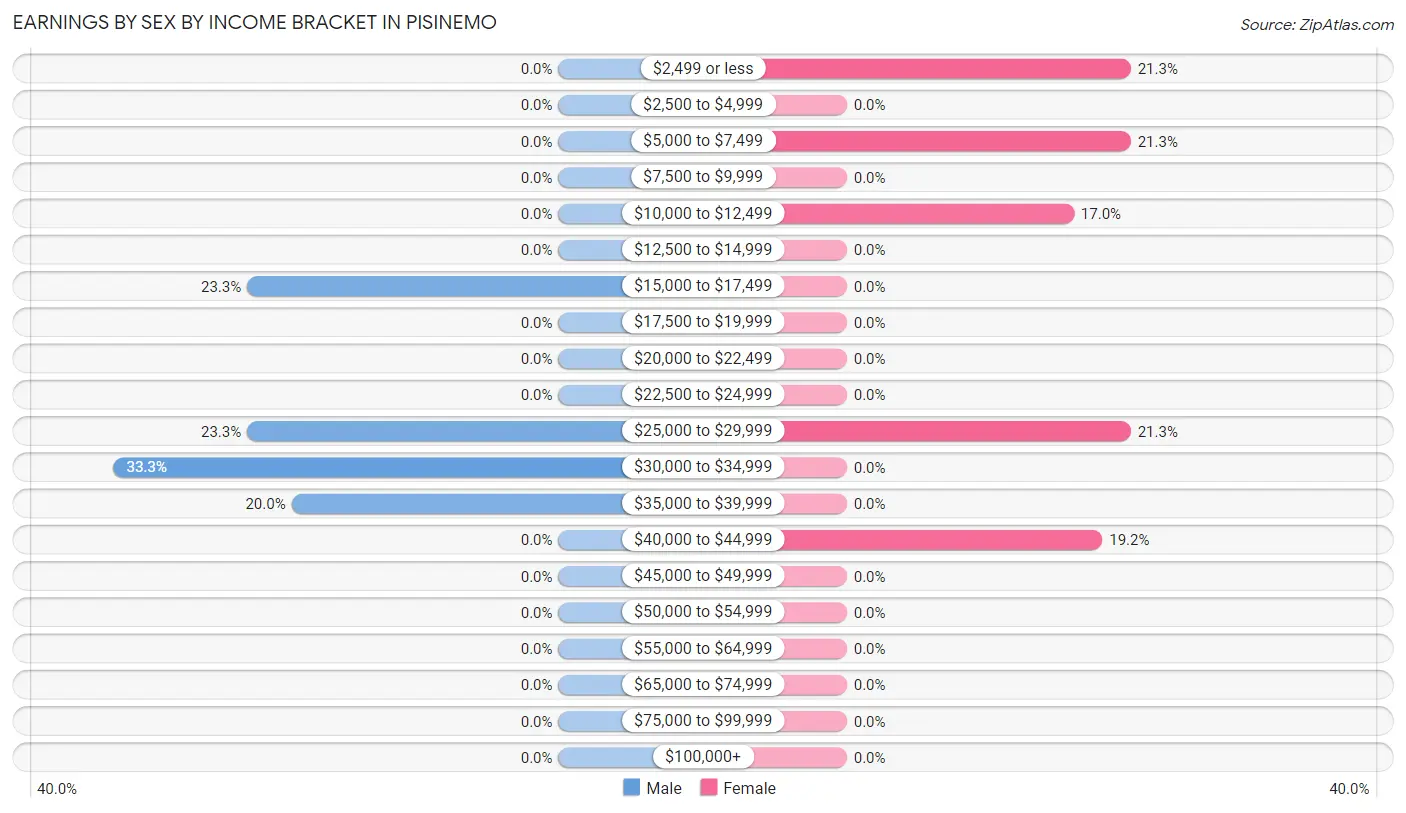
| Income | Male | Female |
| $2,499 or less | 0 (0.0%) | 10 (21.3%) |
| $2,500 to $4,999 | 0 (0.0%) | 0 (0.0%) |
| $5,000 to $7,499 | 0 (0.0%) | 10 (21.3%) |
| $7,500 to $9,999 | 0 (0.0%) | 0 (0.0%) |
| $10,000 to $12,499 | 0 (0.0%) | 8 (17.0%) |
| $12,500 to $14,999 | 0 (0.0%) | 0 (0.0%) |
| $15,000 to $17,499 | 7 (23.3%) | 0 (0.0%) |
| $17,500 to $19,999 | 0 (0.0%) | 0 (0.0%) |
| $20,000 to $22,499 | 0 (0.0%) | 0 (0.0%) |
| $22,500 to $24,999 | 0 (0.0%) | 0 (0.0%) |
| $25,000 to $29,999 | 7 (23.3%) | 10 (21.3%) |
| $30,000 to $34,999 | 10 (33.3%) | 0 (0.0%) |
| $35,000 to $39,999 | 6 (20.0%) | 0 (0.0%) |
| $40,000 to $44,999 | 0 (0.0%) | 9 (19.2%) |
| $45,000 to $49,999 | 0 (0.0%) | 0 (0.0%) |
| $50,000 to $54,999 | 0 (0.0%) | 0 (0.0%) |
| $55,000 to $64,999 | 0 (0.0%) | 0 (0.0%) |
| $65,000 to $74,999 | 0 (0.0%) | 0 (0.0%) |
| $75,000 to $99,999 | 0 (0.0%) | 0 (0.0%) |
| $100,000+ | 0 (0.0%) | 0 (0.0%) |
| Total | 30 (100.0%) | 47 (100.0%) |
Earnings by Sex by Educational Attainment in Pisinemo
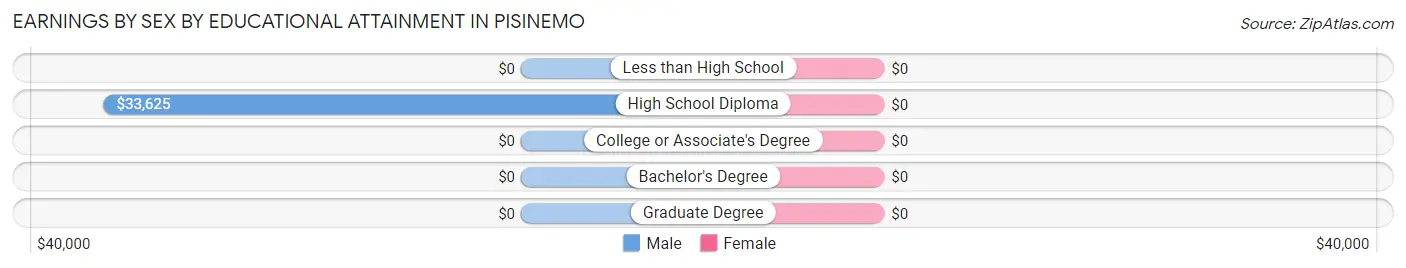
| Educational Attainment | Male Income | Female Income |
| Less than High School | - | - |
| High School Diploma | $33,625 | $0 |
| College or Associate's Degree | - | - |
| Bachelor's Degree | - | - |
| Graduate Degree | - | - |
| Total | $32,750 | $0 |
Family Income in Pisinemo
Family Income Brackets in Pisinemo
According to the Pisinemo family income data, there are 27 families falling into the $25,000 to $34,999 income range, which is the most common income bracket and makes up 39.1% of all families.
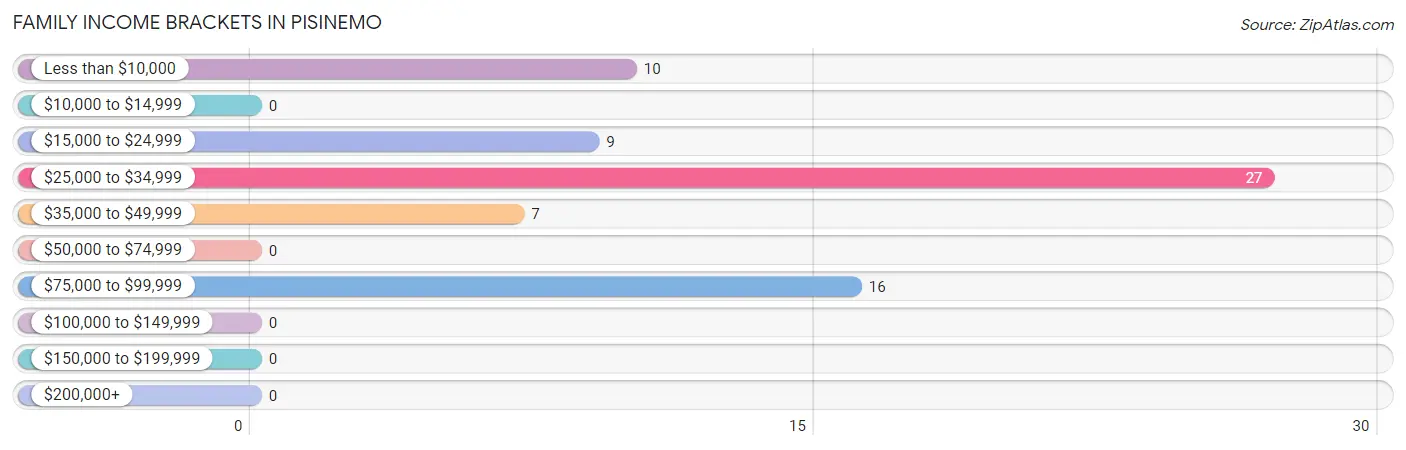
| Income Bracket | # Families | % Families |
| Less than $10,000 | 10 | 14.5% |
| $10,000 to $14,999 | 0 | 0.0% |
| $15,000 to $24,999 | 9 | 13.0% |
| $25,000 to $34,999 | 27 | 39.1% |
| $35,000 to $49,999 | 7 | 10.1% |
| $50,000 to $74,999 | 0 | 0.0% |
| $75,000 to $99,999 | 16 | 23.2% |
| $100,000 to $149,999 | 0 | 0.0% |
| $150,000 to $199,999 | 0 | 0.0% |
| $200,000+ | 0 | 0.0% |
Family Income by Famaliy Size in Pisinemo
| Income Bracket | # Families | Median Income |
| 2-Person Families | 14 (20.3%) | $0 |
| 3-Person Families | 9 (13.0%) | $0 |
| 4-Person Families | 20 (29.0%) | $0 |
| 5-Person Families | 10 (14.5%) | $0 |
| 6-Person Families | 0 (0.0%) | $0 |
| 7+ Person Families | 16 (23.2%) | $0 |
| Total | 69 (100.0%) | $28,563 |
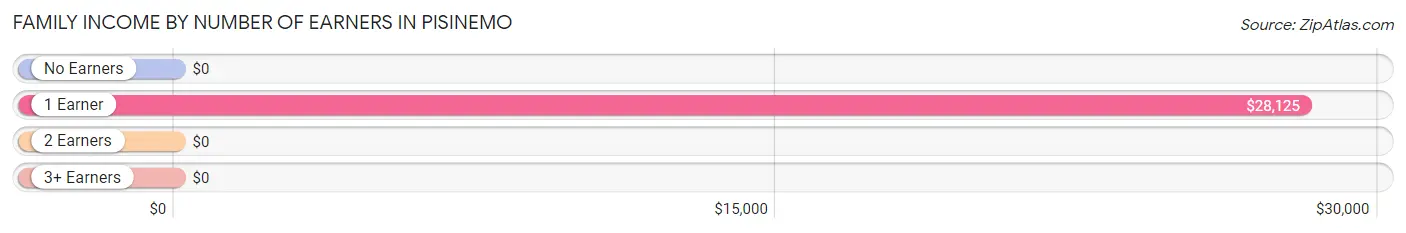
Family Income by Number of Earners in Pisinemo
| Number of Earners | # Families | Median Income |
| No Earners | 16 (23.2%) | $0 |
| 1 Earner | 44 (63.8%) | $28,125 |
| 2 Earners | 0 (0.0%) | $0 |
| 3+ Earners | 9 (13.0%) | $0 |
| Total | 69 (100.0%) | $28,563 |
Household Income in Pisinemo
Household Income Brackets in Pisinemo
With 27 households falling in the category, the $25,000 to $34,999 income range is the most frequent in Pisinemo, accounting for 26.5% of all households.
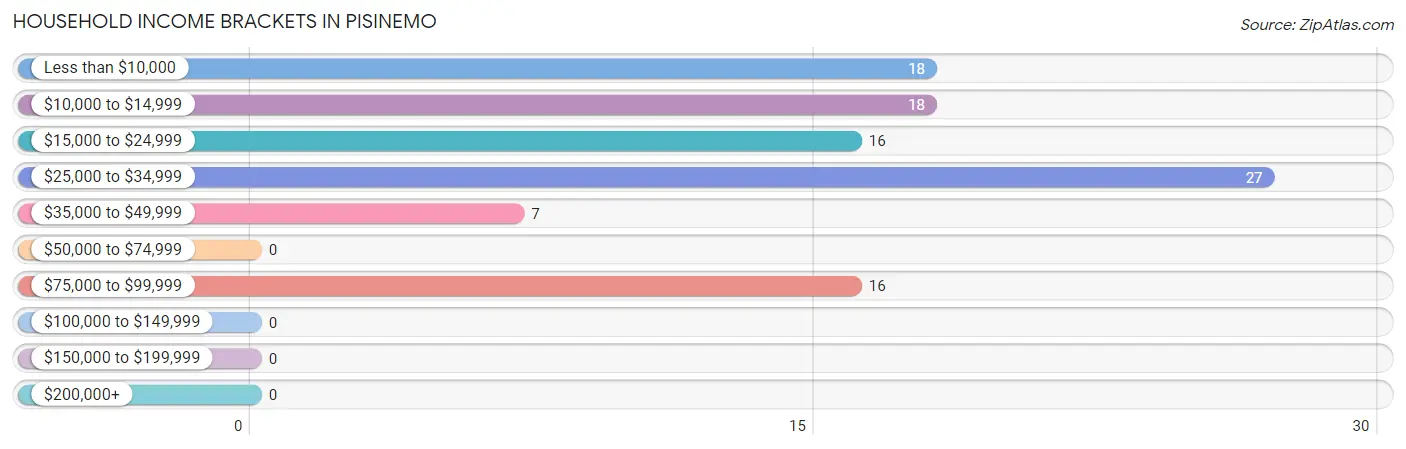
| Income Bracket | # Households | % Households |
| Less than $10,000 | 18 | 17.6% |
| $10,000 to $14,999 | 18 | 17.6% |
| $15,000 to $24,999 | 16 | 15.7% |
| $25,000 to $34,999 | 27 | 26.5% |
| $35,000 to $49,999 | 7 | 6.9% |
| $50,000 to $74,999 | 0 | 0.0% |
| $75,000 to $99,999 | 16 | 15.7% |
| $100,000 to $149,999 | 0 | 0.0% |
| $150,000 to $199,999 | 0 | 0.0% |
| $200,000+ | 0 | 0.0% |
Household Income by Householder Age in Pisinemo
| Income Bracket | # Households | Median Income |
| 15 to 24 Years | 0 (0.0%) | $0 |
| 25 to 44 Years | 57 (55.9%) | $0 |
| 45 to 64 Years | 17 (16.7%) | $0 |
| 65+ Years | 28 (27.5%) | $0 |
| Total | 102 (100.0%) | $19,643 |
Poverty in Pisinemo
Income Below Poverty by Sex and Age in Pisinemo
With 60.5% poverty level for males and 50.5% for females among the residents of Pisinemo, 6 to 11 year old males and 12 to 14 year old females are the most vulnerable to poverty, with 29 males (100.0%) and 8 females (100.0%) in their respective age groups living below the poverty level.
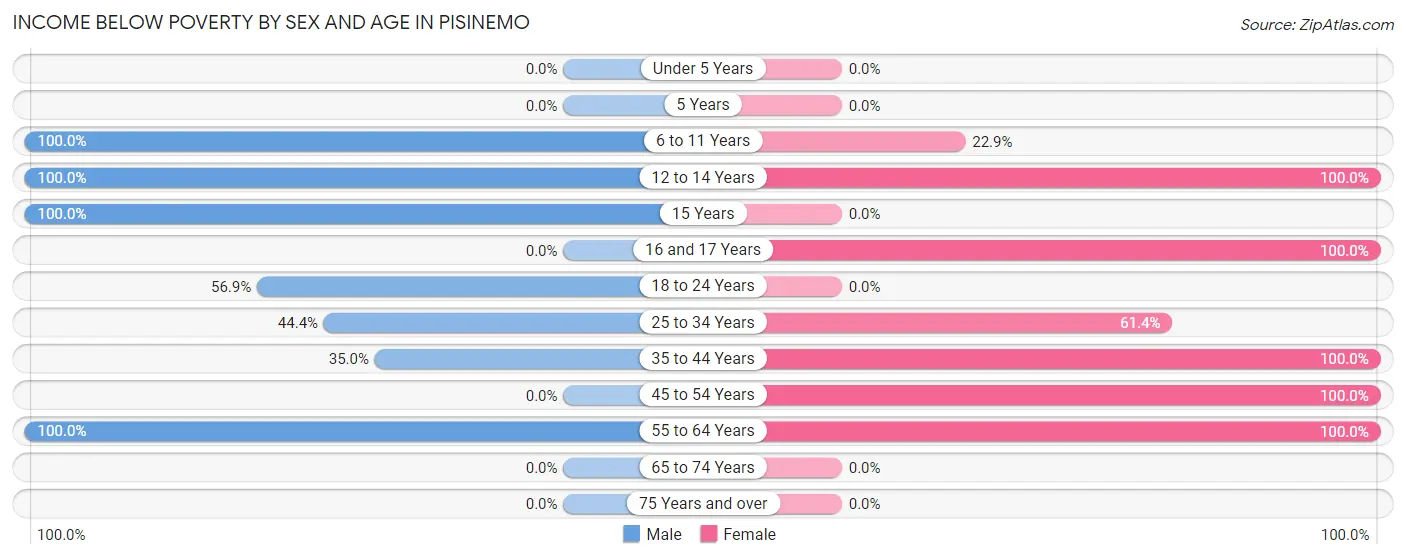
| Age Bracket | Male | Female |
| Under 5 Years | 0 (0.0%) | 0 (0.0%) |
| 5 Years | 0 (0.0%) | 0 (0.0%) |
| 6 to 11 Years | 29 (100.0%) | 11 (22.9%) |
| 12 to 14 Years | 8 (100.0%) | 8 (100.0%) |
| 15 Years | 11 (100.0%) | 0 (0.0%) |
| 16 and 17 Years | 0 (0.0%) | 12 (100.0%) |
| 18 to 24 Years | 29 (56.9%) | 0 (0.0%) |
| 25 to 34 Years | 8 (44.4%) | 27 (61.4%) |
| 35 to 44 Years | 7 (35.0%) | 20 (100.0%) |
| 45 to 54 Years | 0 (0.0%) | 8 (100.0%) |
| 55 to 64 Years | 9 (100.0%) | 8 (100.0%) |
| 65 to 74 Years | 0 (0.0%) | 0 (0.0%) |
| 75 Years and over | 0 (0.0%) | 0 (0.0%) |
| Total | 101 (60.5%) | 94 (50.5%) |
Income Above Poverty by Sex and Age in Pisinemo
According to the poverty statistics in Pisinemo, males aged 65 to 74 years and females aged under 5 years are the age groups that are most secure financially, with 100.0% of males and 100.0% of females in these age groups living above the poverty line.
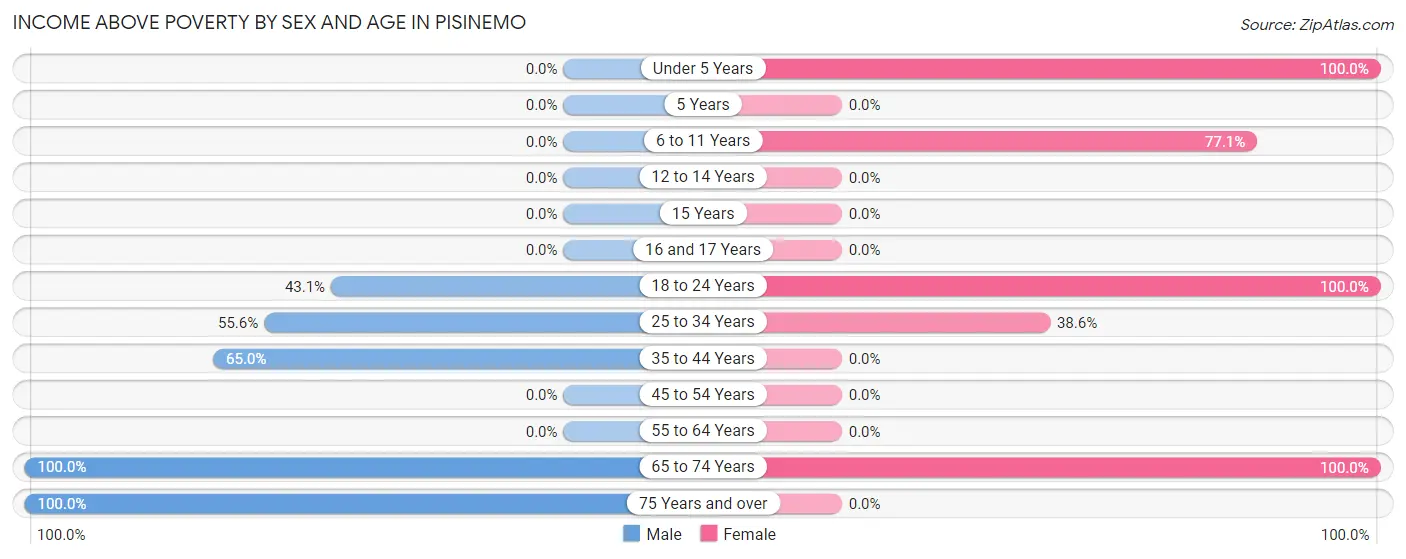
| Age Bracket | Male | Female |
| Under 5 Years | 0 (0.0%) | 9 (100.0%) |
| 5 Years | 0 (0.0%) | 0 (0.0%) |
| 6 to 11 Years | 0 (0.0%) | 37 (77.1%) |
| 12 to 14 Years | 0 (0.0%) | 0 (0.0%) |
| 15 Years | 0 (0.0%) | 0 (0.0%) |
| 16 and 17 Years | 0 (0.0%) | 0 (0.0%) |
| 18 to 24 Years | 22 (43.1%) | 10 (100.0%) |
| 25 to 34 Years | 10 (55.6%) | 17 (38.6%) |
| 35 to 44 Years | 13 (65.0%) | 0 (0.0%) |
| 45 to 54 Years | 0 (0.0%) | 0 (0.0%) |
| 55 to 64 Years | 0 (0.0%) | 0 (0.0%) |
| 65 to 74 Years | 7 (100.0%) | 19 (100.0%) |
| 75 Years and over | 14 (100.0%) | 0 (0.0%) |
| Total | 66 (39.5%) | 92 (49.5%) |
Income Below Poverty Among Married-Couple Families in Pisinemo
The poverty statistics for married-couple families in Pisinemo show that 30.3% or 10 of the total 33 families live below the poverty line. Families with 1 or 2 children have the highest poverty rate of 58.8%, comprising of 10 families. On the other hand, families with no children have the lowest poverty rate of 0.0%, which includes 0 families.
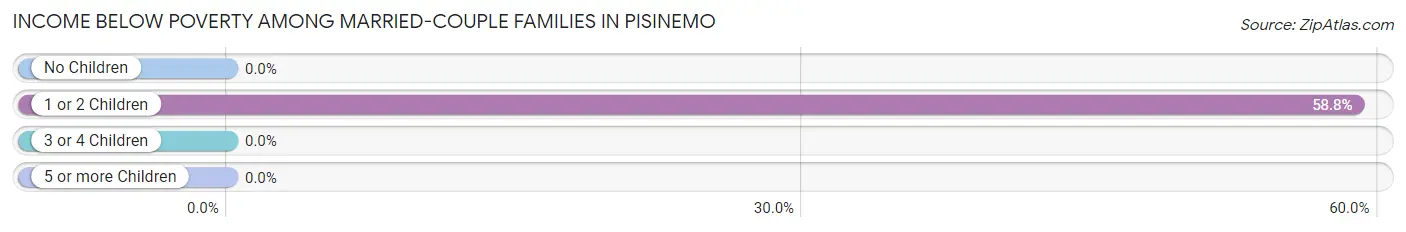
| Children | Above Poverty | Below Poverty |
| No Children | 7 (100.0%) | 0 (0.0%) |
| 1 or 2 Children | 7 (41.2%) | 10 (58.8%) |
| 3 or 4 Children | 9 (100.0%) | 0 (0.0%) |
| 5 or more Children | 0 (0.0%) | 0 (0.0%) |
| Total | 23 (69.7%) | 10 (30.3%) |
Income Below Poverty Among Single-Parent Households in Pisinemo
According to the poverty data in Pisinemo, 100.0% or 9 single-father households and 74.1% or 20 single-mother households are living below the poverty line. Among single-father households, those with no children have the highest poverty rate, with 9 households (100.0%) experiencing poverty. Likewise, among single-mother households, those with 3 or 4 children have the highest poverty rate, with 20 households (100.0%) falling below the poverty line.
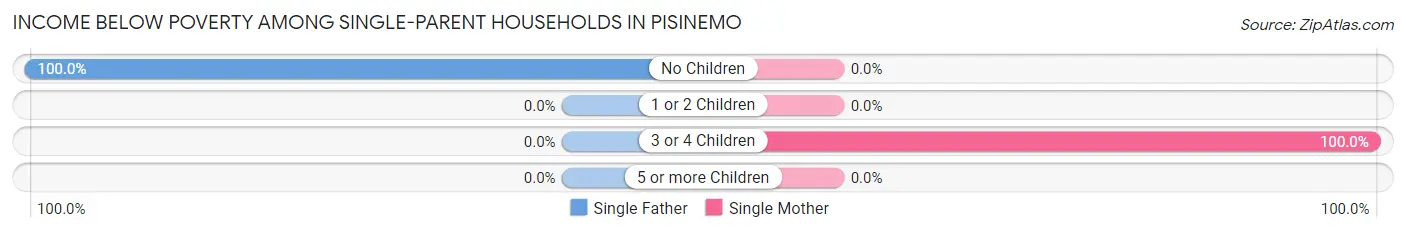
| Children | Single Father | Single Mother |
| No Children | 9 (100.0%) | 0 (0.0%) |
| 1 or 2 Children | 0 (0.0%) | 0 (0.0%) |
| 3 or 4 Children | 0 (0.0%) | 20 (100.0%) |
| 5 or more Children | 0 (0.0%) | 0 (0.0%) |
| Total | 9 (100.0%) | 20 (74.1%) |
Income Below Poverty Among Married-Couple vs Single-Parent Households in Pisinemo
The poverty data for Pisinemo shows that 10 of the married-couple family households (30.3%) and 29 of the single-parent households (80.6%) are living below the poverty level. Within the married-couple family households, those with 1 or 2 children have the highest poverty rate, with 10 households (58.8%) falling below the poverty line. Among the single-parent households, those with 3 or 4 children have the highest poverty rate, with 20 household (100.0%) living below poverty.
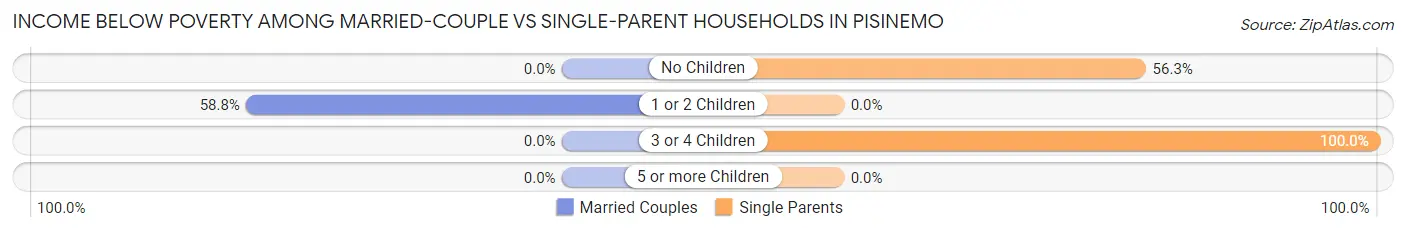
| Children | Married-Couple Families | Single-Parent Households |
| No Children | 0 (0.0%) | 9 (56.2%) |
| 1 or 2 Children | 10 (58.8%) | 0 (0.0%) |
| 3 or 4 Children | 0 (0.0%) | 20 (100.0%) |
| 5 or more Children | 0 (0.0%) | 0 (0.0%) |
| Total | 10 (30.3%) | 29 (80.6%) |
Race in Pisinemo
The most populous races in Pisinemo are Native / Alaskan (313 | 88.7%), Hispanic or Latino (64 | 18.1%), and Two or more Races (40 | 11.3%).
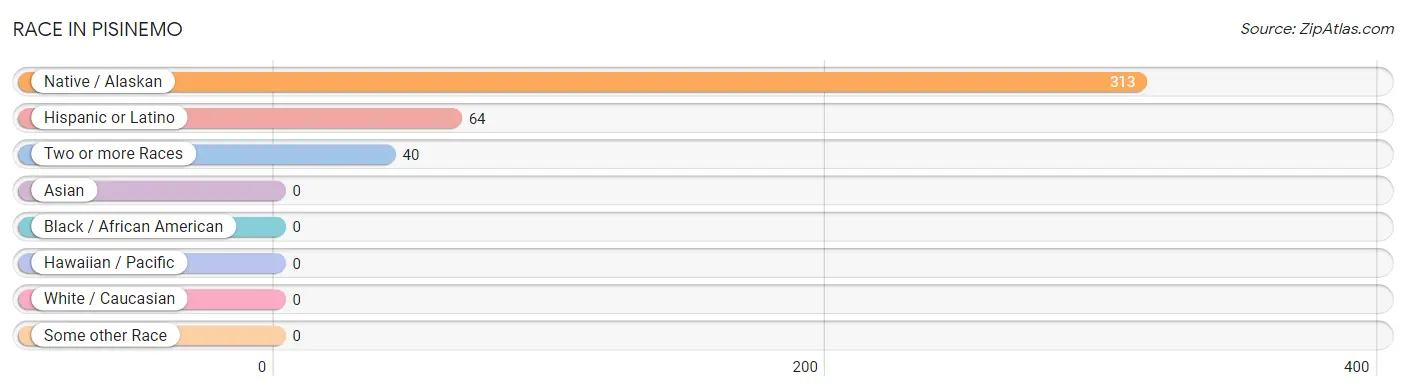
| Race | # Population | % Population |
| Asian | 0 | 0.0% |
| Black / African American | 0 | 0.0% |
| Hawaiian / Pacific | 0 | 0.0% |
| Hispanic or Latino | 64 | 18.1% |
| Native / Alaskan | 313 | 88.7% |
| White / Caucasian | 0 | 0.0% |
| Two or more Races | 40 | 11.3% |
| Some other Race | 0 | 0.0% |
| Total | 353 | 100.0% |
Ancestry in Pisinemo
The most populous ancestries reported in Pisinemo are Tohono O'Odham (313 | 88.7%), Mexican (56 | 15.9%), Dutch (10 | 2.8%), Central American (8 | 2.3%), and Guatemalan (8 | 2.3%), together accounting for 111.9% of all Pisinemo residents.
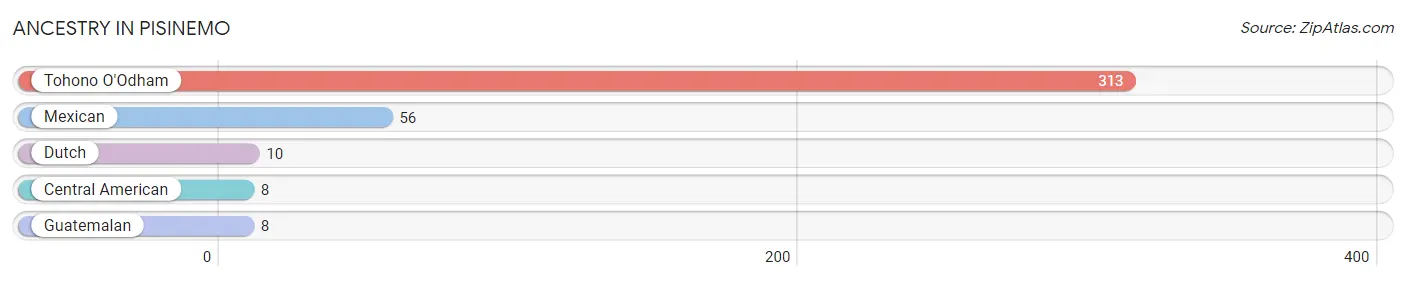
| Ancestry | # Population | % Population |
| Central American | 8 | 2.3% |
| Dutch | 10 | 2.8% |
| Guatemalan | 8 | 2.3% |
| Mexican | 56 | 15.9% |
| Tohono O'Odham | 313 | 88.7% | View All 5 Rows |
Immigrants in Pisinemo

| Immigration Origin | # Population | % Population | View All 0 Rows |
Sex and Age in Pisinemo
Sex and Age in Pisinemo
The most populous age groups in Pisinemo are 20 to 24 Years (43 | 25.8%) for men and 5 to 9 Years (48 | 25.8%) for women.
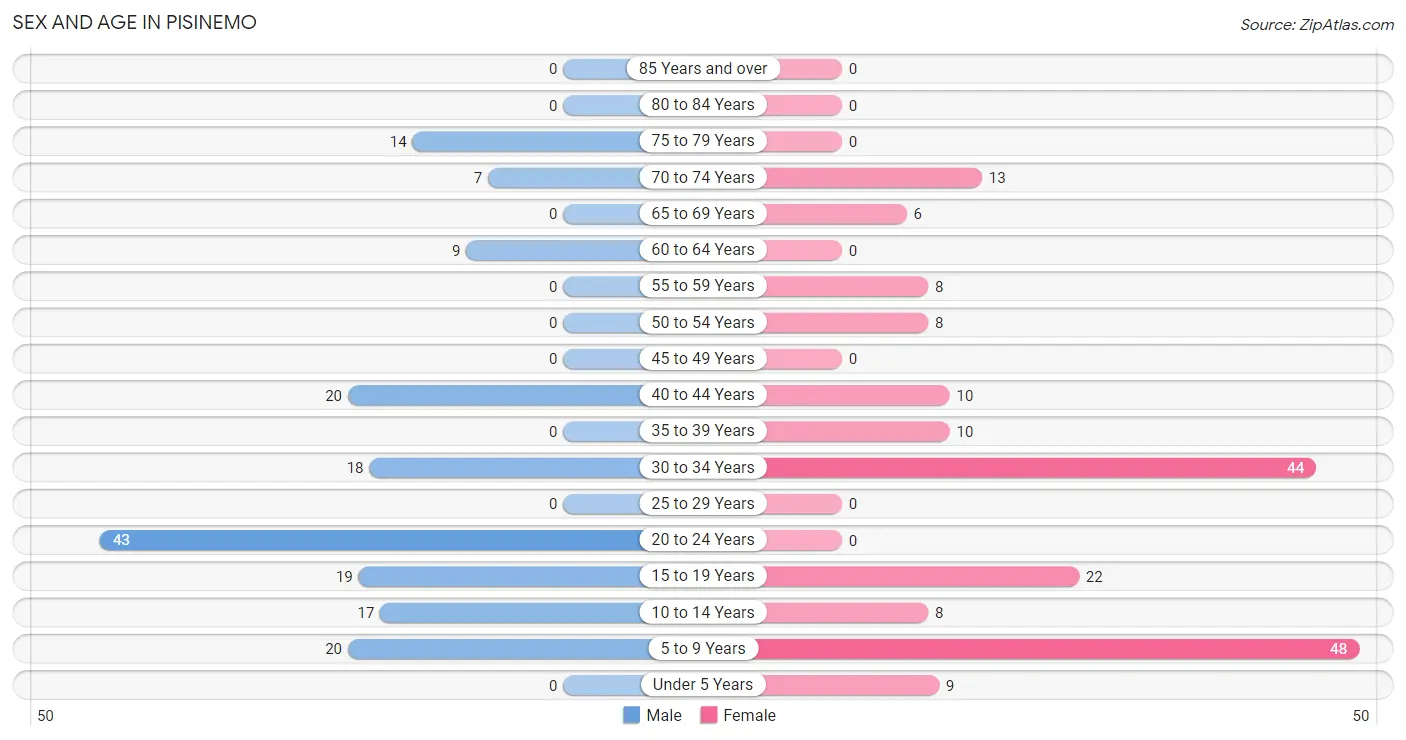
| Age Bracket | Male | Female |
| Under 5 Years | 0 (0.0%) | 9 (4.8%) |
| 5 to 9 Years | 20 (12.0%) | 48 (25.8%) |
| 10 to 14 Years | 17 (10.2%) | 8 (4.3%) |
| 15 to 19 Years | 19 (11.4%) | 22 (11.8%) |
| 20 to 24 Years | 43 (25.8%) | 0 (0.0%) |
| 25 to 29 Years | 0 (0.0%) | 0 (0.0%) |
| 30 to 34 Years | 18 (10.8%) | 44 (23.7%) |
| 35 to 39 Years | 0 (0.0%) | 10 (5.4%) |
| 40 to 44 Years | 20 (12.0%) | 10 (5.4%) |
| 45 to 49 Years | 0 (0.0%) | 0 (0.0%) |
| 50 to 54 Years | 0 (0.0%) | 8 (4.3%) |
| 55 to 59 Years | 0 (0.0%) | 8 (4.3%) |
| 60 to 64 Years | 9 (5.4%) | 0 (0.0%) |
| 65 to 69 Years | 0 (0.0%) | 6 (3.2%) |
| 70 to 74 Years | 7 (4.2%) | 13 (7.0%) |
| 75 to 79 Years | 14 (8.4%) | 0 (0.0%) |
| 80 to 84 Years | 0 (0.0%) | 0 (0.0%) |
| 85 Years and over | 0 (0.0%) | 0 (0.0%) |
| Total | 167 (100.0%) | 186 (100.0%) |
Families and Households in Pisinemo
Median Family Size in Pisinemo
The median family size in Pisinemo is 4.42 persons per family, with married-couple families (33 | 47.8%) accounting for the largest median family size of 5.55 persons per family. On the other hand, single male/father families (9 | 13.0%) represent the smallest median family size with 3.00 persons per family.
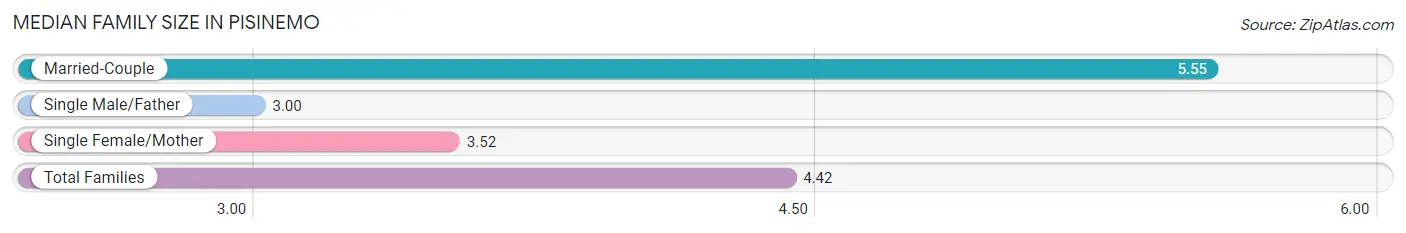
| Family Type | # Families | Family Size |
| Married-Couple | 33 (47.8%) | 5.55 |
| Single Male/Father | 9 (13.0%) | 3.00 |
| Single Female/Mother | 27 (39.1%) | 3.52 |
| Total Families | 69 (100.0%) | 4.42 |
Median Household Size in Pisinemo
The median household size in Pisinemo is 3.46 persons per household, with married-couple households (33 | 32.4%) accounting for the largest median household size of 5.55 persons per household. non-family households (33 | 32.4%) represent the smallest median household size with 1.45 persons per household.
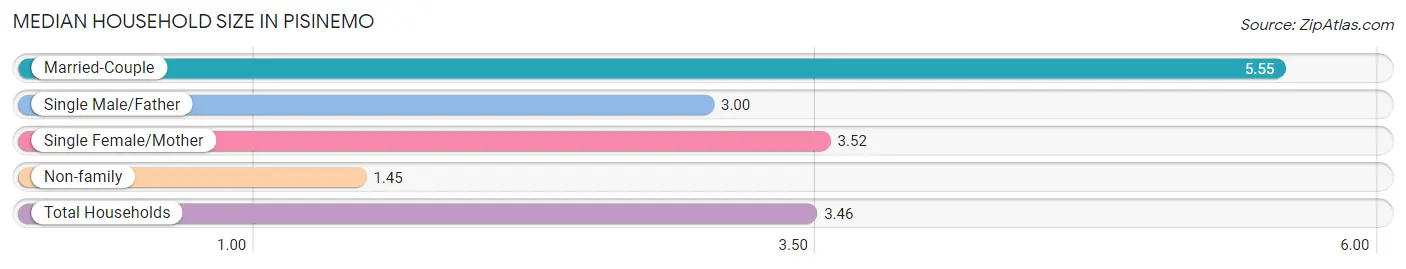
| Household Type | # Households | Household Size |
| Married-Couple | 33 (32.4%) | 5.55 |
| Single Male/Father | 9 (8.8%) | 3.00 |
| Single Female/Mother | 27 (26.5%) | 3.52 |
| Non-family | 33 (32.4%) | 1.45 |
| Total Households | 102 (100.0%) | 3.46 |
Household Size by Marriage Status in Pisinemo
Out of a total of 102 households in Pisinemo, 69 (67.6%) are family households, while 33 (32.4%) are nonfamily households. The most numerous type of family households are 4-person households, comprising 20, and the most common type of nonfamily households are 1-person households, comprising 17.
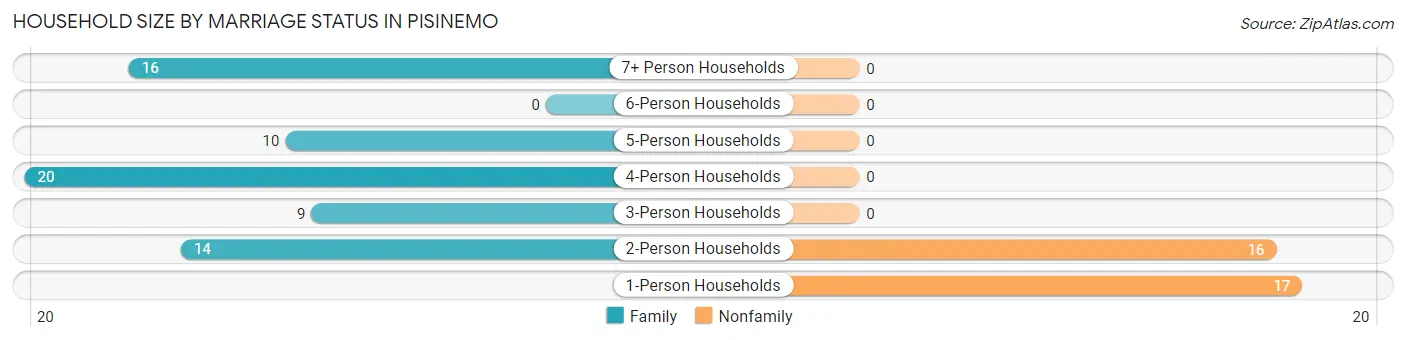
| Household Size | Family Households | Nonfamily Households |
| 1-Person Households | - | 17 (16.7%) |
| 2-Person Households | 14 (13.7%) | 16 (15.7%) |
| 3-Person Households | 9 (8.8%) | 0 (0.0%) |
| 4-Person Households | 20 (19.6%) | 0 (0.0%) |
| 5-Person Households | 10 (9.8%) | 0 (0.0%) |
| 6-Person Households | 0 (0.0%) | 0 (0.0%) |
| 7+ Person Households | 16 (15.7%) | 0 (0.0%) |
| Total | 69 (67.6%) | 33 (32.4%) |
Female Fertility in Pisinemo
Fertility by Age in Pisinemo
| Age Bracket | Women with Births | Births / 1,000 Women |
| 15 to 19 years | 0 (0.0%) | 0.0 |
| 20 to 34 years | 0 (0.0%) | 0.0 |
| 35 to 50 years | 0 (0.0%) | 0.0 |
| Total | 0 (0.0%) | 0.0 |
Fertility by Age by Marriage Status in Pisinemo
| Age Bracket | Married | Unmarried |
| 15 to 19 years | 0 (0.0%) | 0 (0.0%) |
| 20 to 34 years | 0 (0.0%) | 0 (0.0%) |
| 35 to 50 years | 0 (0.0%) | 0 (0.0%) |
| Total | 0 (0.0%) | 0 (0.0%) |
Fertility by Education in Pisinemo
| Educational Attainment | Women with Births | Births / 1,000 Women |
| Less than High School | 0 (0.0%) | 0.0 |
| High School Diploma | 0 (0.0%) | 0.0 |
| College or Associate's Degree | 0 (0.0%) | 0.0 |
| Bachelor's Degree | 0 (0.0%) | 0.0 |
| Graduate Degree | 0 (0.0%) | 0.0 |
| Total | 0 (0.0%) | 0.0 |
Fertility by Education by Marriage Status in Pisinemo
| Educational Attainment | Married | Unmarried |
| Less than High School | 0 (0.0%) | 0 (0.0%) |
| High School Diploma | 0 (0.0%) | 0 (0.0%) |
| College or Associate's Degree | 0 (0.0%) | 0 (0.0%) |
| Bachelor's Degree | 0 (0.0%) | 0 (0.0%) |
| Graduate Degree | 0 (0.0%) | 0 (0.0%) |
| Total | 0 (0.0%) | 0 (0.0%) |
Employment Characteristics in Pisinemo
Employment by Class of Employer in Pisinemo
Among the 67 employed individuals in Pisinemo, local government employees (37 | 55.2%), private company employees (15 | 22.4%), and federal government employees (9 | 13.4%) make up the most common classes of employment.
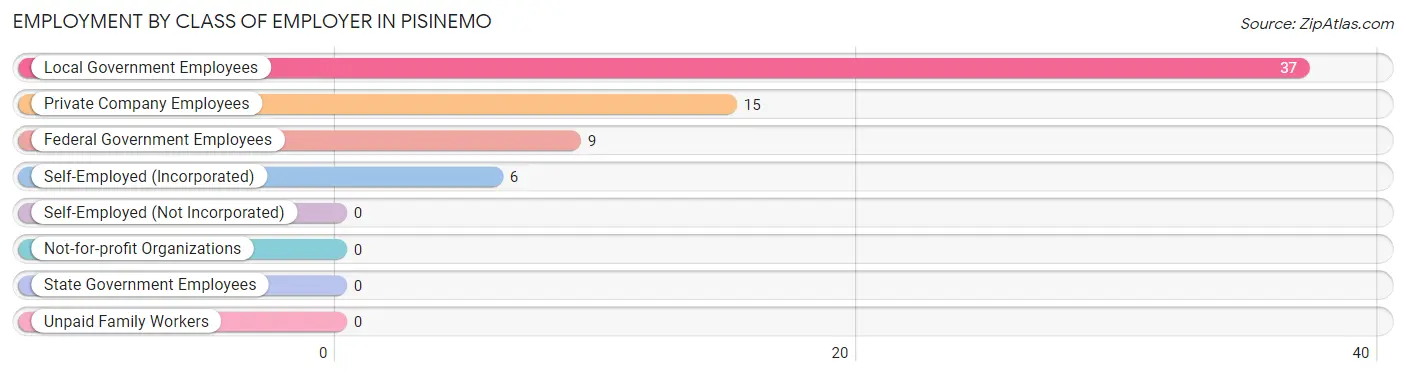
| Employer Class | # Employees | % Employees |
| Private Company Employees | 15 | 22.4% |
| Self-Employed (Incorporated) | 6 | 9.0% |
| Self-Employed (Not Incorporated) | 0 | 0.0% |
| Not-for-profit Organizations | 0 | 0.0% |
| Local Government Employees | 37 | 55.2% |
| State Government Employees | 0 | 0.0% |
| Federal Government Employees | 9 | 13.4% |
| Unpaid Family Workers | 0 | 0.0% |
| Total | 67 | 100.0% |
Employment Status by Age in Pisinemo
According to the labor force statistics for Pisinemo, out of the total population over 16 years of age (240), 43.3% or 104 individuals are in the labor force, with 35.6% or 37 of them unemployed. The age group with the highest labor force participation rate is 55 to 59 years, with 100.0% or 8 individuals in the labor force. Within the labor force, the 20 to 24 years age range has the highest percentage of unemployed individuals, with 100.0% or 11 of them being unemployed.
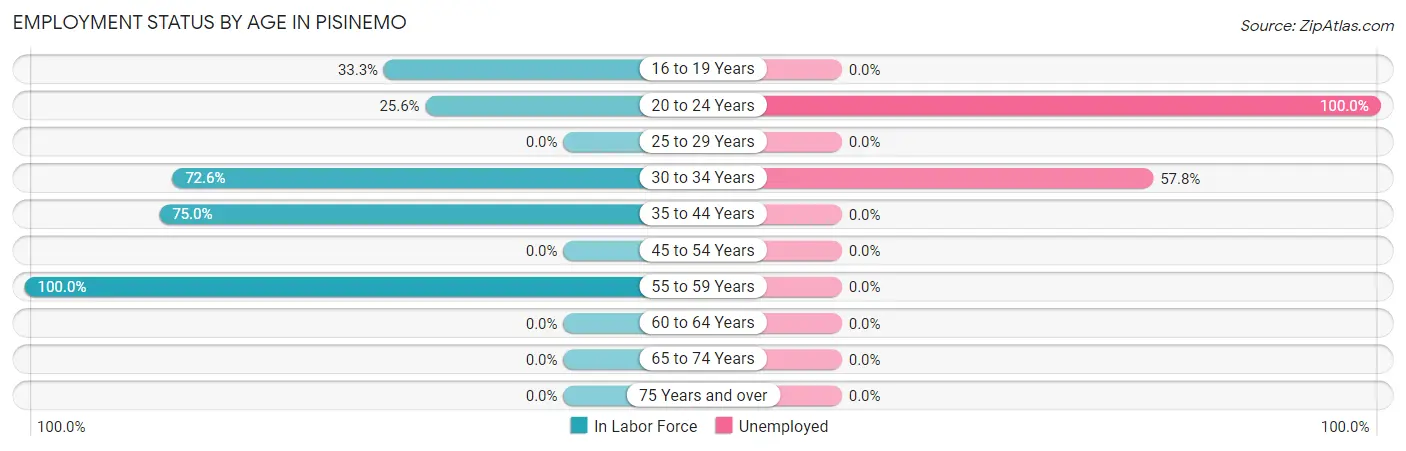
| Age Bracket | In Labor Force | Unemployed |
| 16 to 19 Years | 10 (33.3%) | 0 (0.0%) |
| 20 to 24 Years | 11 (25.6%) | 11 (100.0%) |
| 25 to 29 Years | 0 (0.0%) | 0 (0.0%) |
| 30 to 34 Years | 45 (72.6%) | 26 (57.8%) |
| 35 to 44 Years | 30 (75.0%) | 0 (0.0%) |
| 45 to 54 Years | 0 (0.0%) | 0 (0.0%) |
| 55 to 59 Years | 8 (100.0%) | 0 (0.0%) |
| 60 to 64 Years | 0 (0.0%) | 0 (0.0%) |
| 65 to 74 Years | 0 (0.0%) | 0 (0.0%) |
| 75 Years and over | 0 (0.0%) | 0 (0.0%) |
| Total | 104 (43.3%) | 37 (35.6%) |
Employment Status by Educational Attainment in Pisinemo
According to labor force statistics for Pisinemo, 65.4% of individuals (83) out of the total population between 25 and 64 years of age (127) are in the labor force, with 31.3% or 26 of them being unemployed. The group with the highest labor force participation rate are those with the educational attainment of high school diploma, with 80.4% or 41 individuals in the labor force. Within the labor force, individuals with less than high school education have the highest percentage of unemployment, with 100.0% or 8 of them being unemployed.
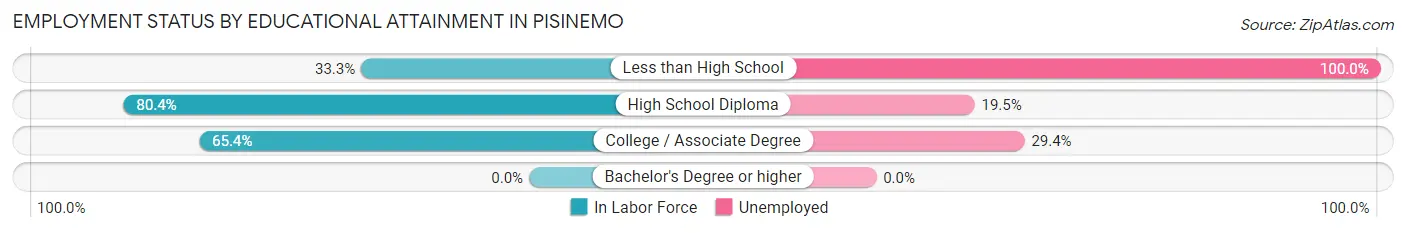
| Educational Attainment | In Labor Force | Unemployed |
| Less than High School | 8 (33.3%) | 24 (100.0%) |
| High School Diploma | 41 (80.4%) | 10 (19.5%) |
| College / Associate Degree | 34 (65.4%) | 15 (29.4%) |
| Bachelor's Degree or higher | 0 (0.0%) | 0 (0.0%) |
| Total | 83 (65.4%) | 40 (31.3%) |
Employment Occupations by Sex in Pisinemo
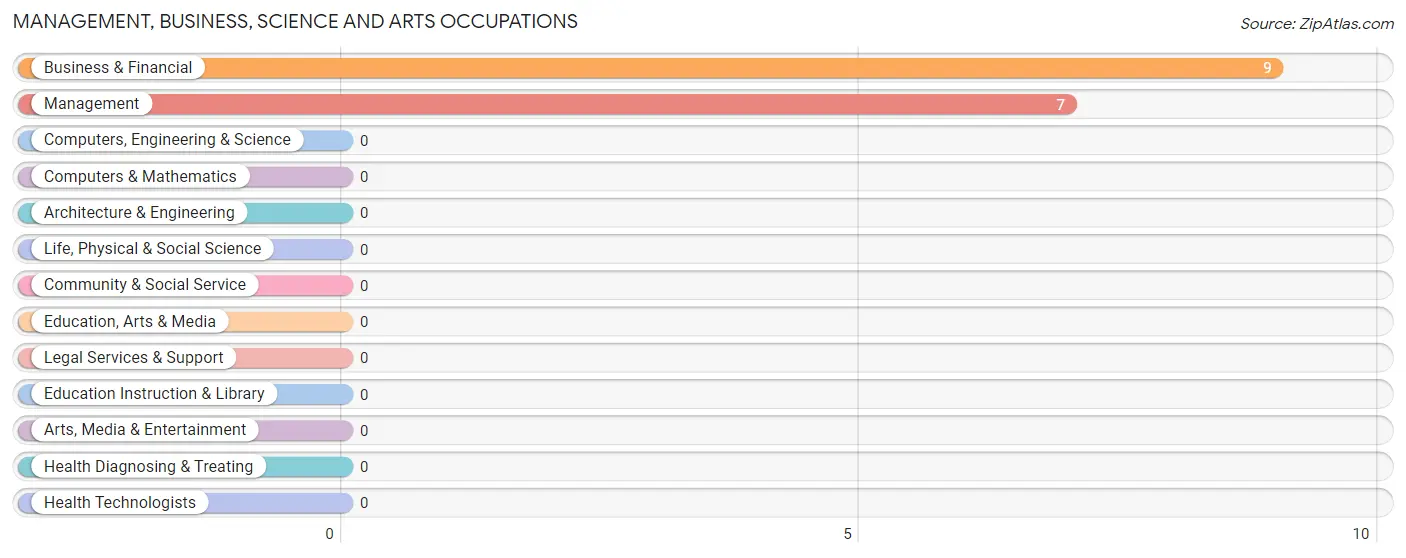
Management, Business, Science and Arts Occupations
The most common Management, Business, Science and Arts occupations in Pisinemo are Business & Financial (9 | 13.4%), and Management (7 | 10.4%).
Management, Business, Science and Arts Occupations by Sex
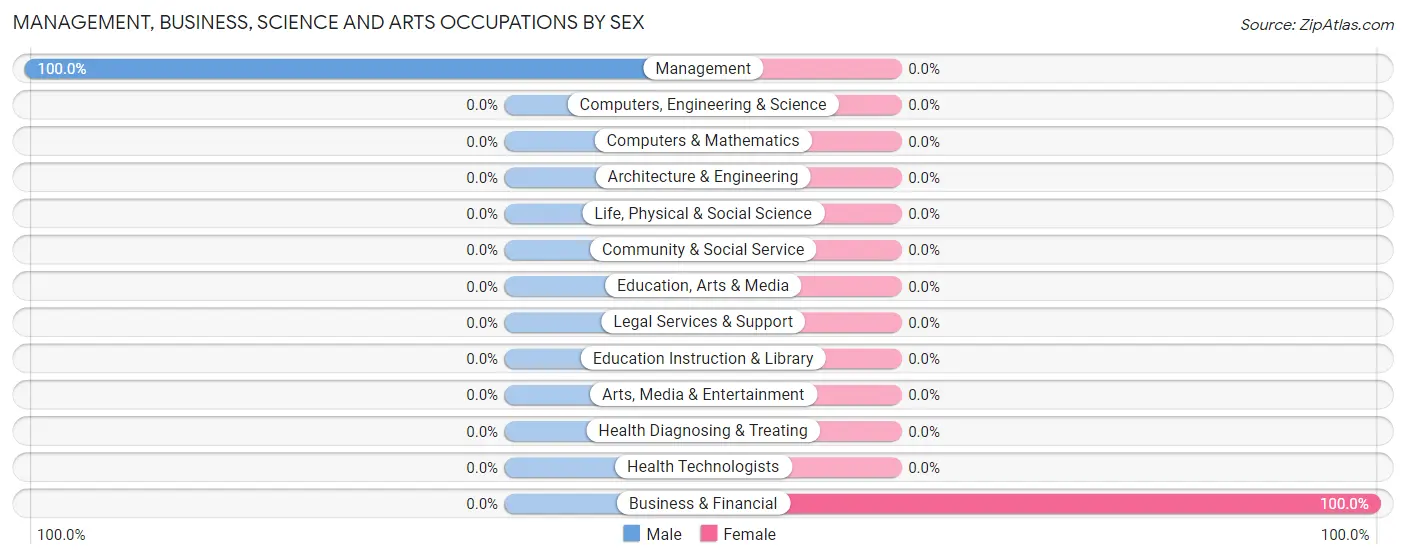
| Occupation | Male | Female |
| Management | 7 (100.0%) | 0 (0.0%) |
| Business & Financial | 0 (0.0%) | 9 (100.0%) |
| Computers, Engineering & Science | 0 (0.0%) | 0 (0.0%) |
| Computers & Mathematics | 0 (0.0%) | 0 (0.0%) |
| Architecture & Engineering | 0 (0.0%) | 0 (0.0%) |
| Life, Physical & Social Science | 0 (0.0%) | 0 (0.0%) |
| Community & Social Service | 0 (0.0%) | 0 (0.0%) |
| Education, Arts & Media | 0 (0.0%) | 0 (0.0%) |
| Legal Services & Support | 0 (0.0%) | 0 (0.0%) |
| Education Instruction & Library | 0 (0.0%) | 0 (0.0%) |
| Arts, Media & Entertainment | 0 (0.0%) | 0 (0.0%) |
| Health Diagnosing & Treating | 0 (0.0%) | 0 (0.0%) |
| Health Technologists | 0 (0.0%) | 0 (0.0%) |
| Total (Category) | 7 (43.8%) | 9 (56.2%) |
| Total (Overall) | 30 (44.8%) | 37 (55.2%) |
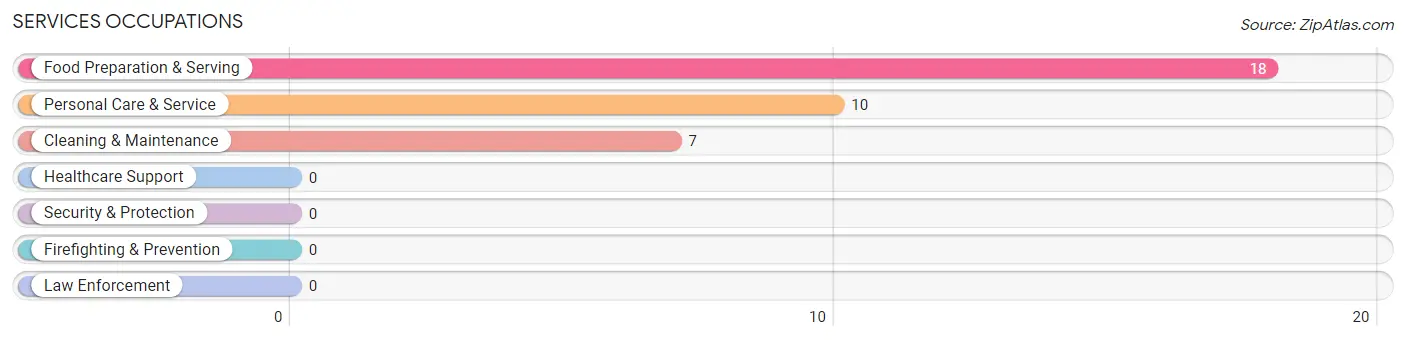
Services Occupations
The most common Services occupations in Pisinemo are Food Preparation & Serving (18 | 26.9%), Personal Care & Service (10 | 14.9%), and Cleaning & Maintenance (7 | 10.4%).
Services Occupations by Sex
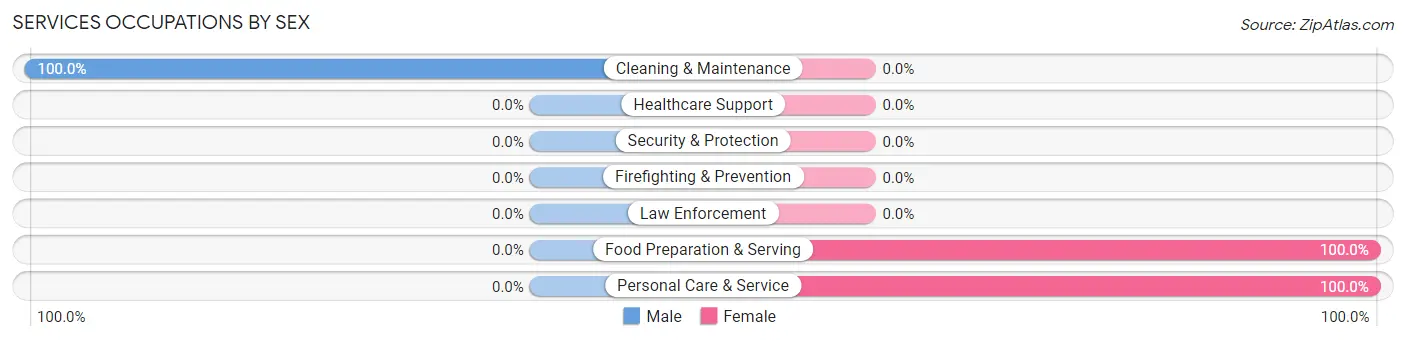
| Occupation | Male | Female |
| Healthcare Support | 0 (0.0%) | 0 (0.0%) |
| Security & Protection | 0 (0.0%) | 0 (0.0%) |
| Firefighting & Prevention | 0 (0.0%) | 0 (0.0%) |
| Law Enforcement | 0 (0.0%) | 0 (0.0%) |
| Food Preparation & Serving | 0 (0.0%) | 18 (100.0%) |
| Cleaning & Maintenance | 7 (100.0%) | 0 (0.0%) |
| Personal Care & Service | 0 (0.0%) | 10 (100.0%) |
| Total (Category) | 7 (20.0%) | 28 (80.0%) |
| Total (Overall) | 30 (44.8%) | 37 (55.2%) |
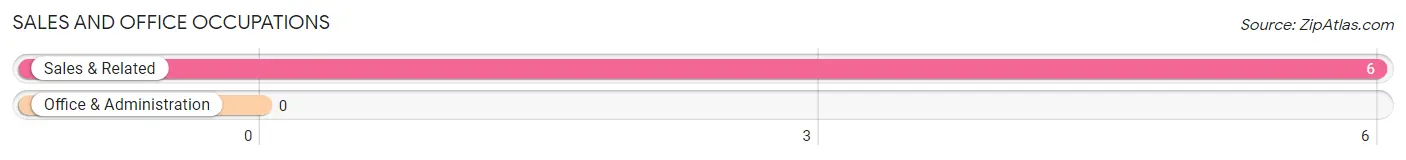
Sales and Office Occupations
The most common Sales and Office occupations in Pisinemo are , and Sales & Related (6 | 9.0%).
Sales and Office Occupations by Sex
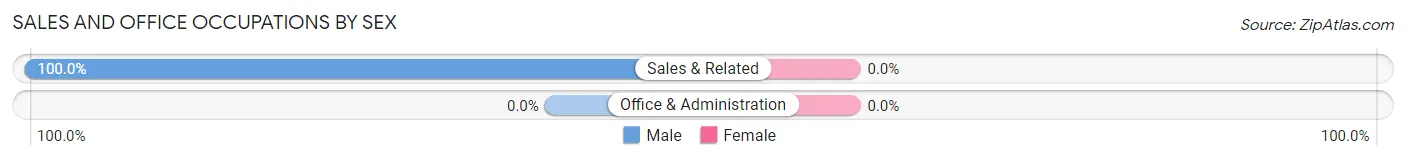
| Occupation | Male | Female |
| Sales & Related | 6 (100.0%) | 0 (0.0%) |
| Office & Administration | 0 (0.0%) | 0 (0.0%) |
| Total (Category) | 6 (100.0%) | 0 (0.0%) |
| Total (Overall) | 30 (44.8%) | 37 (55.2%) |
Natural Resources, Construction and Maintenance Occupations
The most common Natural Resources, Construction and Maintenance occupations in Pisinemo are , and Construction & Extraction (10 | 14.9%).
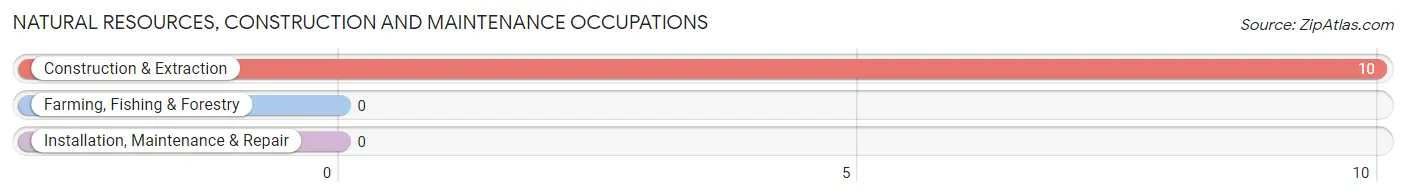
Natural Resources, Construction and Maintenance Occupations by Sex
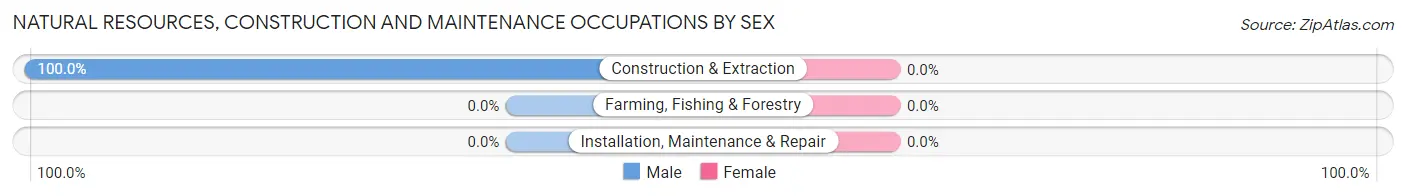
| Occupation | Male | Female |
| Farming, Fishing & Forestry | 0 (0.0%) | 0 (0.0%) |
| Construction & Extraction | 10 (100.0%) | 0 (0.0%) |
| Installation, Maintenance & Repair | 0 (0.0%) | 0 (0.0%) |
| Total (Category) | 10 (100.0%) | 0 (0.0%) |
| Total (Overall) | 30 (44.8%) | 37 (55.2%) |
Production, Transportation and Moving Occupations
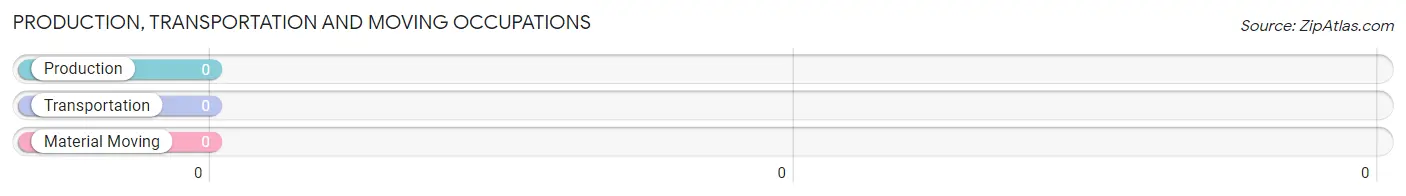
Production, Transportation and Moving Occupations by Sex
| Occupation | Male | Female |
| Production | 0 (0.0%) | 0 (0.0%) |
| Transportation | 0 (0.0%) | 0 (0.0%) |
| Material Moving | 0 (0.0%) | 0 (0.0%) |
| Total (Category) | 0 (0.0%) | 0 (0.0%) |
| Total (Overall) | 30 (44.8%) | 37 (55.2%) |
Employment Industries by Sex in Pisinemo
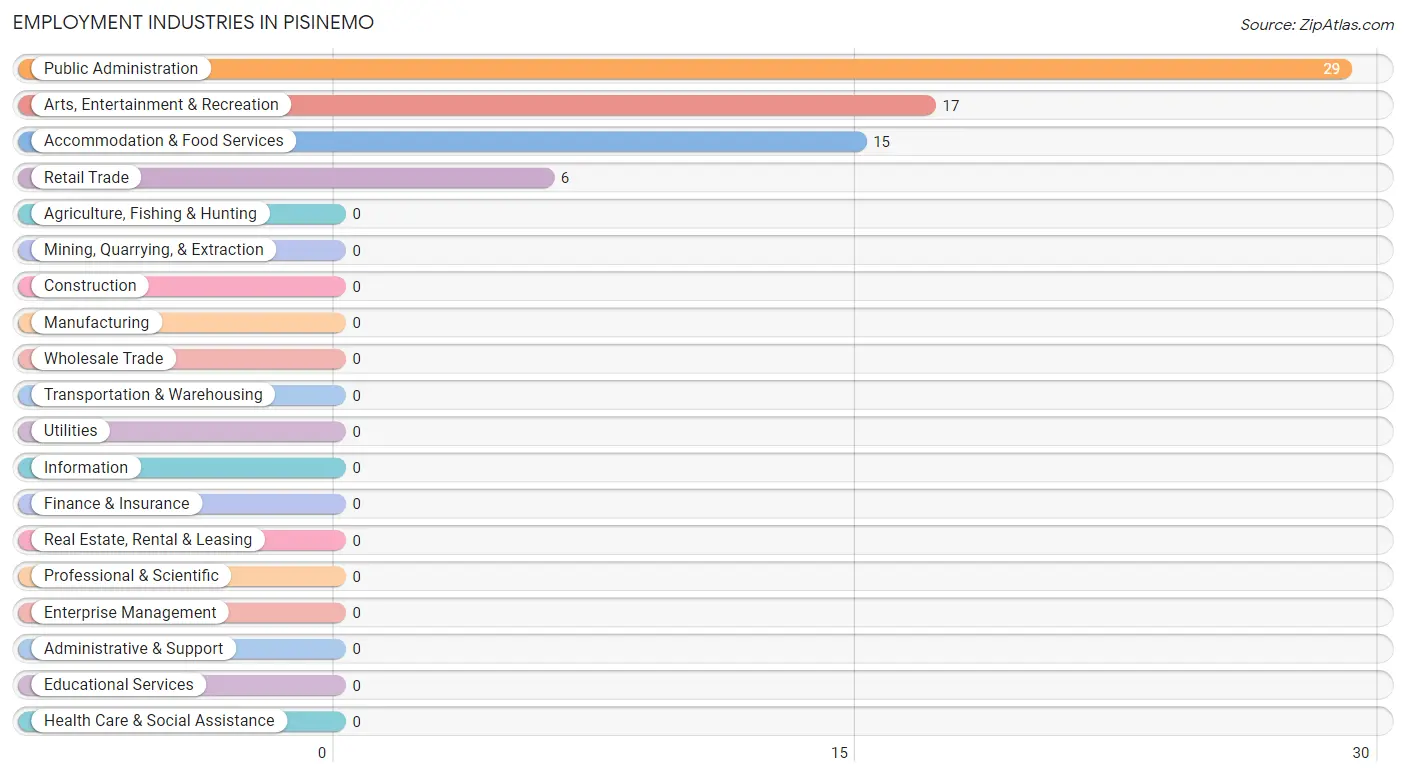
Employment Industries in Pisinemo
The major employment industries in Pisinemo include Public Administration (29 | 43.3%), Arts, Entertainment & Recreation (17 | 25.4%), Accommodation & Food Services (15 | 22.4%), and Retail Trade (6 | 9.0%).
Employment Industries by Sex in Pisinemo
The Pisinemo industries that see more men than women are Retail Trade (100.0%), Accommodation & Food Services (46.7%), and Arts, Entertainment & Recreation (41.2%), whereas the industries that tend to have a higher number of women are Public Administration (65.5%), Arts, Entertainment & Recreation (58.8%), and Accommodation & Food Services (53.3%).
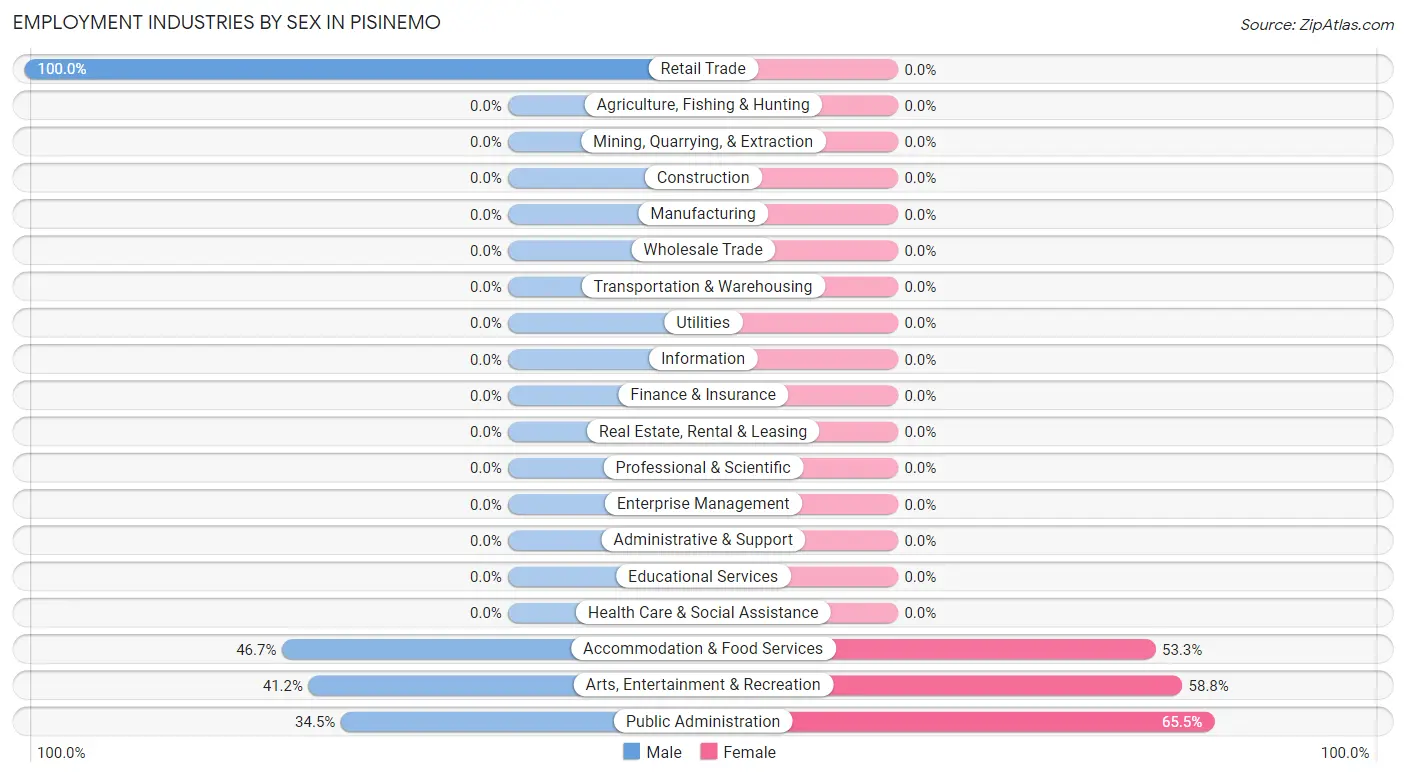
| Industry | Male | Female |
| Agriculture, Fishing & Hunting | 0 (0.0%) | 0 (0.0%) |
| Mining, Quarrying, & Extraction | 0 (0.0%) | 0 (0.0%) |
| Construction | 0 (0.0%) | 0 (0.0%) |
| Manufacturing | 0 (0.0%) | 0 (0.0%) |
| Wholesale Trade | 0 (0.0%) | 0 (0.0%) |
| Retail Trade | 6 (100.0%) | 0 (0.0%) |
| Transportation & Warehousing | 0 (0.0%) | 0 (0.0%) |
| Utilities | 0 (0.0%) | 0 (0.0%) |
| Information | 0 (0.0%) | 0 (0.0%) |
| Finance & Insurance | 0 (0.0%) | 0 (0.0%) |
| Real Estate, Rental & Leasing | 0 (0.0%) | 0 (0.0%) |
| Professional & Scientific | 0 (0.0%) | 0 (0.0%) |
| Enterprise Management | 0 (0.0%) | 0 (0.0%) |
| Administrative & Support | 0 (0.0%) | 0 (0.0%) |
| Educational Services | 0 (0.0%) | 0 (0.0%) |
| Health Care & Social Assistance | 0 (0.0%) | 0 (0.0%) |
| Arts, Entertainment & Recreation | 7 (41.2%) | 10 (58.8%) |
| Accommodation & Food Services | 7 (46.7%) | 8 (53.3%) |
| Public Administration | 10 (34.5%) | 19 (65.5%) |
| Total | 30 (44.8%) | 37 (55.2%) |
Education in Pisinemo
School Enrollment in Pisinemo
The most common levels of schooling among the 144 students in Pisinemo are elementary school (48 | 33.3%), high school (39 | 27.1%), and middle school (20 | 13.9%).
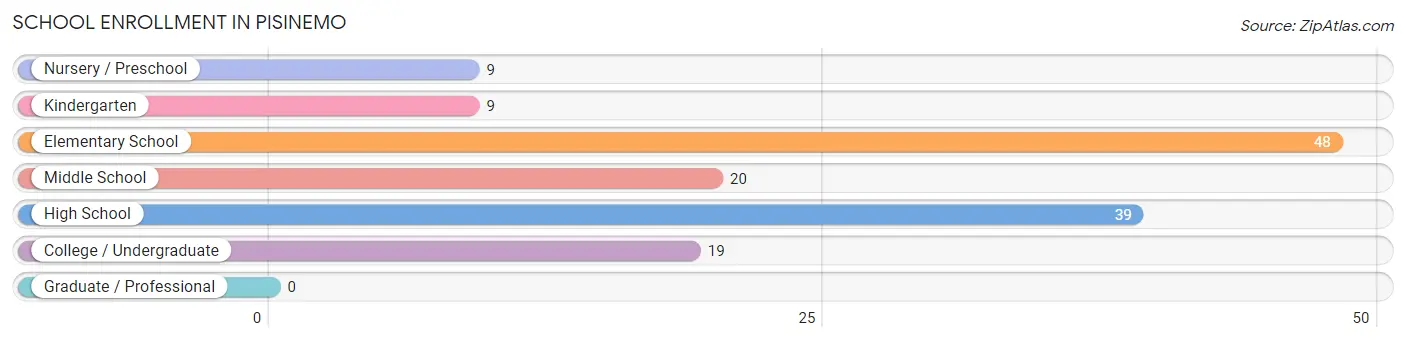
| School Level | # Students | % Students |
| Nursery / Preschool | 9 | 6.2% |
| Kindergarten | 9 | 6.2% |
| Elementary School | 48 | 33.3% |
| Middle School | 20 | 13.9% |
| High School | 39 | 27.1% |
| College / Undergraduate | 19 | 13.2% |
| Graduate / Professional | 0 | 0.0% |
| Total | 144 | 100.0% |
School Enrollment by Age by Funding Source in Pisinemo
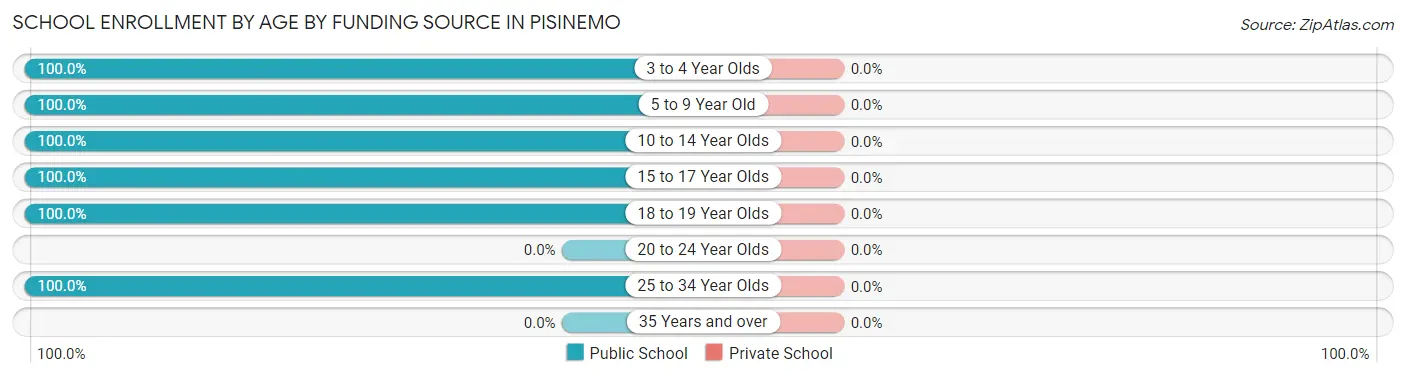
| Age Bracket | Public School | Private School |
| 3 to 4 Year Olds | 9 (100.0%) | 0 (0.0%) |
| 5 to 9 Year Old | 68 (100.0%) | 0 (0.0%) |
| 10 to 14 Year Olds | 25 (100.0%) | 0 (0.0%) |
| 15 to 17 Year Olds | 23 (100.0%) | 0 (0.0%) |
| 18 to 19 Year Olds | 10 (100.0%) | 0 (0.0%) |
| 20 to 24 Year Olds | 0 (0.0%) | 0 (0.0%) |
| 25 to 34 Year Olds | 9 (100.0%) | 0 (0.0%) |
| 35 Years and over | 0 (0.0%) | 0 (0.0%) |
| Total | 144 (100.0%) | 0 (0.0%) |
Educational Attainment by Field of Study in Pisinemo
| Field of Study | # Graduates | % Graduates |
| Computers & Mathematics | 0 | 0.0% |
| Bio, Nature & Agricultural | 0 | 0.0% |
| Physical & Health Sciences | 0 | 0.0% |
| Psychology | 0 | 0.0% |
| Social Sciences | 0 | 0.0% |
| Engineering | 0 | 0.0% |
| Multidisciplinary Studies | 0 | 0.0% |
| Science & Technology | 0 | 0.0% |
| Business | 0 | 0.0% |
| Education | 0 | 0.0% |
| Literature & Languages | 0 | 0.0% |
| Liberal Arts & History | 0 | 0.0% |
| Visual & Performing Arts | 0 | 0.0% |
| Communications | 0 | 0.0% |
| Arts & Humanities | 0 | 0.0% |
| Total | 0 | 0.0% |
Transportation & Commute in Pisinemo
Vehicle Availability by Sex in Pisinemo
The most prevalent vehicle ownership categories in Pisinemo are males with 2 vehicles (13, accounting for 43.3%) and females with 2 vehicles (0, making up 35.1%).
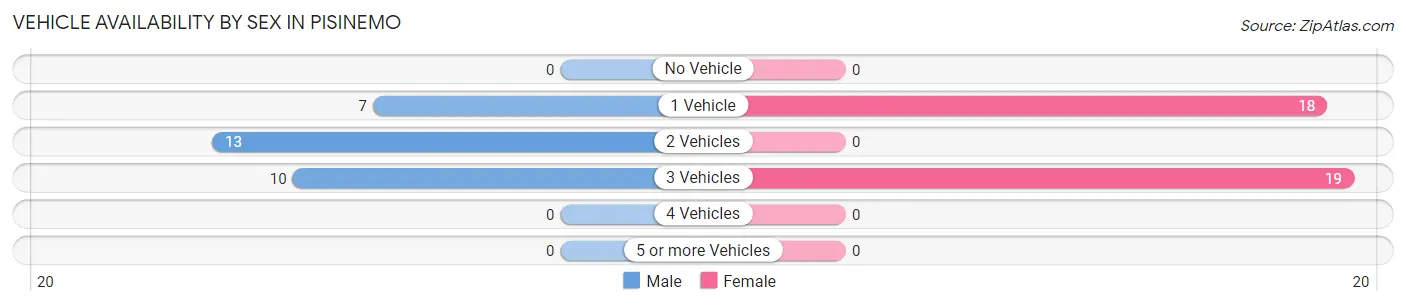
| Vehicles Available | Male | Female |
| No Vehicle | 0 (0.0%) | 0 (0.0%) |
| 1 Vehicle | 7 (23.3%) | 18 (48.6%) |
| 2 Vehicles | 13 (43.3%) | 0 (0.0%) |
| 3 Vehicles | 10 (33.3%) | 19 (51.3%) |
| 4 Vehicles | 0 (0.0%) | 0 (0.0%) |
| 5 or more Vehicles | 0 (0.0%) | 0 (0.0%) |
| Total | 30 (100.0%) | 37 (100.0%) |
Commute Time in Pisinemo
The most frequently occuring commute durations in Pisinemo are 5 to 9 minutes (30 commuters, 44.8%), 30 to 34 minutes (15 commuters, 22.4%), and less than 5 minutes (9 commuters, 13.4%).
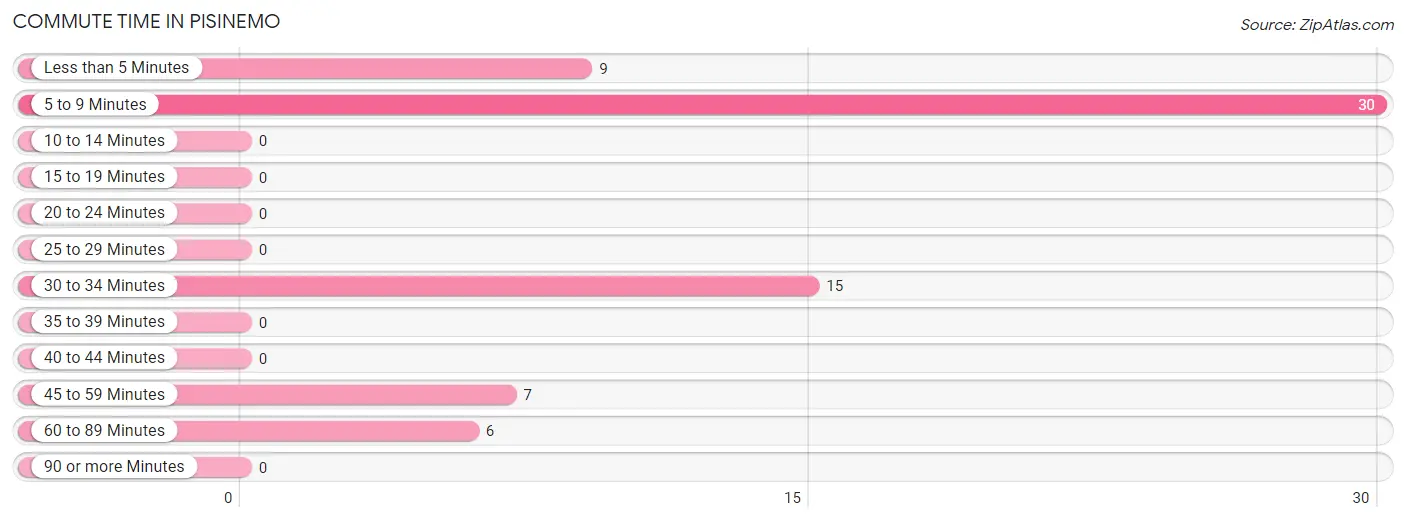
| Commute Time | # Commuters | % Commuters |
| Less than 5 Minutes | 9 | 13.4% |
| 5 to 9 Minutes | 30 | 44.8% |
| 10 to 14 Minutes | 0 | 0.0% |
| 15 to 19 Minutes | 0 | 0.0% |
| 20 to 24 Minutes | 0 | 0.0% |
| 25 to 29 Minutes | 0 | 0.0% |
| 30 to 34 Minutes | 15 | 22.4% |
| 35 to 39 Minutes | 0 | 0.0% |
| 40 to 44 Minutes | 0 | 0.0% |
| 45 to 59 Minutes | 7 | 10.4% |
| 60 to 89 Minutes | 6 | 9.0% |
| 90 or more Minutes | 0 | 0.0% |
Commute Time by Sex in Pisinemo
The most common commute times in Pisinemo are 5 to 9 minutes (10 commuters, 33.3%) for males and 5 to 9 minutes (20 commuters, 54.0%) for females.
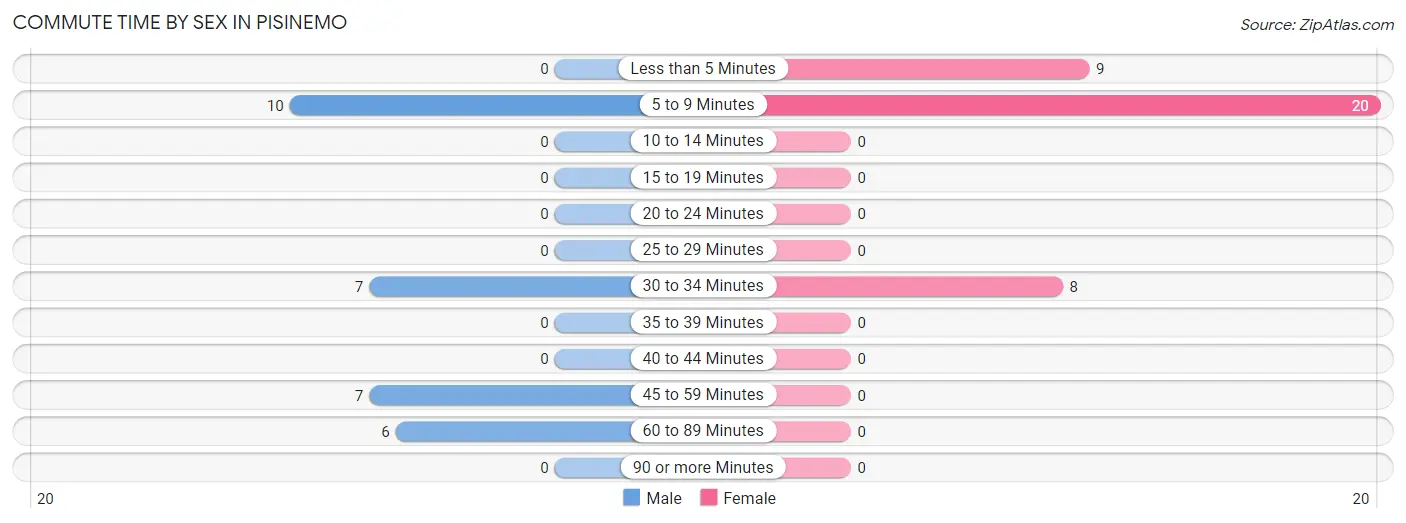
| Commute Time | Male | Female |
| Less than 5 Minutes | 0 (0.0%) | 9 (24.3%) |
| 5 to 9 Minutes | 10 (33.3%) | 20 (54.0%) |
| 10 to 14 Minutes | 0 (0.0%) | 0 (0.0%) |
| 15 to 19 Minutes | 0 (0.0%) | 0 (0.0%) |
| 20 to 24 Minutes | 0 (0.0%) | 0 (0.0%) |
| 25 to 29 Minutes | 0 (0.0%) | 0 (0.0%) |
| 30 to 34 Minutes | 7 (23.3%) | 8 (21.6%) |
| 35 to 39 Minutes | 0 (0.0%) | 0 (0.0%) |
| 40 to 44 Minutes | 0 (0.0%) | 0 (0.0%) |
| 45 to 59 Minutes | 7 (23.3%) | 0 (0.0%) |
| 60 to 89 Minutes | 6 (20.0%) | 0 (0.0%) |
| 90 or more Minutes | 0 (0.0%) | 0 (0.0%) |
Time of Departure to Work by Sex in Pisinemo
The most frequent times of departure to work in Pisinemo are 7:00 AM to 7:29 AM (20, 66.7%) for males and 12:00 PM to 3:59 PM (18, 48.6%) for females.
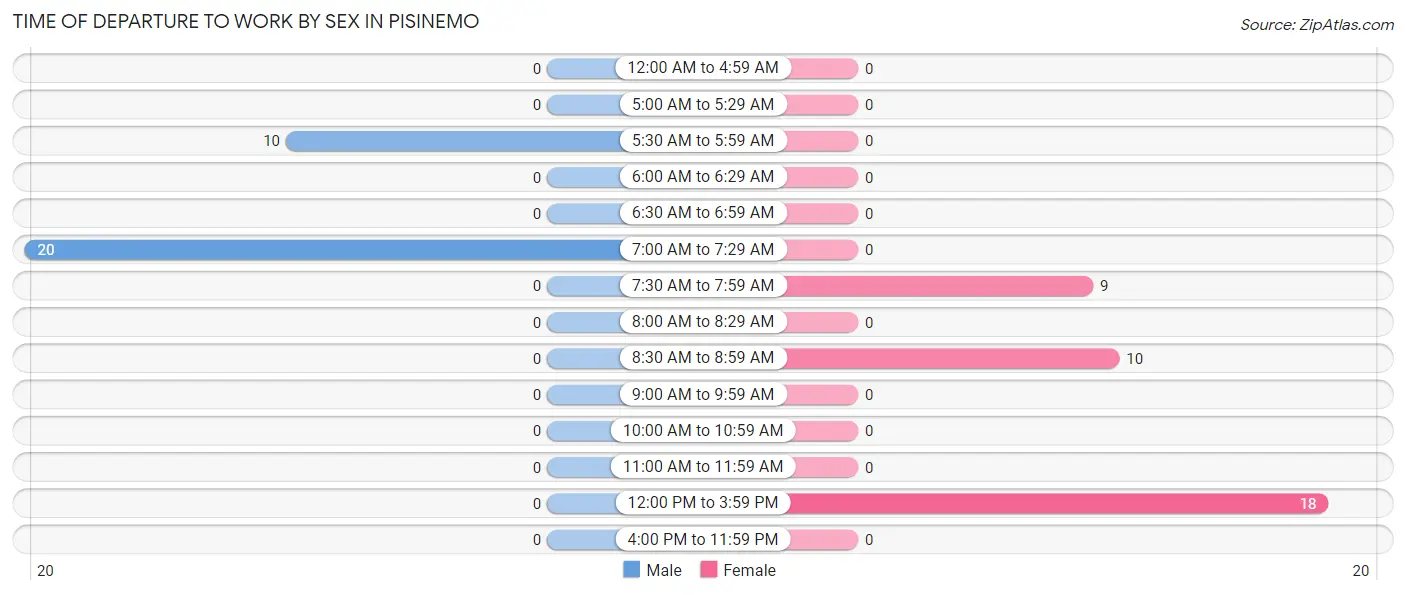
| Time of Departure | Male | Female |
| 12:00 AM to 4:59 AM | 0 (0.0%) | 0 (0.0%) |
| 5:00 AM to 5:29 AM | 0 (0.0%) | 0 (0.0%) |
| 5:30 AM to 5:59 AM | 10 (33.3%) | 0 (0.0%) |
| 6:00 AM to 6:29 AM | 0 (0.0%) | 0 (0.0%) |
| 6:30 AM to 6:59 AM | 0 (0.0%) | 0 (0.0%) |
| 7:00 AM to 7:29 AM | 20 (66.7%) | 0 (0.0%) |
| 7:30 AM to 7:59 AM | 0 (0.0%) | 9 (24.3%) |
| 8:00 AM to 8:29 AM | 0 (0.0%) | 0 (0.0%) |
| 8:30 AM to 8:59 AM | 0 (0.0%) | 10 (27.0%) |
| 9:00 AM to 9:59 AM | 0 (0.0%) | 0 (0.0%) |
| 10:00 AM to 10:59 AM | 0 (0.0%) | 0 (0.0%) |
| 11:00 AM to 11:59 AM | 0 (0.0%) | 0 (0.0%) |
| 12:00 PM to 3:59 PM | 0 (0.0%) | 18 (48.6%) |
| 4:00 PM to 11:59 PM | 0 (0.0%) | 0 (0.0%) |
| Total | 30 (100.0%) | 37 (100.0%) |
Housing Occupancy in Pisinemo
Occupancy by Ownership in Pisinemo
Of the total 102 dwellings in Pisinemo, owner-occupied units account for 65 (63.7%), while renter-occupied units make up 37 (36.3%).
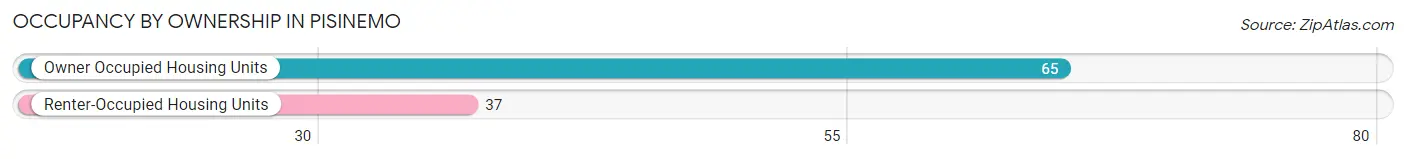
| Occupancy | # Housing Units | % Housing Units |
| Owner Occupied Housing Units | 65 | 63.7% |
| Renter-Occupied Housing Units | 37 | 36.3% |
| Total Occupied Housing Units | 102 | 100.0% |
Occupancy by Household Size in Pisinemo
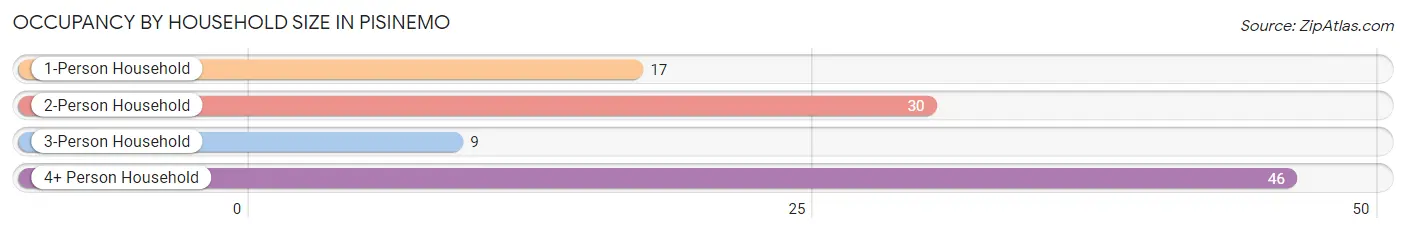
| Household Size | # Housing Units | % Housing Units |
| 1-Person Household | 17 | 16.7% |
| 2-Person Household | 30 | 29.4% |
| 3-Person Household | 9 | 8.8% |
| 4+ Person Household | 46 | 45.1% |
| Total Housing Units | 102 | 100.0% |
Occupancy by Ownership by Household Size in Pisinemo
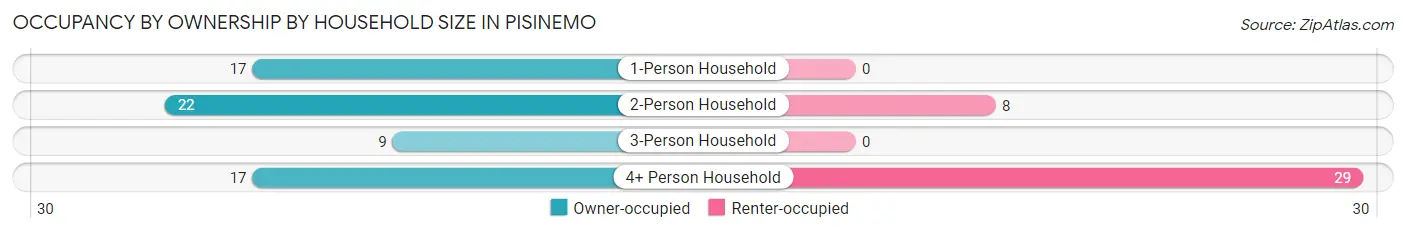
| Household Size | Owner-occupied | Renter-occupied |
| 1-Person Household | 17 (100.0%) | 0 (0.0%) |
| 2-Person Household | 22 (73.3%) | 8 (26.7%) |
| 3-Person Household | 9 (100.0%) | 0 (0.0%) |
| 4+ Person Household | 17 (37.0%) | 29 (63.0%) |
| Total Housing Units | 65 (63.7%) | 37 (36.3%) |
Occupancy by Educational Attainment in Pisinemo
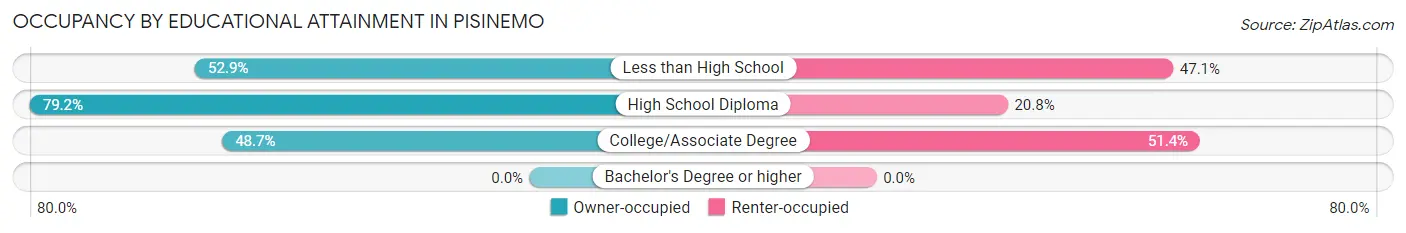
| Household Size | Owner-occupied | Renter-occupied |
| Less than High School | 9 (52.9%) | 8 (47.1%) |
| High School Diploma | 38 (79.2%) | 10 (20.8%) |
| College/Associate Degree | 18 (48.6%) | 19 (51.3%) |
| Bachelor's Degree or higher | 0 (0.0%) | 0 (0.0%) |
Occupancy by Age of Householder in Pisinemo
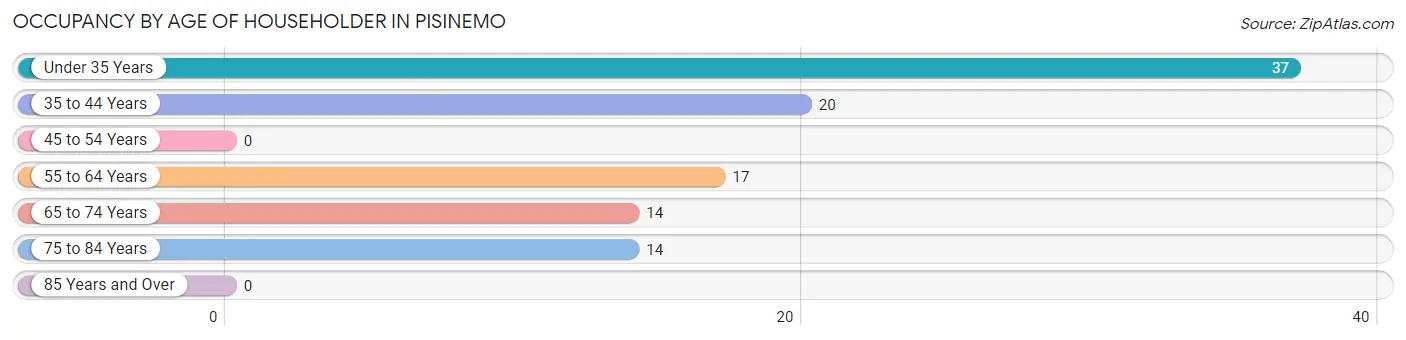
| Age Bracket | # Households | % Households |
| Under 35 Years | 37 | 36.3% |
| 35 to 44 Years | 20 | 19.6% |
| 45 to 54 Years | 0 | 0.0% |
| 55 to 64 Years | 17 | 16.7% |
| 65 to 74 Years | 14 | 13.7% |
| 75 to 84 Years | 14 | 13.7% |
| 85 Years and Over | 0 | 0.0% |
| Total | 102 | 100.0% |
Housing Finances in Pisinemo
Median Income by Occupancy in Pisinemo
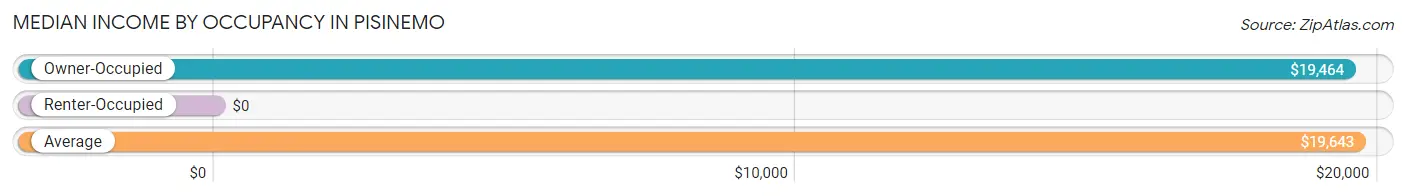
| Occupancy Type | # Households | Median Income |
| Owner-Occupied | 65 (63.7%) | $19,464 |
| Renter-Occupied | 37 (36.3%) | $0 |
| Average | 102 (100.0%) | $19,643 |
Occupancy by Householder Income Bracket in Pisinemo
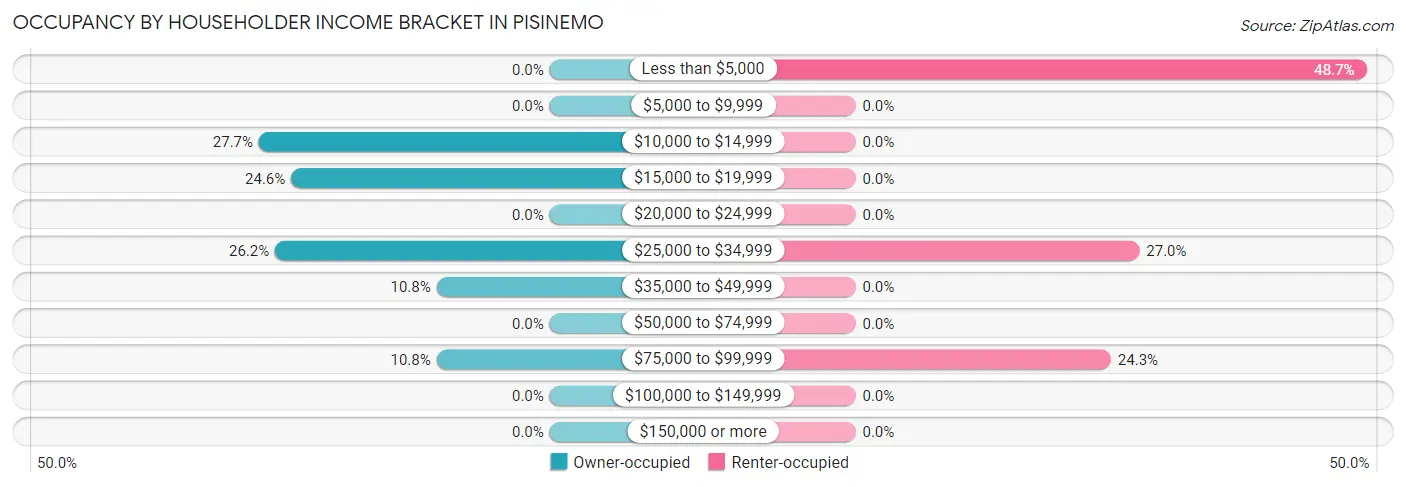
| Income Bracket | Owner-occupied | Renter-occupied |
| Less than $5,000 | 0 (0.0%) | 18 (48.6%) |
| $5,000 to $9,999 | 0 (0.0%) | 0 (0.0%) |
| $10,000 to $14,999 | 18 (27.7%) | 0 (0.0%) |
| $15,000 to $19,999 | 16 (24.6%) | 0 (0.0%) |
| $20,000 to $24,999 | 0 (0.0%) | 0 (0.0%) |
| $25,000 to $34,999 | 17 (26.2%) | 10 (27.0%) |
| $35,000 to $49,999 | 7 (10.8%) | 0 (0.0%) |
| $50,000 to $74,999 | 0 (0.0%) | 0 (0.0%) |
| $75,000 to $99,999 | 7 (10.8%) | 9 (24.3%) |
| $100,000 to $149,999 | 0 (0.0%) | 0 (0.0%) |
| $150,000 or more | 0 (0.0%) | 0 (0.0%) |
| Total | 65 (100.0%) | 37 (100.0%) |
Monthly Housing Cost Tiers in Pisinemo
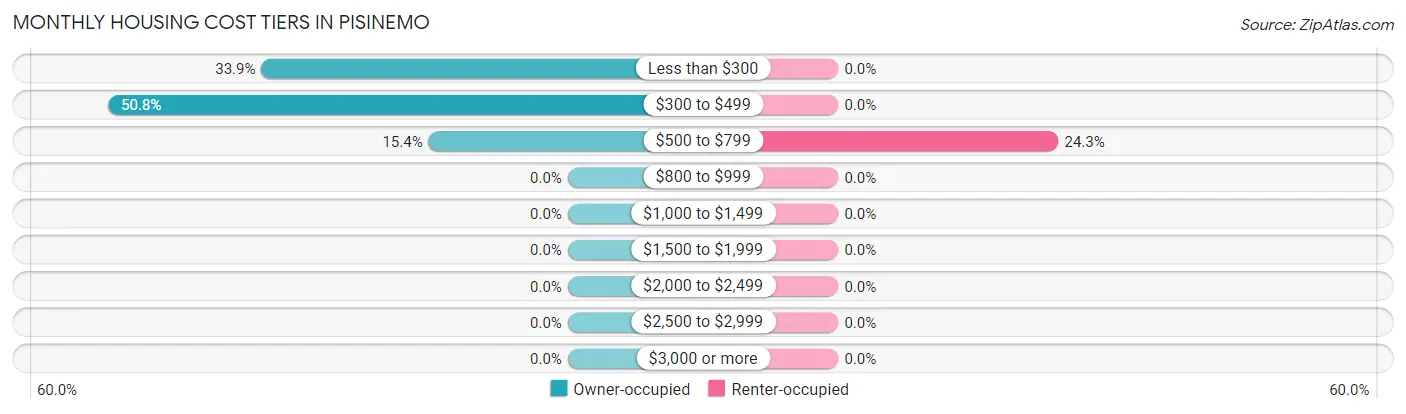
| Monthly Cost | Owner-occupied | Renter-occupied |
| Less than $300 | 22 (33.9%) | 0 (0.0%) |
| $300 to $499 | 33 (50.8%) | 0 (0.0%) |
| $500 to $799 | 10 (15.4%) | 9 (24.3%) |
| $800 to $999 | 0 (0.0%) | 0 (0.0%) |
| $1,000 to $1,499 | 0 (0.0%) | 0 (0.0%) |
| $1,500 to $1,999 | 0 (0.0%) | 0 (0.0%) |
| $2,000 to $2,499 | 0 (0.0%) | 0 (0.0%) |
| $2,500 to $2,999 | 0 (0.0%) | 0 (0.0%) |
| $3,000 or more | 0 (0.0%) | 0 (0.0%) |
| Total | 65 (100.0%) | 37 (100.0%) |
Physical Housing Characteristics in Pisinemo
Housing Structures in Pisinemo
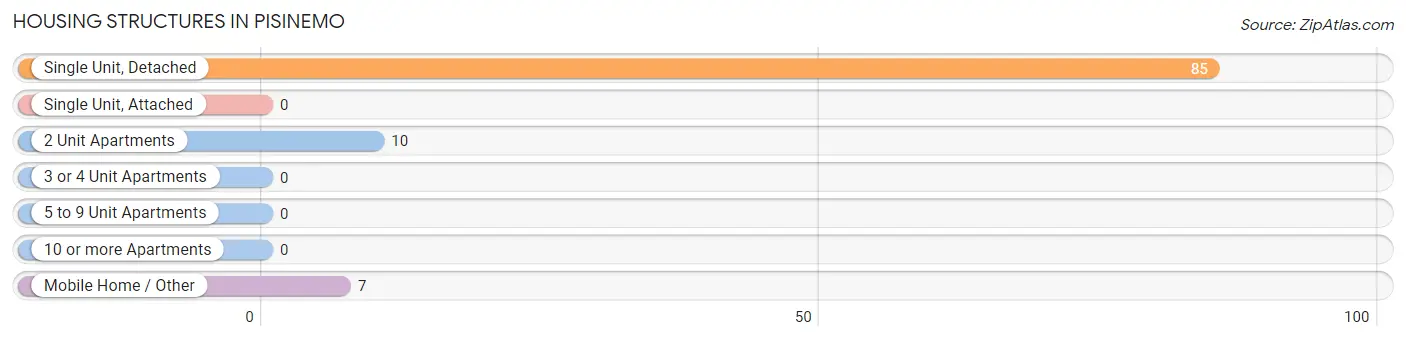
| Structure Type | # Housing Units | % Housing Units |
| Single Unit, Detached | 85 | 83.3% |
| Single Unit, Attached | 0 | 0.0% |
| 2 Unit Apartments | 10 | 9.8% |
| 3 or 4 Unit Apartments | 0 | 0.0% |
| 5 to 9 Unit Apartments | 0 | 0.0% |
| 10 or more Apartments | 0 | 0.0% |
| Mobile Home / Other | 7 | 6.9% |
| Total | 102 | 100.0% |
Housing Structures by Occupancy in Pisinemo
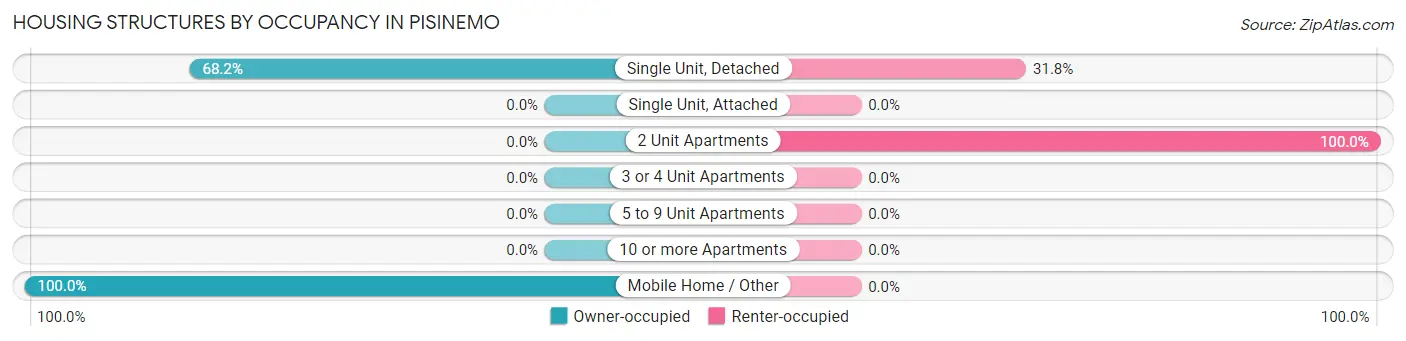
| Structure Type | Owner-occupied | Renter-occupied |
| Single Unit, Detached | 58 (68.2%) | 27 (31.8%) |
| Single Unit, Attached | 0 (0.0%) | 0 (0.0%) |
| 2 Unit Apartments | 0 (0.0%) | 10 (100.0%) |
| 3 or 4 Unit Apartments | 0 (0.0%) | 0 (0.0%) |
| 5 to 9 Unit Apartments | 0 (0.0%) | 0 (0.0%) |
| 10 or more Apartments | 0 (0.0%) | 0 (0.0%) |
| Mobile Home / Other | 7 (100.0%) | 0 (0.0%) |
| Total | 65 (63.7%) | 37 (36.3%) |
Housing Structures by Number of Rooms in Pisinemo
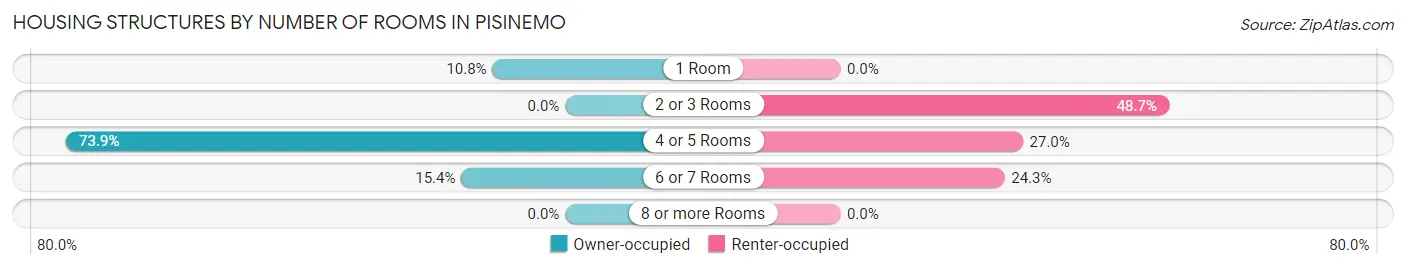
| Number of Rooms | Owner-occupied | Renter-occupied |
| 1 Room | 7 (10.8%) | 0 (0.0%) |
| 2 or 3 Rooms | 0 (0.0%) | 18 (48.6%) |
| 4 or 5 Rooms | 48 (73.9%) | 10 (27.0%) |
| 6 or 7 Rooms | 10 (15.4%) | 9 (24.3%) |
| 8 or more Rooms | 0 (0.0%) | 0 (0.0%) |
| Total | 65 (100.0%) | 37 (100.0%) |
Housing Structure by Heating Type in Pisinemo
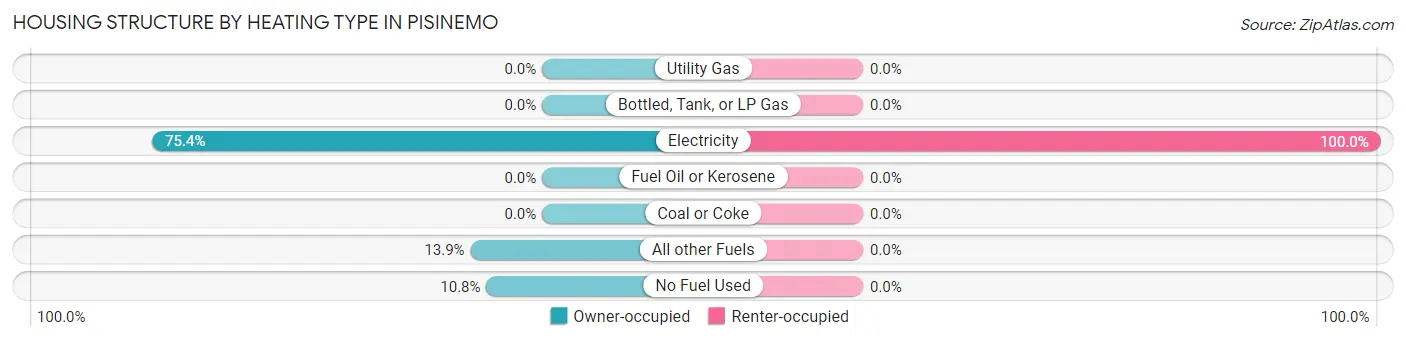
| Heating Type | Owner-occupied | Renter-occupied |
| Utility Gas | 0 (0.0%) | 0 (0.0%) |
| Bottled, Tank, or LP Gas | 0 (0.0%) | 0 (0.0%) |
| Electricity | 49 (75.4%) | 37 (100.0%) |
| Fuel Oil or Kerosene | 0 (0.0%) | 0 (0.0%) |
| Coal or Coke | 0 (0.0%) | 0 (0.0%) |
| All other Fuels | 9 (13.9%) | 0 (0.0%) |
| No Fuel Used | 7 (10.8%) | 0 (0.0%) |
| Total | 65 (100.0%) | 37 (100.0%) |
Household Vehicle Usage in Pisinemo
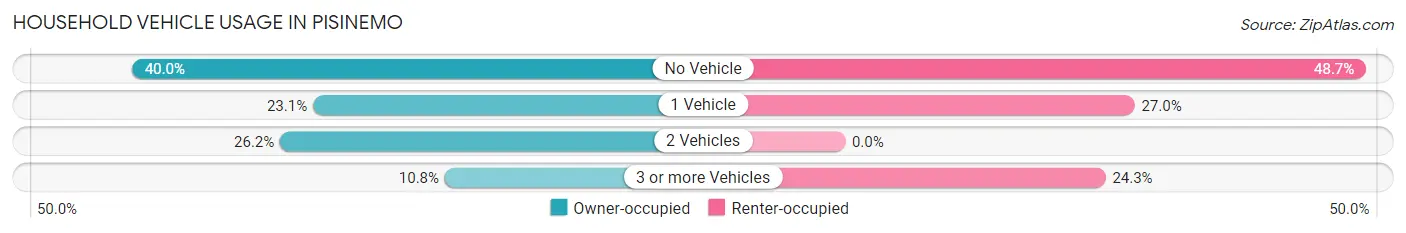
| Vehicles per Household | Owner-occupied | Renter-occupied |
| No Vehicle | 26 (40.0%) | 18 (48.6%) |
| 1 Vehicle | 15 (23.1%) | 10 (27.0%) |
| 2 Vehicles | 17 (26.2%) | 0 (0.0%) |
| 3 or more Vehicles | 7 (10.8%) | 9 (24.3%) |
| Total | 65 (100.0%) | 37 (100.0%) |
Real Estate & Mortgages in Pisinemo
Real Estate and Mortgage Overview in Pisinemo
| Characteristic | Without Mortgage | With Mortgage |
| Housing Units | 65 | 0 |
| Median Property Value | $91,500 | $0 |
| Median Household Income | $19,464 | $0 |
| Monthly Housing Costs | $377 | $0 |
| Real Estate Taxes | - | - |
Property Value by Mortgage Status in Pisinemo
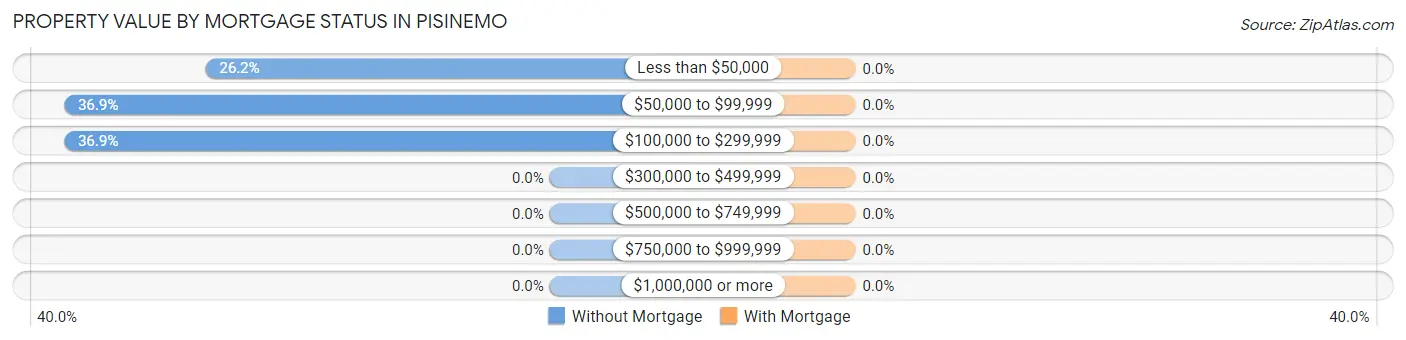
| Property Value | Without Mortgage | With Mortgage |
| Less than $50,000 | 17 (26.2%) | 0 (0.0%) |
| $50,000 to $99,999 | 24 (36.9%) | 0 (0.0%) |
| $100,000 to $299,999 | 24 (36.9%) | 0 (0.0%) |
| $300,000 to $499,999 | 0 (0.0%) | 0 (0.0%) |
| $500,000 to $749,999 | 0 (0.0%) | 0 (0.0%) |
| $750,000 to $999,999 | 0 (0.0%) | 0 (0.0%) |
| $1,000,000 or more | 0 (0.0%) | 0 (0.0%) |
| Total | 65 (100.0%) | 0 (0.0%) |
Household Income by Mortgage Status in Pisinemo
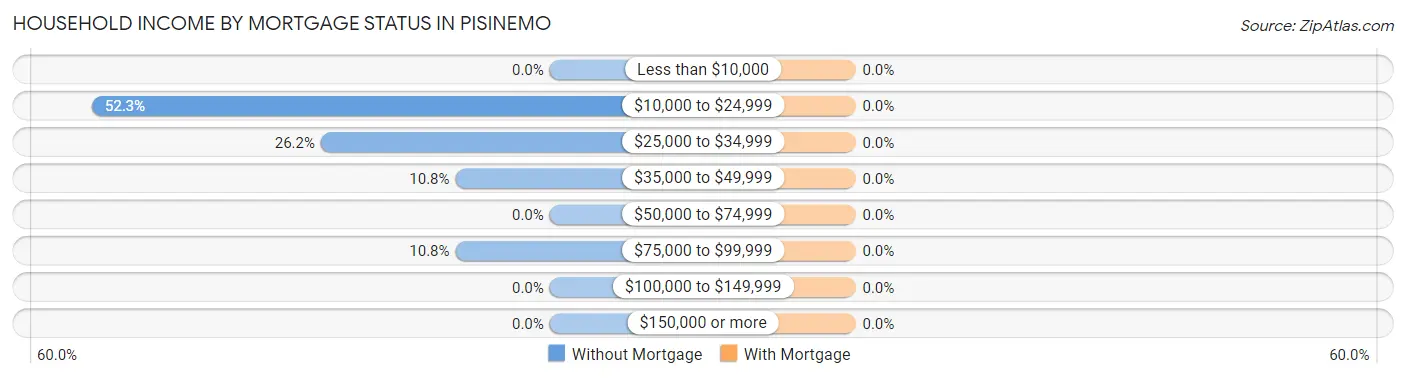
| Household Income | Without Mortgage | With Mortgage |
| Less than $10,000 | 0 (0.0%) | 0 (0.0%) |
| $10,000 to $24,999 | 34 (52.3%) | 0 (0.0%) |
| $25,000 to $34,999 | 17 (26.2%) | 0 (0.0%) |
| $35,000 to $49,999 | 7 (10.8%) | 0 (0.0%) |
| $50,000 to $74,999 | 0 (0.0%) | 0 (0.0%) |
| $75,000 to $99,999 | 7 (10.8%) | 0 (0.0%) |
| $100,000 to $149,999 | 0 (0.0%) | 0 (0.0%) |
| $150,000 or more | 0 (0.0%) | 0 (0.0%) |
| Total | 65 (100.0%) | 0 (0.0%) |
Property Value to Household Income Ratio in Pisinemo
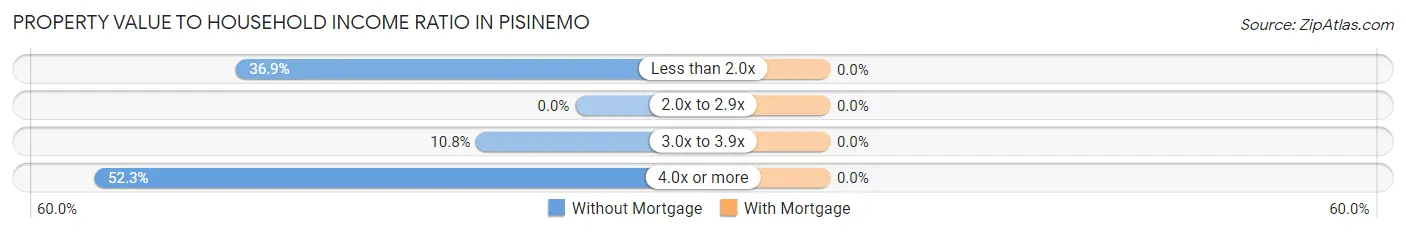
| Value-to-Income Ratio | Without Mortgage | With Mortgage |
| Less than 2.0x | 24 (36.9%) | 0 (0.0%) |
| 2.0x to 2.9x | 0 (0.0%) | 0 (0.0%) |
| 3.0x to 3.9x | 7 (10.8%) | 0 (0.0%) |
| 4.0x or more | 34 (52.3%) | 0 (0.0%) |
| Total | 65 (100.0%) | 0 (0.0%) |
Real Estate Taxes by Mortgage Status in Pisinemo
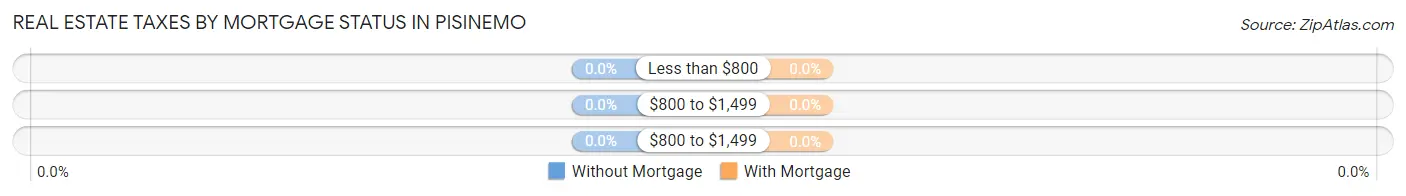
| Property Taxes | Without Mortgage | With Mortgage |
| Less than $800 | 0 (0.0%) | 0 (0.0%) |
| $800 to $1,499 | 0 (0.0%) | 0 (0.0%) |
| $800 to $1,499 | 0 (0.0%) | 0 (0.0%) |
| Total | 65 (100.0%) | 0 (0.0%) |
Health & Disability in Pisinemo
Health Insurance Coverage by Age in Pisinemo
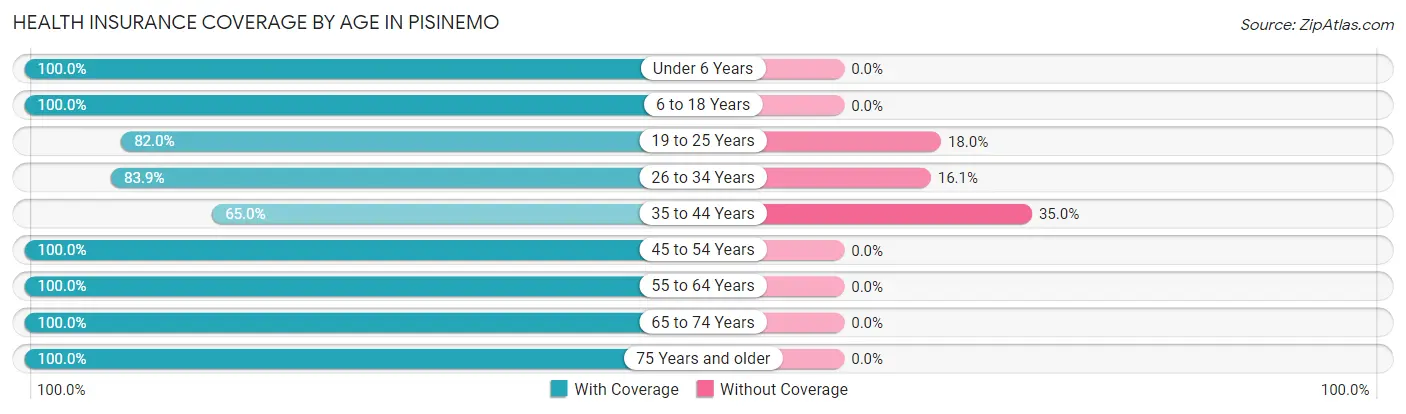
| Age Bracket | With Coverage | Without Coverage |
| Under 6 Years | 9 (100.0%) | 0 (0.0%) |
| 6 to 18 Years | 116 (100.0%) | 0 (0.0%) |
| 19 to 25 Years | 50 (82.0%) | 11 (18.0%) |
| 26 to 34 Years | 52 (83.9%) | 10 (16.1%) |
| 35 to 44 Years | 26 (65.0%) | 14 (35.0%) |
| 45 to 54 Years | 8 (100.0%) | 0 (0.0%) |
| 55 to 64 Years | 17 (100.0%) | 0 (0.0%) |
| 65 to 74 Years | 26 (100.0%) | 0 (0.0%) |
| 75 Years and older | 14 (100.0%) | 0 (0.0%) |
| Total | 318 (90.1%) | 35 (9.9%) |
Health Insurance Coverage by Citizenship Status in Pisinemo
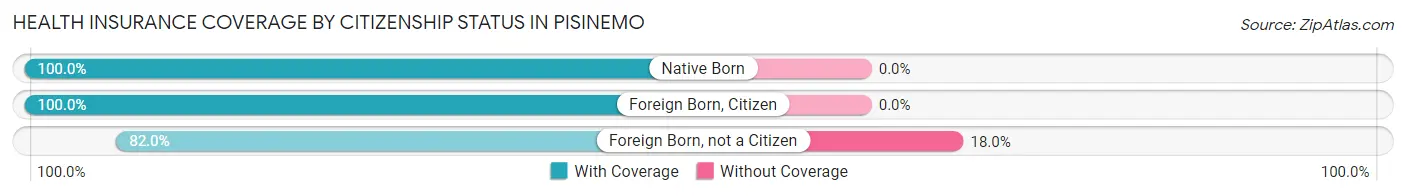
| Citizenship Status | With Coverage | Without Coverage |
| Native Born | 9 (100.0%) | 0 (0.0%) |
| Foreign Born, Citizen | 116 (100.0%) | 0 (0.0%) |
| Foreign Born, not a Citizen | 50 (82.0%) | 11 (18.0%) |
Health Insurance Coverage by Household Income in Pisinemo
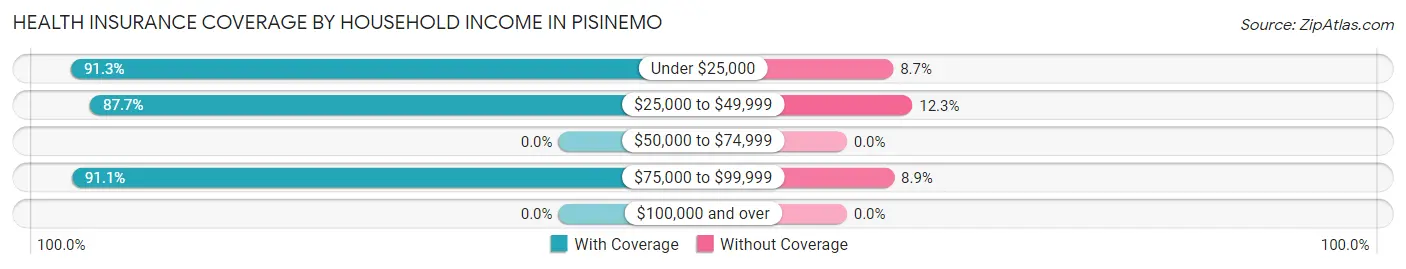
| Household Income | With Coverage | Without Coverage |
| Under $25,000 | 105 (91.3%) | 10 (8.7%) |
| $25,000 to $49,999 | 100 (87.7%) | 14 (12.3%) |
| $50,000 to $74,999 | 0 (0.0%) | 0 (0.0%) |
| $75,000 to $99,999 | 113 (91.1%) | 11 (8.9%) |
| $100,000 and over | 0 (0.0%) | 0 (0.0%) |
Public vs Private Health Insurance Coverage by Age in Pisinemo
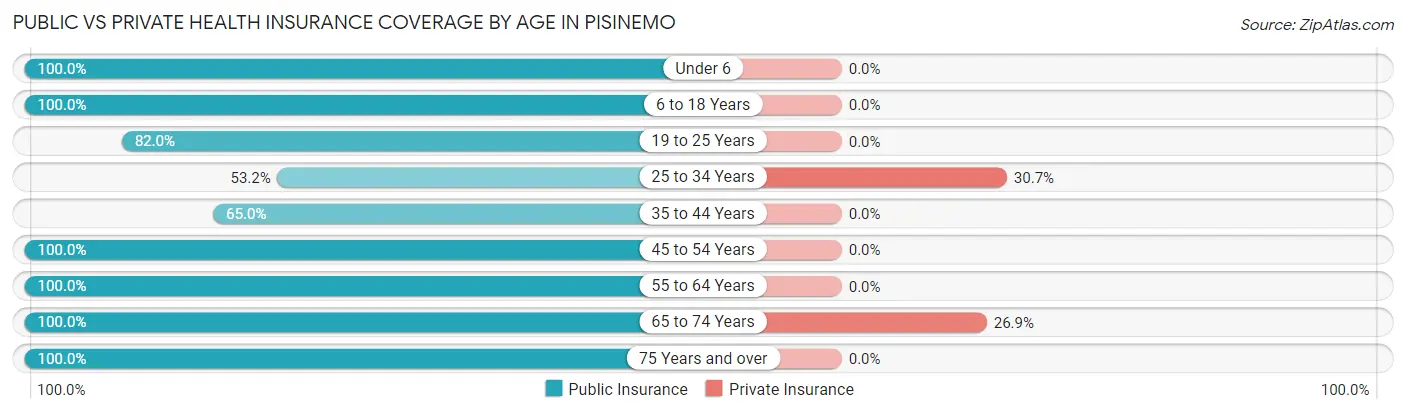
| Age Bracket | Public Insurance | Private Insurance |
| Under 6 | 9 (100.0%) | 0 (0.0%) |
| 6 to 18 Years | 116 (100.0%) | 0 (0.0%) |
| 19 to 25 Years | 50 (82.0%) | 0 (0.0%) |
| 25 to 34 Years | 33 (53.2%) | 19 (30.6%) |
| 35 to 44 Years | 26 (65.0%) | 0 (0.0%) |
| 45 to 54 Years | 8 (100.0%) | 0 (0.0%) |
| 55 to 64 Years | 17 (100.0%) | 0 (0.0%) |
| 65 to 74 Years | 26 (100.0%) | 7 (26.9%) |
| 75 Years and over | 14 (100.0%) | 0 (0.0%) |
| Total | 299 (84.7%) | 26 (7.4%) |
Disability Status by Sex by Age in Pisinemo
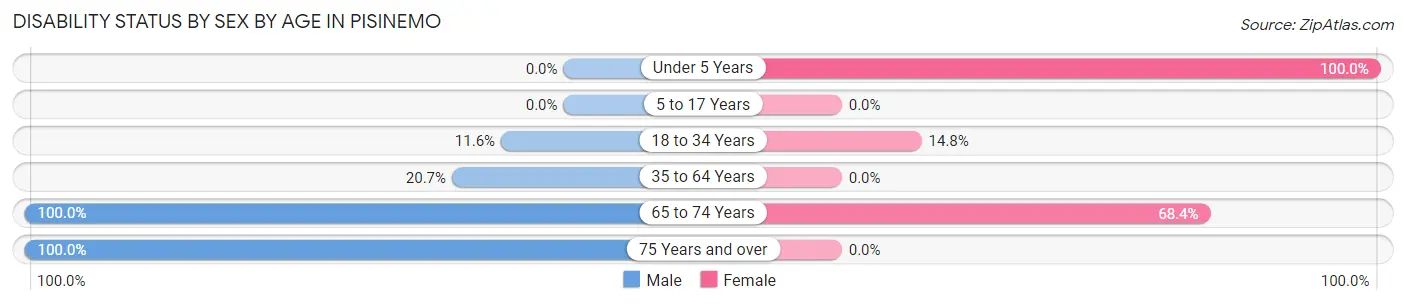
| Age Bracket | Male | Female |
| Under 5 Years | 0 (0.0%) | 9 (100.0%) |
| 5 to 17 Years | 0 (0.0%) | 0 (0.0%) |
| 18 to 34 Years | 8 (11.6%) | 8 (14.8%) |
| 35 to 64 Years | 6 (20.7%) | 0 (0.0%) |
| 65 to 74 Years | 7 (100.0%) | 13 (68.4%) |
| 75 Years and over | 14 (100.0%) | 0 (0.0%) |
Disability Class by Sex by Age in Pisinemo
Disability Class: Hearing Difficulty
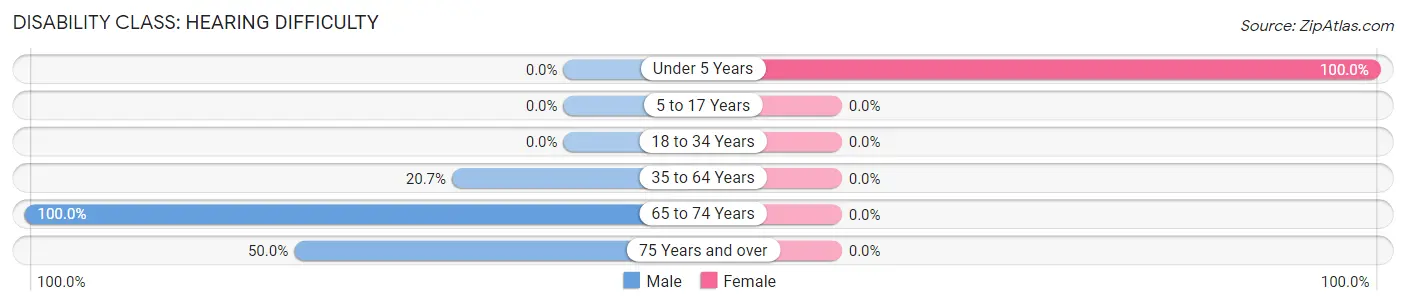
| Age Bracket | Male | Female |
| Under 5 Years | 0 (0.0%) | 9 (100.0%) |
| 5 to 17 Years | 0 (0.0%) | 0 (0.0%) |
| 18 to 34 Years | 0 (0.0%) | 0 (0.0%) |
| 35 to 64 Years | 6 (20.7%) | 0 (0.0%) |
| 65 to 74 Years | 7 (100.0%) | 0 (0.0%) |
| 75 Years and over | 7 (50.0%) | 0 (0.0%) |
Disability Class: Vision Difficulty
| Age Bracket | Male | Female |
| Under 5 Years | 0 (0.0%) | 0 (0.0%) |
| 5 to 17 Years | 0 (0.0%) | 0 (0.0%) |
| 18 to 34 Years | 0 (0.0%) | 0 (0.0%) |
| 35 to 64 Years | 0 (0.0%) | 0 (0.0%) |
| 65 to 74 Years | 0 (0.0%) | 0 (0.0%) |
| 75 Years and over | 0 (0.0%) | 0 (0.0%) |
Disability Class: Cognitive Difficulty
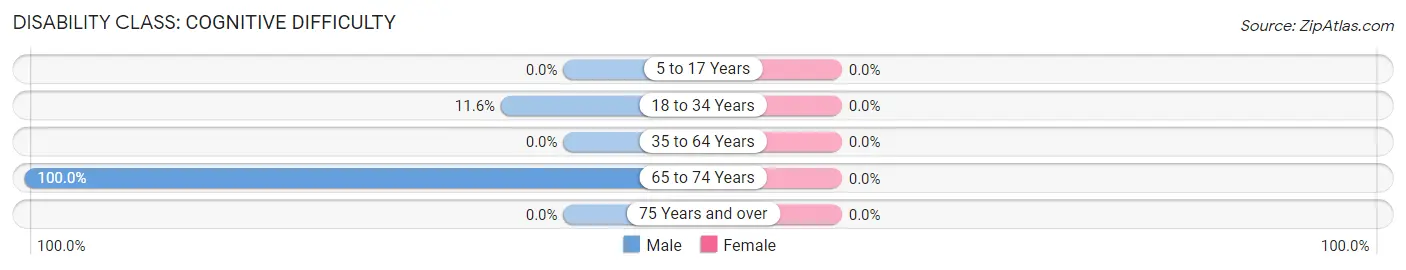
| Age Bracket | Male | Female |
| 5 to 17 Years | 0 (0.0%) | 0 (0.0%) |
| 18 to 34 Years | 8 (11.6%) | 0 (0.0%) |
| 35 to 64 Years | 0 (0.0%) | 0 (0.0%) |
| 65 to 74 Years | 7 (100.0%) | 0 (0.0%) |
| 75 Years and over | 0 (0.0%) | 0 (0.0%) |
Disability Class: Ambulatory Difficulty
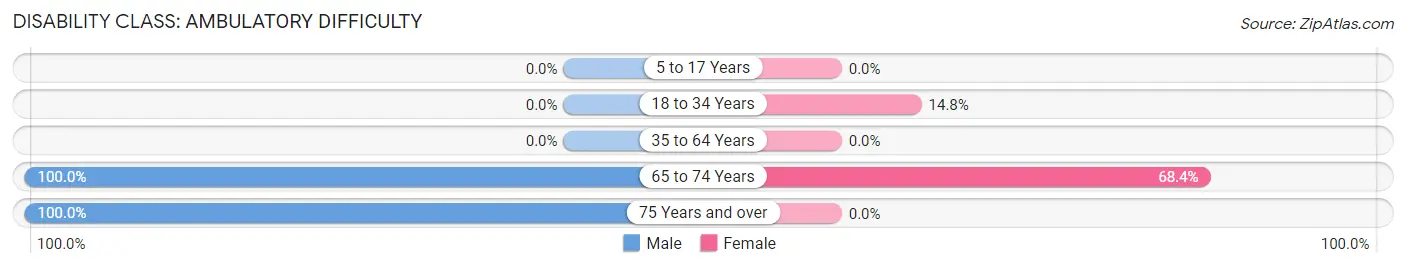
| Age Bracket | Male | Female |
| 5 to 17 Years | 0 (0.0%) | 0 (0.0%) |
| 18 to 34 Years | 0 (0.0%) | 8 (14.8%) |
| 35 to 64 Years | 0 (0.0%) | 0 (0.0%) |
| 65 to 74 Years | 7 (100.0%) | 13 (68.4%) |
| 75 Years and over | 14 (100.0%) | 0 (0.0%) |
Disability Class: Self-Care Difficulty
| Age Bracket | Male | Female |
| 5 to 17 Years | 0 (0.0%) | 0 (0.0%) |
| 18 to 34 Years | 0 (0.0%) | 0 (0.0%) |
| 35 to 64 Years | 0 (0.0%) | 0 (0.0%) |
| 65 to 74 Years | 0 (0.0%) | 0 (0.0%) |
| 75 Years and over | 0 (0.0%) | 0 (0.0%) |
Technology Access in Pisinemo
Computing Device Access in Pisinemo
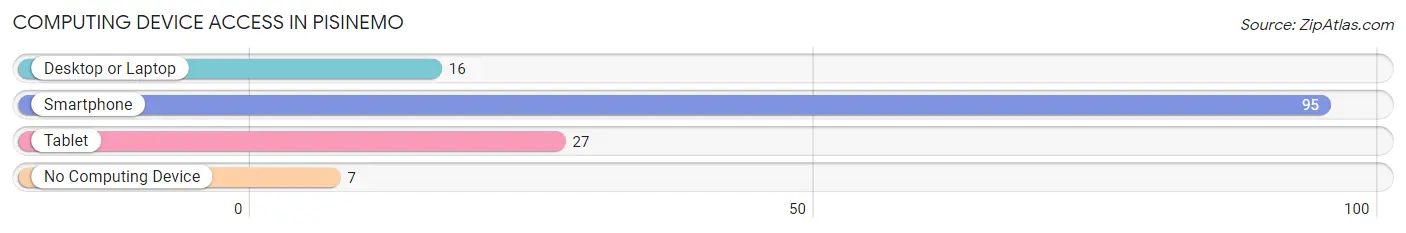
| Device Type | # Households | % Households |
| Desktop or Laptop | 16 | 15.7% |
| Smartphone | 95 | 93.1% |
| Tablet | 27 | 26.5% |
| No Computing Device | 7 | 6.9% |
| Total | 102 | 100.0% |
Internet Access in Pisinemo
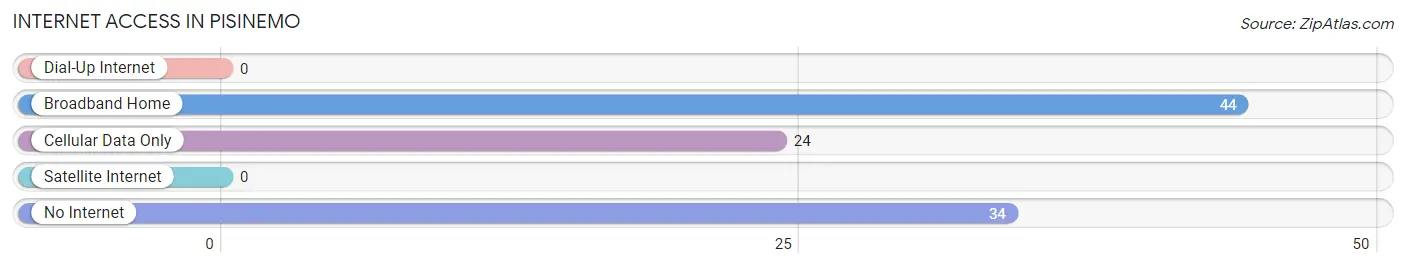
| Internet Type | # Households | % Households |
| Dial-Up Internet | 0 | 0.0% |
| Broadband Home | 44 | 43.1% |
| Cellular Data Only | 24 | 23.5% |
| Satellite Internet | 0 | 0.0% |
| No Internet | 34 | 33.3% |
| Total | 102 | 100.0% |
Pisinemo Summary
Pisinemo is a small unincorporated community located in the Gila River Indian Community in Pinal County, Arizona. It is located about 40 miles south of Phoenix and is home to about 1,000 people. The community is located in the Sonoran Desert and is surrounded by the Gila River Indian Reservation.
Geography
Pisinemo is located in the Gila River Indian Community in Pinal County, Arizona. It is located about 40 miles south of Phoenix and is home to about 1,000 people. The community is located in the Sonoran Desert and is surrounded by the Gila River Indian Reservation. The area is characterized by flat terrain and is surrounded by mountains. The climate is hot and dry with temperatures ranging from the mid-90s in the summer to the mid-50s in the winter.
History
Pisinemo was originally inhabited by the O'odham people, who were the original inhabitants of the area. The O'odham people were a semi-nomadic tribe that lived in the area for centuries before the arrival of Europeans. The first Europeans to settle in the area were Spanish missionaries in the late 1700s. The area was then part of Mexico until the Gadsden Purchase in 1853, when it became part of the United States.
The area was then settled by Anglo-Americans in the late 1800s. The town was originally called "Pisinemo," which is an O'odham word meaning "place of the sun." The town was officially established in 1891 and was incorporated in 1912. The town was a farming community and was home to several small businesses.
Economy
The economy of Pisinemo is largely based on agriculture. The area is known for its production of cotton, alfalfa, and other crops. The town is also home to several small businesses, including a grocery store, a gas station, and a restaurant. The town is also home to a casino, which is a major source of employment and revenue for the community.
Demographics
As of the 2010 census, the population of Pisinemo was 1,000. The racial makeup of the town was 94.2% Native American, 4.2% White, 0.2% African American, 0.2% Asian, and 1.2% from other races. The median household income was $25,000 and the median family income was $30,000. The per capita income was $13,000.
Conclusion
Pisinemo is a small unincorporated community located in the Gila River Indian Community in Pinal County, Arizona. It is located about 40 miles south of Phoenix and is home to about 1,000 people. The community is located in the Sonoran Desert and is surrounded by the Gila River Indian Reservation. The economy of Pisinemo is largely based on agriculture and the town is also home to several small businesses. The population of Pisinemo is mostly Native American and the median household income is $25,000.
Common Questions
What is Per Capita Income in Pisinemo?
Per Capita income in Pisinemo is $7,885.
What is the Median Family Income in Pisinemo?
Median Family Income in Pisinemo is $28,563.
What is the Median Household income in Pisinemo?
Median Household Income in Pisinemo is $19,643.
What is Inequality or Gini Index in Pisinemo?
Inequality or Gini Index in Pisinemo is 0.48.
What is the Total Population of Pisinemo?
Total Population of Pisinemo is 353.
What is the Total Male Population of Pisinemo?
Total Male Population of Pisinemo is 167.
What is the Total Female Population of Pisinemo?
Total Female Population of Pisinemo is 186.
What is the Ratio of Males per 100 Females in Pisinemo?
There are 89.78 Males per 100 Females in Pisinemo.
What is the Ratio of Females per 100 Males in Pisinemo?
There are 111.38 Females per 100 Males in Pisinemo.
What is the Median Population Age in Pisinemo?
Median Population Age in Pisinemo is 22.6 Years.
What is the Average Family Size in Pisinemo
Average Family Size in Pisinemo is 4.4 People.
What is the Average Household Size in Pisinemo
Average Household Size in Pisinemo is 3.5 People.
How Large is the Labor Force in Pisinemo?
There are 104 People in the Labor Forcein in Pisinemo.
What is the Percentage of People in the Labor Force in Pisinemo?
43.3% of People are in the Labor Force in Pisinemo.
What is the Unemployment Rate in Pisinemo?
Unemployment Rate in Pisinemo is 35.6%.