Zip Codes with the Highest Percentage of Population Employed in Food Preparation & Serving in Flagstaff, AZ
RELATED REPORTS & OPTIONS
Food Preparation & Serving
Flagstaff
Compare Zip Codes
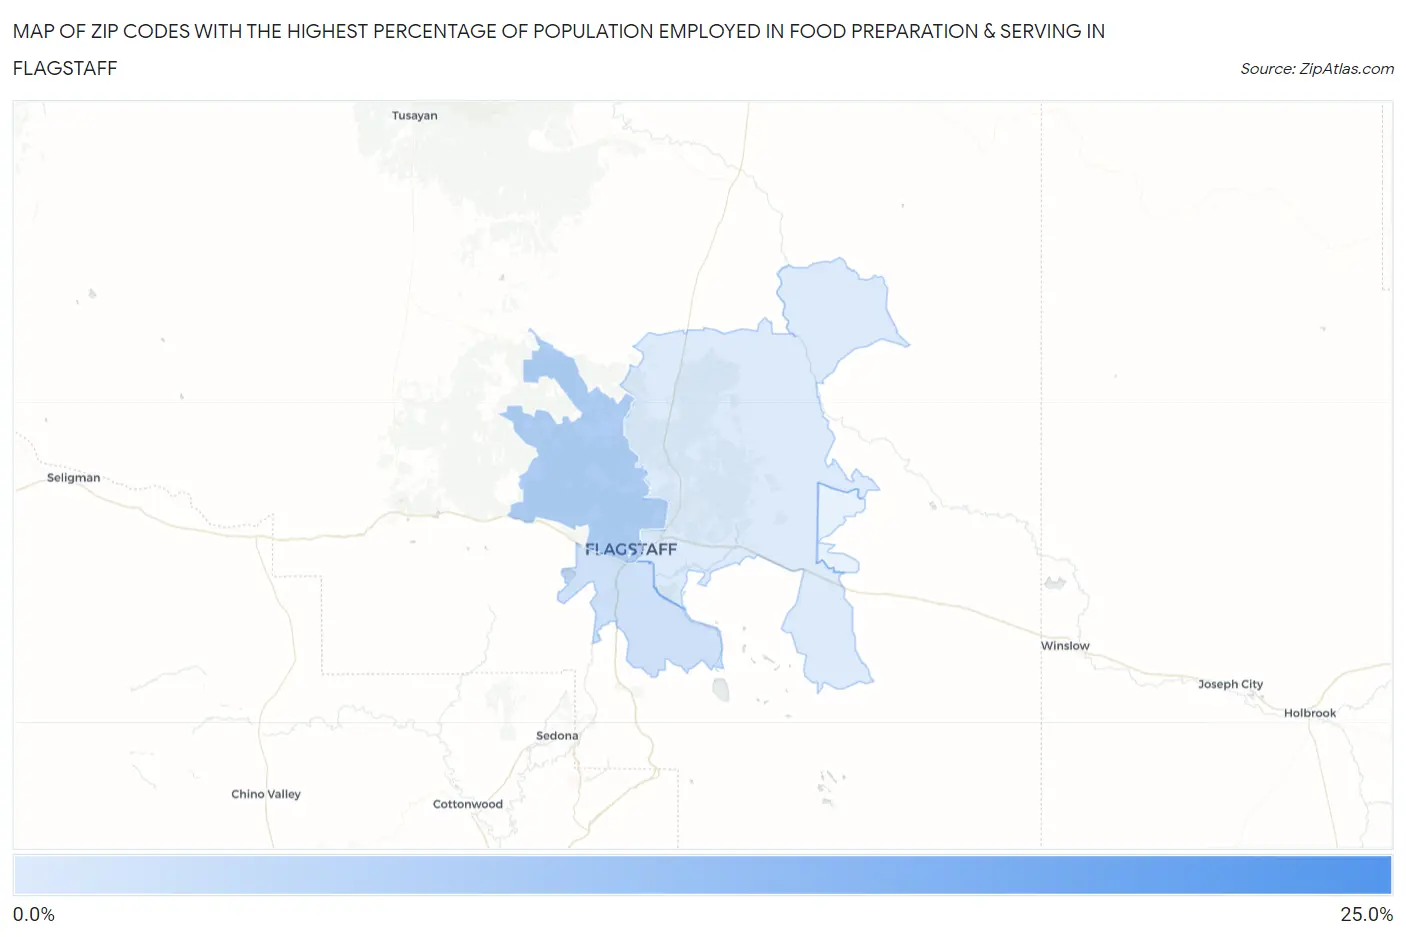
Map of Zip Codes with the Highest Percentage of Population Employed in Food Preparation & Serving in Flagstaff
4.7%
22.9%
Zip Codes with the Highest Percentage of Population Employed in Food Preparation & Serving in Flagstaff, AZ
| Zip Code | % Employed | vs State | vs National | |
| 1. | 86011 | 22.9% | 5.7%(+17.2)#8 | 5.3%(+17.6)#387 |
| 2. | 86001 | 10.0% | 5.7%(+4.34)#48 | 5.3%(+4.73)#2,620 |
| 3. | 86005 | 6.3% | 5.7%(+0.620)#137 | 5.3%(+1.00)#8,471 |
| 4. | 86004 | 4.7% | 5.7%(-0.929)#207 | 5.3%(-0.548)#14,001 |
1
Common Questions
What are the Top 3 Zip Codes with the Highest Percentage of Population Employed in Food Preparation & Serving in Flagstaff, AZ?
Top 3 Zip Codes with the Highest Percentage of Population Employed in Food Preparation & Serving in Flagstaff, AZ are:
What zip code has the Highest Percentage of Population Employed in Food Preparation & Serving in Flagstaff, AZ?
86011 has the Highest Percentage of Population Employed in Food Preparation & Serving in Flagstaff, AZ with 22.9%.
What is the Percentage of Population Employed in Food Preparation & Serving in Flagstaff, AZ?
Percentage of Population Employed in Food Preparation & Serving in Flagstaff is 8.4%.
What is the Percentage of Population Employed in Food Preparation & Serving in Arizona?
Percentage of Population Employed in Food Preparation & Serving in Arizona is 5.7%.
What is the Percentage of Population Employed in Food Preparation & Serving in the United States?
Percentage of Population Employed in Food Preparation & Serving in the United States is 5.3%.