Wet Camp Village, AZ Map & Demographics
Wet Camp Village Map
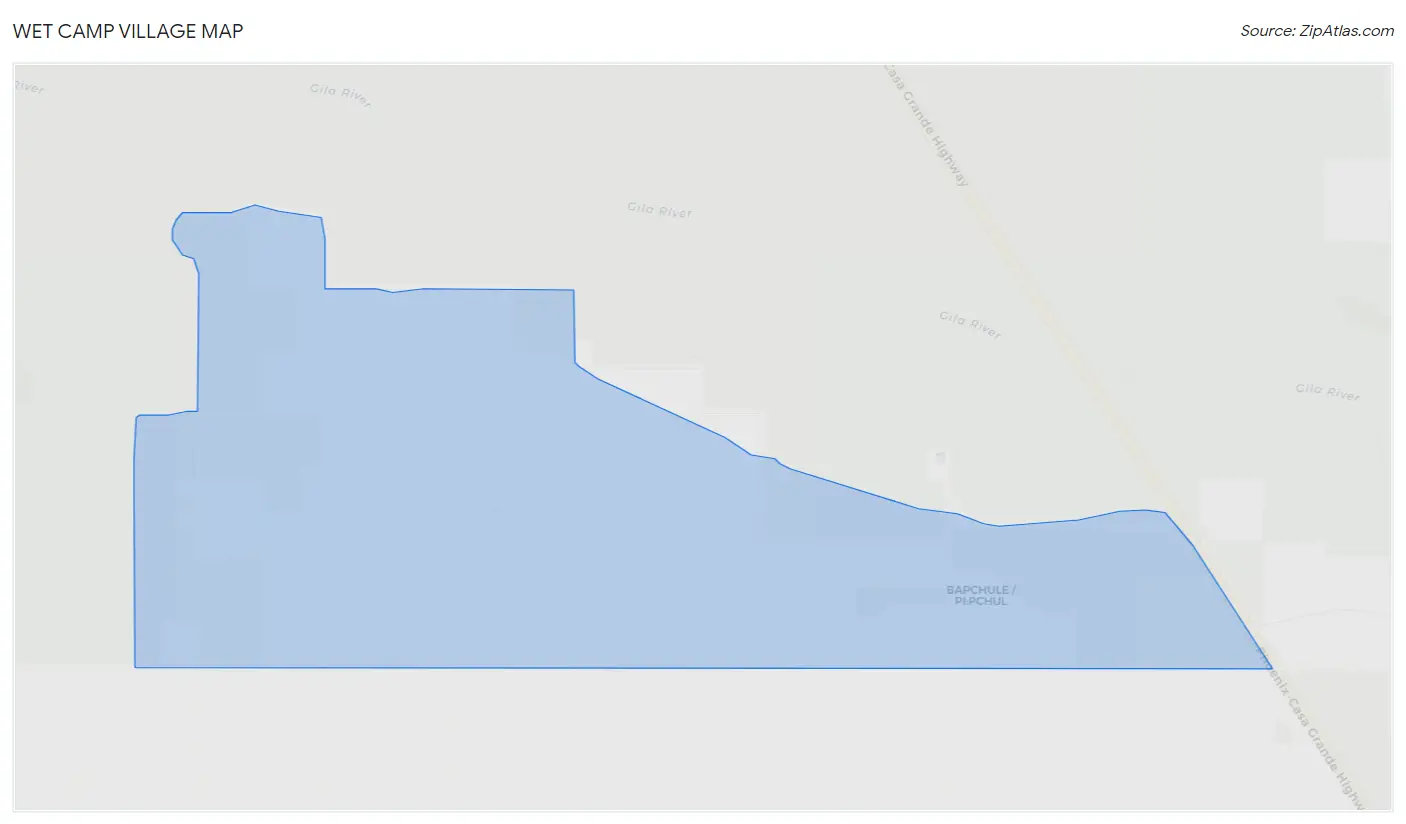
Wet Camp Village Overview
$11,402
PER CAPITA INCOME
0.47
INEQUALITY / GINI INDEX
171
TOTAL POPULATION
120
MALE POPULATION
51
FEMALE POPULATION
235.29
MALES / 100 FEMALES
42.50
FEMALES / 100 MALES
31.4
MEDIAN AGE
3.4
AVG FAMILY SIZE
2.2
AVG HOUSEHOLD SIZE
145
LABOR FORCE [ PEOPLE ]
91.2%
PERCENT IN LABOR FORCE
27.6%
UNEMPLOYMENT RATE
Income in Wet Camp Village
Income Overview in Wet Camp Village
| Characteristic | Number | Measure |
| Per Capita Income | 171 | $11,402 |
| Median Family Income | 32 | $0 |
| Mean Family Income | 32 | $0 |
| Median Household Income | 78 | $0 |
| Mean Household Income | 78 | $20,992 |
| Income Deficit | 32 | $0 |
| Wage / Income Gap (%) | 171 | 0.00% |
| Wage / Income Gap ($) | 171 | 100.00¢ per $1 |
| Gini / Inequality Index | 171 | 0.47 |
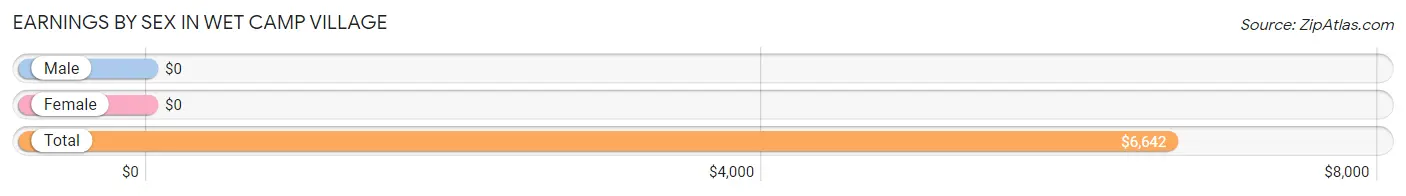
Earnings by Sex in Wet Camp Village
| Sex | Number | Average Earnings |
| Male | 108 (84.4%) | $0 |
| Female | 20 (15.6%) | $0 |
| Total | 128 (100.0%) | $6,642 |
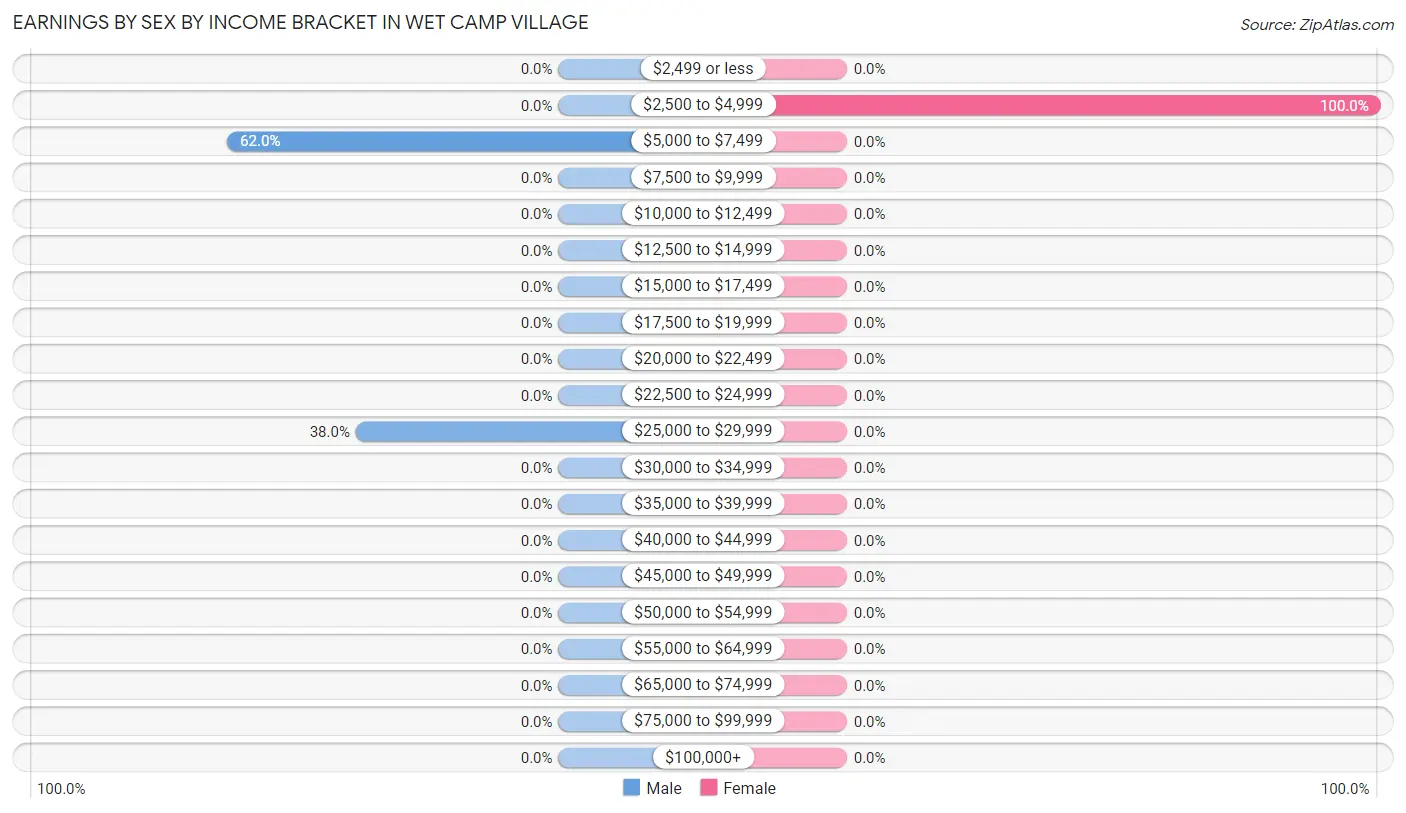
Earnings by Sex by Income Bracket in Wet Camp Village
The most common earnings brackets in Wet Camp Village are $5,000 to $7,499 for men (67 | 62.0%) and $2,500 to $4,999 for women (20 | 100.0%).
| Income | Male | Female |
| $2,499 or less | 0 (0.0%) | 0 (0.0%) |
| $2,500 to $4,999 | 0 (0.0%) | 20 (100.0%) |
| $5,000 to $7,499 | 67 (62.0%) | 0 (0.0%) |
| $7,500 to $9,999 | 0 (0.0%) | 0 (0.0%) |
| $10,000 to $12,499 | 0 (0.0%) | 0 (0.0%) |
| $12,500 to $14,999 | 0 (0.0%) | 0 (0.0%) |
| $15,000 to $17,499 | 0 (0.0%) | 0 (0.0%) |
| $17,500 to $19,999 | 0 (0.0%) | 0 (0.0%) |
| $20,000 to $22,499 | 0 (0.0%) | 0 (0.0%) |
| $22,500 to $24,999 | 0 (0.0%) | 0 (0.0%) |
| $25,000 to $29,999 | 41 (38.0%) | 0 (0.0%) |
| $30,000 to $34,999 | 0 (0.0%) | 0 (0.0%) |
| $35,000 to $39,999 | 0 (0.0%) | 0 (0.0%) |
| $40,000 to $44,999 | 0 (0.0%) | 0 (0.0%) |
| $45,000 to $49,999 | 0 (0.0%) | 0 (0.0%) |
| $50,000 to $54,999 | 0 (0.0%) | 0 (0.0%) |
| $55,000 to $64,999 | 0 (0.0%) | 0 (0.0%) |
| $65,000 to $74,999 | 0 (0.0%) | 0 (0.0%) |
| $75,000 to $99,999 | 0 (0.0%) | 0 (0.0%) |
| $100,000+ | 0 (0.0%) | 0 (0.0%) |
| Total | 108 (100.0%) | 20 (100.0%) |
Earnings by Sex by Educational Attainment in Wet Camp Village
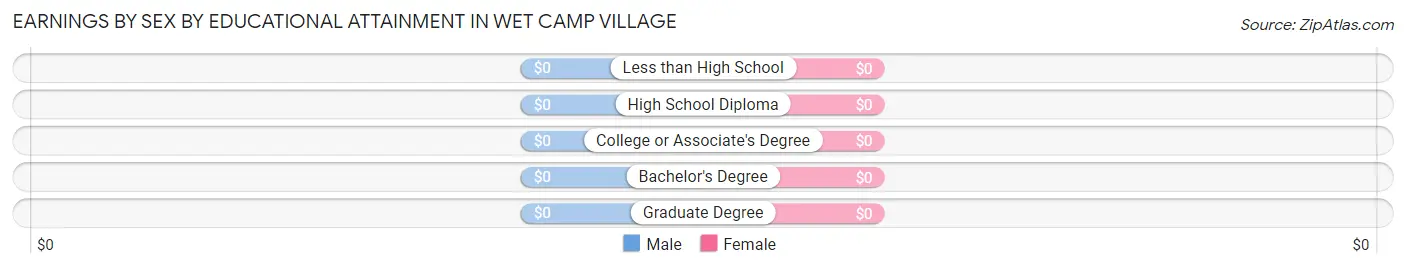
| Educational Attainment | Male Income | Female Income |
| Less than High School | - | - |
| High School Diploma | - | - |
| College or Associate's Degree | - | - |
| Bachelor's Degree | - | - |
| Graduate Degree | - | - |
| Total | - | - |
Family Income in Wet Camp Village
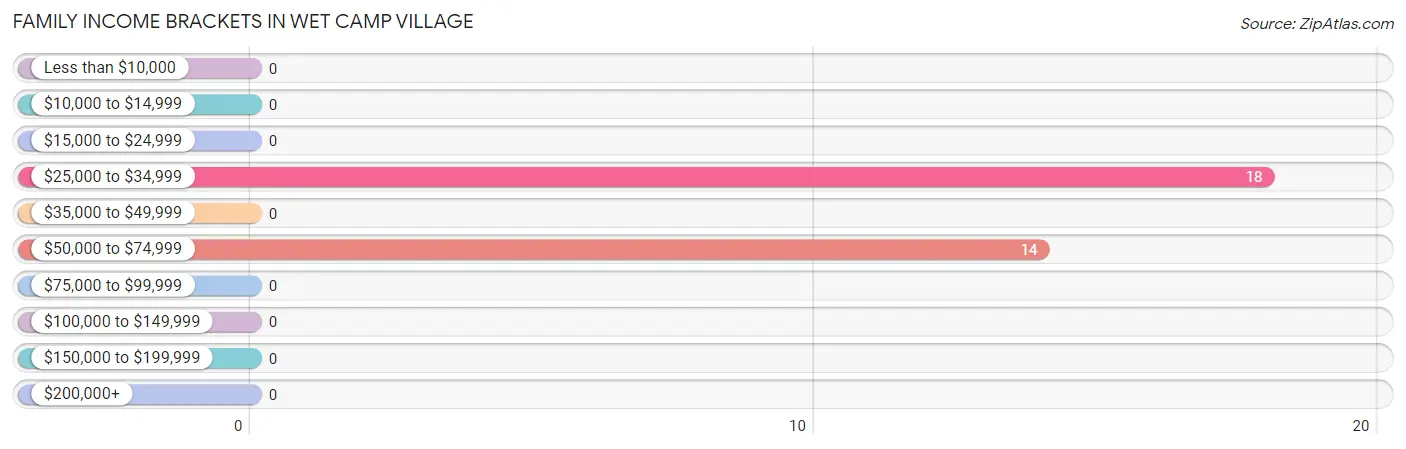
Family Income Brackets in Wet Camp Village
According to the Wet Camp Village family income data, there are 18 families falling into the $25,000 to $34,999 income range, which is the most common income bracket and makes up 56.2% of all families.
| Income Bracket | # Families | % Families |
| Less than $10,000 | 0 | 0.0% |
| $10,000 to $14,999 | 0 | 0.0% |
| $15,000 to $24,999 | 0 | 0.0% |
| $25,000 to $34,999 | 18 | 56.3% |
| $35,000 to $49,999 | 0 | 0.0% |
| $50,000 to $74,999 | 14 | 43.8% |
| $75,000 to $99,999 | 0 | 0.0% |
| $100,000 to $149,999 | 0 | 0.0% |
| $150,000 to $199,999 | 0 | 0.0% |
| $200,000+ | 0 | 0.0% |
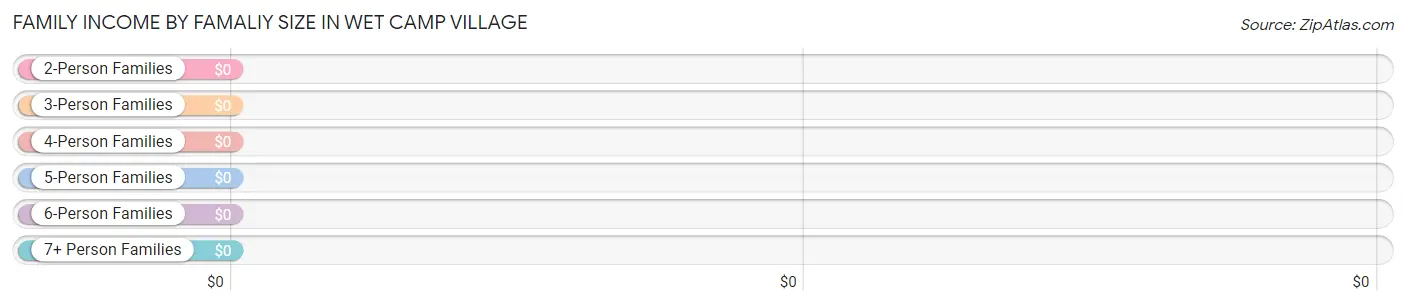
Family Income by Famaliy Size in Wet Camp Village
| Income Bracket | # Families | Median Income |
| 2-Person Families | 0 (0.0%) | $0 |
| 3-Person Families | 32 (100.0%) | $0 |
| 4-Person Families | 0 (0.0%) | $0 |
| 5-Person Families | 0 (0.0%) | $0 |
| 6-Person Families | 0 (0.0%) | $0 |
| 7+ Person Families | 0 (0.0%) | $0 |
| Total | 32 (100.0%) | $0 |
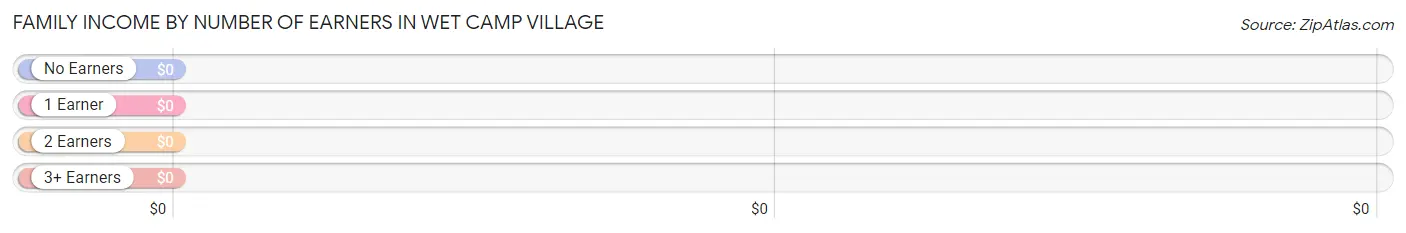
Family Income by Number of Earners in Wet Camp Village
| Number of Earners | # Families | Median Income |
| No Earners | 0 (0.0%) | $0 |
| 1 Earner | 0 (0.0%) | $0 |
| 2 Earners | 32 (100.0%) | $0 |
| 3+ Earners | 0 (0.0%) | $0 |
| Total | 32 (100.0%) | $0 |
Household Income in Wet Camp Village
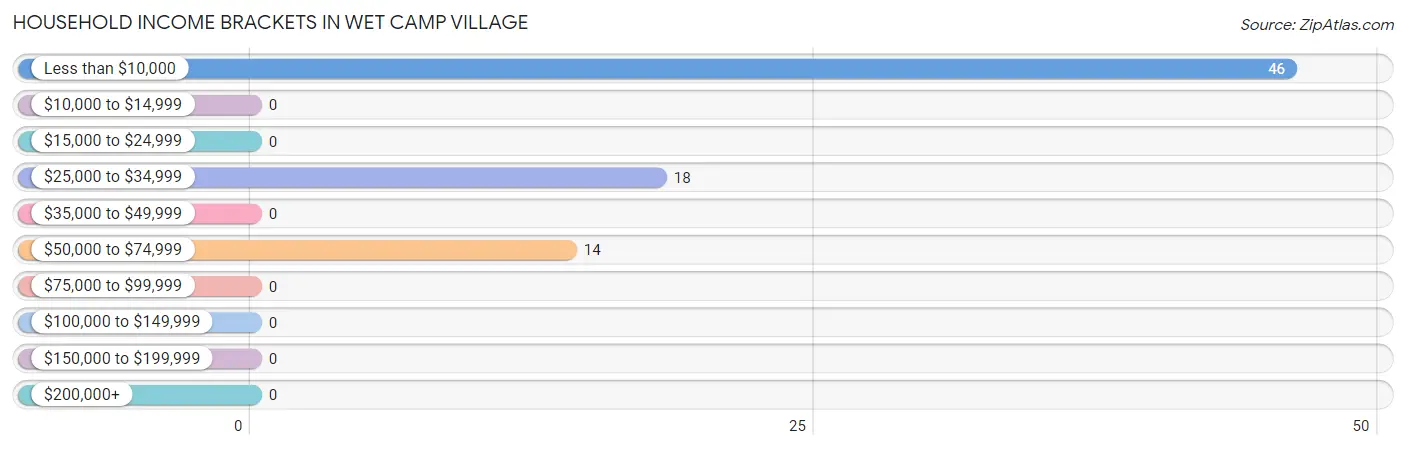
Household Income Brackets in Wet Camp Village
With 46 households falling in the category, the less than $10,000 income range is the most frequent in Wet Camp Village, accounting for 59.0% of all households.
| Income Bracket | # Households | % Households |
| Less than $10,000 | 46 | 59.0% |
| $10,000 to $14,999 | 0 | 0.0% |
| $15,000 to $24,999 | 0 | 0.0% |
| $25,000 to $34,999 | 18 | 23.1% |
| $35,000 to $49,999 | 0 | 0.0% |
| $50,000 to $74,999 | 14 | 17.9% |
| $75,000 to $99,999 | 0 | 0.0% |
| $100,000 to $149,999 | 0 | 0.0% |
| $150,000 to $199,999 | 0 | 0.0% |
| $200,000+ | 0 | 0.0% |
Household Income by Householder Age in Wet Camp Village
| Income Bracket | # Households | Median Income |
| 15 to 24 Years | 0 (0.0%) | $0 |
| 25 to 44 Years | 64 (82.1%) | $0 |
| 45 to 64 Years | 0 (0.0%) | $0 |
| 65+ Years | 14 (17.9%) | $0 |
| Total | 78 (100.0%) | $0 |
Poverty in Wet Camp Village
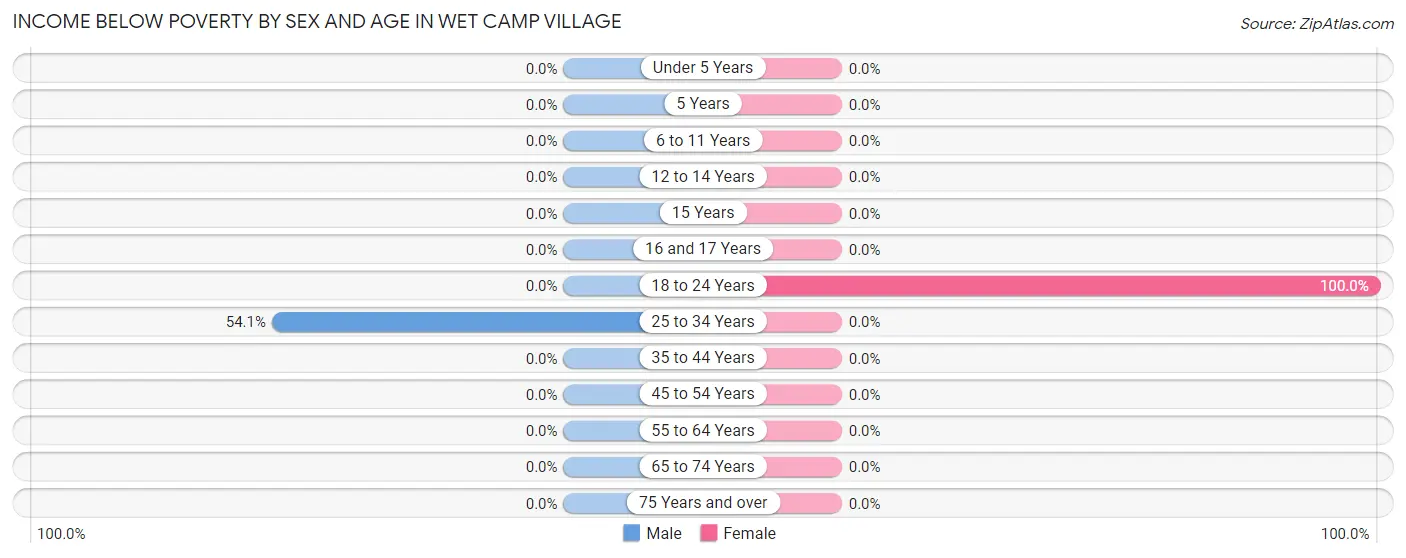
Income Below Poverty by Sex and Age in Wet Camp Village
With 38.3% poverty level for males and 33.3% for females among the residents of Wet Camp Village, 25 to 34 year old males and 18 to 24 year old females are the most vulnerable to poverty, with 46 males (54.1%) and 17 females (100.0%) in their respective age groups living below the poverty level.
| Age Bracket | Male | Female |
| Under 5 Years | 0 (0.0%) | 0 (0.0%) |
| 5 Years | 0 (0.0%) | 0 (0.0%) |
| 6 to 11 Years | 0 (0.0%) | 0 (0.0%) |
| 12 to 14 Years | 0 (0.0%) | 0 (0.0%) |
| 15 Years | 0 (0.0%) | 0 (0.0%) |
| 16 and 17 Years | 0 (0.0%) | 0 (0.0%) |
| 18 to 24 Years | 0 (0.0%) | 17 (100.0%) |
| 25 to 34 Years | 46 (54.1%) | 0 (0.0%) |
| 35 to 44 Years | 0 (0.0%) | 0 (0.0%) |
| 45 to 54 Years | 0 (0.0%) | 0 (0.0%) |
| 55 to 64 Years | 0 (0.0%) | 0 (0.0%) |
| 65 to 74 Years | 0 (0.0%) | 0 (0.0%) |
| 75 Years and over | 0 (0.0%) | 0 (0.0%) |
| Total | 46 (38.3%) | 17 (33.3%) |
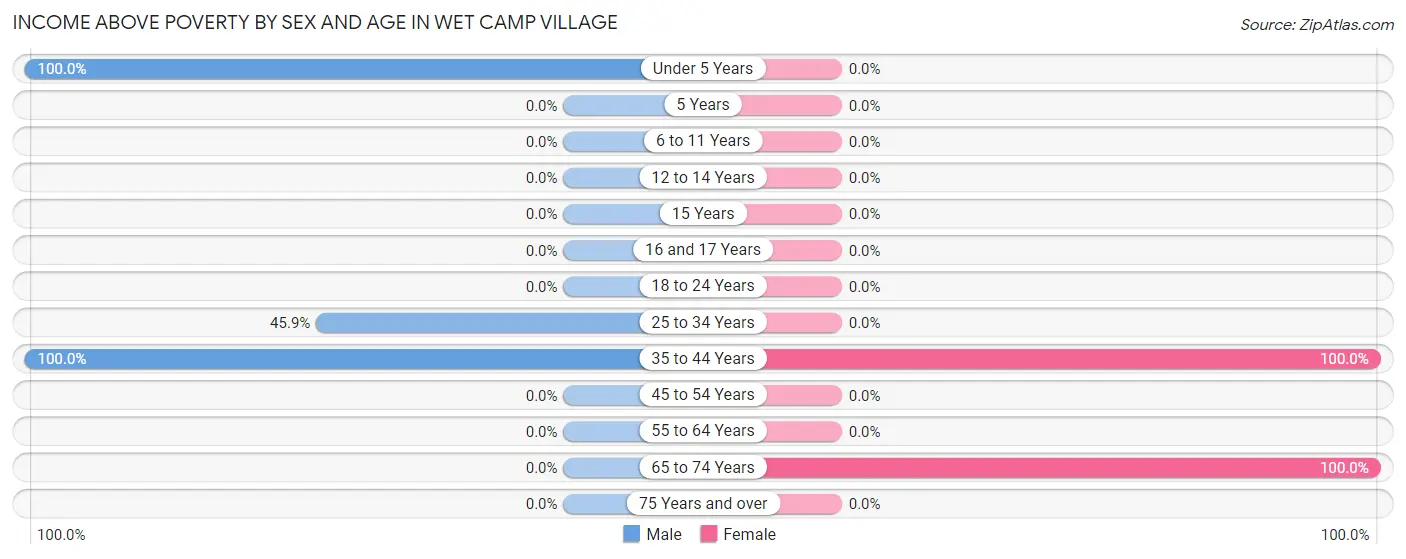
Income Above Poverty by Sex and Age in Wet Camp Village
According to the poverty statistics in Wet Camp Village, males aged under 5 years and females aged 35 to 44 years are the age groups that are most secure financially, with 100.0% of males and 100.0% of females in these age groups living above the poverty line.
| Age Bracket | Male | Female |
| Under 5 Years | 12 (100.0%) | 0 (0.0%) |
| 5 Years | 0 (0.0%) | 0 (0.0%) |
| 6 to 11 Years | 0 (0.0%) | 0 (0.0%) |
| 12 to 14 Years | 0 (0.0%) | 0 (0.0%) |
| 15 Years | 0 (0.0%) | 0 (0.0%) |
| 16 and 17 Years | 0 (0.0%) | 0 (0.0%) |
| 18 to 24 Years | 0 (0.0%) | 0 (0.0%) |
| 25 to 34 Years | 39 (45.9%) | 0 (0.0%) |
| 35 to 44 Years | 23 (100.0%) | 20 (100.0%) |
| 45 to 54 Years | 0 (0.0%) | 0 (0.0%) |
| 55 to 64 Years | 0 (0.0%) | 0 (0.0%) |
| 65 to 74 Years | 0 (0.0%) | 14 (100.0%) |
| 75 Years and over | 0 (0.0%) | 0 (0.0%) |
| Total | 74 (61.7%) | 34 (66.7%) |
Income Below Poverty Among Married-Couple Families in Wet Camp Village
| Children | Above Poverty | Below Poverty |
| No Children | 0 (0.0%) | 0 (0.0%) |
| 1 or 2 Children | 0 (0.0%) | 0 (0.0%) |
| 3 or 4 Children | 0 (0.0%) | 0 (0.0%) |
| 5 or more Children | 0 (0.0%) | 0 (0.0%) |
| Total | 0 (0.0%) | 0 (0.0%) |
Income Below Poverty Among Single-Parent Households in Wet Camp Village
| Children | Single Father | Single Mother |
| No Children | 0 (0.0%) | 0 (0.0%) |
| 1 or 2 Children | 0 (0.0%) | 0 (0.0%) |
| 3 or 4 Children | 0 (0.0%) | 0 (0.0%) |
| 5 or more Children | 0 (0.0%) | 0 (0.0%) |
| Total | 0 (0.0%) | 0 (0.0%) |
Income Below Poverty Among Married-Couple vs Single-Parent Households in Wet Camp Village
| Children | Married-Couple Families | Single-Parent Households |
| No Children | 0 (0.0%) | 0 (0.0%) |
| 1 or 2 Children | 0 (0.0%) | 0 (0.0%) |
| 3 or 4 Children | 0 (0.0%) | 0 (0.0%) |
| 5 or more Children | 0 (0.0%) | 0 (0.0%) |
| Total | 0 (0.0%) | 0 (0.0%) |
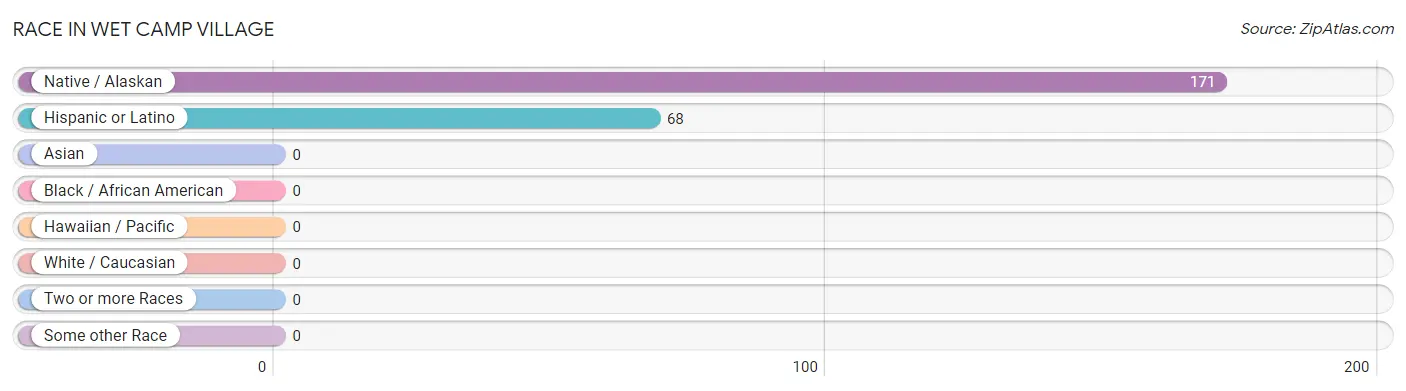
Race in Wet Camp Village
The most populous races in Wet Camp Village are Native / Alaskan (171 | 100.0%), and Hispanic or Latino (68 | 39.8%).
| Race | # Population | % Population |
| Asian | 0 | 0.0% |
| Black / African American | 0 | 0.0% |
| Hawaiian / Pacific | 0 | 0.0% |
| Hispanic or Latino | 68 | 39.8% |
| Native / Alaskan | 171 | 100.0% |
| White / Caucasian | 0 | 0.0% |
| Two or more Races | 0 | 0.0% |
| Some other Race | 0 | 0.0% |
| Total | 171 | 100.0% |
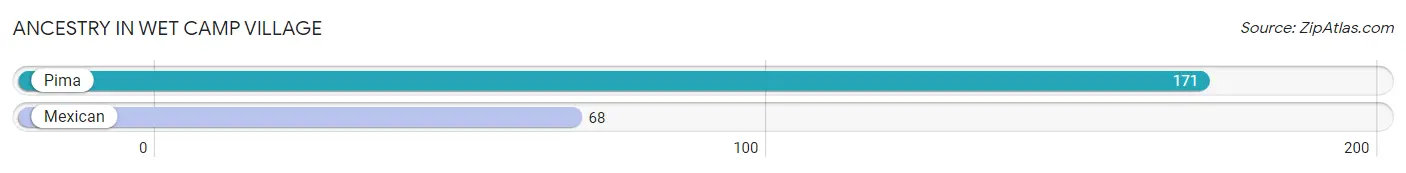
Ancestry in Wet Camp Village
The most populous ancestries reported in Wet Camp Village are Pima (171 | 100.0%), and Mexican (68 | 39.8%), together accounting for 139.8% of all Wet Camp Village residents.
| Ancestry | # Population | % Population |
| Mexican | 68 | 39.8% |
| Pima | 171 | 100.0% | View All 2 Rows |
Immigrants in Wet Camp Village

| Immigration Origin | # Population | % Population | View All 0 Rows |
Sex and Age in Wet Camp Village
Sex and Age in Wet Camp Village
The most populous age groups in Wet Camp Village are 30 to 34 Years (46 | 38.3%) for men and 40 to 44 Years (20 | 39.2%) for women.
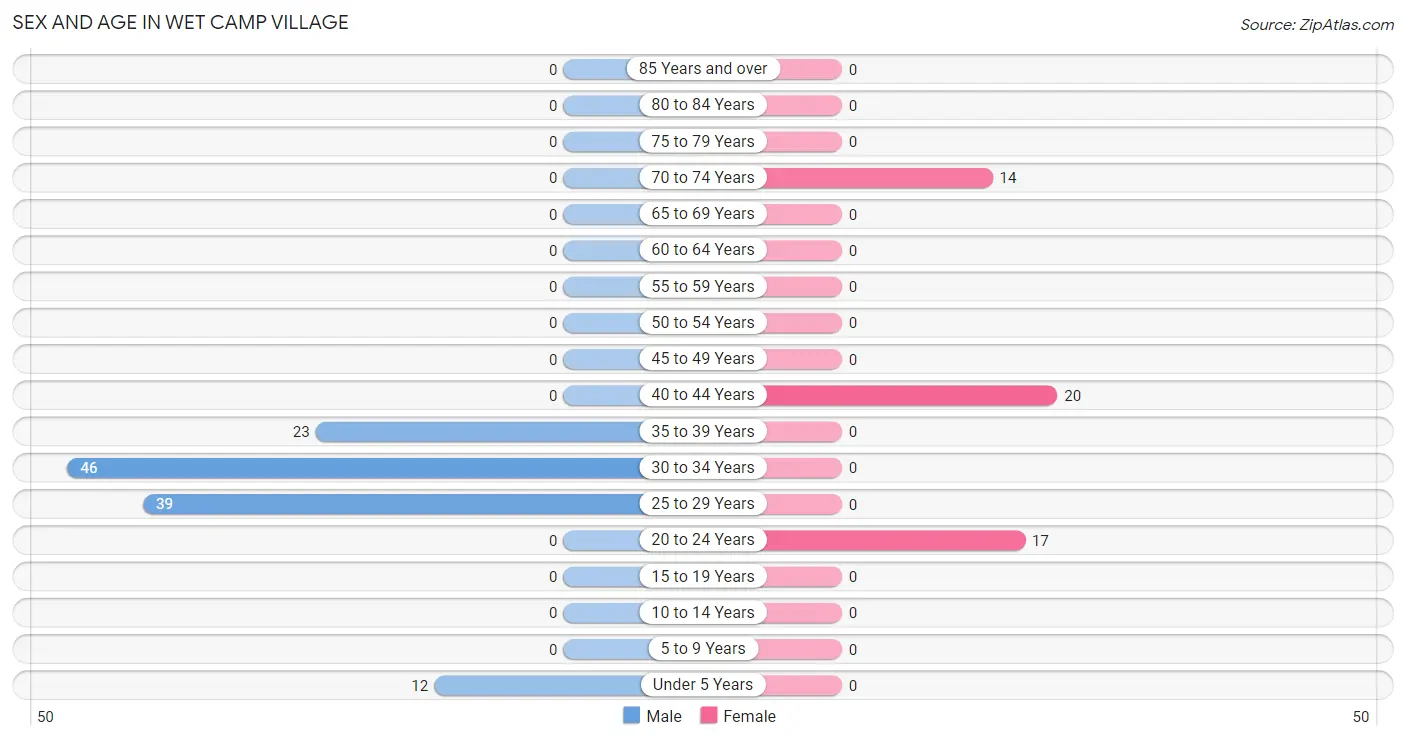
| Age Bracket | Male | Female |
| Under 5 Years | 12 (10.0%) | 0 (0.0%) |
| 5 to 9 Years | 0 (0.0%) | 0 (0.0%) |
| 10 to 14 Years | 0 (0.0%) | 0 (0.0%) |
| 15 to 19 Years | 0 (0.0%) | 0 (0.0%) |
| 20 to 24 Years | 0 (0.0%) | 17 (33.3%) |
| 25 to 29 Years | 39 (32.5%) | 0 (0.0%) |
| 30 to 34 Years | 46 (38.3%) | 0 (0.0%) |
| 35 to 39 Years | 23 (19.2%) | 0 (0.0%) |
| 40 to 44 Years | 0 (0.0%) | 20 (39.2%) |
| 45 to 49 Years | 0 (0.0%) | 0 (0.0%) |
| 50 to 54 Years | 0 (0.0%) | 0 (0.0%) |
| 55 to 59 Years | 0 (0.0%) | 0 (0.0%) |
| 60 to 64 Years | 0 (0.0%) | 0 (0.0%) |
| 65 to 69 Years | 0 (0.0%) | 0 (0.0%) |
| 70 to 74 Years | 0 (0.0%) | 14 (27.5%) |
| 75 to 79 Years | 0 (0.0%) | 0 (0.0%) |
| 80 to 84 Years | 0 (0.0%) | 0 (0.0%) |
| 85 Years and over | 0 (0.0%) | 0 (0.0%) |
| Total | 120 (100.0%) | 51 (100.0%) |
Families and Households in Wet Camp Village
Median Family Size in Wet Camp Village
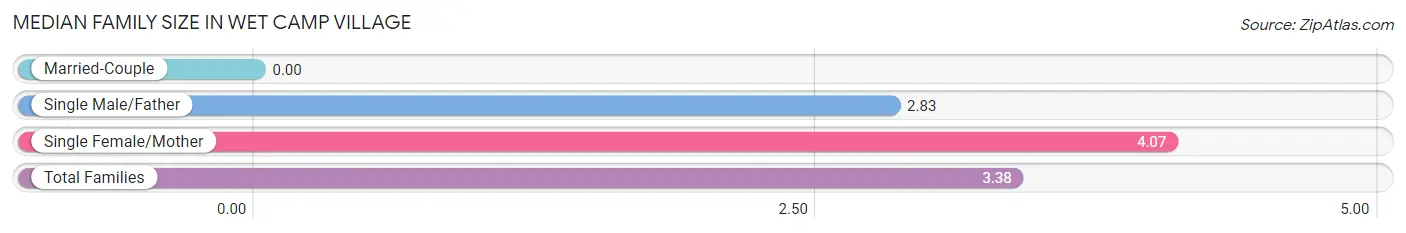
| Family Type | # Families | Family Size |
| Married-Couple | 0 (0.0%) | - |
| Single Male/Father | 18 (56.2%) | 2.83 |
| Single Female/Mother | 14 (43.8%) | 4.07 |
| Total Families | 32 (100.0%) | 3.38 |
Median Household Size in Wet Camp Village
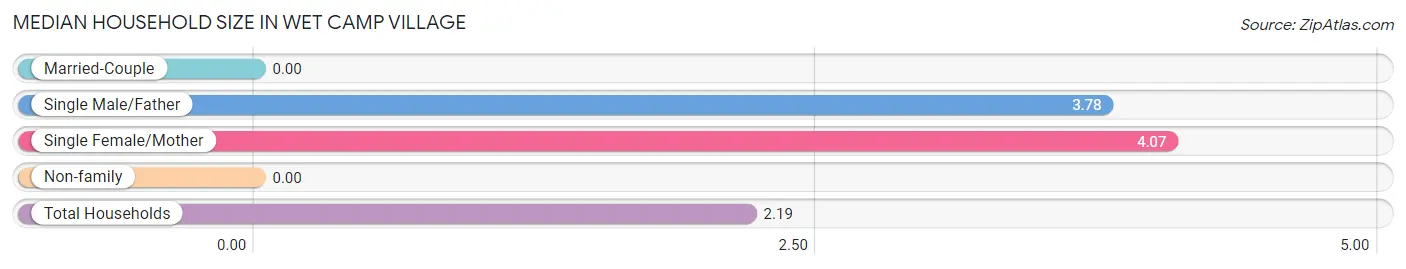
| Household Type | # Households | Household Size |
| Married-Couple | 0 (0.0%) | - |
| Single Male/Father | 18 (23.1%) | 3.78 |
| Single Female/Mother | 14 (17.9%) | 4.07 |
| Non-family | 46 (59.0%) | - |
| Total Households | 78 (100.0%) | 2.19 |
Household Size by Marriage Status in Wet Camp Village
Out of a total of 78 households in Wet Camp Village, 32 (41.0%) are family households, while 46 (59.0%) are nonfamily households. The most numerous type of family households are 4-person households, comprising 18, and the most common type of nonfamily households are 1-person households, comprising 46.
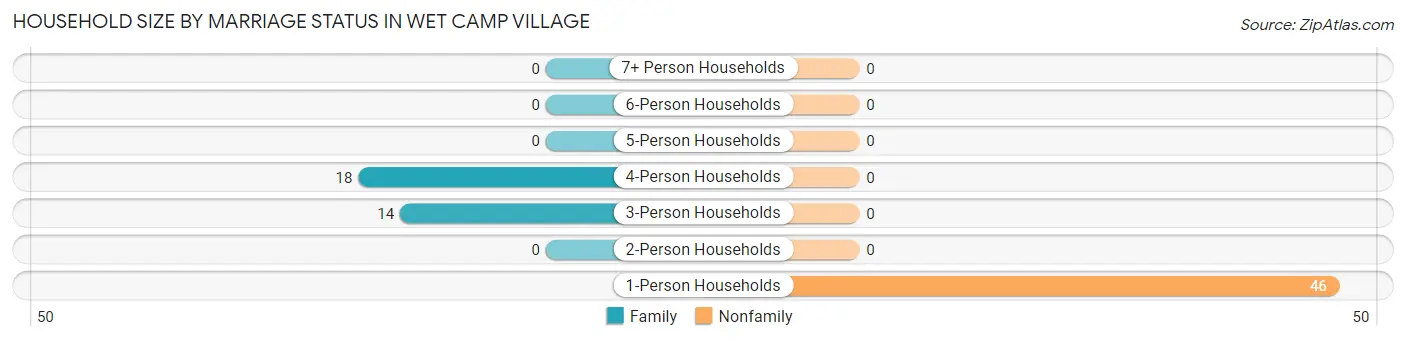
| Household Size | Family Households | Nonfamily Households |
| 1-Person Households | - | 46 (59.0%) |
| 2-Person Households | 0 (0.0%) | 0 (0.0%) |
| 3-Person Households | 14 (17.9%) | 0 (0.0%) |
| 4-Person Households | 18 (23.1%) | 0 (0.0%) |
| 5-Person Households | 0 (0.0%) | 0 (0.0%) |
| 6-Person Households | 0 (0.0%) | 0 (0.0%) |
| 7+ Person Households | 0 (0.0%) | 0 (0.0%) |
| Total | 32 (41.0%) | 46 (59.0%) |
Female Fertility in Wet Camp Village
Fertility by Age in Wet Camp Village
| Age Bracket | Women with Births | Births / 1,000 Women |
| 15 to 19 years | 0 (0.0%) | 0.0 |
| 20 to 34 years | 0 (0.0%) | 0.0 |
| 35 to 50 years | 0 (0.0%) | 0.0 |
| Total | 0 (0.0%) | 0.0 |
Fertility by Age by Marriage Status in Wet Camp Village
| Age Bracket | Married | Unmarried |
| 15 to 19 years | 0 (0.0%) | 0 (0.0%) |
| 20 to 34 years | 0 (0.0%) | 0 (0.0%) |
| 35 to 50 years | 0 (0.0%) | 0 (0.0%) |
| Total | 0 (0.0%) | 0 (0.0%) |
Fertility by Education in Wet Camp Village
| Educational Attainment | Women with Births | Births / 1,000 Women |
| Less than High School | 0 (0.0%) | 0.0 |
| High School Diploma | 0 (0.0%) | 0.0 |
| College or Associate's Degree | 0 (0.0%) | 0.0 |
| Bachelor's Degree | 0 (0.0%) | 0.0 |
| Graduate Degree | 0 (0.0%) | 0.0 |
| Total | 0 (0.0%) | 0.0 |
Fertility by Education by Marriage Status in Wet Camp Village
| Educational Attainment | Married | Unmarried |
| Less than High School | 0 (0.0%) | 0 (0.0%) |
| High School Diploma | 0 (0.0%) | 0 (0.0%) |
| College or Associate's Degree | 0 (0.0%) | 0 (0.0%) |
| Bachelor's Degree | 0 (0.0%) | 0 (0.0%) |
| Graduate Degree | 0 (0.0%) | 0 (0.0%) |
| Total | 0 (0.0%) | 0 (0.0%) |
Employment Characteristics in Wet Camp Village
Employment by Class of Employer in Wet Camp Village
Among the 105 employed individuals in Wet Camp Village, private company employees (64 | 61.0%), and not-for-profit organizations (41 | 39.1%) make up the most common classes of employment.
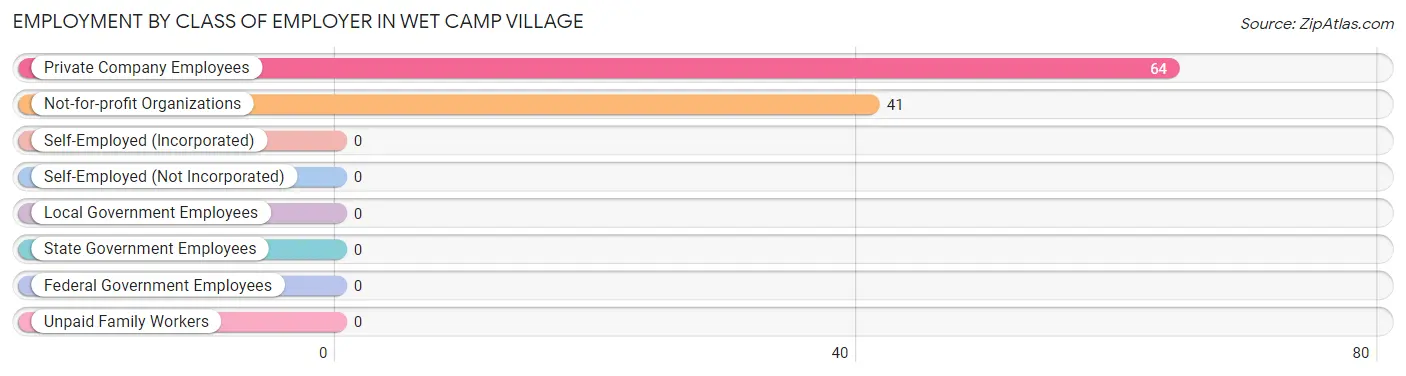
| Employer Class | # Employees | % Employees |
| Private Company Employees | 64 | 61.0% |
| Self-Employed (Incorporated) | 0 | 0.0% |
| Self-Employed (Not Incorporated) | 0 | 0.0% |
| Not-for-profit Organizations | 41 | 39.1% |
| Local Government Employees | 0 | 0.0% |
| State Government Employees | 0 | 0.0% |
| Federal Government Employees | 0 | 0.0% |
| Unpaid Family Workers | 0 | 0.0% |
| Total | 105 | 100.0% |
Employment Status by Age in Wet Camp Village
According to the labor force statistics for Wet Camp Village, out of the total population over 16 years of age (159), 91.2% or 145 individuals are in the labor force, with 27.6% or 40 of them unemployed. The age group with the highest labor force participation rate is 20 to 24 years, with 100.0% or 17 individuals in the labor force. Within the labor force, the 20 to 24 years age range has the highest percentage of unemployed individuals, with 100.0% or 17 of them being unemployed.
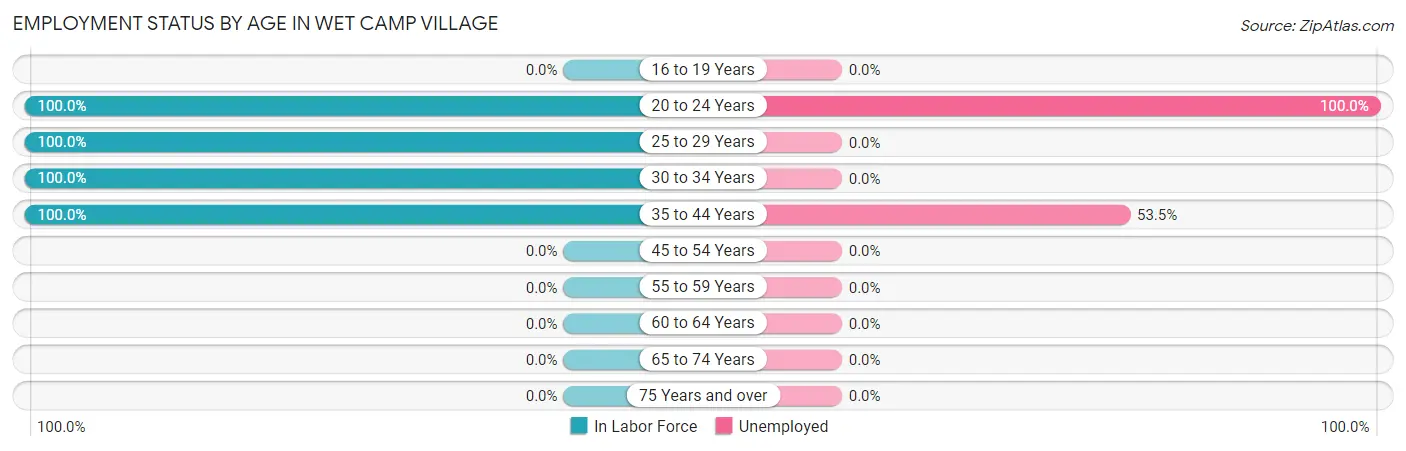
| Age Bracket | In Labor Force | Unemployed |
| 16 to 19 Years | 0 (0.0%) | 0 (0.0%) |
| 20 to 24 Years | 17 (100.0%) | 17 (100.0%) |
| 25 to 29 Years | 39 (100.0%) | 0 (0.0%) |
| 30 to 34 Years | 46 (100.0%) | 0 (0.0%) |
| 35 to 44 Years | 43 (100.0%) | 23 (53.5%) |
| 45 to 54 Years | 0 (0.0%) | 0 (0.0%) |
| 55 to 59 Years | 0 (0.0%) | 0 (0.0%) |
| 60 to 64 Years | 0 (0.0%) | 0 (0.0%) |
| 65 to 74 Years | 0 (0.0%) | 0 (0.0%) |
| 75 Years and over | 0 (0.0%) | 0 (0.0%) |
| Total | 145 (91.2%) | 40 (27.6%) |
Employment Status by Educational Attainment in Wet Camp Village
According to labor force statistics for Wet Camp Village, 100.0% of individuals (128) out of the total population between 25 and 64 years of age (128) are in the labor force, with 18.0% or 23 of them being unemployed. The group with the highest labor force participation rate are those with the educational attainment of less than high school, with 100.0% or 39 individuals in the labor force. Within the labor force, individuals with high school diploma education have the highest percentage of unemployment, with 33.3% or 23 of them being unemployed.
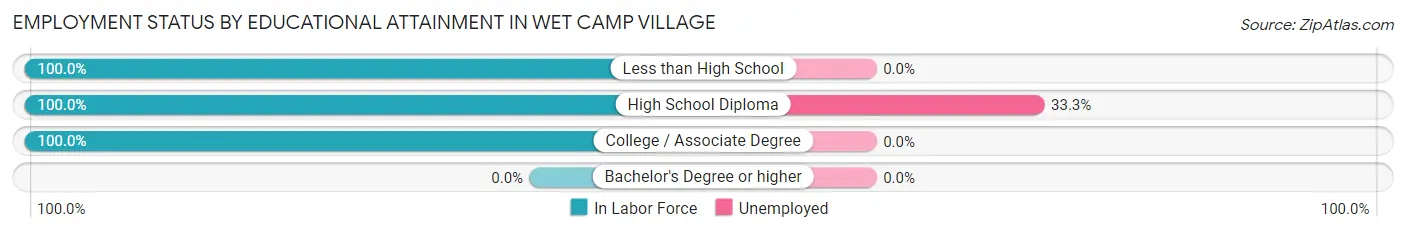
| Educational Attainment | In Labor Force | Unemployed |
| Less than High School | 39 (100.0%) | 0 (0.0%) |
| High School Diploma | 69 (100.0%) | 23 (33.3%) |
| College / Associate Degree | 20 (100.0%) | 0 (0.0%) |
| Bachelor's Degree or higher | 0 (0.0%) | 0 (0.0%) |
| Total | 128 (100.0%) | 23 (18.0%) |
Employment Occupations by Sex in Wet Camp Village
Management, Business, Science and Arts Occupations
The most common Management, Business, Science and Arts occupations in Wet Camp Village are Community & Social Service (20 | 19.1%), and Education Instruction & Library (20 | 19.1%).
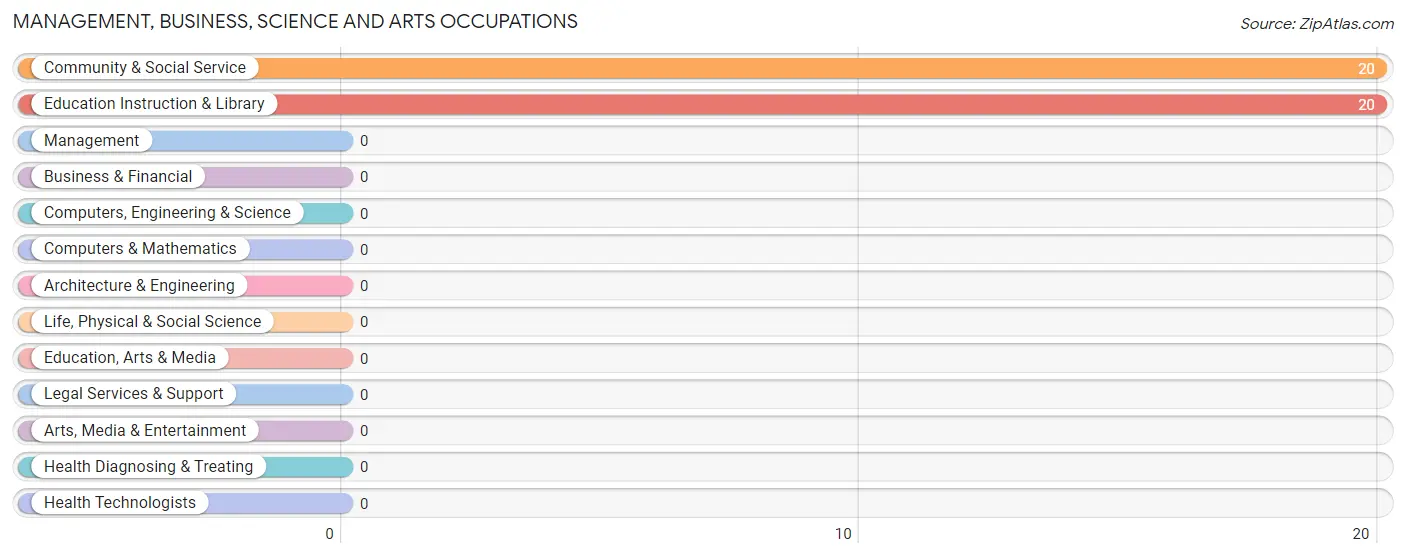
Management, Business, Science and Arts Occupations by Sex
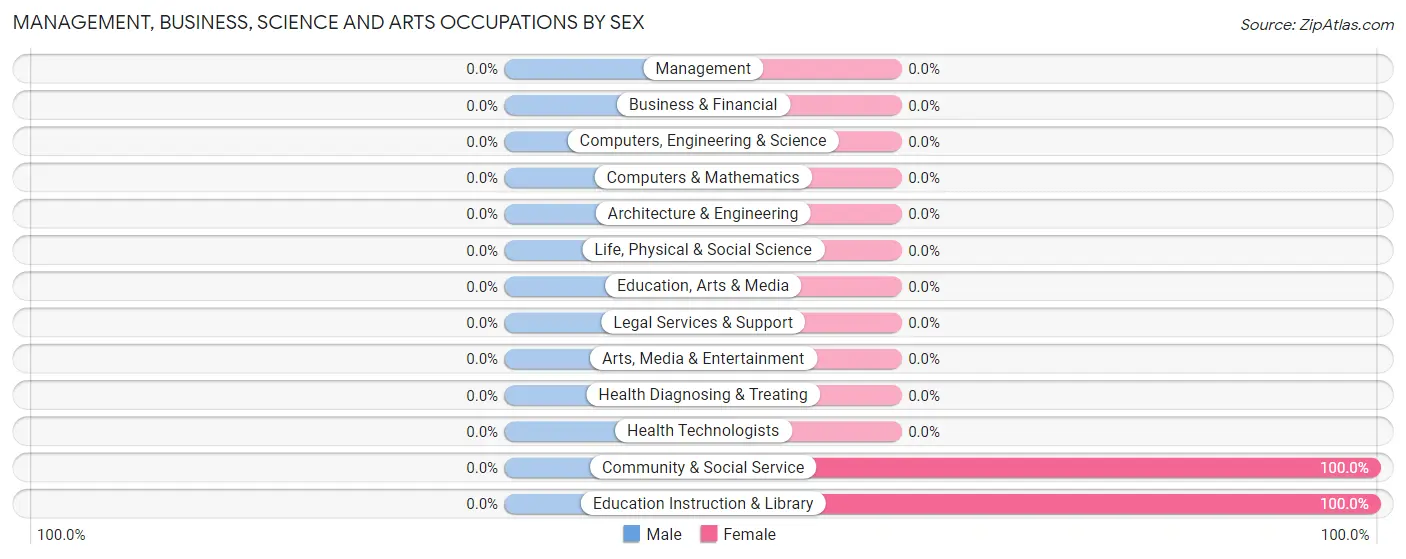
| Occupation | Male | Female |
| Management | 0 (0.0%) | 0 (0.0%) |
| Business & Financial | 0 (0.0%) | 0 (0.0%) |
| Computers, Engineering & Science | 0 (0.0%) | 0 (0.0%) |
| Computers & Mathematics | 0 (0.0%) | 0 (0.0%) |
| Architecture & Engineering | 0 (0.0%) | 0 (0.0%) |
| Life, Physical & Social Science | 0 (0.0%) | 0 (0.0%) |
| Community & Social Service | 0 (0.0%) | 20 (100.0%) |
| Education, Arts & Media | 0 (0.0%) | 0 (0.0%) |
| Legal Services & Support | 0 (0.0%) | 0 (0.0%) |
| Education Instruction & Library | 0 (0.0%) | 20 (100.0%) |
| Arts, Media & Entertainment | 0 (0.0%) | 0 (0.0%) |
| Health Diagnosing & Treating | 0 (0.0%) | 0 (0.0%) |
| Health Technologists | 0 (0.0%) | 0 (0.0%) |
| Total (Category) | 0 (0.0%) | 20 (100.0%) |
| Total (Overall) | 85 (80.9%) | 20 (19.1%) |
Services Occupations
The most common Services occupations in Wet Camp Village are Food Preparation & Serving (46 | 43.8%), and Cleaning & Maintenance (39 | 37.1%).
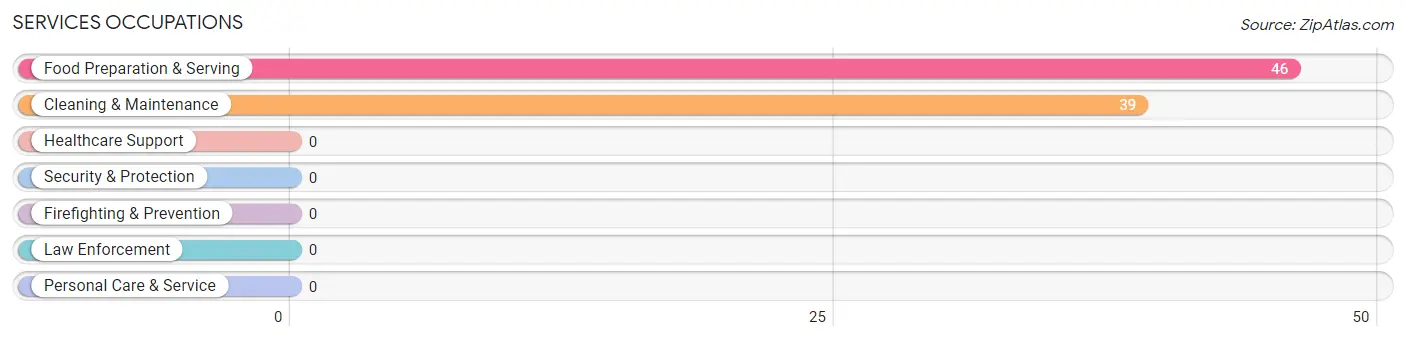
Services Occupations by Sex
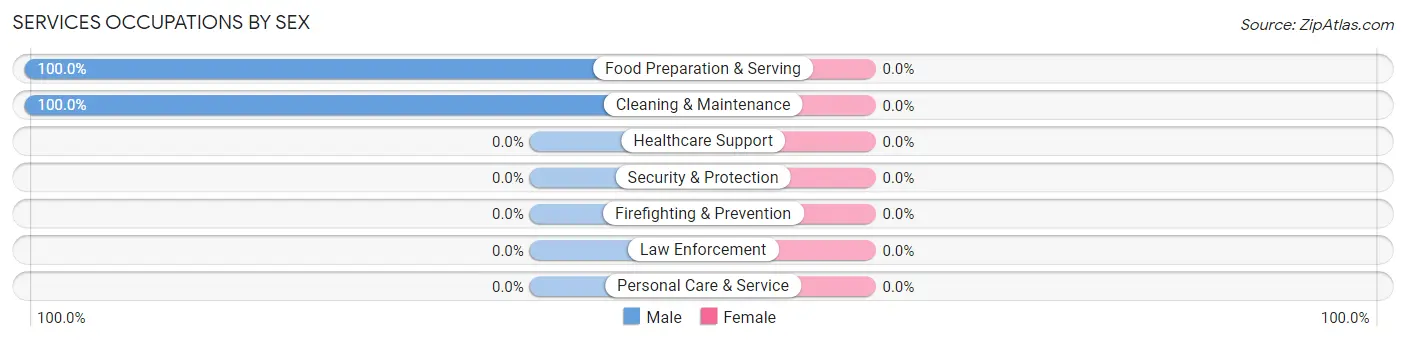
| Occupation | Male | Female |
| Healthcare Support | 0 (0.0%) | 0 (0.0%) |
| Security & Protection | 0 (0.0%) | 0 (0.0%) |
| Firefighting & Prevention | 0 (0.0%) | 0 (0.0%) |
| Law Enforcement | 0 (0.0%) | 0 (0.0%) |
| Food Preparation & Serving | 46 (100.0%) | 0 (0.0%) |
| Cleaning & Maintenance | 39 (100.0%) | 0 (0.0%) |
| Personal Care & Service | 0 (0.0%) | 0 (0.0%) |
| Total (Category) | 85 (100.0%) | 0 (0.0%) |
| Total (Overall) | 85 (80.9%) | 20 (19.1%) |
Sales and Office Occupations
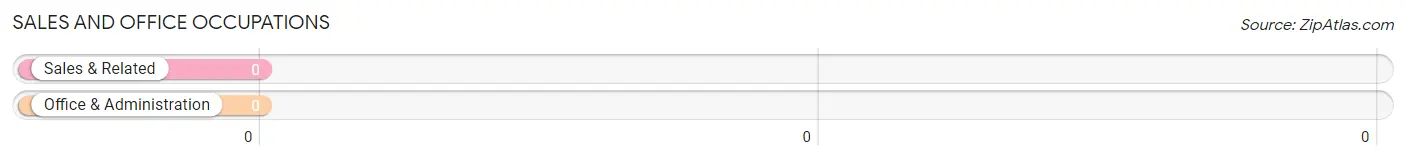
Sales and Office Occupations by Sex
| Occupation | Male | Female |
| Sales & Related | 0 (0.0%) | 0 (0.0%) |
| Office & Administration | 0 (0.0%) | 0 (0.0%) |
| Total (Category) | 0 (0.0%) | 0 (0.0%) |
| Total (Overall) | 85 (80.9%) | 20 (19.1%) |
Natural Resources, Construction and Maintenance Occupations
Natural Resources, Construction and Maintenance Occupations by Sex
| Occupation | Male | Female |
| Farming, Fishing & Forestry | 0 (0.0%) | 0 (0.0%) |
| Construction & Extraction | 0 (0.0%) | 0 (0.0%) |
| Installation, Maintenance & Repair | 0 (0.0%) | 0 (0.0%) |
| Total (Category) | 0 (0.0%) | 0 (0.0%) |
| Total (Overall) | 85 (80.9%) | 20 (19.1%) |
Production, Transportation and Moving Occupations
Production, Transportation and Moving Occupations by Sex
| Occupation | Male | Female |
| Production | 0 (0.0%) | 0 (0.0%) |
| Transportation | 0 (0.0%) | 0 (0.0%) |
| Material Moving | 0 (0.0%) | 0 (0.0%) |
| Total (Category) | 0 (0.0%) | 0 (0.0%) |
| Total (Overall) | 85 (80.9%) | 20 (19.1%) |
Employment Industries by Sex in Wet Camp Village
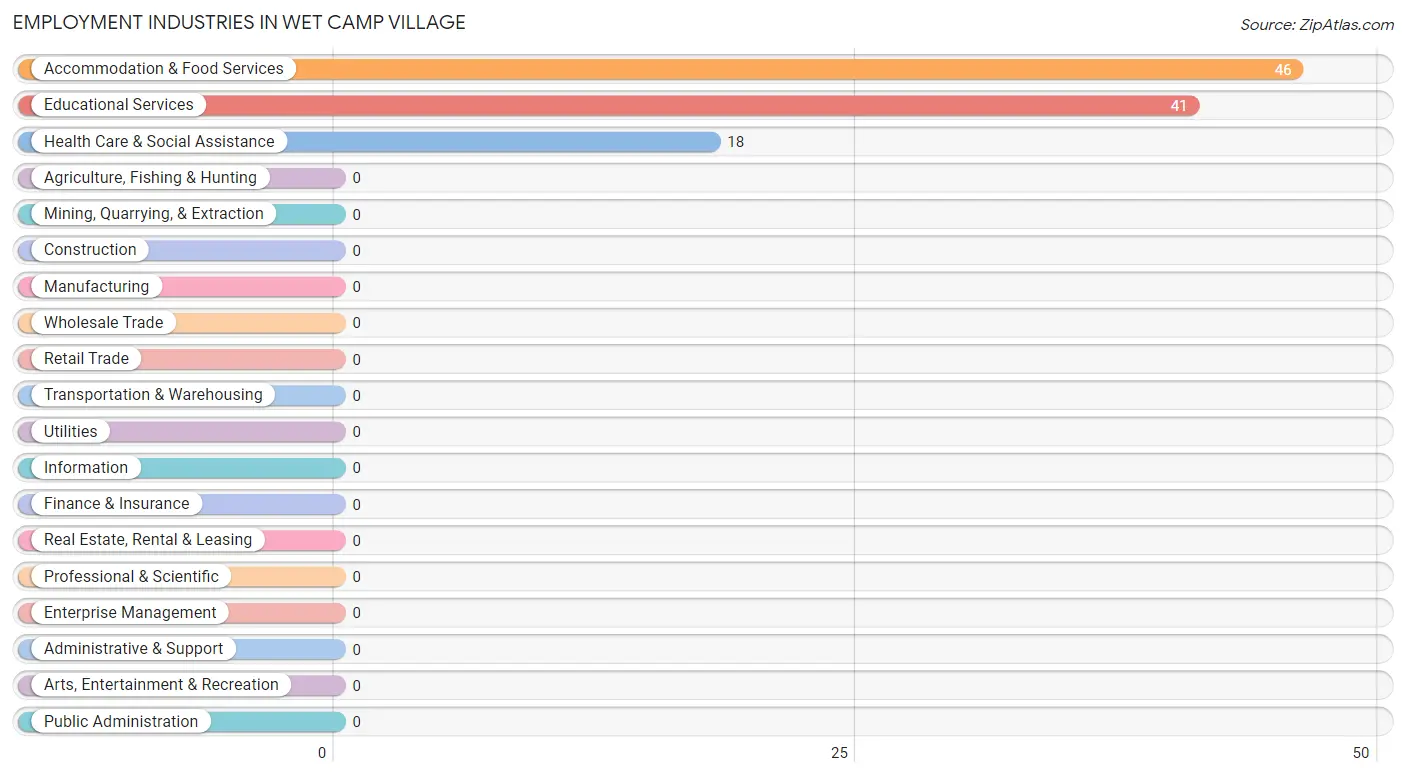
Employment Industries in Wet Camp Village
The major employment industries in Wet Camp Village include Accommodation & Food Services (46 | 43.8%), Educational Services (41 | 39.1%), and Health Care & Social Assistance (18 | 17.1%).
Employment Industries by Sex in Wet Camp Village
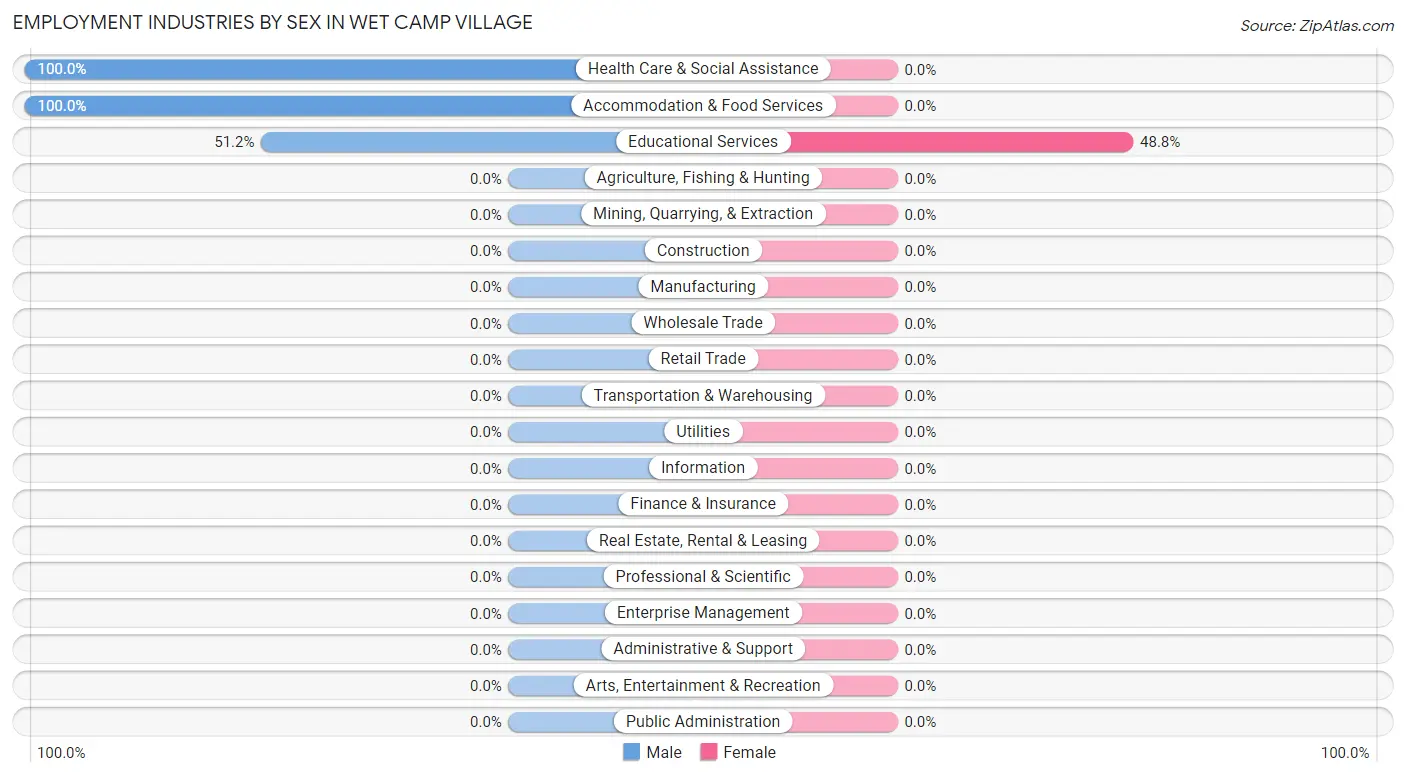
| Industry | Male | Female |
| Agriculture, Fishing & Hunting | 0 (0.0%) | 0 (0.0%) |
| Mining, Quarrying, & Extraction | 0 (0.0%) | 0 (0.0%) |
| Construction | 0 (0.0%) | 0 (0.0%) |
| Manufacturing | 0 (0.0%) | 0 (0.0%) |
| Wholesale Trade | 0 (0.0%) | 0 (0.0%) |
| Retail Trade | 0 (0.0%) | 0 (0.0%) |
| Transportation & Warehousing | 0 (0.0%) | 0 (0.0%) |
| Utilities | 0 (0.0%) | 0 (0.0%) |
| Information | 0 (0.0%) | 0 (0.0%) |
| Finance & Insurance | 0 (0.0%) | 0 (0.0%) |
| Real Estate, Rental & Leasing | 0 (0.0%) | 0 (0.0%) |
| Professional & Scientific | 0 (0.0%) | 0 (0.0%) |
| Enterprise Management | 0 (0.0%) | 0 (0.0%) |
| Administrative & Support | 0 (0.0%) | 0 (0.0%) |
| Educational Services | 21 (51.2%) | 20 (48.8%) |
| Health Care & Social Assistance | 18 (100.0%) | 0 (0.0%) |
| Arts, Entertainment & Recreation | 0 (0.0%) | 0 (0.0%) |
| Accommodation & Food Services | 46 (100.0%) | 0 (0.0%) |
| Public Administration | 0 (0.0%) | 0 (0.0%) |
| Total | 85 (80.9%) | 20 (19.1%) |
Education in Wet Camp Village
School Enrollment in Wet Camp Village
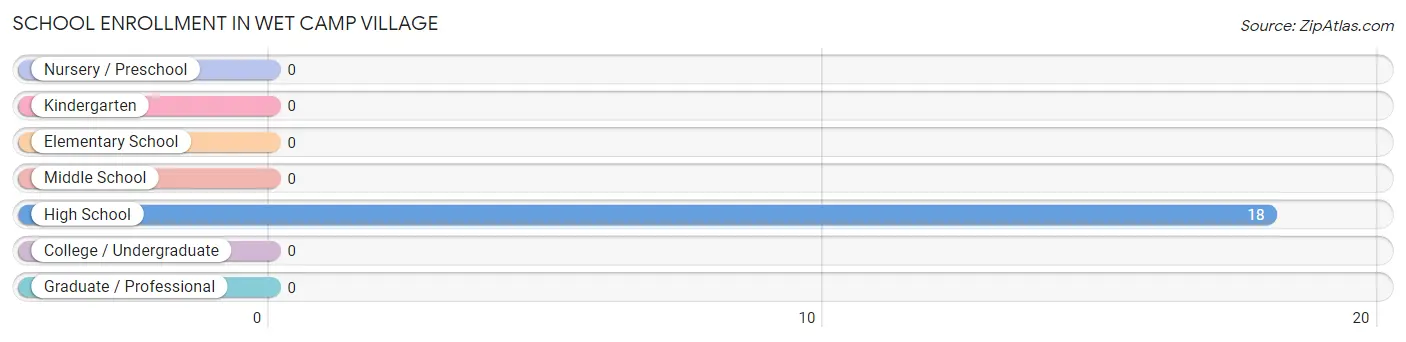
| School Level | # Students | % Students |
| Nursery / Preschool | 0 | 0.0% |
| Kindergarten | 0 | 0.0% |
| Elementary School | 0 | 0.0% |
| Middle School | 0 | 0.0% |
| High School | 18 | 100.0% |
| College / Undergraduate | 0 | 0.0% |
| Graduate / Professional | 0 | 0.0% |
| Total | 18 | 100.0% |
School Enrollment by Age by Funding Source in Wet Camp Village
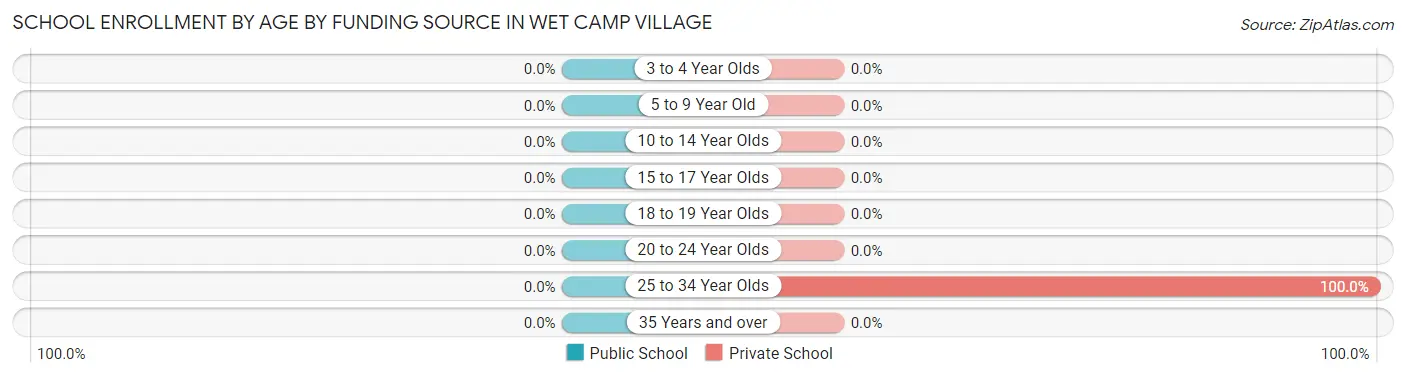
| Age Bracket | Public School | Private School |
| 3 to 4 Year Olds | 0 (0.0%) | 0 (0.0%) |
| 5 to 9 Year Old | 0 (0.0%) | 0 (0.0%) |
| 10 to 14 Year Olds | 0 (0.0%) | 0 (0.0%) |
| 15 to 17 Year Olds | 0 (0.0%) | 0 (0.0%) |
| 18 to 19 Year Olds | 0 (0.0%) | 0 (0.0%) |
| 20 to 24 Year Olds | 0 (0.0%) | 0 (0.0%) |
| 25 to 34 Year Olds | 0 (0.0%) | 18 (100.0%) |
| 35 Years and over | 0 (0.0%) | 0 (0.0%) |
| Total | 0 (0.0%) | 18 (100.0%) |
Educational Attainment by Field of Study in Wet Camp Village
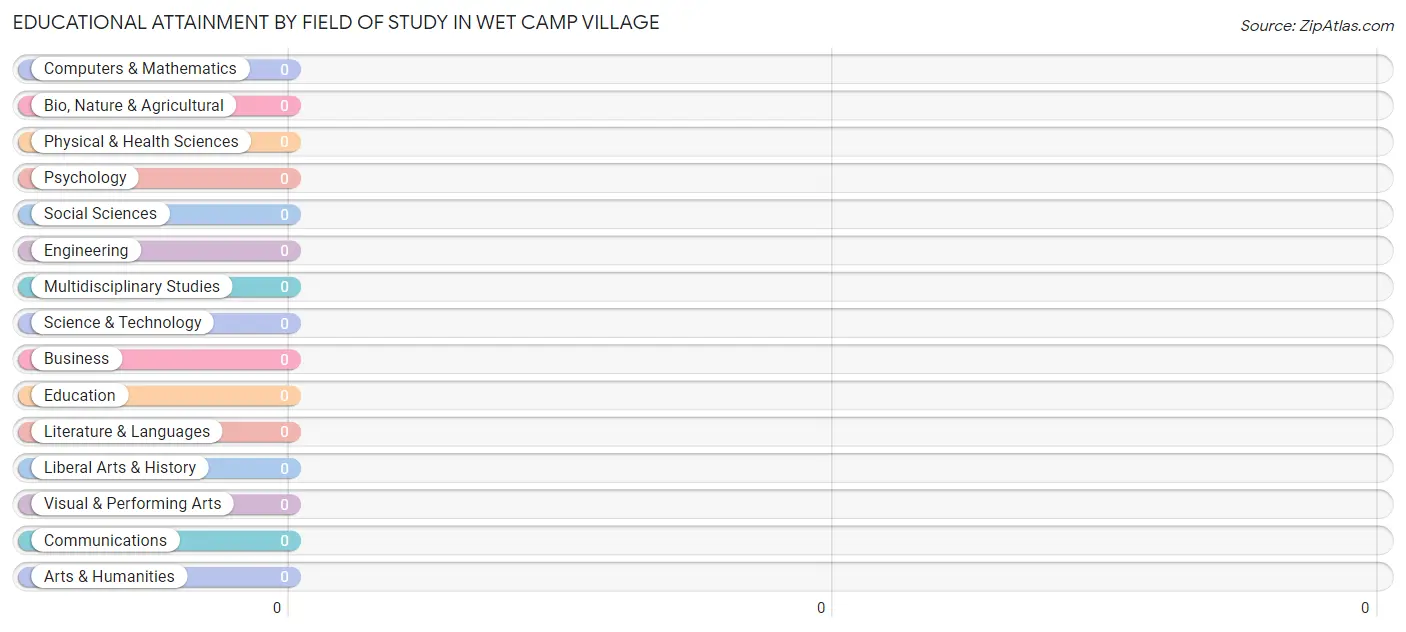
| Field of Study | # Graduates | % Graduates |
| Computers & Mathematics | 0 | 0.0% |
| Bio, Nature & Agricultural | 0 | 0.0% |
| Physical & Health Sciences | 0 | 0.0% |
| Psychology | 0 | 0.0% |
| Social Sciences | 0 | 0.0% |
| Engineering | 0 | 0.0% |
| Multidisciplinary Studies | 0 | 0.0% |
| Science & Technology | 0 | 0.0% |
| Business | 0 | 0.0% |
| Education | 0 | 0.0% |
| Literature & Languages | 0 | 0.0% |
| Liberal Arts & History | 0 | 0.0% |
| Visual & Performing Arts | 0 | 0.0% |
| Communications | 0 | 0.0% |
| Arts & Humanities | 0 | 0.0% |
| Total | 0 | 0.0% |
Transportation & Commute in Wet Camp Village
Vehicle Availability by Sex in Wet Camp Village
The most prevalent vehicle ownership categories in Wet Camp Village are males with 1 vehicle (46, accounting for 54.1%) and females with 1 vehicle (0, making up 230.0%).
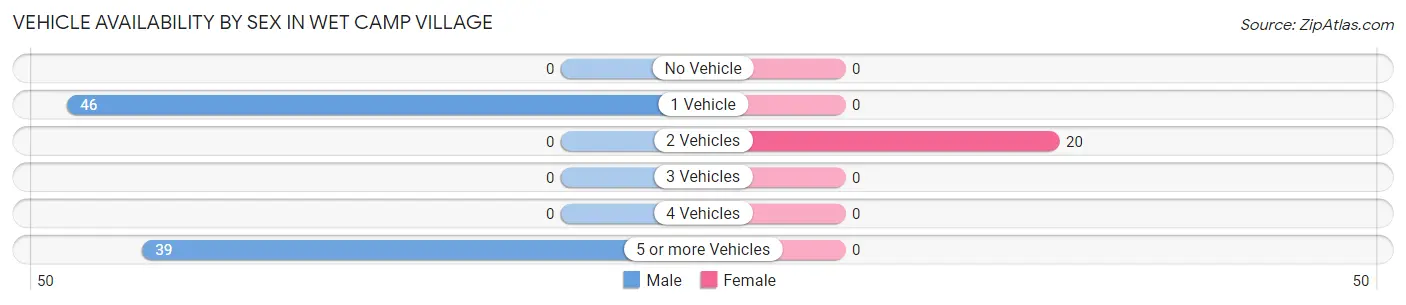
| Vehicles Available | Male | Female |
| No Vehicle | 0 (0.0%) | 0 (0.0%) |
| 1 Vehicle | 46 (54.1%) | 0 (0.0%) |
| 2 Vehicles | 0 (0.0%) | 20 (100.0%) |
| 3 Vehicles | 0 (0.0%) | 0 (0.0%) |
| 4 Vehicles | 0 (0.0%) | 0 (0.0%) |
| 5 or more Vehicles | 39 (45.9%) | 0 (0.0%) |
| Total | 85 (100.0%) | 20 (100.0%) |
Commute Time in Wet Camp Village
The most frequently occuring commute durations in Wet Camp Village are 20 to 24 minutes (46 commuters, 43.8%), 10 to 14 minutes (38 commuters, 36.2%), and less than 5 minutes (21 commuters, 20.0%).
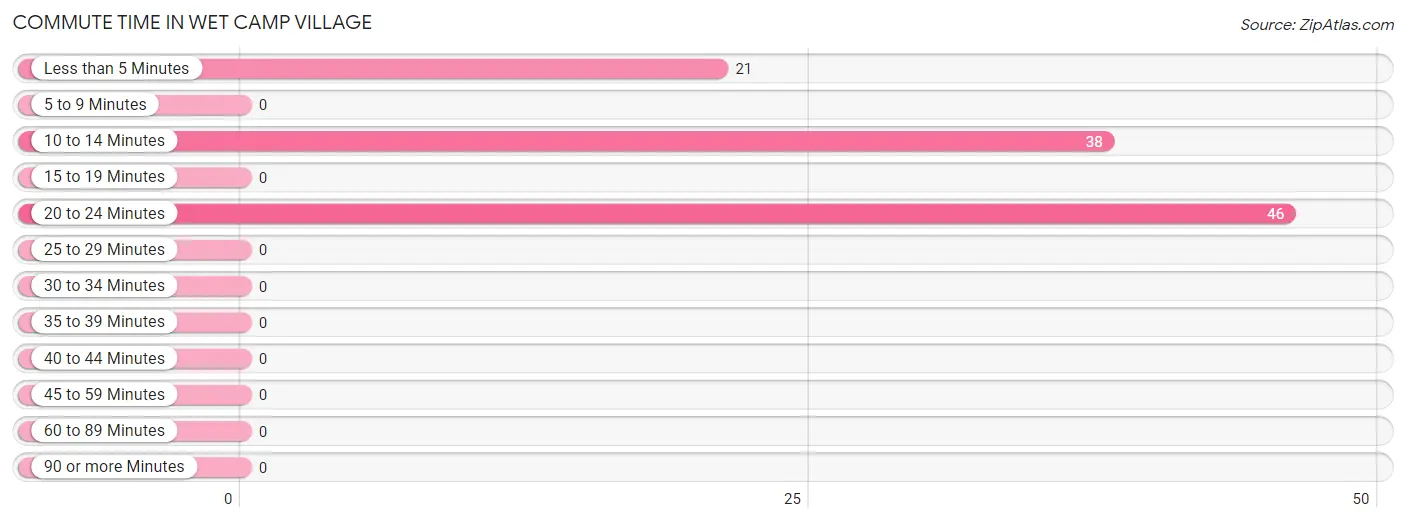
| Commute Time | # Commuters | % Commuters |
| Less than 5 Minutes | 21 | 20.0% |
| 5 to 9 Minutes | 0 | 0.0% |
| 10 to 14 Minutes | 38 | 36.2% |
| 15 to 19 Minutes | 0 | 0.0% |
| 20 to 24 Minutes | 46 | 43.8% |
| 25 to 29 Minutes | 0 | 0.0% |
| 30 to 34 Minutes | 0 | 0.0% |
| 35 to 39 Minutes | 0 | 0.0% |
| 40 to 44 Minutes | 0 | 0.0% |
| 45 to 59 Minutes | 0 | 0.0% |
| 60 to 89 Minutes | 0 | 0.0% |
| 90 or more Minutes | 0 | 0.0% |
Commute Time by Sex in Wet Camp Village
The most common commute times in Wet Camp Village are 20 to 24 minutes (46 commuters, 54.1%) for males and 10 to 14 minutes (20 commuters, 100.0%) for females.
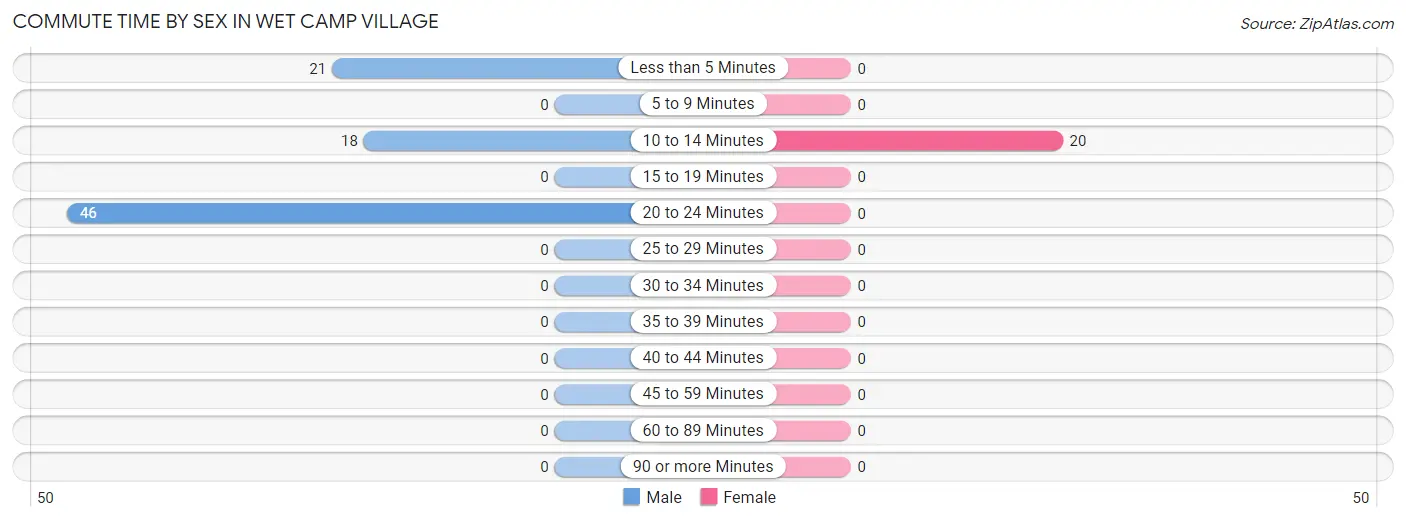
| Commute Time | Male | Female |
| Less than 5 Minutes | 21 (24.7%) | 0 (0.0%) |
| 5 to 9 Minutes | 0 (0.0%) | 0 (0.0%) |
| 10 to 14 Minutes | 18 (21.2%) | 20 (100.0%) |
| 15 to 19 Minutes | 0 (0.0%) | 0 (0.0%) |
| 20 to 24 Minutes | 46 (54.1%) | 0 (0.0%) |
| 25 to 29 Minutes | 0 (0.0%) | 0 (0.0%) |
| 30 to 34 Minutes | 0 (0.0%) | 0 (0.0%) |
| 35 to 39 Minutes | 0 (0.0%) | 0 (0.0%) |
| 40 to 44 Minutes | 0 (0.0%) | 0 (0.0%) |
| 45 to 59 Minutes | 0 (0.0%) | 0 (0.0%) |
| 60 to 89 Minutes | 0 (0.0%) | 0 (0.0%) |
| 90 or more Minutes | 0 (0.0%) | 0 (0.0%) |
Time of Departure to Work by Sex in Wet Camp Village
The most frequent times of departure to work in Wet Camp Village are 12:00 PM to 3:59 PM (64, 75.3%) for males and 7:00 AM to 7:29 AM (20, 100.0%) for females.
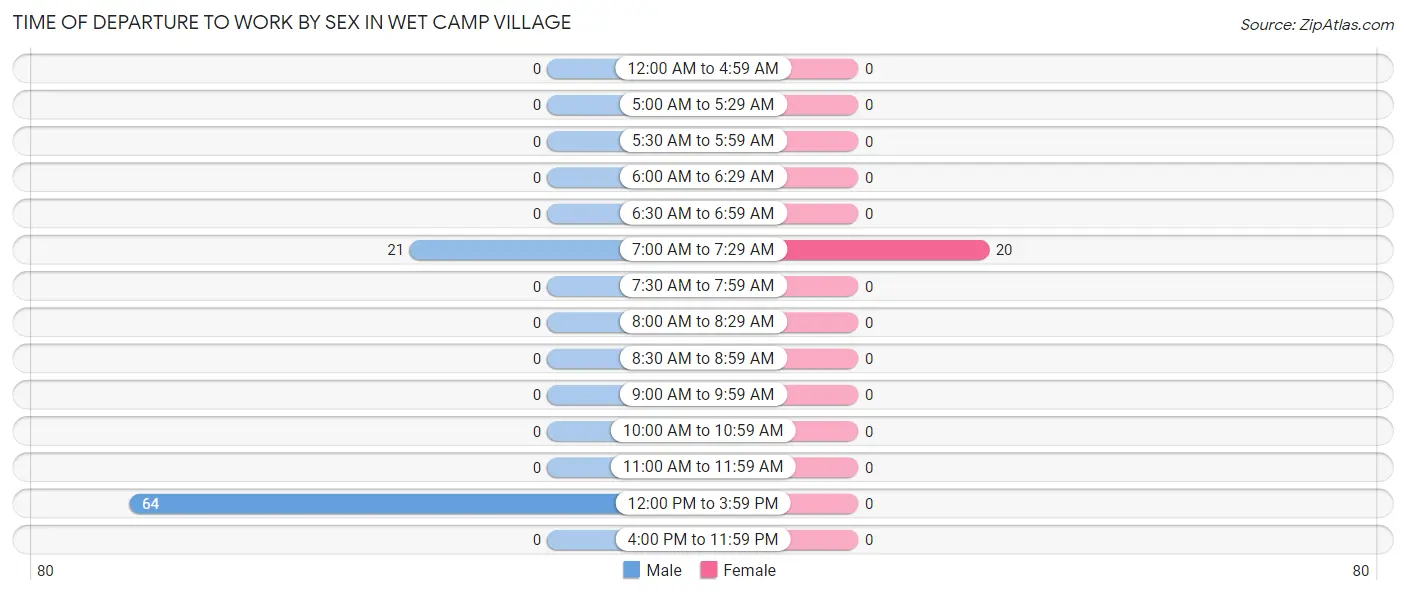
| Time of Departure | Male | Female |
| 12:00 AM to 4:59 AM | 0 (0.0%) | 0 (0.0%) |
| 5:00 AM to 5:29 AM | 0 (0.0%) | 0 (0.0%) |
| 5:30 AM to 5:59 AM | 0 (0.0%) | 0 (0.0%) |
| 6:00 AM to 6:29 AM | 0 (0.0%) | 0 (0.0%) |
| 6:30 AM to 6:59 AM | 0 (0.0%) | 0 (0.0%) |
| 7:00 AM to 7:29 AM | 21 (24.7%) | 20 (100.0%) |
| 7:30 AM to 7:59 AM | 0 (0.0%) | 0 (0.0%) |
| 8:00 AM to 8:29 AM | 0 (0.0%) | 0 (0.0%) |
| 8:30 AM to 8:59 AM | 0 (0.0%) | 0 (0.0%) |
| 9:00 AM to 9:59 AM | 0 (0.0%) | 0 (0.0%) |
| 10:00 AM to 10:59 AM | 0 (0.0%) | 0 (0.0%) |
| 11:00 AM to 11:59 AM | 0 (0.0%) | 0 (0.0%) |
| 12:00 PM to 3:59 PM | 64 (75.3%) | 0 (0.0%) |
| 4:00 PM to 11:59 PM | 0 (0.0%) | 0 (0.0%) |
| Total | 85 (100.0%) | 20 (100.0%) |
Housing Occupancy in Wet Camp Village
Occupancy by Ownership in Wet Camp Village
Of the total 78 dwellings in Wet Camp Village, owner-occupied units account for 32 (41.0%), while renter-occupied units make up 46 (59.0%).
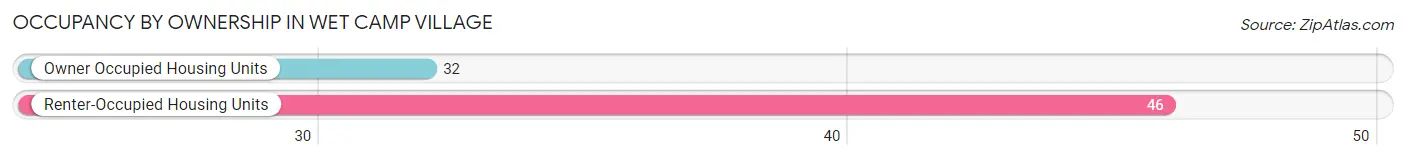
| Occupancy | # Housing Units | % Housing Units |
| Owner Occupied Housing Units | 32 | 41.0% |
| Renter-Occupied Housing Units | 46 | 59.0% |
| Total Occupied Housing Units | 78 | 100.0% |
Occupancy by Household Size in Wet Camp Village
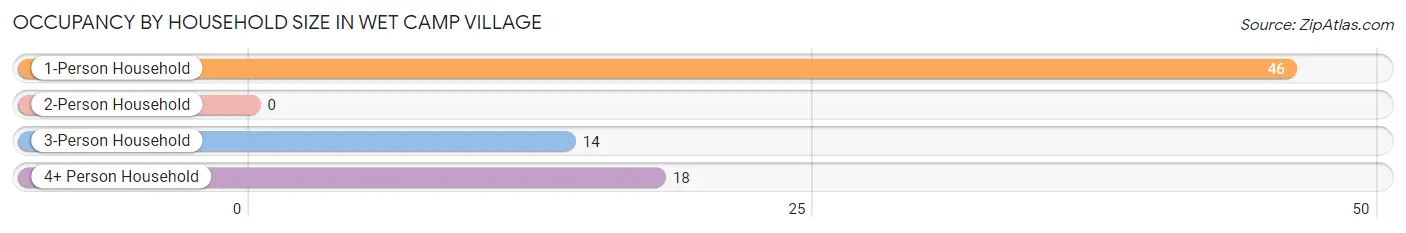
| Household Size | # Housing Units | % Housing Units |
| 1-Person Household | 46 | 59.0% |
| 2-Person Household | 0 | 0.0% |
| 3-Person Household | 14 | 17.9% |
| 4+ Person Household | 18 | 23.1% |
| Total Housing Units | 78 | 100.0% |
Occupancy by Ownership by Household Size in Wet Camp Village
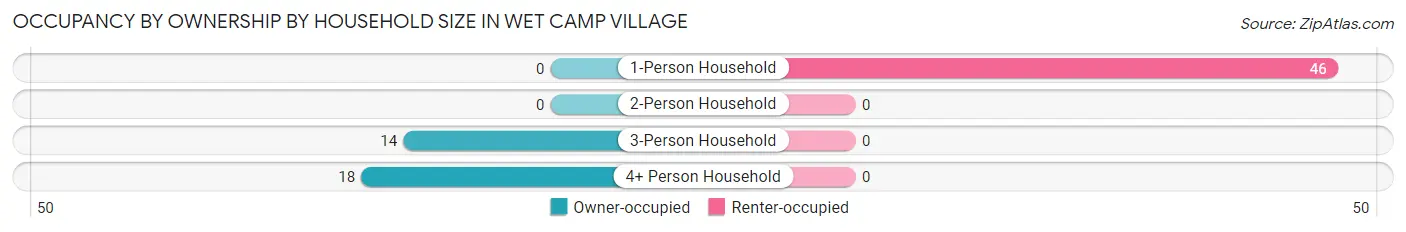
| Household Size | Owner-occupied | Renter-occupied |
| 1-Person Household | 0 (0.0%) | 46 (100.0%) |
| 2-Person Household | 0 (0.0%) | 0 (0.0%) |
| 3-Person Household | 14 (100.0%) | 0 (0.0%) |
| 4+ Person Household | 18 (100.0%) | 0 (0.0%) |
| Total Housing Units | 32 (41.0%) | 46 (59.0%) |
Occupancy by Educational Attainment in Wet Camp Village
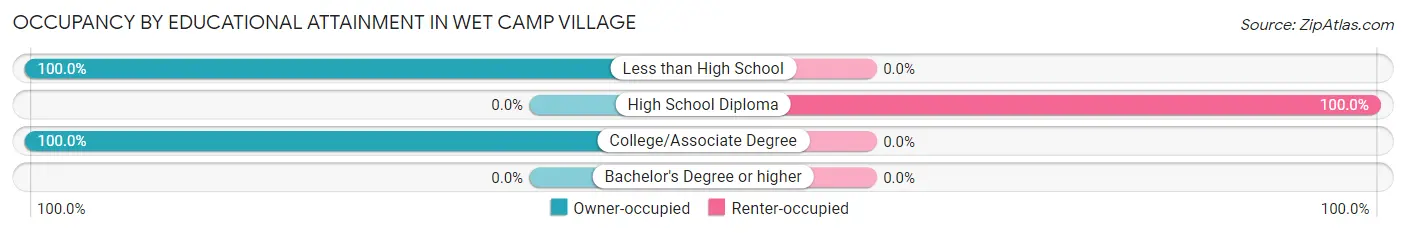
| Household Size | Owner-occupied | Renter-occupied |
| Less than High School | 18 (100.0%) | 0 (0.0%) |
| High School Diploma | 0 (0.0%) | 46 (100.0%) |
| College/Associate Degree | 14 (100.0%) | 0 (0.0%) |
| Bachelor's Degree or higher | 0 (0.0%) | 0 (0.0%) |
Occupancy by Age of Householder in Wet Camp Village
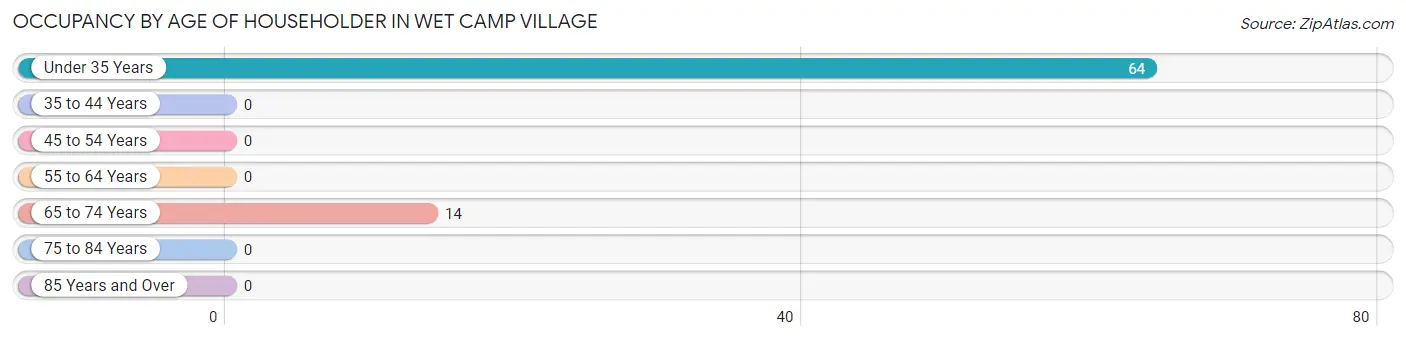
| Age Bracket | # Households | % Households |
| Under 35 Years | 64 | 82.1% |
| 35 to 44 Years | 0 | 0.0% |
| 45 to 54 Years | 0 | 0.0% |
| 55 to 64 Years | 0 | 0.0% |
| 65 to 74 Years | 14 | 17.9% |
| 75 to 84 Years | 0 | 0.0% |
| 85 Years and Over | 0 | 0.0% |
| Total | 78 | 100.0% |
Housing Finances in Wet Camp Village
Median Income by Occupancy in Wet Camp Village
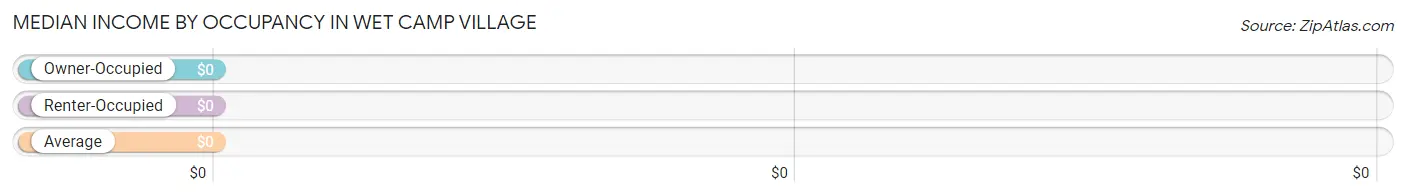
| Occupancy Type | # Households | Median Income |
| Owner-Occupied | 32 (41.0%) | $0 |
| Renter-Occupied | 46 (59.0%) | $0 |
| Average | 78 (100.0%) | $0 |
Occupancy by Householder Income Bracket in Wet Camp Village
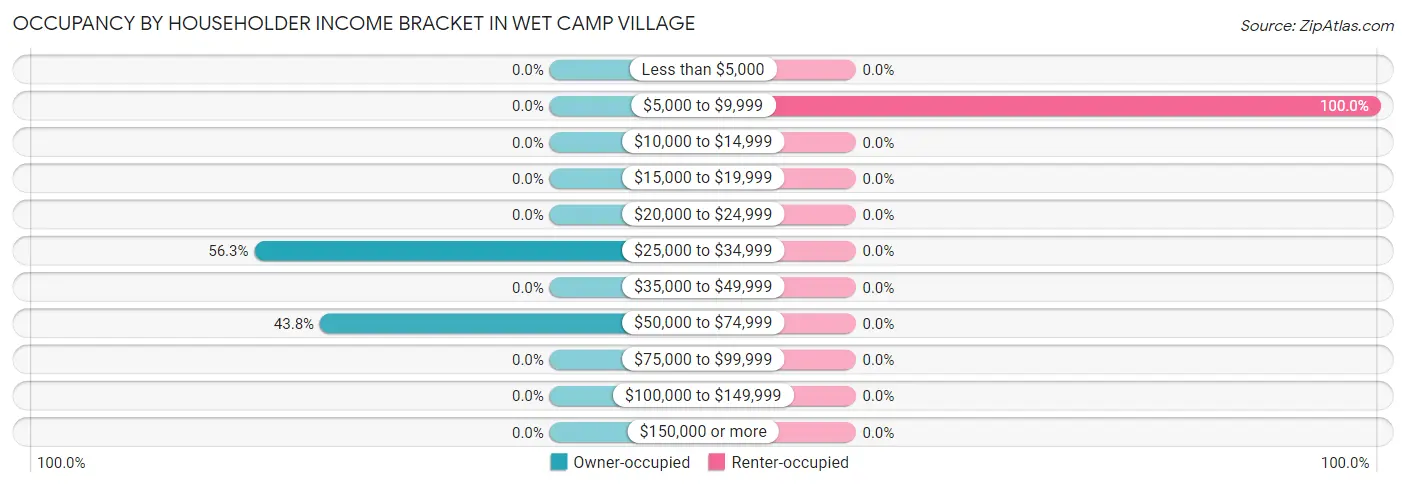
| Income Bracket | Owner-occupied | Renter-occupied |
| Less than $5,000 | 0 (0.0%) | 0 (0.0%) |
| $5,000 to $9,999 | 0 (0.0%) | 46 (100.0%) |
| $10,000 to $14,999 | 0 (0.0%) | 0 (0.0%) |
| $15,000 to $19,999 | 0 (0.0%) | 0 (0.0%) |
| $20,000 to $24,999 | 0 (0.0%) | 0 (0.0%) |
| $25,000 to $34,999 | 18 (56.2%) | 0 (0.0%) |
| $35,000 to $49,999 | 0 (0.0%) | 0 (0.0%) |
| $50,000 to $74,999 | 14 (43.8%) | 0 (0.0%) |
| $75,000 to $99,999 | 0 (0.0%) | 0 (0.0%) |
| $100,000 to $149,999 | 0 (0.0%) | 0 (0.0%) |
| $150,000 or more | 0 (0.0%) | 0 (0.0%) |
| Total | 32 (100.0%) | 46 (100.0%) |
Monthly Housing Cost Tiers in Wet Camp Village
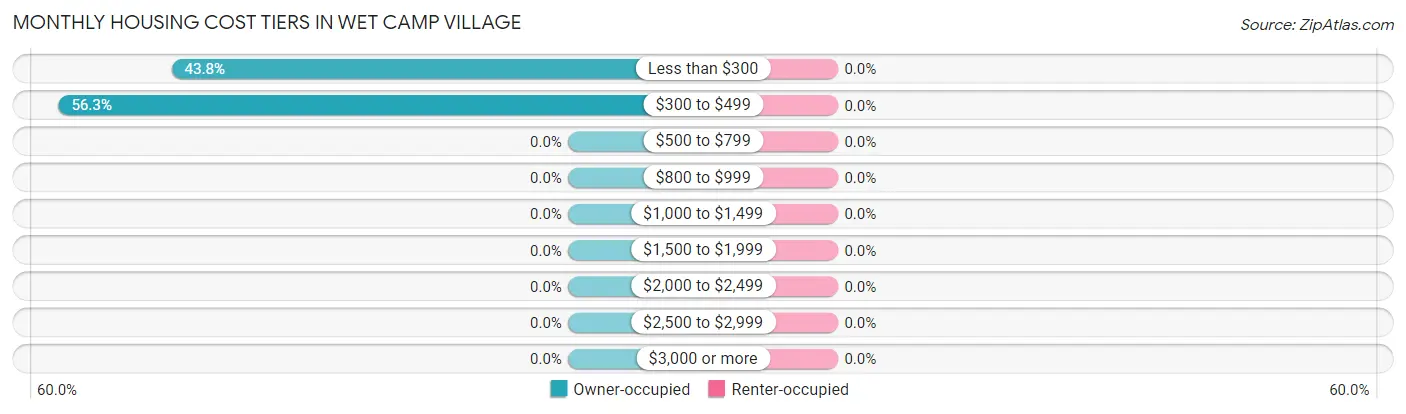
| Monthly Cost | Owner-occupied | Renter-occupied |
| Less than $300 | 14 (43.8%) | 0 (0.0%) |
| $300 to $499 | 18 (56.2%) | 0 (0.0%) |
| $500 to $799 | 0 (0.0%) | 0 (0.0%) |
| $800 to $999 | 0 (0.0%) | 0 (0.0%) |
| $1,000 to $1,499 | 0 (0.0%) | 0 (0.0%) |
| $1,500 to $1,999 | 0 (0.0%) | 0 (0.0%) |
| $2,000 to $2,499 | 0 (0.0%) | 0 (0.0%) |
| $2,500 to $2,999 | 0 (0.0%) | 0 (0.0%) |
| $3,000 or more | 0 (0.0%) | 0 (0.0%) |
| Total | 32 (100.0%) | 46 (100.0%) |
Physical Housing Characteristics in Wet Camp Village
Housing Structures in Wet Camp Village
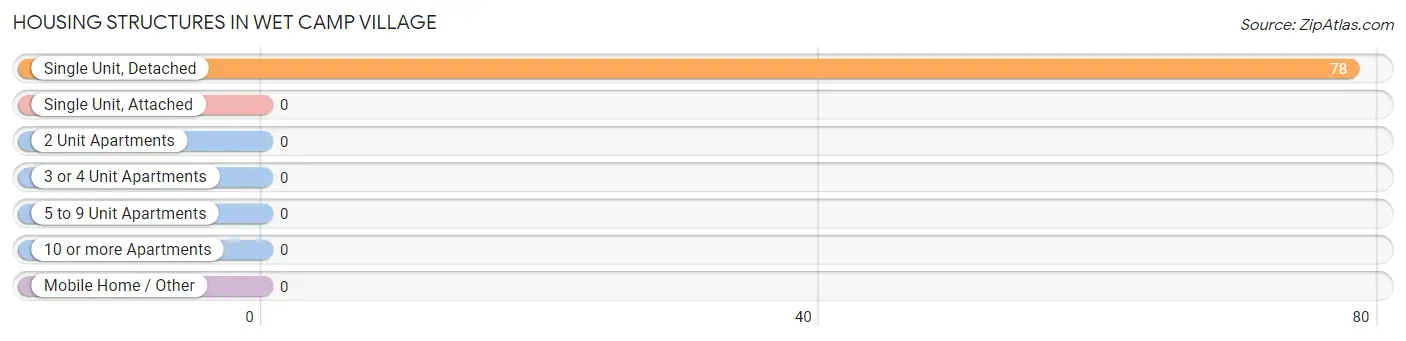
| Structure Type | # Housing Units | % Housing Units |
| Single Unit, Detached | 78 | 100.0% |
| Single Unit, Attached | 0 | 0.0% |
| 2 Unit Apartments | 0 | 0.0% |
| 3 or 4 Unit Apartments | 0 | 0.0% |
| 5 to 9 Unit Apartments | 0 | 0.0% |
| 10 or more Apartments | 0 | 0.0% |
| Mobile Home / Other | 0 | 0.0% |
| Total | 78 | 100.0% |
Housing Structures by Occupancy in Wet Camp Village
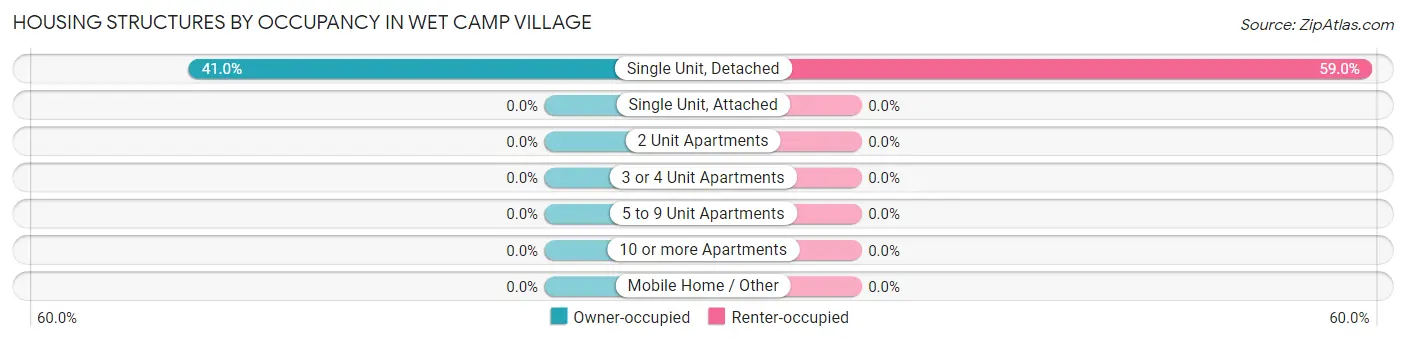
| Structure Type | Owner-occupied | Renter-occupied |
| Single Unit, Detached | 32 (41.0%) | 46 (59.0%) |
| Single Unit, Attached | 0 (0.0%) | 0 (0.0%) |
| 2 Unit Apartments | 0 (0.0%) | 0 (0.0%) |
| 3 or 4 Unit Apartments | 0 (0.0%) | 0 (0.0%) |
| 5 to 9 Unit Apartments | 0 (0.0%) | 0 (0.0%) |
| 10 or more Apartments | 0 (0.0%) | 0 (0.0%) |
| Mobile Home / Other | 0 (0.0%) | 0 (0.0%) |
| Total | 32 (41.0%) | 46 (59.0%) |
Housing Structures by Number of Rooms in Wet Camp Village
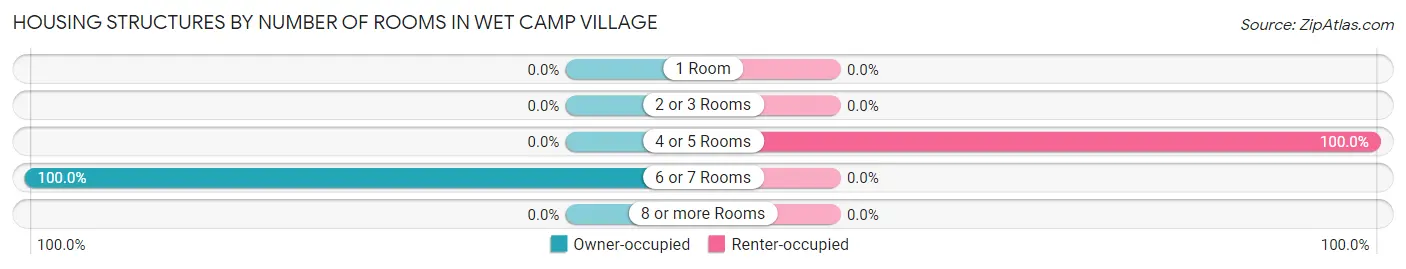
| Number of Rooms | Owner-occupied | Renter-occupied |
| 1 Room | 0 (0.0%) | 0 (0.0%) |
| 2 or 3 Rooms | 0 (0.0%) | 0 (0.0%) |
| 4 or 5 Rooms | 0 (0.0%) | 46 (100.0%) |
| 6 or 7 Rooms | 32 (100.0%) | 0 (0.0%) |
| 8 or more Rooms | 0 (0.0%) | 0 (0.0%) |
| Total | 32 (100.0%) | 46 (100.0%) |
Housing Structure by Heating Type in Wet Camp Village
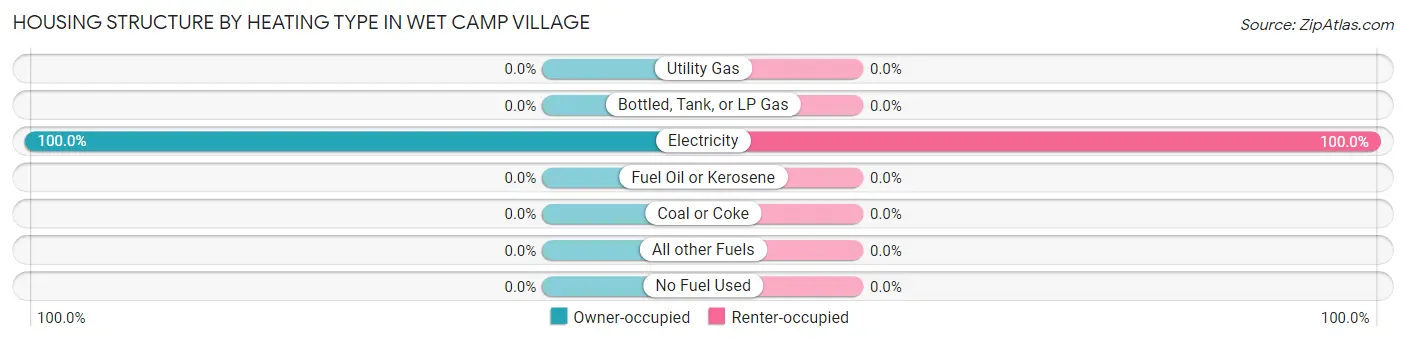
| Heating Type | Owner-occupied | Renter-occupied |
| Utility Gas | 0 (0.0%) | 0 (0.0%) |
| Bottled, Tank, or LP Gas | 0 (0.0%) | 0 (0.0%) |
| Electricity | 32 (100.0%) | 46 (100.0%) |
| Fuel Oil or Kerosene | 0 (0.0%) | 0 (0.0%) |
| Coal or Coke | 0 (0.0%) | 0 (0.0%) |
| All other Fuels | 0 (0.0%) | 0 (0.0%) |
| No Fuel Used | 0 (0.0%) | 0 (0.0%) |
| Total | 32 (100.0%) | 46 (100.0%) |
Household Vehicle Usage in Wet Camp Village
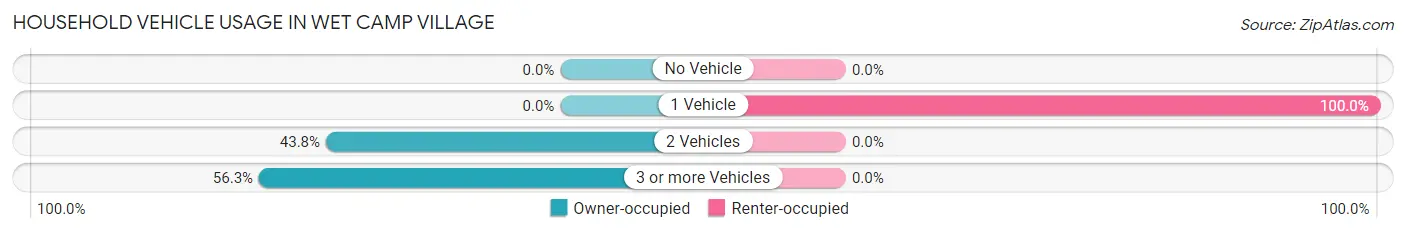
| Vehicles per Household | Owner-occupied | Renter-occupied |
| No Vehicle | 0 (0.0%) | 0 (0.0%) |
| 1 Vehicle | 0 (0.0%) | 46 (100.0%) |
| 2 Vehicles | 14 (43.8%) | 0 (0.0%) |
| 3 or more Vehicles | 18 (56.2%) | 0 (0.0%) |
| Total | 32 (100.0%) | 46 (100.0%) |
Real Estate & Mortgages in Wet Camp Village
Real Estate and Mortgage Overview in Wet Camp Village
| Characteristic | Without Mortgage | With Mortgage |
| Housing Units | 32 | 0 |
| Median Property Value | - | - |
| Median Household Income | - | - |
| Monthly Housing Costs | - | - |
| Real Estate Taxes | - | - |
Property Value by Mortgage Status in Wet Camp Village
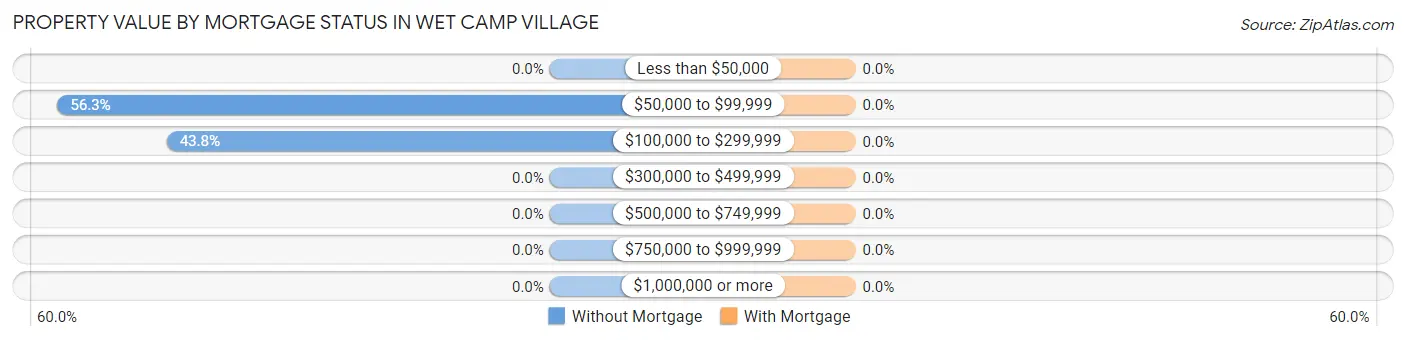
| Property Value | Without Mortgage | With Mortgage |
| Less than $50,000 | 0 (0.0%) | 0 (0.0%) |
| $50,000 to $99,999 | 18 (56.2%) | 0 (0.0%) |
| $100,000 to $299,999 | 14 (43.8%) | 0 (0.0%) |
| $300,000 to $499,999 | 0 (0.0%) | 0 (0.0%) |
| $500,000 to $749,999 | 0 (0.0%) | 0 (0.0%) |
| $750,000 to $999,999 | 0 (0.0%) | 0 (0.0%) |
| $1,000,000 or more | 0 (0.0%) | 0 (0.0%) |
| Total | 32 (100.0%) | 0 (0.0%) |
Household Income by Mortgage Status in Wet Camp Village
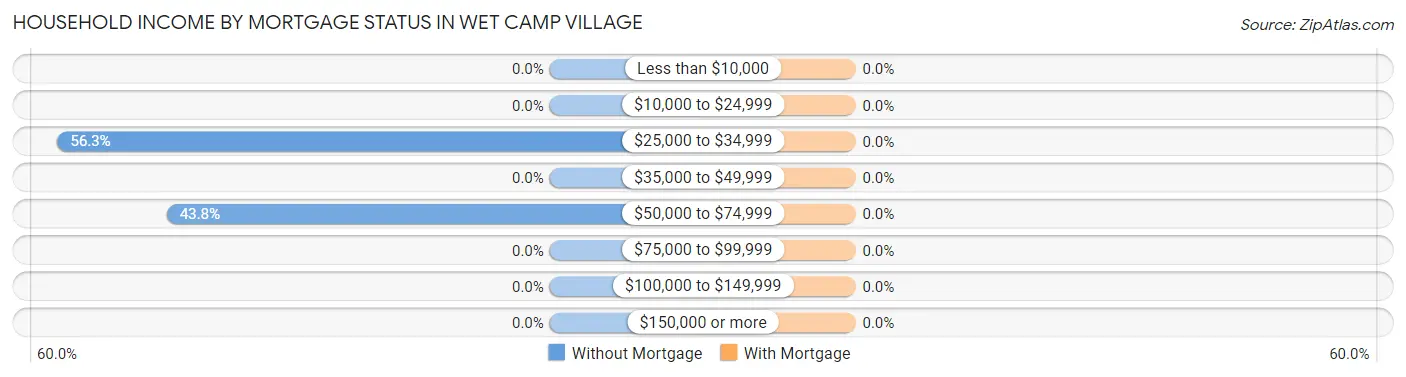
| Household Income | Without Mortgage | With Mortgage |
| Less than $10,000 | 0 (0.0%) | 0 (0.0%) |
| $10,000 to $24,999 | 0 (0.0%) | 0 (0.0%) |
| $25,000 to $34,999 | 18 (56.2%) | 0 (0.0%) |
| $35,000 to $49,999 | 0 (0.0%) | 0 (0.0%) |
| $50,000 to $74,999 | 14 (43.8%) | 0 (0.0%) |
| $75,000 to $99,999 | 0 (0.0%) | 0 (0.0%) |
| $100,000 to $149,999 | 0 (0.0%) | 0 (0.0%) |
| $150,000 or more | 0 (0.0%) | 0 (0.0%) |
| Total | 32 (100.0%) | 0 (0.0%) |
Property Value to Household Income Ratio in Wet Camp Village
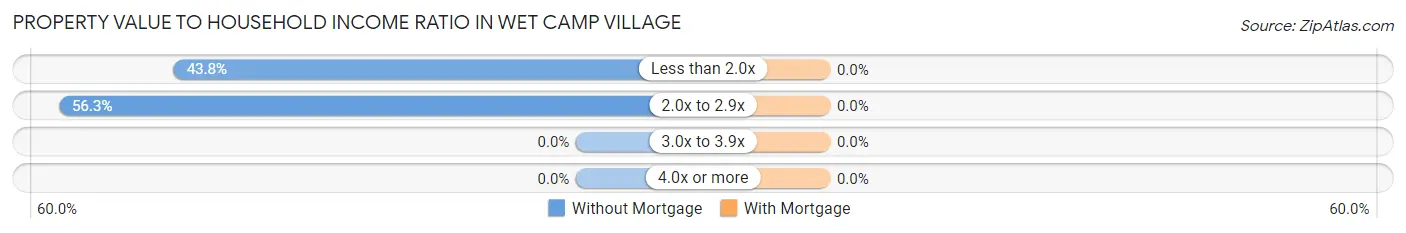
| Value-to-Income Ratio | Without Mortgage | With Mortgage |
| Less than 2.0x | 14 (43.8%) | 0 (0.0%) |
| 2.0x to 2.9x | 18 (56.2%) | 0 (0.0%) |
| 3.0x to 3.9x | 0 (0.0%) | 0 (0.0%) |
| 4.0x or more | 0 (0.0%) | 0 (0.0%) |
| Total | 32 (100.0%) | 0 (0.0%) |
Real Estate Taxes by Mortgage Status in Wet Camp Village
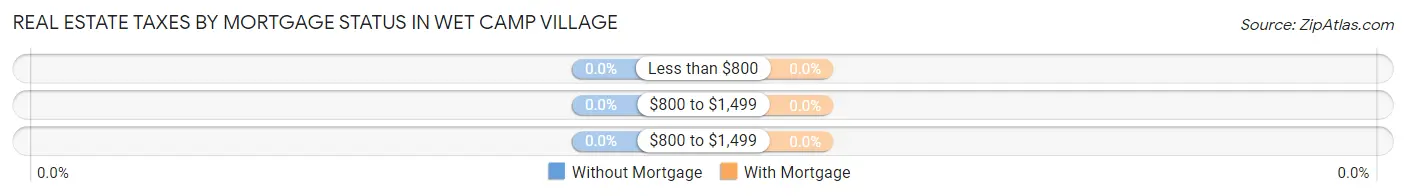
| Property Taxes | Without Mortgage | With Mortgage |
| Less than $800 | 0 (0.0%) | 0 (0.0%) |
| $800 to $1,499 | 0 (0.0%) | 0 (0.0%) |
| $800 to $1,499 | 0 (0.0%) | 0 (0.0%) |
| Total | 32 (100.0%) | 0 (0.0%) |
Health & Disability in Wet Camp Village
Health Insurance Coverage by Age in Wet Camp Village
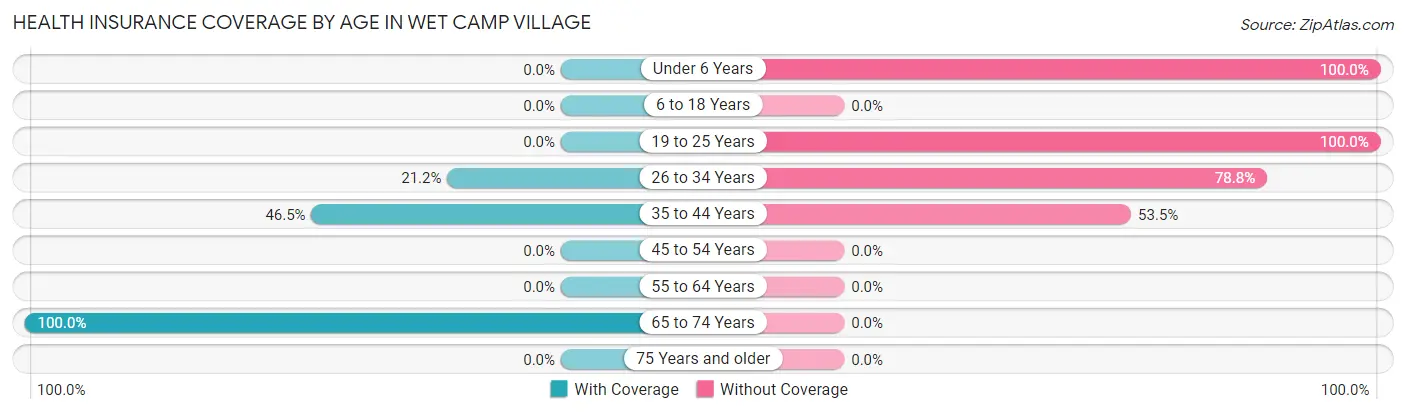
| Age Bracket | With Coverage | Without Coverage |
| Under 6 Years | 0 (0.0%) | 12 (100.0%) |
| 6 to 18 Years | 0 (0.0%) | 0 (0.0%) |
| 19 to 25 Years | 0 (0.0%) | 17 (100.0%) |
| 26 to 34 Years | 18 (21.2%) | 67 (78.8%) |
| 35 to 44 Years | 20 (46.5%) | 23 (53.5%) |
| 45 to 54 Years | 0 (0.0%) | 0 (0.0%) |
| 55 to 64 Years | 0 (0.0%) | 0 (0.0%) |
| 65 to 74 Years | 14 (100.0%) | 0 (0.0%) |
| 75 Years and older | 0 (0.0%) | 0 (0.0%) |
| Total | 52 (30.4%) | 119 (69.6%) |
Health Insurance Coverage by Citizenship Status in Wet Camp Village
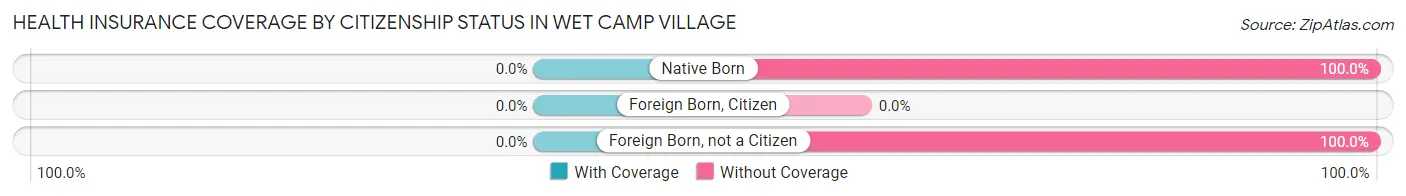
| Citizenship Status | With Coverage | Without Coverage |
| Native Born | 0 (0.0%) | 12 (100.0%) |
| Foreign Born, Citizen | 0 (0.0%) | 0 (0.0%) |
| Foreign Born, not a Citizen | 0 (0.0%) | 17 (100.0%) |
Health Insurance Coverage by Household Income in Wet Camp Village
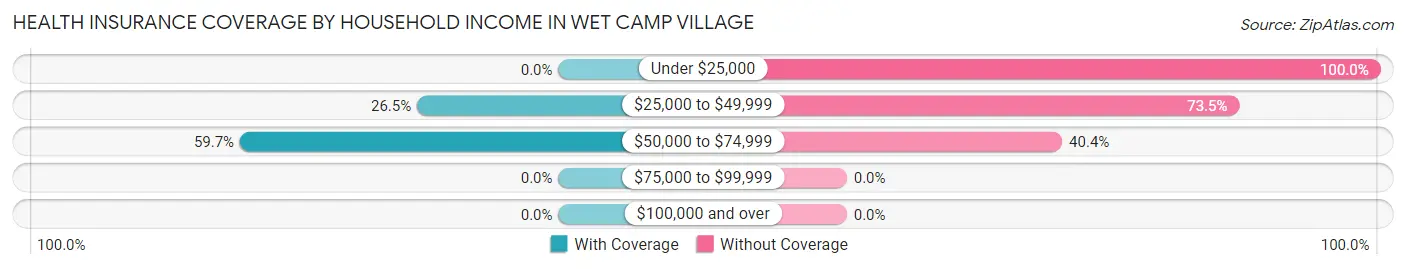
| Household Income | With Coverage | Without Coverage |
| Under $25,000 | 0 (0.0%) | 46 (100.0%) |
| $25,000 to $49,999 | 18 (26.5%) | 50 (73.5%) |
| $50,000 to $74,999 | 34 (59.7%) | 23 (40.4%) |
| $75,000 to $99,999 | 0 (0.0%) | 0 (0.0%) |
| $100,000 and over | 0 (0.0%) | 0 (0.0%) |
Public vs Private Health Insurance Coverage by Age in Wet Camp Village
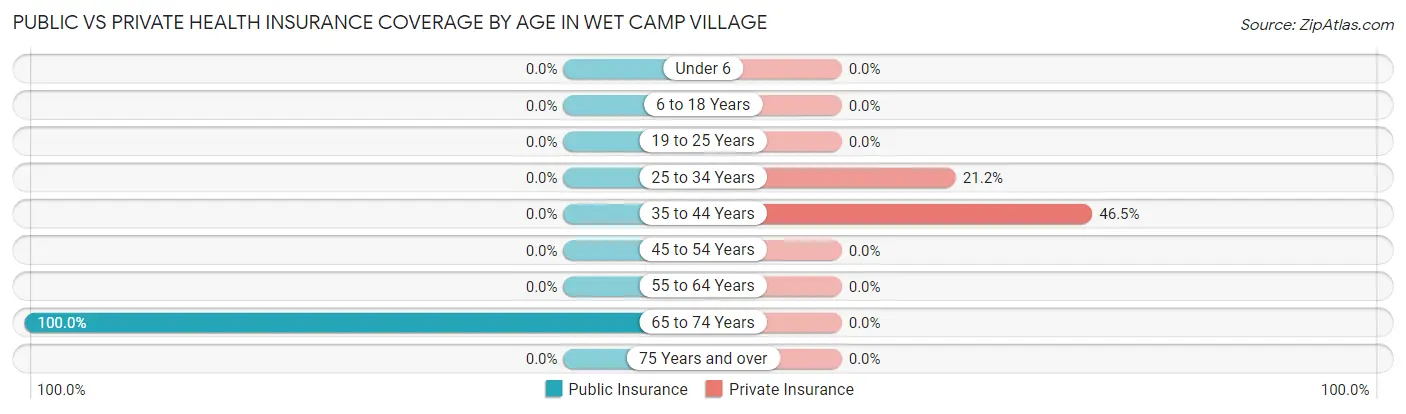
| Age Bracket | Public Insurance | Private Insurance |
| Under 6 | 0 (0.0%) | 0 (0.0%) |
| 6 to 18 Years | 0 (0.0%) | 0 (0.0%) |
| 19 to 25 Years | 0 (0.0%) | 0 (0.0%) |
| 25 to 34 Years | 0 (0.0%) | 18 (21.2%) |
| 35 to 44 Years | 0 (0.0%) | 20 (46.5%) |
| 45 to 54 Years | 0 (0.0%) | 0 (0.0%) |
| 55 to 64 Years | 0 (0.0%) | 0 (0.0%) |
| 65 to 74 Years | 14 (100.0%) | 0 (0.0%) |
| 75 Years and over | 0 (0.0%) | 0 (0.0%) |
| Total | 14 (8.2%) | 38 (22.2%) |
Disability Status by Sex by Age in Wet Camp Village
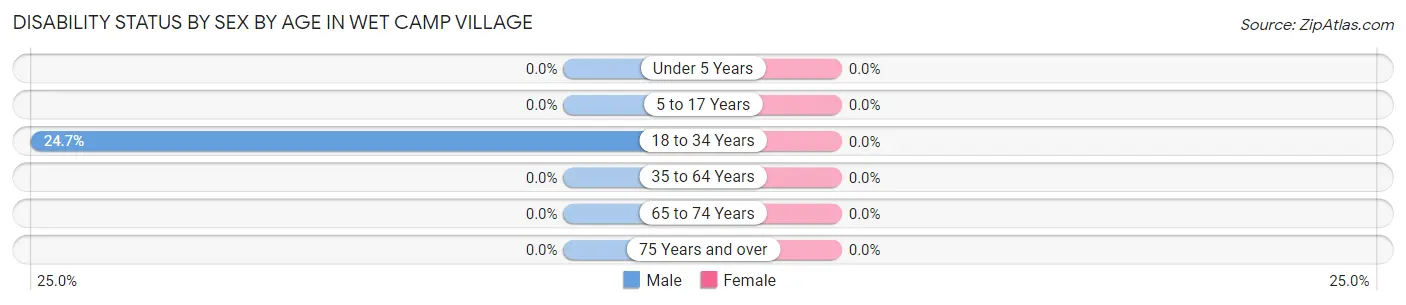
| Age Bracket | Male | Female |
| Under 5 Years | 0 (0.0%) | 0 (0.0%) |
| 5 to 17 Years | 0 (0.0%) | 0 (0.0%) |
| 18 to 34 Years | 21 (24.7%) | 0 (0.0%) |
| 35 to 64 Years | 0 (0.0%) | 0 (0.0%) |
| 65 to 74 Years | 0 (0.0%) | 0 (0.0%) |
| 75 Years and over | 0 (0.0%) | 0 (0.0%) |
Disability Class by Sex by Age in Wet Camp Village
Disability Class: Hearing Difficulty
| Age Bracket | Male | Female |
| Under 5 Years | 0 (0.0%) | 0 (0.0%) |
| 5 to 17 Years | 0 (0.0%) | 0 (0.0%) |
| 18 to 34 Years | 0 (0.0%) | 0 (0.0%) |
| 35 to 64 Years | 0 (0.0%) | 0 (0.0%) |
| 65 to 74 Years | 0 (0.0%) | 0 (0.0%) |
| 75 Years and over | 0 (0.0%) | 0 (0.0%) |
Disability Class: Vision Difficulty
| Age Bracket | Male | Female |
| Under 5 Years | 0 (0.0%) | 0 (0.0%) |
| 5 to 17 Years | 0 (0.0%) | 0 (0.0%) |
| 18 to 34 Years | 0 (0.0%) | 0 (0.0%) |
| 35 to 64 Years | 0 (0.0%) | 0 (0.0%) |
| 65 to 74 Years | 0 (0.0%) | 0 (0.0%) |
| 75 Years and over | 0 (0.0%) | 0 (0.0%) |
Disability Class: Cognitive Difficulty
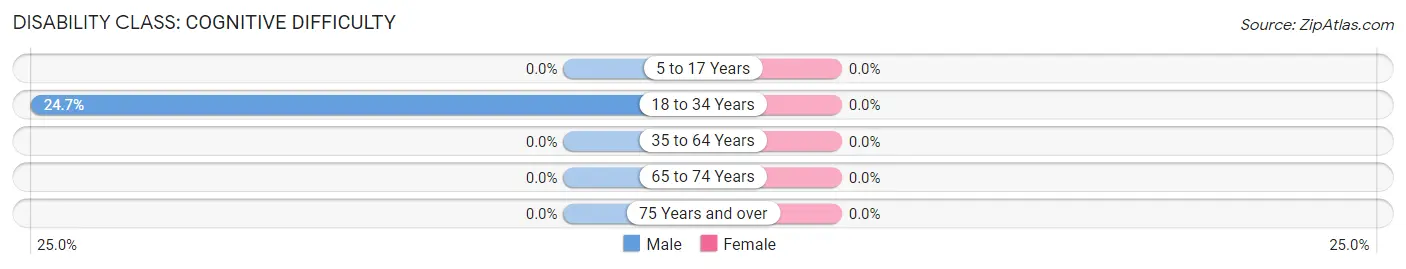
| Age Bracket | Male | Female |
| 5 to 17 Years | 0 (0.0%) | 0 (0.0%) |
| 18 to 34 Years | 21 (24.7%) | 0 (0.0%) |
| 35 to 64 Years | 0 (0.0%) | 0 (0.0%) |
| 65 to 74 Years | 0 (0.0%) | 0 (0.0%) |
| 75 Years and over | 0 (0.0%) | 0 (0.0%) |
Disability Class: Ambulatory Difficulty
| Age Bracket | Male | Female |
| 5 to 17 Years | 0 (0.0%) | 0 (0.0%) |
| 18 to 34 Years | 0 (0.0%) | 0 (0.0%) |
| 35 to 64 Years | 0 (0.0%) | 0 (0.0%) |
| 65 to 74 Years | 0 (0.0%) | 0 (0.0%) |
| 75 Years and over | 0 (0.0%) | 0 (0.0%) |
Disability Class: Self-Care Difficulty
| Age Bracket | Male | Female |
| 5 to 17 Years | 0 (0.0%) | 0 (0.0%) |
| 18 to 34 Years | 0 (0.0%) | 0 (0.0%) |
| 35 to 64 Years | 0 (0.0%) | 0 (0.0%) |
| 65 to 74 Years | 0 (0.0%) | 0 (0.0%) |
| 75 Years and over | 0 (0.0%) | 0 (0.0%) |
Technology Access in Wet Camp Village
Computing Device Access in Wet Camp Village
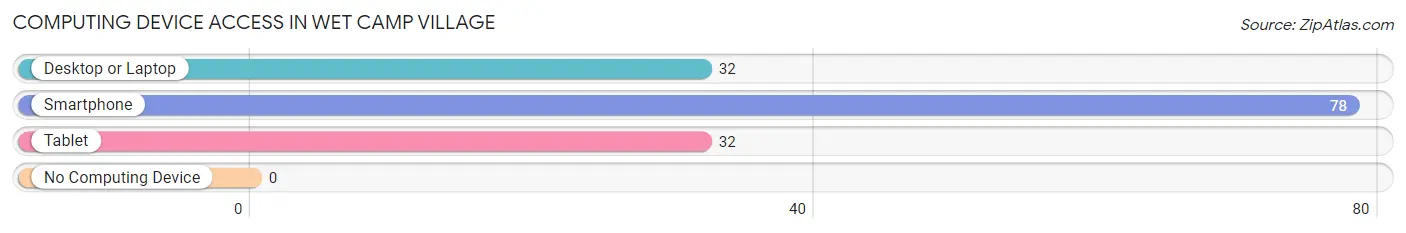
| Device Type | # Households | % Households |
| Desktop or Laptop | 32 | 41.0% |
| Smartphone | 78 | 100.0% |
| Tablet | 32 | 41.0% |
| No Computing Device | 0 | 0.0% |
| Total | 78 | 100.0% |
Internet Access in Wet Camp Village
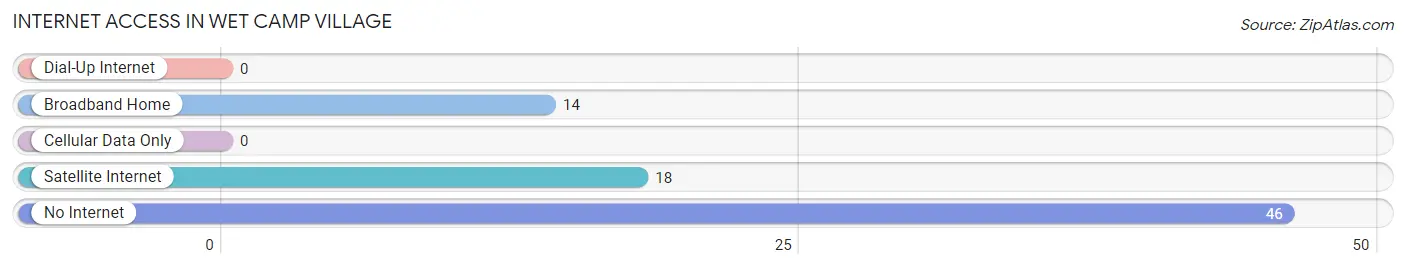
| Internet Type | # Households | % Households |
| Dial-Up Internet | 0 | 0.0% |
| Broadband Home | 14 | 17.9% |
| Cellular Data Only | 0 | 0.0% |
| Satellite Internet | 18 | 23.1% |
| No Internet | 46 | 59.0% |
| Total | 78 | 100.0% |
Wet Camp Village Summary
Wet Camp Village is a small unincorporated community located in the Gila River Indian Reservation in Maricopa County, Arizona. It is located approximately 25 miles south of Phoenix and is home to the Akimel O’odham and Pee-Posh people. The population of Wet Camp Village was estimated to be around 1,000 in 2000.
History
The area that is now known as Wet Camp Village has been inhabited by the Akimel O’odham and Pee-Posh people for centuries. The Akimel O’odham are the original inhabitants of the area and are believed to have been living in the area since the 13th century. The Pee-Posh people are believed to have migrated to the area in the late 18th century.
The area was first settled by non-Native Americans in the late 19th century. The settlement was originally known as “Wet Camp” and was established as a stagecoach stop along the Gila River. The settlement was later renamed “Wet Camp Village” in the early 20th century.
Geography
Wet Camp Village is located in the Gila River Indian Reservation in Maricopa County, Arizona. It is located approximately 25 miles south of Phoenix. The area is mostly flat and is surrounded by desert. The climate is hot and dry with temperatures reaching up to 110 degrees Fahrenheit in the summer months.
Economy
The economy of Wet Camp Village is largely based on agriculture. The area is home to several farms that produce a variety of crops including cotton, alfalfa, and melons. The area is also home to several small businesses including convenience stores, restaurants, and gas stations.
Demographics
The population of Wet Camp Village was estimated to be around 1,000 in 2000. The majority of the population is Native American, with the Akimel O’odham and Pee-Posh people making up the majority of the population. The population is also diverse, with people of Hispanic, African American, and Asian descent also living in the area. The median household income in Wet Camp Village is $25,000.
Common Questions
What is Per Capita Income in Wet Camp Village?
Per Capita income in Wet Camp Village is $11,402.
What is Inequality or Gini Index in Wet Camp Village?
Inequality or Gini Index in Wet Camp Village is 0.47.
What is the Total Population of Wet Camp Village?
Total Population of Wet Camp Village is 171.
What is the Total Male Population of Wet Camp Village?
Total Male Population of Wet Camp Village is 120.
What is the Total Female Population of Wet Camp Village?
Total Female Population of Wet Camp Village is 51.
What is the Ratio of Males per 100 Females in Wet Camp Village?
There are 235.29 Males per 100 Females in Wet Camp Village.
What is the Ratio of Females per 100 Males in Wet Camp Village?
There are 42.50 Females per 100 Males in Wet Camp Village.
What is the Median Population Age in Wet Camp Village?
Median Population Age in Wet Camp Village is 31.4 Years.
What is the Average Family Size in Wet Camp Village
Average Family Size in Wet Camp Village is 3.4 People.
What is the Average Household Size in Wet Camp Village
Average Household Size in Wet Camp Village is 2.2 People.
How Large is the Labor Force in Wet Camp Village?
There are 145 People in the Labor Forcein in Wet Camp Village.
What is the Percentage of People in the Labor Force in Wet Camp Village?
91.2% of People are in the Labor Force in Wet Camp Village.
What is the Unemployment Rate in Wet Camp Village?
Unemployment Rate in Wet Camp Village is 27.6%.