Flowing Wells, AZ Map & Demographics
Flowing Wells Map
Flowing Wells Overview
$21,511
PER CAPITA INCOME
$46,775
AVG FAMILY INCOME
$37,092
AVG HOUSEHOLD INCOME
1.1%
WAGE / INCOME GAP [ % ]
98.9¢/ $1
WAGE / INCOME GAP [ $ ]
$8,492
FAMILY INCOME DEFICIT
0.42
INEQUALITY / GINI INDEX
17,188
TOTAL POPULATION
8,119
MALE POPULATION
9,069
FEMALE POPULATION
89.52
MALES / 100 FEMALES
111.70
FEMALES / 100 MALES
37.0
MEDIAN AGE
3.2
AVG FAMILY SIZE
2.5
AVG HOUSEHOLD SIZE
8,516
LABOR FORCE [ PEOPLE ]
62.8%
PERCENT IN LABOR FORCE
10.4%
UNEMPLOYMENT RATE
Income in Flowing Wells
Income Overview in Flowing Wells
Per Capita Income in Flowing Wells is $21,511, while median incomes of families and households are $46,775 and $37,092 respectively.
| Characteristic | Number | Measure |
| Per Capita Income | 17,188 | $21,511 |
| Median Family Income | 4,143 | $46,775 |
| Mean Family Income | 4,143 | $58,590 |
| Median Household Income | 6,951 | $37,092 |
| Mean Household Income | 6,951 | $51,502 |
| Income Deficit | 4,143 | $8,492 |
| Wage / Income Gap (%) | 17,188 | 1.12% |
| Wage / Income Gap ($) | 17,188 | 98.88¢ per $1 |
| Gini / Inequality Index | 17,188 | 0.42 |
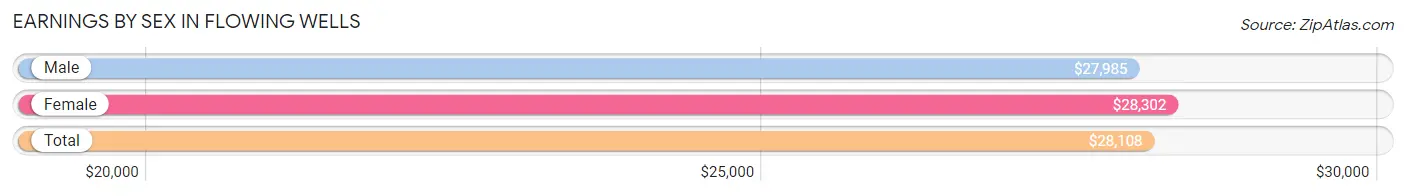
Earnings by Sex in Flowing Wells
Average Earnings in Flowing Wells are $28,108, $27,985 for men and $28,302 for women, a difference of 1.1%.
| Sex | Number | Average Earnings |
| Male | 4,462 (53.3%) | $27,985 |
| Female | 3,902 (46.7%) | $28,302 |
| Total | 8,364 (100.0%) | $28,108 |
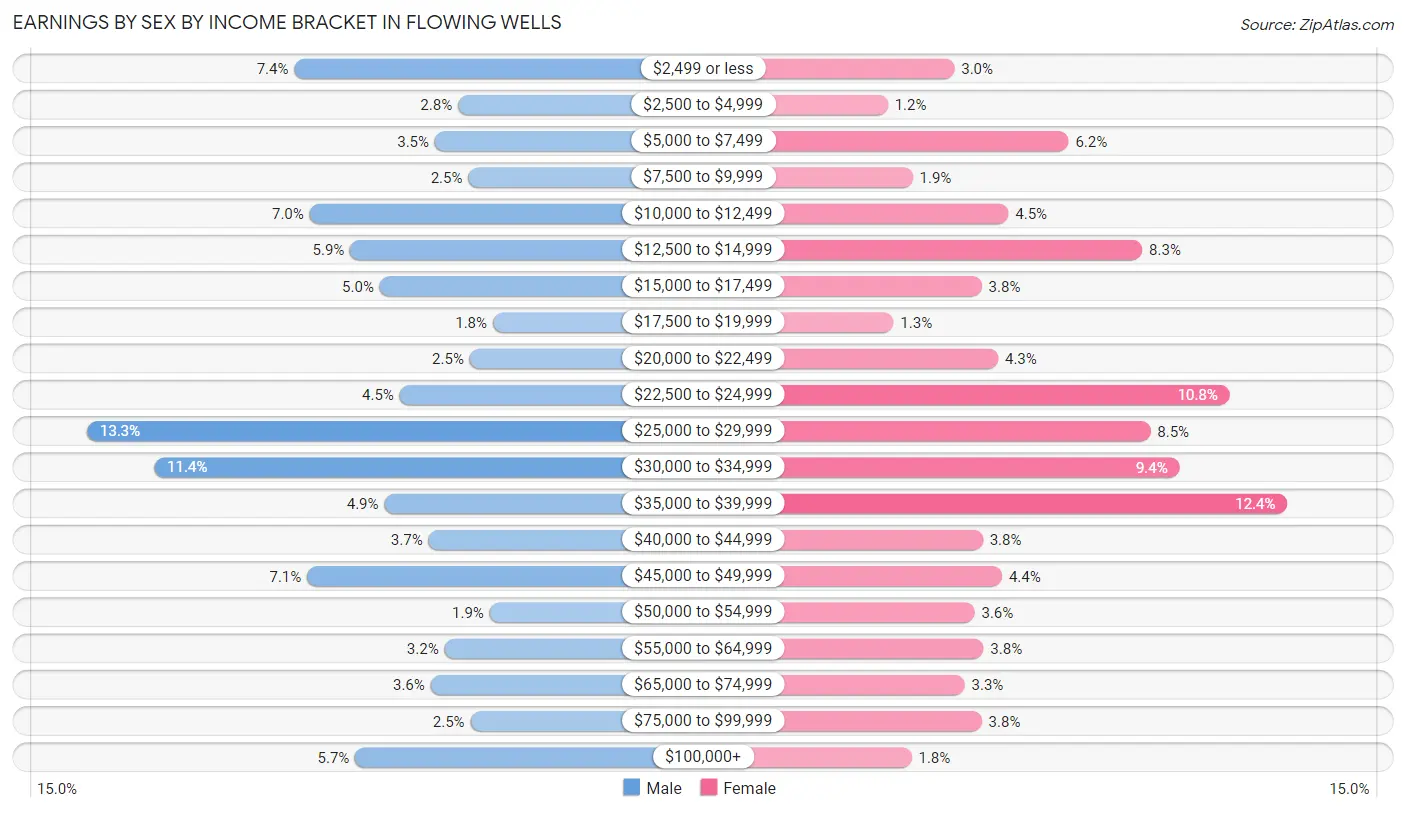
Earnings by Sex by Income Bracket in Flowing Wells
The most common earnings brackets in Flowing Wells are $25,000 to $29,999 for men (591 | 13.3%) and $35,000 to $39,999 for women (483 | 12.4%).
| Income | Male | Female |
| $2,499 or less | 331 (7.4%) | 118 (3.0%) |
| $2,500 to $4,999 | 126 (2.8%) | 45 (1.1%) |
| $5,000 to $7,499 | 155 (3.5%) | 243 (6.2%) |
| $7,500 to $9,999 | 113 (2.5%) | 72 (1.8%) |
| $10,000 to $12,499 | 312 (7.0%) | 177 (4.5%) |
| $12,500 to $14,999 | 261 (5.9%) | 324 (8.3%) |
| $15,000 to $17,499 | 224 (5.0%) | 148 (3.8%) |
| $17,500 to $19,999 | 82 (1.8%) | 51 (1.3%) |
| $20,000 to $22,499 | 111 (2.5%) | 166 (4.3%) |
| $22,500 to $24,999 | 199 (4.5%) | 420 (10.8%) |
| $25,000 to $29,999 | 591 (13.3%) | 333 (8.5%) |
| $30,000 to $34,999 | 507 (11.4%) | 365 (9.3%) |
| $35,000 to $39,999 | 218 (4.9%) | 483 (12.4%) |
| $40,000 to $44,999 | 163 (3.6%) | 149 (3.8%) |
| $45,000 to $49,999 | 315 (7.1%) | 170 (4.4%) |
| $50,000 to $54,999 | 86 (1.9%) | 140 (3.6%) |
| $55,000 to $64,999 | 143 (3.2%) | 150 (3.8%) |
| $65,000 to $74,999 | 160 (3.6%) | 129 (3.3%) |
| $75,000 to $99,999 | 110 (2.5%) | 148 (3.8%) |
| $100,000+ | 255 (5.7%) | 71 (1.8%) |
| Total | 4,462 (100.0%) | 3,902 (100.0%) |
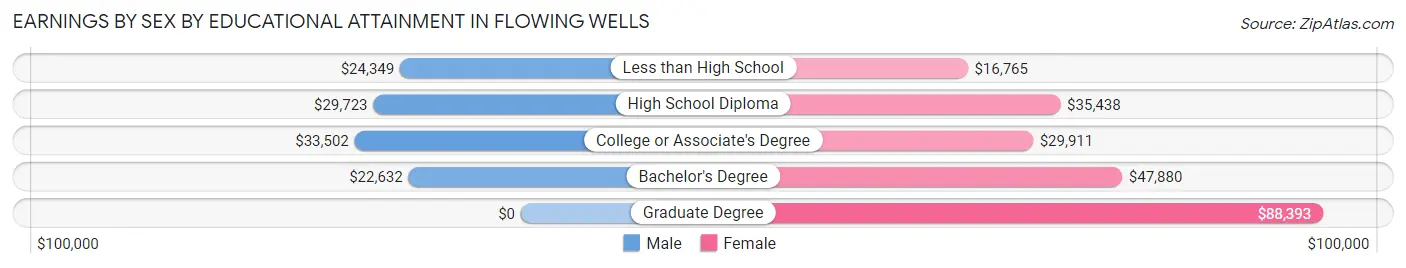
Earnings by Sex by Educational Attainment in Flowing Wells
Average earnings in Flowing Wells are $28,874 for men and $31,155 for women, a difference of 7.3%. Men with an educational attainment of college or associate's degree enjoy the highest average annual earnings of $33,502, while those with bachelor's degree education earn the least with $22,632. Women with an educational attainment of graduate degree earn the most with the average annual earnings of $88,393, while those with less than high school education have the smallest earnings of $16,765.
| Educational Attainment | Male Income | Female Income |
| Less than High School | $24,349 | $16,765 |
| High School Diploma | $29,723 | $35,438 |
| College or Associate's Degree | $33,502 | $29,911 |
| Bachelor's Degree | $22,632 | $47,880 |
| Graduate Degree | - | - |
| Total | $28,874 | $31,155 |
Family Income in Flowing Wells
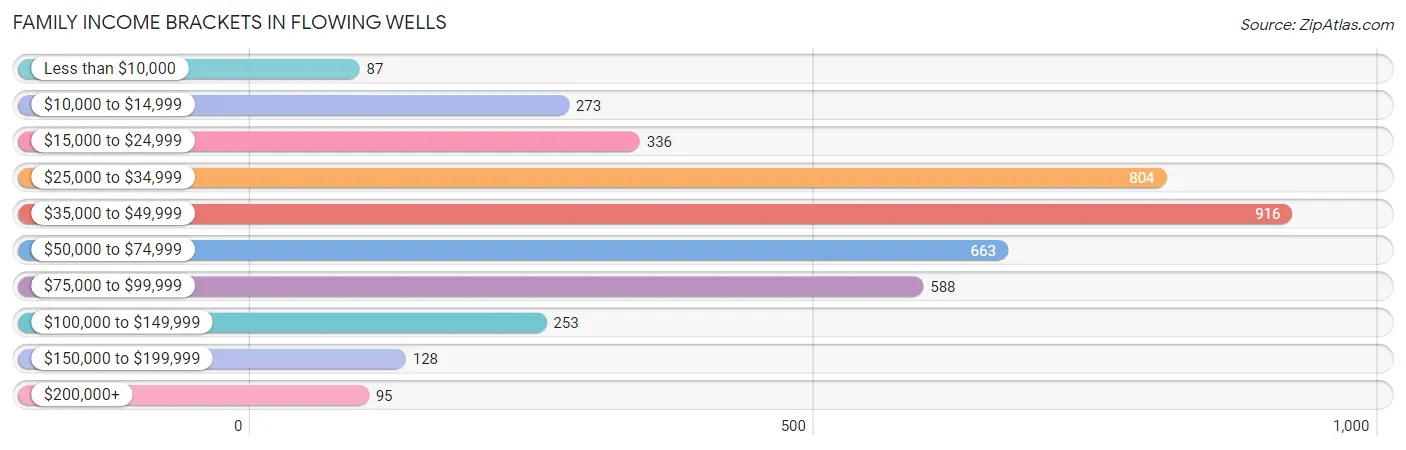
Family Income Brackets in Flowing Wells
According to the Flowing Wells family income data, there are 916 families falling into the $35,000 to $49,999 income range, which is the most common income bracket and makes up 22.1% of all families. Conversely, the less than $10,000 income bracket is the least frequent group with only 87 families (2.1%) belonging to this category.
| Income Bracket | # Families | % Families |
| Less than $10,000 | 87 | 2.1% |
| $10,000 to $14,999 | 273 | 6.6% |
| $15,000 to $24,999 | 336 | 8.1% |
| $25,000 to $34,999 | 804 | 19.4% |
| $35,000 to $49,999 | 916 | 22.1% |
| $50,000 to $74,999 | 663 | 16.0% |
| $75,000 to $99,999 | 588 | 14.2% |
| $100,000 to $149,999 | 253 | 6.1% |
| $150,000 to $199,999 | 128 | 3.1% |
| $200,000+ | 95 | 2.3% |
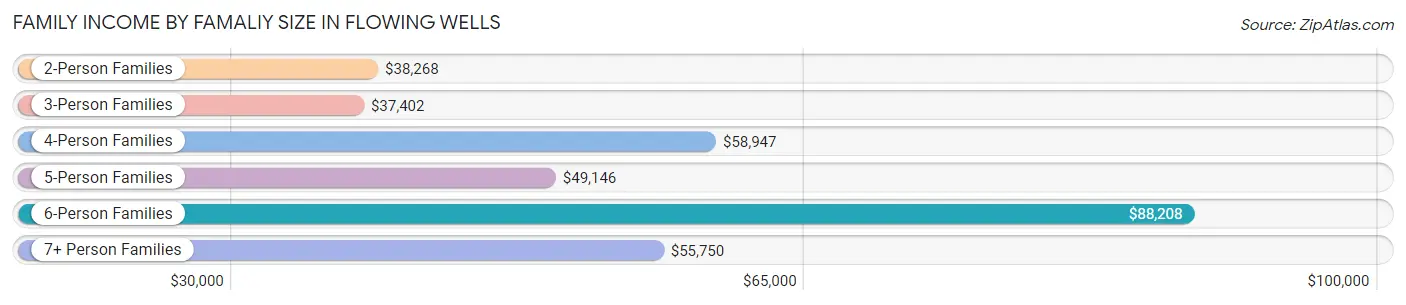
Family Income by Famaliy Size in Flowing Wells
6-person families (214 | 5.2%) account for the highest median family income in Flowing Wells with $88,208 per family, while 2-person families (1,829 | 44.2%) have the highest median income of $19,134 per family member.
| Income Bracket | # Families | Median Income |
| 2-Person Families | 1,829 (44.2%) | $38,268 |
| 3-Person Families | 1,024 (24.7%) | $37,402 |
| 4-Person Families | 728 (17.6%) | $58,947 |
| 5-Person Families | 320 (7.7%) | $49,146 |
| 6-Person Families | 214 (5.2%) | $88,208 |
| 7+ Person Families | 28 (0.7%) | $55,750 |
| Total | 4,143 (100.0%) | $46,775 |
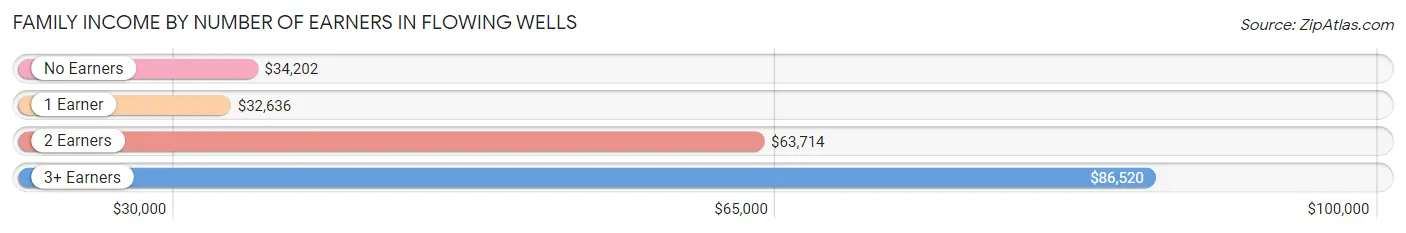
Family Income by Number of Earners in Flowing Wells
The median family income in Flowing Wells is $46,775, with families comprising 3+ earners (448) having the highest median family income of $86,520, while families with 1 earner (1,897) have the lowest median family income of $32,636, accounting for 10.8% and 45.8% of families, respectively.
| Number of Earners | # Families | Median Income |
| No Earners | 546 (13.2%) | $34,202 |
| 1 Earner | 1,897 (45.8%) | $32,636 |
| 2 Earners | 1,252 (30.2%) | $63,714 |
| 3+ Earners | 448 (10.8%) | $86,520 |
| Total | 4,143 (100.0%) | $46,775 |
Household Income in Flowing Wells
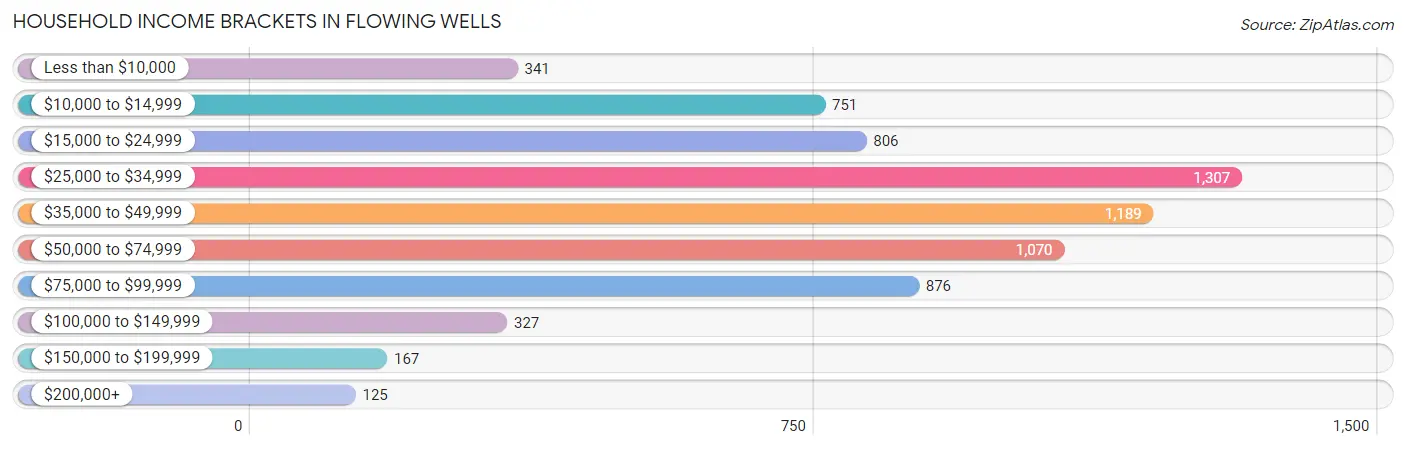
Household Income Brackets in Flowing Wells
With 1,307 households falling in the category, the $25,000 to $34,999 income range is the most frequent in Flowing Wells, accounting for 18.8% of all households. In contrast, only 125 households (1.8%) fall into the $200,000+ income bracket, making it the least populous group.
| Income Bracket | # Households | % Households |
| Less than $10,000 | 341 | 4.9% |
| $10,000 to $14,999 | 751 | 10.8% |
| $15,000 to $24,999 | 806 | 11.6% |
| $25,000 to $34,999 | 1,307 | 18.8% |
| $35,000 to $49,999 | 1,189 | 17.1% |
| $50,000 to $74,999 | 1,070 | 15.4% |
| $75,000 to $99,999 | 876 | 12.6% |
| $100,000 to $149,999 | 327 | 4.7% |
| $150,000 to $199,999 | 167 | 2.4% |
| $200,000+ | 125 | 1.8% |
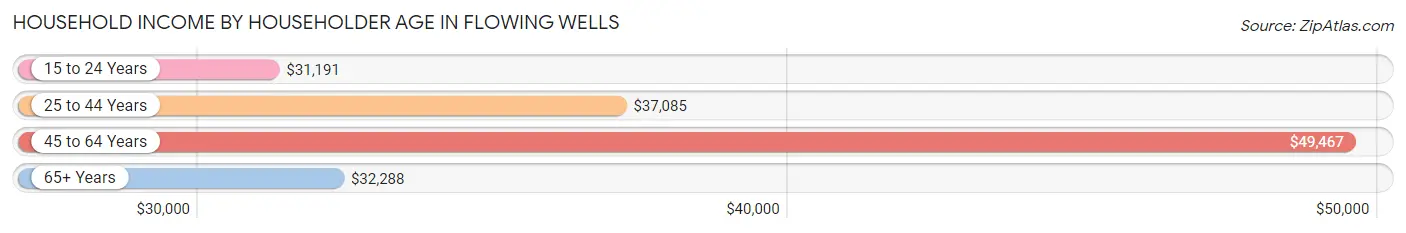
Household Income by Householder Age in Flowing Wells
The median household income in Flowing Wells is $37,092, with the highest median household income of $49,467 found in the 45 to 64 years age bracket for the primary householder. A total of 2,652 households (38.2%) fall into this category. Meanwhile, the 15 to 24 years age bracket for the primary householder has the lowest median household income of $31,191, with 508 households (7.3%) in this group.
| Income Bracket | # Households | Median Income |
| 15 to 24 Years | 508 (7.3%) | $31,191 |
| 25 to 44 Years | 1,899 (27.3%) | $37,085 |
| 45 to 64 Years | 2,652 (38.2%) | $49,467 |
| 65+ Years | 1,892 (27.2%) | $32,288 |
| Total | 6,951 (100.0%) | $37,092 |
Poverty in Flowing Wells
Income Below Poverty by Sex and Age in Flowing Wells
With 23.7% poverty level for males and 21.0% for females among the residents of Flowing Wells, under 5 year old males and 35 to 44 year old females are the most vulnerable to poverty, with 349 males (56.1%) and 402 females (37.9%) in their respective age groups living below the poverty level.
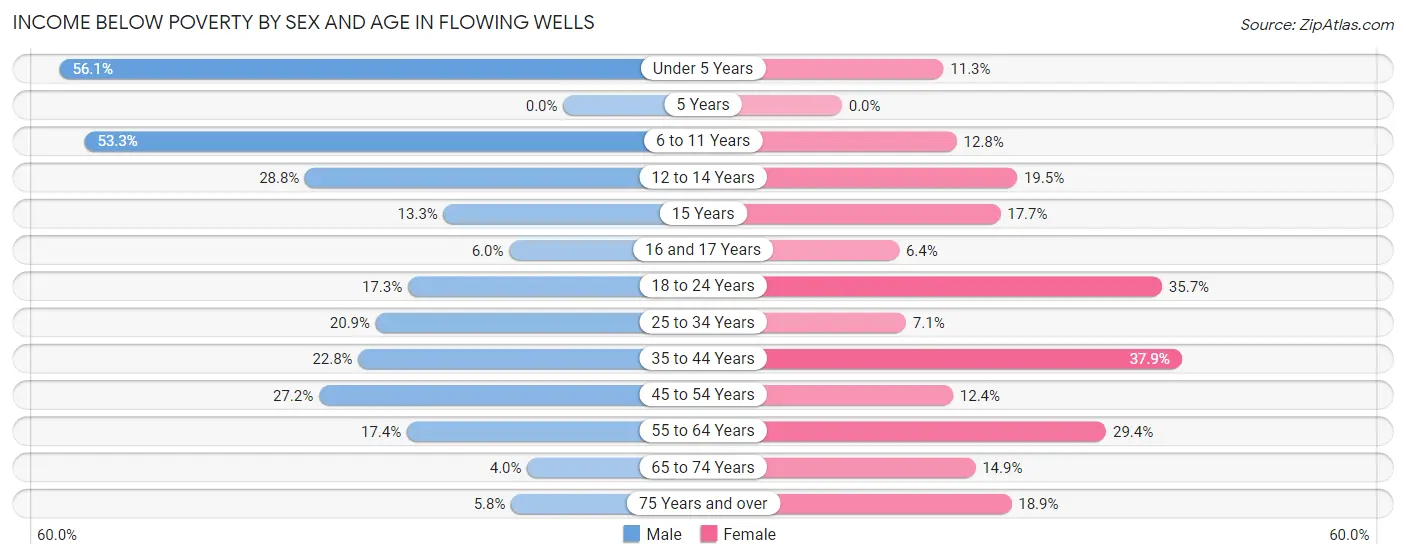
| Age Bracket | Male | Female |
| Under 5 Years | 349 (56.1%) | 56 (11.3%) |
| 5 Years | 0 (0.0%) | 0 (0.0%) |
| 6 to 11 Years | 344 (53.3%) | 109 (12.8%) |
| 12 to 14 Years | 90 (28.7%) | 87 (19.5%) |
| 15 Years | 24 (13.3%) | 6 (17.6%) |
| 16 and 17 Years | 15 (6.0%) | 13 (6.4%) |
| 18 to 24 Years | 178 (17.3%) | 370 (35.6%) |
| 25 to 34 Years | 204 (20.9%) | 69 (7.1%) |
| 35 to 44 Years | 194 (22.8%) | 402 (37.9%) |
| 45 to 54 Years | 320 (27.2%) | 128 (12.4%) |
| 55 to 64 Years | 149 (17.4%) | 400 (29.4%) |
| 65 to 74 Years | 33 (4.0%) | 115 (14.9%) |
| 75 Years and over | 22 (5.8%) | 148 (18.9%) |
| Total | 1,922 (23.7%) | 1,903 (21.0%) |
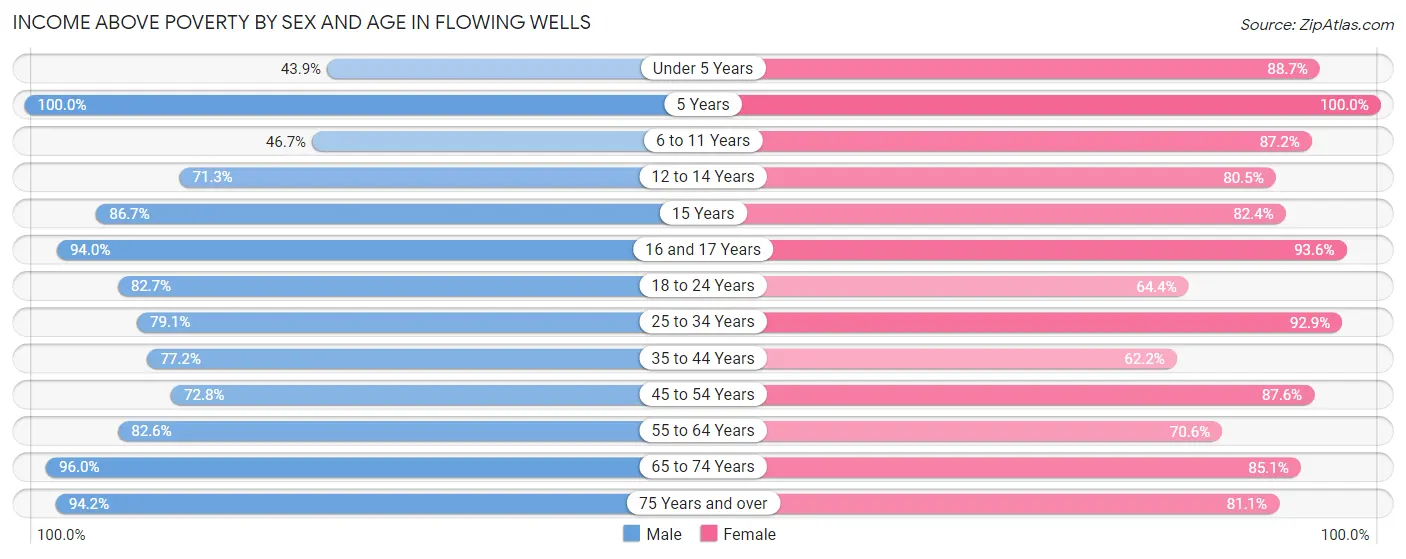
Income Above Poverty by Sex and Age in Flowing Wells
According to the poverty statistics in Flowing Wells, males aged 5 years and females aged 5 years are the age groups that are most secure financially, with 100.0% of males and 100.0% of females in these age groups living above the poverty line.
| Age Bracket | Male | Female |
| Under 5 Years | 273 (43.9%) | 439 (88.7%) |
| 5 Years | 21 (100.0%) | 19 (100.0%) |
| 6 to 11 Years | 301 (46.7%) | 743 (87.2%) |
| 12 to 14 Years | 223 (71.3%) | 359 (80.5%) |
| 15 Years | 156 (86.7%) | 28 (82.4%) |
| 16 and 17 Years | 234 (94.0%) | 191 (93.6%) |
| 18 to 24 Years | 851 (82.7%) | 668 (64.3%) |
| 25 to 34 Years | 773 (79.1%) | 898 (92.9%) |
| 35 to 44 Years | 656 (77.2%) | 660 (62.2%) |
| 45 to 54 Years | 856 (72.8%) | 907 (87.6%) |
| 55 to 64 Years | 707 (82.6%) | 959 (70.6%) |
| 65 to 74 Years | 789 (96.0%) | 659 (85.1%) |
| 75 Years and over | 357 (94.2%) | 636 (81.1%) |
| Total | 6,197 (76.3%) | 7,166 (79.0%) |
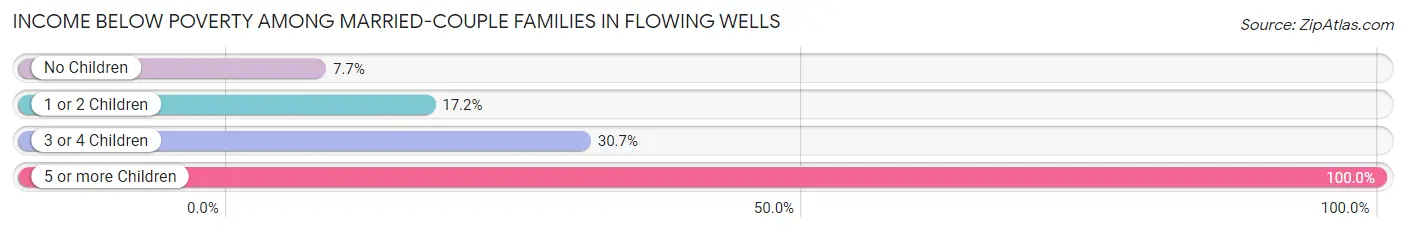
Income Below Poverty Among Married-Couple Families in Flowing Wells
The poverty statistics for married-couple families in Flowing Wells show that 14.0% or 291 of the total 2,073 families live below the poverty line. Families with 5 or more children have the highest poverty rate of 100.0%, comprising of 8 families. On the other hand, families with no children have the lowest poverty rate of 7.7%, which includes 84 families.
| Children | Above Poverty | Below Poverty |
| No Children | 1,012 (92.3%) | 84 (7.7%) |
| 1 or 2 Children | 603 (82.8%) | 125 (17.2%) |
| 3 or 4 Children | 167 (69.3%) | 74 (30.7%) |
| 5 or more Children | 0 (0.0%) | 8 (100.0%) |
| Total | 1,782 (86.0%) | 291 (14.0%) |
Income Below Poverty Among Single-Parent Households in Flowing Wells
According to the poverty data in Flowing Wells, 19.2% or 140 single-father households and 18.3% or 246 single-mother households are living below the poverty line. Among single-father households, those with 3 or 4 children have the highest poverty rate, with 127 households (58.5%) experiencing poverty. Likewise, among single-mother households, those with 1 or 2 children have the highest poverty rate, with 160 households (22.2%) falling below the poverty line.
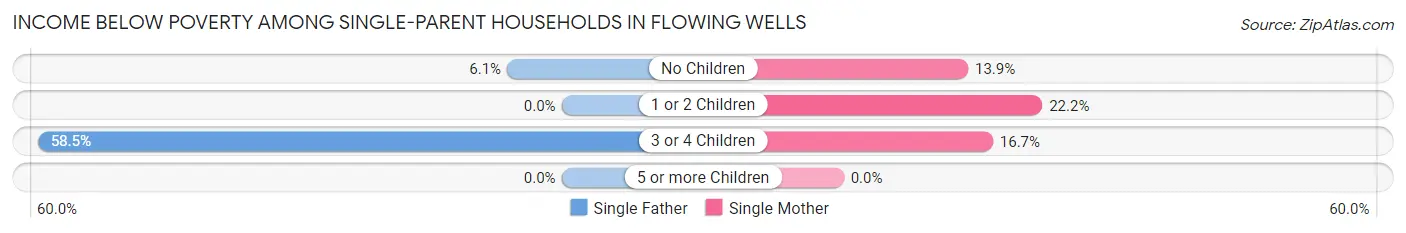
| Children | Single Father | Single Mother |
| No Children | 13 (6.1%) | 78 (13.9%) |
| 1 or 2 Children | 0 (0.0%) | 160 (22.2%) |
| 3 or 4 Children | 127 (58.5%) | 8 (16.7%) |
| 5 or more Children | 0 (0.0%) | 0 (0.0%) |
| Total | 140 (19.2%) | 246 (18.3%) |
Income Below Poverty Among Married-Couple vs Single-Parent Households in Flowing Wells
The poverty data for Flowing Wells shows that 291 of the married-couple family households (14.0%) and 386 of the single-parent households (18.6%) are living below the poverty level. Within the married-couple family households, those with 5 or more children have the highest poverty rate, with 8 households (100.0%) falling below the poverty line. Among the single-parent households, those with 3 or 4 children have the highest poverty rate, with 135 household (50.9%) living below poverty.
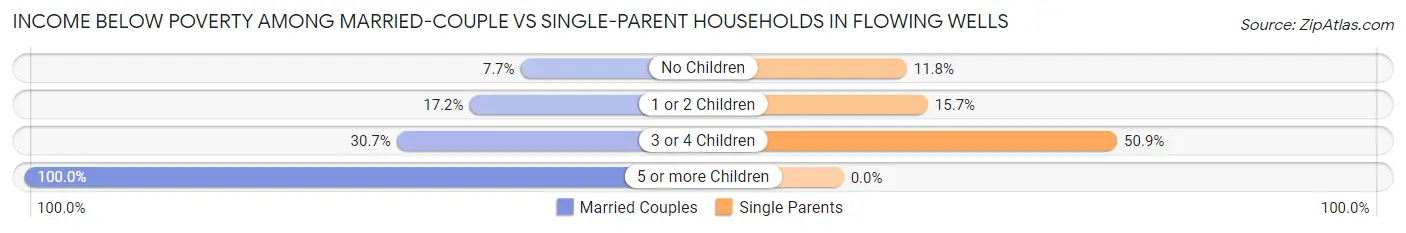
| Children | Married-Couple Families | Single-Parent Households |
| No Children | 84 (7.7%) | 91 (11.8%) |
| 1 or 2 Children | 125 (17.2%) | 160 (15.7%) |
| 3 or 4 Children | 74 (30.7%) | 135 (50.9%) |
| 5 or more Children | 8 (100.0%) | 0 (0.0%) |
| Total | 291 (14.0%) | 386 (18.6%) |
Race in Flowing Wells
The most populous races in Flowing Wells are White / Caucasian (10,992 | 63.9%), Hispanic or Latino (8,419 | 49.0%), and Two or more Races (2,965 | 17.2%).
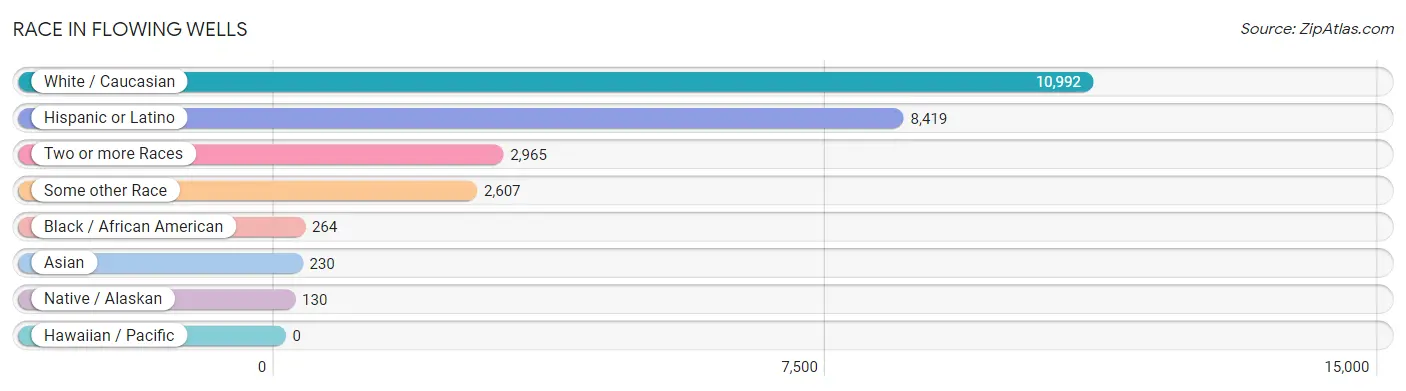
| Race | # Population | % Population |
| Asian | 230 | 1.3% |
| Black / African American | 264 | 1.5% |
| Hawaiian / Pacific | 0 | 0.0% |
| Hispanic or Latino | 8,419 | 49.0% |
| Native / Alaskan | 130 | 0.8% |
| White / Caucasian | 10,992 | 63.9% |
| Two or more Races | 2,965 | 17.2% |
| Some other Race | 2,607 | 15.2% |
| Total | 17,188 | 100.0% |
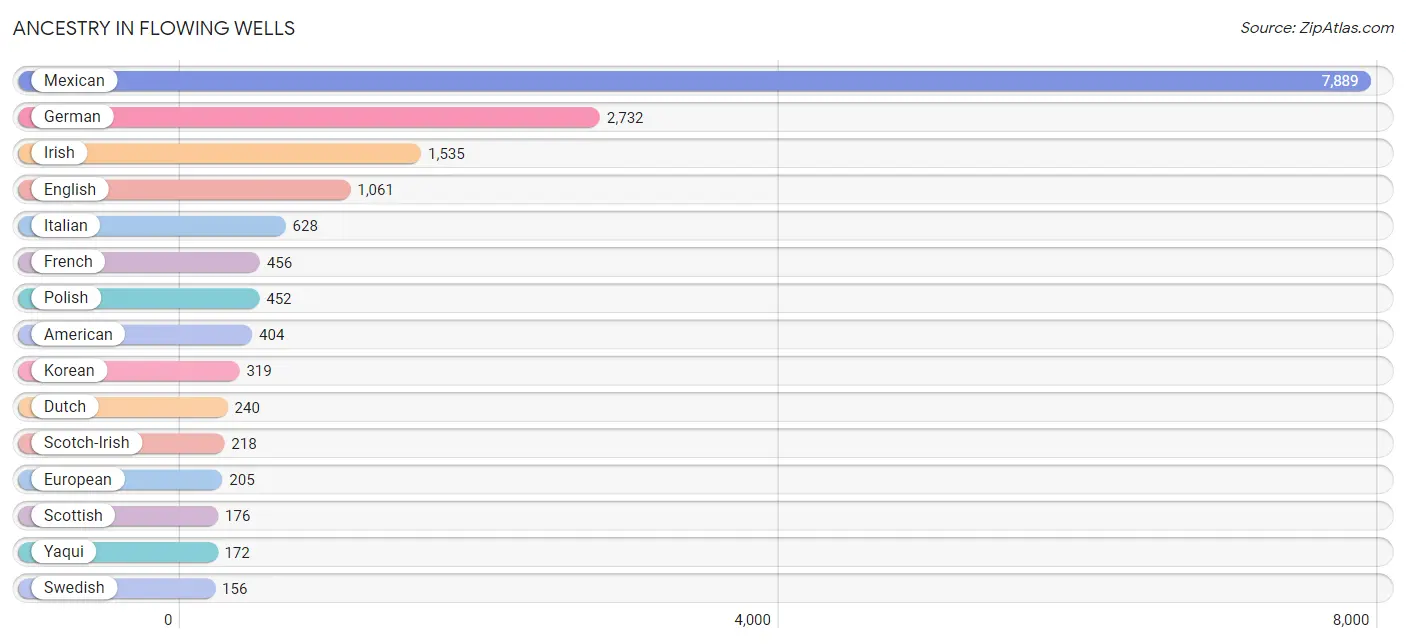
Ancestry in Flowing Wells
The most populous ancestries reported in Flowing Wells are Mexican (7,889 | 45.9%), German (2,732 | 15.9%), Irish (1,535 | 8.9%), English (1,061 | 6.2%), and Italian (628 | 3.6%), together accounting for 80.5% of all Flowing Wells residents.
| Ancestry | # Population | % Population |
| Alaska Native | 7 | 0.0% |
| American | 404 | 2.4% |
| Arab | 37 | 0.2% |
| Armenian | 15 | 0.1% |
| Austrian | 103 | 0.6% |
| Belgian | 18 | 0.1% |
| Bhutanese | 45 | 0.3% |
| Brazilian | 12 | 0.1% |
| British | 49 | 0.3% |
| Burmese | 25 | 0.2% |
| Canadian | 8 | 0.1% |
| Central American Indian | 19 | 0.1% |
| Cherokee | 88 | 0.5% |
| Choctaw | 15 | 0.1% |
| Colombian | 69 | 0.4% |
| Creek | 29 | 0.2% |
| Cuban | 49 | 0.3% |
| Czech | 10 | 0.1% |
| Danish | 10 | 0.1% |
| Dutch | 240 | 1.4% |
| Eastern European | 64 | 0.4% |
| English | 1,061 | 6.2% |
| European | 205 | 1.2% |
| Finnish | 10 | 0.1% |
| French | 456 | 2.6% |
| French American Indian | 104 | 0.6% |
| French Canadian | 3 | 0.0% |
| German | 2,732 | 15.9% |
| Greek | 55 | 0.3% |
| Indian (Asian) | 76 | 0.4% |
| Irish | 1,535 | 8.9% |
| Israeli | 10 | 0.1% |
| Italian | 628 | 3.6% |
| Korean | 319 | 1.9% |
| Lebanese | 7 | 0.0% |
| Lithuanian | 8 | 0.1% |
| Mexican | 7,889 | 45.9% |
| Navajo | 61 | 0.4% |
| Nigerian | 11 | 0.1% |
| Northern European | 25 | 0.2% |
| Norwegian | 134 | 0.8% |
| Osage | 3 | 0.0% |
| Pakistani | 37 | 0.2% |
| Pennsylvania German | 44 | 0.3% |
| Pima | 13 | 0.1% |
| Polish | 452 | 2.6% |
| Portuguese | 19 | 0.1% |
| Puerto Rican | 118 | 0.7% |
| Romanian | 15 | 0.1% |
| Russian | 122 | 0.7% |
| Scandinavian | 24 | 0.1% |
| Scotch-Irish | 218 | 1.3% |
| Scottish | 176 | 1.0% |
| Serbian | 10 | 0.1% |
| Sioux | 29 | 0.2% |
| Slovak | 35 | 0.2% |
| South American | 69 | 0.4% |
| Spaniard | 130 | 0.8% |
| Spanish | 7 | 0.0% |
| Sri Lankan | 38 | 0.2% |
| Subsaharan African | 11 | 0.1% |
| Swedish | 156 | 0.9% |
| Swiss | 10 | 0.1% |
| Syrian | 30 | 0.2% |
| Thai | 26 | 0.2% |
| Tohono O'Odham | 26 | 0.2% |
| Ukrainian | 37 | 0.2% |
| Welsh | 88 | 0.5% |
| Yaqui | 172 | 1.0% | View All 69 Rows |
Immigrants in Flowing Wells
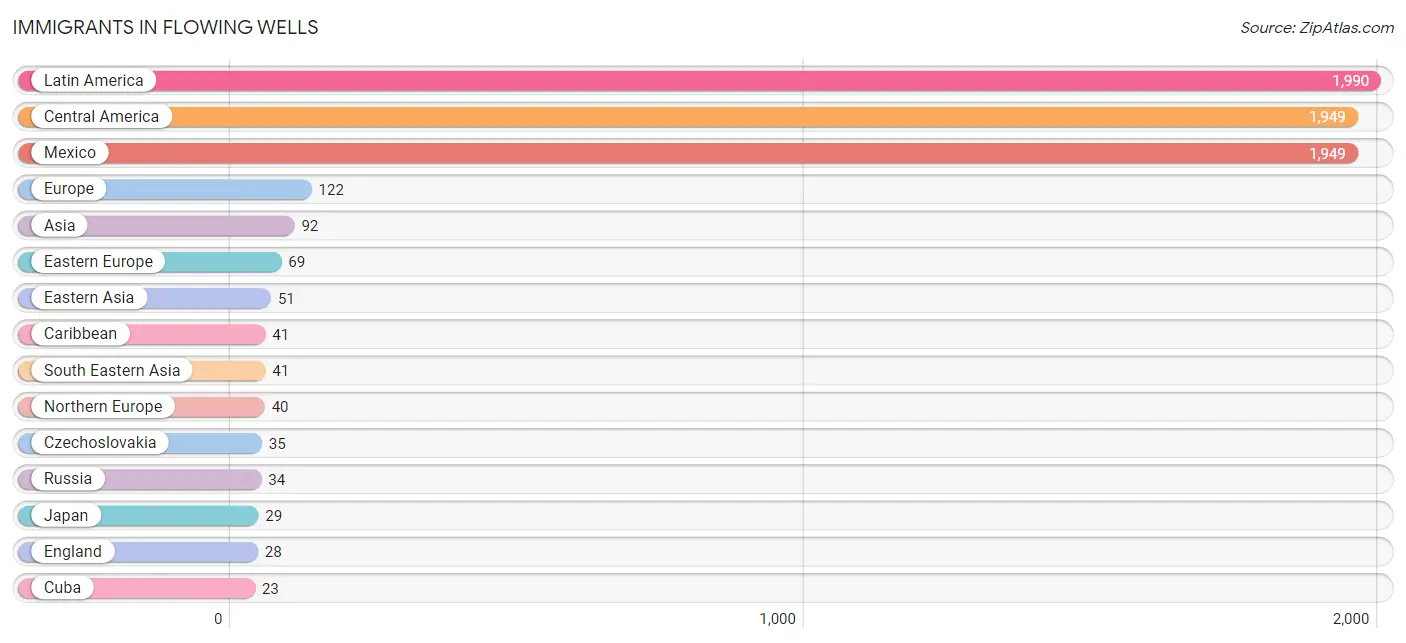
The most numerous immigrant groups reported in Flowing Wells came from Latin America (1,990 | 11.6%), Central America (1,949 | 11.3%), Mexico (1,949 | 11.3%), Europe (122 | 0.7%), and Asia (92 | 0.5%), together accounting for 35.5% of all Flowing Wells residents.
| Immigration Origin | # Population | % Population |
| Asia | 92 | 0.5% |
| Canada | 18 | 0.1% |
| Caribbean | 41 | 0.2% |
| Central America | 1,949 | 11.3% |
| Cuba | 23 | 0.1% |
| Czechoslovakia | 35 | 0.2% |
| Eastern Asia | 51 | 0.3% |
| Eastern Europe | 69 | 0.4% |
| England | 28 | 0.2% |
| Europe | 122 | 0.7% |
| Germany | 13 | 0.1% |
| Jamaica | 18 | 0.1% |
| Japan | 29 | 0.2% |
| Korea | 22 | 0.1% |
| Latin America | 1,990 | 11.6% |
| Mexico | 1,949 | 11.3% |
| Northern Europe | 40 | 0.2% |
| Philippines | 19 | 0.1% |
| Russia | 34 | 0.2% |
| South Eastern Asia | 41 | 0.2% |
| Thailand | 22 | 0.1% |
| Western Europe | 13 | 0.1% | View All 22 Rows |
Sex and Age in Flowing Wells
Sex and Age in Flowing Wells
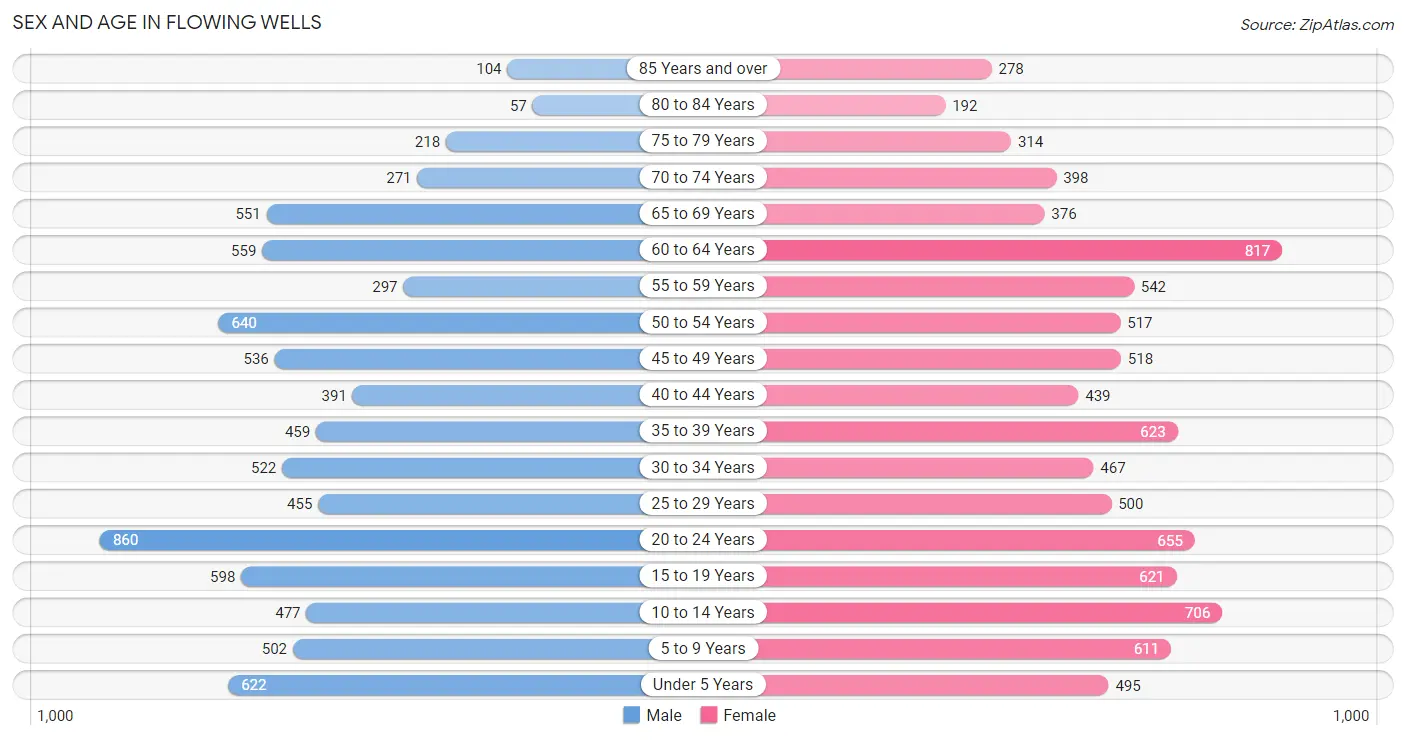
The most populous age groups in Flowing Wells are 20 to 24 Years (860 | 10.6%) for men and 60 to 64 Years (817 | 9.0%) for women.
| Age Bracket | Male | Female |
| Under 5 Years | 622 (7.7%) | 495 (5.5%) |
| 5 to 9 Years | 502 (6.2%) | 611 (6.7%) |
| 10 to 14 Years | 477 (5.9%) | 706 (7.8%) |
| 15 to 19 Years | 598 (7.4%) | 621 (6.9%) |
| 20 to 24 Years | 860 (10.6%) | 655 (7.2%) |
| 25 to 29 Years | 455 (5.6%) | 500 (5.5%) |
| 30 to 34 Years | 522 (6.4%) | 467 (5.1%) |
| 35 to 39 Years | 459 (5.7%) | 623 (6.9%) |
| 40 to 44 Years | 391 (4.8%) | 439 (4.8%) |
| 45 to 49 Years | 536 (6.6%) | 518 (5.7%) |
| 50 to 54 Years | 640 (7.9%) | 517 (5.7%) |
| 55 to 59 Years | 297 (3.7%) | 542 (6.0%) |
| 60 to 64 Years | 559 (6.9%) | 817 (9.0%) |
| 65 to 69 Years | 551 (6.8%) | 376 (4.2%) |
| 70 to 74 Years | 271 (3.3%) | 398 (4.4%) |
| 75 to 79 Years | 218 (2.7%) | 314 (3.5%) |
| 80 to 84 Years | 57 (0.7%) | 192 (2.1%) |
| 85 Years and over | 104 (1.3%) | 278 (3.1%) |
| Total | 8,119 (100.0%) | 9,069 (100.0%) |
Families and Households in Flowing Wells
Median Family Size in Flowing Wells
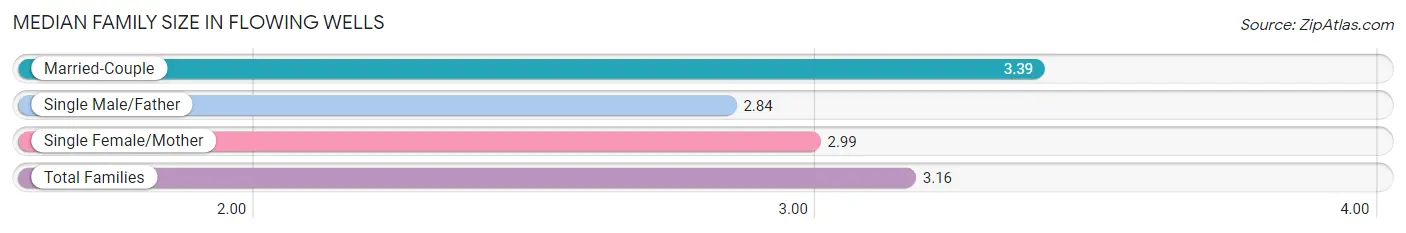
The median family size in Flowing Wells is 3.16 persons per family, with married-couple families (2,073 | 50.0%) accounting for the largest median family size of 3.39 persons per family. On the other hand, single male/father families (729 | 17.6%) represent the smallest median family size with 2.84 persons per family.
| Family Type | # Families | Family Size |
| Married-Couple | 2,073 (50.0%) | 3.39 |
| Single Male/Father | 729 (17.6%) | 2.84 |
| Single Female/Mother | 1,341 (32.4%) | 2.99 |
| Total Families | 4,143 (100.0%) | 3.16 |
Median Household Size in Flowing Wells
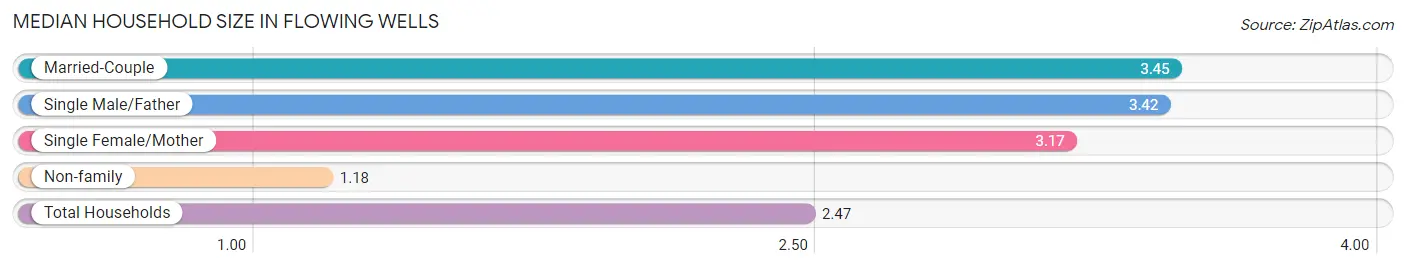
The median household size in Flowing Wells is 2.47 persons per household, with married-couple households (2,073 | 29.8%) accounting for the largest median household size of 3.45 persons per household. non-family households (2,808 | 40.4%) represent the smallest median household size with 1.18 persons per household.
| Household Type | # Households | Household Size |
| Married-Couple | 2,073 (29.8%) | 3.45 |
| Single Male/Father | 729 (10.5%) | 3.42 |
| Single Female/Mother | 1,341 (19.3%) | 3.17 |
| Non-family | 2,808 (40.4%) | 1.18 |
| Total Households | 6,951 (100.0%) | 2.47 |
Household Size by Marriage Status in Flowing Wells
Out of a total of 6,951 households in Flowing Wells, 4,143 (59.6%) are family households, while 2,808 (40.4%) are nonfamily households. The most numerous type of family households are 2-person households, comprising 1,512, and the most common type of nonfamily households are 1-person households, comprising 2,391.
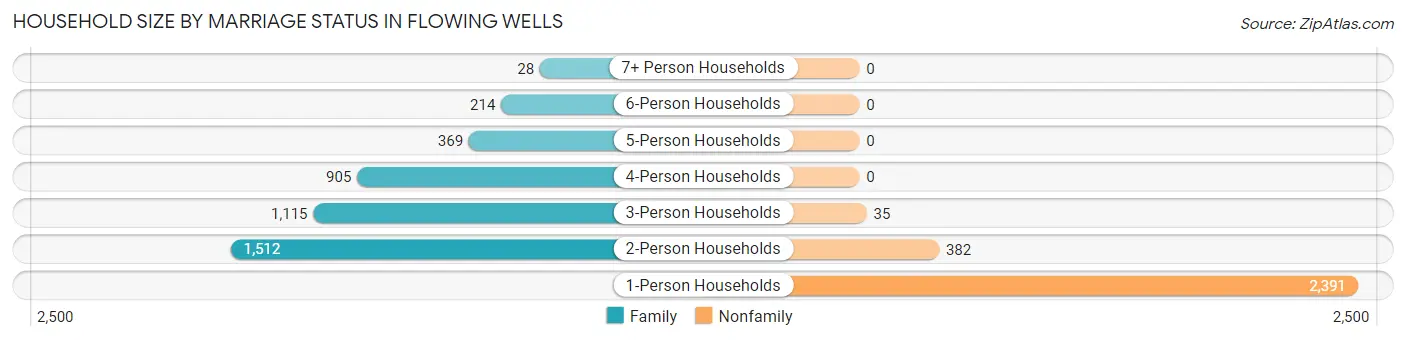
| Household Size | Family Households | Nonfamily Households |
| 1-Person Households | - | 2,391 (34.4%) |
| 2-Person Households | 1,512 (21.7%) | 382 (5.5%) |
| 3-Person Households | 1,115 (16.0%) | 35 (0.5%) |
| 4-Person Households | 905 (13.0%) | 0 (0.0%) |
| 5-Person Households | 369 (5.3%) | 0 (0.0%) |
| 6-Person Households | 214 (3.1%) | 0 (0.0%) |
| 7+ Person Households | 28 (0.4%) | 0 (0.0%) |
| Total | 4,143 (59.6%) | 2,808 (40.4%) |
Female Fertility in Flowing Wells
Fertility by Age in Flowing Wells
Average fertility rate in Flowing Wells is 100.0 births per 1,000 women. Women in the age bracket of 15 to 19 years have the highest fertility rate with 428.0 births per 1,000 women. Women in the age bracket of 15 to 19 years acount for 67.9% of all women with births.
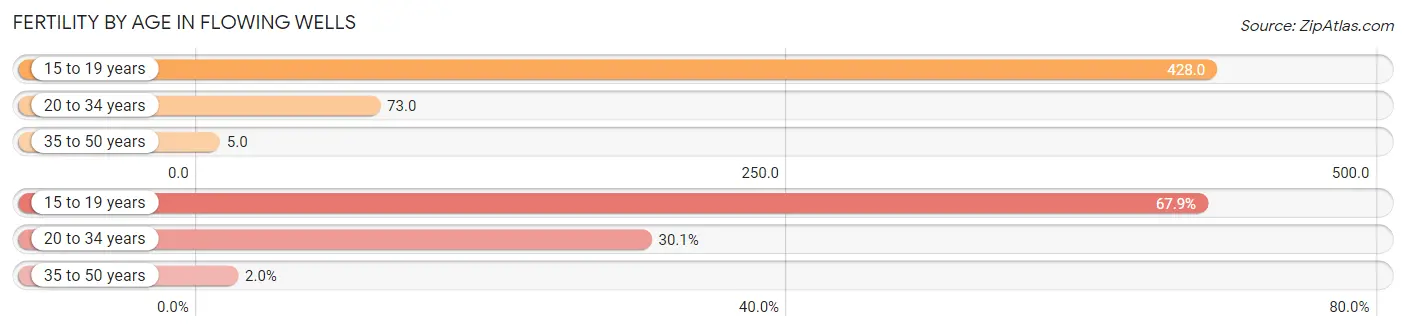
| Age Bracket | Women with Births | Births / 1,000 Women |
| 15 to 19 years | 266 (67.9%) | 428.0 |
| 20 to 34 years | 118 (30.1%) | 73.0 |
| 35 to 50 years | 8 (2.0%) | 5.0 |
| Total | 392 (100.0%) | 100.0 |
Fertility by Age by Marriage Status in Flowing Wells
9.4% of women with births (392) in Flowing Wells are married. The highest percentage of unmarried women with births falls into 15 to 19 years age bracket with 100.0% of them unmarried at the time of birth, while the lowest percentage of unmarried women with births belong to 35 to 50 years age bracket with 0.0% of them unmarried.
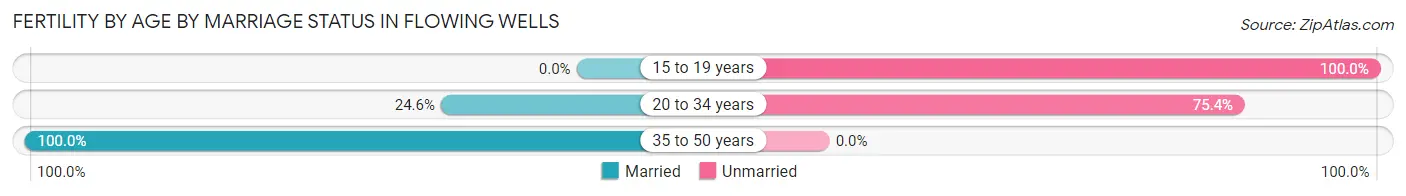
| Age Bracket | Married | Unmarried |
| 15 to 19 years | 0 (0.0%) | 266 (100.0%) |
| 20 to 34 years | 29 (24.6%) | 89 (75.4%) |
| 35 to 50 years | 8 (100.0%) | 0 (0.0%) |
| Total | 37 (9.4%) | 355 (90.6%) |
Fertility by Education in Flowing Wells
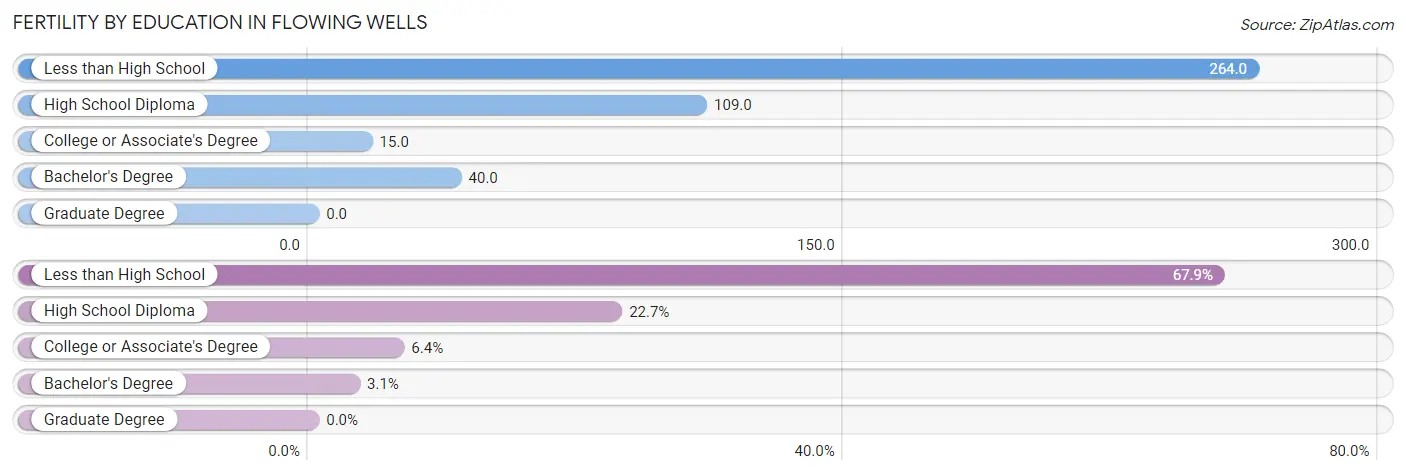
| Educational Attainment | Women with Births | Births / 1,000 Women |
| Less than High School | 266 (67.9%) | 264.0 |
| High School Diploma | 89 (22.7%) | 109.0 |
| College or Associate's Degree | 25 (6.4%) | 15.0 |
| Bachelor's Degree | 12 (3.1%) | 40.0 |
| Graduate Degree | 0 (0.0%) | 0.0 |
| Total | 392 (100.0%) | 100.0 |
Fertility by Education by Marriage Status in Flowing Wells
90.6% of women with births in Flowing Wells are unmarried. Women with the educational attainment of college or associate's degree are most likely to be married with 100.0% of them married at childbirth, while women with the educational attainment of less than high school are least likely to be married with 100.0% of them unmarried at childbirth.
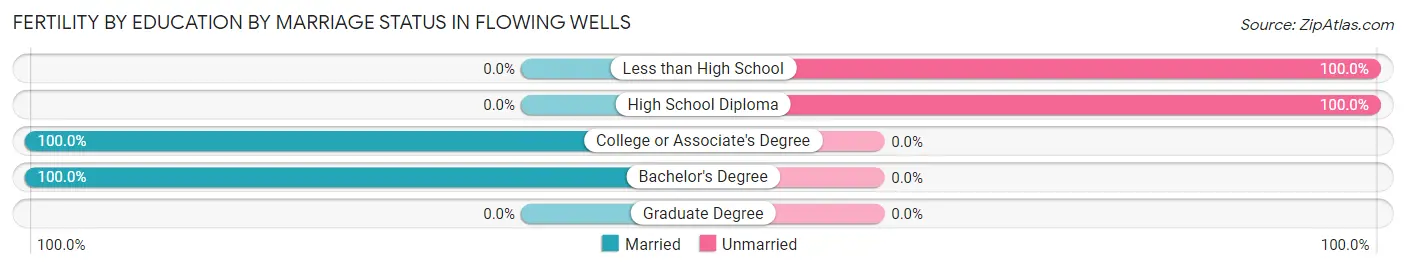
| Educational Attainment | Married | Unmarried |
| Less than High School | 0 (0.0%) | 266 (100.0%) |
| High School Diploma | 0 (0.0%) | 89 (100.0%) |
| College or Associate's Degree | 25 (100.0%) | 0 (0.0%) |
| Bachelor's Degree | 12 (100.0%) | 0 (0.0%) |
| Graduate Degree | 0 (0.0%) | 0 (0.0%) |
| Total | 37 (9.4%) | 355 (90.6%) |
Employment Characteristics in Flowing Wells
Employment by Class of Employer in Flowing Wells
Among the 7,390 employed individuals in Flowing Wells, private company employees (5,009 | 67.8%), self-employed (not incorporated) (685 | 9.3%), and local government employees (440 | 5.9%) make up the most common classes of employment.
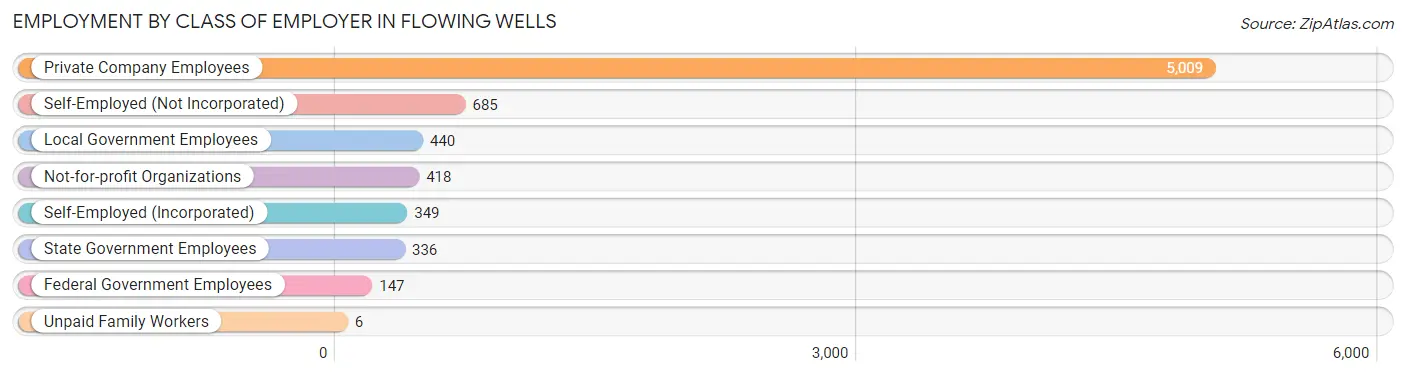
| Employer Class | # Employees | % Employees |
| Private Company Employees | 5,009 | 67.8% |
| Self-Employed (Incorporated) | 349 | 4.7% |
| Self-Employed (Not Incorporated) | 685 | 9.3% |
| Not-for-profit Organizations | 418 | 5.7% |
| Local Government Employees | 440 | 5.9% |
| State Government Employees | 336 | 4.5% |
| Federal Government Employees | 147 | 2.0% |
| Unpaid Family Workers | 6 | 0.1% |
| Total | 7,390 | 100.0% |
Employment Status by Age in Flowing Wells
According to the labor force statistics for Flowing Wells, out of the total population over 16 years of age (13,561), 62.8% or 8,516 individuals are in the labor force, with 10.4% or 886 of them unemployed. The age group with the highest labor force participation rate is 30 to 34 years, with 88.6% or 876 individuals in the labor force. Within the labor force, the 16 to 19 years age range has the highest percentage of unemployed individuals, with 20.7% or 74 of them being unemployed.
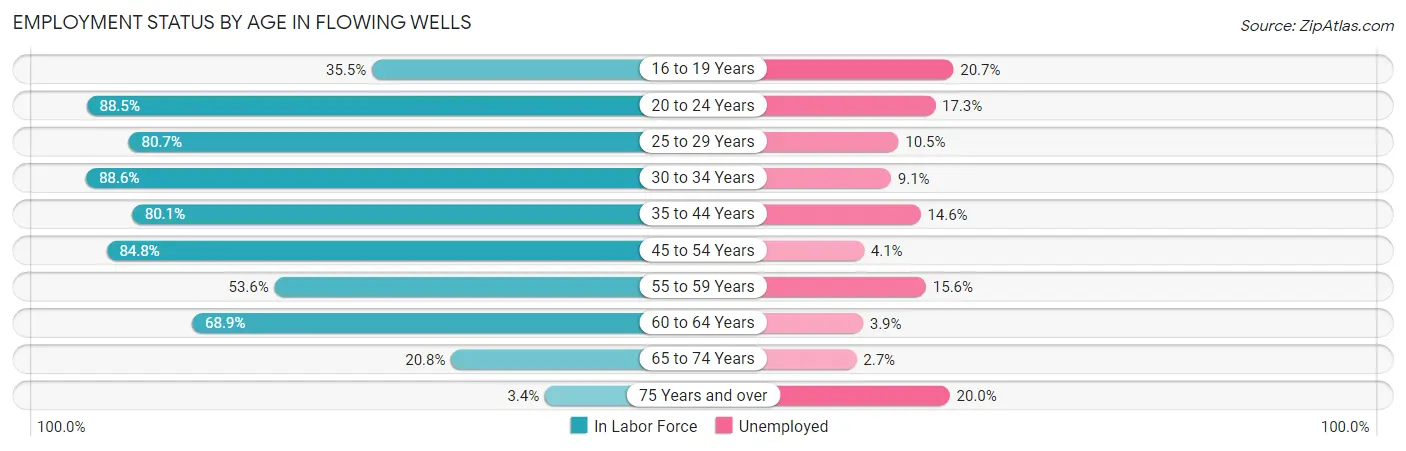
| Age Bracket | In Labor Force | Unemployed |
| 16 to 19 Years | 357 (35.5%) | 74 (20.7%) |
| 20 to 24 Years | 1,341 (88.5%) | 232 (17.3%) |
| 25 to 29 Years | 771 (80.7%) | 81 (10.5%) |
| 30 to 34 Years | 876 (88.6%) | 80 (9.1%) |
| 35 to 44 Years | 1,532 (80.1%) | 224 (14.6%) |
| 45 to 54 Years | 1,875 (84.8%) | 77 (4.1%) |
| 55 to 59 Years | 450 (53.6%) | 70 (15.6%) |
| 60 to 64 Years | 948 (68.9%) | 37 (3.9%) |
| 65 to 74 Years | 332 (20.8%) | 9 (2.7%) |
| 75 Years and over | 40 (3.4%) | 8 (20.0%) |
| Total | 8,516 (62.8%) | 886 (10.4%) |
Employment Status by Educational Attainment in Flowing Wells
According to labor force statistics for Flowing Wells, 77.9% of individuals (6,452) out of the total population between 25 and 64 years of age (8,282) are in the labor force, with 8.8% or 568 of them being unemployed. The group with the highest labor force participation rate are those with the educational attainment of bachelor's degree or higher, with 91.3% or 881 individuals in the labor force. Within the labor force, individuals with high school diploma education have the highest percentage of unemployment, with 12.9% or 228 of them being unemployed.
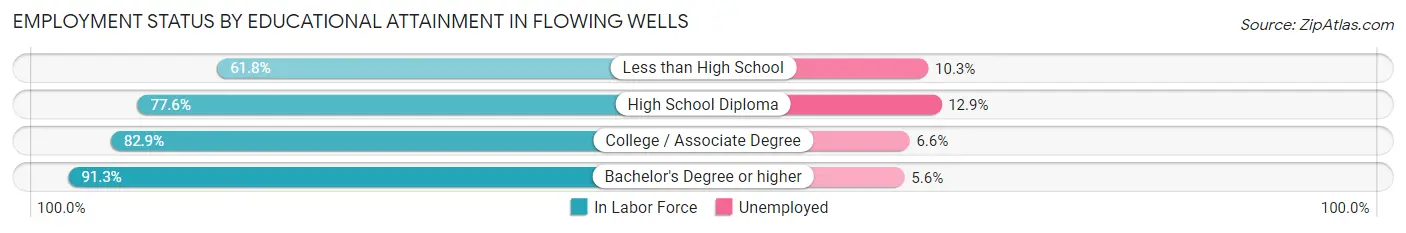
| Educational Attainment | In Labor Force | Unemployed |
| Less than High School | 1,088 (61.8%) | 181 (10.3%) |
| High School Diploma | 1,768 (77.6%) | 294 (12.9%) |
| College / Associate Degree | 2,718 (82.9%) | 216 (6.6%) |
| Bachelor's Degree or higher | 881 (91.3%) | 54 (5.6%) |
| Total | 6,452 (77.9%) | 729 (8.8%) |
Employment Occupations by Sex in Flowing Wells
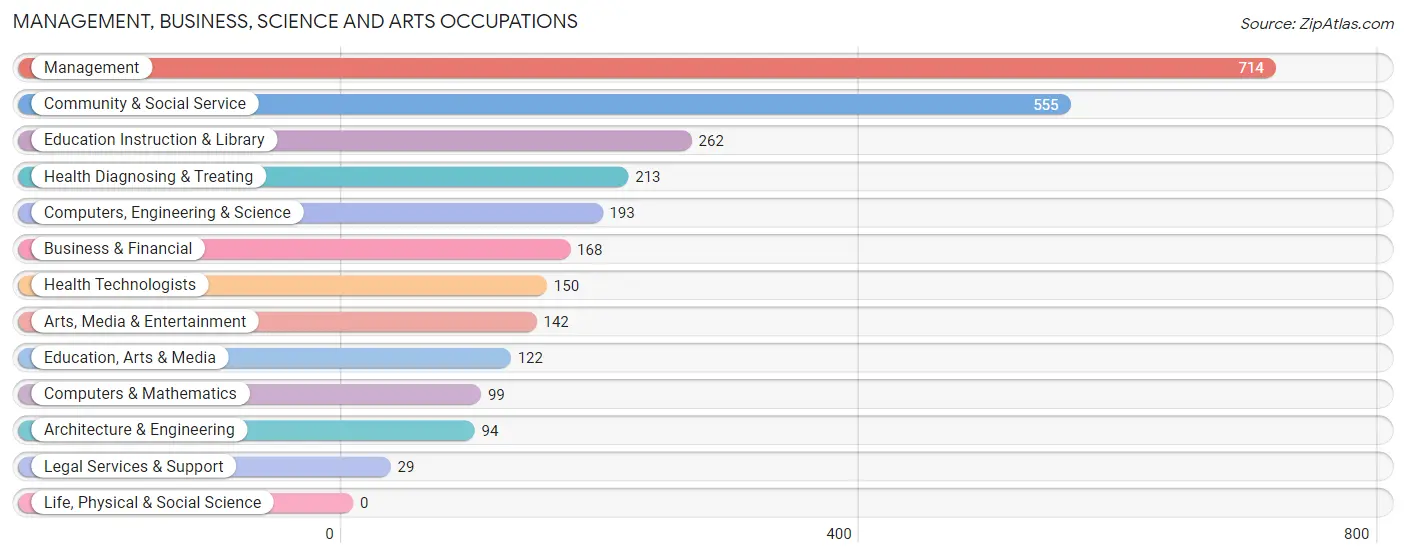
Management, Business, Science and Arts Occupations
The most common Management, Business, Science and Arts occupations in Flowing Wells are Management (714 | 9.4%), Community & Social Service (555 | 7.3%), Education Instruction & Library (262 | 3.4%), Health Diagnosing & Treating (213 | 2.8%), and Computers, Engineering & Science (193 | 2.5%).
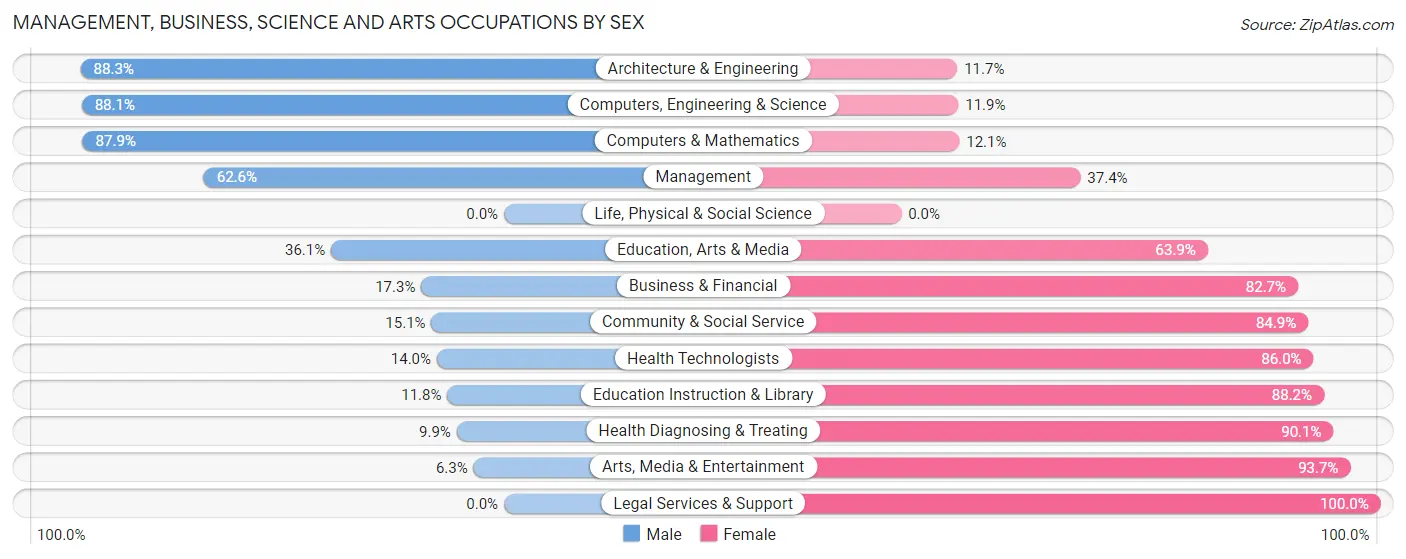
Management, Business, Science and Arts Occupations by Sex
Within the Management, Business, Science and Arts occupations in Flowing Wells, the most male-oriented occupations are Architecture & Engineering (88.3%), Computers, Engineering & Science (88.1%), and Computers & Mathematics (87.9%), while the most female-oriented occupations are Legal Services & Support (100.0%), Arts, Media & Entertainment (93.7%), and Health Diagnosing & Treating (90.1%).
| Occupation | Male | Female |
| Management | 447 (62.6%) | 267 (37.4%) |
| Business & Financial | 29 (17.3%) | 139 (82.7%) |
| Computers, Engineering & Science | 170 (88.1%) | 23 (11.9%) |
| Computers & Mathematics | 87 (87.9%) | 12 (12.1%) |
| Architecture & Engineering | 83 (88.3%) | 11 (11.7%) |
| Life, Physical & Social Science | 0 (0.0%) | 0 (0.0%) |
| Community & Social Service | 84 (15.1%) | 471 (84.9%) |
| Education, Arts & Media | 44 (36.1%) | 78 (63.9%) |
| Legal Services & Support | 0 (0.0%) | 29 (100.0%) |
| Education Instruction & Library | 31 (11.8%) | 231 (88.2%) |
| Arts, Media & Entertainment | 9 (6.3%) | 133 (93.7%) |
| Health Diagnosing & Treating | 21 (9.9%) | 192 (90.1%) |
| Health Technologists | 21 (14.0%) | 129 (86.0%) |
| Total (Category) | 751 (40.7%) | 1,092 (59.3%) |
| Total (Overall) | 4,042 (53.0%) | 3,579 (47.0%) |
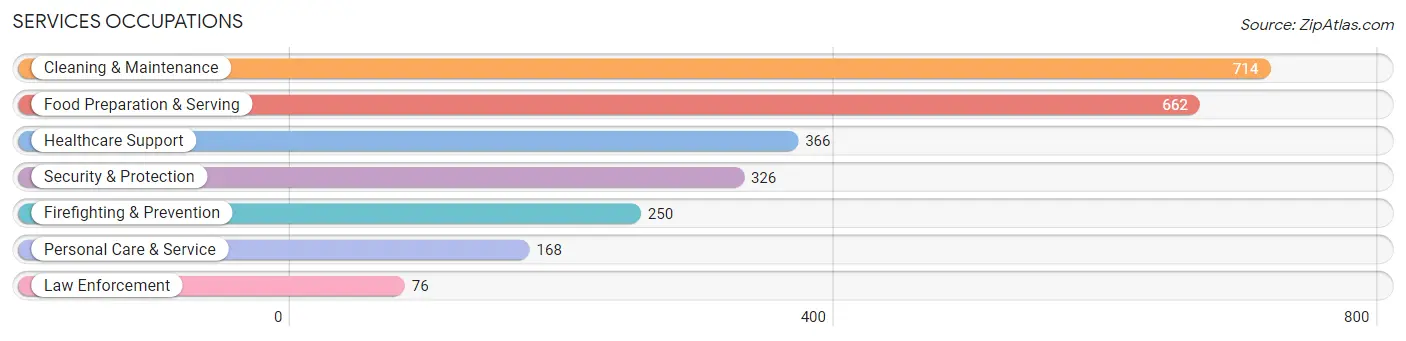
Services Occupations
The most common Services occupations in Flowing Wells are Cleaning & Maintenance (714 | 9.4%), Food Preparation & Serving (662 | 8.7%), Healthcare Support (366 | 4.8%), Security & Protection (326 | 4.3%), and Firefighting & Prevention (250 | 3.3%).
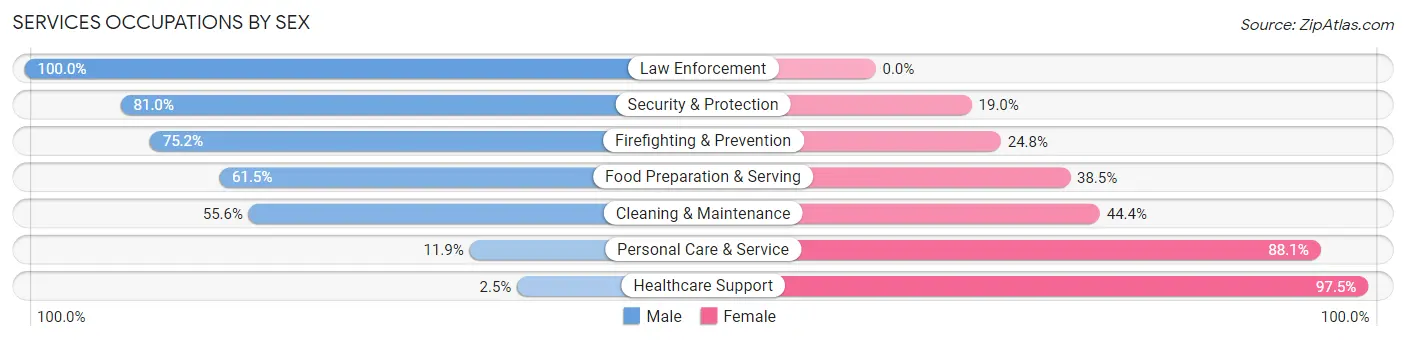
Services Occupations by Sex
Within the Services occupations in Flowing Wells, the most male-oriented occupations are Law Enforcement (100.0%), Security & Protection (81.0%), and Firefighting & Prevention (75.2%), while the most female-oriented occupations are Healthcare Support (97.5%), Personal Care & Service (88.1%), and Cleaning & Maintenance (44.4%).
| Occupation | Male | Female |
| Healthcare Support | 9 (2.5%) | 357 (97.5%) |
| Security & Protection | 264 (81.0%) | 62 (19.0%) |
| Firefighting & Prevention | 188 (75.2%) | 62 (24.8%) |
| Law Enforcement | 76 (100.0%) | 0 (0.0%) |
| Food Preparation & Serving | 407 (61.5%) | 255 (38.5%) |
| Cleaning & Maintenance | 397 (55.6%) | 317 (44.4%) |
| Personal Care & Service | 20 (11.9%) | 148 (88.1%) |
| Total (Category) | 1,097 (49.1%) | 1,139 (50.9%) |
| Total (Overall) | 4,042 (53.0%) | 3,579 (47.0%) |
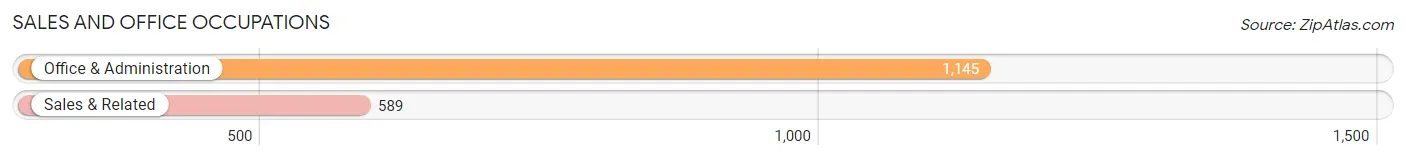
Sales and Office Occupations
The most common Sales and Office occupations in Flowing Wells are Office & Administration (1,145 | 15.0%), and Sales & Related (589 | 7.7%).
Sales and Office Occupations by Sex
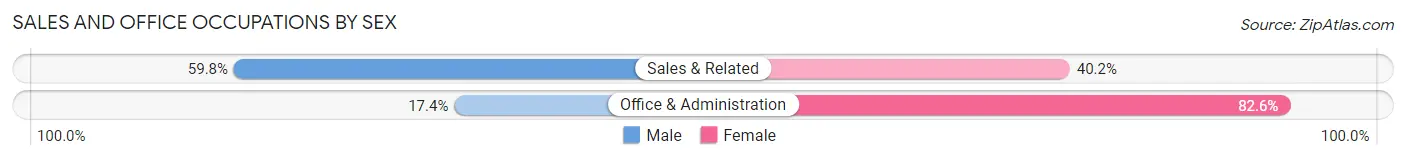
| Occupation | Male | Female |
| Sales & Related | 352 (59.8%) | 237 (40.2%) |
| Office & Administration | 199 (17.4%) | 946 (82.6%) |
| Total (Category) | 551 (31.8%) | 1,183 (68.2%) |
| Total (Overall) | 4,042 (53.0%) | 3,579 (47.0%) |
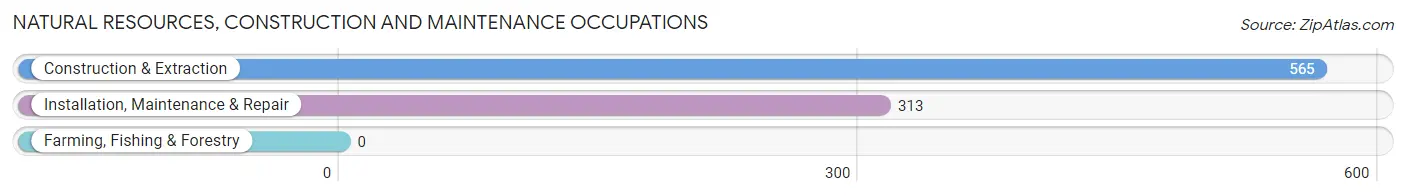
Natural Resources, Construction and Maintenance Occupations
The most common Natural Resources, Construction and Maintenance occupations in Flowing Wells are Construction & Extraction (565 | 7.4%), and Installation, Maintenance & Repair (313 | 4.1%).
Natural Resources, Construction and Maintenance Occupations by Sex
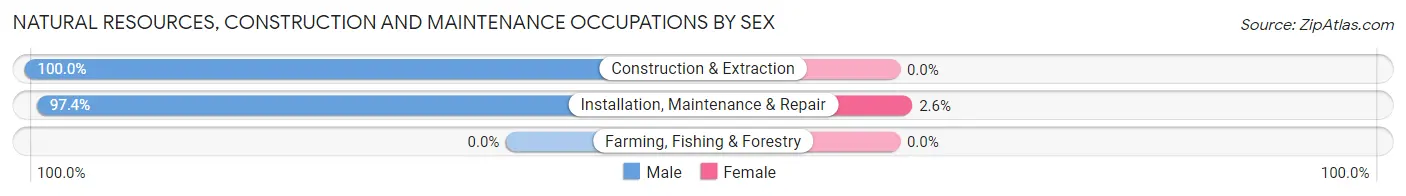
| Occupation | Male | Female |
| Farming, Fishing & Forestry | 0 (0.0%) | 0 (0.0%) |
| Construction & Extraction | 565 (100.0%) | 0 (0.0%) |
| Installation, Maintenance & Repair | 305 (97.4%) | 8 (2.6%) |
| Total (Category) | 870 (99.1%) | 8 (0.9%) |
| Total (Overall) | 4,042 (53.0%) | 3,579 (47.0%) |
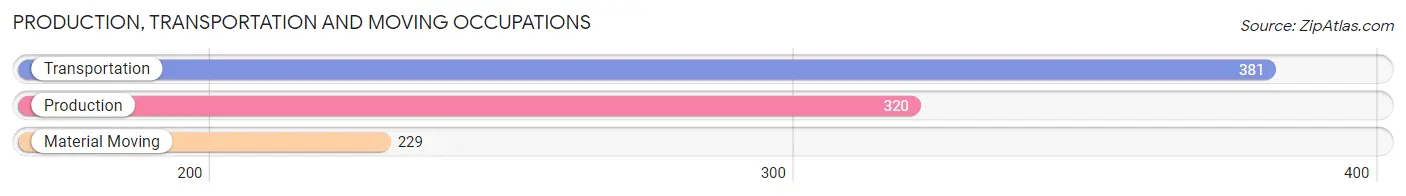
Production, Transportation and Moving Occupations
The most common Production, Transportation and Moving occupations in Flowing Wells are Transportation (381 | 5.0%), Production (320 | 4.2%), and Material Moving (229 | 3.0%).
Production, Transportation and Moving Occupations by Sex
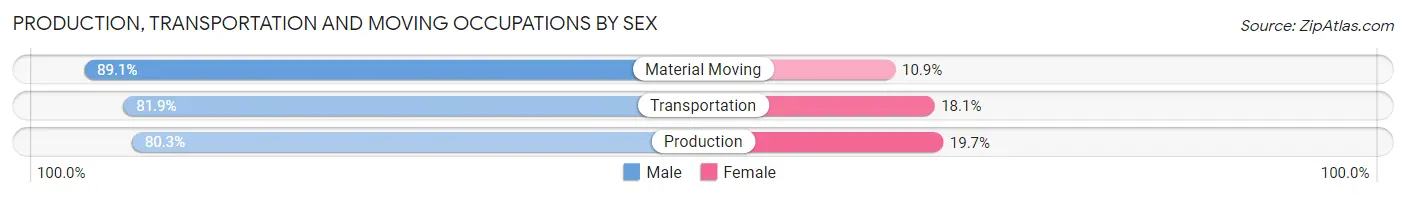
| Occupation | Male | Female |
| Production | 257 (80.3%) | 63 (19.7%) |
| Transportation | 312 (81.9%) | 69 (18.1%) |
| Material Moving | 204 (89.1%) | 25 (10.9%) |
| Total (Category) | 773 (83.1%) | 157 (16.9%) |
| Total (Overall) | 4,042 (53.0%) | 3,579 (47.0%) |
Employment Industries by Sex in Flowing Wells
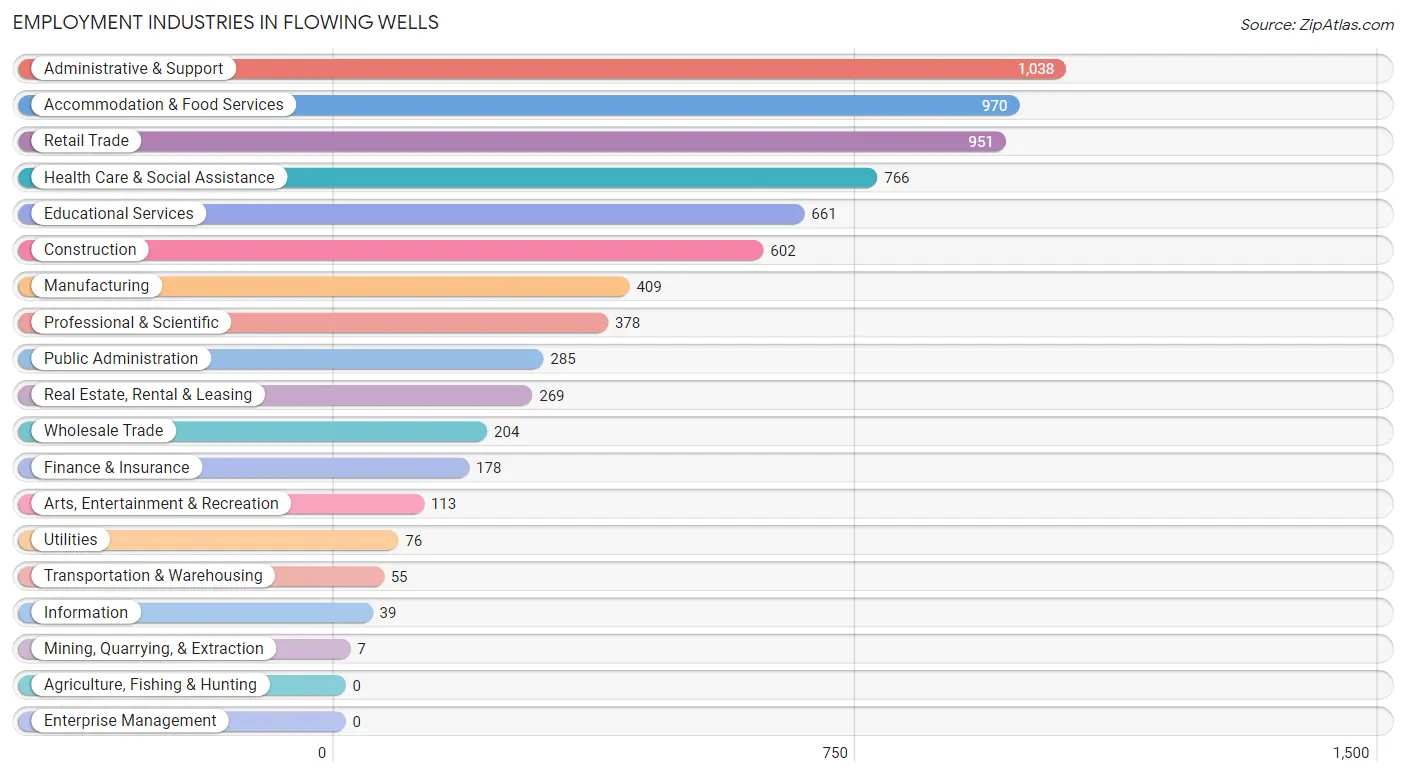
Employment Industries in Flowing Wells
The major employment industries in Flowing Wells include Administrative & Support (1,038 | 13.6%), Accommodation & Food Services (970 | 12.7%), Retail Trade (951 | 12.5%), Health Care & Social Assistance (766 | 10.1%), and Educational Services (661 | 8.7%).
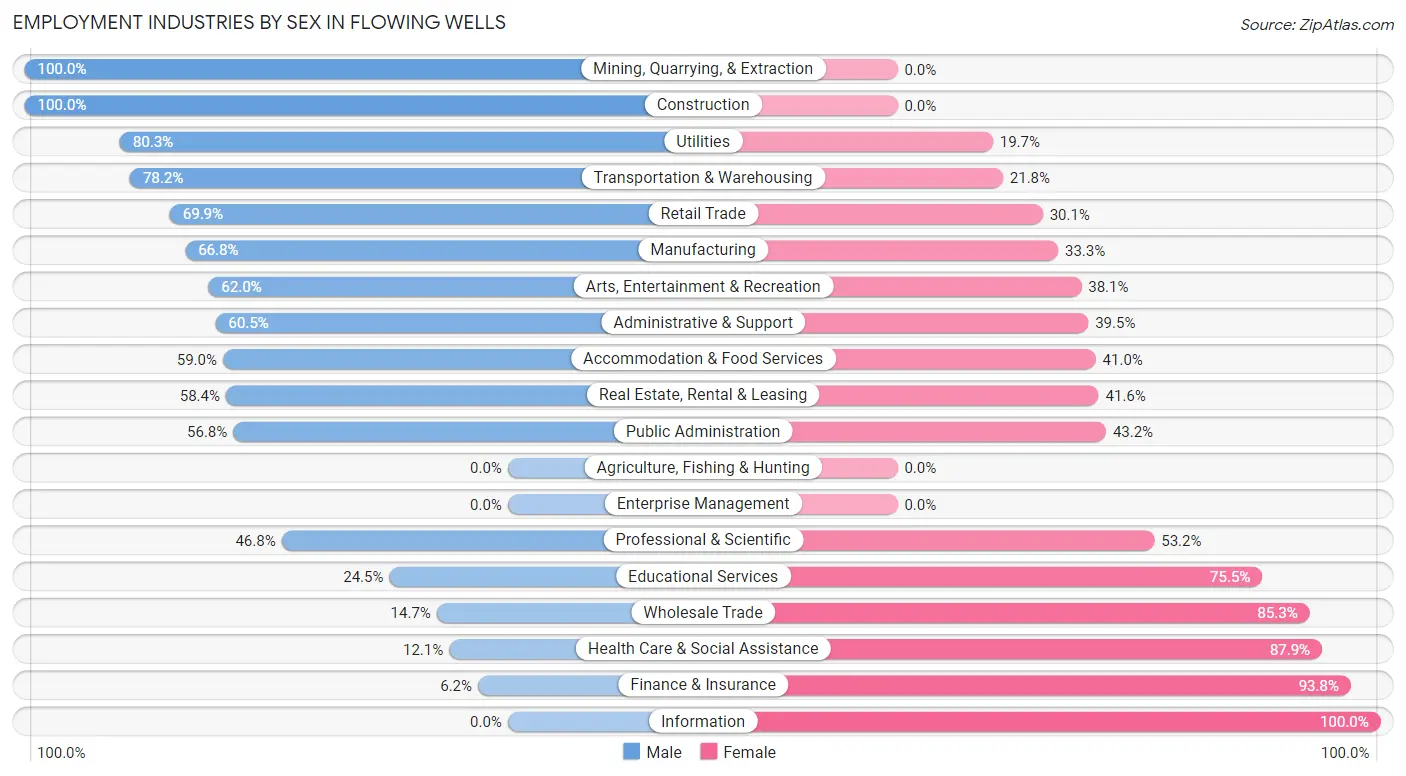
Employment Industries by Sex in Flowing Wells
The Flowing Wells industries that see more men than women are Mining, Quarrying, & Extraction (100.0%), Construction (100.0%), and Utilities (80.3%), whereas the industries that tend to have a higher number of women are Information (100.0%), Finance & Insurance (93.8%), and Health Care & Social Assistance (87.9%).
| Industry | Male | Female |
| Agriculture, Fishing & Hunting | 0 (0.0%) | 0 (0.0%) |
| Mining, Quarrying, & Extraction | 7 (100.0%) | 0 (0.0%) |
| Construction | 602 (100.0%) | 0 (0.0%) |
| Manufacturing | 273 (66.7%) | 136 (33.3%) |
| Wholesale Trade | 30 (14.7%) | 174 (85.3%) |
| Retail Trade | 665 (69.9%) | 286 (30.1%) |
| Transportation & Warehousing | 43 (78.2%) | 12 (21.8%) |
| Utilities | 61 (80.3%) | 15 (19.7%) |
| Information | 0 (0.0%) | 39 (100.0%) |
| Finance & Insurance | 11 (6.2%) | 167 (93.8%) |
| Real Estate, Rental & Leasing | 157 (58.4%) | 112 (41.6%) |
| Professional & Scientific | 177 (46.8%) | 201 (53.2%) |
| Enterprise Management | 0 (0.0%) | 0 (0.0%) |
| Administrative & Support | 628 (60.5%) | 410 (39.5%) |
| Educational Services | 162 (24.5%) | 499 (75.5%) |
| Health Care & Social Assistance | 93 (12.1%) | 673 (87.9%) |
| Arts, Entertainment & Recreation | 70 (62.0%) | 43 (38.1%) |
| Accommodation & Food Services | 572 (59.0%) | 398 (41.0%) |
| Public Administration | 162 (56.8%) | 123 (43.2%) |
| Total | 4,042 (53.0%) | 3,579 (47.0%) |
Education in Flowing Wells
School Enrollment in Flowing Wells
The most common levels of schooling among the 4,082 students in Flowing Wells are elementary school (1,037 | 25.4%), middle school (1,002 | 24.5%), and high school (879 | 21.5%).
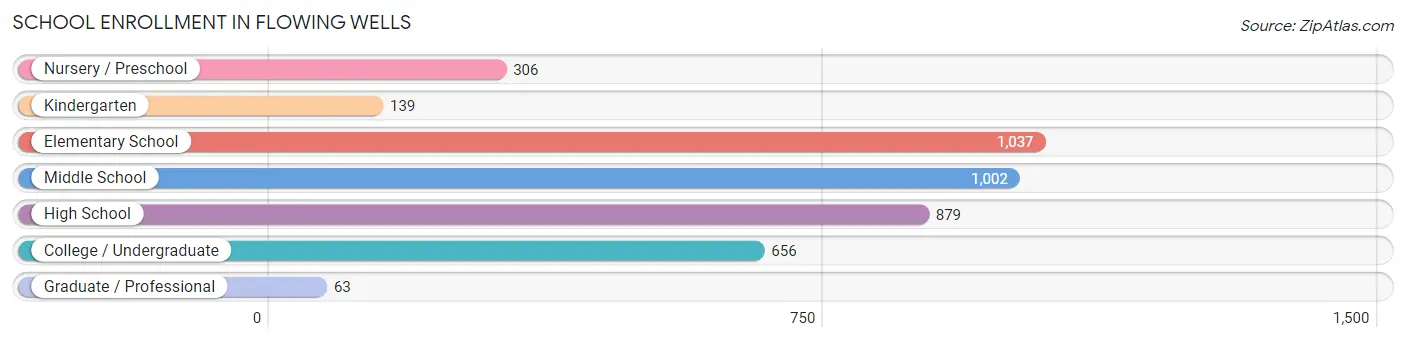
| School Level | # Students | % Students |
| Nursery / Preschool | 306 | 7.5% |
| Kindergarten | 139 | 3.4% |
| Elementary School | 1,037 | 25.4% |
| Middle School | 1,002 | 24.5% |
| High School | 879 | 21.5% |
| College / Undergraduate | 656 | 16.1% |
| Graduate / Professional | 63 | 1.5% |
| Total | 4,082 | 100.0% |
School Enrollment by Age by Funding Source in Flowing Wells
Out of a total of 4,082 students who are enrolled in schools in Flowing Wells, 449 (11.0%) attend a private institution, while the remaining 3,633 (89.0%) are enrolled in public schools. The age group of 35 years and over has the highest likelihood of being enrolled in private schools, with 49 (55.1% in the age bracket) enrolled. Conversely, the age group of 5 to 9 year old has the lowest likelihood of being enrolled in a private school, with 1,107 (99.5% in the age bracket) attending a public institution.
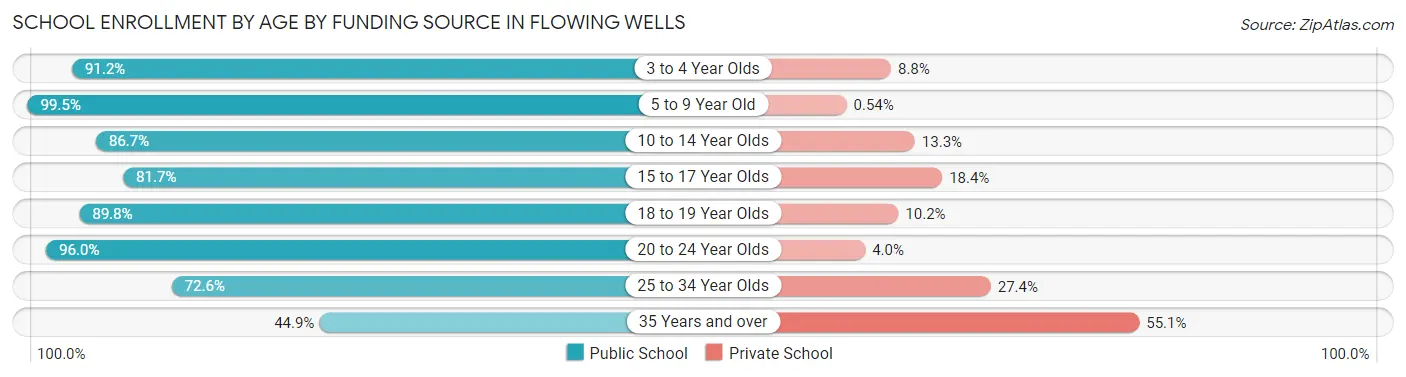
| Age Bracket | Public School | Private School |
| 3 to 4 Year Olds | 279 (91.2%) | 27 (8.8%) |
| 5 to 9 Year Old | 1,107 (99.5%) | 6 (0.5%) |
| 10 to 14 Year Olds | 1,026 (86.7%) | 157 (13.3%) |
| 15 to 17 Year Olds | 516 (81.7%) | 116 (18.3%) |
| 18 to 19 Year Olds | 194 (89.8%) | 22 (10.2%) |
| 20 to 24 Year Olds | 311 (96.0%) | 13 (4.0%) |
| 25 to 34 Year Olds | 159 (72.6%) | 60 (27.4%) |
| 35 Years and over | 40 (44.9%) | 49 (55.1%) |
| Total | 3,633 (89.0%) | 449 (11.0%) |
Educational Attainment by Field of Study in Flowing Wells
Business (336 | 21.1%), education (287 | 18.0%), engineering (161 | 10.1%), bio, nature & agricultural (149 | 9.4%), and science & technology (143 | 9.0%) are the most common fields of study among 1,592 individuals in Flowing Wells who have obtained a bachelor's degree or higher.
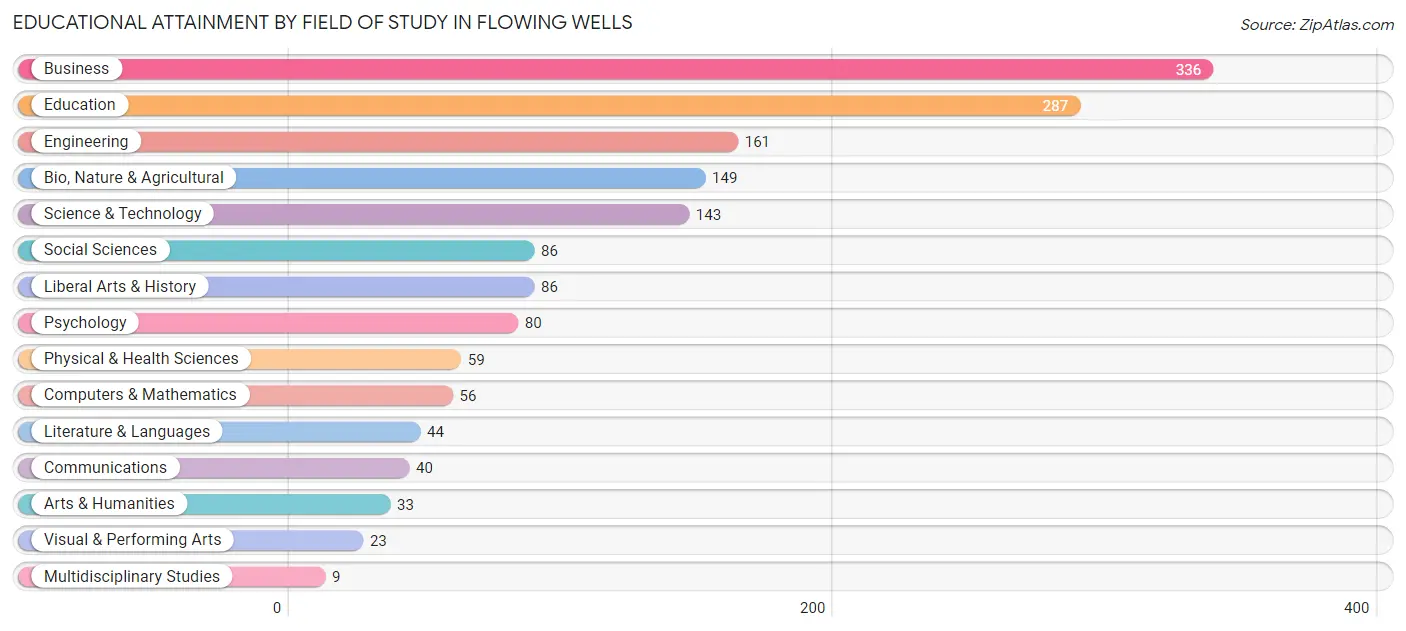
| Field of Study | # Graduates | % Graduates |
| Computers & Mathematics | 56 | 3.5% |
| Bio, Nature & Agricultural | 149 | 9.4% |
| Physical & Health Sciences | 59 | 3.7% |
| Psychology | 80 | 5.0% |
| Social Sciences | 86 | 5.4% |
| Engineering | 161 | 10.1% |
| Multidisciplinary Studies | 9 | 0.6% |
| Science & Technology | 143 | 9.0% |
| Business | 336 | 21.1% |
| Education | 287 | 18.0% |
| Literature & Languages | 44 | 2.8% |
| Liberal Arts & History | 86 | 5.4% |
| Visual & Performing Arts | 23 | 1.4% |
| Communications | 40 | 2.5% |
| Arts & Humanities | 33 | 2.1% |
| Total | 1,592 | 100.0% |
Transportation & Commute in Flowing Wells
Vehicle Availability by Sex in Flowing Wells
The most prevalent vehicle ownership categories in Flowing Wells are males with 2 vehicles (1,341, accounting for 34.7%) and females with 2 vehicles (1,252, making up 38.1%).
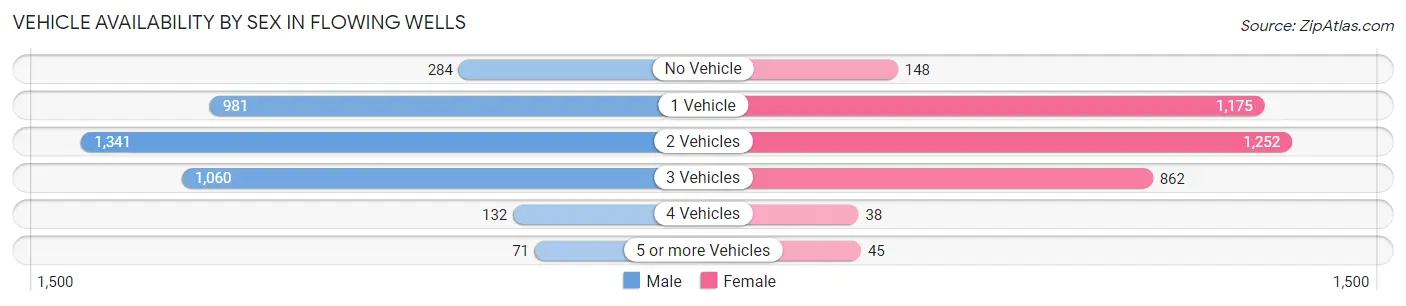
| Vehicles Available | Male | Female |
| No Vehicle | 284 (7.3%) | 148 (4.2%) |
| 1 Vehicle | 981 (25.4%) | 1,175 (33.4%) |
| 2 Vehicles | 1,341 (34.7%) | 1,252 (35.6%) |
| 3 Vehicles | 1,060 (27.4%) | 862 (24.5%) |
| 4 Vehicles | 132 (3.4%) | 38 (1.1%) |
| 5 or more Vehicles | 71 (1.8%) | 45 (1.3%) |
| Total | 3,869 (100.0%) | 3,520 (100.0%) |
Commute Time in Flowing Wells
The most frequently occuring commute durations in Flowing Wells are 15 to 19 minutes (1,495 commuters, 21.9%), 20 to 24 minutes (1,380 commuters, 20.2%), and 10 to 14 minutes (875 commuters, 12.8%).
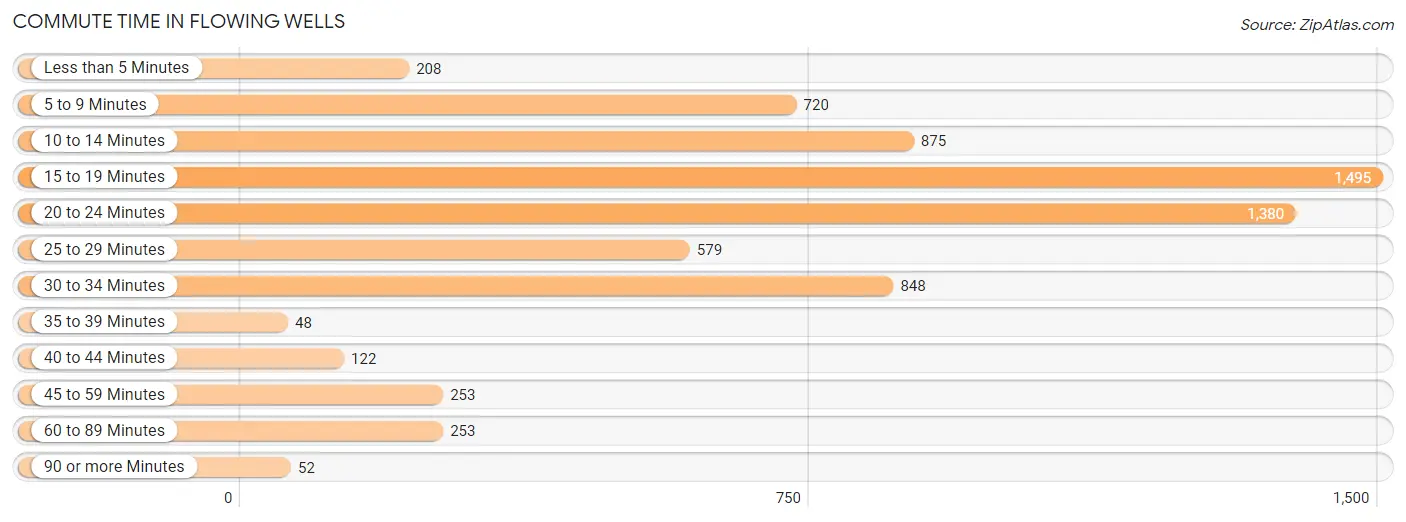
| Commute Time | # Commuters | % Commuters |
| Less than 5 Minutes | 208 | 3.0% |
| 5 to 9 Minutes | 720 | 10.5% |
| 10 to 14 Minutes | 875 | 12.8% |
| 15 to 19 Minutes | 1,495 | 21.9% |
| 20 to 24 Minutes | 1,380 | 20.2% |
| 25 to 29 Minutes | 579 | 8.5% |
| 30 to 34 Minutes | 848 | 12.4% |
| 35 to 39 Minutes | 48 | 0.7% |
| 40 to 44 Minutes | 122 | 1.8% |
| 45 to 59 Minutes | 253 | 3.7% |
| 60 to 89 Minutes | 253 | 3.7% |
| 90 or more Minutes | 52 | 0.8% |
Commute Time by Sex in Flowing Wells
The most common commute times in Flowing Wells are 15 to 19 minutes (921 commuters, 25.4%) for males and 20 to 24 minutes (760 commuters, 23.7%) for females.
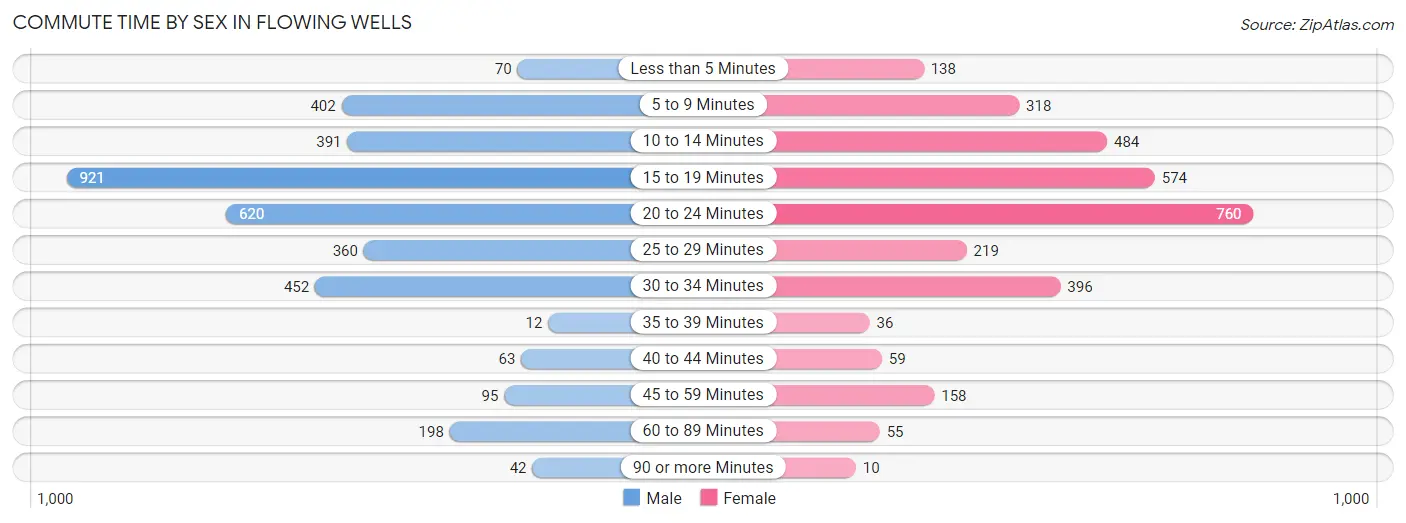
| Commute Time | Male | Female |
| Less than 5 Minutes | 70 (1.9%) | 138 (4.3%) |
| 5 to 9 Minutes | 402 (11.1%) | 318 (9.9%) |
| 10 to 14 Minutes | 391 (10.8%) | 484 (15.1%) |
| 15 to 19 Minutes | 921 (25.4%) | 574 (17.9%) |
| 20 to 24 Minutes | 620 (17.1%) | 760 (23.7%) |
| 25 to 29 Minutes | 360 (9.9%) | 219 (6.8%) |
| 30 to 34 Minutes | 452 (12.5%) | 396 (12.3%) |
| 35 to 39 Minutes | 12 (0.3%) | 36 (1.1%) |
| 40 to 44 Minutes | 63 (1.7%) | 59 (1.8%) |
| 45 to 59 Minutes | 95 (2.6%) | 158 (4.9%) |
| 60 to 89 Minutes | 198 (5.5%) | 55 (1.7%) |
| 90 or more Minutes | 42 (1.2%) | 10 (0.3%) |
Time of Departure to Work by Sex in Flowing Wells
The most frequent times of departure to work in Flowing Wells are 12:00 AM to 4:59 AM (537, 14.8%) for males and 7:00 AM to 7:29 AM (589, 18.4%) for females.
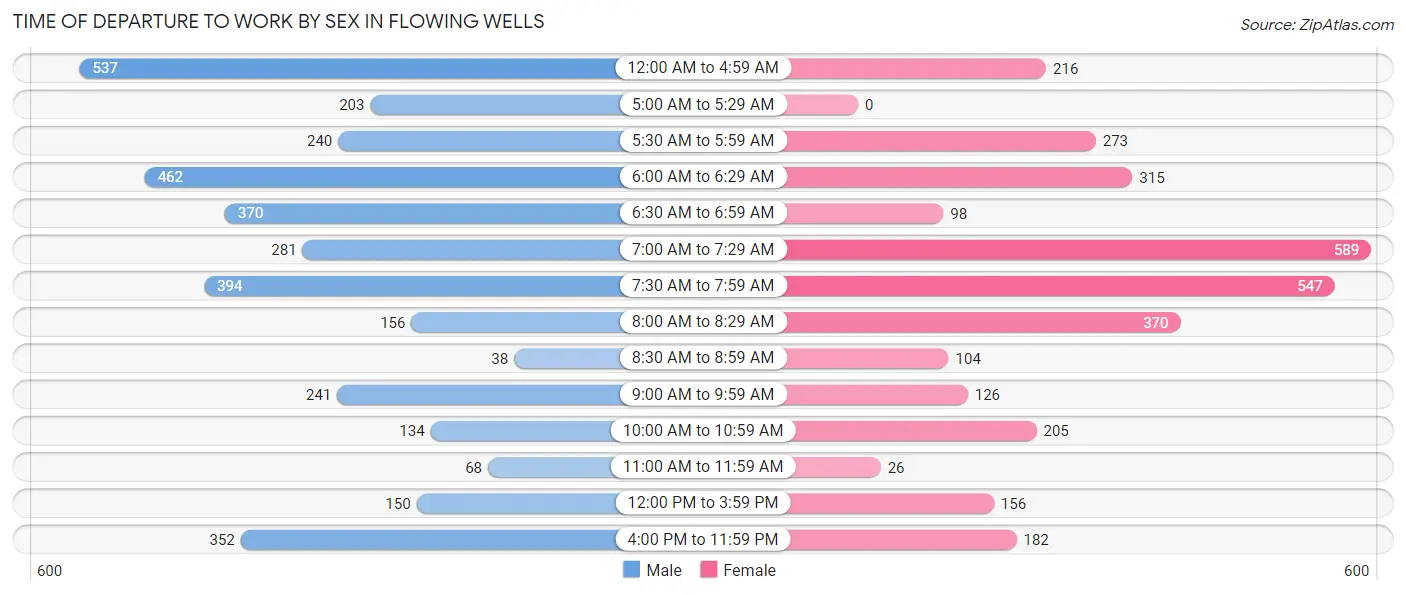
| Time of Departure | Male | Female |
| 12:00 AM to 4:59 AM | 537 (14.8%) | 216 (6.7%) |
| 5:00 AM to 5:29 AM | 203 (5.6%) | 0 (0.0%) |
| 5:30 AM to 5:59 AM | 240 (6.6%) | 273 (8.5%) |
| 6:00 AM to 6:29 AM | 462 (12.7%) | 315 (9.8%) |
| 6:30 AM to 6:59 AM | 370 (10.2%) | 98 (3.1%) |
| 7:00 AM to 7:29 AM | 281 (7.7%) | 589 (18.4%) |
| 7:30 AM to 7:59 AM | 394 (10.9%) | 547 (17.1%) |
| 8:00 AM to 8:29 AM | 156 (4.3%) | 370 (11.5%) |
| 8:30 AM to 8:59 AM | 38 (1.1%) | 104 (3.2%) |
| 9:00 AM to 9:59 AM | 241 (6.7%) | 126 (3.9%) |
| 10:00 AM to 10:59 AM | 134 (3.7%) | 205 (6.4%) |
| 11:00 AM to 11:59 AM | 68 (1.9%) | 26 (0.8%) |
| 12:00 PM to 3:59 PM | 150 (4.1%) | 156 (4.9%) |
| 4:00 PM to 11:59 PM | 352 (9.7%) | 182 (5.7%) |
| Total | 3,626 (100.0%) | 3,207 (100.0%) |
Housing Occupancy in Flowing Wells
Occupancy by Ownership in Flowing Wells
Of the total 6,951 dwellings in Flowing Wells, owner-occupied units account for 4,953 (71.3%), while renter-occupied units make up 1,998 (28.7%).
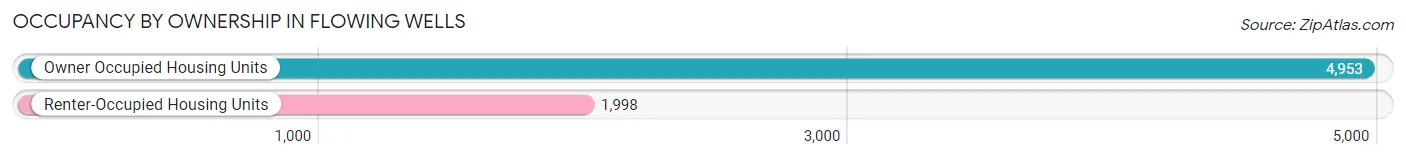
| Occupancy | # Housing Units | % Housing Units |
| Owner Occupied Housing Units | 4,953 | 71.3% |
| Renter-Occupied Housing Units | 1,998 | 28.7% |
| Total Occupied Housing Units | 6,951 | 100.0% |
Occupancy by Household Size in Flowing Wells
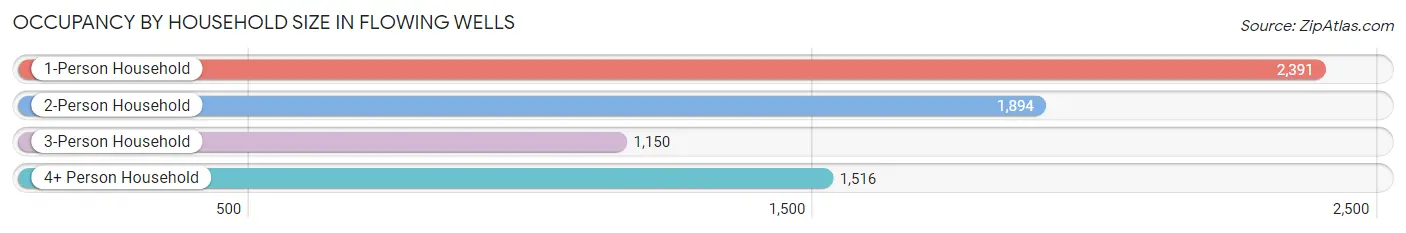
| Household Size | # Housing Units | % Housing Units |
| 1-Person Household | 2,391 | 34.4% |
| 2-Person Household | 1,894 | 27.3% |
| 3-Person Household | 1,150 | 16.5% |
| 4+ Person Household | 1,516 | 21.8% |
| Total Housing Units | 6,951 | 100.0% |
Occupancy by Ownership by Household Size in Flowing Wells
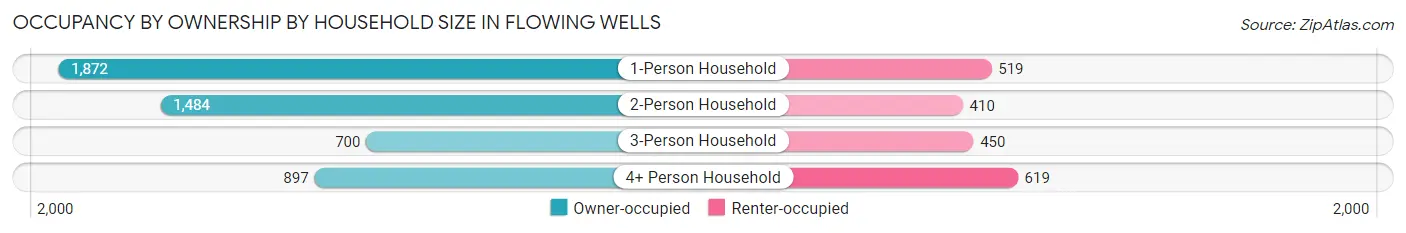
| Household Size | Owner-occupied | Renter-occupied |
| 1-Person Household | 1,872 (78.3%) | 519 (21.7%) |
| 2-Person Household | 1,484 (78.3%) | 410 (21.6%) |
| 3-Person Household | 700 (60.9%) | 450 (39.1%) |
| 4+ Person Household | 897 (59.2%) | 619 (40.8%) |
| Total Housing Units | 4,953 (71.3%) | 1,998 (28.7%) |
Occupancy by Educational Attainment in Flowing Wells
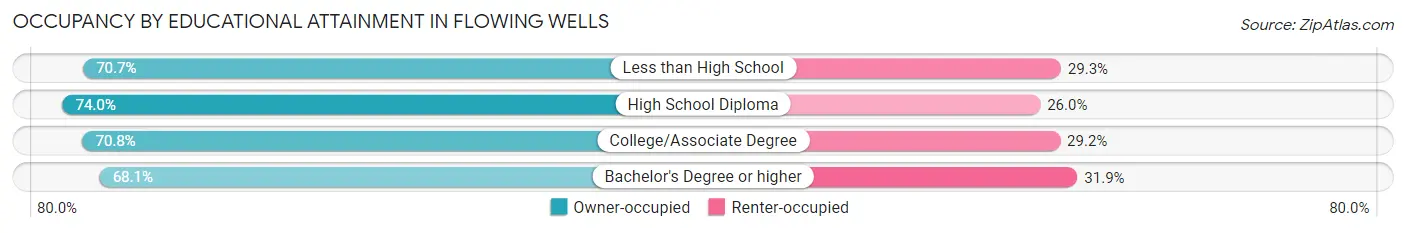
| Household Size | Owner-occupied | Renter-occupied |
| Less than High School | 731 (70.7%) | 303 (29.3%) |
| High School Diploma | 1,390 (74.0%) | 489 (26.0%) |
| College/Associate Degree | 2,143 (70.8%) | 883 (29.2%) |
| Bachelor's Degree or higher | 689 (68.1%) | 323 (31.9%) |
Occupancy by Age of Householder in Flowing Wells
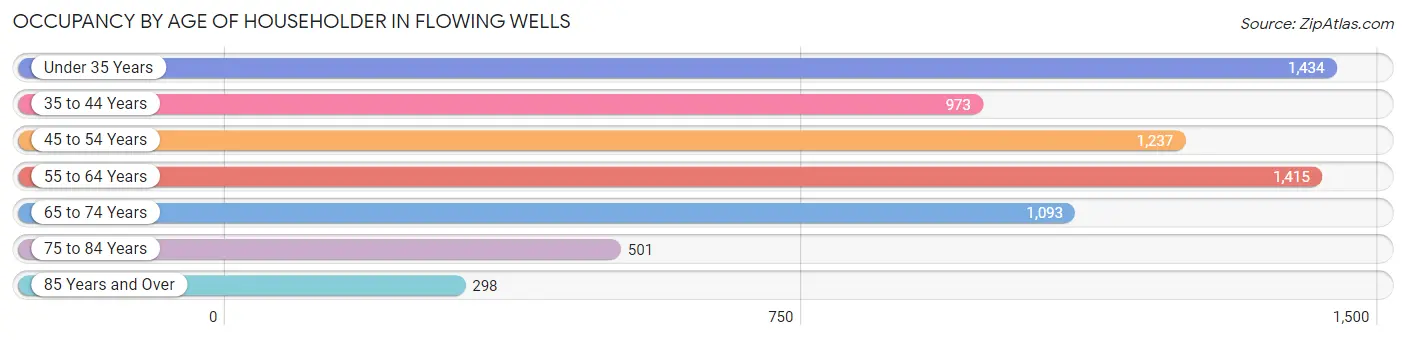
| Age Bracket | # Households | % Households |
| Under 35 Years | 1,434 | 20.6% |
| 35 to 44 Years | 973 | 14.0% |
| 45 to 54 Years | 1,237 | 17.8% |
| 55 to 64 Years | 1,415 | 20.4% |
| 65 to 74 Years | 1,093 | 15.7% |
| 75 to 84 Years | 501 | 7.2% |
| 85 Years and Over | 298 | 4.3% |
| Total | 6,951 | 100.0% |
Housing Finances in Flowing Wells
Median Income by Occupancy in Flowing Wells
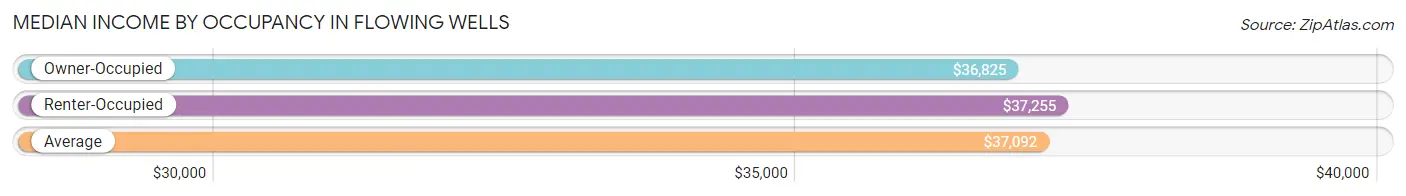
| Occupancy Type | # Households | Median Income |
| Owner-Occupied | 4,953 (71.3%) | $36,825 |
| Renter-Occupied | 1,998 (28.7%) | $37,255 |
| Average | 6,951 (100.0%) | $37,092 |
Occupancy by Householder Income Bracket in Flowing Wells
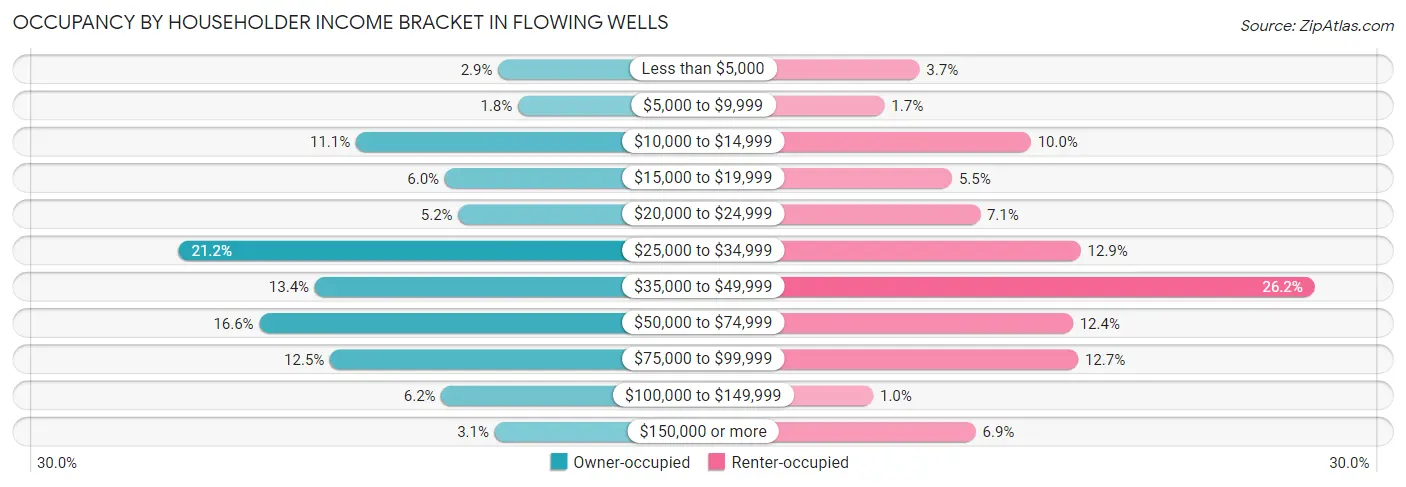
| Income Bracket | Owner-occupied | Renter-occupied |
| Less than $5,000 | 145 (2.9%) | 73 (3.6%) |
| $5,000 to $9,999 | 89 (1.8%) | 33 (1.7%) |
| $10,000 to $14,999 | 548 (11.1%) | 200 (10.0%) |
| $15,000 to $19,999 | 296 (6.0%) | 110 (5.5%) |
| $20,000 to $24,999 | 258 (5.2%) | 142 (7.1%) |
| $25,000 to $34,999 | 1,050 (21.2%) | 257 (12.9%) |
| $35,000 to $49,999 | 664 (13.4%) | 524 (26.2%) |
| $50,000 to $74,999 | 821 (16.6%) | 248 (12.4%) |
| $75,000 to $99,999 | 621 (12.5%) | 254 (12.7%) |
| $100,000 to $149,999 | 306 (6.2%) | 20 (1.0%) |
| $150,000 or more | 155 (3.1%) | 137 (6.9%) |
| Total | 4,953 (100.0%) | 1,998 (100.0%) |
Monthly Housing Cost Tiers in Flowing Wells
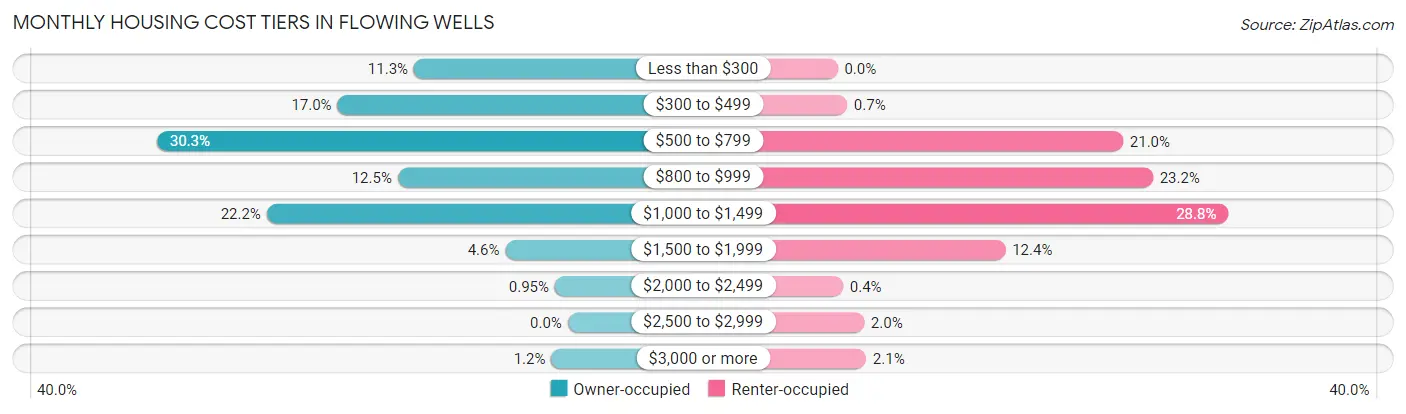
| Monthly Cost | Owner-occupied | Renter-occupied |
| Less than $300 | 561 (11.3%) | 0 (0.0%) |
| $300 to $499 | 840 (17.0%) | 14 (0.7%) |
| $500 to $799 | 1,499 (30.3%) | 420 (21.0%) |
| $800 to $999 | 620 (12.5%) | 464 (23.2%) |
| $1,000 to $1,499 | 1,098 (22.2%) | 575 (28.8%) |
| $1,500 to $1,999 | 228 (4.6%) | 247 (12.4%) |
| $2,000 to $2,499 | 47 (0.9%) | 8 (0.4%) |
| $2,500 to $2,999 | 0 (0.0%) | 39 (1.9%) |
| $3,000 or more | 60 (1.2%) | 42 (2.1%) |
| Total | 4,953 (100.0%) | 1,998 (100.0%) |
Physical Housing Characteristics in Flowing Wells
Housing Structures in Flowing Wells
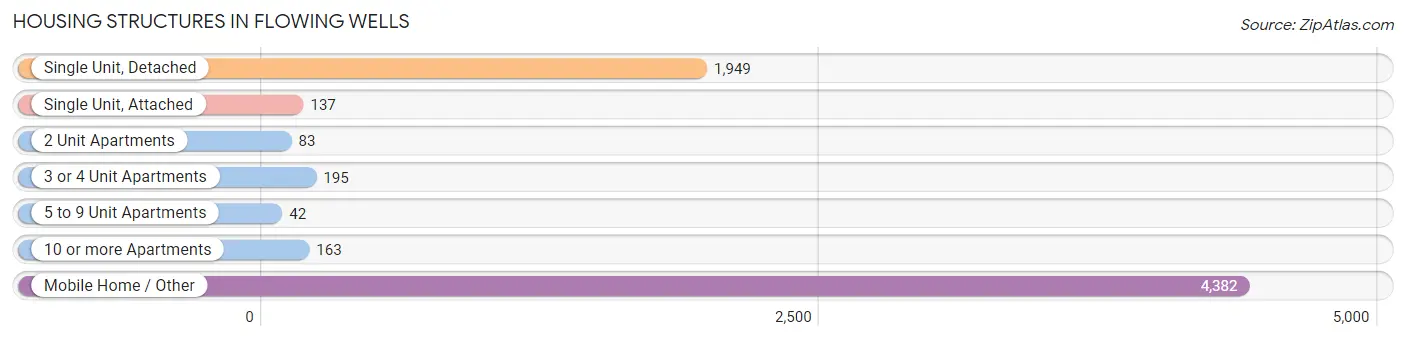
| Structure Type | # Housing Units | % Housing Units |
| Single Unit, Detached | 1,949 | 28.0% |
| Single Unit, Attached | 137 | 2.0% |
| 2 Unit Apartments | 83 | 1.2% |
| 3 or 4 Unit Apartments | 195 | 2.8% |
| 5 to 9 Unit Apartments | 42 | 0.6% |
| 10 or more Apartments | 163 | 2.3% |
| Mobile Home / Other | 4,382 | 63.0% |
| Total | 6,951 | 100.0% |
Housing Structures by Occupancy in Flowing Wells
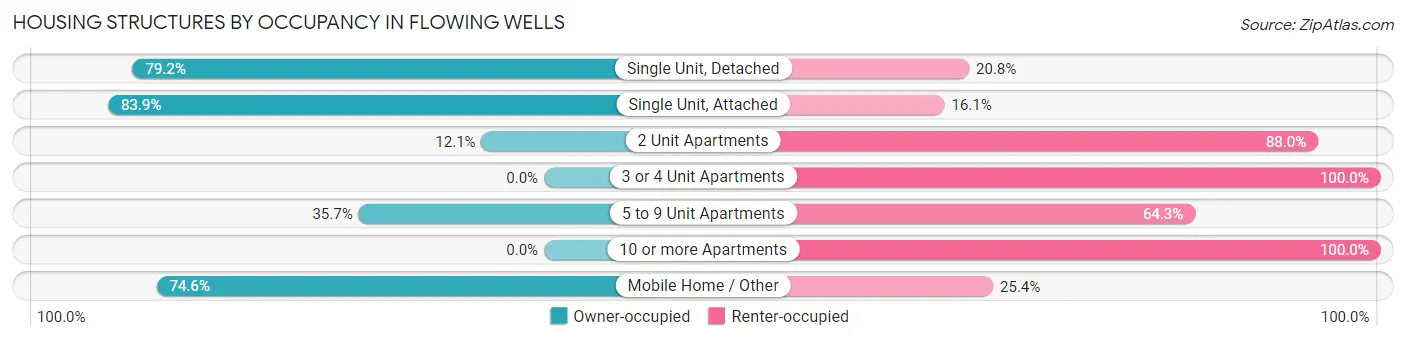
| Structure Type | Owner-occupied | Renter-occupied |
| Single Unit, Detached | 1,544 (79.2%) | 405 (20.8%) |
| Single Unit, Attached | 115 (83.9%) | 22 (16.1%) |
| 2 Unit Apartments | 10 (12.0%) | 73 (87.9%) |
| 3 or 4 Unit Apartments | 0 (0.0%) | 195 (100.0%) |
| 5 to 9 Unit Apartments | 15 (35.7%) | 27 (64.3%) |
| 10 or more Apartments | 0 (0.0%) | 163 (100.0%) |
| Mobile Home / Other | 3,269 (74.6%) | 1,113 (25.4%) |
| Total | 4,953 (71.3%) | 1,998 (28.7%) |
Housing Structures by Number of Rooms in Flowing Wells
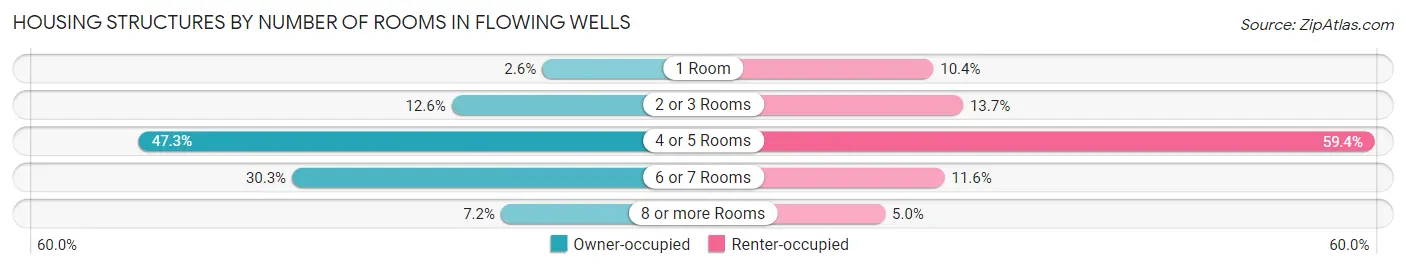
| Number of Rooms | Owner-occupied | Renter-occupied |
| 1 Room | 128 (2.6%) | 207 (10.4%) |
| 2 or 3 Rooms | 625 (12.6%) | 273 (13.7%) |
| 4 or 5 Rooms | 2,344 (47.3%) | 1,186 (59.4%) |
| 6 or 7 Rooms | 1,502 (30.3%) | 232 (11.6%) |
| 8 or more Rooms | 354 (7.1%) | 100 (5.0%) |
| Total | 4,953 (100.0%) | 1,998 (100.0%) |
Housing Structure by Heating Type in Flowing Wells
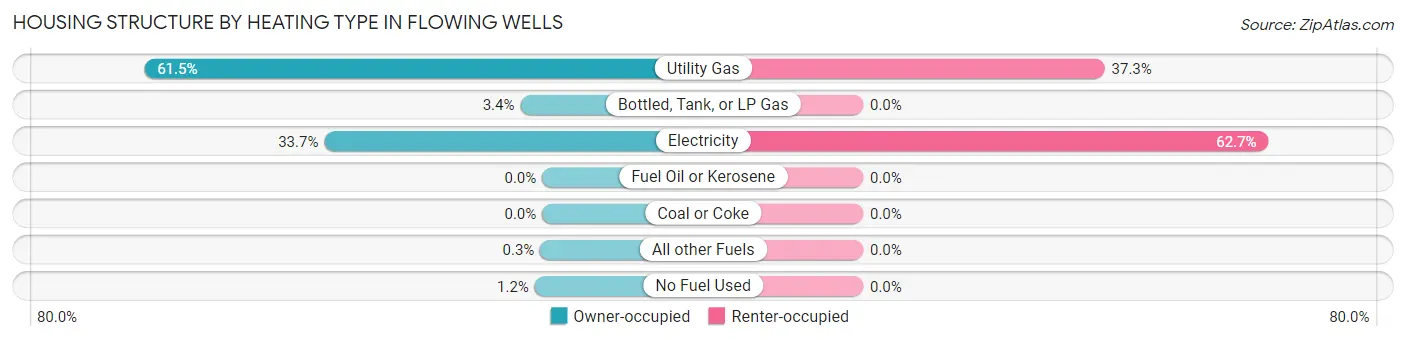
| Heating Type | Owner-occupied | Renter-occupied |
| Utility Gas | 3,046 (61.5%) | 746 (37.3%) |
| Bottled, Tank, or LP Gas | 167 (3.4%) | 0 (0.0%) |
| Electricity | 1,668 (33.7%) | 1,252 (62.7%) |
| Fuel Oil or Kerosene | 0 (0.0%) | 0 (0.0%) |
| Coal or Coke | 0 (0.0%) | 0 (0.0%) |
| All other Fuels | 15 (0.3%) | 0 (0.0%) |
| No Fuel Used | 57 (1.1%) | 0 (0.0%) |
| Total | 4,953 (100.0%) | 1,998 (100.0%) |
Household Vehicle Usage in Flowing Wells
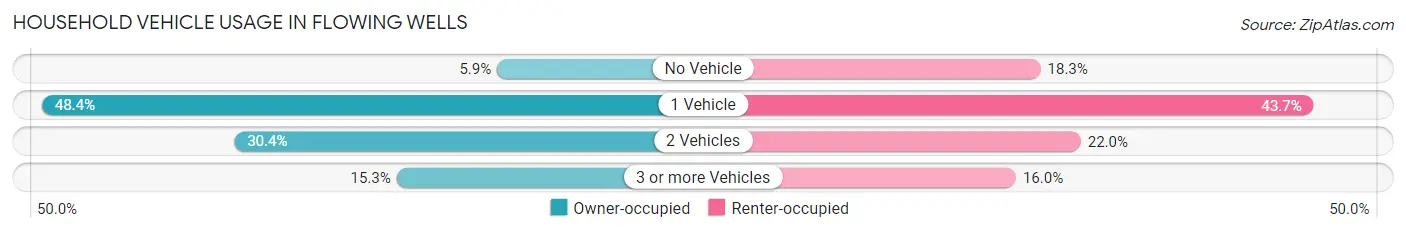
| Vehicles per Household | Owner-occupied | Renter-occupied |
| No Vehicle | 292 (5.9%) | 365 (18.3%) |
| 1 Vehicle | 2,397 (48.4%) | 874 (43.7%) |
| 2 Vehicles | 1,507 (30.4%) | 440 (22.0%) |
| 3 or more Vehicles | 757 (15.3%) | 319 (16.0%) |
| Total | 4,953 (100.0%) | 1,998 (100.0%) |
Real Estate & Mortgages in Flowing Wells
Real Estate and Mortgage Overview in Flowing Wells
| Characteristic | Without Mortgage | With Mortgage |
| Housing Units | 3,176 | 1,777 |
| Median Property Value | $18,200 | $150,000 |
| Median Household Income | $31,206 | $76 |
| Monthly Housing Costs | $585 | $17 |
| Real Estate Taxes | $457 | $69 |
Property Value by Mortgage Status in Flowing Wells
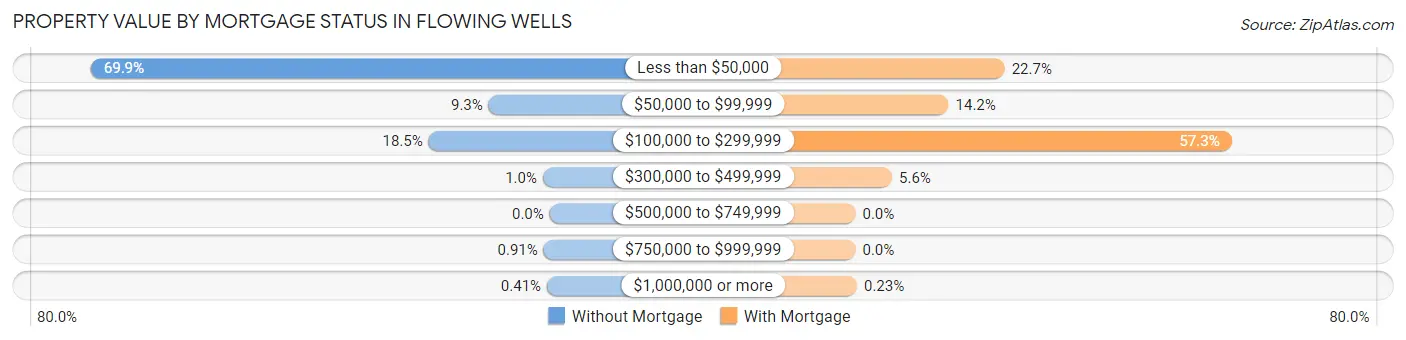
| Property Value | Without Mortgage | With Mortgage |
| Less than $50,000 | 2,220 (69.9%) | 404 (22.7%) |
| $50,000 to $99,999 | 295 (9.3%) | 252 (14.2%) |
| $100,000 to $299,999 | 586 (18.4%) | 1,018 (57.3%) |
| $300,000 to $499,999 | 33 (1.0%) | 99 (5.6%) |
| $500,000 to $749,999 | 0 (0.0%) | 0 (0.0%) |
| $750,000 to $999,999 | 29 (0.9%) | 0 (0.0%) |
| $1,000,000 or more | 13 (0.4%) | 4 (0.2%) |
| Total | 3,176 (100.0%) | 1,777 (100.0%) |
Household Income by Mortgage Status in Flowing Wells
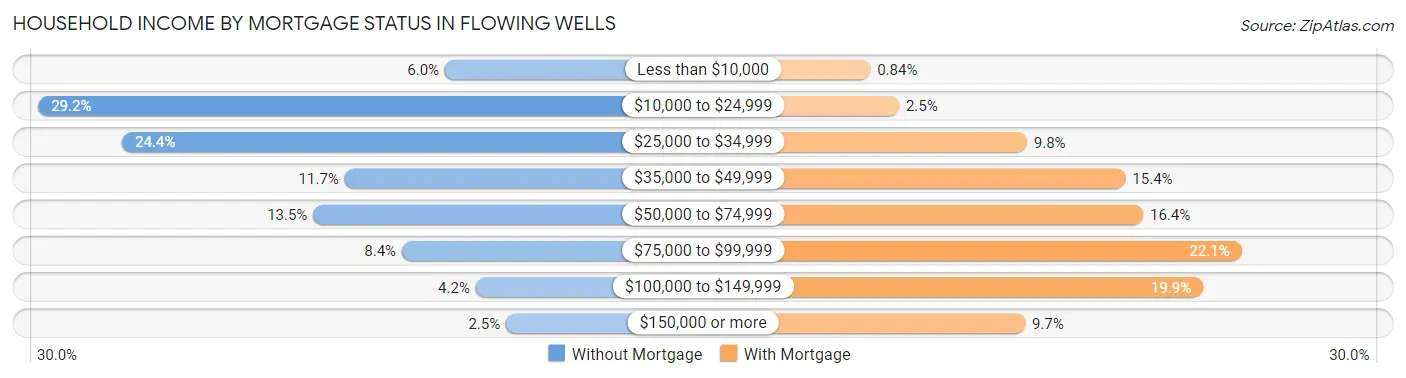
| Household Income | Without Mortgage | With Mortgage |
| Less than $10,000 | 190 (6.0%) | 15 (0.8%) |
| $10,000 to $24,999 | 928 (29.2%) | 44 (2.5%) |
| $25,000 to $34,999 | 776 (24.4%) | 174 (9.8%) |
| $35,000 to $49,999 | 372 (11.7%) | 274 (15.4%) |
| $50,000 to $74,999 | 429 (13.5%) | 292 (16.4%) |
| $75,000 to $99,999 | 268 (8.4%) | 392 (22.1%) |
| $100,000 to $149,999 | 134 (4.2%) | 353 (19.9%) |
| $150,000 or more | 79 (2.5%) | 172 (9.7%) |
| Total | 3,176 (100.0%) | 1,777 (100.0%) |
Property Value to Household Income Ratio in Flowing Wells
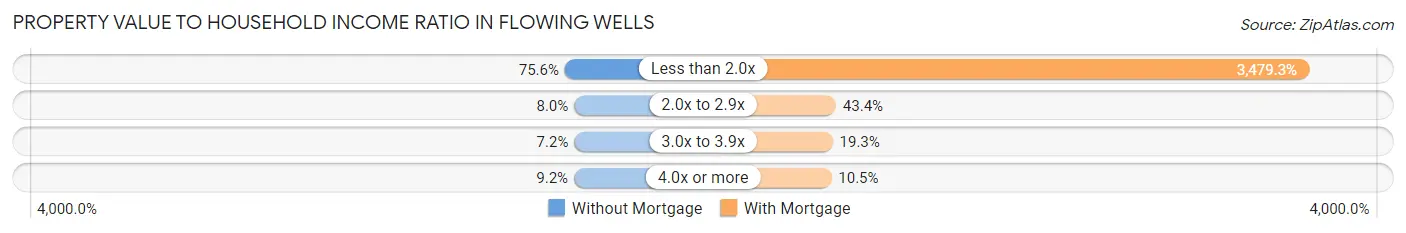
| Value-to-Income Ratio | Without Mortgage | With Mortgage |
| Less than 2.0x | 2,402 (75.6%) | 61,827 (3,479.3%) |
| 2.0x to 2.9x | 255 (8.0%) | 771 (43.4%) |
| 3.0x to 3.9x | 227 (7.1%) | 343 (19.3%) |
| 4.0x or more | 292 (9.2%) | 187 (10.5%) |
| Total | 3,176 (100.0%) | 1,777 (100.0%) |
Real Estate Taxes by Mortgage Status in Flowing Wells
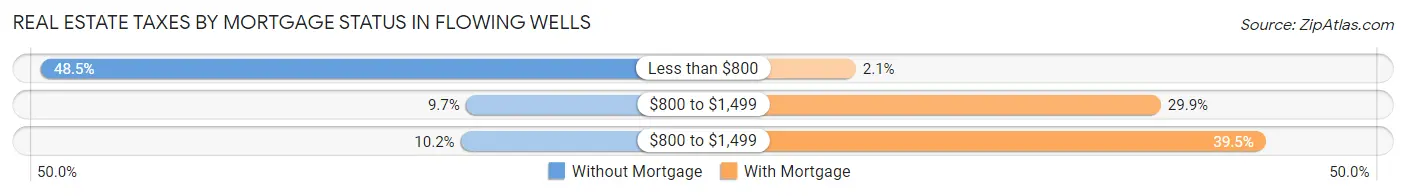
| Property Taxes | Without Mortgage | With Mortgage |
| Less than $800 | 1,540 (48.5%) | 37 (2.1%) |
| $800 to $1,499 | 309 (9.7%) | 532 (29.9%) |
| $800 to $1,499 | 324 (10.2%) | 702 (39.5%) |
| Total | 3,176 (100.0%) | 1,777 (100.0%) |
Health & Disability in Flowing Wells
Health Insurance Coverage by Age in Flowing Wells
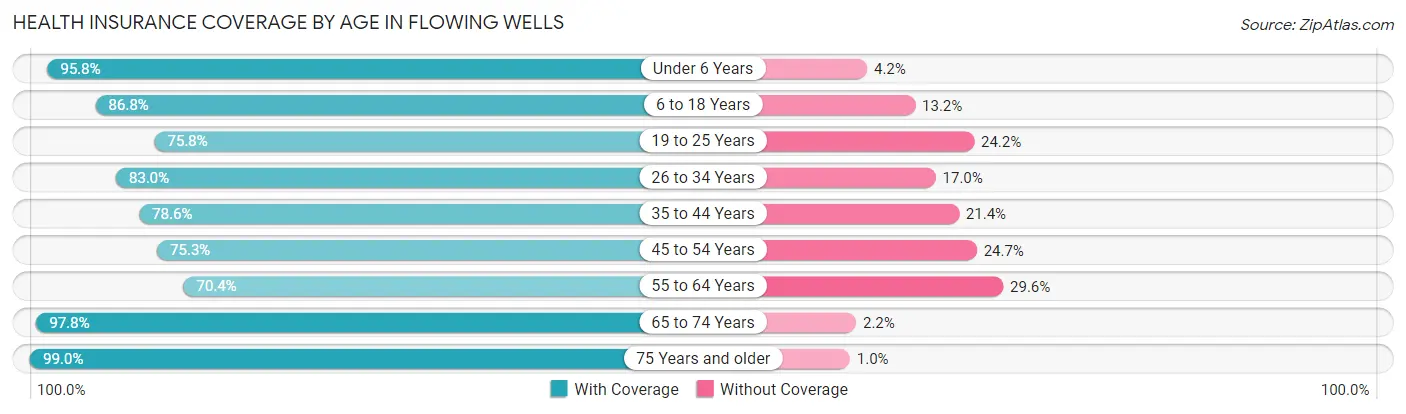
| Age Bracket | With Coverage | Without Coverage |
| Under 6 Years | 1,108 (95.8%) | 49 (4.2%) |
| 6 to 18 Years | 2,673 (86.8%) | 407 (13.2%) |
| 19 to 25 Years | 1,657 (75.8%) | 529 (24.2%) |
| 26 to 34 Years | 1,384 (83.0%) | 284 (17.0%) |
| 35 to 44 Years | 1,494 (78.6%) | 406 (21.4%) |
| 45 to 54 Years | 1,665 (75.3%) | 546 (24.7%) |
| 55 to 64 Years | 1,559 (70.4%) | 656 (29.6%) |
| 65 to 74 Years | 1,561 (97.8%) | 35 (2.2%) |
| 75 Years and older | 1,151 (99.0%) | 12 (1.0%) |
| Total | 14,252 (83.0%) | 2,924 (17.0%) |
Health Insurance Coverage by Citizenship Status in Flowing Wells
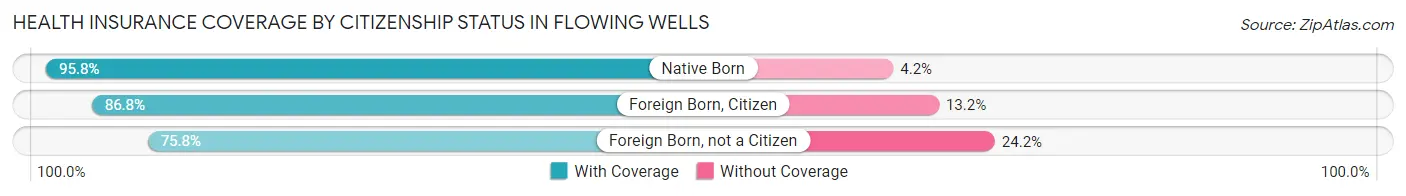
| Citizenship Status | With Coverage | Without Coverage |
| Native Born | 1,108 (95.8%) | 49 (4.2%) |
| Foreign Born, Citizen | 2,673 (86.8%) | 407 (13.2%) |
| Foreign Born, not a Citizen | 1,657 (75.8%) | 529 (24.2%) |
Health Insurance Coverage by Household Income in Flowing Wells
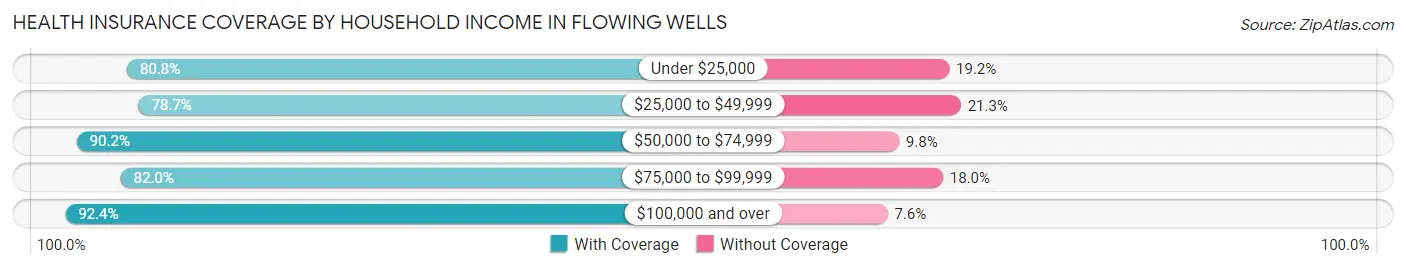
| Household Income | With Coverage | Without Coverage |
| Under $25,000 | 2,420 (80.8%) | 574 (19.2%) |
| $25,000 to $49,999 | 5,232 (78.7%) | 1,419 (21.3%) |
| $50,000 to $74,999 | 2,433 (90.2%) | 263 (9.8%) |
| $75,000 to $99,999 | 2,370 (82.0%) | 520 (18.0%) |
| $100,000 and over | 1,795 (92.4%) | 148 (7.6%) |
Public vs Private Health Insurance Coverage by Age in Flowing Wells
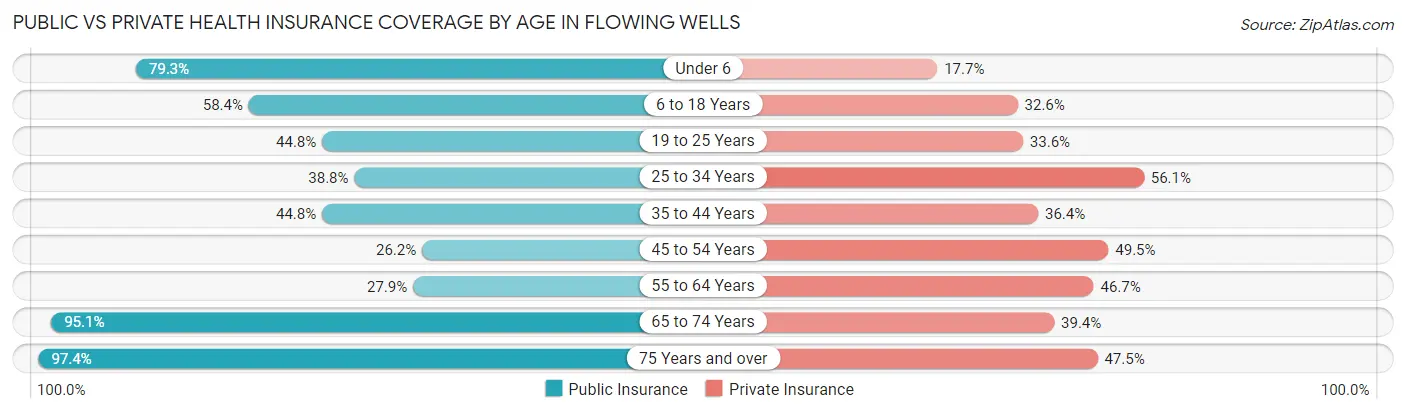
| Age Bracket | Public Insurance | Private Insurance |
| Under 6 | 918 (79.3%) | 205 (17.7%) |
| 6 to 18 Years | 1,798 (58.4%) | 1,005 (32.6%) |
| 19 to 25 Years | 979 (44.8%) | 735 (33.6%) |
| 25 to 34 Years | 647 (38.8%) | 935 (56.1%) |
| 35 to 44 Years | 851 (44.8%) | 692 (36.4%) |
| 45 to 54 Years | 580 (26.2%) | 1,094 (49.5%) |
| 55 to 64 Years | 618 (27.9%) | 1,035 (46.7%) |
| 65 to 74 Years | 1,517 (95.1%) | 629 (39.4%) |
| 75 Years and over | 1,133 (97.4%) | 552 (47.5%) |
| Total | 9,041 (52.6%) | 6,882 (40.1%) |
Disability Status by Sex by Age in Flowing Wells
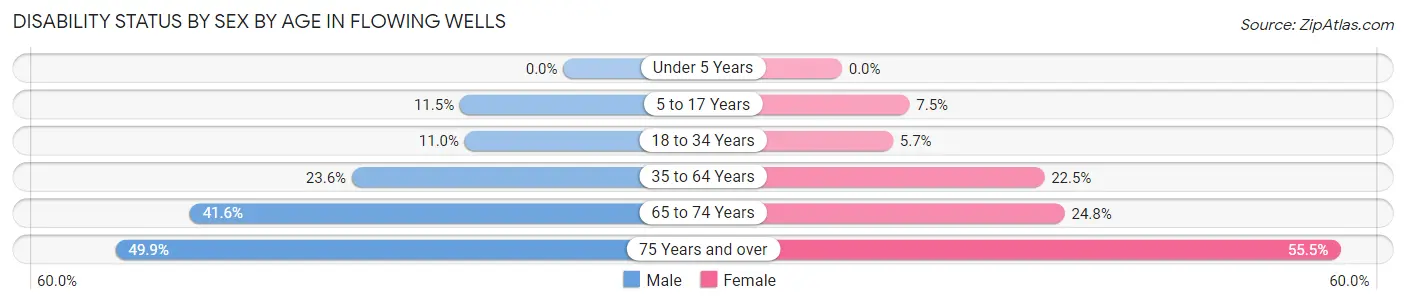
| Age Bracket | Male | Female |
| Under 5 Years | 0 (0.0%) | 0 (0.0%) |
| 5 to 17 Years | 162 (11.5%) | 117 (7.5%) |
| 18 to 34 Years | 220 (11.0%) | 114 (5.7%) |
| 35 to 64 Years | 676 (23.5%) | 779 (22.5%) |
| 65 to 74 Years | 342 (41.6%) | 192 (24.8%) |
| 75 Years and over | 189 (49.9%) | 435 (55.5%) |
Disability Class by Sex by Age in Flowing Wells
Disability Class: Hearing Difficulty
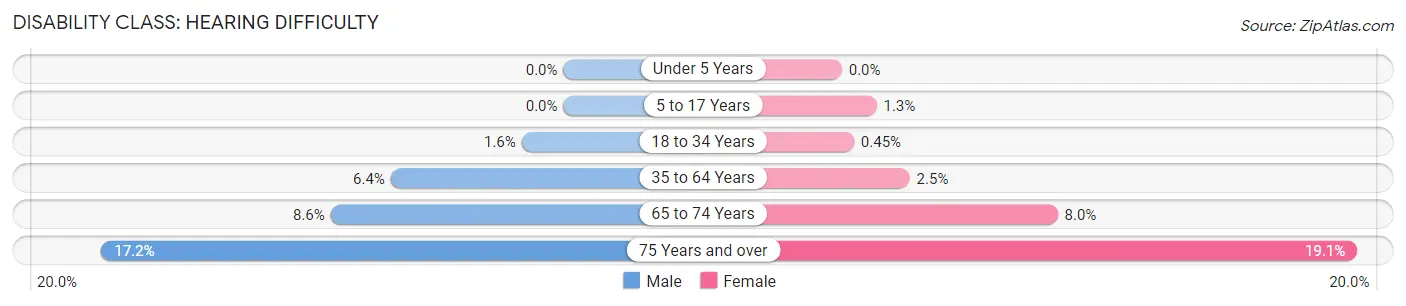
| Age Bracket | Male | Female |
| Under 5 Years | 0 (0.0%) | 0 (0.0%) |
| 5 to 17 Years | 0 (0.0%) | 20 (1.3%) |
| 18 to 34 Years | 31 (1.5%) | 9 (0.4%) |
| 35 to 64 Years | 184 (6.4%) | 87 (2.5%) |
| 65 to 74 Years | 71 (8.6%) | 62 (8.0%) |
| 75 Years and over | 65 (17.2%) | 150 (19.1%) |
Disability Class: Vision Difficulty
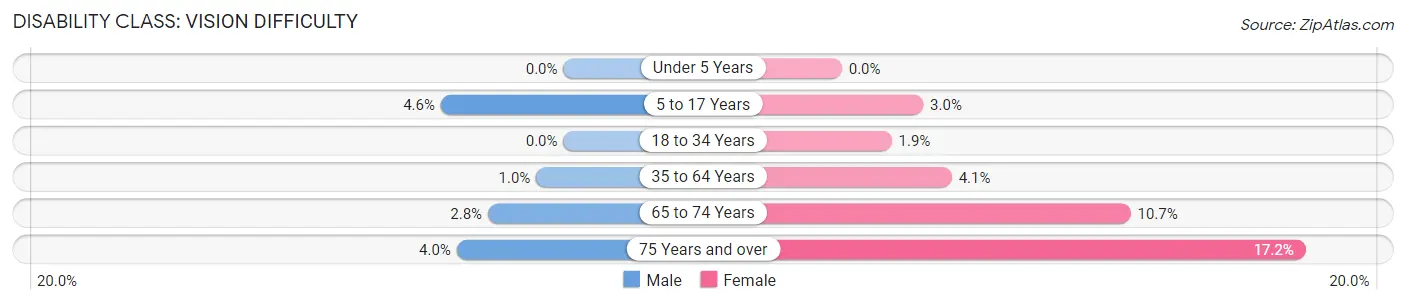
| Age Bracket | Male | Female |
| Under 5 Years | 0 (0.0%) | 0 (0.0%) |
| 5 to 17 Years | 64 (4.5%) | 47 (3.0%) |
| 18 to 34 Years | 0 (0.0%) | 37 (1.8%) |
| 35 to 64 Years | 29 (1.0%) | 141 (4.1%) |
| 65 to 74 Years | 23 (2.8%) | 83 (10.7%) |
| 75 Years and over | 15 (4.0%) | 135 (17.2%) |
Disability Class: Cognitive Difficulty
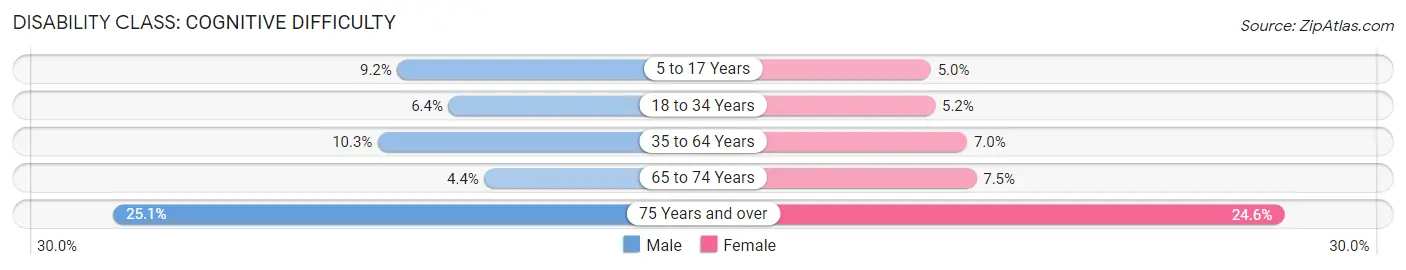
| Age Bracket | Male | Female |
| 5 to 17 Years | 130 (9.2%) | 77 (5.0%) |
| 18 to 34 Years | 128 (6.4%) | 104 (5.2%) |
| 35 to 64 Years | 296 (10.3%) | 241 (7.0%) |
| 65 to 74 Years | 36 (4.4%) | 58 (7.5%) |
| 75 Years and over | 95 (25.1%) | 193 (24.6%) |
Disability Class: Ambulatory Difficulty
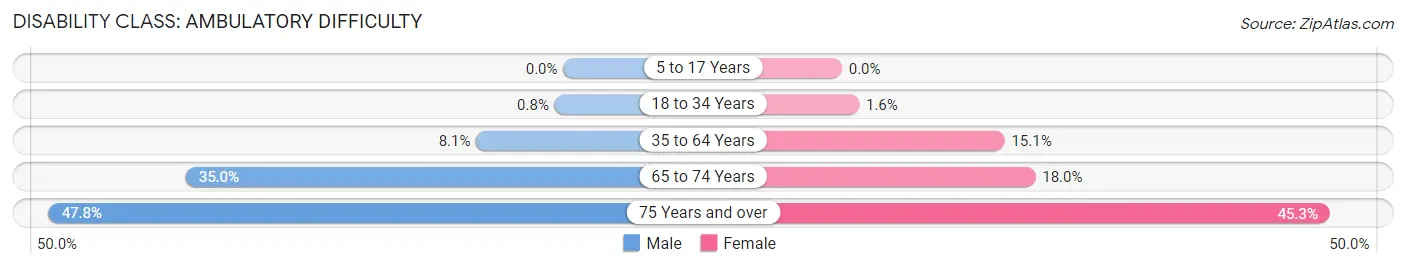
| Age Bracket | Male | Female |
| 5 to 17 Years | 0 (0.0%) | 0 (0.0%) |
| 18 to 34 Years | 16 (0.8%) | 32 (1.6%) |
| 35 to 64 Years | 232 (8.1%) | 522 (15.1%) |
| 65 to 74 Years | 288 (35.0%) | 139 (18.0%) |
| 75 Years and over | 181 (47.8%) | 355 (45.3%) |
Disability Class: Self-Care Difficulty
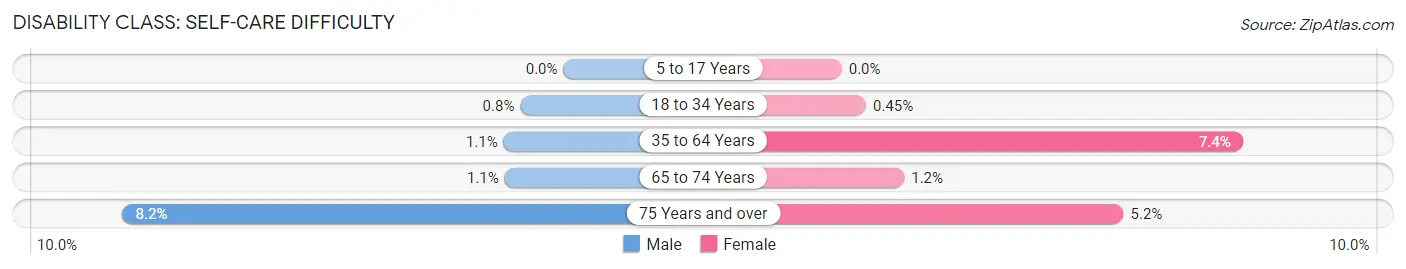
| Age Bracket | Male | Female |
| 5 to 17 Years | 0 (0.0%) | 0 (0.0%) |
| 18 to 34 Years | 16 (0.8%) | 9 (0.4%) |
| 35 to 64 Years | 32 (1.1%) | 257 (7.4%) |
| 65 to 74 Years | 9 (1.1%) | 9 (1.2%) |
| 75 Years and over | 31 (8.2%) | 41 (5.2%) |
Technology Access in Flowing Wells
Computing Device Access in Flowing Wells
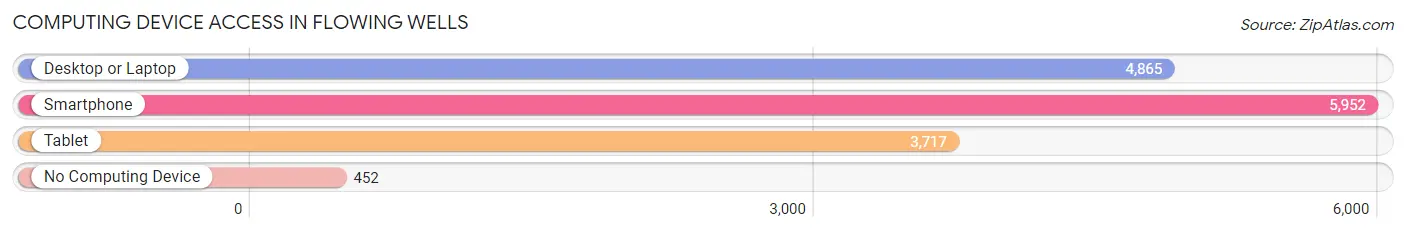
| Device Type | # Households | % Households |
| Desktop or Laptop | 4,865 | 70.0% |
| Smartphone | 5,952 | 85.6% |
| Tablet | 3,717 | 53.5% |
| No Computing Device | 452 | 6.5% |
| Total | 6,951 | 100.0% |
Internet Access in Flowing Wells
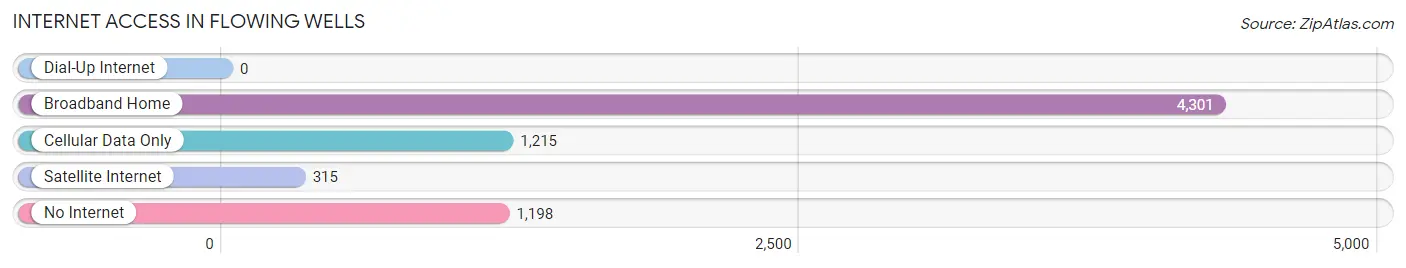
| Internet Type | # Households | % Households |
| Dial-Up Internet | 0 | 0.0% |
| Broadband Home | 4,301 | 61.9% |
| Cellular Data Only | 1,215 | 17.5% |
| Satellite Internet | 315 | 4.5% |
| No Internet | 1,198 | 17.2% |
| Total | 6,951 | 100.0% |
Flowing Wells Summary
Flowing Wells is a census-designated place (CDP) located in Pima County, Arizona. It is situated in the Tucson metropolitan area and is part of the Tucson-Nogales Combined Statistical Area. The population of Flowing Wells was 8,521 at the 2010 census.
History
The area now known as Flowing Wells was originally inhabited by the Hohokam people, who were a Native American tribe that lived in the area from around 300 BC to 1450 AD. The Hohokam were known for their irrigation systems, which were used to cultivate crops such as corn, beans, squash, and cotton.
The area was first settled by non-Native Americans in the late 19th century. The first settlers were ranchers who established ranches in the area. The area was named Flowing Wells in the early 20th century, after a nearby well that was said to have “flowed” with water.
Geography
Flowing Wells is located at 32°14'25" North, 111°1'25" West (32.240278, -111.023333). It is situated in the Tucson metropolitan area and is part of the Tucson-Nogales Combined Statistical Area.
The CDP has a total area of 4.2 square miles, all of which is land. The terrain is mostly flat, with some hills in the northern part of the CDP.
Economy
The economy of Flowing Wells is largely based on agriculture and tourism. The area is home to several farms and ranches, which produce a variety of crops such as cotton, alfalfa, and hay. The area is also home to several tourist attractions, such as the Arizona-Sonora Desert Museum and the Saguaro National Park.
Demographics
As of the 2010 census, there were 8,521 people, 2,845 households, and 2,072 families residing in the CDP. The population density was 2,037.2 people per square mile. The racial makeup of the CDP was 75.2% White, 1.3% African American, 1.2% Native American, 0.7% Asian, 0.1% Pacific Islander, 17.7% from other races, and 3.9% from two or more races. Hispanic or Latino of any race were 44.2% of the population.
The median income for a household in the CDP was $35,938, and the median income for a family was $41,944. Males had a median income of $30,917 versus $25,917 for females. The per capita income for the CDP was $15,945. About 14.2% of families and 17.7% of the population were below the poverty line, including 25.2% of those under age 18 and 8.2% of those age 65 or over.
Common Questions
What is Per Capita Income in Flowing Wells?
Per Capita income in Flowing Wells is $21,511.
What is the Median Family Income in Flowing Wells?
Median Family Income in Flowing Wells is $46,775.
What is the Median Household income in Flowing Wells?
Median Household Income in Flowing Wells is $37,092.
What is Income or Wage Gap in Flowing Wells?
Income or Wage Gap in Flowing Wells is 1.1%.
Women in Flowing Wells earn 98.9 cents for every dollar earned by a man.
What is Family Income Deficit in Flowing Wells?
Family Income Deficit in Flowing Wells is $8,492.
Families that are below poverty line in Flowing Wells earn $8,492 less on average than the poverty threshold level.
What is Inequality or Gini Index in Flowing Wells?
Inequality or Gini Index in Flowing Wells is 0.42.
What is the Total Population of Flowing Wells?
Total Population of Flowing Wells is 17,188.
What is the Total Male Population of Flowing Wells?
Total Male Population of Flowing Wells is 8,119.
What is the Total Female Population of Flowing Wells?
Total Female Population of Flowing Wells is 9,069.
What is the Ratio of Males per 100 Females in Flowing Wells?
There are 89.52 Males per 100 Females in Flowing Wells.
What is the Ratio of Females per 100 Males in Flowing Wells?
There are 111.70 Females per 100 Males in Flowing Wells.
What is the Median Population Age in Flowing Wells?
Median Population Age in Flowing Wells is 37.0 Years.
What is the Average Family Size in Flowing Wells
Average Family Size in Flowing Wells is 3.2 People.
What is the Average Household Size in Flowing Wells
Average Household Size in Flowing Wells is 2.5 People.
How Large is the Labor Force in Flowing Wells?
There are 8,516 People in the Labor Forcein in Flowing Wells.
What is the Percentage of People in the Labor Force in Flowing Wells?
62.8% of People are in the Labor Force in Flowing Wells.
What is the Unemployment Rate in Flowing Wells?
Unemployment Rate in Flowing Wells is 10.4%.