Winslow West, AZ Map & Demographics
Winslow West Map
Winslow West Overview
$16,031
PER CAPITA INCOME
$43,125
AVG HOUSEHOLD INCOME
29.2%
WAGE / INCOME GAP [ % ]
70.8¢/ $1
WAGE / INCOME GAP [ $ ]
$15,806
FAMILY INCOME DEFICIT
0.43
INEQUALITY / GINI INDEX
343
TOTAL POPULATION
184
MALE POPULATION
159
FEMALE POPULATION
115.72
MALES / 100 FEMALES
86.41
FEMALES / 100 MALES
29.9
MEDIAN AGE
3.4
AVG FAMILY SIZE
3.2
AVG HOUSEHOLD SIZE
136
LABOR FORCE [ PEOPLE ]
62.4%
PERCENT IN LABOR FORCE
11.0%
UNEMPLOYMENT RATE
Income in Winslow West
Income Overview in Winslow West
| Characteristic | Number | Measure |
| Per Capita Income | 343 | $16,031 |
| Median Family Income | 89 | $0 |
| Mean Family Income | 89 | $57,013 |
| Median Household Income | 107 | $43,125 |
| Mean Household Income | 107 | $53,761 |
| Income Deficit | 89 | $15,806 |
| Wage / Income Gap (%) | 343 | 29.18% |
| Wage / Income Gap ($) | 343 | 70.82¢ per $1 |
| Gini / Inequality Index | 343 | 0.43 |
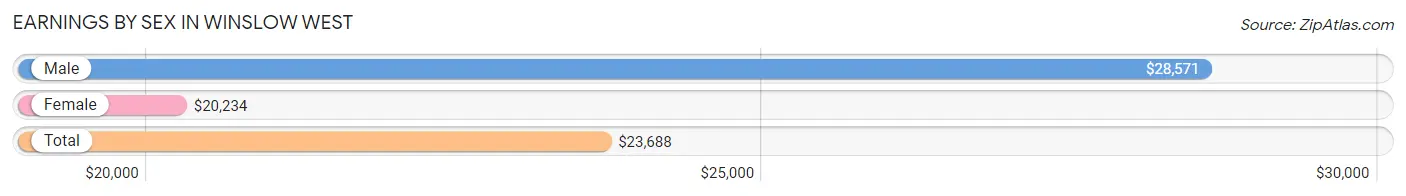
Earnings by Sex in Winslow West
Average Earnings in Winslow West are $23,688, $28,571 for men and $20,234 for women, a difference of 29.2%.
| Sex | Number | Average Earnings |
| Male | 88 (59.1%) | $28,571 |
| Female | 61 (40.9%) | $20,234 |
| Total | 149 (100.0%) | $23,688 |
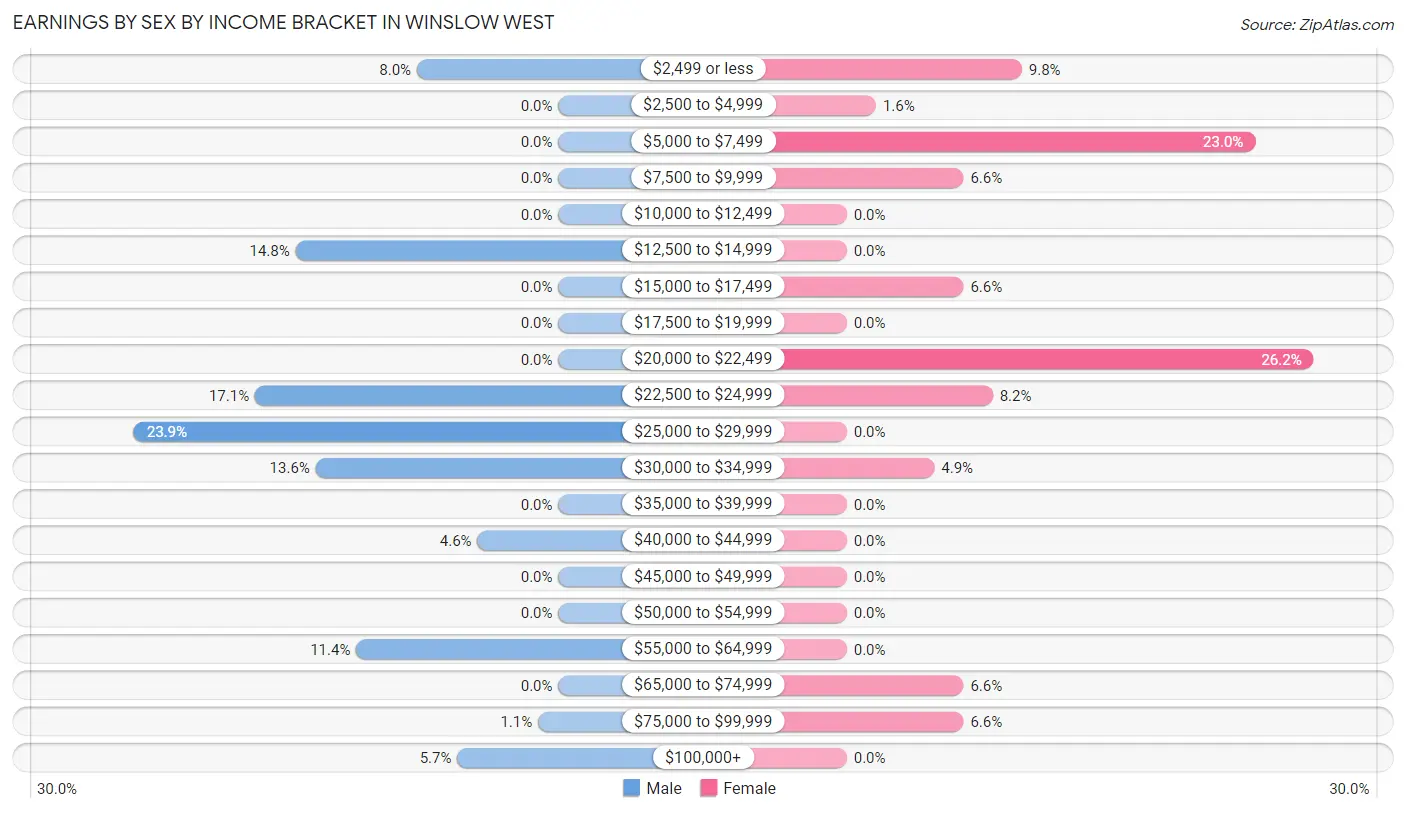
Earnings by Sex by Income Bracket in Winslow West
The most common earnings brackets in Winslow West are $25,000 to $29,999 for men (21 | 23.9%) and $20,000 to $22,499 for women (16 | 26.2%).
| Income | Male | Female |
| $2,499 or less | 7 (8.0%) | 6 (9.8%) |
| $2,500 to $4,999 | 0 (0.0%) | 1 (1.6%) |
| $5,000 to $7,499 | 0 (0.0%) | 14 (23.0%) |
| $7,500 to $9,999 | 0 (0.0%) | 4 (6.6%) |
| $10,000 to $12,499 | 0 (0.0%) | 0 (0.0%) |
| $12,500 to $14,999 | 13 (14.8%) | 0 (0.0%) |
| $15,000 to $17,499 | 0 (0.0%) | 4 (6.6%) |
| $17,500 to $19,999 | 0 (0.0%) | 0 (0.0%) |
| $20,000 to $22,499 | 0 (0.0%) | 16 (26.2%) |
| $22,500 to $24,999 | 15 (17.1%) | 5 (8.2%) |
| $25,000 to $29,999 | 21 (23.9%) | 0 (0.0%) |
| $30,000 to $34,999 | 12 (13.6%) | 3 (4.9%) |
| $35,000 to $39,999 | 0 (0.0%) | 0 (0.0%) |
| $40,000 to $44,999 | 4 (4.5%) | 0 (0.0%) |
| $45,000 to $49,999 | 0 (0.0%) | 0 (0.0%) |
| $50,000 to $54,999 | 0 (0.0%) | 0 (0.0%) |
| $55,000 to $64,999 | 10 (11.4%) | 0 (0.0%) |
| $65,000 to $74,999 | 0 (0.0%) | 4 (6.6%) |
| $75,000 to $99,999 | 1 (1.1%) | 4 (6.6%) |
| $100,000+ | 5 (5.7%) | 0 (0.0%) |
| Total | 88 (100.0%) | 61 (100.0%) |
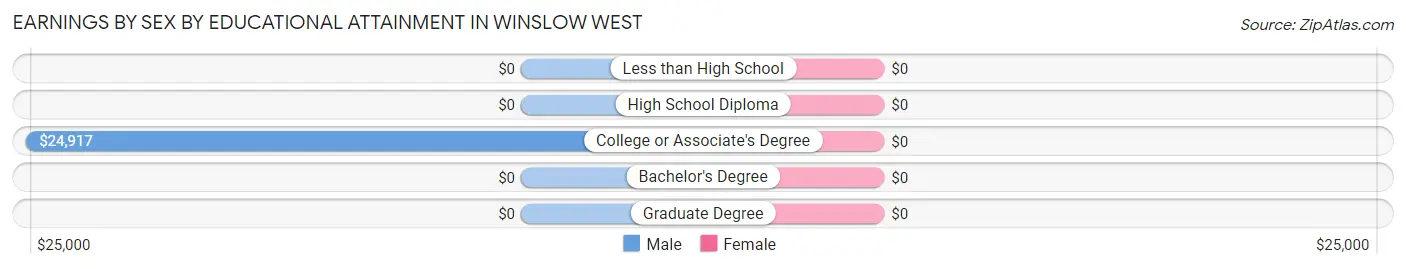
Earnings by Sex by Educational Attainment in Winslow West
| Educational Attainment | Male Income | Female Income |
| Less than High School | - | - |
| High School Diploma | - | - |
| College or Associate's Degree | $24,917 | $0 |
| Bachelor's Degree | - | - |
| Graduate Degree | - | - |
| Total | $28,988 | $18,750 |
Family Income in Winslow West
Family Income Brackets in Winslow West
According to the Winslow West family income data, there are 37 families falling into the $25,000 to $34,999 income range, which is the most common income bracket and makes up 41.6% of all families.
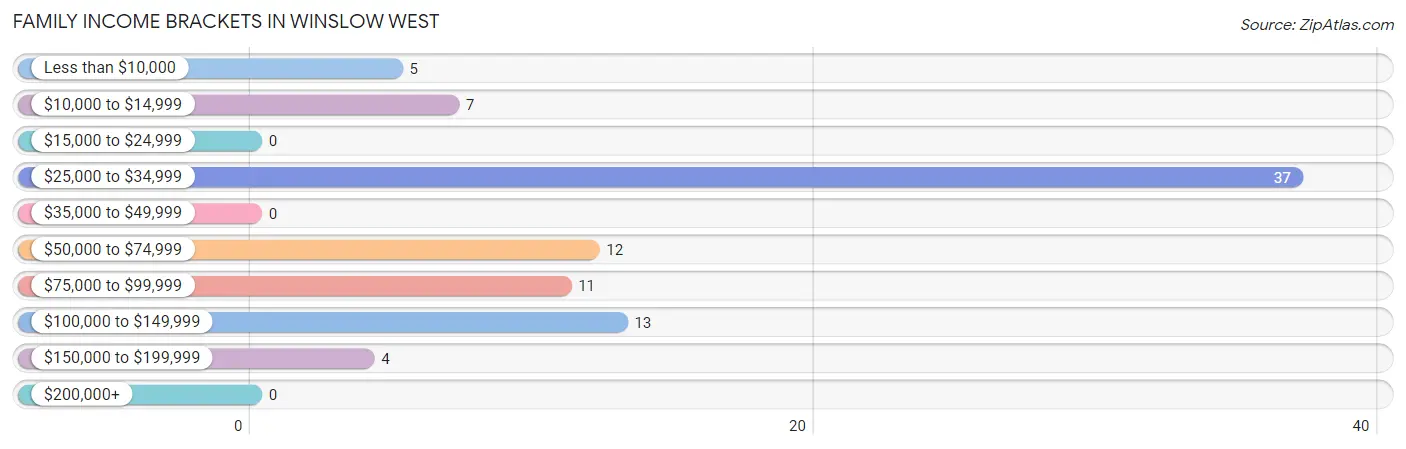
| Income Bracket | # Families | % Families |
| Less than $10,000 | 5 | 5.6% |
| $10,000 to $14,999 | 7 | 7.9% |
| $15,000 to $24,999 | 0 | 0.0% |
| $25,000 to $34,999 | 37 | 41.6% |
| $35,000 to $49,999 | 0 | 0.0% |
| $50,000 to $74,999 | 12 | 13.5% |
| $75,000 to $99,999 | 11 | 12.4% |
| $100,000 to $149,999 | 13 | 14.6% |
| $150,000 to $199,999 | 4 | 4.5% |
| $200,000+ | 0 | 0.0% |
Family Income by Famaliy Size in Winslow West
2-person families (42 | 47.2%) account for the highest median family income in Winslow West with $57,708 per family, while 2-person families (42 | 47.2%) have the highest median income of $28,854 per family member.
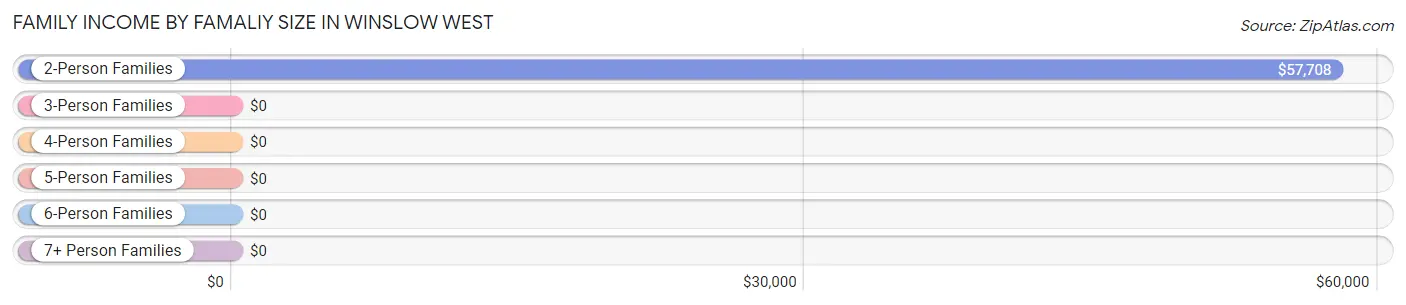
| Income Bracket | # Families | Median Income |
| 2-Person Families | 42 (47.2%) | $57,708 |
| 3-Person Families | 18 (20.2%) | $0 |
| 4-Person Families | 9 (10.1%) | $0 |
| 5-Person Families | 12 (13.5%) | $0 |
| 6-Person Families | 0 (0.0%) | $0 |
| 7+ Person Families | 8 (9.0%) | $0 |
| Total | 89 (100.0%) | $0 |
Family Income by Number of Earners in Winslow West
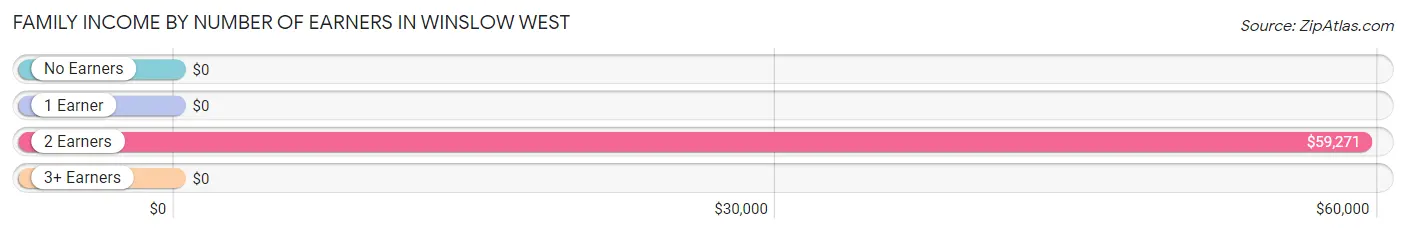
| Number of Earners | # Families | Median Income |
| No Earners | 12 (13.5%) | $0 |
| 1 Earner | 22 (24.7%) | $0 |
| 2 Earners | 47 (52.8%) | $59,271 |
| 3+ Earners | 8 (9.0%) | $0 |
| Total | 89 (100.0%) | $0 |
Household Income in Winslow West
Household Income Brackets in Winslow West
With 28 households falling in the category, the $25,000 to $34,999 income range is the most frequent in Winslow West, accounting for 26.2% of all households.
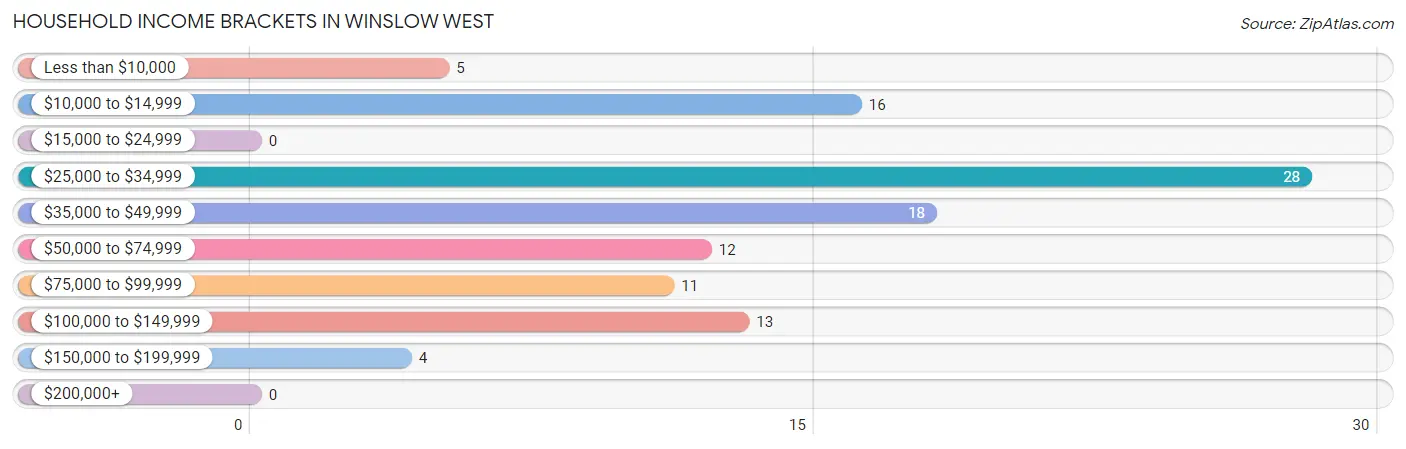
| Income Bracket | # Households | % Households |
| Less than $10,000 | 5 | 4.7% |
| $10,000 to $14,999 | 16 | 15.0% |
| $15,000 to $24,999 | 0 | 0.0% |
| $25,000 to $34,999 | 28 | 26.2% |
| $35,000 to $49,999 | 18 | 16.8% |
| $50,000 to $74,999 | 12 | 11.2% |
| $75,000 to $99,999 | 11 | 10.3% |
| $100,000 to $149,999 | 13 | 12.1% |
| $150,000 to $199,999 | 4 | 3.7% |
| $200,000+ | 0 | 0.0% |
Household Income by Householder Age in Winslow West
The median household income in Winslow West is $43,125, with the highest median household income of $57,708 found in the 25 to 44 years age bracket for the primary householder. A total of 60 households (56.1%) fall into this category. Meanwhile, the 15 to 24 years age bracket for the primary householder has the lowest median household income of $0, with 5 households (4.7%) in this group.
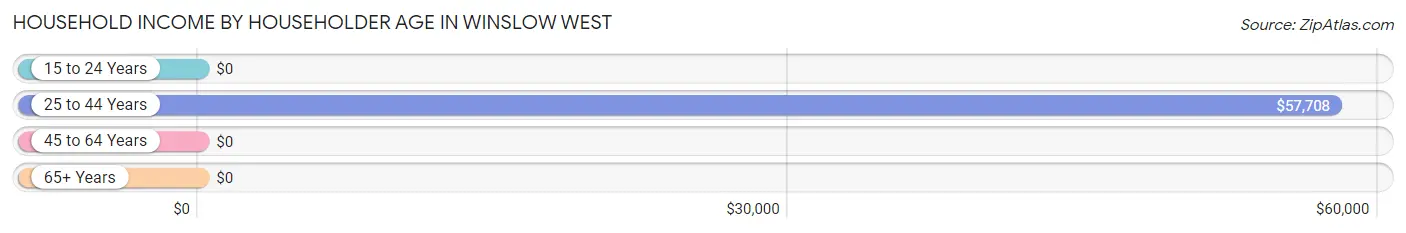
| Income Bracket | # Households | Median Income |
| 15 to 24 Years | 5 (4.7%) | $0 |
| 25 to 44 Years | 60 (56.1%) | $57,708 |
| 45 to 64 Years | 28 (26.2%) | $0 |
| 65+ Years | 14 (13.1%) | $0 |
| Total | 107 (100.0%) | $43,125 |
Poverty in Winslow West
Income Below Poverty by Sex and Age in Winslow West
With 16.3% poverty level for males and 32.7% for females among the residents of Winslow West, under 5 year old males and 16 and 17 year old females are the most vulnerable to poverty, with 5 males (100.0%) and 6 females (100.0%) in their respective age groups living below the poverty level.
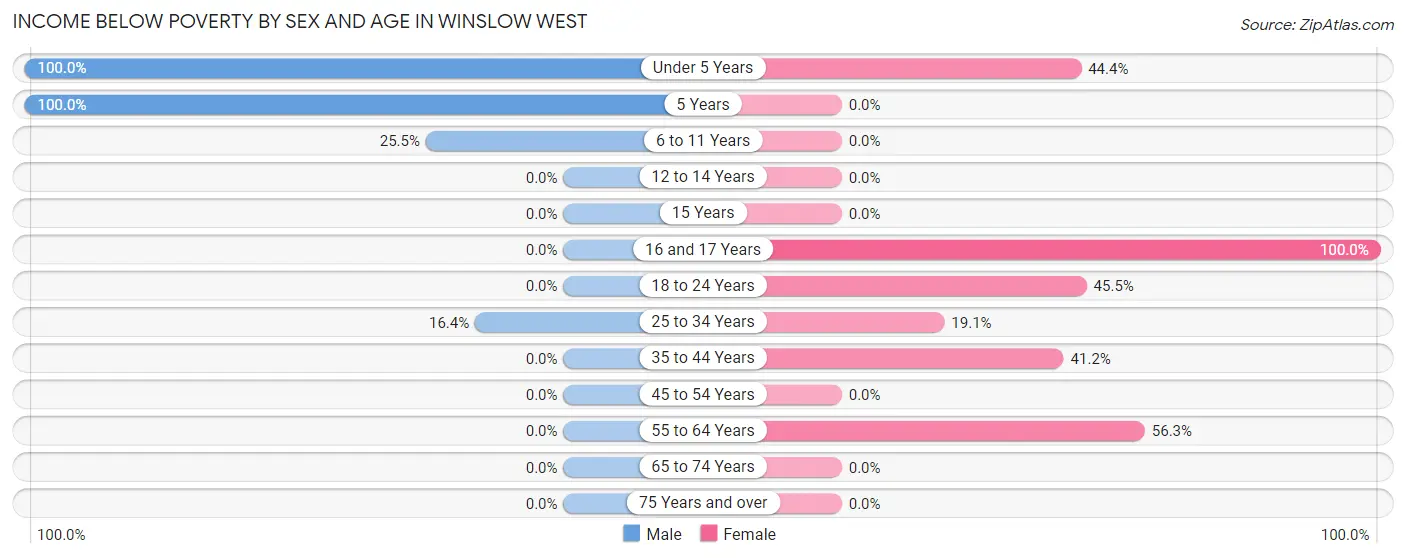
| Age Bracket | Male | Female |
| Under 5 Years | 5 (100.0%) | 12 (44.4%) |
| 5 Years | 3 (100.0%) | 0 (0.0%) |
| 6 to 11 Years | 12 (25.5%) | 0 (0.0%) |
| 12 to 14 Years | 0 (0.0%) | 0 (0.0%) |
| 15 Years | 0 (0.0%) | 0 (0.0%) |
| 16 and 17 Years | 0 (0.0%) | 6 (100.0%) |
| 18 to 24 Years | 0 (0.0%) | 5 (45.5%) |
| 25 to 34 Years | 10 (16.4%) | 4 (19.1%) |
| 35 to 44 Years | 0 (0.0%) | 7 (41.2%) |
| 45 to 54 Years | 0 (0.0%) | 0 (0.0%) |
| 55 to 64 Years | 0 (0.0%) | 18 (56.2%) |
| 65 to 74 Years | 0 (0.0%) | 0 (0.0%) |
| 75 Years and over | 0 (0.0%) | 0 (0.0%) |
| Total | 30 (16.3%) | 52 (32.7%) |
Income Above Poverty by Sex and Age in Winslow West
According to the poverty statistics in Winslow West, males aged 12 to 14 years and females aged 5 years are the age groups that are most secure financially, with 100.0% of males and 100.0% of females in these age groups living above the poverty line.
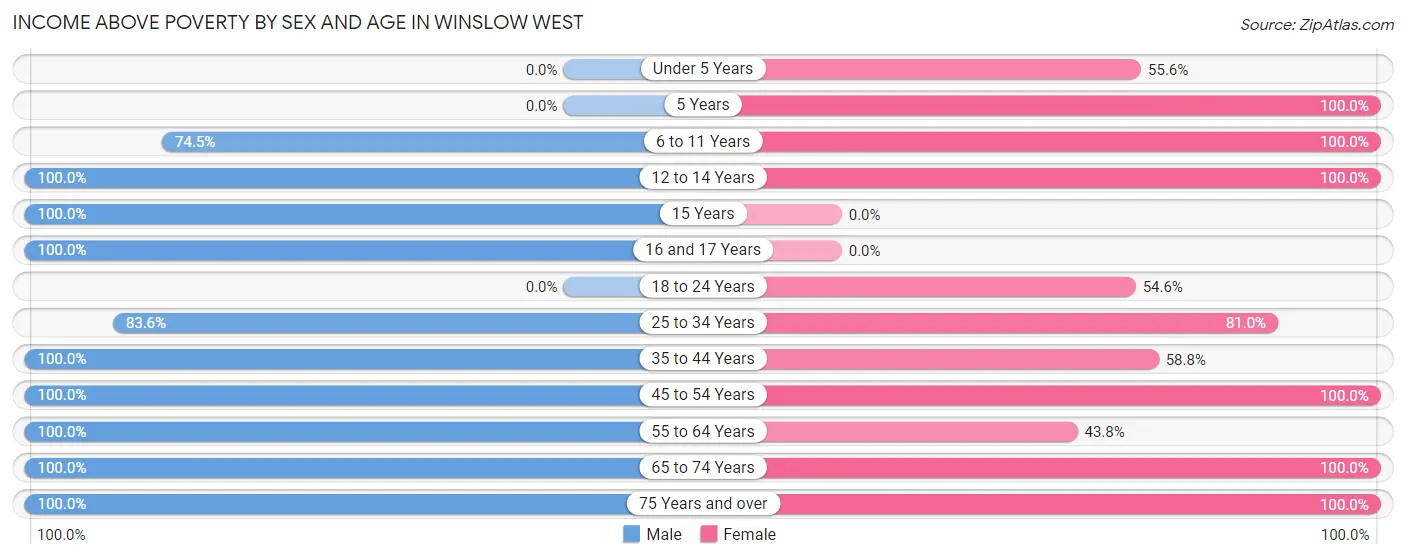
| Age Bracket | Male | Female |
| Under 5 Years | 0 (0.0%) | 15 (55.6%) |
| 5 Years | 0 (0.0%) | 1 (100.0%) |
| 6 to 11 Years | 35 (74.5%) | 5 (100.0%) |
| 12 to 14 Years | 9 (100.0%) | 21 (100.0%) |
| 15 Years | 7 (100.0%) | 0 (0.0%) |
| 16 and 17 Years | 7 (100.0%) | 0 (0.0%) |
| 18 to 24 Years | 0 (0.0%) | 6 (54.5%) |
| 25 to 34 Years | 51 (83.6%) | 17 (80.9%) |
| 35 to 44 Years | 5 (100.0%) | 10 (58.8%) |
| 45 to 54 Years | 19 (100.0%) | 9 (100.0%) |
| 55 to 64 Years | 4 (100.0%) | 14 (43.8%) |
| 65 to 74 Years | 5 (100.0%) | 4 (100.0%) |
| 75 Years and over | 12 (100.0%) | 5 (100.0%) |
| Total | 154 (83.7%) | 107 (67.3%) |
Income Below Poverty Among Married-Couple Families in Winslow West
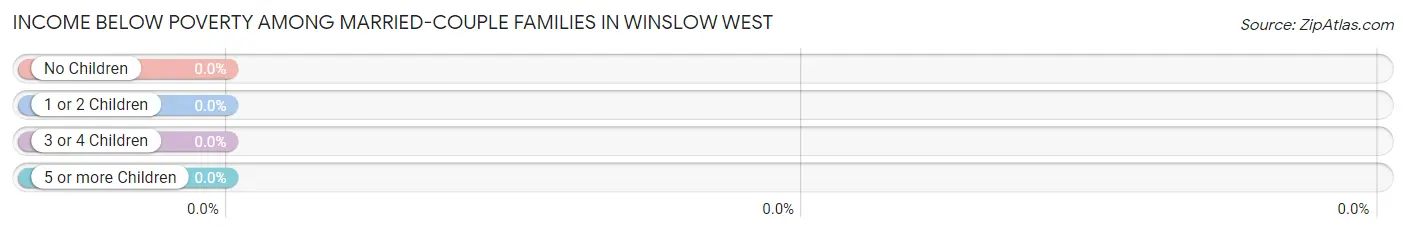
| Children | Above Poverty | Below Poverty |
| No Children | 20 (100.0%) | 0 (0.0%) |
| 1 or 2 Children | 4 (100.0%) | 0 (0.0%) |
| 3 or 4 Children | 1 (100.0%) | 0 (0.0%) |
| 5 or more Children | 8 (100.0%) | 0 (0.0%) |
| Total | 33 (100.0%) | 0 (0.0%) |
Income Below Poverty Among Single-Parent Households in Winslow West
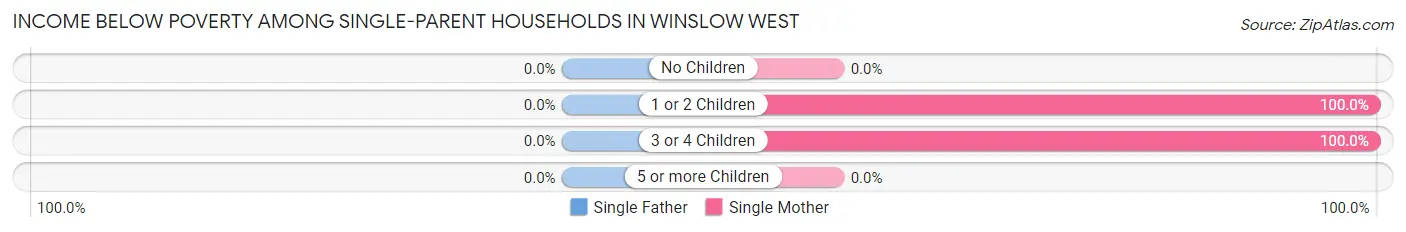
| Children | Single Father | Single Mother |
| No Children | 0 (0.0%) | 0 (0.0%) |
| 1 or 2 Children | 0 (0.0%) | 5 (100.0%) |
| 3 or 4 Children | 0 (0.0%) | 11 (100.0%) |
| 5 or more Children | 0 (0.0%) | 0 (0.0%) |
| Total | 0 (0.0%) | 16 (57.1%) |
Income Below Poverty Among Married-Couple vs Single-Parent Households in Winslow West
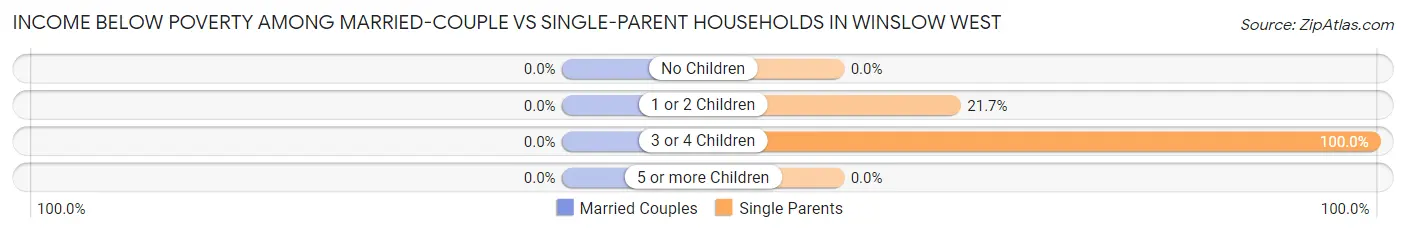
| Children | Married-Couple Families | Single-Parent Households |
| No Children | 0 (0.0%) | 0 (0.0%) |
| 1 or 2 Children | 0 (0.0%) | 5 (21.7%) |
| 3 or 4 Children | 0 (0.0%) | 11 (100.0%) |
| 5 or more Children | 0 (0.0%) | 0 (0.0%) |
| Total | 0 (0.0%) | 16 (28.6%) |
Race in Winslow West
The most populous races in Winslow West are White / Caucasian (178 | 51.9%), Native / Alaskan (155 | 45.2%), and Hispanic or Latino (38 | 11.1%).
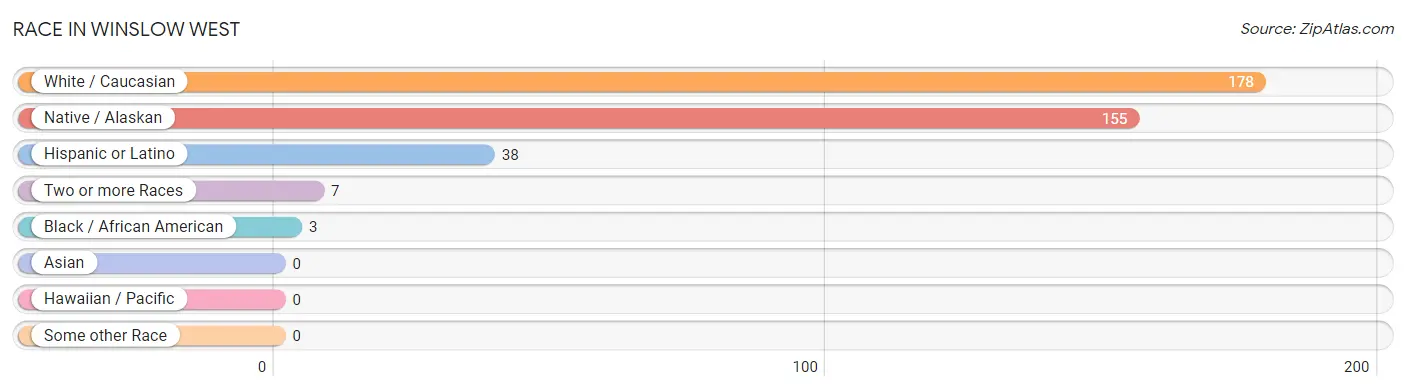
| Race | # Population | % Population |
| Asian | 0 | 0.0% |
| Black / African American | 3 | 0.9% |
| Hawaiian / Pacific | 0 | 0.0% |
| Hispanic or Latino | 38 | 11.1% |
| Native / Alaskan | 155 | 45.2% |
| White / Caucasian | 178 | 51.9% |
| Two or more Races | 7 | 2.0% |
| Some other Race | 0 | 0.0% |
| Total | 343 | 100.0% |
Ancestry in Winslow West
The most populous ancestries reported in Winslow West are Hopi (104 | 30.3%), English (64 | 18.7%), Navajo (55 | 16.0%), German (43 | 12.5%), and Mexican (38 | 11.1%), together accounting for 88.6% of all Winslow West residents.
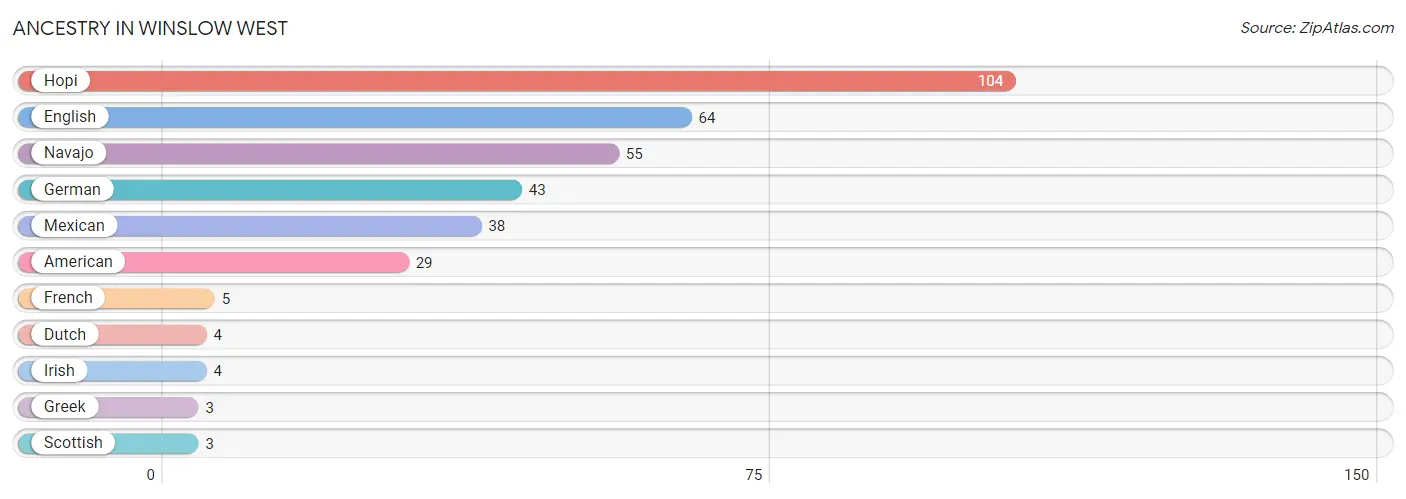
| Ancestry | # Population | % Population |
| American | 29 | 8.5% |
| Dutch | 4 | 1.2% |
| English | 64 | 18.7% |
| French | 5 | 1.5% |
| German | 43 | 12.5% |
| Greek | 3 | 0.9% |
| Hopi | 104 | 30.3% |
| Irish | 4 | 1.2% |
| Mexican | 38 | 11.1% |
| Navajo | 55 | 16.0% |
| Scottish | 3 | 0.9% | View All 11 Rows |
Immigrants in Winslow West

| Immigration Origin | # Population | % Population | View All 0 Rows |
Sex and Age in Winslow West
Sex and Age in Winslow West
The most populous age groups in Winslow West are 30 to 34 Years (45 | 24.5%) for men and 55 to 59 Years (32 | 20.1%) for women.
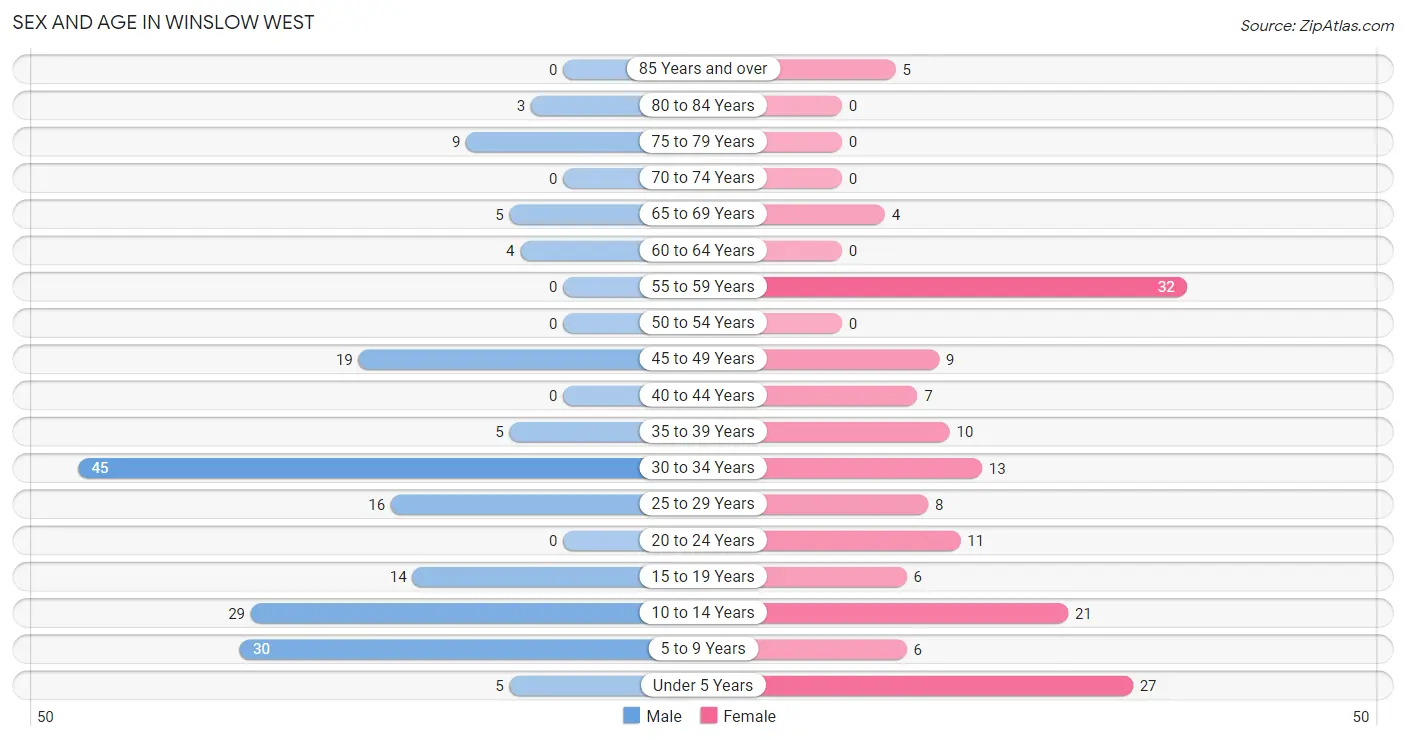
| Age Bracket | Male | Female |
| Under 5 Years | 5 (2.7%) | 27 (17.0%) |
| 5 to 9 Years | 30 (16.3%) | 6 (3.8%) |
| 10 to 14 Years | 29 (15.8%) | 21 (13.2%) |
| 15 to 19 Years | 14 (7.6%) | 6 (3.8%) |
| 20 to 24 Years | 0 (0.0%) | 11 (6.9%) |
| 25 to 29 Years | 16 (8.7%) | 8 (5.0%) |
| 30 to 34 Years | 45 (24.5%) | 13 (8.2%) |
| 35 to 39 Years | 5 (2.7%) | 10 (6.3%) |
| 40 to 44 Years | 0 (0.0%) | 7 (4.4%) |
| 45 to 49 Years | 19 (10.3%) | 9 (5.7%) |
| 50 to 54 Years | 0 (0.0%) | 0 (0.0%) |
| 55 to 59 Years | 0 (0.0%) | 32 (20.1%) |
| 60 to 64 Years | 4 (2.2%) | 0 (0.0%) |
| 65 to 69 Years | 5 (2.7%) | 4 (2.5%) |
| 70 to 74 Years | 0 (0.0%) | 0 (0.0%) |
| 75 to 79 Years | 9 (4.9%) | 0 (0.0%) |
| 80 to 84 Years | 3 (1.6%) | 0 (0.0%) |
| 85 Years and over | 0 (0.0%) | 5 (3.1%) |
| Total | 184 (100.0%) | 159 (100.0%) |
Families and Households in Winslow West
Median Family Size in Winslow West
The median family size in Winslow West is 3.38 persons per family, with married-couple families (33 | 37.1%) accounting for the largest median family size of 4.91 persons per family. On the other hand, single male/father families (28 | 31.5%) represent the smallest median family size with 2.18 persons per family.

| Family Type | # Families | Family Size |
| Married-Couple | 33 (37.1%) | 4.91 |
| Single Male/Father | 28 (31.5%) | 2.18 |
| Single Female/Mother | 28 (31.5%) | 2.79 |
| Total Families | 89 (100.0%) | 3.38 |
Median Household Size in Winslow West
The median household size in Winslow West is 3.21 persons per household, with married-couple households (33 | 30.8%) accounting for the largest median household size of 5.06 persons per household. non-family households (18 | 16.8%) represent the smallest median household size with 1.50 persons per household.
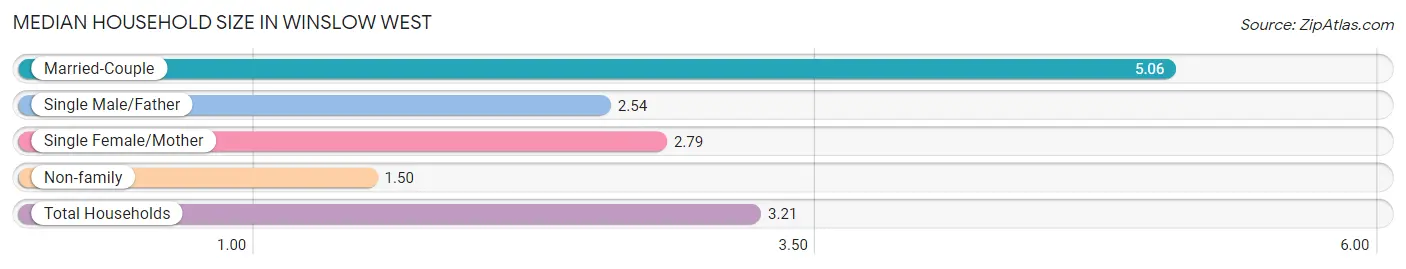
| Household Type | # Households | Household Size |
| Married-Couple | 33 (30.8%) | 5.06 |
| Single Male/Father | 28 (26.2%) | 2.54 |
| Single Female/Mother | 28 (26.2%) | 2.79 |
| Non-family | 18 (16.8%) | 1.50 |
| Total Households | 107 (100.0%) | 3.21 |
Household Size by Marriage Status in Winslow West
Out of a total of 107 households in Winslow West, 89 (83.2%) are family households, while 18 (16.8%) are nonfamily households. The most numerous type of family households are 2-person households, comprising 42, and the most common type of nonfamily households are 1-person households, comprising 9.
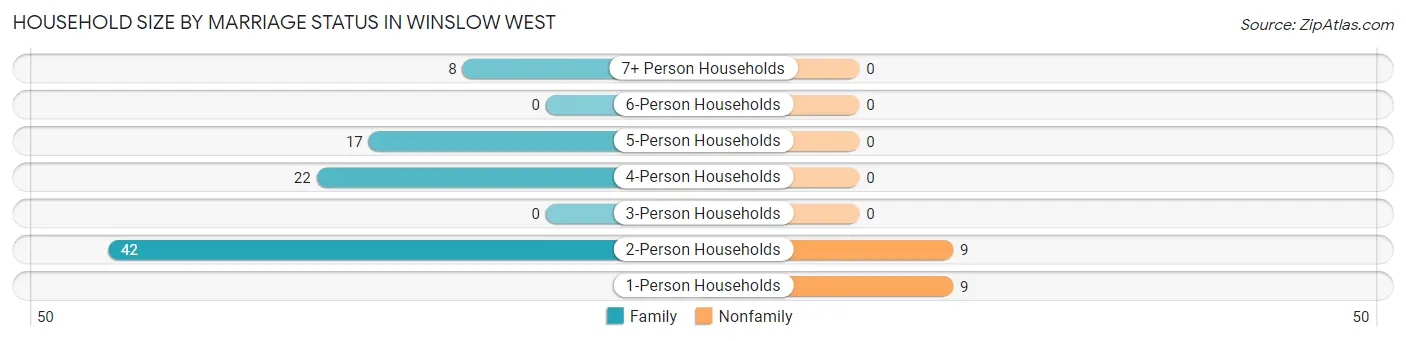
| Household Size | Family Households | Nonfamily Households |
| 1-Person Households | - | 9 (8.4%) |
| 2-Person Households | 42 (39.3%) | 9 (8.4%) |
| 3-Person Households | 0 (0.0%) | 0 (0.0%) |
| 4-Person Households | 22 (20.6%) | 0 (0.0%) |
| 5-Person Households | 17 (15.9%) | 0 (0.0%) |
| 6-Person Households | 0 (0.0%) | 0 (0.0%) |
| 7+ Person Households | 8 (7.5%) | 0 (0.0%) |
| Total | 89 (83.2%) | 18 (16.8%) |
Female Fertility in Winslow West
Fertility by Age in Winslow West
| Age Bracket | Women with Births | Births / 1,000 Women |
| 15 to 19 years | 0 (0.0%) | 0.0 |
| 20 to 34 years | 0 (0.0%) | 0.0 |
| 35 to 50 years | 0 (0.0%) | 0.0 |
| Total | 0 (0.0%) | 0.0 |
Fertility by Age by Marriage Status in Winslow West
| Age Bracket | Married | Unmarried |
| 15 to 19 years | 0 (0.0%) | 0 (0.0%) |
| 20 to 34 years | 0 (0.0%) | 0 (0.0%) |
| 35 to 50 years | 0 (0.0%) | 0 (0.0%) |
| Total | 0 (0.0%) | 0 (0.0%) |
Fertility by Education in Winslow West
| Educational Attainment | Women with Births | Births / 1,000 Women |
| Less than High School | 0 (0.0%) | 0.0 |
| High School Diploma | 0 (0.0%) | 0.0 |
| College or Associate's Degree | 0 (0.0%) | 0.0 |
| Bachelor's Degree | 0 (0.0%) | 0.0 |
| Graduate Degree | 0 (0.0%) | 0.0 |
| Total | 0 (0.0%) | 0.0 |
Fertility by Education by Marriage Status in Winslow West
| Educational Attainment | Married | Unmarried |
| Less than High School | 0 (0.0%) | 0 (0.0%) |
| High School Diploma | 0 (0.0%) | 0 (0.0%) |
| College or Associate's Degree | 0 (0.0%) | 0 (0.0%) |
| Bachelor's Degree | 0 (0.0%) | 0 (0.0%) |
| Graduate Degree | 0 (0.0%) | 0 (0.0%) |
| Total | 0 (0.0%) | 0 (0.0%) |
Employment Characteristics in Winslow West
Employment by Class of Employer in Winslow West
Among the 121 employed individuals in Winslow West, private company employees (90 | 74.4%), self-employed (not incorporated) (12 | 9.9%), and local government employees (11 | 9.1%) make up the most common classes of employment.
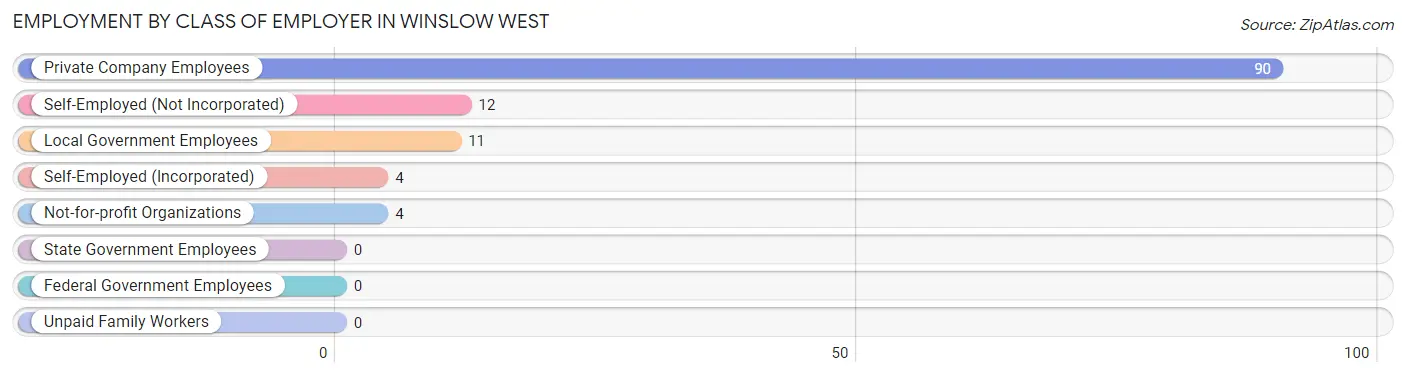
| Employer Class | # Employees | % Employees |
| Private Company Employees | 90 | 74.4% |
| Self-Employed (Incorporated) | 4 | 3.3% |
| Self-Employed (Not Incorporated) | 12 | 9.9% |
| Not-for-profit Organizations | 4 | 3.3% |
| Local Government Employees | 11 | 9.1% |
| State Government Employees | 0 | 0.0% |
| Federal Government Employees | 0 | 0.0% |
| Unpaid Family Workers | 0 | 0.0% |
| Total | 121 | 100.0% |
Employment Status by Age in Winslow West
According to the labor force statistics for Winslow West, out of the total population over 16 years of age (218), 62.4% or 136 individuals are in the labor force, with 11.0% or 15 of them unemployed. The age group with the highest labor force participation rate is 20 to 24 years, with 100.0% or 11 individuals in the labor force. Within the labor force, the 20 to 24 years age range has the highest percentage of unemployed individuals, with 72.7% or 8 of them being unemployed.
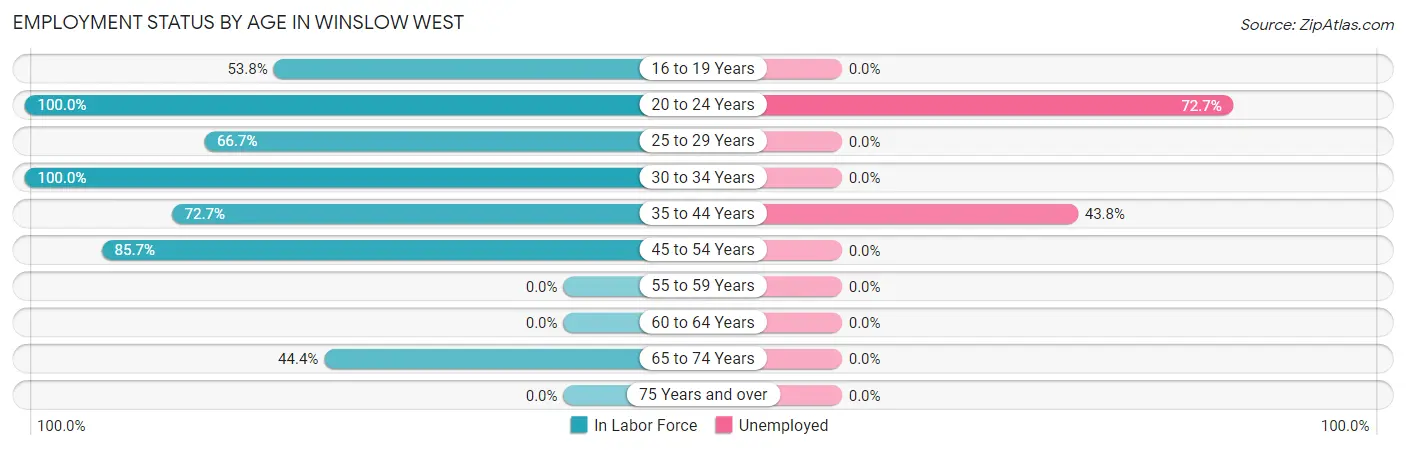
| Age Bracket | In Labor Force | Unemployed |
| 16 to 19 Years | 7 (53.8%) | 0 (0.0%) |
| 20 to 24 Years | 11 (100.0%) | 8 (72.7%) |
| 25 to 29 Years | 16 (66.7%) | 0 (0.0%) |
| 30 to 34 Years | 58 (100.0%) | 0 (0.0%) |
| 35 to 44 Years | 16 (72.7%) | 7 (43.8%) |
| 45 to 54 Years | 24 (85.7%) | 0 (0.0%) |
| 55 to 59 Years | 0 (0.0%) | 0 (0.0%) |
| 60 to 64 Years | 0 (0.0%) | 0 (0.0%) |
| 65 to 74 Years | 4 (44.4%) | 0 (0.0%) |
| 75 Years and over | 0 (0.0%) | 0 (0.0%) |
| Total | 136 (62.4%) | 15 (11.0%) |
Employment Status by Educational Attainment in Winslow West
According to labor force statistics for Winslow West, 67.9% of individuals (114) out of the total population between 25 and 64 years of age (168) are in the labor force, with 6.1% or 7 of them being unemployed. The group with the highest labor force participation rate are those with the educational attainment of college / associate degree, with 74.4% or 67 individuals in the labor force. Within the labor force, individuals with college / associate degree education have the highest percentage of unemployment, with 10.4% or 7 of them being unemployed.
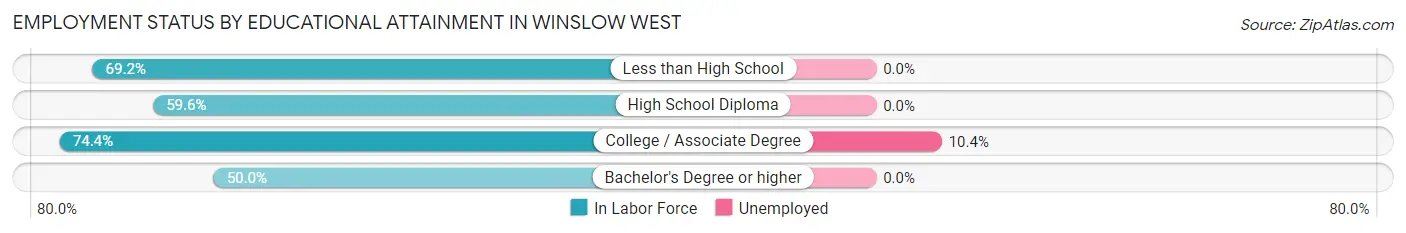
| Educational Attainment | In Labor Force | Unemployed |
| Less than High School | 9 (69.2%) | 0 (0.0%) |
| High School Diploma | 34 (59.6%) | 0 (0.0%) |
| College / Associate Degree | 67 (74.4%) | 9 (10.4%) |
| Bachelor's Degree or higher | 4 (50.0%) | 0 (0.0%) |
| Total | 114 (67.9%) | 10 (6.1%) |
Employment Occupations by Sex in Winslow West
Management, Business, Science and Arts Occupations
The most common Management, Business, Science and Arts occupations in Winslow West are Management (7 | 5.8%), and Health Diagnosing & Treating (3 | 2.5%).
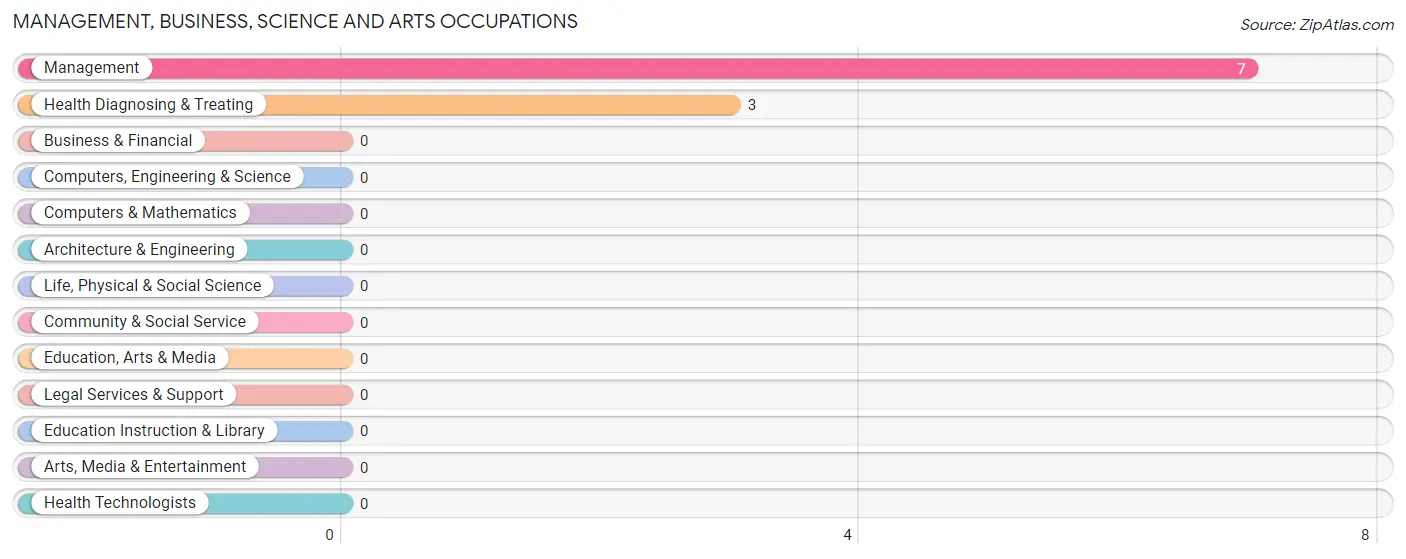
Management, Business, Science and Arts Occupations by Sex
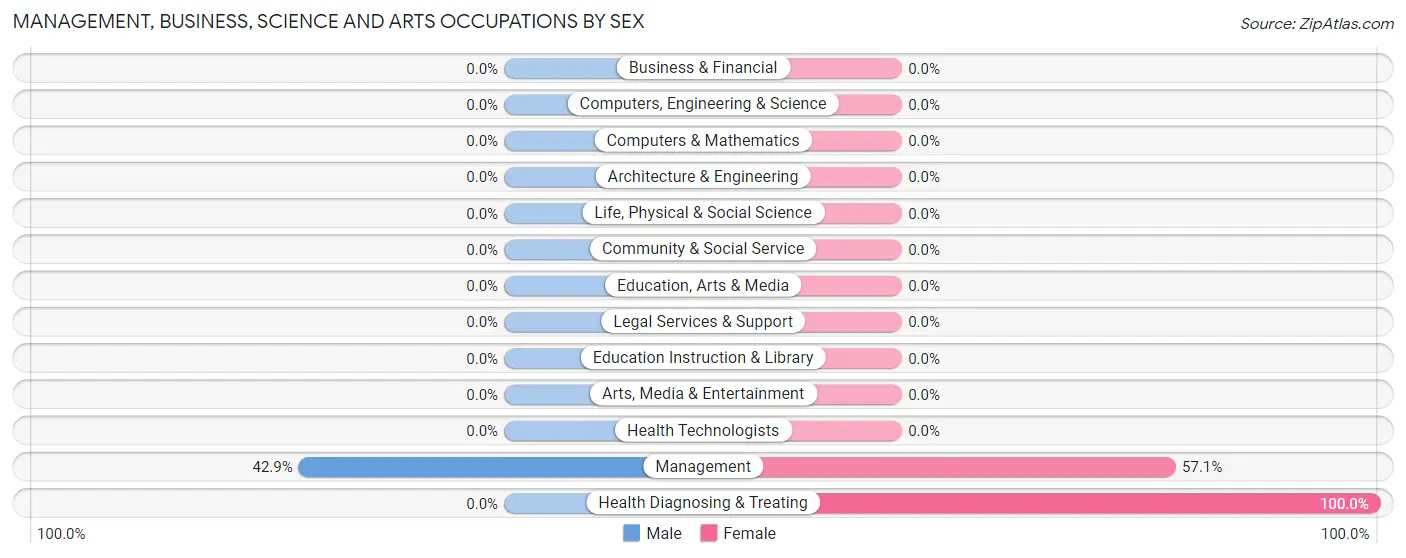
| Occupation | Male | Female |
| Management | 3 (42.9%) | 4 (57.1%) |
| Business & Financial | 0 (0.0%) | 0 (0.0%) |
| Computers, Engineering & Science | 0 (0.0%) | 0 (0.0%) |
| Computers & Mathematics | 0 (0.0%) | 0 (0.0%) |
| Architecture & Engineering | 0 (0.0%) | 0 (0.0%) |
| Life, Physical & Social Science | 0 (0.0%) | 0 (0.0%) |
| Community & Social Service | 0 (0.0%) | 0 (0.0%) |
| Education, Arts & Media | 0 (0.0%) | 0 (0.0%) |
| Legal Services & Support | 0 (0.0%) | 0 (0.0%) |
| Education Instruction & Library | 0 (0.0%) | 0 (0.0%) |
| Arts, Media & Entertainment | 0 (0.0%) | 0 (0.0%) |
| Health Diagnosing & Treating | 0 (0.0%) | 3 (100.0%) |
| Health Technologists | 0 (0.0%) | 0 (0.0%) |
| Total (Category) | 3 (30.0%) | 7 (70.0%) |
| Total (Overall) | 88 (72.7%) | 33 (27.3%) |
Services Occupations
The most common Services occupations in Winslow West are Food Preparation & Serving (31 | 25.6%), Cleaning & Maintenance (10 | 8.3%), Security & Protection (7 | 5.8%), and Firefighting & Prevention (7 | 5.8%).
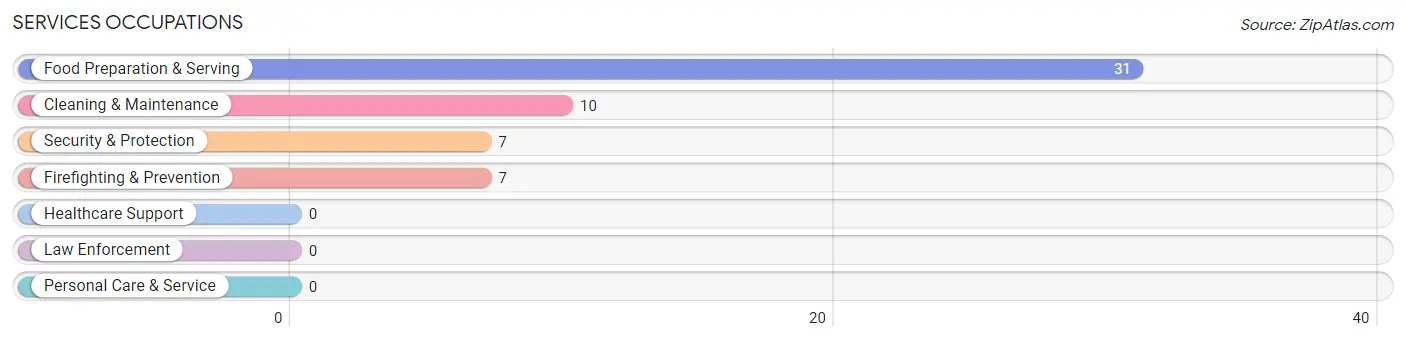
Services Occupations by Sex
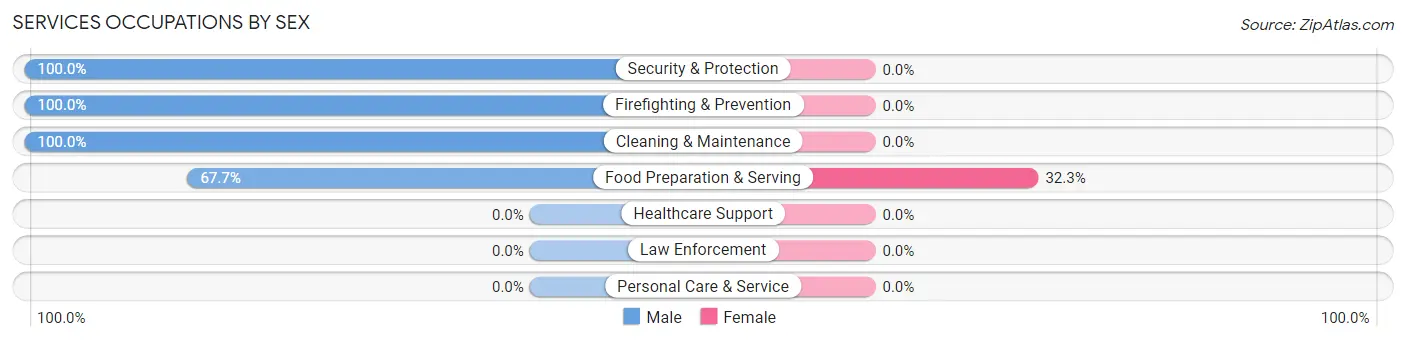
| Occupation | Male | Female |
| Healthcare Support | 0 (0.0%) | 0 (0.0%) |
| Security & Protection | 7 (100.0%) | 0 (0.0%) |
| Firefighting & Prevention | 7 (100.0%) | 0 (0.0%) |
| Law Enforcement | 0 (0.0%) | 0 (0.0%) |
| Food Preparation & Serving | 21 (67.7%) | 10 (32.3%) |
| Cleaning & Maintenance | 10 (100.0%) | 0 (0.0%) |
| Personal Care & Service | 0 (0.0%) | 0 (0.0%) |
| Total (Category) | 38 (79.2%) | 10 (20.8%) |
| Total (Overall) | 88 (72.7%) | 33 (27.3%) |
Sales and Office Occupations
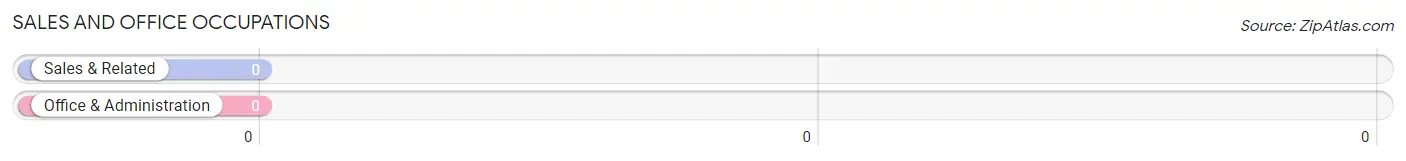
Sales and Office Occupations by Sex
| Occupation | Male | Female |
| Sales & Related | 0 (0.0%) | 0 (0.0%) |
| Office & Administration | 0 (0.0%) | 0 (0.0%) |
| Total (Category) | 0 (0.0%) | 0 (0.0%) |
| Total (Overall) | 88 (72.7%) | 33 (27.3%) |
Natural Resources, Construction and Maintenance Occupations
The most common Natural Resources, Construction and Maintenance occupations in Winslow West are , and Installation, Maintenance & Repair (10 | 8.3%).
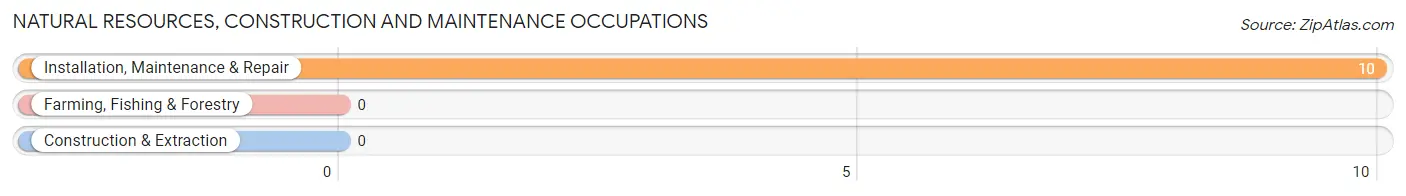
Natural Resources, Construction and Maintenance Occupations by Sex
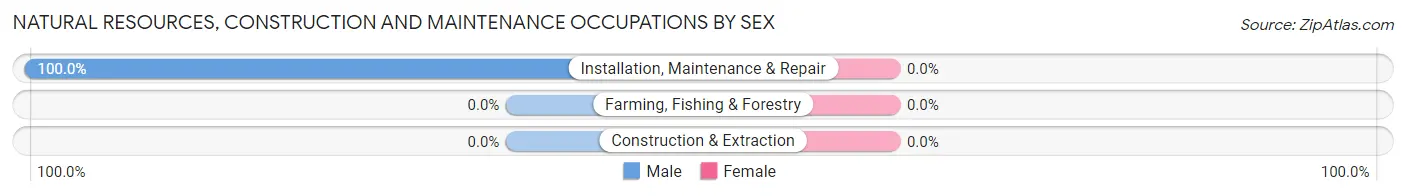
| Occupation | Male | Female |
| Farming, Fishing & Forestry | 0 (0.0%) | 0 (0.0%) |
| Construction & Extraction | 0 (0.0%) | 0 (0.0%) |
| Installation, Maintenance & Repair | 10 (100.0%) | 0 (0.0%) |
| Total (Category) | 10 (100.0%) | 0 (0.0%) |
| Total (Overall) | 88 (72.7%) | 33 (27.3%) |
Production, Transportation and Moving Occupations
The most common Production, Transportation and Moving occupations in Winslow West are Production (28 | 23.1%), and Transportation (25 | 20.7%).
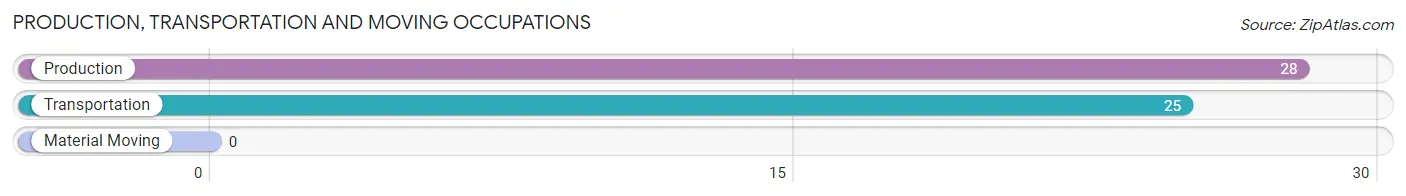
Production, Transportation and Moving Occupations by Sex
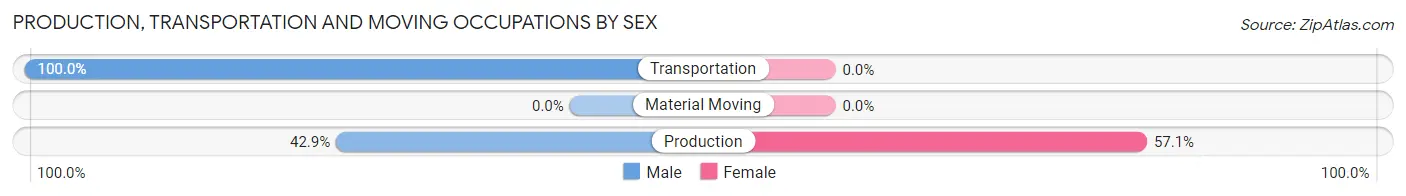
| Occupation | Male | Female |
| Production | 12 (42.9%) | 16 (57.1%) |
| Transportation | 25 (100.0%) | 0 (0.0%) |
| Material Moving | 0 (0.0%) | 0 (0.0%) |
| Total (Category) | 37 (69.8%) | 16 (30.2%) |
| Total (Overall) | 88 (72.7%) | 33 (27.3%) |
Employment Industries by Sex in Winslow West
Employment Industries in Winslow West
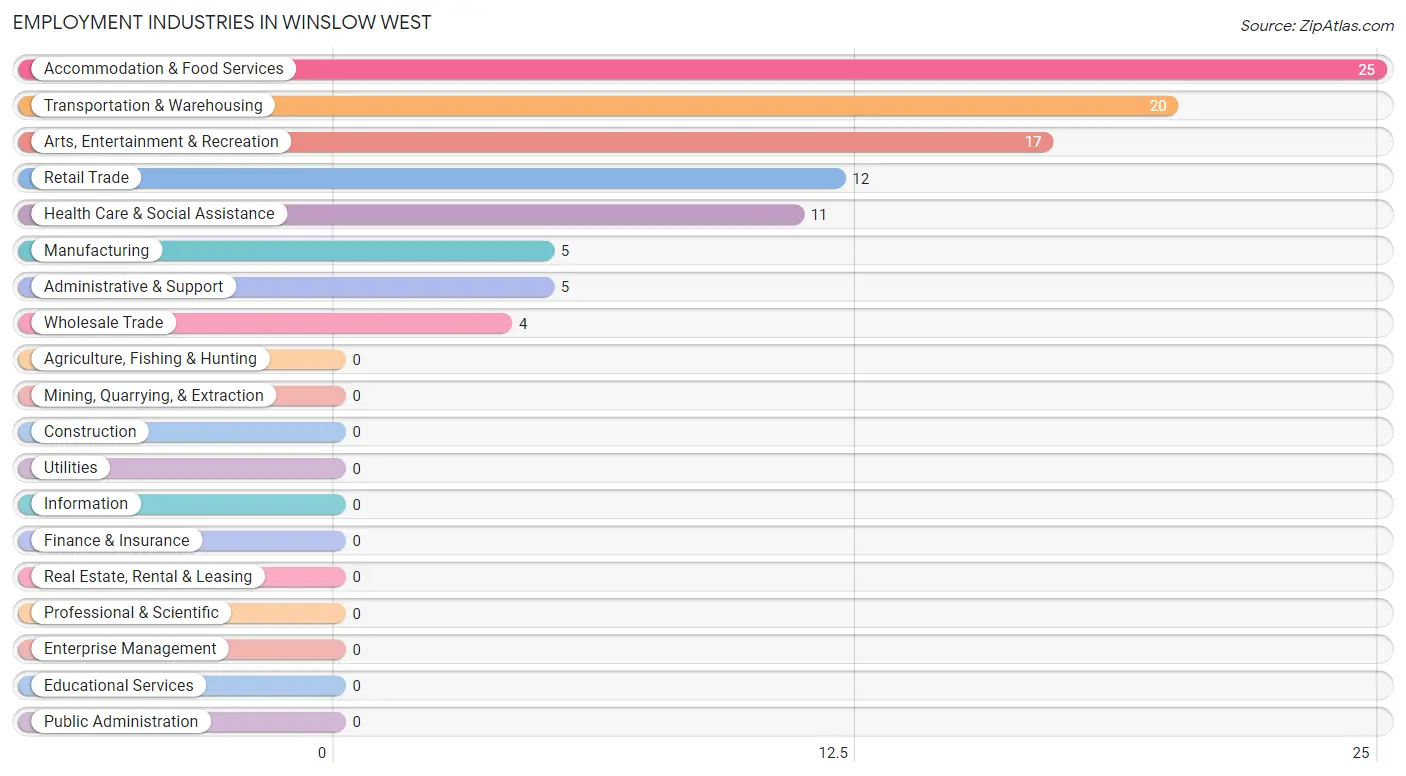
The major employment industries in Winslow West include Accommodation & Food Services (25 | 20.7%), Transportation & Warehousing (20 | 16.5%), Arts, Entertainment & Recreation (17 | 14.1%), Retail Trade (12 | 9.9%), and Health Care & Social Assistance (11 | 9.1%).
Employment Industries by Sex in Winslow West
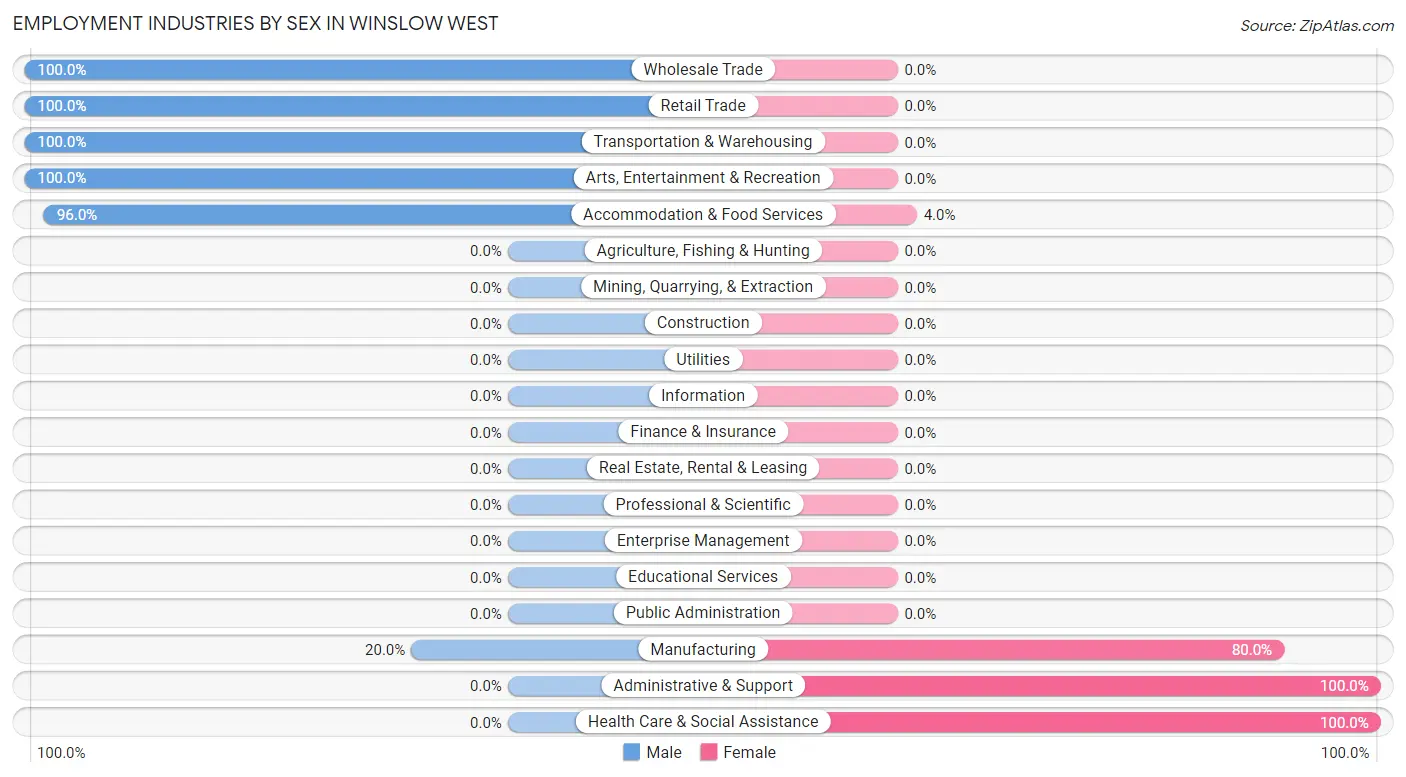
The Winslow West industries that see more men than women are Wholesale Trade (100.0%), Retail Trade (100.0%), and Transportation & Warehousing (100.0%), whereas the industries that tend to have a higher number of women are Administrative & Support (100.0%), Health Care & Social Assistance (100.0%), and Manufacturing (80.0%).
| Industry | Male | Female |
| Agriculture, Fishing & Hunting | 0 (0.0%) | 0 (0.0%) |
| Mining, Quarrying, & Extraction | 0 (0.0%) | 0 (0.0%) |
| Construction | 0 (0.0%) | 0 (0.0%) |
| Manufacturing | 1 (20.0%) | 4 (80.0%) |
| Wholesale Trade | 4 (100.0%) | 0 (0.0%) |
| Retail Trade | 12 (100.0%) | 0 (0.0%) |
| Transportation & Warehousing | 20 (100.0%) | 0 (0.0%) |
| Utilities | 0 (0.0%) | 0 (0.0%) |
| Information | 0 (0.0%) | 0 (0.0%) |
| Finance & Insurance | 0 (0.0%) | 0 (0.0%) |
| Real Estate, Rental & Leasing | 0 (0.0%) | 0 (0.0%) |
| Professional & Scientific | 0 (0.0%) | 0 (0.0%) |
| Enterprise Management | 0 (0.0%) | 0 (0.0%) |
| Administrative & Support | 0 (0.0%) | 5 (100.0%) |
| Educational Services | 0 (0.0%) | 0 (0.0%) |
| Health Care & Social Assistance | 0 (0.0%) | 11 (100.0%) |
| Arts, Entertainment & Recreation | 17 (100.0%) | 0 (0.0%) |
| Accommodation & Food Services | 24 (96.0%) | 1 (4.0%) |
| Public Administration | 0 (0.0%) | 0 (0.0%) |
| Total | 88 (72.7%) | 33 (27.3%) |
Education in Winslow West
School Enrollment in Winslow West
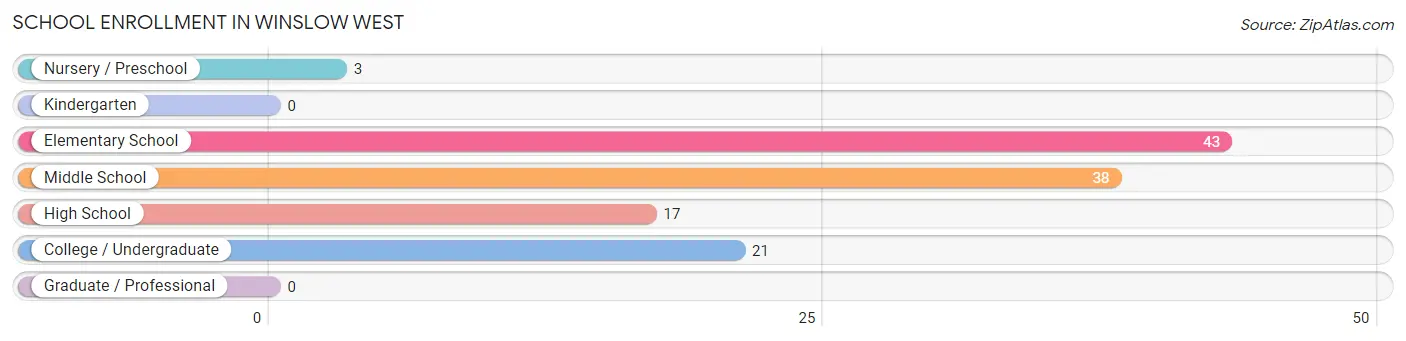
The most common levels of schooling among the 122 students in Winslow West are elementary school (43 | 35.2%), middle school (38 | 31.1%), and college / undergraduate (21 | 17.2%).
| School Level | # Students | % Students |
| Nursery / Preschool | 3 | 2.5% |
| Kindergarten | 0 | 0.0% |
| Elementary School | 43 | 35.2% |
| Middle School | 38 | 31.1% |
| High School | 17 | 13.9% |
| College / Undergraduate | 21 | 17.2% |
| Graduate / Professional | 0 | 0.0% |
| Total | 122 | 100.0% |
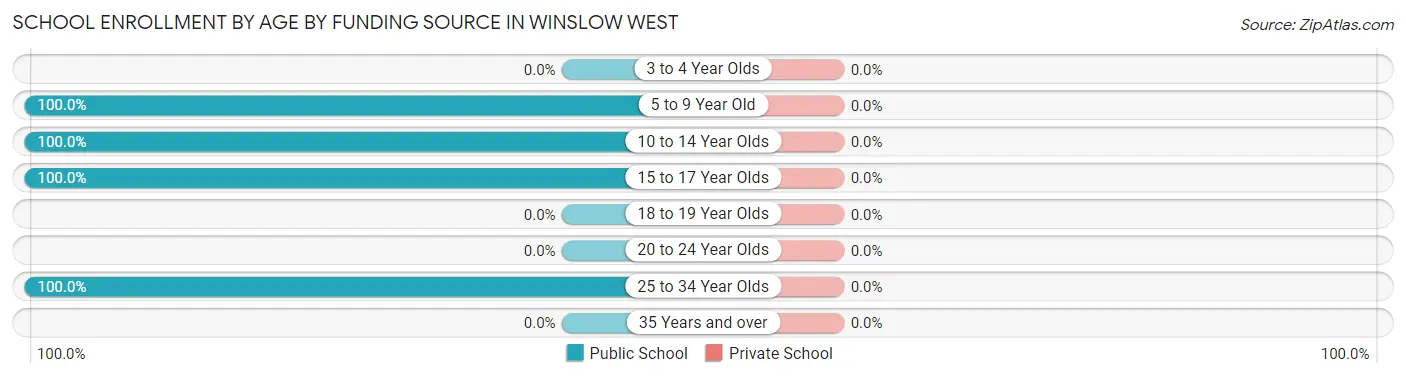
School Enrollment by Age by Funding Source in Winslow West
| Age Bracket | Public School | Private School |
| 3 to 4 Year Olds | 0 (0.0%) | 0 (0.0%) |
| 5 to 9 Year Old | 34 (100.0%) | 0 (0.0%) |
| 10 to 14 Year Olds | 50 (100.0%) | 0 (0.0%) |
| 15 to 17 Year Olds | 13 (100.0%) | 0 (0.0%) |
| 18 to 19 Year Olds | 0 (0.0%) | 0 (0.0%) |
| 20 to 24 Year Olds | 0 (0.0%) | 0 (0.0%) |
| 25 to 34 Year Olds | 25 (100.0%) | 0 (0.0%) |
| 35 Years and over | 0 (0.0%) | 0 (0.0%) |
| Total | 122 (100.0%) | 0 (0.0%) |
Educational Attainment by Field of Study in Winslow West
Psychology (4 | 22.2%), visual & performing arts (4 | 22.2%), arts & humanities (4 | 22.2%), science & technology (3 | 16.7%), and education (3 | 16.7%) are the most common fields of study among 18 individuals in Winslow West who have obtained a bachelor's degree or higher.
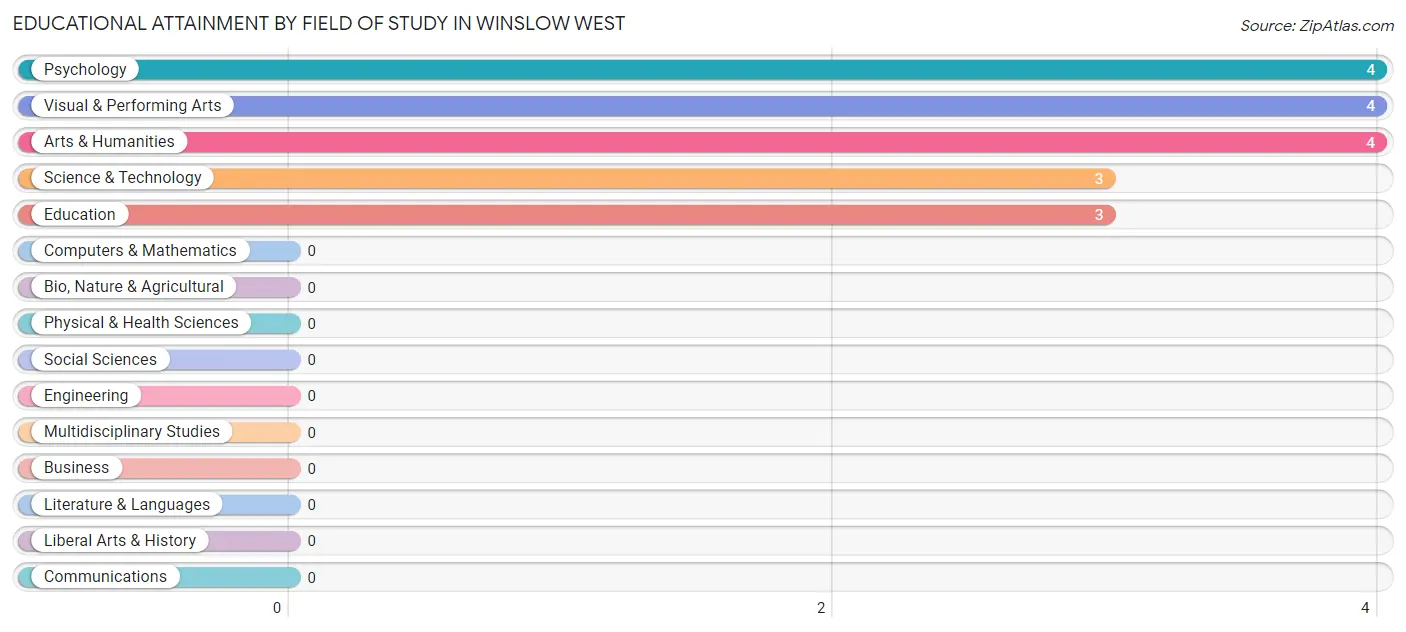
| Field of Study | # Graduates | % Graduates |
| Computers & Mathematics | 0 | 0.0% |
| Bio, Nature & Agricultural | 0 | 0.0% |
| Physical & Health Sciences | 0 | 0.0% |
| Psychology | 4 | 22.2% |
| Social Sciences | 0 | 0.0% |
| Engineering | 0 | 0.0% |
| Multidisciplinary Studies | 0 | 0.0% |
| Science & Technology | 3 | 16.7% |
| Business | 0 | 0.0% |
| Education | 3 | 16.7% |
| Literature & Languages | 0 | 0.0% |
| Liberal Arts & History | 0 | 0.0% |
| Visual & Performing Arts | 4 | 22.2% |
| Communications | 0 | 0.0% |
| Arts & Humanities | 4 | 22.2% |
| Total | 18 | 100.0% |
Transportation & Commute in Winslow West
Vehicle Availability by Sex in Winslow West
The most prevalent vehicle ownership categories in Winslow West are males with 1 vehicle (38, accounting for 43.2%) and females with 1 vehicle (5, making up 115.1%).
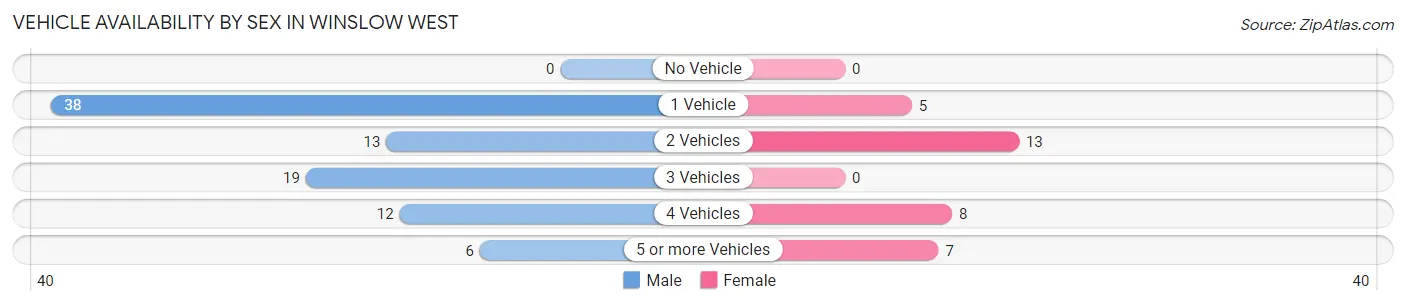
| Vehicles Available | Male | Female |
| No Vehicle | 0 (0.0%) | 0 (0.0%) |
| 1 Vehicle | 38 (43.2%) | 5 (15.1%) |
| 2 Vehicles | 13 (14.8%) | 13 (39.4%) |
| 3 Vehicles | 19 (21.6%) | 0 (0.0%) |
| 4 Vehicles | 12 (13.6%) | 8 (24.2%) |
| 5 or more Vehicles | 6 (6.8%) | 7 (21.2%) |
| Total | 88 (100.0%) | 33 (100.0%) |
Commute Time in Winslow West
The most frequently occuring commute durations in Winslow West are 10 to 14 minutes (71 commuters, 60.7%), 15 to 19 minutes (37 commuters, 31.6%), and 5 to 9 minutes (9 commuters, 7.7%).
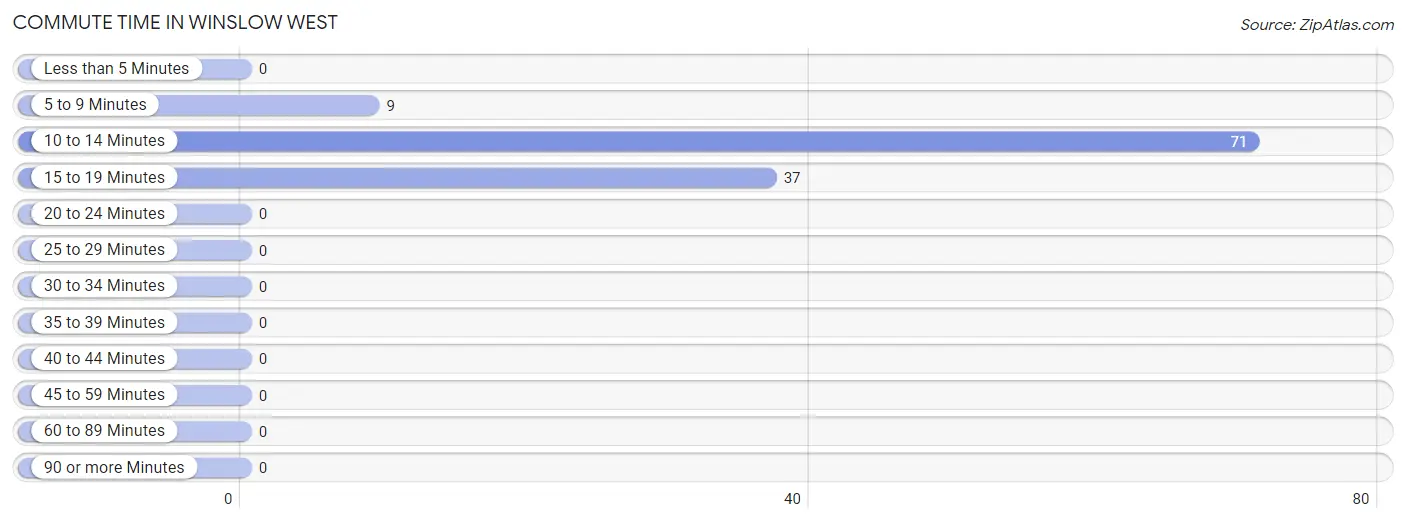
| Commute Time | # Commuters | % Commuters |
| Less than 5 Minutes | 0 | 0.0% |
| 5 to 9 Minutes | 9 | 7.7% |
| 10 to 14 Minutes | 71 | 60.7% |
| 15 to 19 Minutes | 37 | 31.6% |
| 20 to 24 Minutes | 0 | 0.0% |
| 25 to 29 Minutes | 0 | 0.0% |
| 30 to 34 Minutes | 0 | 0.0% |
| 35 to 39 Minutes | 0 | 0.0% |
| 40 to 44 Minutes | 0 | 0.0% |
| 45 to 59 Minutes | 0 | 0.0% |
| 60 to 89 Minutes | 0 | 0.0% |
| 90 or more Minutes | 0 | 0.0% |
Commute Time by Sex in Winslow West
The most common commute times in Winslow West are 10 to 14 minutes (56 commuters, 63.6%) for males and 10 to 14 minutes (15 commuters, 51.7%) for females.
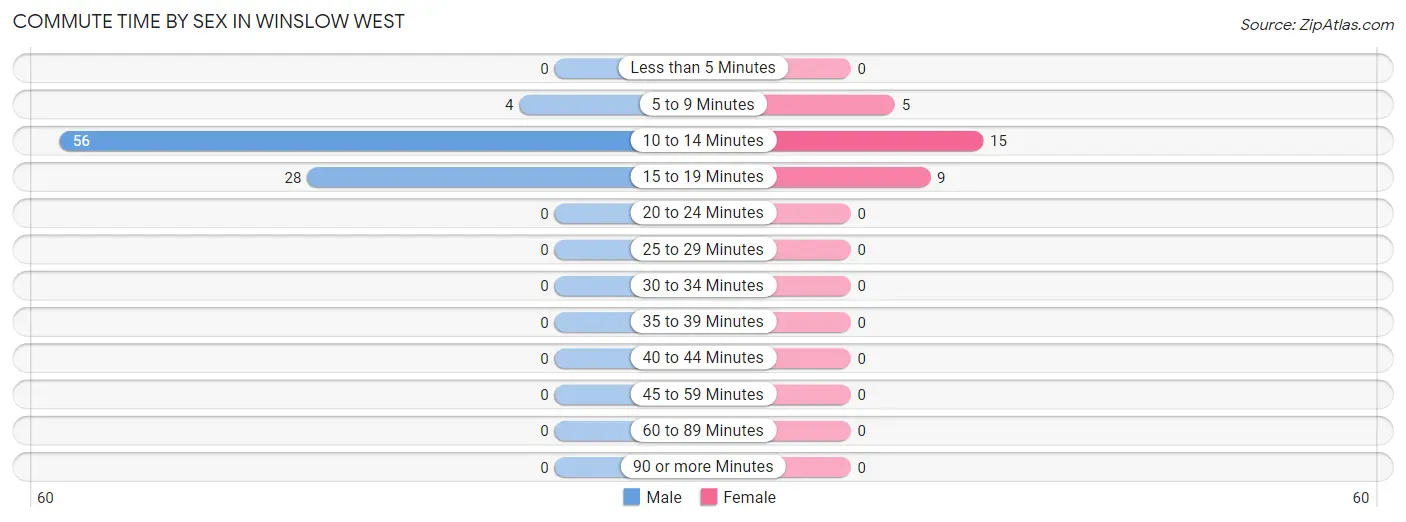
| Commute Time | Male | Female |
| Less than 5 Minutes | 0 (0.0%) | 0 (0.0%) |
| 5 to 9 Minutes | 4 (4.5%) | 5 (17.2%) |
| 10 to 14 Minutes | 56 (63.6%) | 15 (51.7%) |
| 15 to 19 Minutes | 28 (31.8%) | 9 (31.0%) |
| 20 to 24 Minutes | 0 (0.0%) | 0 (0.0%) |
| 25 to 29 Minutes | 0 (0.0%) | 0 (0.0%) |
| 30 to 34 Minutes | 0 (0.0%) | 0 (0.0%) |
| 35 to 39 Minutes | 0 (0.0%) | 0 (0.0%) |
| 40 to 44 Minutes | 0 (0.0%) | 0 (0.0%) |
| 45 to 59 Minutes | 0 (0.0%) | 0 (0.0%) |
| 60 to 89 Minutes | 0 (0.0%) | 0 (0.0%) |
| 90 or more Minutes | 0 (0.0%) | 0 (0.0%) |
Time of Departure to Work by Sex in Winslow West
The most frequent times of departure to work in Winslow West are 9:00 AM to 9:59 AM (30, 34.1%) for males and 12:00 PM to 3:59 PM (12, 41.4%) for females.
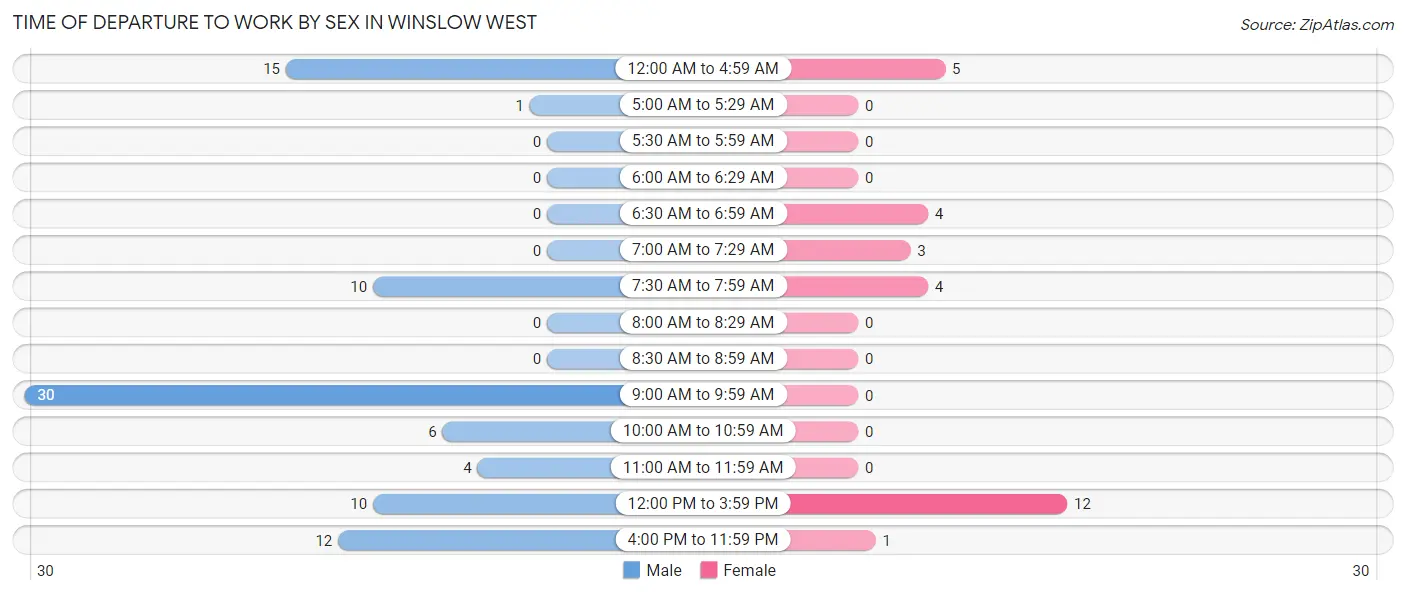
| Time of Departure | Male | Female |
| 12:00 AM to 4:59 AM | 15 (17.1%) | 5 (17.2%) |
| 5:00 AM to 5:29 AM | 1 (1.1%) | 0 (0.0%) |
| 5:30 AM to 5:59 AM | 0 (0.0%) | 0 (0.0%) |
| 6:00 AM to 6:29 AM | 0 (0.0%) | 0 (0.0%) |
| 6:30 AM to 6:59 AM | 0 (0.0%) | 4 (13.8%) |
| 7:00 AM to 7:29 AM | 0 (0.0%) | 3 (10.3%) |
| 7:30 AM to 7:59 AM | 10 (11.4%) | 4 (13.8%) |
| 8:00 AM to 8:29 AM | 0 (0.0%) | 0 (0.0%) |
| 8:30 AM to 8:59 AM | 0 (0.0%) | 0 (0.0%) |
| 9:00 AM to 9:59 AM | 30 (34.1%) | 0 (0.0%) |
| 10:00 AM to 10:59 AM | 6 (6.8%) | 0 (0.0%) |
| 11:00 AM to 11:59 AM | 4 (4.5%) | 0 (0.0%) |
| 12:00 PM to 3:59 PM | 10 (11.4%) | 12 (41.4%) |
| 4:00 PM to 11:59 PM | 12 (13.6%) | 1 (3.5%) |
| Total | 88 (100.0%) | 29 (100.0%) |
Housing Occupancy in Winslow West
Occupancy by Ownership in Winslow West
Of the total 107 dwellings in Winslow West, owner-occupied units account for 38 (35.5%), while renter-occupied units make up 69 (64.5%).
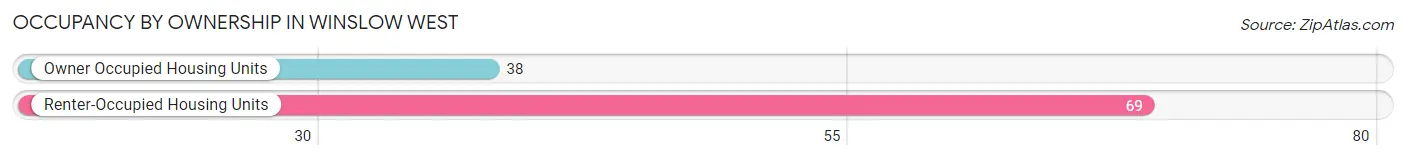
| Occupancy | # Housing Units | % Housing Units |
| Owner Occupied Housing Units | 38 | 35.5% |
| Renter-Occupied Housing Units | 69 | 64.5% |
| Total Occupied Housing Units | 107 | 100.0% |
Occupancy by Household Size in Winslow West
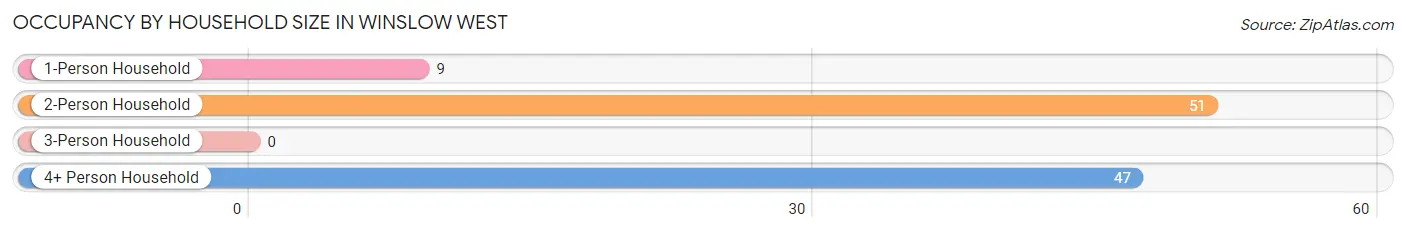
| Household Size | # Housing Units | % Housing Units |
| 1-Person Household | 9 | 8.4% |
| 2-Person Household | 51 | 47.7% |
| 3-Person Household | 0 | 0.0% |
| 4+ Person Household | 47 | 43.9% |
| Total Housing Units | 107 | 100.0% |
Occupancy by Ownership by Household Size in Winslow West
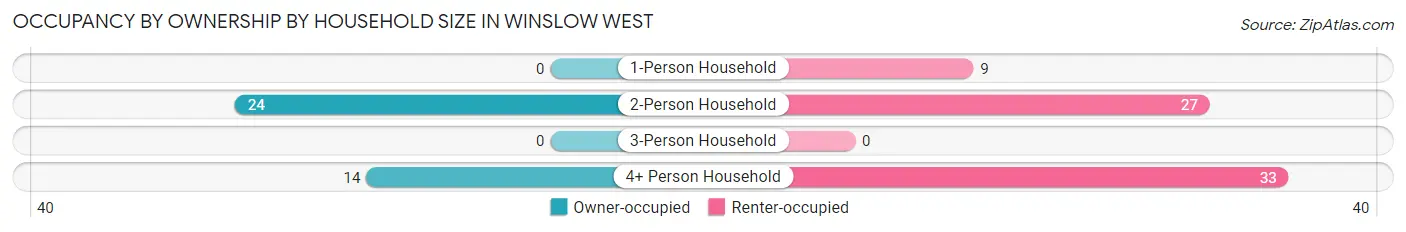
| Household Size | Owner-occupied | Renter-occupied |
| 1-Person Household | 0 (0.0%) | 9 (100.0%) |
| 2-Person Household | 24 (47.1%) | 27 (52.9%) |
| 3-Person Household | 0 (0.0%) | 0 (0.0%) |
| 4+ Person Household | 14 (29.8%) | 33 (70.2%) |
| Total Housing Units | 38 (35.5%) | 69 (64.5%) |
Occupancy by Educational Attainment in Winslow West
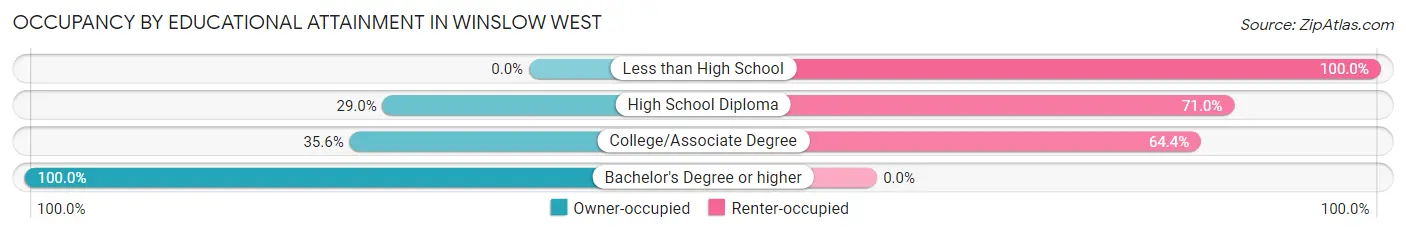
| Household Size | Owner-occupied | Renter-occupied |
| Less than High School | 0 (0.0%) | 9 (100.0%) |
| High School Diploma | 9 (29.0%) | 22 (71.0%) |
| College/Associate Degree | 21 (35.6%) | 38 (64.4%) |
| Bachelor's Degree or higher | 8 (100.0%) | 0 (0.0%) |
Occupancy by Age of Householder in Winslow West
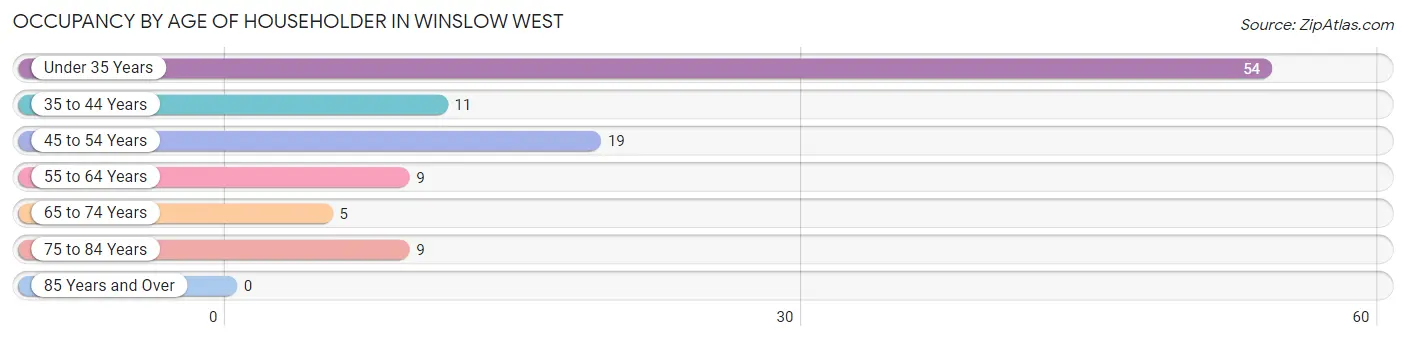
| Age Bracket | # Households | % Households |
| Under 35 Years | 54 | 50.5% |
| 35 to 44 Years | 11 | 10.3% |
| 45 to 54 Years | 19 | 17.8% |
| 55 to 64 Years | 9 | 8.4% |
| 65 to 74 Years | 5 | 4.7% |
| 75 to 84 Years | 9 | 8.4% |
| 85 Years and Over | 0 | 0.0% |
| Total | 107 | 100.0% |
Housing Finances in Winslow West
Median Income by Occupancy in Winslow West
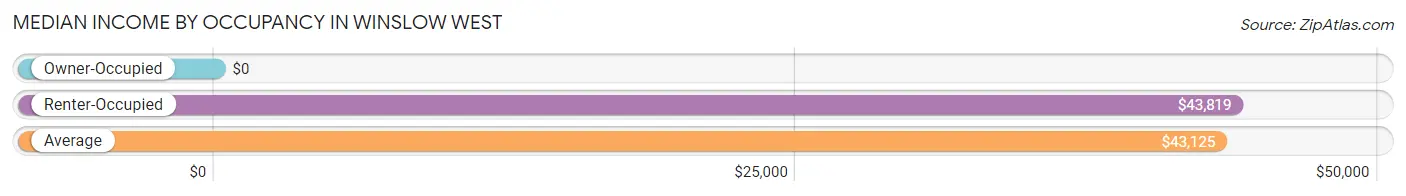
| Occupancy Type | # Households | Median Income |
| Owner-Occupied | 38 (35.5%) | $0 |
| Renter-Occupied | 69 (64.5%) | $43,819 |
| Average | 107 (100.0%) | $43,125 |
Occupancy by Householder Income Bracket in Winslow West
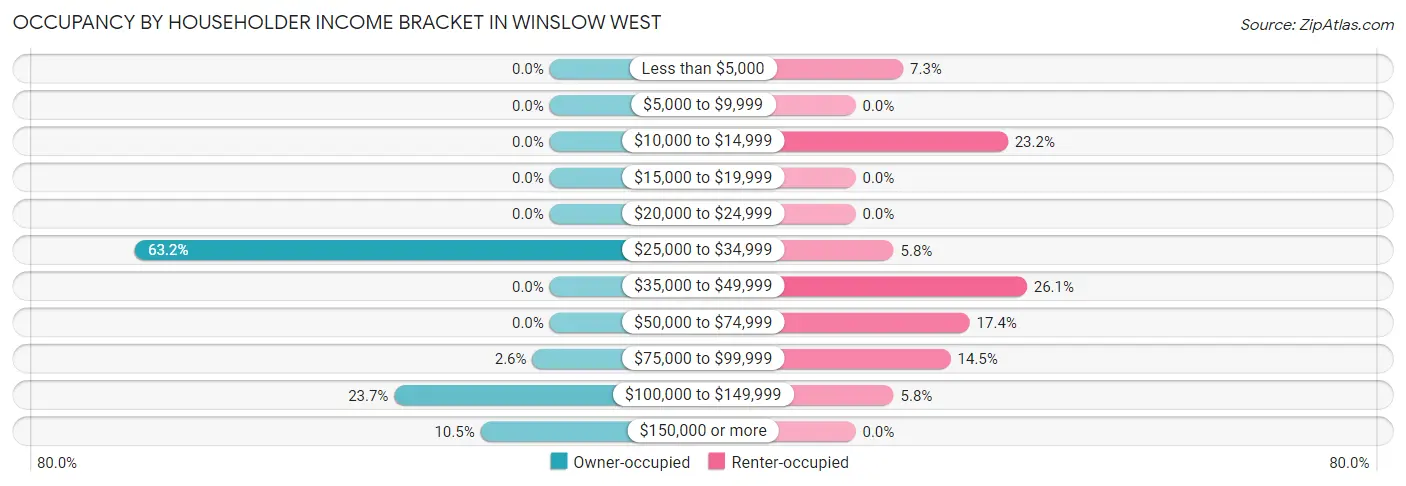
| Income Bracket | Owner-occupied | Renter-occupied |
| Less than $5,000 | 0 (0.0%) | 5 (7.2%) |
| $5,000 to $9,999 | 0 (0.0%) | 0 (0.0%) |
| $10,000 to $14,999 | 0 (0.0%) | 16 (23.2%) |
| $15,000 to $19,999 | 0 (0.0%) | 0 (0.0%) |
| $20,000 to $24,999 | 0 (0.0%) | 0 (0.0%) |
| $25,000 to $34,999 | 24 (63.2%) | 4 (5.8%) |
| $35,000 to $49,999 | 0 (0.0%) | 18 (26.1%) |
| $50,000 to $74,999 | 0 (0.0%) | 12 (17.4%) |
| $75,000 to $99,999 | 1 (2.6%) | 10 (14.5%) |
| $100,000 to $149,999 | 9 (23.7%) | 4 (5.8%) |
| $150,000 or more | 4 (10.5%) | 0 (0.0%) |
| Total | 38 (100.0%) | 69 (100.0%) |
Monthly Housing Cost Tiers in Winslow West
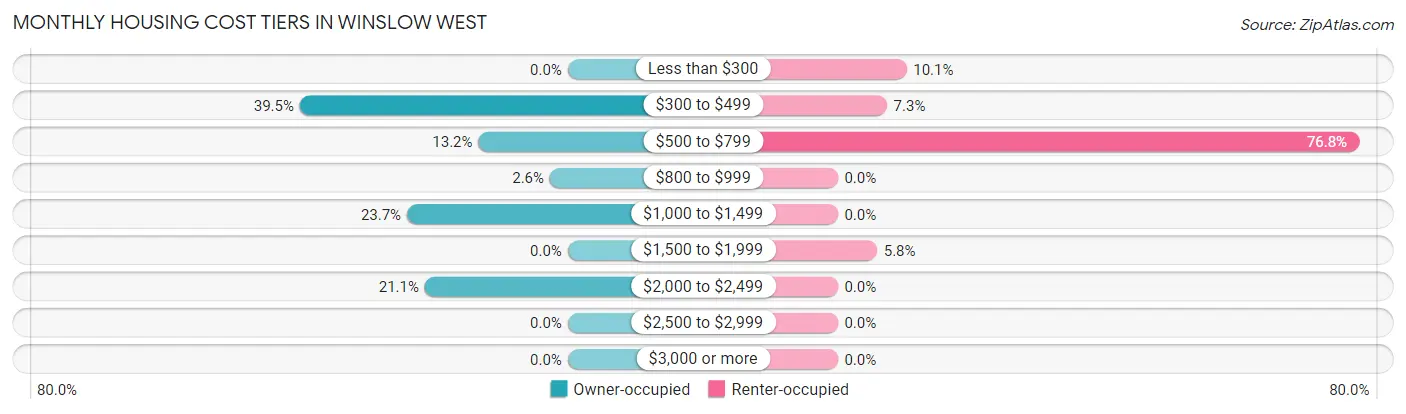
| Monthly Cost | Owner-occupied | Renter-occupied |
| Less than $300 | 0 (0.0%) | 7 (10.1%) |
| $300 to $499 | 15 (39.5%) | 5 (7.2%) |
| $500 to $799 | 5 (13.2%) | 53 (76.8%) |
| $800 to $999 | 1 (2.6%) | 0 (0.0%) |
| $1,000 to $1,499 | 9 (23.7%) | 0 (0.0%) |
| $1,500 to $1,999 | 0 (0.0%) | 4 (5.8%) |
| $2,000 to $2,499 | 8 (21.0%) | 0 (0.0%) |
| $2,500 to $2,999 | 0 (0.0%) | 0 (0.0%) |
| $3,000 or more | 0 (0.0%) | 0 (0.0%) |
| Total | 38 (100.0%) | 69 (100.0%) |
Physical Housing Characteristics in Winslow West
Housing Structures in Winslow West
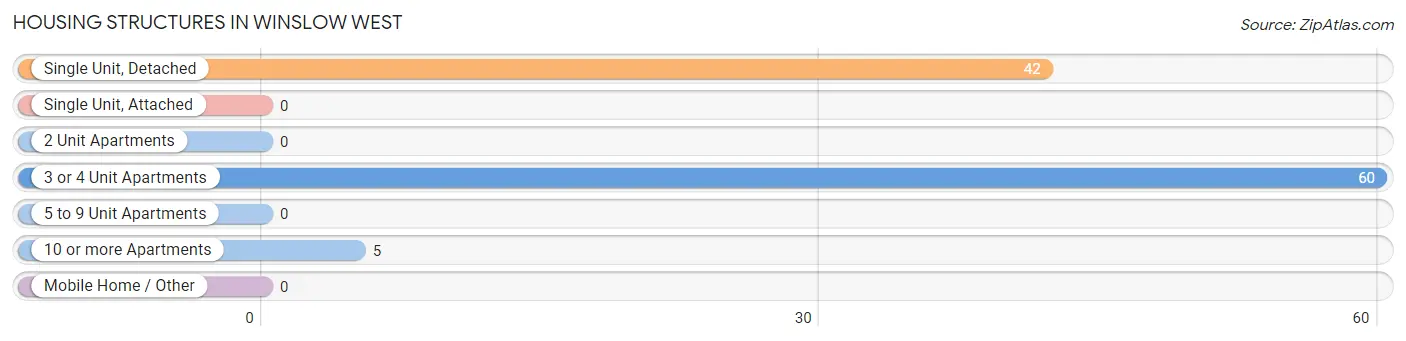
| Structure Type | # Housing Units | % Housing Units |
| Single Unit, Detached | 42 | 39.3% |
| Single Unit, Attached | 0 | 0.0% |
| 2 Unit Apartments | 0 | 0.0% |
| 3 or 4 Unit Apartments | 60 | 56.1% |
| 5 to 9 Unit Apartments | 0 | 0.0% |
| 10 or more Apartments | 5 | 4.7% |
| Mobile Home / Other | 0 | 0.0% |
| Total | 107 | 100.0% |
Housing Structures by Occupancy in Winslow West
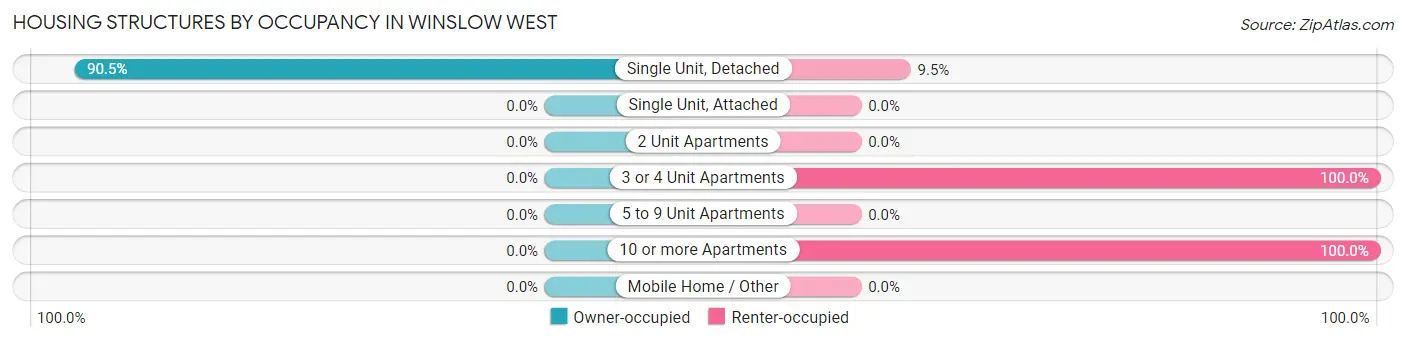
| Structure Type | Owner-occupied | Renter-occupied |
| Single Unit, Detached | 38 (90.5%) | 4 (9.5%) |
| Single Unit, Attached | 0 (0.0%) | 0 (0.0%) |
| 2 Unit Apartments | 0 (0.0%) | 0 (0.0%) |
| 3 or 4 Unit Apartments | 0 (0.0%) | 60 (100.0%) |
| 5 to 9 Unit Apartments | 0 (0.0%) | 0 (0.0%) |
| 10 or more Apartments | 0 (0.0%) | 5 (100.0%) |
| Mobile Home / Other | 0 (0.0%) | 0 (0.0%) |
| Total | 38 (35.5%) | 69 (64.5%) |
Housing Structures by Number of Rooms in Winslow West
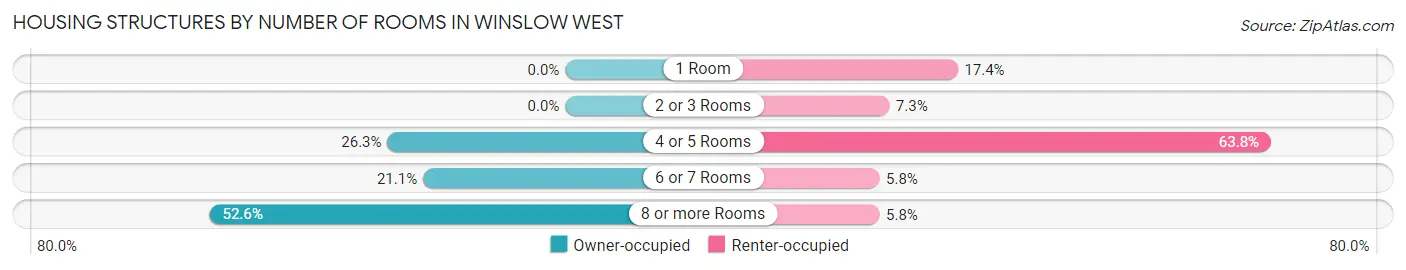
| Number of Rooms | Owner-occupied | Renter-occupied |
| 1 Room | 0 (0.0%) | 12 (17.4%) |
| 2 or 3 Rooms | 0 (0.0%) | 5 (7.2%) |
| 4 or 5 Rooms | 10 (26.3%) | 44 (63.8%) |
| 6 or 7 Rooms | 8 (21.0%) | 4 (5.8%) |
| 8 or more Rooms | 20 (52.6%) | 4 (5.8%) |
| Total | 38 (100.0%) | 69 (100.0%) |
Housing Structure by Heating Type in Winslow West
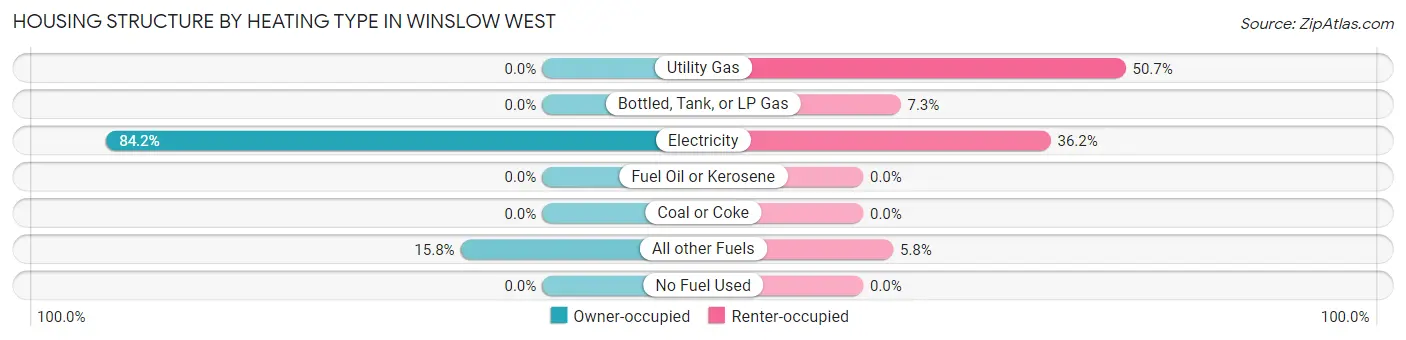
| Heating Type | Owner-occupied | Renter-occupied |
| Utility Gas | 0 (0.0%) | 35 (50.7%) |
| Bottled, Tank, or LP Gas | 0 (0.0%) | 5 (7.2%) |
| Electricity | 32 (84.2%) | 25 (36.2%) |
| Fuel Oil or Kerosene | 0 (0.0%) | 0 (0.0%) |
| Coal or Coke | 0 (0.0%) | 0 (0.0%) |
| All other Fuels | 6 (15.8%) | 4 (5.8%) |
| No Fuel Used | 0 (0.0%) | 0 (0.0%) |
| Total | 38 (100.0%) | 69 (100.0%) |
Household Vehicle Usage in Winslow West
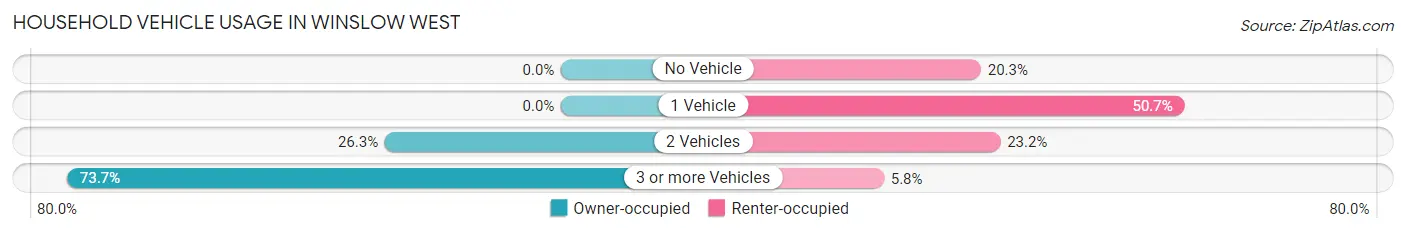
| Vehicles per Household | Owner-occupied | Renter-occupied |
| No Vehicle | 0 (0.0%) | 14 (20.3%) |
| 1 Vehicle | 0 (0.0%) | 35 (50.7%) |
| 2 Vehicles | 10 (26.3%) | 16 (23.2%) |
| 3 or more Vehicles | 28 (73.7%) | 4 (5.8%) |
| Total | 38 (100.0%) | 69 (100.0%) |
Real Estate & Mortgages in Winslow West
Real Estate and Mortgage Overview in Winslow West
| Characteristic | Without Mortgage | With Mortgage |
| Housing Units | 20 | 18 |
| Median Property Value | - | - |
| Median Household Income | - | - |
| Monthly Housing Costs | - | - |
| Real Estate Taxes | - | - |
Property Value by Mortgage Status in Winslow West
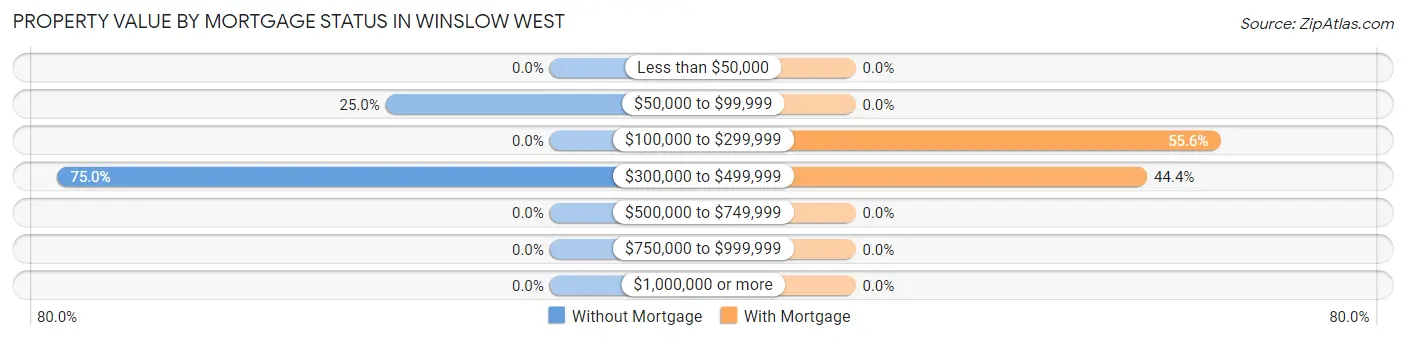
| Property Value | Without Mortgage | With Mortgage |
| Less than $50,000 | 0 (0.0%) | 0 (0.0%) |
| $50,000 to $99,999 | 5 (25.0%) | 0 (0.0%) |
| $100,000 to $299,999 | 0 (0.0%) | 10 (55.6%) |
| $300,000 to $499,999 | 15 (75.0%) | 8 (44.4%) |
| $500,000 to $749,999 | 0 (0.0%) | 0 (0.0%) |
| $750,000 to $999,999 | 0 (0.0%) | 0 (0.0%) |
| $1,000,000 or more | 0 (0.0%) | 0 (0.0%) |
| Total | 20 (100.0%) | 18 (100.0%) |
Household Income by Mortgage Status in Winslow West
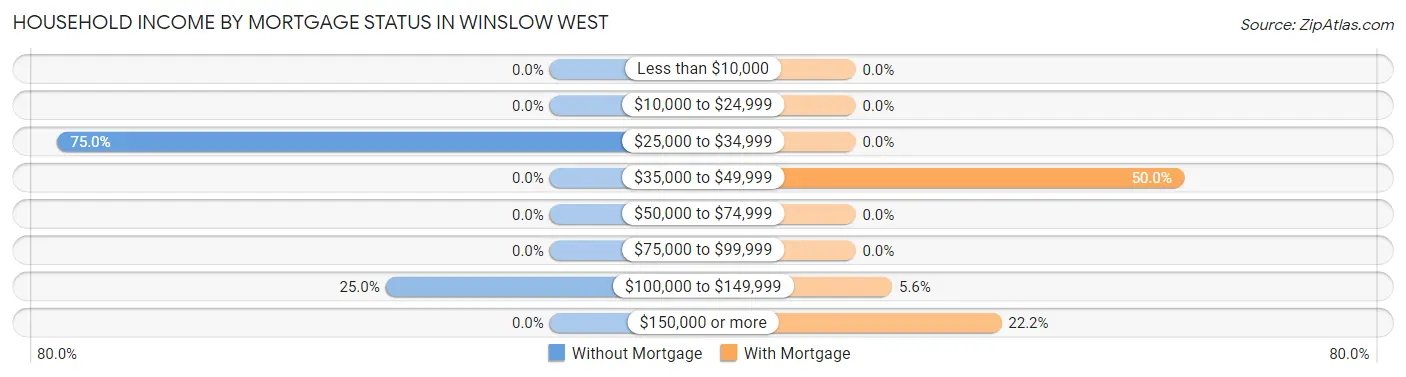
| Household Income | Without Mortgage | With Mortgage |
| Less than $10,000 | 0 (0.0%) | 0 (0.0%) |
| $10,000 to $24,999 | 0 (0.0%) | 0 (0.0%) |
| $25,000 to $34,999 | 15 (75.0%) | 0 (0.0%) |
| $35,000 to $49,999 | 0 (0.0%) | 9 (50.0%) |
| $50,000 to $74,999 | 0 (0.0%) | 0 (0.0%) |
| $75,000 to $99,999 | 0 (0.0%) | 0 (0.0%) |
| $100,000 to $149,999 | 5 (25.0%) | 1 (5.6%) |
| $150,000 or more | 0 (0.0%) | 4 (22.2%) |
| Total | 20 (100.0%) | 18 (100.0%) |
Property Value to Household Income Ratio in Winslow West
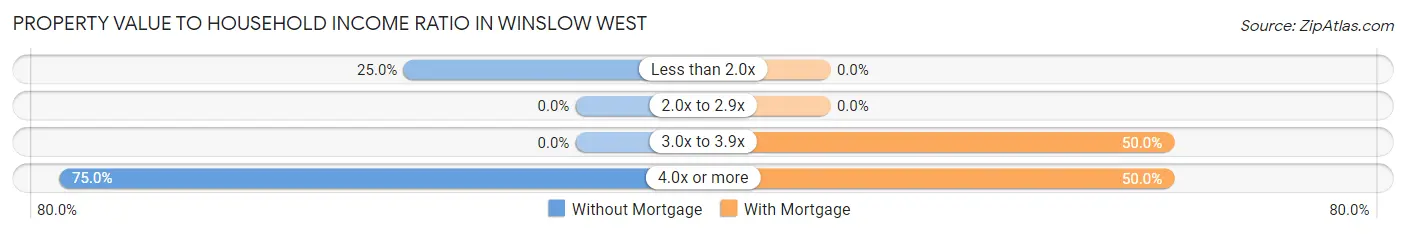
| Value-to-Income Ratio | Without Mortgage | With Mortgage |
| Less than 2.0x | 5 (25.0%) | 0 (0.0%) |
| 2.0x to 2.9x | 0 (0.0%) | 0 (0.0%) |
| 3.0x to 3.9x | 0 (0.0%) | 9 (50.0%) |
| 4.0x or more | 15 (75.0%) | 9 (50.0%) |
| Total | 20 (100.0%) | 18 (100.0%) |
Real Estate Taxes by Mortgage Status in Winslow West
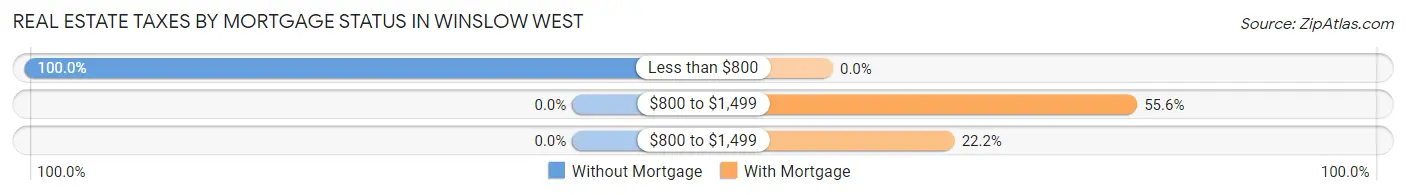
| Property Taxes | Without Mortgage | With Mortgage |
| Less than $800 | 20 (100.0%) | 0 (0.0%) |
| $800 to $1,499 | 0 (0.0%) | 10 (55.6%) |
| $800 to $1,499 | 0 (0.0%) | 4 (22.2%) |
| Total | 20 (100.0%) | 18 (100.0%) |
Health & Disability in Winslow West
Health Insurance Coverage by Age in Winslow West
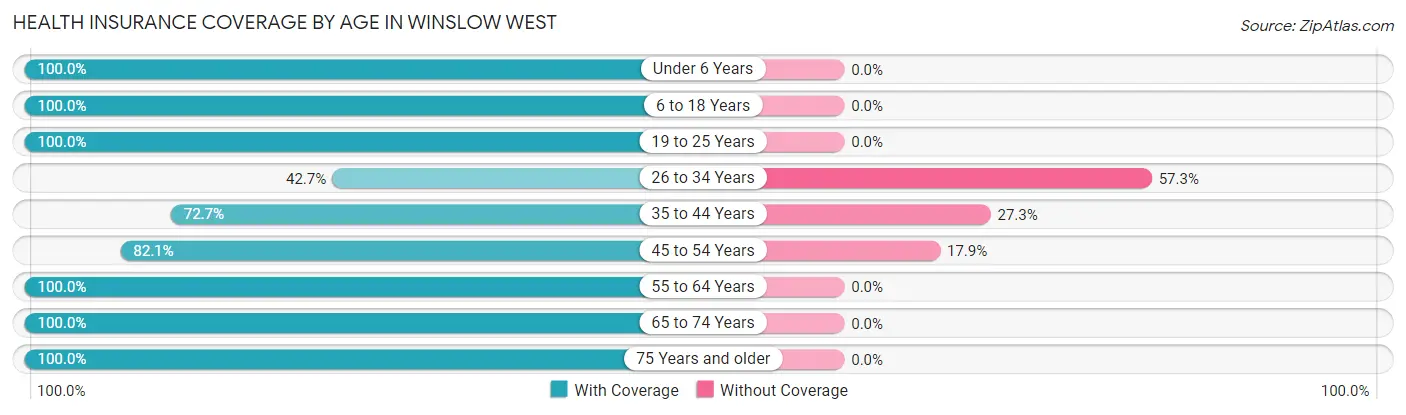
| Age Bracket | With Coverage | Without Coverage |
| Under 6 Years | 36 (100.0%) | 0 (0.0%) |
| 6 to 18 Years | 102 (100.0%) | 0 (0.0%) |
| 19 to 25 Years | 18 (100.0%) | 0 (0.0%) |
| 26 to 34 Years | 32 (42.7%) | 43 (57.3%) |
| 35 to 44 Years | 16 (72.7%) | 6 (27.3%) |
| 45 to 54 Years | 23 (82.1%) | 5 (17.9%) |
| 55 to 64 Years | 36 (100.0%) | 0 (0.0%) |
| 65 to 74 Years | 9 (100.0%) | 0 (0.0%) |
| 75 Years and older | 17 (100.0%) | 0 (0.0%) |
| Total | 289 (84.3%) | 54 (15.7%) |
Health Insurance Coverage by Citizenship Status in Winslow West
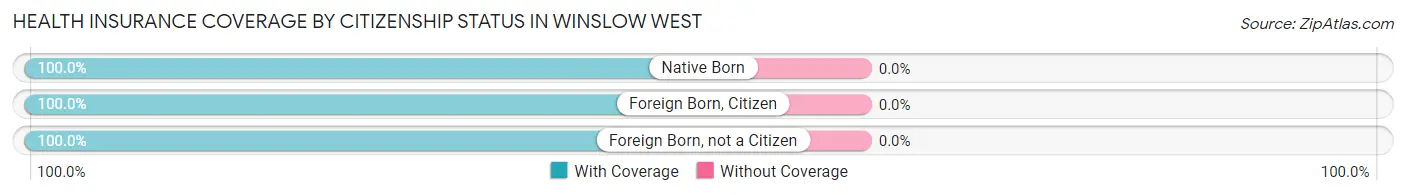
| Citizenship Status | With Coverage | Without Coverage |
| Native Born | 36 (100.0%) | 0 (0.0%) |
| Foreign Born, Citizen | 102 (100.0%) | 0 (0.0%) |
| Foreign Born, not a Citizen | 18 (100.0%) | 0 (0.0%) |
Health Insurance Coverage by Household Income in Winslow West
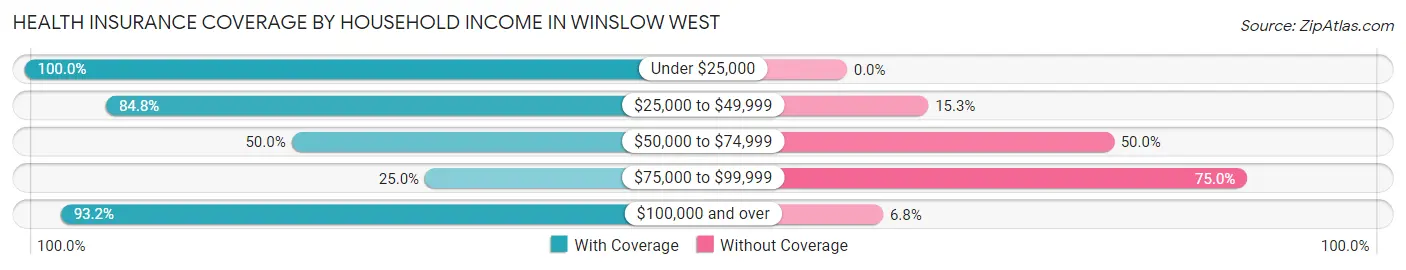
| Household Income | With Coverage | Without Coverage |
| Under $25,000 | 48 (100.0%) | 0 (0.0%) |
| $25,000 to $49,999 | 100 (84.8%) | 18 (15.2%) |
| $50,000 to $74,999 | 12 (50.0%) | 12 (50.0%) |
| $75,000 to $99,999 | 5 (25.0%) | 15 (75.0%) |
| $100,000 and over | 124 (93.2%) | 9 (6.8%) |
Public vs Private Health Insurance Coverage by Age in Winslow West
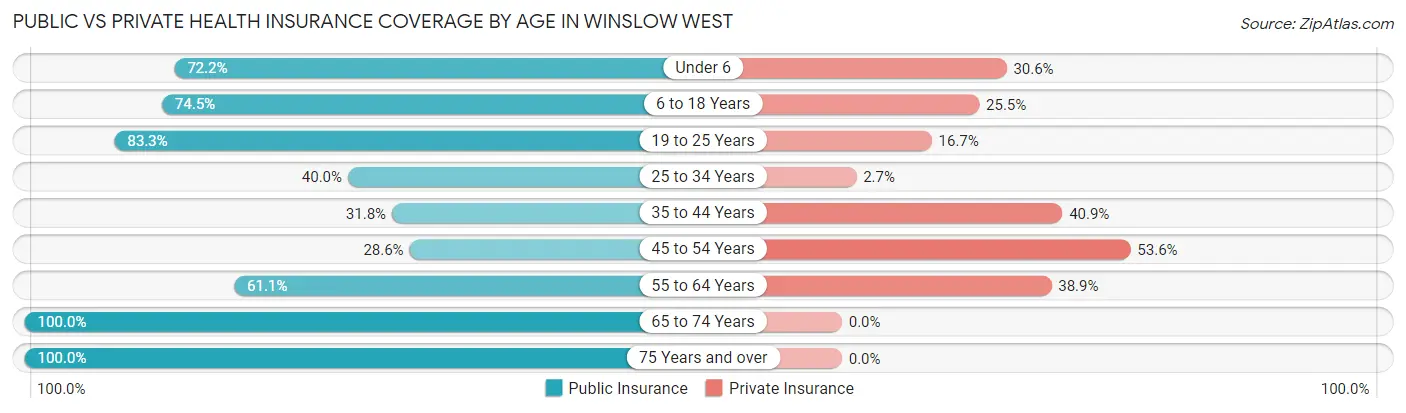
| Age Bracket | Public Insurance | Private Insurance |
| Under 6 | 26 (72.2%) | 11 (30.6%) |
| 6 to 18 Years | 76 (74.5%) | 26 (25.5%) |
| 19 to 25 Years | 15 (83.3%) | 3 (16.7%) |
| 25 to 34 Years | 30 (40.0%) | 2 (2.7%) |
| 35 to 44 Years | 7 (31.8%) | 9 (40.9%) |
| 45 to 54 Years | 8 (28.6%) | 15 (53.6%) |
| 55 to 64 Years | 22 (61.1%) | 14 (38.9%) |
| 65 to 74 Years | 9 (100.0%) | 0 (0.0%) |
| 75 Years and over | 17 (100.0%) | 0 (0.0%) |
| Total | 210 (61.2%) | 80 (23.3%) |
Disability Status by Sex by Age in Winslow West
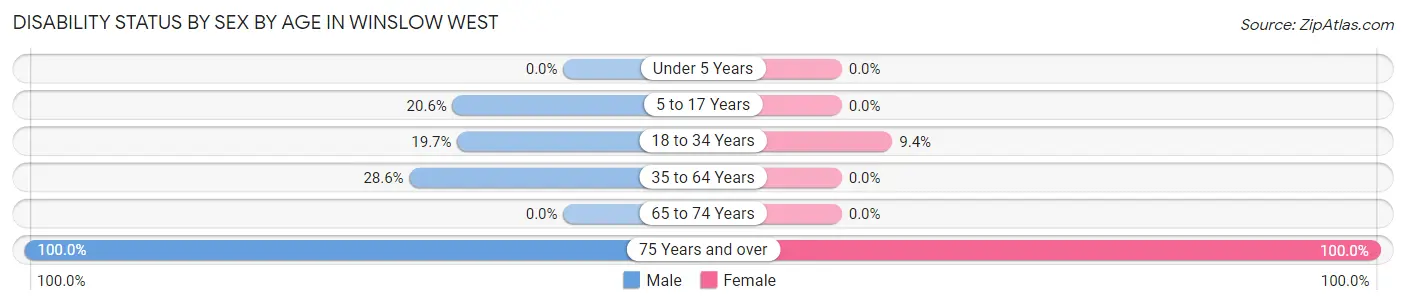
| Age Bracket | Male | Female |
| Under 5 Years | 0 (0.0%) | 0 (0.0%) |
| 5 to 17 Years | 15 (20.5%) | 0 (0.0%) |
| 18 to 34 Years | 12 (19.7%) | 3 (9.4%) |
| 35 to 64 Years | 8 (28.6%) | 0 (0.0%) |
| 65 to 74 Years | 0 (0.0%) | 0 (0.0%) |
| 75 Years and over | 12 (100.0%) | 5 (100.0%) |
Disability Class by Sex by Age in Winslow West
Disability Class: Hearing Difficulty
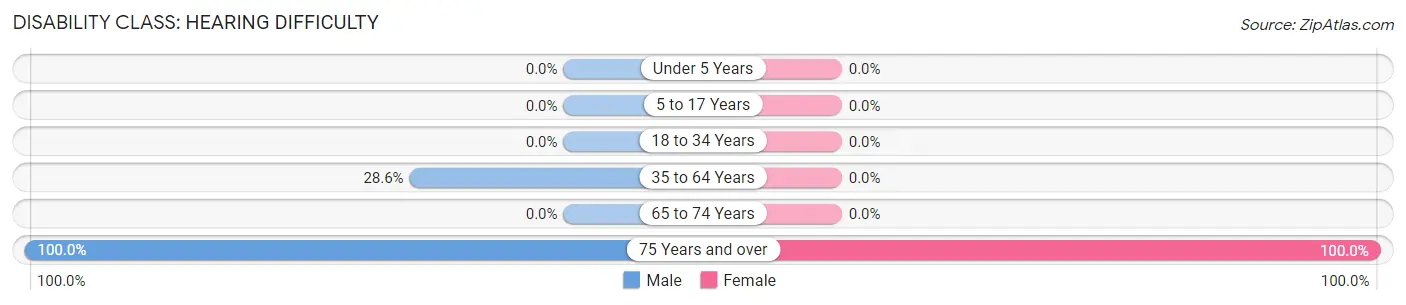
| Age Bracket | Male | Female |
| Under 5 Years | 0 (0.0%) | 0 (0.0%) |
| 5 to 17 Years | 0 (0.0%) | 0 (0.0%) |
| 18 to 34 Years | 0 (0.0%) | 0 (0.0%) |
| 35 to 64 Years | 8 (28.6%) | 0 (0.0%) |
| 65 to 74 Years | 0 (0.0%) | 0 (0.0%) |
| 75 Years and over | 12 (100.0%) | 5 (100.0%) |
Disability Class: Vision Difficulty
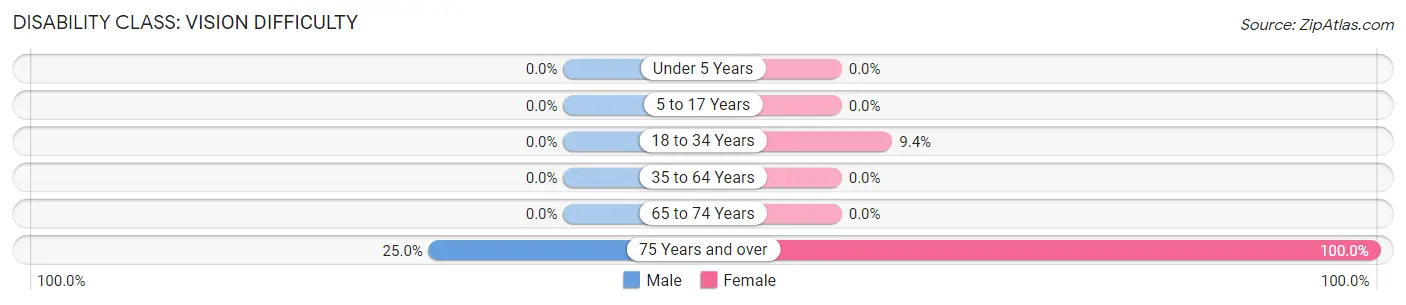
| Age Bracket | Male | Female |
| Under 5 Years | 0 (0.0%) | 0 (0.0%) |
| 5 to 17 Years | 0 (0.0%) | 0 (0.0%) |
| 18 to 34 Years | 0 (0.0%) | 3 (9.4%) |
| 35 to 64 Years | 0 (0.0%) | 0 (0.0%) |
| 65 to 74 Years | 0 (0.0%) | 0 (0.0%) |
| 75 Years and over | 3 (25.0%) | 5 (100.0%) |
Disability Class: Cognitive Difficulty
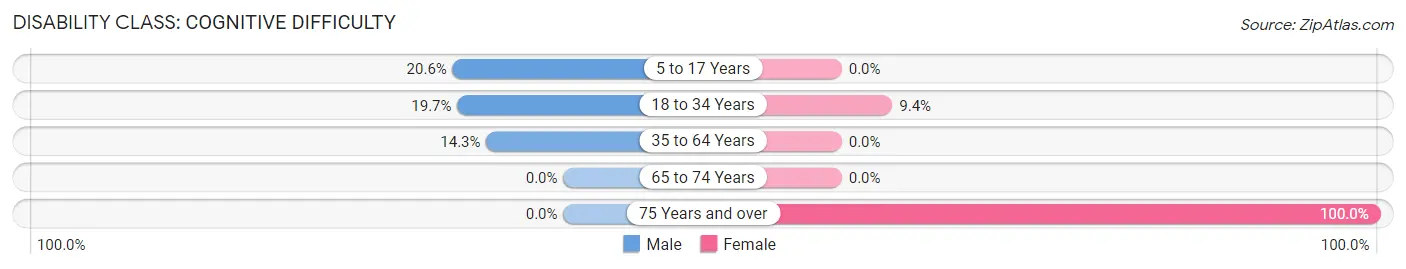
| Age Bracket | Male | Female |
| 5 to 17 Years | 15 (20.5%) | 0 (0.0%) |
| 18 to 34 Years | 12 (19.7%) | 3 (9.4%) |
| 35 to 64 Years | 4 (14.3%) | 0 (0.0%) |
| 65 to 74 Years | 0 (0.0%) | 0 (0.0%) |
| 75 Years and over | 0 (0.0%) | 5 (100.0%) |
Disability Class: Ambulatory Difficulty
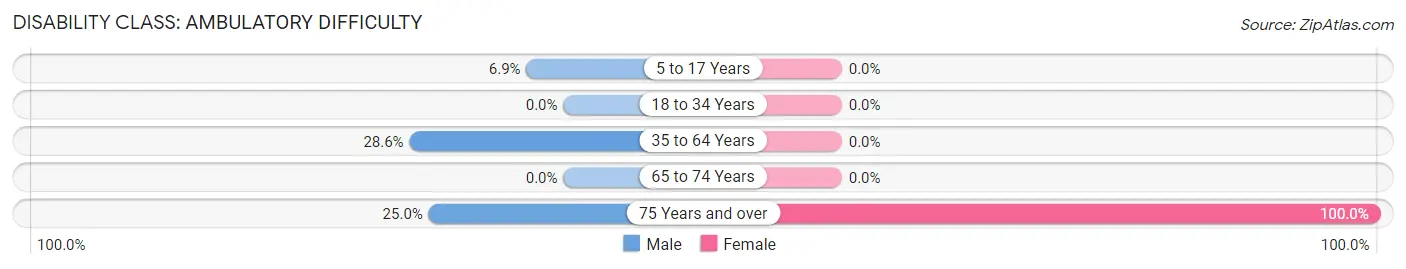
| Age Bracket | Male | Female |
| 5 to 17 Years | 5 (6.9%) | 0 (0.0%) |
| 18 to 34 Years | 0 (0.0%) | 0 (0.0%) |
| 35 to 64 Years | 8 (28.6%) | 0 (0.0%) |
| 65 to 74 Years | 0 (0.0%) | 0 (0.0%) |
| 75 Years and over | 3 (25.0%) | 5 (100.0%) |
Disability Class: Self-Care Difficulty
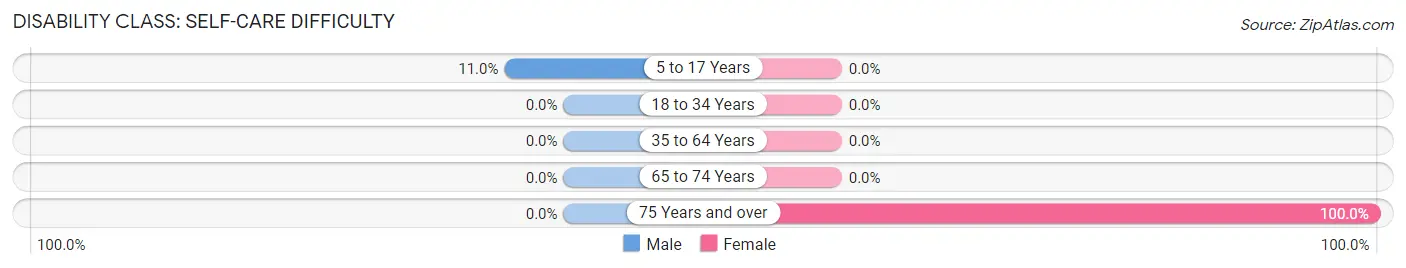
| Age Bracket | Male | Female |
| 5 to 17 Years | 8 (11.0%) | 0 (0.0%) |
| 18 to 34 Years | 0 (0.0%) | 0 (0.0%) |
| 35 to 64 Years | 0 (0.0%) | 0 (0.0%) |
| 65 to 74 Years | 0 (0.0%) | 0 (0.0%) |
| 75 Years and over | 0 (0.0%) | 5 (100.0%) |
Technology Access in Winslow West
Computing Device Access in Winslow West
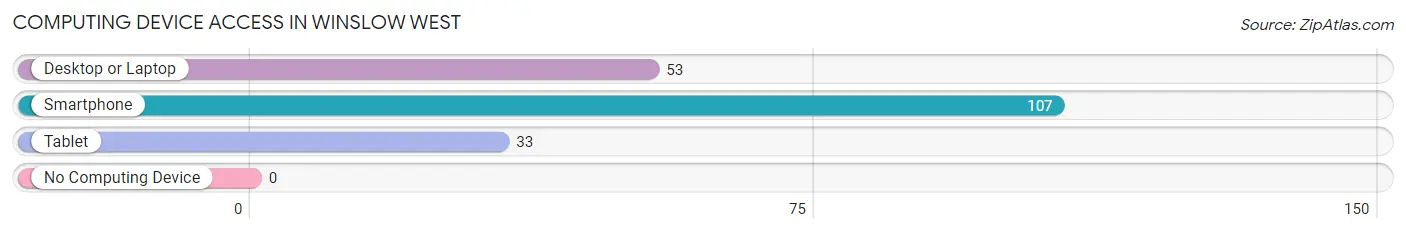
| Device Type | # Households | % Households |
| Desktop or Laptop | 53 | 49.5% |
| Smartphone | 107 | 100.0% |
| Tablet | 33 | 30.8% |
| No Computing Device | 0 | 0.0% |
| Total | 107 | 100.0% |
Internet Access in Winslow West
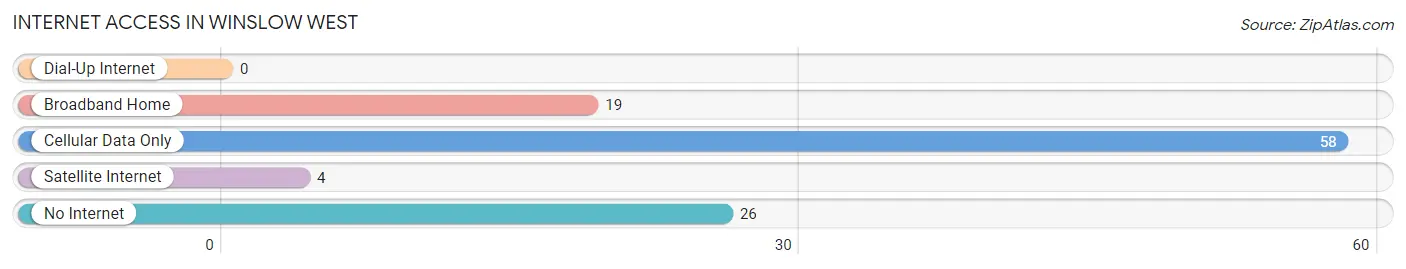
| Internet Type | # Households | % Households |
| Dial-Up Internet | 0 | 0.0% |
| Broadband Home | 19 | 17.8% |
| Cellular Data Only | 58 | 54.2% |
| Satellite Internet | 4 | 3.7% |
| No Internet | 26 | 24.3% |
| Total | 107 | 100.0% |
Winslow West Summary
Winslow West, Arizona is a small unincorporated community located in Navajo County, Arizona. It is situated in the northeastern part of the state, approximately 20 miles west of Winslow. The community is located in the high desert region of the state, at an elevation of 5,000 feet.
History
The area that is now Winslow West was first settled by the Navajo people in the late 1800s. The first non-Native American settlers arrived in the area in the early 1900s. The community was originally known as "Rattlesnake Springs" and was later renamed "Winslow West" in honor of the nearby city of Winslow.
The area was primarily used for ranching and farming until the 1950s, when the construction of Interstate 40 brought an influx of travelers and businesses to the area. The community was officially incorporated in 1960.
Geography
Winslow West is located in the high desert region of Arizona, at an elevation of 5,000 feet. The area is characterized by rolling hills, mesas, and canyons. The climate is semi-arid, with hot summers and mild winters. The average annual precipitation is approximately 10 inches.
The community is located approximately 20 miles west of Winslow, and is accessible via Interstate 40. The nearest major cities are Flagstaff, Arizona (90 miles to the west) and Albuquerque, New Mexico (200 miles to the east).
Economy
The economy of Winslow West is largely based on tourism and agriculture. The area is home to several tourist attractions, including the Meteor Crater, the Petrified Forest National Park, and the Navajo Nation. The community is also home to several farms and ranches, which produce a variety of crops and livestock.
The area is also home to several businesses, including restaurants, gas stations, and convenience stores. The community is served by a post office, a library, and a fire station.
Demographics
As of the 2010 census, the population of Winslow West was 1,845. The racial makeup of the community was 94.3% White, 0.7% African American, 0.7% Native American, 0.3% Asian, 0.1% Pacific Islander, and 3.0% from other races. The median household income was $35,000, and the median family income was $41,000.
Conclusion
Winslow West, Arizona is a small unincorporated community located in Navajo County, Arizona. It is situated in the northeastern part of the state, approximately 20 miles west of Winslow. The community was originally settled by the Navajo people in the late 1800s, and was later incorporated in 1960. The economy of Winslow West is largely based on tourism and agriculture, and the population of the community was 1,845 as of the 2010 census.
Common Questions
What is Per Capita Income in Winslow West?
Per Capita income in Winslow West is $16,031.
What is the Median Household income in Winslow West?
Median Household Income in Winslow West is $43,125.
What is Income or Wage Gap in Winslow West?
Income or Wage Gap in Winslow West is 29.2%.
Women in Winslow West earn 70.8 cents for every dollar earned by a man.
What is Family Income Deficit in Winslow West?
Family Income Deficit in Winslow West is $15,806.
Families that are below poverty line in Winslow West earn $15,806 less on average than the poverty threshold level.
What is Inequality or Gini Index in Winslow West?
Inequality or Gini Index in Winslow West is 0.43.
What is the Total Population of Winslow West?
Total Population of Winslow West is 343.
What is the Total Male Population of Winslow West?
Total Male Population of Winslow West is 184.
What is the Total Female Population of Winslow West?
Total Female Population of Winslow West is 159.
What is the Ratio of Males per 100 Females in Winslow West?
There are 115.72 Males per 100 Females in Winslow West.
What is the Ratio of Females per 100 Males in Winslow West?
There are 86.41 Females per 100 Males in Winslow West.
What is the Median Population Age in Winslow West?
Median Population Age in Winslow West is 29.9 Years.
What is the Average Family Size in Winslow West
Average Family Size in Winslow West is 3.4 People.
What is the Average Household Size in Winslow West
Average Household Size in Winslow West is 3.2 People.
How Large is the Labor Force in Winslow West?
There are 136 People in the Labor Forcein in Winslow West.
What is the Percentage of People in the Labor Force in Winslow West?
62.4% of People are in the Labor Force in Winslow West.
What is the Unemployment Rate in Winslow West?
Unemployment Rate in Winslow West is 11.0%.