Springerville, AZ Map & Demographics
Springerville Map
Springerville Overview
$26,578
PER CAPITA INCOME
$57,188
AVG FAMILY INCOME
$48,475
AVG HOUSEHOLD INCOME
50.4%
WAGE / INCOME GAP [ % ]
49.6¢/ $1
WAGE / INCOME GAP [ $ ]
$8,612
FAMILY INCOME DEFICIT
0.40
INEQUALITY / GINI INDEX
2,006
TOTAL POPULATION
881
MALE POPULATION
1,125
FEMALE POPULATION
78.31
MALES / 100 FEMALES
127.70
FEMALES / 100 MALES
41.5
MEDIAN AGE
2.9
AVG FAMILY SIZE
2.4
AVG HOUSEHOLD SIZE
740
LABOR FORCE [ PEOPLE ]
46.6%
PERCENT IN LABOR FORCE
1.9%
UNEMPLOYMENT RATE
Springerville Zip Codes
Springerville Area Codes
Income in Springerville
Income Overview in Springerville
Per Capita Income in Springerville is $26,578, while median incomes of families and households are $57,188 and $48,475 respectively.
| Characteristic | Number | Measure |
| Per Capita Income | 2,006 | $26,578 |
| Median Family Income | 572 | $57,188 |
| Mean Family Income | 572 | $74,700 |
| Median Household Income | 823 | $48,475 |
| Mean Household Income | 823 | $65,576 |
| Income Deficit | 572 | $8,612 |
| Wage / Income Gap (%) | 2,006 | 50.42% |
| Wage / Income Gap ($) | 2,006 | 49.58¢ per $1 |
| Gini / Inequality Index | 2,006 | 0.40 |
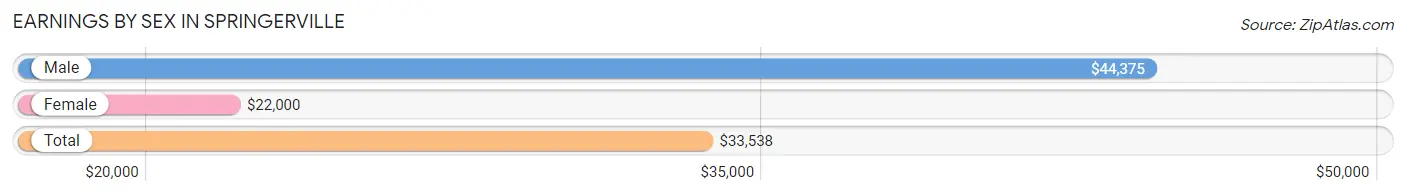
Earnings by Sex in Springerville
Average Earnings in Springerville are $33,538, $44,375 for men and $22,000 for women, a difference of 50.4%.
| Sex | Number | Average Earnings |
| Male | 372 (46.6%) | $44,375 |
| Female | 426 (53.4%) | $22,000 |
| Total | 798 (100.0%) | $33,538 |
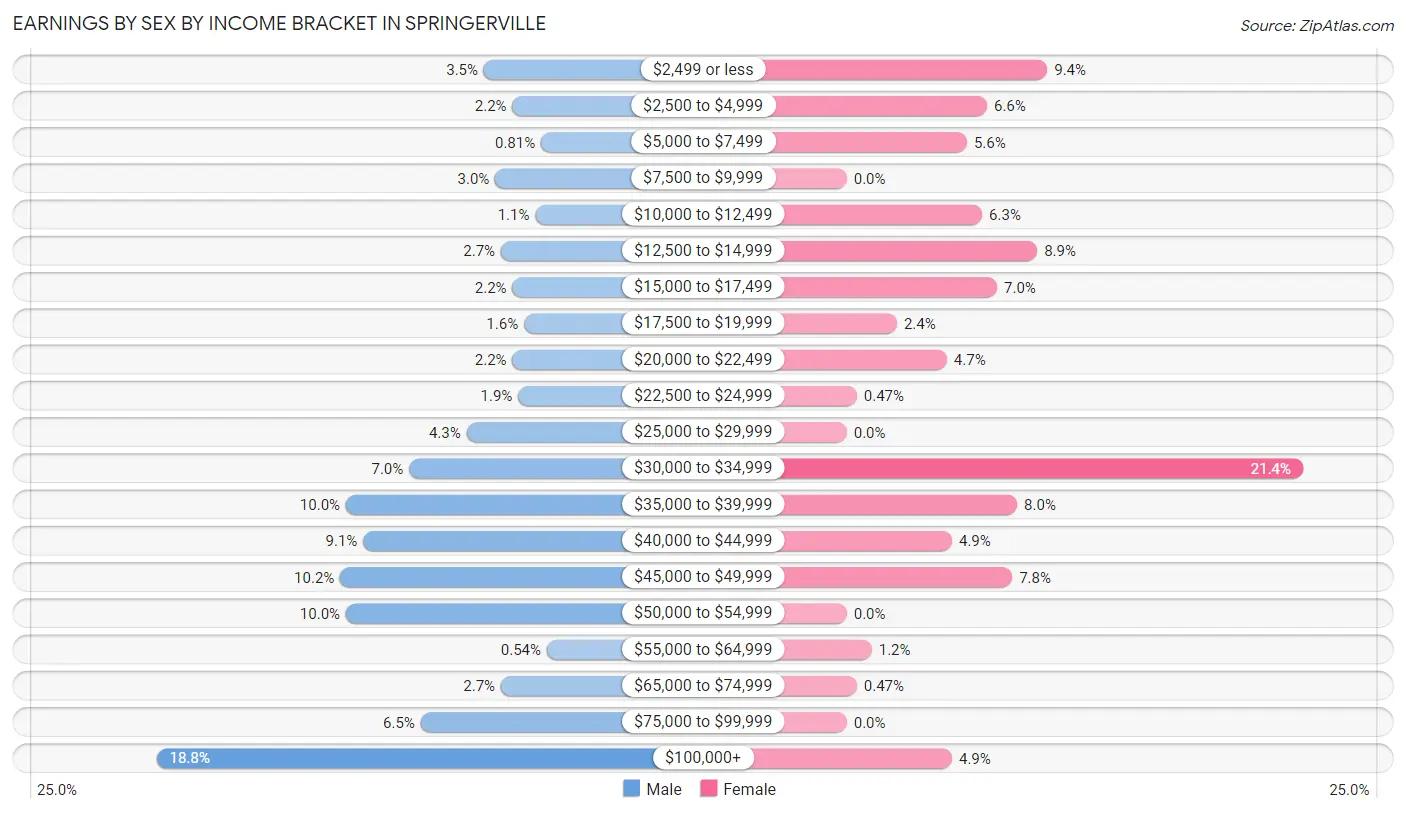
Earnings by Sex by Income Bracket in Springerville
The most common earnings brackets in Springerville are $100,000+ for men (70 | 18.8%) and $30,000 to $34,999 for women (91 | 21.4%).
| Income | Male | Female |
| $2,499 or less | 13 (3.5%) | 40 (9.4%) |
| $2,500 to $4,999 | 8 (2.1%) | 28 (6.6%) |
| $5,000 to $7,499 | 3 (0.8%) | 24 (5.6%) |
| $7,500 to $9,999 | 11 (3.0%) | 0 (0.0%) |
| $10,000 to $12,499 | 4 (1.1%) | 27 (6.3%) |
| $12,500 to $14,999 | 10 (2.7%) | 38 (8.9%) |
| $15,000 to $17,499 | 8 (2.1%) | 30 (7.0%) |
| $17,500 to $19,999 | 6 (1.6%) | 10 (2.4%) |
| $20,000 to $22,499 | 8 (2.1%) | 20 (4.7%) |
| $22,500 to $24,999 | 7 (1.9%) | 2 (0.5%) |
| $25,000 to $29,999 | 16 (4.3%) | 0 (0.0%) |
| $30,000 to $34,999 | 26 (7.0%) | 91 (21.4%) |
| $35,000 to $39,999 | 37 (10.0%) | 34 (8.0%) |
| $40,000 to $44,999 | 34 (9.1%) | 21 (4.9%) |
| $45,000 to $49,999 | 38 (10.2%) | 33 (7.7%) |
| $50,000 to $54,999 | 37 (10.0%) | 0 (0.0%) |
| $55,000 to $64,999 | 2 (0.5%) | 5 (1.2%) |
| $65,000 to $74,999 | 10 (2.7%) | 2 (0.5%) |
| $75,000 to $99,999 | 24 (6.5%) | 0 (0.0%) |
| $100,000+ | 70 (18.8%) | 21 (4.9%) |
| Total | 372 (100.0%) | 426 (100.0%) |
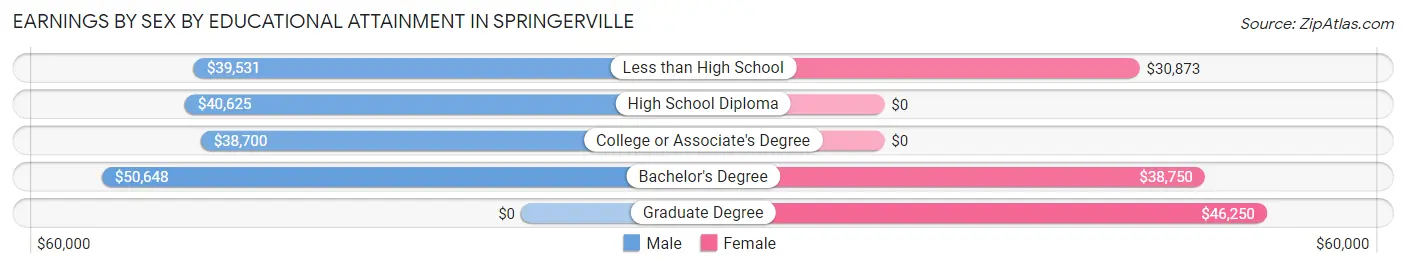
Earnings by Sex by Educational Attainment in Springerville
Average earnings in Springerville are $48,250 for men and $31,336 for women, a difference of 35.0%. Men with an educational attainment of bachelor's degree enjoy the highest average annual earnings of $50,648, while those with college or associate's degree education earn the least with $38,700. Women with an educational attainment of graduate degree earn the most with the average annual earnings of $46,250, while those with less than high school education have the smallest earnings of $30,873.
| Educational Attainment | Male Income | Female Income |
| Less than High School | $39,531 | $30,873 |
| High School Diploma | $40,625 | $0 |
| College or Associate's Degree | $38,700 | $0 |
| Bachelor's Degree | $50,648 | $38,750 |
| Graduate Degree | - | - |
| Total | $48,250 | $31,336 |
Family Income in Springerville
Family Income Brackets in Springerville
According to the Springerville family income data, there are 155 families falling into the $35,000 to $49,999 income range, which is the most common income bracket and makes up 27.1% of all families.
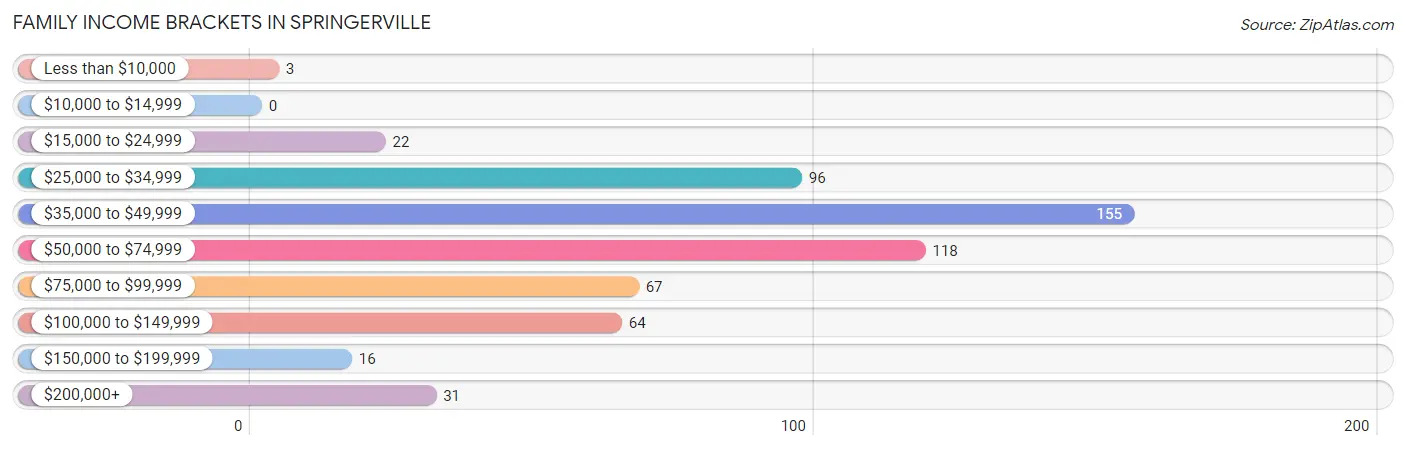
| Income Bracket | # Families | % Families |
| Less than $10,000 | 3 | 0.5% |
| $10,000 to $14,999 | 0 | 0.0% |
| $15,000 to $24,999 | 22 | 3.8% |
| $25,000 to $34,999 | 96 | 16.8% |
| $35,000 to $49,999 | 155 | 27.1% |
| $50,000 to $74,999 | 118 | 20.6% |
| $75,000 to $99,999 | 67 | 11.7% |
| $100,000 to $149,999 | 64 | 11.2% |
| $150,000 to $199,999 | 16 | 2.8% |
| $200,000+ | 31 | 5.4% |
Family Income by Famaliy Size in Springerville
5-person families (52 | 9.1%) account for the highest median family income in Springerville with $93,889 per family, while 2-person families (233 | 40.7%) have the highest median income of $33,080 per family member.
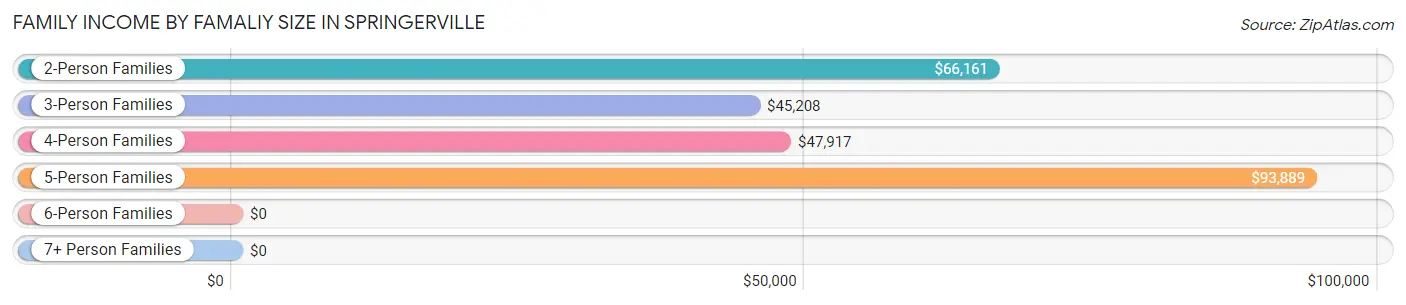
| Income Bracket | # Families | Median Income |
| 2-Person Families | 233 (40.7%) | $66,161 |
| 3-Person Families | 131 (22.9%) | $45,208 |
| 4-Person Families | 144 (25.2%) | $47,917 |
| 5-Person Families | 52 (9.1%) | $93,889 |
| 6-Person Families | 12 (2.1%) | $0 |
| 7+ Person Families | 0 (0.0%) | $0 |
| Total | 572 (100.0%) | $57,188 |
Family Income by Number of Earners in Springerville
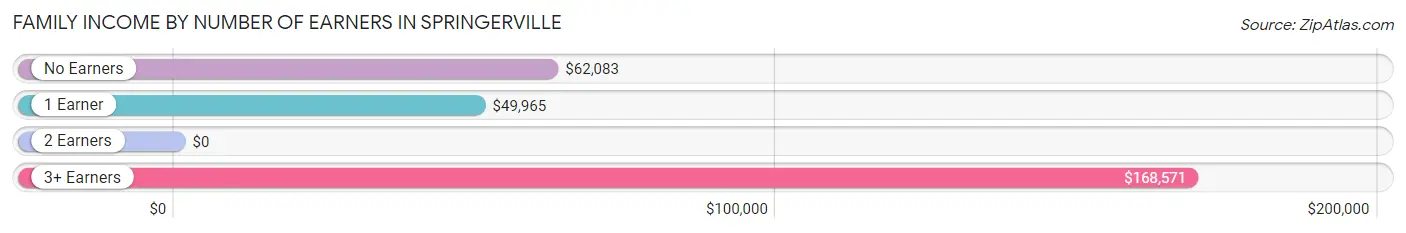
| Number of Earners | # Families | Median Income |
| No Earners | 103 (18.0%) | $62,083 |
| 1 Earner | 263 (46.0%) | $49,965 |
| 2 Earners | 166 (29.0%) | $0 |
| 3+ Earners | 40 (7.0%) | $168,571 |
| Total | 572 (100.0%) | $57,188 |
Household Income in Springerville
Household Income Brackets in Springerville
With 203 households falling in the category, the $35,000 to $49,999 income range is the most frequent in Springerville, accounting for 24.7% of all households. In contrast, only 5 households (0.6%) fall into the $10,000 to $14,999 income bracket, making it the least populous group.
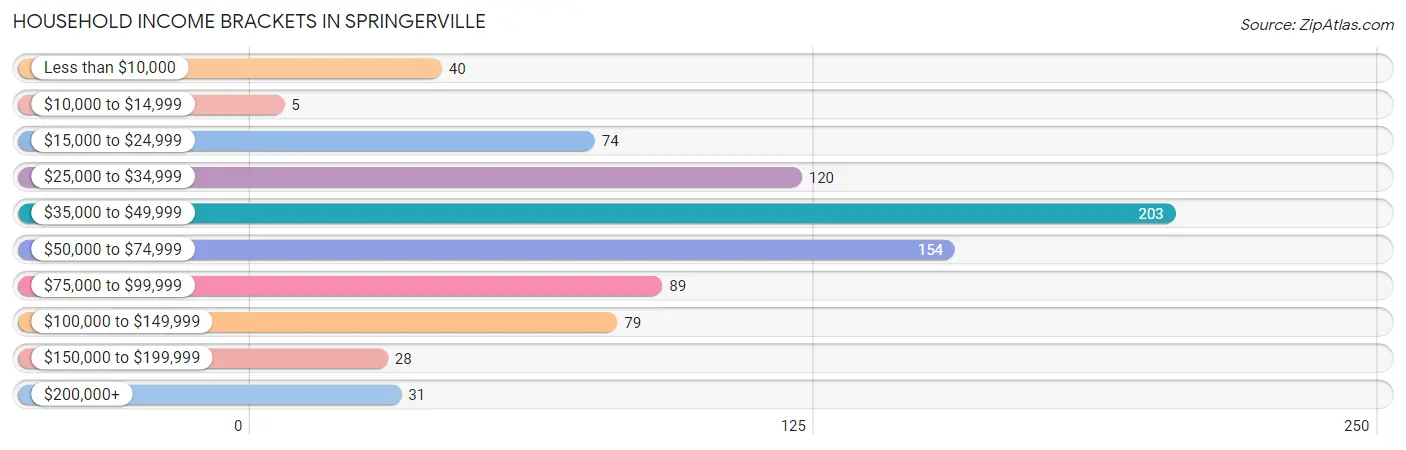
| Income Bracket | # Households | % Households |
| Less than $10,000 | 40 | 4.9% |
| $10,000 to $14,999 | 5 | 0.6% |
| $15,000 to $24,999 | 74 | 9.0% |
| $25,000 to $34,999 | 120 | 14.6% |
| $35,000 to $49,999 | 203 | 24.7% |
| $50,000 to $74,999 | 154 | 18.7% |
| $75,000 to $99,999 | 89 | 10.8% |
| $100,000 to $149,999 | 79 | 9.6% |
| $150,000 to $199,999 | 28 | 3.4% |
| $200,000+ | 31 | 3.8% |
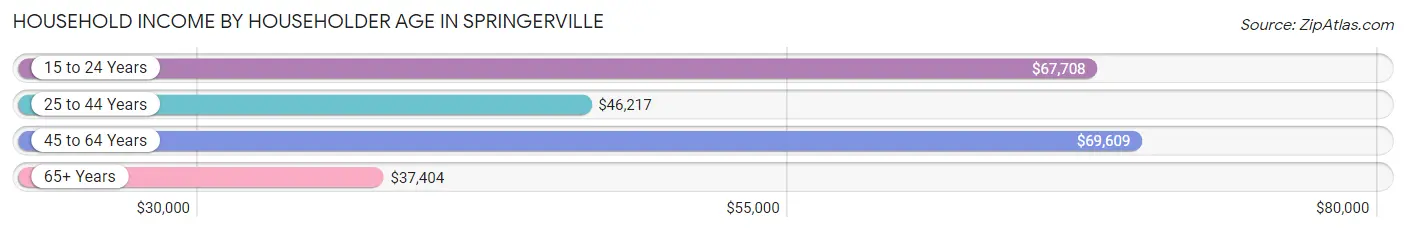
Household Income by Householder Age in Springerville
The median household income in Springerville is $48,475, with the highest median household income of $69,609 found in the 45 to 64 years age bracket for the primary householder. A total of 273 households (33.2%) fall into this category. Meanwhile, the 65+ years age bracket for the primary householder has the lowest median household income of $37,404, with 297 households (36.1%) in this group.
| Income Bracket | # Households | Median Income |
| 15 to 24 Years | 11 (1.3%) | $67,708 |
| 25 to 44 Years | 242 (29.4%) | $46,217 |
| 45 to 64 Years | 273 (33.2%) | $69,609 |
| 65+ Years | 297 (36.1%) | $37,404 |
| Total | 823 (100.0%) | $48,475 |
Poverty in Springerville
Income Below Poverty by Sex and Age in Springerville
With 6.4% poverty level for males and 10.4% for females among the residents of Springerville, 6 to 11 year old males and 12 to 14 year old females are the most vulnerable to poverty, with 13 males (18.6%) and 6 females (60.0%) in their respective age groups living below the poverty level.
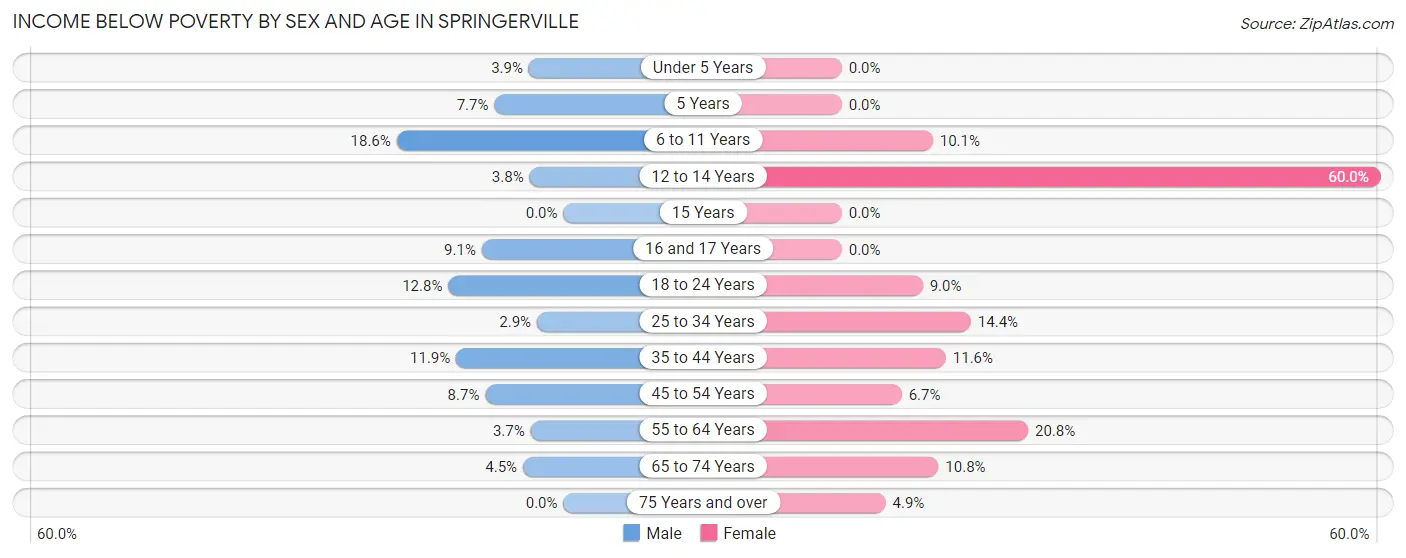
| Age Bracket | Male | Female |
| Under 5 Years | 3 (3.8%) | 0 (0.0%) |
| 5 Years | 2 (7.7%) | 0 (0.0%) |
| 6 to 11 Years | 13 (18.6%) | 8 (10.1%) |
| 12 to 14 Years | 2 (3.8%) | 6 (60.0%) |
| 15 Years | 0 (0.0%) | 0 (0.0%) |
| 16 and 17 Years | 3 (9.1%) | 0 (0.0%) |
| 18 to 24 Years | 5 (12.8%) | 10 (9.0%) |
| 25 to 34 Years | 2 (2.9%) | 23 (14.4%) |
| 35 to 44 Years | 8 (11.9%) | 16 (11.6%) |
| 45 to 54 Years | 8 (8.7%) | 6 (6.7%) |
| 55 to 64 Years | 5 (3.6%) | 22 (20.7%) |
| 65 to 74 Years | 5 (4.5%) | 17 (10.8%) |
| 75 Years and over | 0 (0.0%) | 8 (4.9%) |
| Total | 56 (6.4%) | 116 (10.4%) |
Income Above Poverty by Sex and Age in Springerville
According to the poverty statistics in Springerville, males aged 15 years and females aged under 5 years are the age groups that are most secure financially, with 100.0% of males and 100.0% of females in these age groups living above the poverty line.
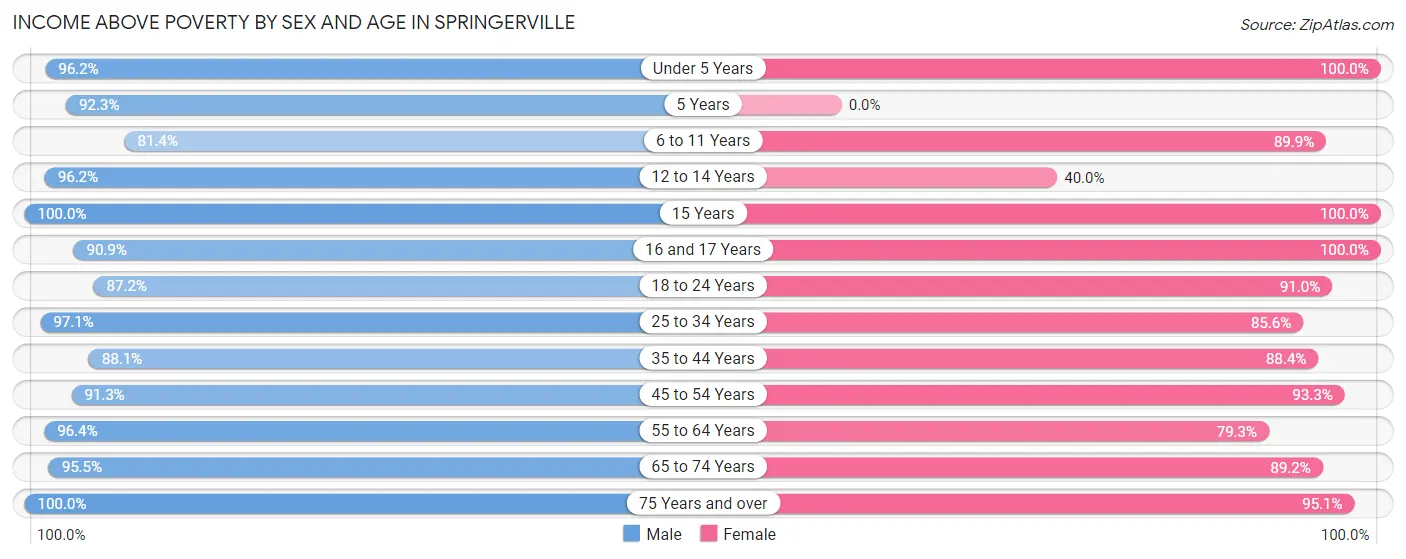
| Age Bracket | Male | Female |
| Under 5 Years | 75 (96.2%) | 56 (100.0%) |
| 5 Years | 24 (92.3%) | 0 (0.0%) |
| 6 to 11 Years | 57 (81.4%) | 71 (89.9%) |
| 12 to 14 Years | 51 (96.2%) | 4 (40.0%) |
| 15 Years | 25 (100.0%) | 16 (100.0%) |
| 16 and 17 Years | 30 (90.9%) | 31 (100.0%) |
| 18 to 24 Years | 34 (87.2%) | 101 (91.0%) |
| 25 to 34 Years | 66 (97.1%) | 137 (85.6%) |
| 35 to 44 Years | 59 (88.1%) | 122 (88.4%) |
| 45 to 54 Years | 84 (91.3%) | 84 (93.3%) |
| 55 to 64 Years | 132 (96.4%) | 84 (79.2%) |
| 65 to 74 Years | 106 (95.5%) | 141 (89.2%) |
| 75 Years and over | 82 (100.0%) | 156 (95.1%) |
| Total | 825 (93.6%) | 1,003 (89.6%) |
Income Below Poverty Among Married-Couple Families in Springerville
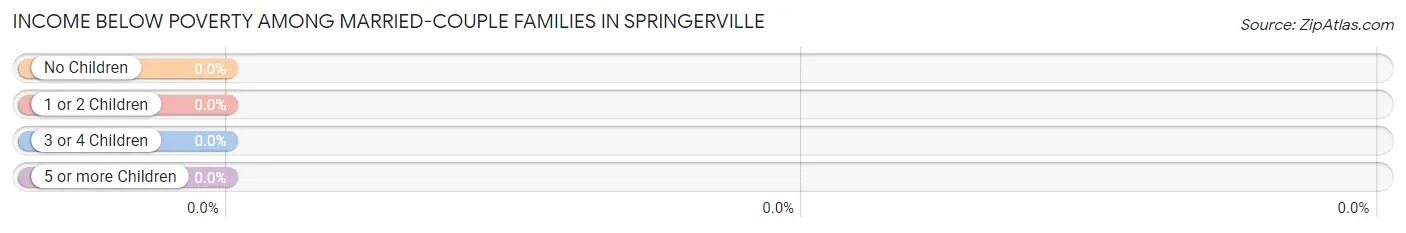
| Children | Above Poverty | Below Poverty |
| No Children | 212 (100.0%) | 0 (0.0%) |
| 1 or 2 Children | 101 (100.0%) | 0 (0.0%) |
| 3 or 4 Children | 52 (100.0%) | 0 (0.0%) |
| 5 or more Children | 0 (0.0%) | 0 (0.0%) |
| Total | 365 (100.0%) | 0 (0.0%) |
Income Below Poverty Among Single-Parent Households in Springerville
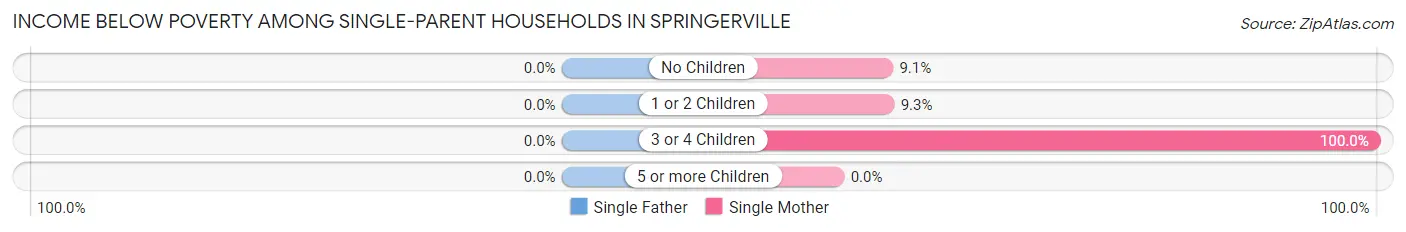
| Children | Single Father | Single Mother |
| No Children | 0 (0.0%) | 3 (9.1%) |
| 1 or 2 Children | 0 (0.0%) | 11 (9.3%) |
| 3 or 4 Children | 0 (0.0%) | 11 (100.0%) |
| 5 or more Children | 0 (0.0%) | 0 (0.0%) |
| Total | 0 (0.0%) | 25 (15.4%) |
Income Below Poverty Among Married-Couple vs Single-Parent Households in Springerville
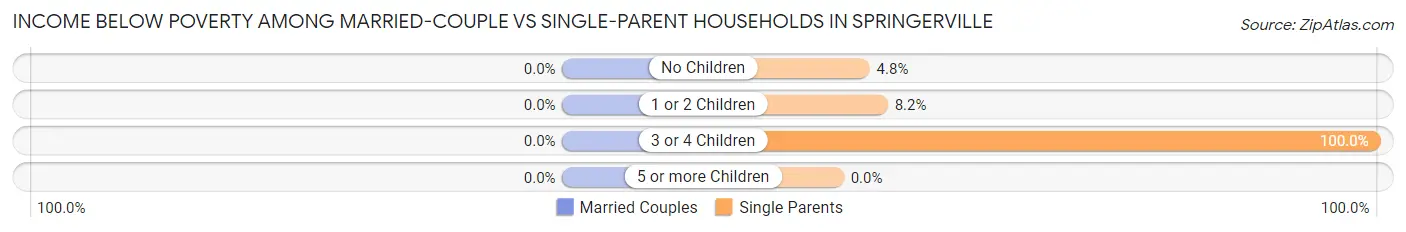
| Children | Married-Couple Families | Single-Parent Households |
| No Children | 0 (0.0%) | 3 (4.8%) |
| 1 or 2 Children | 0 (0.0%) | 11 (8.2%) |
| 3 or 4 Children | 0 (0.0%) | 11 (100.0%) |
| 5 or more Children | 0 (0.0%) | 0 (0.0%) |
| Total | 0 (0.0%) | 25 (12.1%) |
Race in Springerville
The most populous races in Springerville are White / Caucasian (1,613 | 80.4%), Hispanic or Latino (528 | 26.3%), and Two or more Races (239 | 11.9%).
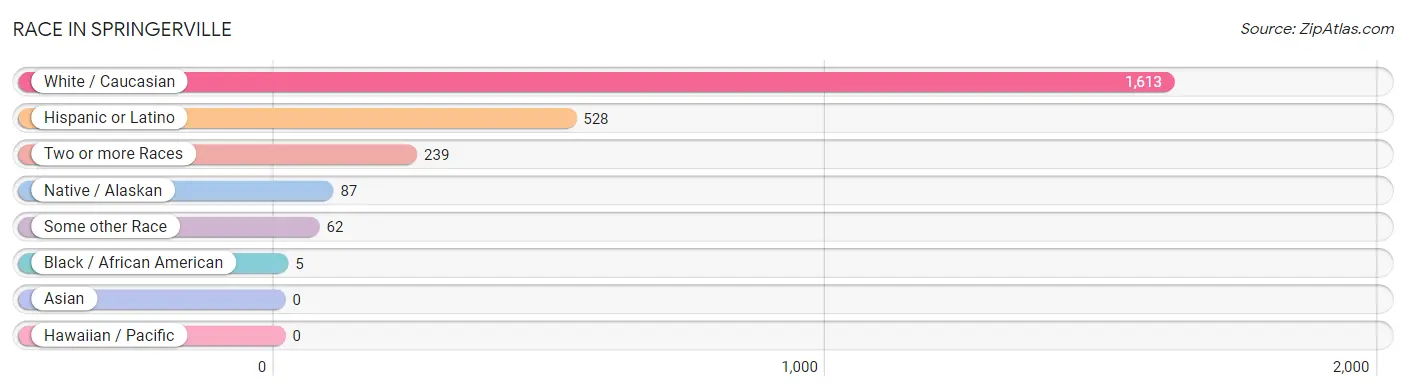
| Race | # Population | % Population |
| Asian | 0 | 0.0% |
| Black / African American | 5 | 0.3% |
| Hawaiian / Pacific | 0 | 0.0% |
| Hispanic or Latino | 528 | 26.3% |
| Native / Alaskan | 87 | 4.3% |
| White / Caucasian | 1,613 | 80.4% |
| Two or more Races | 239 | 11.9% |
| Some other Race | 62 | 3.1% |
| Total | 2,006 | 100.0% |
Ancestry in Springerville
The most populous ancestries reported in Springerville are English (344 | 17.2%), German (329 | 16.4%), Mexican (268 | 13.4%), Irish (206 | 10.3%), and Scottish (160 | 8.0%), together accounting for 65.2% of all Springerville residents.
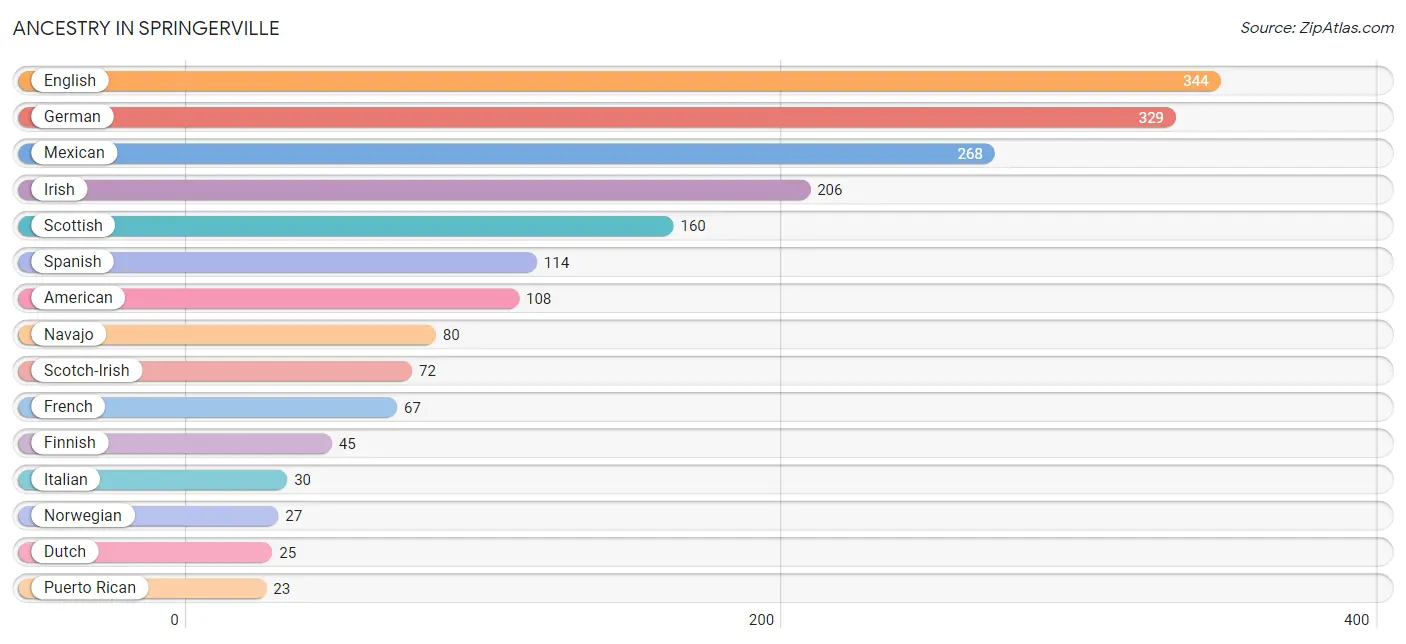
| Ancestry | # Population | % Population |
| American | 108 | 5.4% |
| Cuban | 9 | 0.4% |
| Czech | 15 | 0.7% |
| Danish | 11 | 0.5% |
| Dutch | 25 | 1.3% |
| Dutch West Indian | 12 | 0.6% |
| English | 344 | 17.2% |
| European | 21 | 1.1% |
| Finnish | 45 | 2.2% |
| French | 67 | 3.3% |
| French Canadian | 9 | 0.4% |
| German | 329 | 16.4% |
| Irish | 206 | 10.3% |
| Iroquois | 5 | 0.3% |
| Italian | 30 | 1.5% |
| Korean | 10 | 0.5% |
| Mexican | 268 | 13.4% |
| Navajo | 80 | 4.0% |
| Norwegian | 27 | 1.3% |
| Puerto Rican | 23 | 1.1% |
| Scotch-Irish | 72 | 3.6% |
| Scottish | 160 | 8.0% |
| Spanish | 114 | 5.7% |
| Swedish | 21 | 1.1% |
| Swiss | 2 | 0.1% |
| Yaqui | 15 | 0.7% | View All 26 Rows |
Immigrants in Springerville
The most numerous immigrant groups reported in Springerville came from Central America (43 | 2.1%), Latin America (43 | 2.1%), and Mexico (43 | 2.1%), together accounting for 6.4% of all Springerville residents.
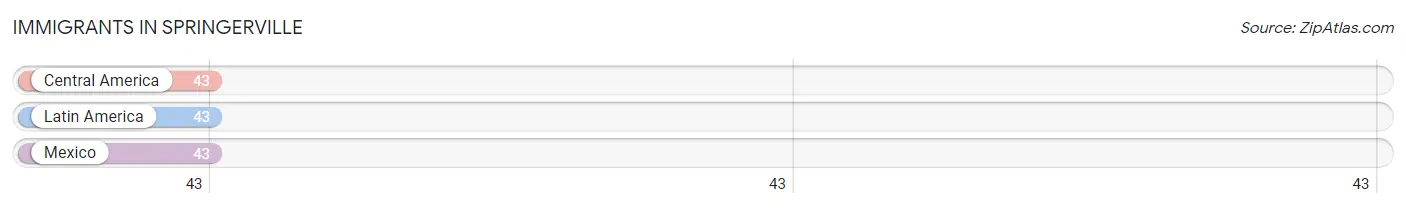
| Immigration Origin | # Population | % Population |
| Central America | 43 | 2.1% |
| Latin America | 43 | 2.1% |
| Mexico | 43 | 2.1% | View All 3 Rows |
Sex and Age in Springerville
Sex and Age in Springerville
The most populous age groups in Springerville are 10 to 14 Years (99 | 11.2%) for men and 40 to 44 Years (121 | 10.8%) for women.
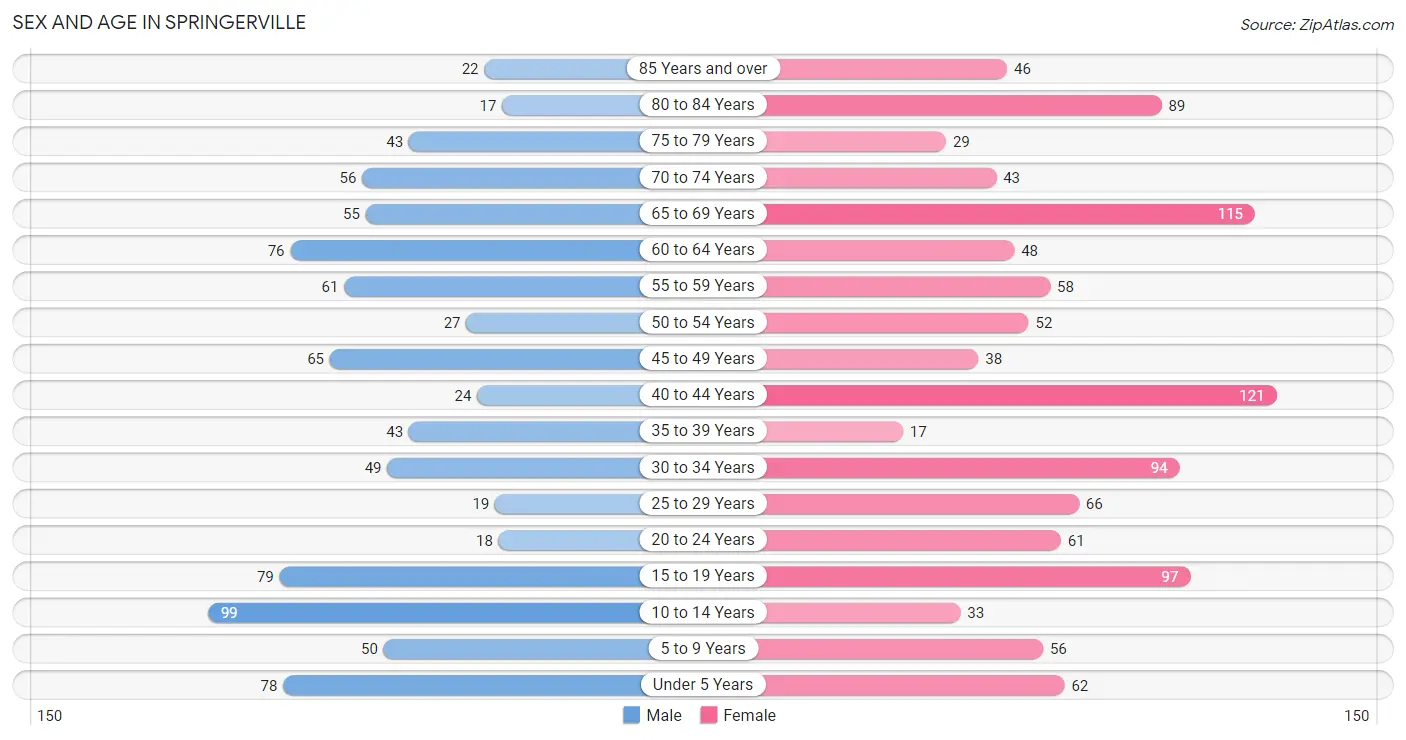
| Age Bracket | Male | Female |
| Under 5 Years | 78 (8.8%) | 62 (5.5%) |
| 5 to 9 Years | 50 (5.7%) | 56 (5.0%) |
| 10 to 14 Years | 99 (11.2%) | 33 (2.9%) |
| 15 to 19 Years | 79 (9.0%) | 97 (8.6%) |
| 20 to 24 Years | 18 (2.0%) | 61 (5.4%) |
| 25 to 29 Years | 19 (2.2%) | 66 (5.9%) |
| 30 to 34 Years | 49 (5.6%) | 94 (8.4%) |
| 35 to 39 Years | 43 (4.9%) | 17 (1.5%) |
| 40 to 44 Years | 24 (2.7%) | 121 (10.8%) |
| 45 to 49 Years | 65 (7.4%) | 38 (3.4%) |
| 50 to 54 Years | 27 (3.1%) | 52 (4.6%) |
| 55 to 59 Years | 61 (6.9%) | 58 (5.2%) |
| 60 to 64 Years | 76 (8.6%) | 48 (4.3%) |
| 65 to 69 Years | 55 (6.2%) | 115 (10.2%) |
| 70 to 74 Years | 56 (6.4%) | 43 (3.8%) |
| 75 to 79 Years | 43 (4.9%) | 29 (2.6%) |
| 80 to 84 Years | 17 (1.9%) | 89 (7.9%) |
| 85 Years and over | 22 (2.5%) | 46 (4.1%) |
| Total | 881 (100.0%) | 1,125 (100.0%) |
Families and Households in Springerville
Median Family Size in Springerville
The median family size in Springerville is 2.92 persons per family, with married-couple families (365 | 63.8%) accounting for the largest median family size of 3.02 persons per family. On the other hand, single male/father families (45 | 7.9%) represent the smallest median family size with 2.51 persons per family.
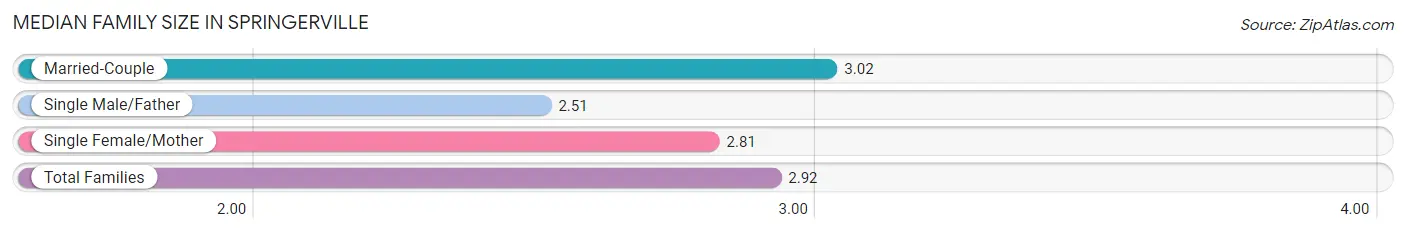
| Family Type | # Families | Family Size |
| Married-Couple | 365 (63.8%) | 3.02 |
| Single Male/Father | 45 (7.9%) | 2.51 |
| Single Female/Mother | 162 (28.3%) | 2.81 |
| Total Families | 572 (100.0%) | 2.92 |
Median Household Size in Springerville
The median household size in Springerville is 2.44 persons per household, with married-couple households (365 | 44.4%) accounting for the largest median household size of 3.02 persons per household. non-family households (251 | 30.5%) represent the smallest median household size with 1.21 persons per household.
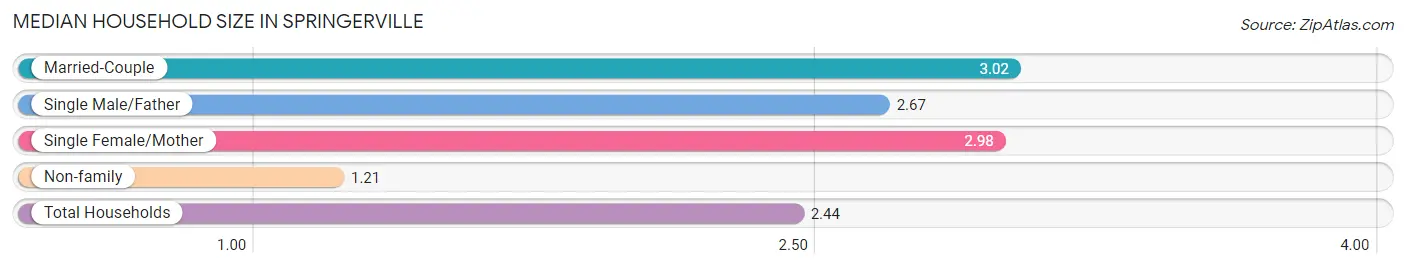
| Household Type | # Households | Household Size |
| Married-Couple | 365 (44.4%) | 3.02 |
| Single Male/Father | 45 (5.5%) | 2.67 |
| Single Female/Mother | 162 (19.7%) | 2.98 |
| Non-family | 251 (30.5%) | 1.21 |
| Total Households | 823 (100.0%) | 2.44 |
Household Size by Marriage Status in Springerville
Out of a total of 823 households in Springerville, 572 (69.5%) are family households, while 251 (30.5%) are nonfamily households. The most numerous type of family households are 2-person households, comprising 231, and the most common type of nonfamily households are 1-person households, comprising 221.
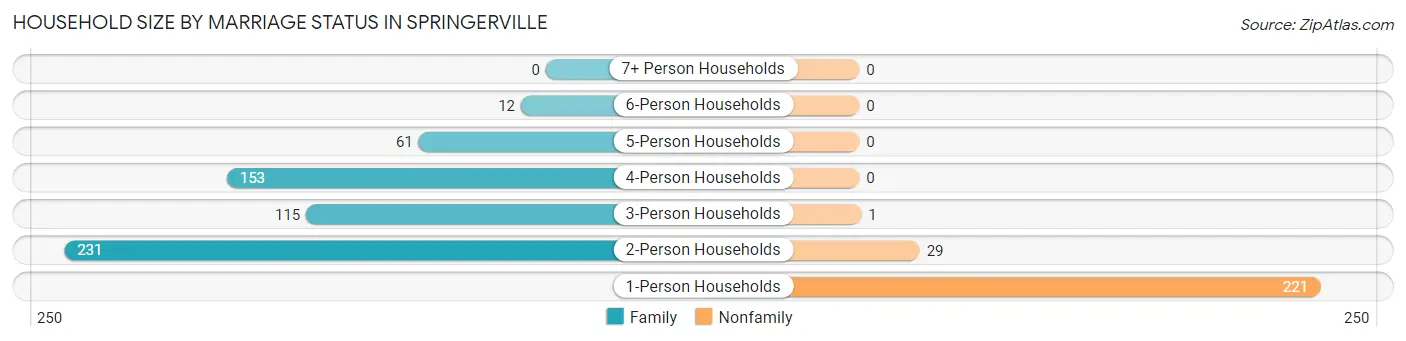
| Household Size | Family Households | Nonfamily Households |
| 1-Person Households | - | 221 (26.9%) |
| 2-Person Households | 231 (28.1%) | 29 (3.5%) |
| 3-Person Households | 115 (14.0%) | 1 (0.1%) |
| 4-Person Households | 153 (18.6%) | 0 (0.0%) |
| 5-Person Households | 61 (7.4%) | 0 (0.0%) |
| 6-Person Households | 12 (1.5%) | 0 (0.0%) |
| 7+ Person Households | 0 (0.0%) | 0 (0.0%) |
| Total | 572 (69.5%) | 251 (30.5%) |
Female Fertility in Springerville
Fertility by Age in Springerville
Average fertility rate in Springerville is 22.0 births per 1,000 women. Women in the age bracket of 20 to 34 years have the highest fertility rate with 50.0 births per 1,000 women. Women in the age bracket of 20 to 34 years acount for 100.0% of all women with births.
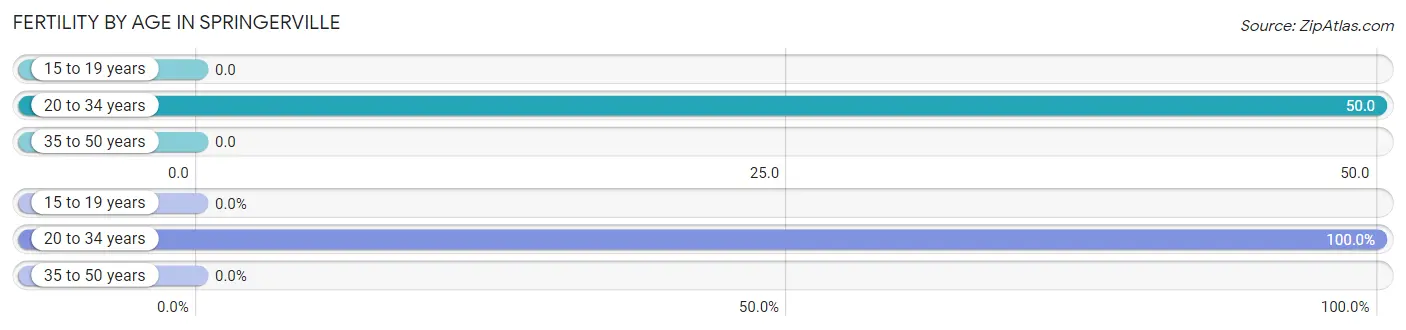
| Age Bracket | Women with Births | Births / 1,000 Women |
| 15 to 19 years | 0 (0.0%) | 0.0 |
| 20 to 34 years | 11 (100.0%) | 50.0 |
| 35 to 50 years | 0 (0.0%) | 0.0 |
| Total | 11 (100.0%) | 22.0 |
Fertility by Age by Marriage Status in Springerville
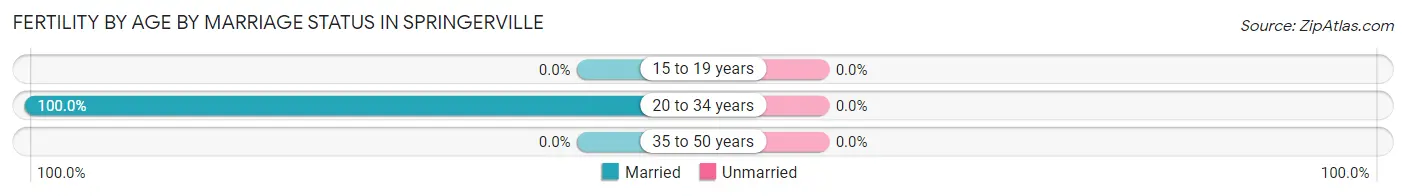
| Age Bracket | Married | Unmarried |
| 15 to 19 years | 0 (0.0%) | 0 (0.0%) |
| 20 to 34 years | 11 (100.0%) | 0 (0.0%) |
| 35 to 50 years | 0 (0.0%) | 0 (0.0%) |
| Total | 11 (100.0%) | 0 (0.0%) |
Fertility by Education in Springerville
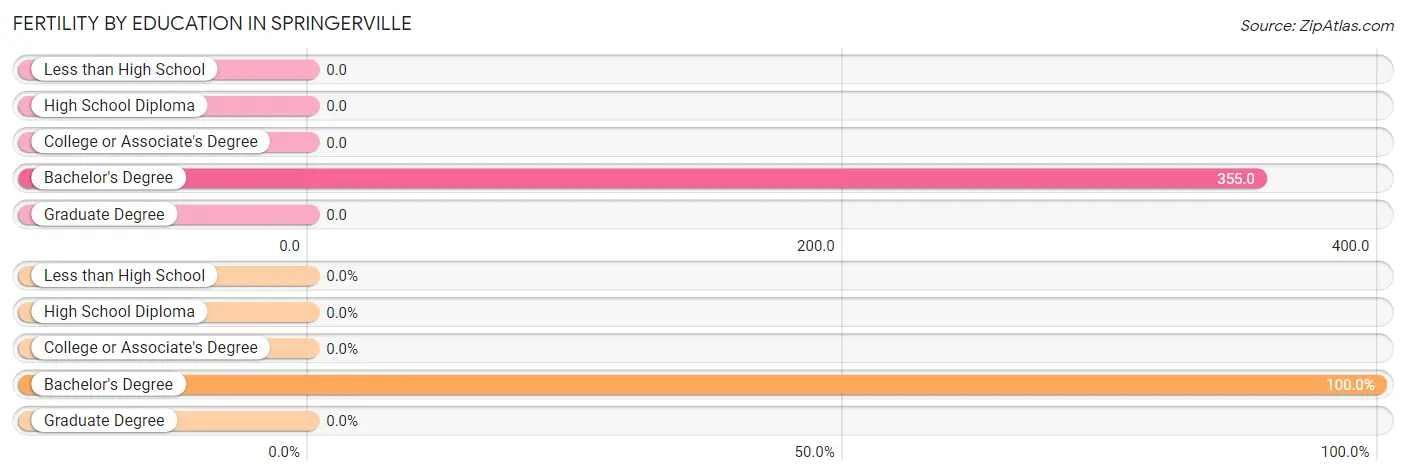
| Educational Attainment | Women with Births | Births / 1,000 Women |
| Less than High School | 0 (0.0%) | 0.0 |
| High School Diploma | 0 (0.0%) | 0.0 |
| College or Associate's Degree | 0 (0.0%) | 0.0 |
| Bachelor's Degree | 11 (100.0%) | 355.0 |
| Graduate Degree | 0 (0.0%) | 0.0 |
| Total | 11 (100.0%) | 22.0 |
Fertility by Education by Marriage Status in Springerville
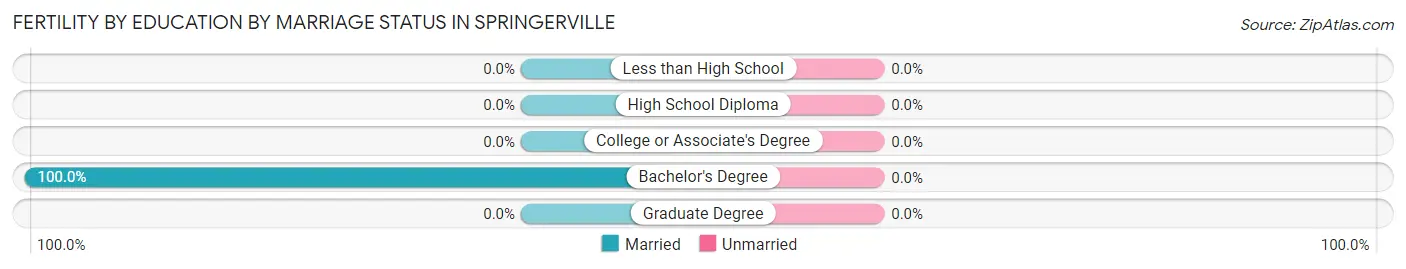
| Educational Attainment | Married | Unmarried |
| Less than High School | 0 (0.0%) | 0 (0.0%) |
| High School Diploma | 0 (0.0%) | 0 (0.0%) |
| College or Associate's Degree | 0 (0.0%) | 0 (0.0%) |
| Bachelor's Degree | 11 (100.0%) | 0 (0.0%) |
| Graduate Degree | 0 (0.0%) | 0 (0.0%) |
| Total | 11 (100.0%) | 0 (0.0%) |
Employment Characteristics in Springerville
Employment by Class of Employer in Springerville
Among the 726 employed individuals in Springerville, private company employees (403 | 55.5%), local government employees (85 | 11.7%), and state government employees (83 | 11.4%) make up the most common classes of employment.
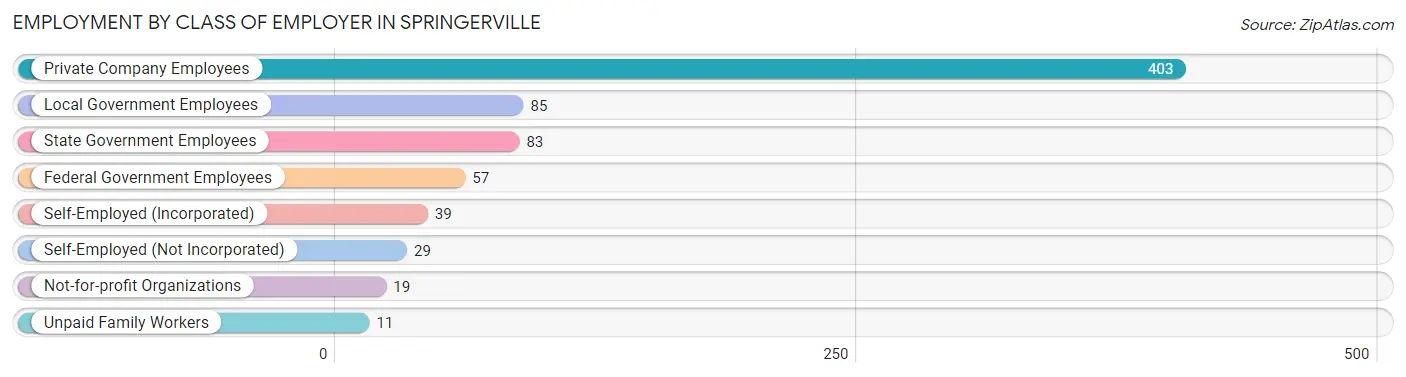
| Employer Class | # Employees | % Employees |
| Private Company Employees | 403 | 55.5% |
| Self-Employed (Incorporated) | 39 | 5.4% |
| Self-Employed (Not Incorporated) | 29 | 4.0% |
| Not-for-profit Organizations | 19 | 2.6% |
| Local Government Employees | 85 | 11.7% |
| State Government Employees | 83 | 11.4% |
| Federal Government Employees | 57 | 7.9% |
| Unpaid Family Workers | 11 | 1.5% |
| Total | 726 | 100.0% |
Employment Status by Age in Springerville
According to the labor force statistics for Springerville, out of the total population over 16 years of age (1,587), 46.6% or 740 individuals are in the labor force, with 1.9% or 14 of them unemployed. The age group with the highest labor force participation rate is 45 to 54 years, with 91.8% or 167 individuals in the labor force. Within the labor force, the 16 to 19 years age range has the highest percentage of unemployed individuals, with 20.0% or 10 of them being unemployed.
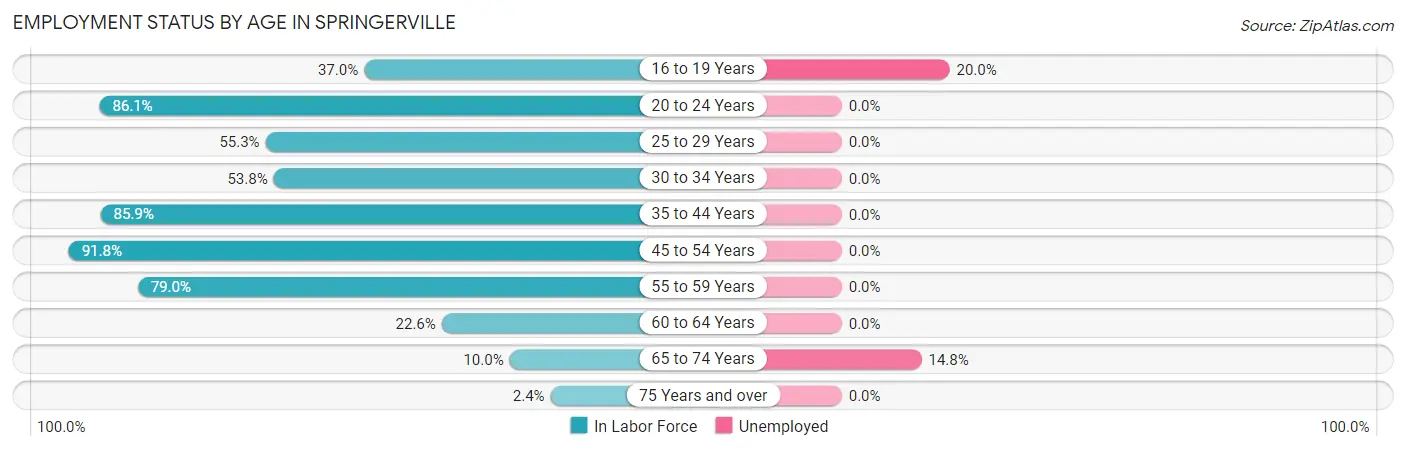
| Age Bracket | In Labor Force | Unemployed |
| 16 to 19 Years | 50 (37.0%) | 10 (20.0%) |
| 20 to 24 Years | 68 (86.1%) | 0 (0.0%) |
| 25 to 29 Years | 47 (55.3%) | 0 (0.0%) |
| 30 to 34 Years | 77 (53.8%) | 0 (0.0%) |
| 35 to 44 Years | 176 (85.9%) | 0 (0.0%) |
| 45 to 54 Years | 167 (91.8%) | 0 (0.0%) |
| 55 to 59 Years | 94 (79.0%) | 0 (0.0%) |
| 60 to 64 Years | 28 (22.6%) | 0 (0.0%) |
| 65 to 74 Years | 27 (10.0%) | 4 (14.8%) |
| 75 Years and over | 6 (2.4%) | 0 (0.0%) |
| Total | 740 (46.6%) | 14 (1.9%) |
Employment Status by Educational Attainment in Springerville
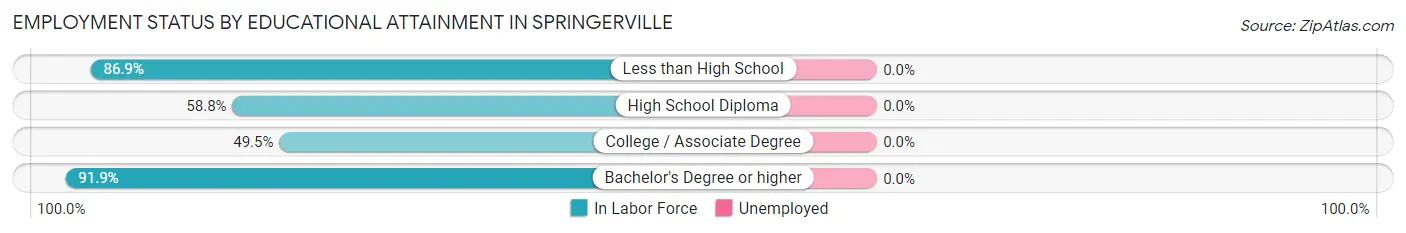
| Educational Attainment | In Labor Force | Unemployed |
| Less than High School | 106 (86.9%) | 0 (0.0%) |
| High School Diploma | 124 (58.8%) | 0 (0.0%) |
| College / Associate Degree | 144 (49.5%) | 0 (0.0%) |
| Bachelor's Degree or higher | 215 (91.9%) | 0 (0.0%) |
| Total | 589 (68.6%) | 0 (0.0%) |
Employment Occupations by Sex in Springerville
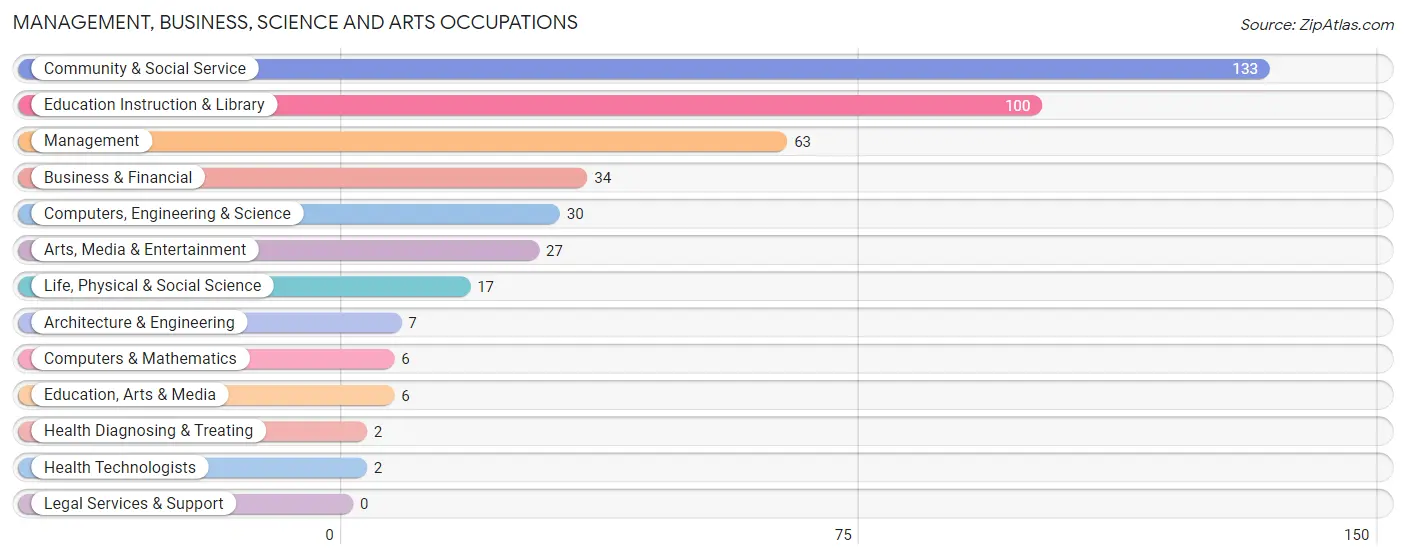
Management, Business, Science and Arts Occupations
The most common Management, Business, Science and Arts occupations in Springerville are Community & Social Service (133 | 18.3%), Education Instruction & Library (100 | 13.8%), Management (63 | 8.7%), Business & Financial (34 | 4.7%), and Computers, Engineering & Science (30 | 4.1%).
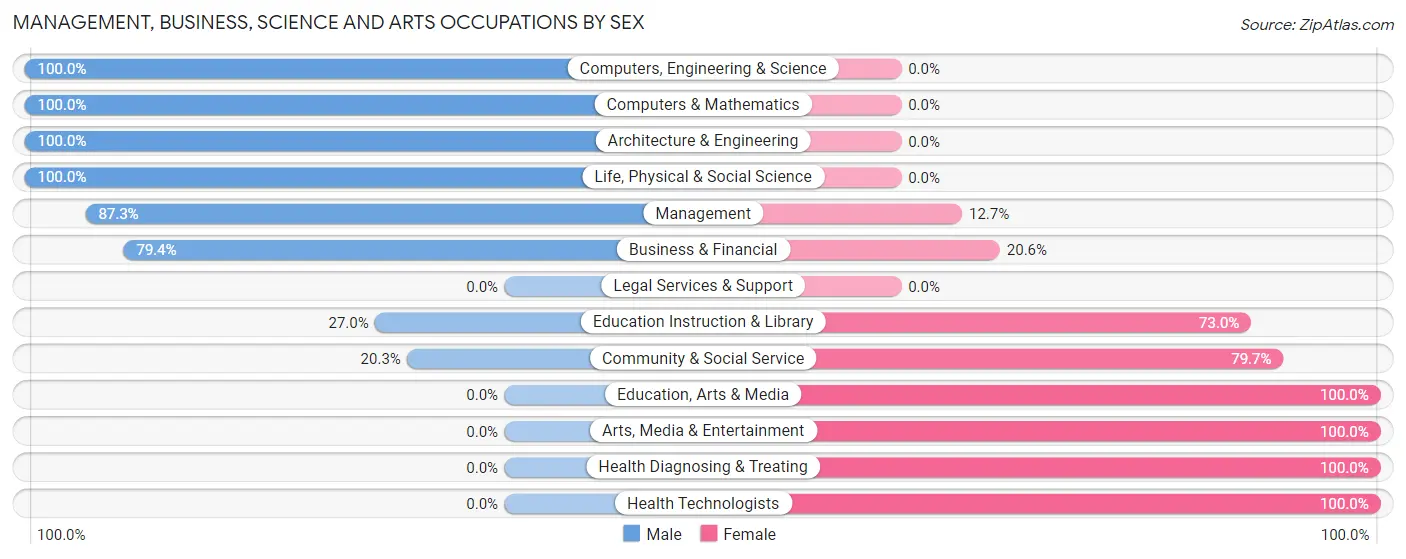
Management, Business, Science and Arts Occupations by Sex
Within the Management, Business, Science and Arts occupations in Springerville, the most male-oriented occupations are Computers, Engineering & Science (100.0%), Computers & Mathematics (100.0%), and Architecture & Engineering (100.0%), while the most female-oriented occupations are Education, Arts & Media (100.0%), Arts, Media & Entertainment (100.0%), and Health Diagnosing & Treating (100.0%).
| Occupation | Male | Female |
| Management | 55 (87.3%) | 8 (12.7%) |
| Business & Financial | 27 (79.4%) | 7 (20.6%) |
| Computers, Engineering & Science | 30 (100.0%) | 0 (0.0%) |
| Computers & Mathematics | 6 (100.0%) | 0 (0.0%) |
| Architecture & Engineering | 7 (100.0%) | 0 (0.0%) |
| Life, Physical & Social Science | 17 (100.0%) | 0 (0.0%) |
| Community & Social Service | 27 (20.3%) | 106 (79.7%) |
| Education, Arts & Media | 0 (0.0%) | 6 (100.0%) |
| Legal Services & Support | 0 (0.0%) | 0 (0.0%) |
| Education Instruction & Library | 27 (27.0%) | 73 (73.0%) |
| Arts, Media & Entertainment | 0 (0.0%) | 27 (100.0%) |
| Health Diagnosing & Treating | 0 (0.0%) | 2 (100.0%) |
| Health Technologists | 0 (0.0%) | 2 (100.0%) |
| Total (Category) | 139 (53.0%) | 123 (46.9%) |
| Total (Overall) | 347 (47.8%) | 379 (52.2%) |
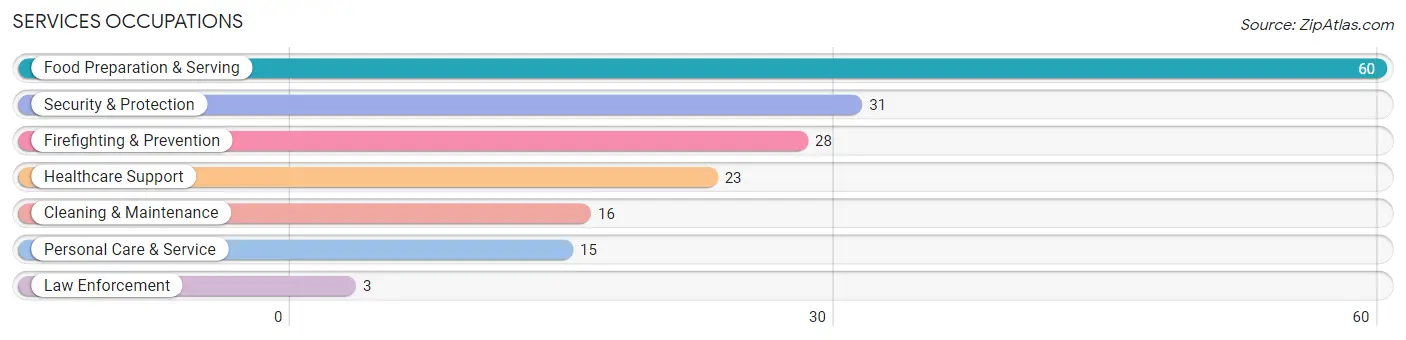
Services Occupations
The most common Services occupations in Springerville are Food Preparation & Serving (60 | 8.3%), Security & Protection (31 | 4.3%), Firefighting & Prevention (28 | 3.9%), Healthcare Support (23 | 3.2%), and Cleaning & Maintenance (16 | 2.2%).
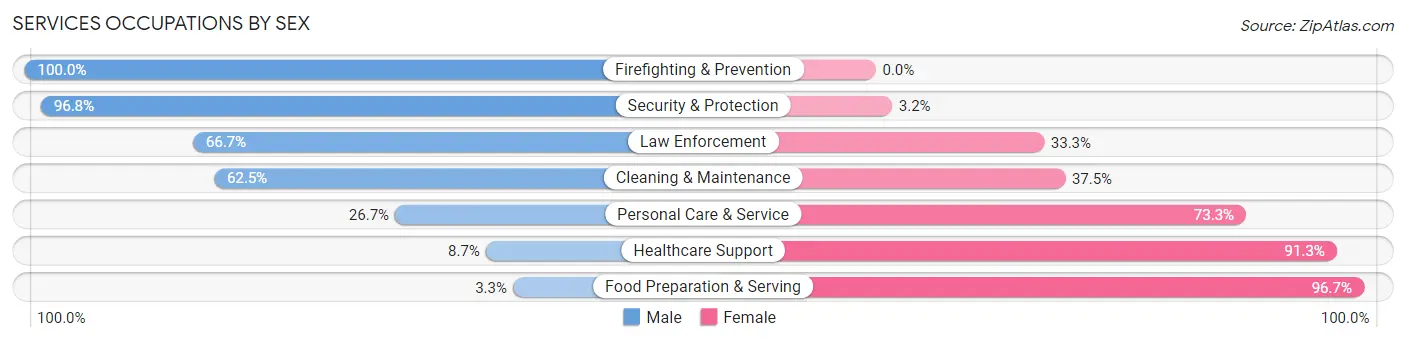
Services Occupations by Sex
Within the Services occupations in Springerville, the most male-oriented occupations are Firefighting & Prevention (100.0%), Security & Protection (96.8%), and Law Enforcement (66.7%), while the most female-oriented occupations are Food Preparation & Serving (96.7%), Healthcare Support (91.3%), and Personal Care & Service (73.3%).
| Occupation | Male | Female |
| Healthcare Support | 2 (8.7%) | 21 (91.3%) |
| Security & Protection | 30 (96.8%) | 1 (3.2%) |
| Firefighting & Prevention | 28 (100.0%) | 0 (0.0%) |
| Law Enforcement | 2 (66.7%) | 1 (33.3%) |
| Food Preparation & Serving | 2 (3.3%) | 58 (96.7%) |
| Cleaning & Maintenance | 10 (62.5%) | 6 (37.5%) |
| Personal Care & Service | 4 (26.7%) | 11 (73.3%) |
| Total (Category) | 48 (33.1%) | 97 (66.9%) |
| Total (Overall) | 347 (47.8%) | 379 (52.2%) |
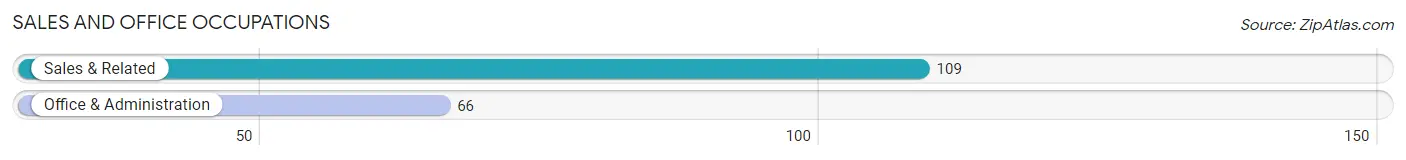
Sales and Office Occupations
The most common Sales and Office occupations in Springerville are Sales & Related (109 | 15.0%), and Office & Administration (66 | 9.1%).
Sales and Office Occupations by Sex
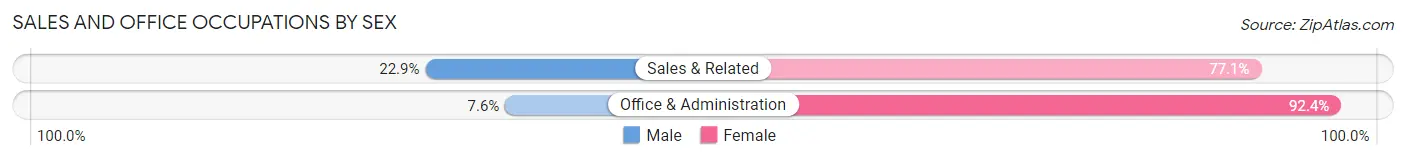
| Occupation | Male | Female |
| Sales & Related | 25 (22.9%) | 84 (77.1%) |
| Office & Administration | 5 (7.6%) | 61 (92.4%) |
| Total (Category) | 30 (17.1%) | 145 (82.9%) |
| Total (Overall) | 347 (47.8%) | 379 (52.2%) |
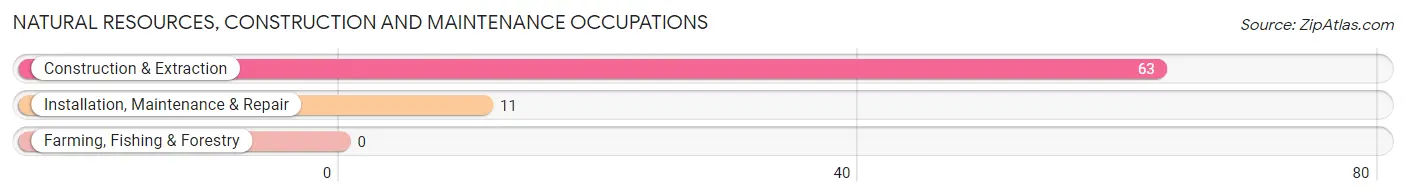
Natural Resources, Construction and Maintenance Occupations
The most common Natural Resources, Construction and Maintenance occupations in Springerville are Construction & Extraction (63 | 8.7%), and Installation, Maintenance & Repair (11 | 1.5%).
Natural Resources, Construction and Maintenance Occupations by Sex
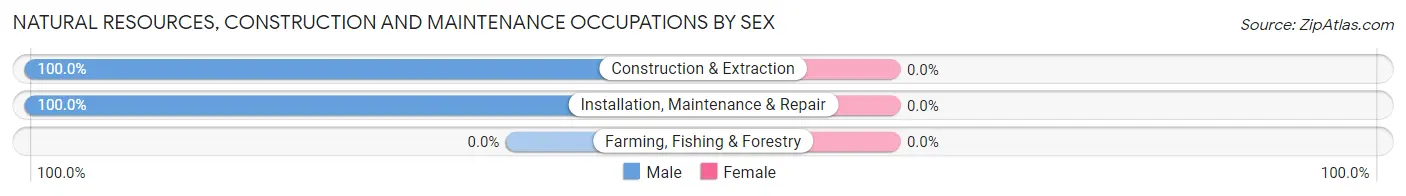
| Occupation | Male | Female |
| Farming, Fishing & Forestry | 0 (0.0%) | 0 (0.0%) |
| Construction & Extraction | 63 (100.0%) | 0 (0.0%) |
| Installation, Maintenance & Repair | 11 (100.0%) | 0 (0.0%) |
| Total (Category) | 74 (100.0%) | 0 (0.0%) |
| Total (Overall) | 347 (47.8%) | 379 (52.2%) |
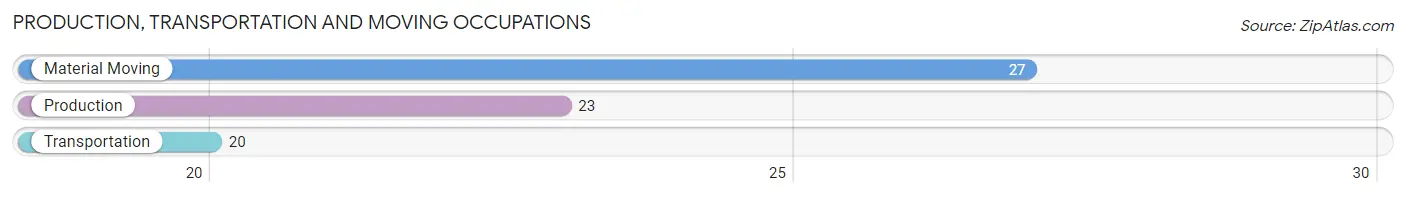
Production, Transportation and Moving Occupations
The most common Production, Transportation and Moving occupations in Springerville are Material Moving (27 | 3.7%), Production (23 | 3.2%), and Transportation (20 | 2.8%).
Production, Transportation and Moving Occupations by Sex
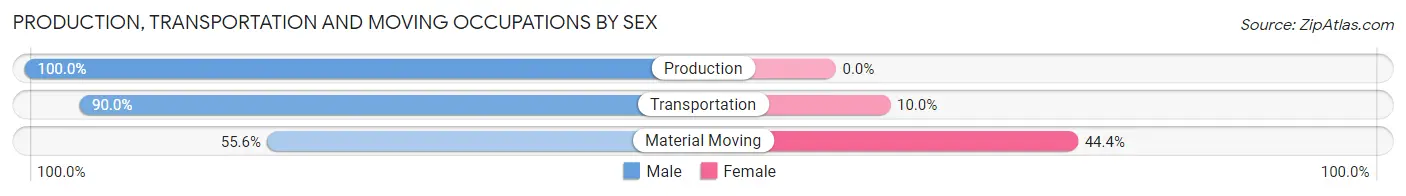
| Occupation | Male | Female |
| Production | 23 (100.0%) | 0 (0.0%) |
| Transportation | 18 (90.0%) | 2 (10.0%) |
| Material Moving | 15 (55.6%) | 12 (44.4%) |
| Total (Category) | 56 (80.0%) | 14 (20.0%) |
| Total (Overall) | 347 (47.8%) | 379 (52.2%) |
Employment Industries by Sex in Springerville
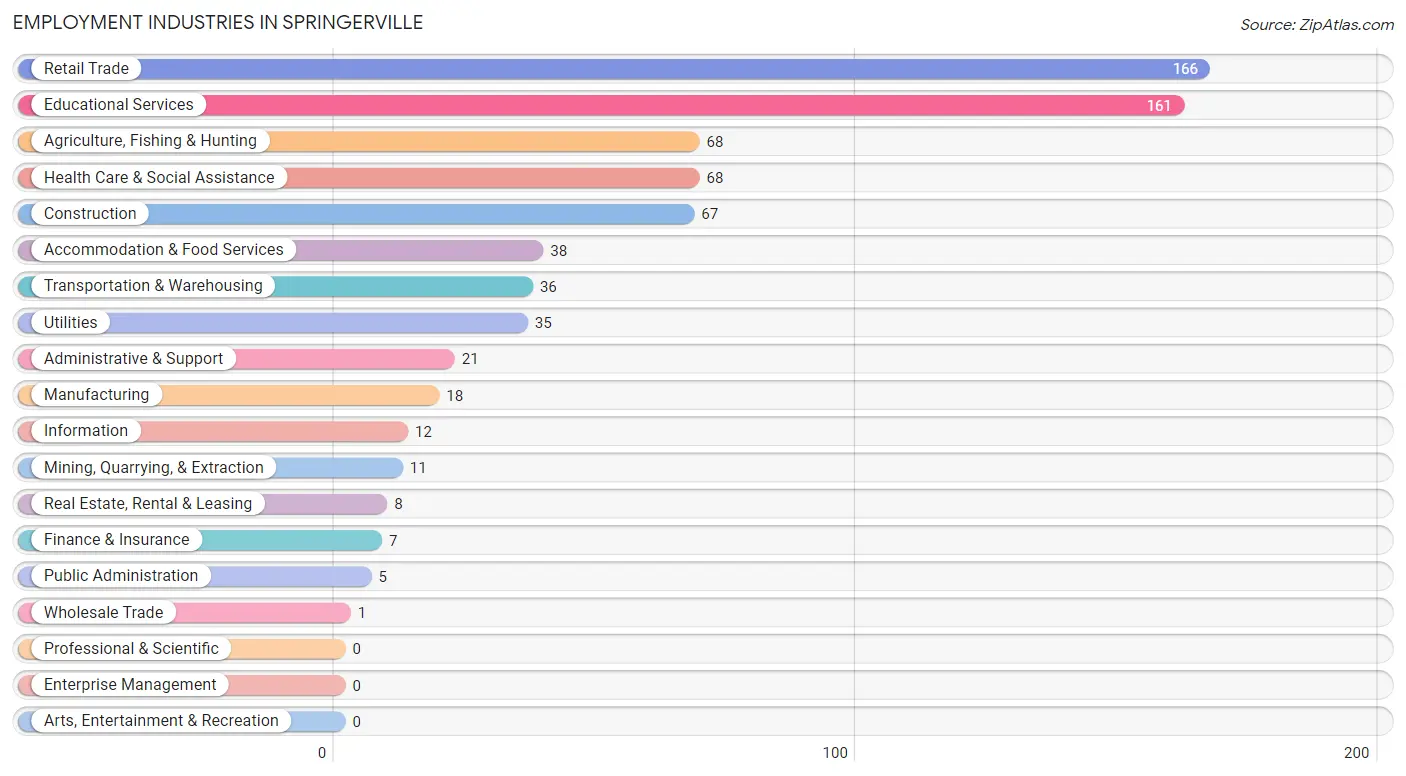
Employment Industries in Springerville
The major employment industries in Springerville include Retail Trade (166 | 22.9%), Educational Services (161 | 22.2%), Agriculture, Fishing & Hunting (68 | 9.4%), Health Care & Social Assistance (68 | 9.4%), and Construction (67 | 9.2%).
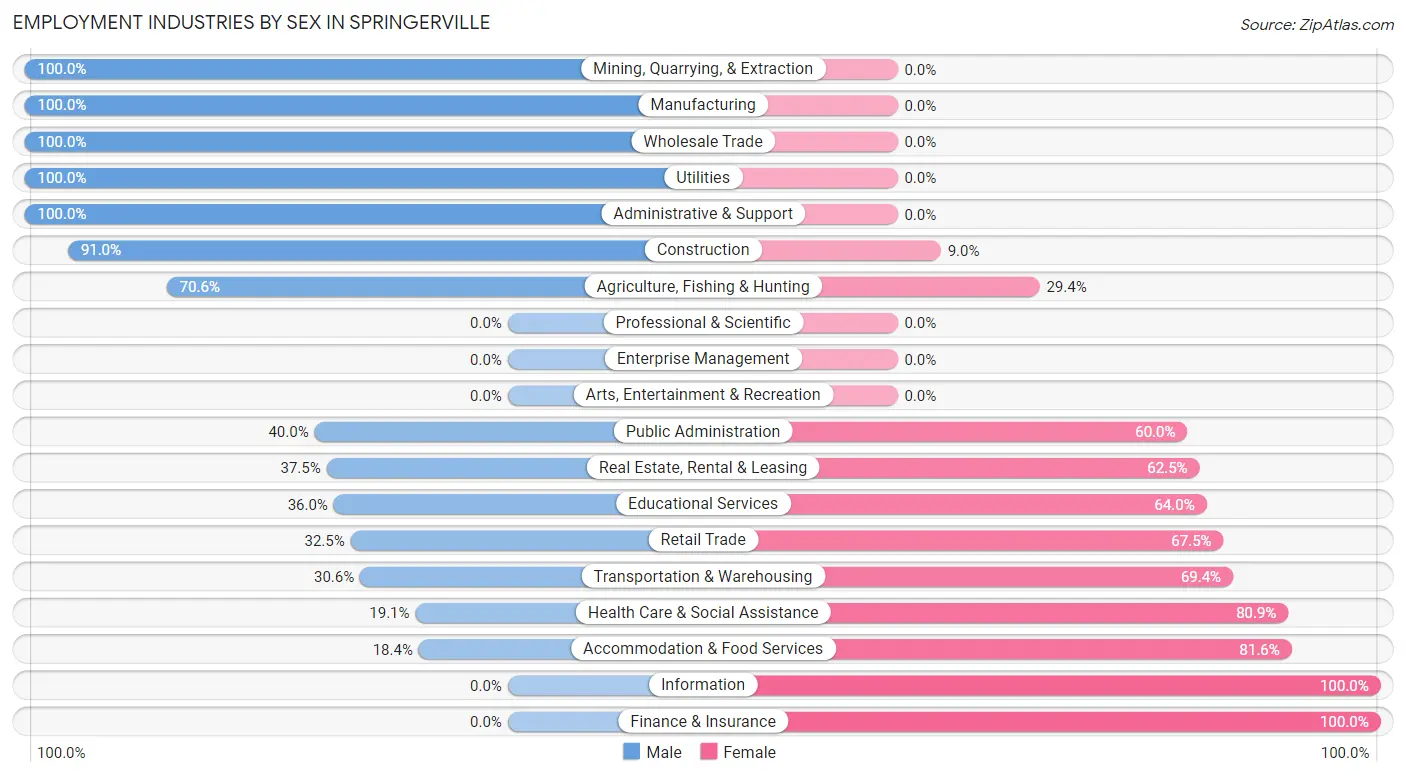
Employment Industries by Sex in Springerville
The Springerville industries that see more men than women are Mining, Quarrying, & Extraction (100.0%), Manufacturing (100.0%), and Wholesale Trade (100.0%), whereas the industries that tend to have a higher number of women are Information (100.0%), Finance & Insurance (100.0%), and Accommodation & Food Services (81.6%).
| Industry | Male | Female |
| Agriculture, Fishing & Hunting | 48 (70.6%) | 20 (29.4%) |
| Mining, Quarrying, & Extraction | 11 (100.0%) | 0 (0.0%) |
| Construction | 61 (91.0%) | 6 (9.0%) |
| Manufacturing | 18 (100.0%) | 0 (0.0%) |
| Wholesale Trade | 1 (100.0%) | 0 (0.0%) |
| Retail Trade | 54 (32.5%) | 112 (67.5%) |
| Transportation & Warehousing | 11 (30.6%) | 25 (69.4%) |
| Utilities | 35 (100.0%) | 0 (0.0%) |
| Information | 0 (0.0%) | 12 (100.0%) |
| Finance & Insurance | 0 (0.0%) | 7 (100.0%) |
| Real Estate, Rental & Leasing | 3 (37.5%) | 5 (62.5%) |
| Professional & Scientific | 0 (0.0%) | 0 (0.0%) |
| Enterprise Management | 0 (0.0%) | 0 (0.0%) |
| Administrative & Support | 21 (100.0%) | 0 (0.0%) |
| Educational Services | 58 (36.0%) | 103 (64.0%) |
| Health Care & Social Assistance | 13 (19.1%) | 55 (80.9%) |
| Arts, Entertainment & Recreation | 0 (0.0%) | 0 (0.0%) |
| Accommodation & Food Services | 7 (18.4%) | 31 (81.6%) |
| Public Administration | 2 (40.0%) | 3 (60.0%) |
| Total | 347 (47.8%) | 379 (52.2%) |
Education in Springerville
School Enrollment in Springerville
The most common levels of schooling among the 525 students in Springerville are high school (156 | 29.7%), middle school (107 | 20.4%), and elementary school (104 | 19.8%).
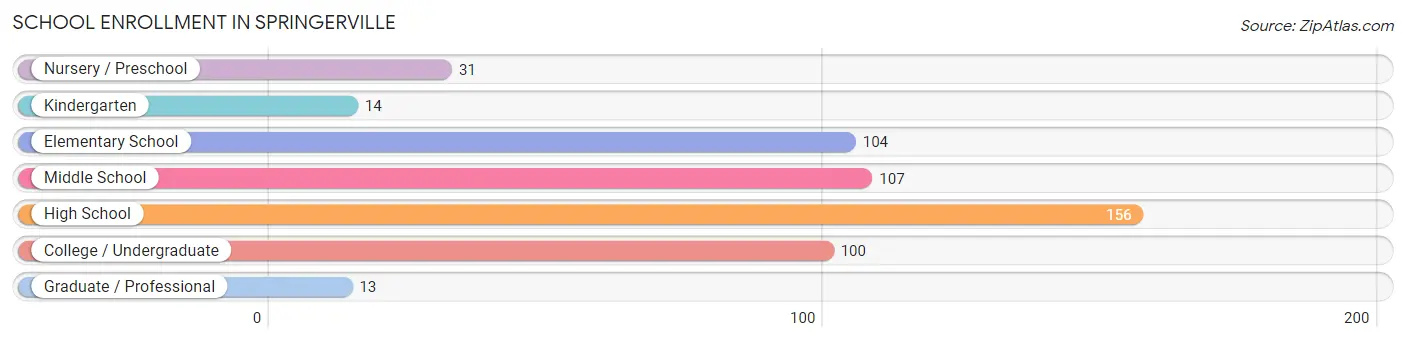
| School Level | # Students | % Students |
| Nursery / Preschool | 31 | 5.9% |
| Kindergarten | 14 | 2.7% |
| Elementary School | 104 | 19.8% |
| Middle School | 107 | 20.4% |
| High School | 156 | 29.7% |
| College / Undergraduate | 100 | 19.1% |
| Graduate / Professional | 13 | 2.5% |
| Total | 525 | 100.0% |
School Enrollment by Age by Funding Source in Springerville
Out of a total of 525 students who are enrolled in schools in Springerville, 97 (18.5%) attend a private institution, while the remaining 428 (81.5%) are enrolled in public schools. The age group of 35 years and over has the highest likelihood of being enrolled in private schools, with 63 (95.5% in the age bracket) enrolled. Conversely, the age group of 3 to 4 year olds has the lowest likelihood of being enrolled in a private school, with 19 (100.0% in the age bracket) attending a public institution.
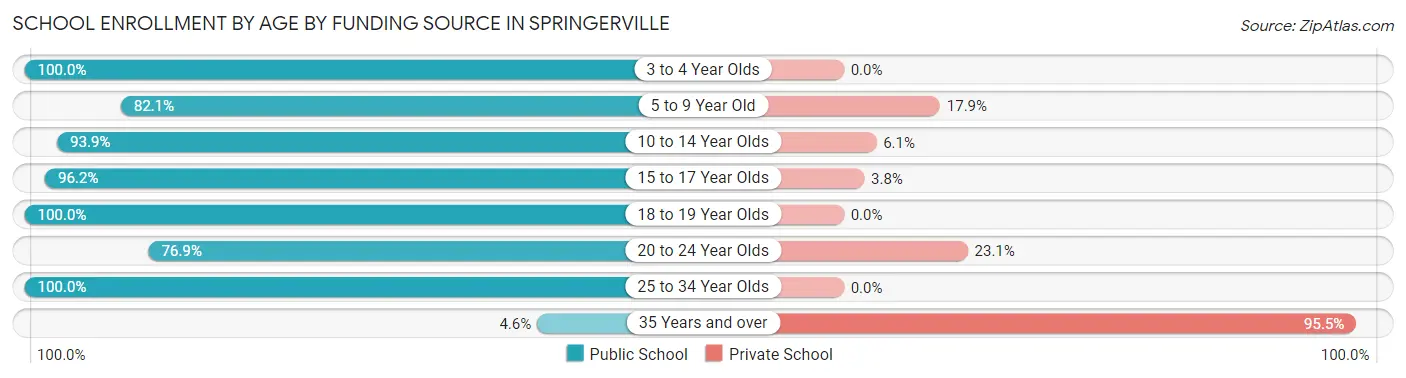
| Age Bracket | Public School | Private School |
| 3 to 4 Year Olds | 19 (100.0%) | 0 (0.0%) |
| 5 to 9 Year Old | 87 (82.1%) | 19 (17.9%) |
| 10 to 14 Year Olds | 124 (93.9%) | 8 (6.1%) |
| 15 to 17 Year Olds | 101 (96.2%) | 4 (3.8%) |
| 18 to 19 Year Olds | 65 (100.0%) | 0 (0.0%) |
| 20 to 24 Year Olds | 10 (76.9%) | 3 (23.1%) |
| 25 to 34 Year Olds | 19 (100.0%) | 0 (0.0%) |
| 35 Years and over | 3 (4.5%) | 63 (95.5%) |
| Total | 428 (81.5%) | 97 (18.5%) |
Educational Attainment by Field of Study in Springerville
Education (115 | 29.8%), arts & humanities (48 | 12.4%), science & technology (32 | 8.3%), bio, nature & agricultural (29 | 7.5%), and literature & languages (28 | 7.2%) are the most common fields of study among 386 individuals in Springerville who have obtained a bachelor's degree or higher.
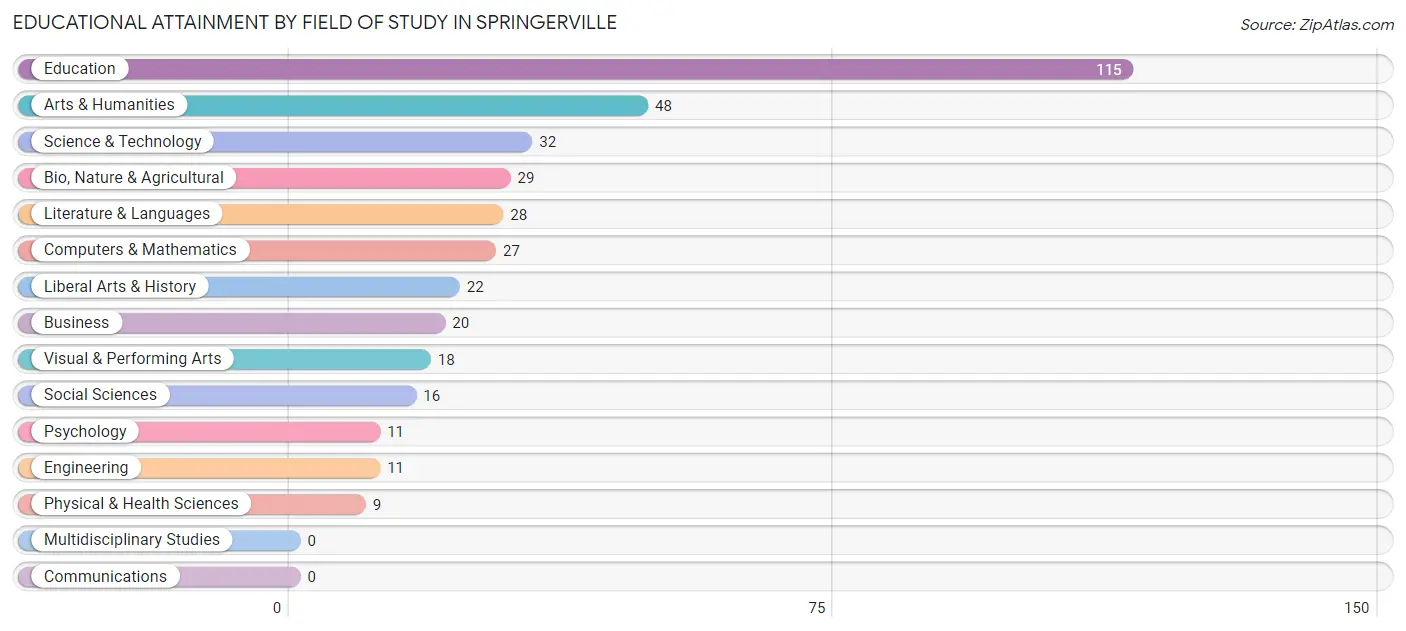
| Field of Study | # Graduates | % Graduates |
| Computers & Mathematics | 27 | 7.0% |
| Bio, Nature & Agricultural | 29 | 7.5% |
| Physical & Health Sciences | 9 | 2.3% |
| Psychology | 11 | 2.9% |
| Social Sciences | 16 | 4.2% |
| Engineering | 11 | 2.9% |
| Multidisciplinary Studies | 0 | 0.0% |
| Science & Technology | 32 | 8.3% |
| Business | 20 | 5.2% |
| Education | 115 | 29.8% |
| Literature & Languages | 28 | 7.2% |
| Liberal Arts & History | 22 | 5.7% |
| Visual & Performing Arts | 18 | 4.7% |
| Communications | 0 | 0.0% |
| Arts & Humanities | 48 | 12.4% |
| Total | 386 | 100.0% |
Transportation & Commute in Springerville
Vehicle Availability by Sex in Springerville
The most prevalent vehicle ownership categories in Springerville are males with 3 vehicles (159, accounting for 45.8%) and females with 3 vehicles (70, making up 41.9%).
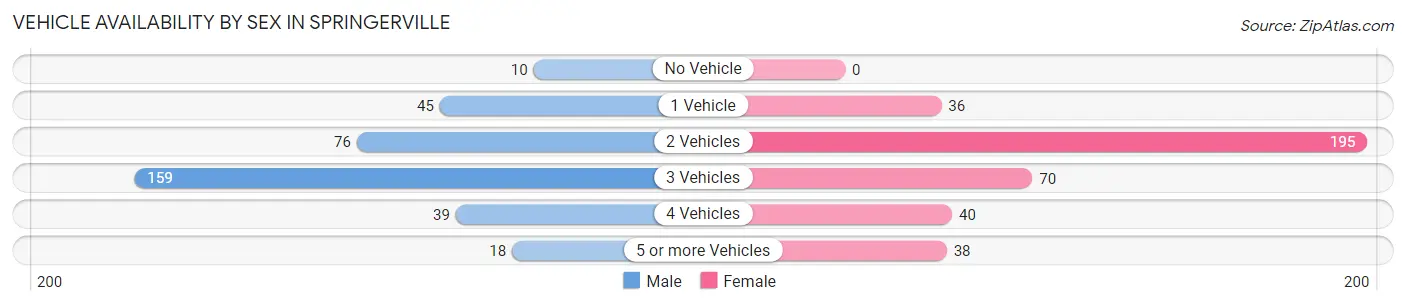
| Vehicles Available | Male | Female |
| No Vehicle | 10 (2.9%) | 0 (0.0%) |
| 1 Vehicle | 45 (13.0%) | 36 (9.5%) |
| 2 Vehicles | 76 (21.9%) | 195 (51.4%) |
| 3 Vehicles | 159 (45.8%) | 70 (18.5%) |
| 4 Vehicles | 39 (11.2%) | 40 (10.5%) |
| 5 or more Vehicles | 18 (5.2%) | 38 (10.0%) |
| Total | 347 (100.0%) | 379 (100.0%) |
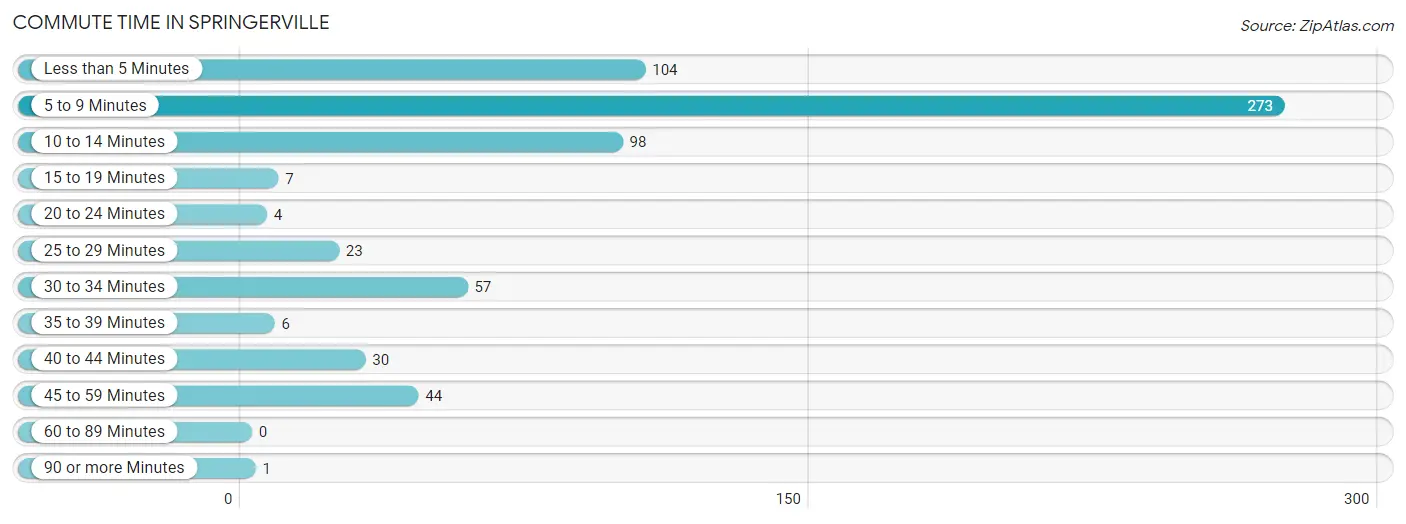
Commute Time in Springerville
The most frequently occuring commute durations in Springerville are 5 to 9 minutes (273 commuters, 42.2%), less than 5 minutes (104 commuters, 16.1%), and 10 to 14 minutes (98 commuters, 15.1%).
| Commute Time | # Commuters | % Commuters |
| Less than 5 Minutes | 104 | 16.1% |
| 5 to 9 Minutes | 273 | 42.2% |
| 10 to 14 Minutes | 98 | 15.1% |
| 15 to 19 Minutes | 7 | 1.1% |
| 20 to 24 Minutes | 4 | 0.6% |
| 25 to 29 Minutes | 23 | 3.5% |
| 30 to 34 Minutes | 57 | 8.8% |
| 35 to 39 Minutes | 6 | 0.9% |
| 40 to 44 Minutes | 30 | 4.6% |
| 45 to 59 Minutes | 44 | 6.8% |
| 60 to 89 Minutes | 0 | 0.0% |
| 90 or more Minutes | 1 | 0.2% |
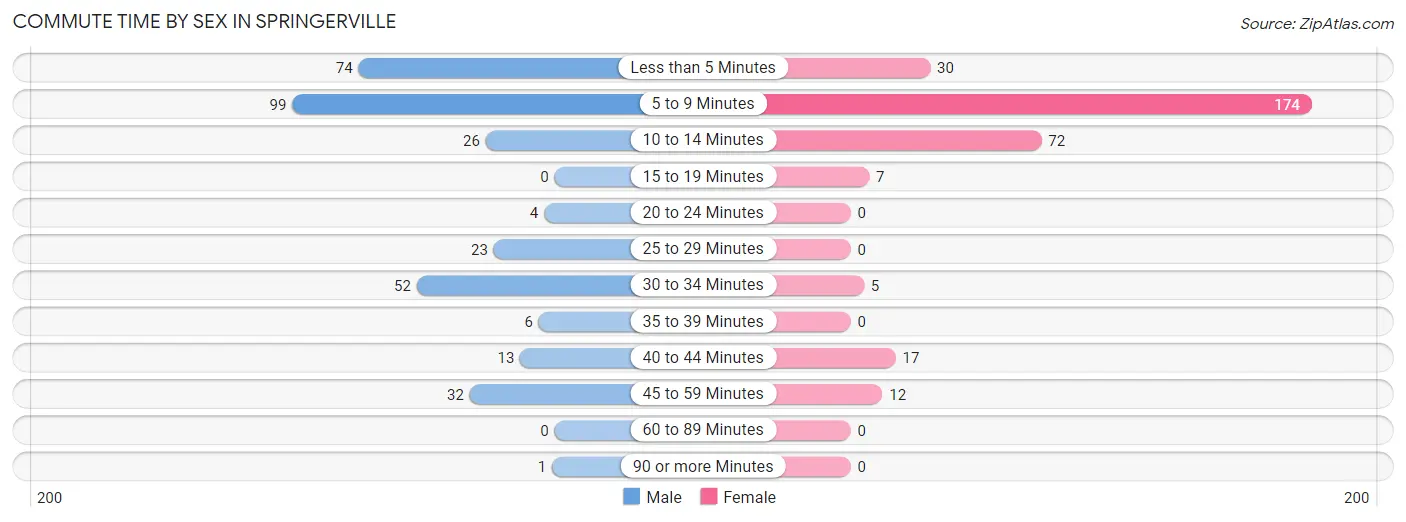
Commute Time by Sex in Springerville
The most common commute times in Springerville are 5 to 9 minutes (99 commuters, 30.0%) for males and 5 to 9 minutes (174 commuters, 54.9%) for females.
| Commute Time | Male | Female |
| Less than 5 Minutes | 74 (22.4%) | 30 (9.5%) |
| 5 to 9 Minutes | 99 (30.0%) | 174 (54.9%) |
| 10 to 14 Minutes | 26 (7.9%) | 72 (22.7%) |
| 15 to 19 Minutes | 0 (0.0%) | 7 (2.2%) |
| 20 to 24 Minutes | 4 (1.2%) | 0 (0.0%) |
| 25 to 29 Minutes | 23 (7.0%) | 0 (0.0%) |
| 30 to 34 Minutes | 52 (15.8%) | 5 (1.6%) |
| 35 to 39 Minutes | 6 (1.8%) | 0 (0.0%) |
| 40 to 44 Minutes | 13 (3.9%) | 17 (5.4%) |
| 45 to 59 Minutes | 32 (9.7%) | 12 (3.8%) |
| 60 to 89 Minutes | 0 (0.0%) | 0 (0.0%) |
| 90 or more Minutes | 1 (0.3%) | 0 (0.0%) |
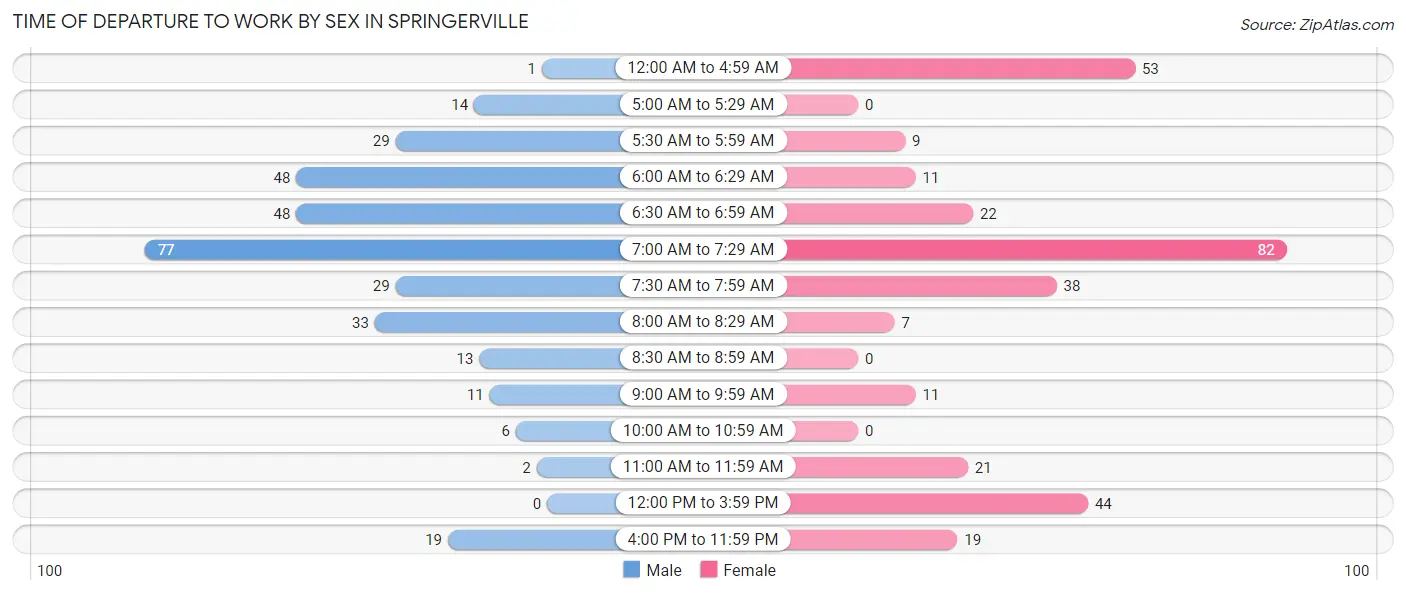
Time of Departure to Work by Sex in Springerville
The most frequent times of departure to work in Springerville are 7:00 AM to 7:29 AM (77, 23.3%) for males and 7:00 AM to 7:29 AM (82, 25.9%) for females.
| Time of Departure | Male | Female |
| 12:00 AM to 4:59 AM | 1 (0.3%) | 53 (16.7%) |
| 5:00 AM to 5:29 AM | 14 (4.2%) | 0 (0.0%) |
| 5:30 AM to 5:59 AM | 29 (8.8%) | 9 (2.8%) |
| 6:00 AM to 6:29 AM | 48 (14.5%) | 11 (3.5%) |
| 6:30 AM to 6:59 AM | 48 (14.5%) | 22 (6.9%) |
| 7:00 AM to 7:29 AM | 77 (23.3%) | 82 (25.9%) |
| 7:30 AM to 7:59 AM | 29 (8.8%) | 38 (12.0%) |
| 8:00 AM to 8:29 AM | 33 (10.0%) | 7 (2.2%) |
| 8:30 AM to 8:59 AM | 13 (3.9%) | 0 (0.0%) |
| 9:00 AM to 9:59 AM | 11 (3.3%) | 11 (3.5%) |
| 10:00 AM to 10:59 AM | 6 (1.8%) | 0 (0.0%) |
| 11:00 AM to 11:59 AM | 2 (0.6%) | 21 (6.6%) |
| 12:00 PM to 3:59 PM | 0 (0.0%) | 44 (13.9%) |
| 4:00 PM to 11:59 PM | 19 (5.8%) | 19 (6.0%) |
| Total | 330 (100.0%) | 317 (100.0%) |
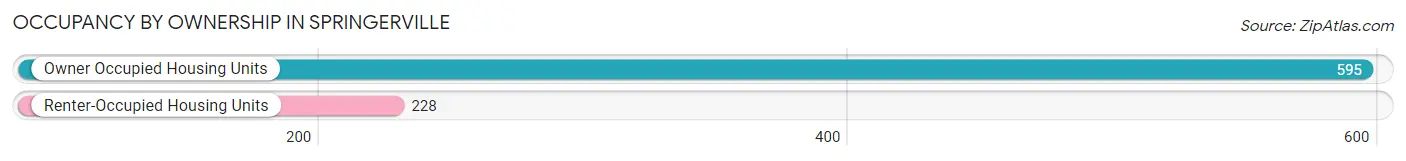
Housing Occupancy in Springerville
Occupancy by Ownership in Springerville
Of the total 823 dwellings in Springerville, owner-occupied units account for 595 (72.3%), while renter-occupied units make up 228 (27.7%).
| Occupancy | # Housing Units | % Housing Units |
| Owner Occupied Housing Units | 595 | 72.3% |
| Renter-Occupied Housing Units | 228 | 27.7% |
| Total Occupied Housing Units | 823 | 100.0% |
Occupancy by Household Size in Springerville
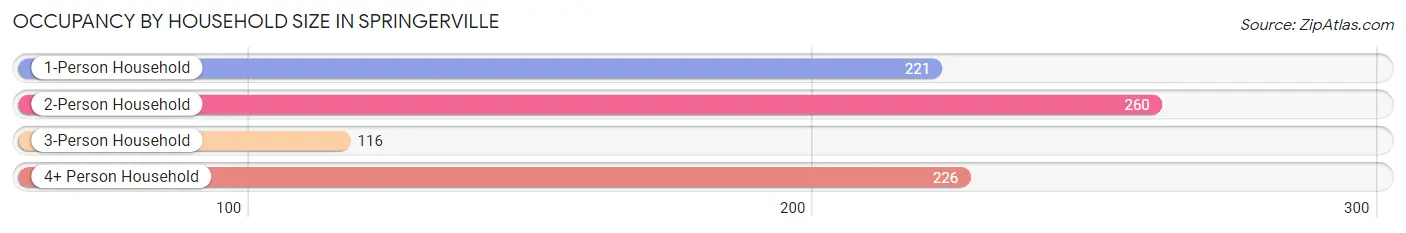
| Household Size | # Housing Units | % Housing Units |
| 1-Person Household | 221 | 26.9% |
| 2-Person Household | 260 | 31.6% |
| 3-Person Household | 116 | 14.1% |
| 4+ Person Household | 226 | 27.5% |
| Total Housing Units | 823 | 100.0% |
Occupancy by Ownership by Household Size in Springerville
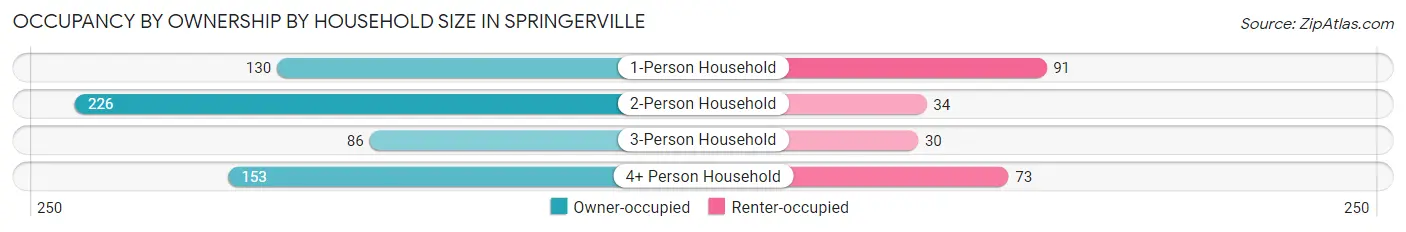
| Household Size | Owner-occupied | Renter-occupied |
| 1-Person Household | 130 (58.8%) | 91 (41.2%) |
| 2-Person Household | 226 (86.9%) | 34 (13.1%) |
| 3-Person Household | 86 (74.1%) | 30 (25.9%) |
| 4+ Person Household | 153 (67.7%) | 73 (32.3%) |
| Total Housing Units | 595 (72.3%) | 228 (27.7%) |
Occupancy by Educational Attainment in Springerville
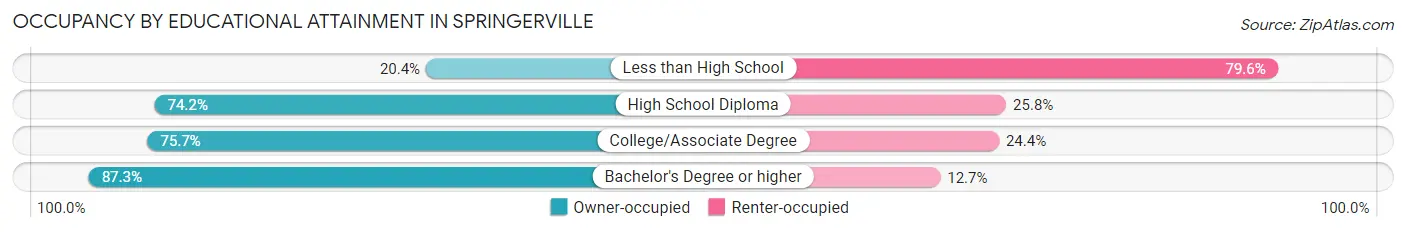
| Household Size | Owner-occupied | Renter-occupied |
| Less than High School | 19 (20.4%) | 74 (79.6%) |
| High School Diploma | 144 (74.2%) | 50 (25.8%) |
| College/Associate Degree | 233 (75.6%) | 75 (24.3%) |
| Bachelor's Degree or higher | 199 (87.3%) | 29 (12.7%) |
Occupancy by Age of Householder in Springerville
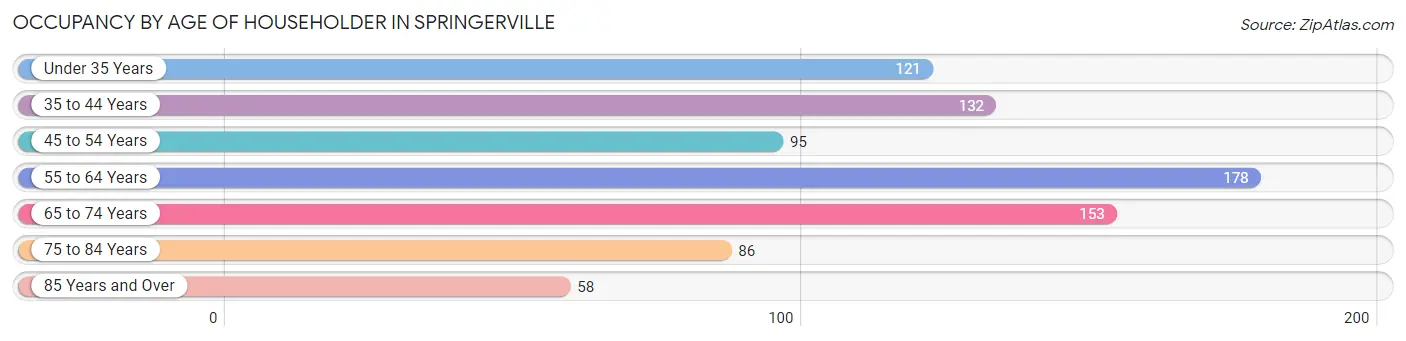
| Age Bracket | # Households | % Households |
| Under 35 Years | 121 | 14.7% |
| 35 to 44 Years | 132 | 16.0% |
| 45 to 54 Years | 95 | 11.5% |
| 55 to 64 Years | 178 | 21.6% |
| 65 to 74 Years | 153 | 18.6% |
| 75 to 84 Years | 86 | 10.4% |
| 85 Years and Over | 58 | 7.0% |
| Total | 823 | 100.0% |
Housing Finances in Springerville
Median Income by Occupancy in Springerville
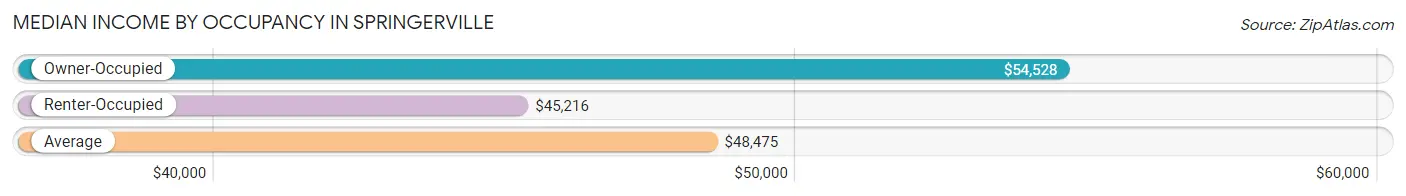
| Occupancy Type | # Households | Median Income |
| Owner-Occupied | 595 (72.3%) | $54,528 |
| Renter-Occupied | 228 (27.7%) | $45,216 |
| Average | 823 (100.0%) | $48,475 |
Occupancy by Householder Income Bracket in Springerville
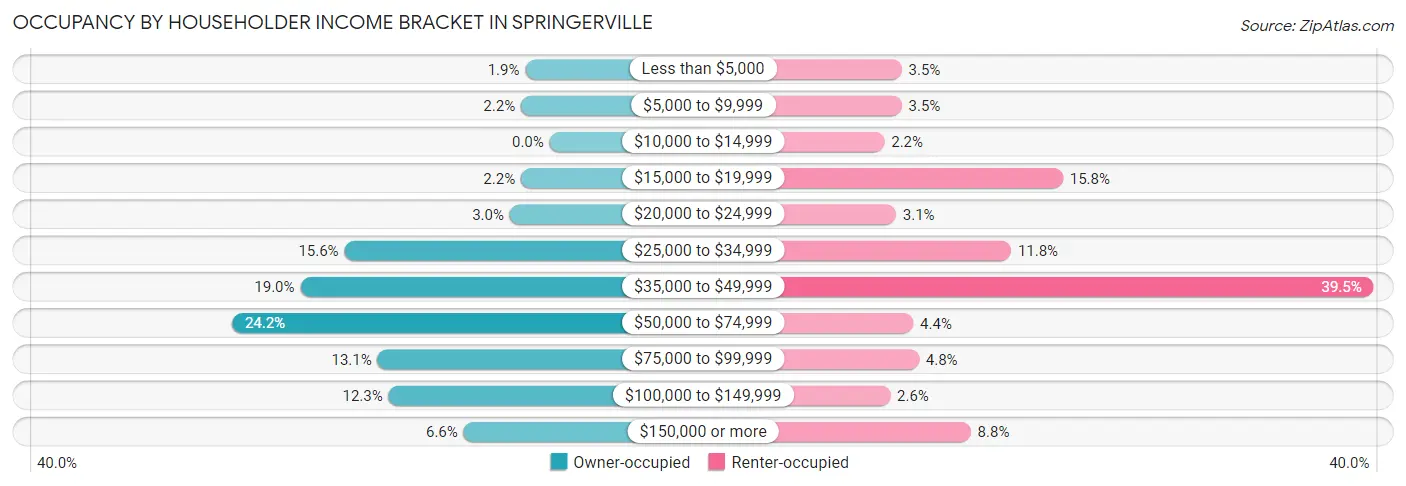
| Income Bracket | Owner-occupied | Renter-occupied |
| Less than $5,000 | 11 (1.8%) | 8 (3.5%) |
| $5,000 to $9,999 | 13 (2.2%) | 8 (3.5%) |
| $10,000 to $14,999 | 0 (0.0%) | 5 (2.2%) |
| $15,000 to $19,999 | 13 (2.2%) | 36 (15.8%) |
| $20,000 to $24,999 | 18 (3.0%) | 7 (3.1%) |
| $25,000 to $34,999 | 93 (15.6%) | 27 (11.8%) |
| $35,000 to $49,999 | 113 (19.0%) | 90 (39.5%) |
| $50,000 to $74,999 | 144 (24.2%) | 10 (4.4%) |
| $75,000 to $99,999 | 78 (13.1%) | 11 (4.8%) |
| $100,000 to $149,999 | 73 (12.3%) | 6 (2.6%) |
| $150,000 or more | 39 (6.6%) | 20 (8.8%) |
| Total | 595 (100.0%) | 228 (100.0%) |
Monthly Housing Cost Tiers in Springerville
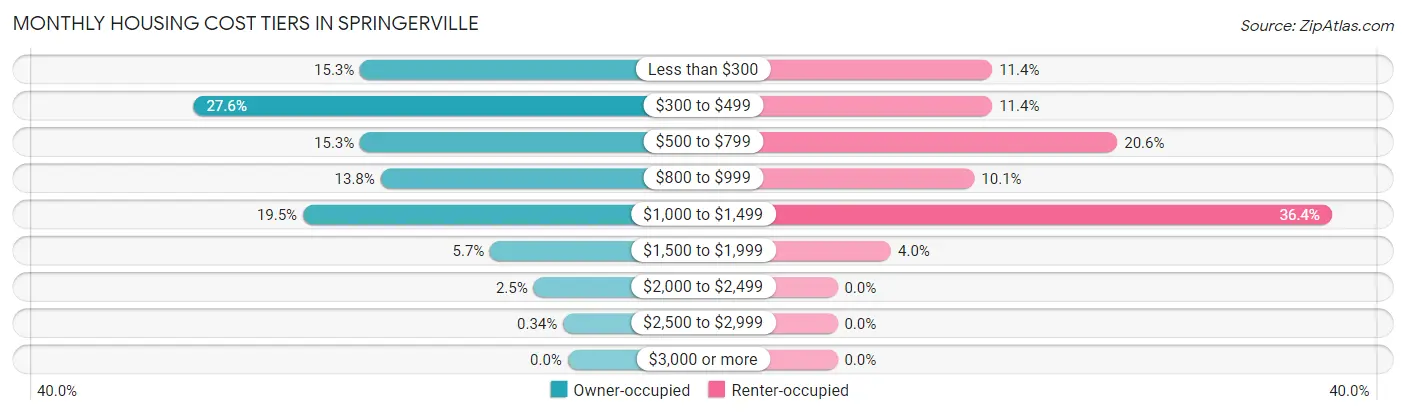
| Monthly Cost | Owner-occupied | Renter-occupied |
| Less than $300 | 91 (15.3%) | 26 (11.4%) |
| $300 to $499 | 164 (27.6%) | 26 (11.4%) |
| $500 to $799 | 91 (15.3%) | 47 (20.6%) |
| $800 to $999 | 82 (13.8%) | 23 (10.1%) |
| $1,000 to $1,499 | 116 (19.5%) | 83 (36.4%) |
| $1,500 to $1,999 | 34 (5.7%) | 9 (4.0%) |
| $2,000 to $2,499 | 15 (2.5%) | 0 (0.0%) |
| $2,500 to $2,999 | 2 (0.3%) | 0 (0.0%) |
| $3,000 or more | 0 (0.0%) | 0 (0.0%) |
| Total | 595 (100.0%) | 228 (100.0%) |
Physical Housing Characteristics in Springerville
Housing Structures in Springerville
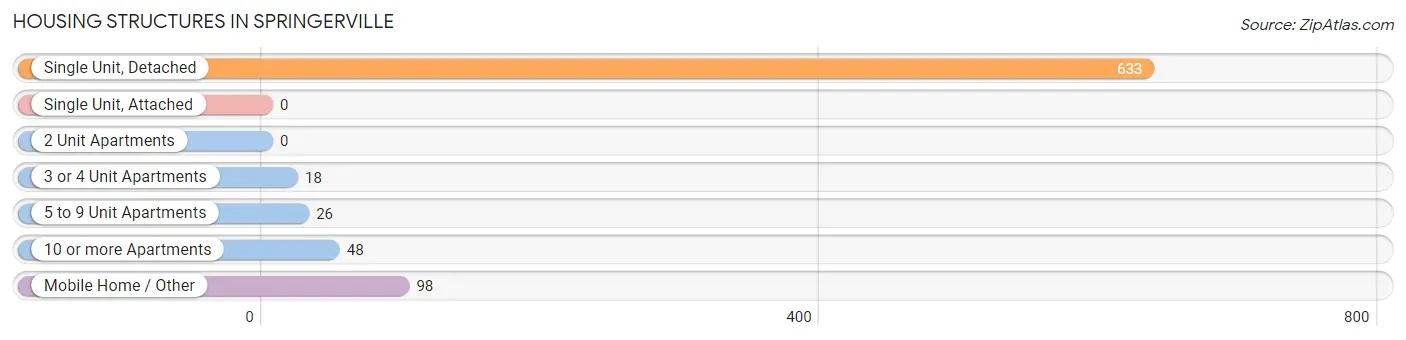
| Structure Type | # Housing Units | % Housing Units |
| Single Unit, Detached | 633 | 76.9% |
| Single Unit, Attached | 0 | 0.0% |
| 2 Unit Apartments | 0 | 0.0% |
| 3 or 4 Unit Apartments | 18 | 2.2% |
| 5 to 9 Unit Apartments | 26 | 3.2% |
| 10 or more Apartments | 48 | 5.8% |
| Mobile Home / Other | 98 | 11.9% |
| Total | 823 | 100.0% |
Housing Structures by Occupancy in Springerville
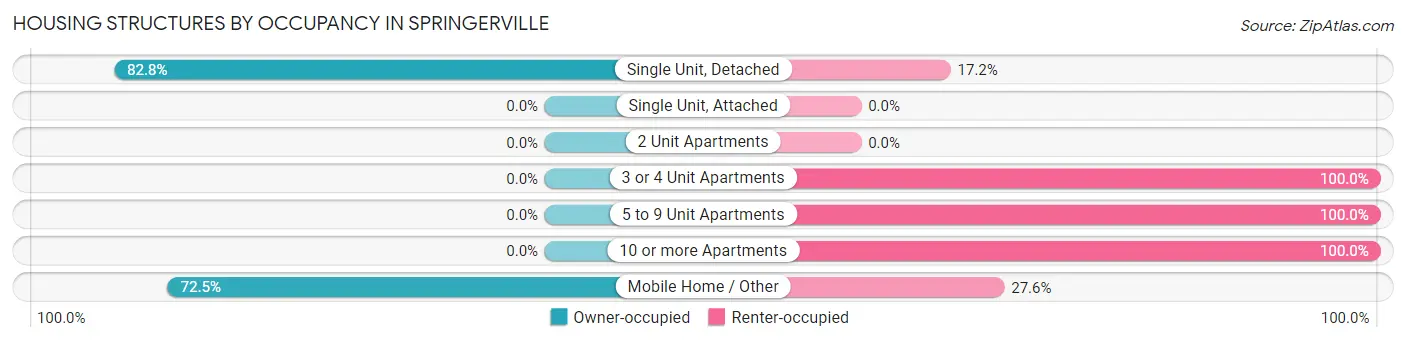
| Structure Type | Owner-occupied | Renter-occupied |
| Single Unit, Detached | 524 (82.8%) | 109 (17.2%) |
| Single Unit, Attached | 0 (0.0%) | 0 (0.0%) |
| 2 Unit Apartments | 0 (0.0%) | 0 (0.0%) |
| 3 or 4 Unit Apartments | 0 (0.0%) | 18 (100.0%) |
| 5 to 9 Unit Apartments | 0 (0.0%) | 26 (100.0%) |
| 10 or more Apartments | 0 (0.0%) | 48 (100.0%) |
| Mobile Home / Other | 71 (72.5%) | 27 (27.6%) |
| Total | 595 (72.3%) | 228 (27.7%) |
Housing Structures by Number of Rooms in Springerville
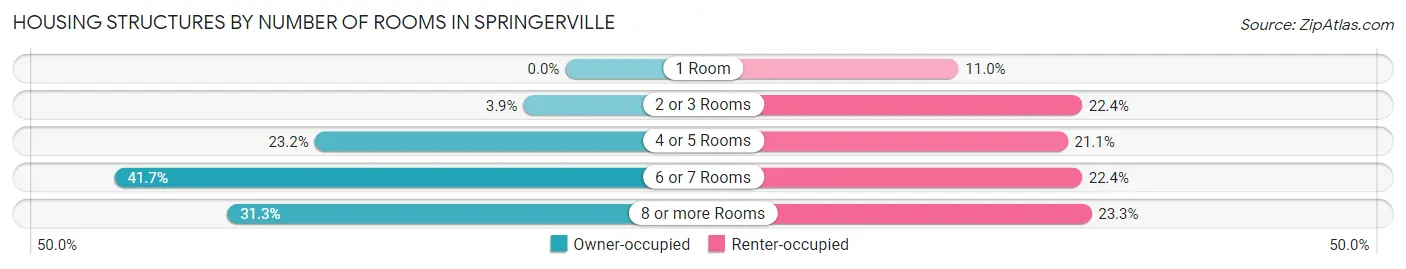
| Number of Rooms | Owner-occupied | Renter-occupied |
| 1 Room | 0 (0.0%) | 25 (11.0%) |
| 2 or 3 Rooms | 23 (3.9%) | 51 (22.4%) |
| 4 or 5 Rooms | 138 (23.2%) | 48 (21.0%) |
| 6 or 7 Rooms | 248 (41.7%) | 51 (22.4%) |
| 8 or more Rooms | 186 (31.3%) | 53 (23.3%) |
| Total | 595 (100.0%) | 228 (100.0%) |
Housing Structure by Heating Type in Springerville
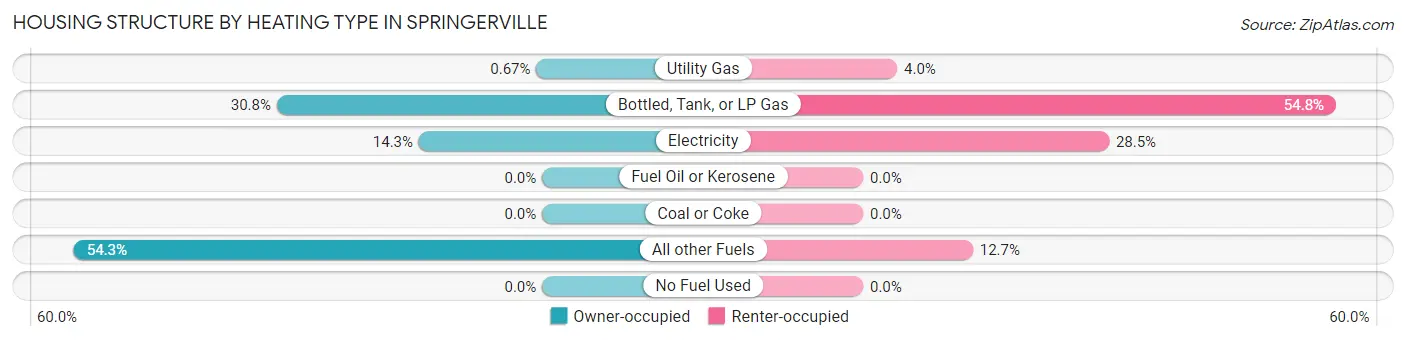
| Heating Type | Owner-occupied | Renter-occupied |
| Utility Gas | 4 (0.7%) | 9 (4.0%) |
| Bottled, Tank, or LP Gas | 183 (30.8%) | 125 (54.8%) |
| Electricity | 85 (14.3%) | 65 (28.5%) |
| Fuel Oil or Kerosene | 0 (0.0%) | 0 (0.0%) |
| Coal or Coke | 0 (0.0%) | 0 (0.0%) |
| All other Fuels | 323 (54.3%) | 29 (12.7%) |
| No Fuel Used | 0 (0.0%) | 0 (0.0%) |
| Total | 595 (100.0%) | 228 (100.0%) |
Household Vehicle Usage in Springerville
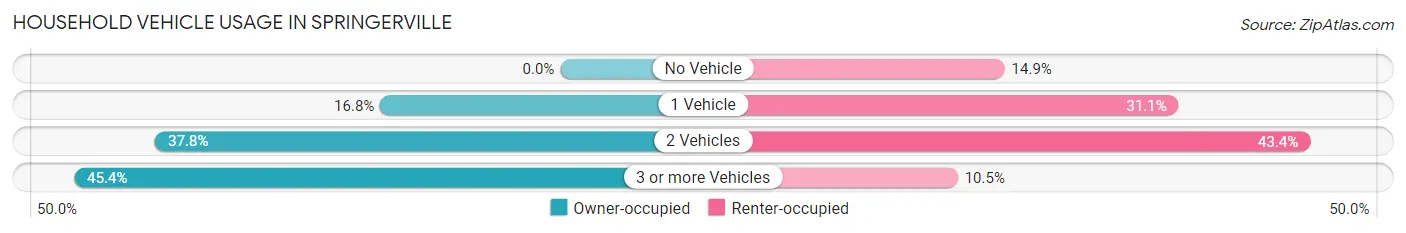
| Vehicles per Household | Owner-occupied | Renter-occupied |
| No Vehicle | 0 (0.0%) | 34 (14.9%) |
| 1 Vehicle | 100 (16.8%) | 71 (31.1%) |
| 2 Vehicles | 225 (37.8%) | 99 (43.4%) |
| 3 or more Vehicles | 270 (45.4%) | 24 (10.5%) |
| Total | 595 (100.0%) | 228 (100.0%) |
Real Estate & Mortgages in Springerville
Real Estate and Mortgage Overview in Springerville
| Characteristic | Without Mortgage | With Mortgage |
| Housing Units | 301 | 294 |
| Median Property Value | $150,400 | $167,800 |
| Median Household Income | $53,185 | $32 |
| Monthly Housing Costs | $420 | $0 |
| Real Estate Taxes | $424 | $13 |
Property Value by Mortgage Status in Springerville
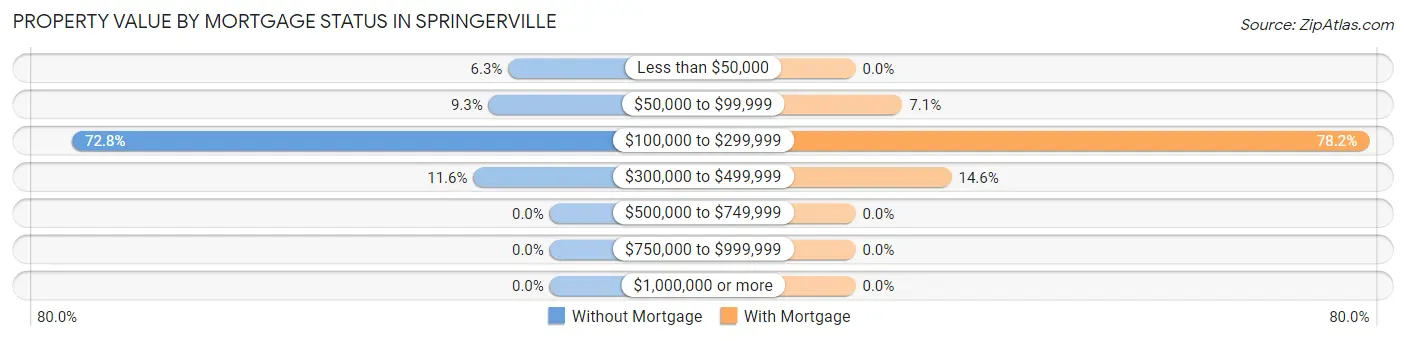
| Property Value | Without Mortgage | With Mortgage |
| Less than $50,000 | 19 (6.3%) | 0 (0.0%) |
| $50,000 to $99,999 | 28 (9.3%) | 21 (7.1%) |
| $100,000 to $299,999 | 219 (72.8%) | 230 (78.2%) |
| $300,000 to $499,999 | 35 (11.6%) | 43 (14.6%) |
| $500,000 to $749,999 | 0 (0.0%) | 0 (0.0%) |
| $750,000 to $999,999 | 0 (0.0%) | 0 (0.0%) |
| $1,000,000 or more | 0 (0.0%) | 0 (0.0%) |
| Total | 301 (100.0%) | 294 (100.0%) |
Household Income by Mortgage Status in Springerville
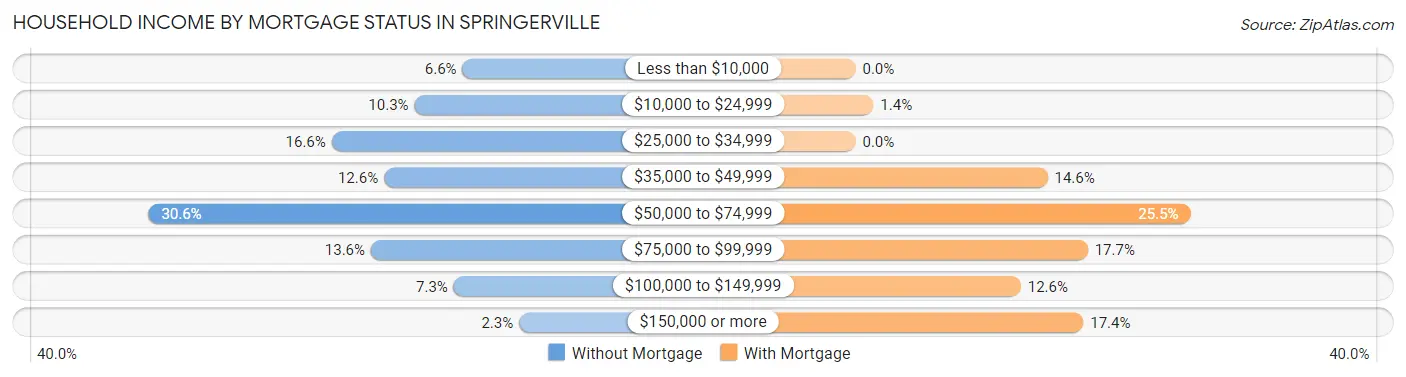
| Household Income | Without Mortgage | With Mortgage |
| Less than $10,000 | 20 (6.6%) | 0 (0.0%) |
| $10,000 to $24,999 | 31 (10.3%) | 4 (1.4%) |
| $25,000 to $34,999 | 50 (16.6%) | 0 (0.0%) |
| $35,000 to $49,999 | 38 (12.6%) | 43 (14.6%) |
| $50,000 to $74,999 | 92 (30.6%) | 75 (25.5%) |
| $75,000 to $99,999 | 41 (13.6%) | 52 (17.7%) |
| $100,000 to $149,999 | 22 (7.3%) | 37 (12.6%) |
| $150,000 or more | 7 (2.3%) | 51 (17.3%) |
| Total | 301 (100.0%) | 294 (100.0%) |
Property Value to Household Income Ratio in Springerville
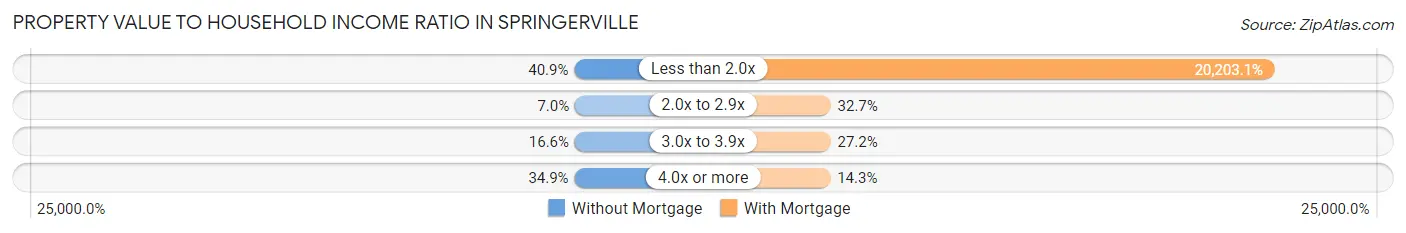
| Value-to-Income Ratio | Without Mortgage | With Mortgage |
| Less than 2.0x | 123 (40.9%) | 59,397 (20,203.1%) |
| 2.0x to 2.9x | 21 (7.0%) | 96 (32.7%) |
| 3.0x to 3.9x | 50 (16.6%) | 80 (27.2%) |
| 4.0x or more | 105 (34.9%) | 42 (14.3%) |
| Total | 301 (100.0%) | 294 (100.0%) |
Real Estate Taxes by Mortgage Status in Springerville
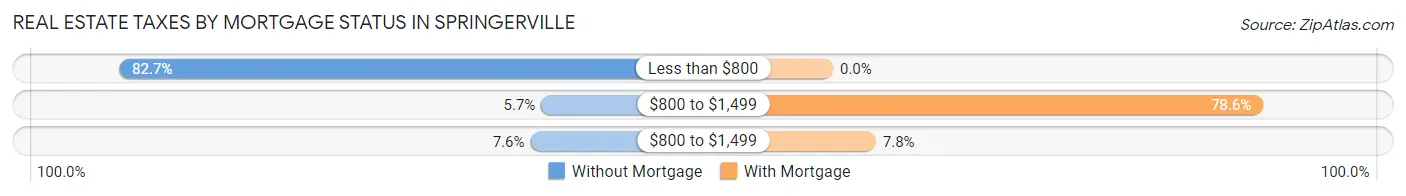
| Property Taxes | Without Mortgage | With Mortgage |
| Less than $800 | 249 (82.7%) | 0 (0.0%) |
| $800 to $1,499 | 17 (5.7%) | 231 (78.6%) |
| $800 to $1,499 | 23 (7.6%) | 23 (7.8%) |
| Total | 301 (100.0%) | 294 (100.0%) |
Health & Disability in Springerville
Health Insurance Coverage by Age in Springerville
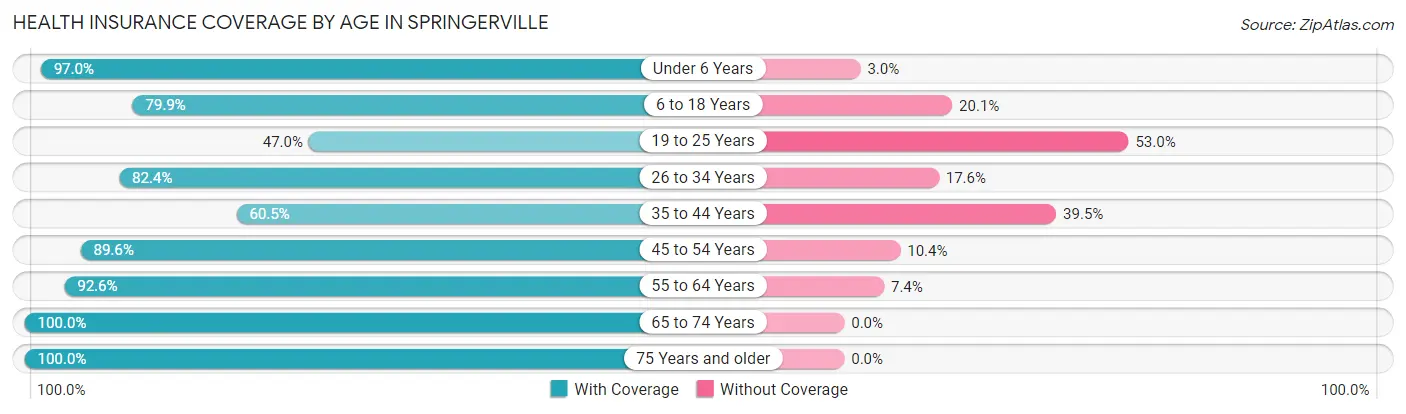
| Age Bracket | With Coverage | Without Coverage |
| Under 6 Years | 161 (97.0%) | 5 (3.0%) |
| 6 to 18 Years | 294 (79.9%) | 74 (20.1%) |
| 19 to 25 Years | 47 (47.0%) | 53 (53.0%) |
| 26 to 34 Years | 187 (82.4%) | 40 (17.6%) |
| 35 to 44 Years | 124 (60.5%) | 81 (39.5%) |
| 45 to 54 Years | 163 (89.6%) | 19 (10.4%) |
| 55 to 64 Years | 225 (92.6%) | 18 (7.4%) |
| 65 to 74 Years | 269 (100.0%) | 0 (0.0%) |
| 75 Years and older | 246 (100.0%) | 0 (0.0%) |
| Total | 1,716 (85.5%) | 290 (14.5%) |
Health Insurance Coverage by Citizenship Status in Springerville
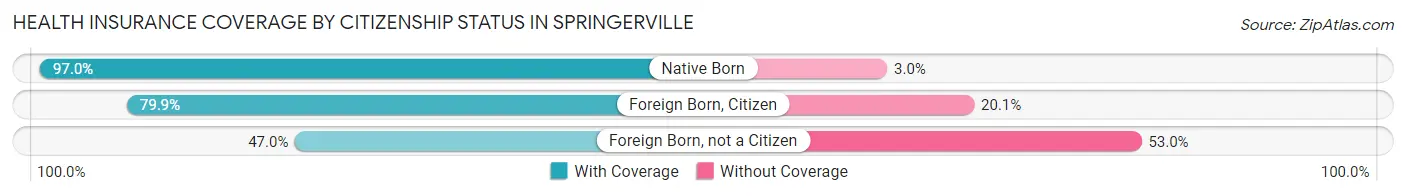
| Citizenship Status | With Coverage | Without Coverage |
| Native Born | 161 (97.0%) | 5 (3.0%) |
| Foreign Born, Citizen | 294 (79.9%) | 74 (20.1%) |
| Foreign Born, not a Citizen | 47 (47.0%) | 53 (53.0%) |
Health Insurance Coverage by Household Income in Springerville
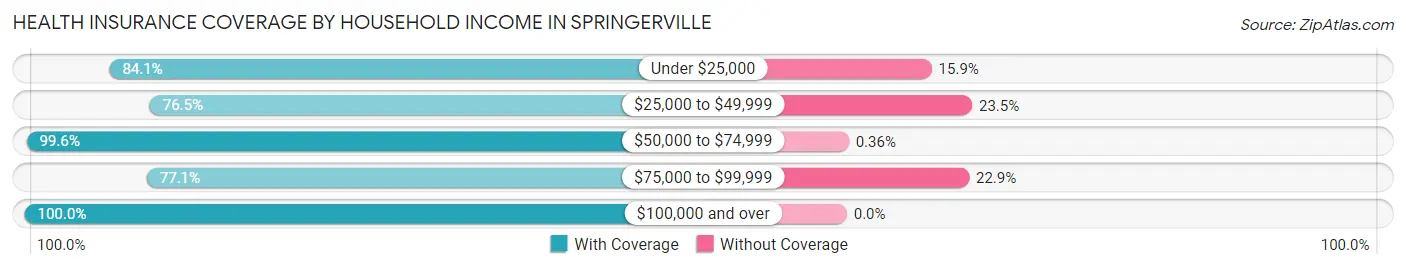
| Household Income | With Coverage | Without Coverage |
| Under $25,000 | 164 (84.1%) | 31 (15.9%) |
| $25,000 to $49,999 | 636 (76.5%) | 195 (23.5%) |
| $50,000 to $74,999 | 276 (99.6%) | 1 (0.4%) |
| $75,000 to $99,999 | 212 (77.1%) | 63 (22.9%) |
| $100,000 and over | 428 (100.0%) | 0 (0.0%) |
Public vs Private Health Insurance Coverage by Age in Springerville
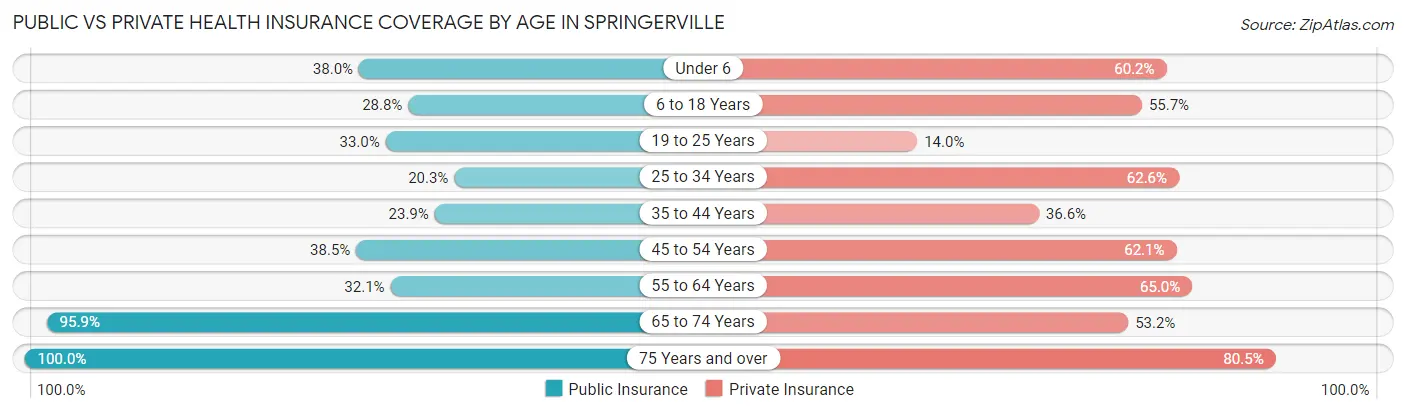
| Age Bracket | Public Insurance | Private Insurance |
| Under 6 | 63 (38.0%) | 100 (60.2%) |
| 6 to 18 Years | 106 (28.8%) | 205 (55.7%) |
| 19 to 25 Years | 33 (33.0%) | 14 (14.0%) |
| 25 to 34 Years | 46 (20.3%) | 142 (62.6%) |
| 35 to 44 Years | 49 (23.9%) | 75 (36.6%) |
| 45 to 54 Years | 70 (38.5%) | 113 (62.1%) |
| 55 to 64 Years | 78 (32.1%) | 158 (65.0%) |
| 65 to 74 Years | 258 (95.9%) | 143 (53.2%) |
| 75 Years and over | 246 (100.0%) | 198 (80.5%) |
| Total | 949 (47.3%) | 1,148 (57.2%) |
Disability Status by Sex by Age in Springerville
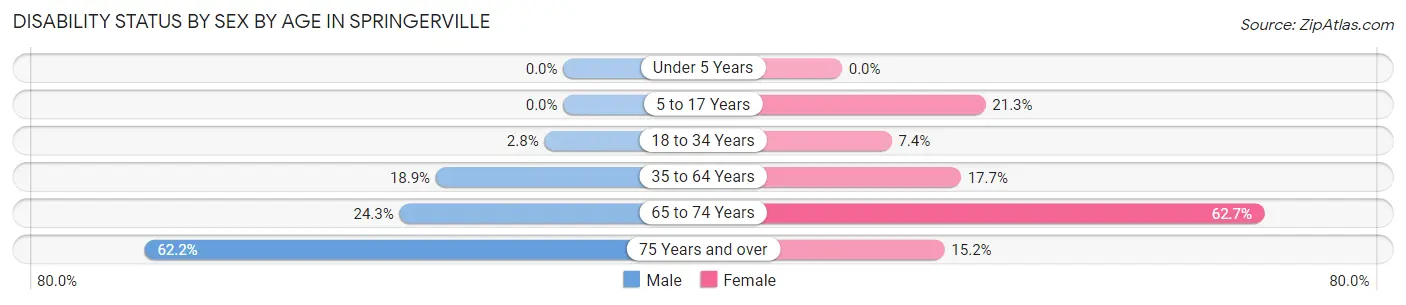
| Age Bracket | Male | Female |
| Under 5 Years | 0 (0.0%) | 0 (0.0%) |
| 5 to 17 Years | 0 (0.0%) | 29 (21.3%) |
| 18 to 34 Years | 3 (2.8%) | 20 (7.4%) |
| 35 to 64 Years | 56 (18.9%) | 59 (17.7%) |
| 65 to 74 Years | 27 (24.3%) | 99 (62.7%) |
| 75 Years and over | 51 (62.2%) | 25 (15.2%) |
Disability Class by Sex by Age in Springerville
Disability Class: Hearing Difficulty
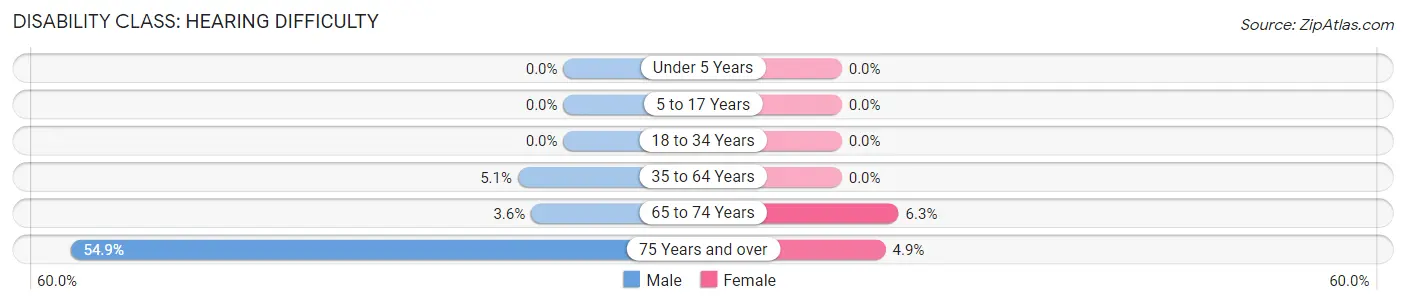
| Age Bracket | Male | Female |
| Under 5 Years | 0 (0.0%) | 0 (0.0%) |
| 5 to 17 Years | 0 (0.0%) | 0 (0.0%) |
| 18 to 34 Years | 0 (0.0%) | 0 (0.0%) |
| 35 to 64 Years | 15 (5.1%) | 0 (0.0%) |
| 65 to 74 Years | 4 (3.6%) | 10 (6.3%) |
| 75 Years and over | 45 (54.9%) | 8 (4.9%) |
Disability Class: Vision Difficulty
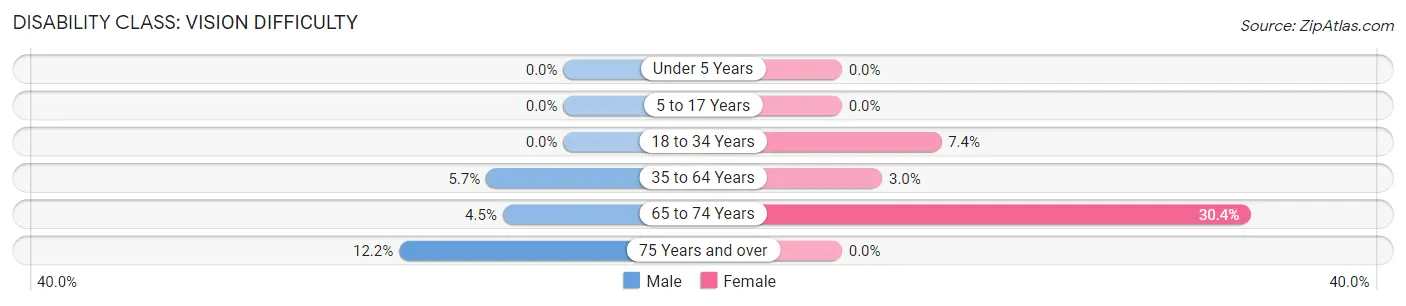
| Age Bracket | Male | Female |
| Under 5 Years | 0 (0.0%) | 0 (0.0%) |
| 5 to 17 Years | 0 (0.0%) | 0 (0.0%) |
| 18 to 34 Years | 0 (0.0%) | 20 (7.4%) |
| 35 to 64 Years | 17 (5.7%) | 10 (3.0%) |
| 65 to 74 Years | 5 (4.5%) | 48 (30.4%) |
| 75 Years and over | 10 (12.2%) | 0 (0.0%) |
Disability Class: Cognitive Difficulty
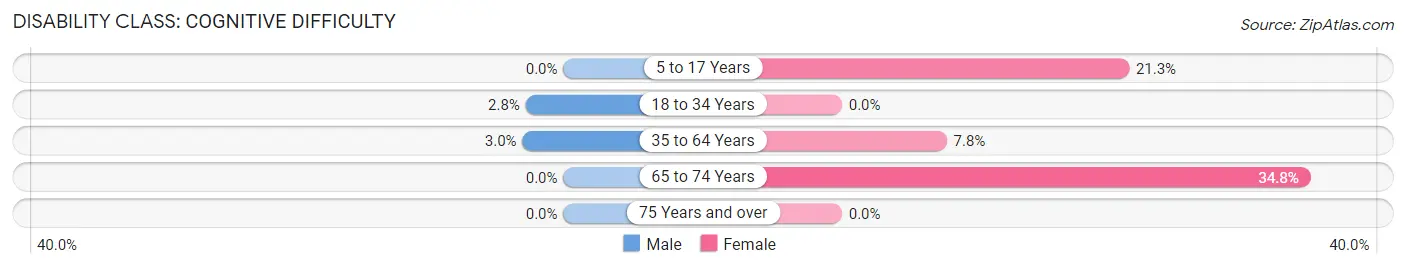
| Age Bracket | Male | Female |
| 5 to 17 Years | 0 (0.0%) | 29 (21.3%) |
| 18 to 34 Years | 3 (2.8%) | 0 (0.0%) |
| 35 to 64 Years | 9 (3.0%) | 26 (7.8%) |
| 65 to 74 Years | 0 (0.0%) | 55 (34.8%) |
| 75 Years and over | 0 (0.0%) | 0 (0.0%) |
Disability Class: Ambulatory Difficulty
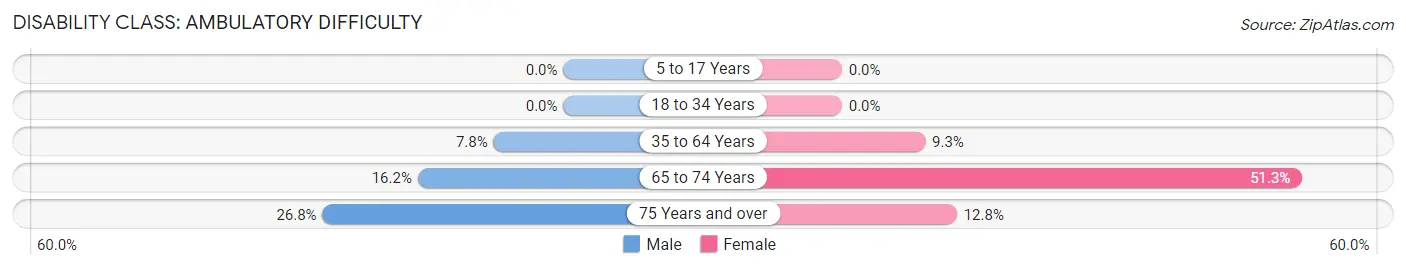
| Age Bracket | Male | Female |
| 5 to 17 Years | 0 (0.0%) | 0 (0.0%) |
| 18 to 34 Years | 0 (0.0%) | 0 (0.0%) |
| 35 to 64 Years | 23 (7.8%) | 31 (9.3%) |
| 65 to 74 Years | 18 (16.2%) | 81 (51.3%) |
| 75 Years and over | 22 (26.8%) | 21 (12.8%) |
Disability Class: Self-Care Difficulty
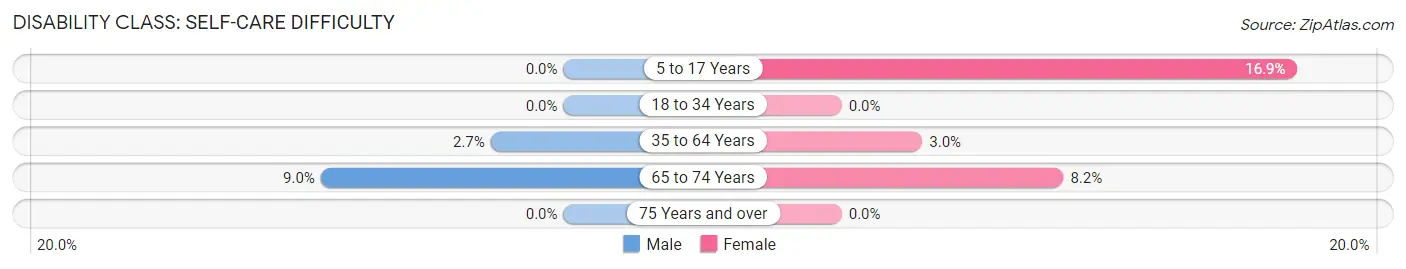
| Age Bracket | Male | Female |
| 5 to 17 Years | 0 (0.0%) | 23 (16.9%) |
| 18 to 34 Years | 0 (0.0%) | 0 (0.0%) |
| 35 to 64 Years | 8 (2.7%) | 10 (3.0%) |
| 65 to 74 Years | 10 (9.0%) | 13 (8.2%) |
| 75 Years and over | 0 (0.0%) | 0 (0.0%) |
Technology Access in Springerville
Computing Device Access in Springerville
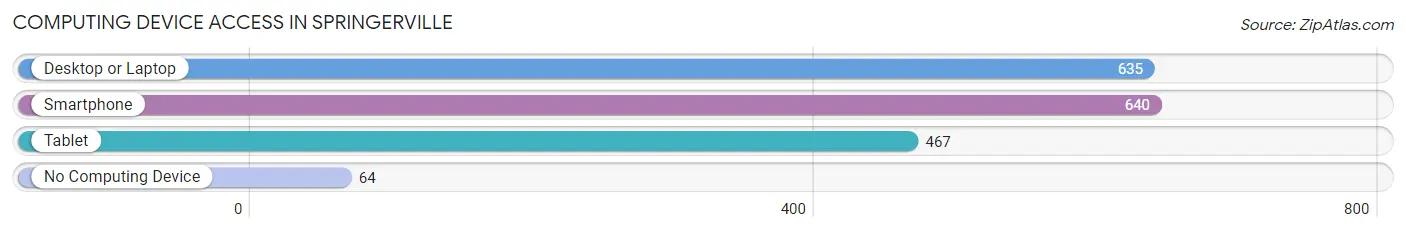
| Device Type | # Households | % Households |
| Desktop or Laptop | 635 | 77.2% |
| Smartphone | 640 | 77.8% |
| Tablet | 467 | 56.7% |
| No Computing Device | 64 | 7.8% |
| Total | 823 | 100.0% |
Internet Access in Springerville
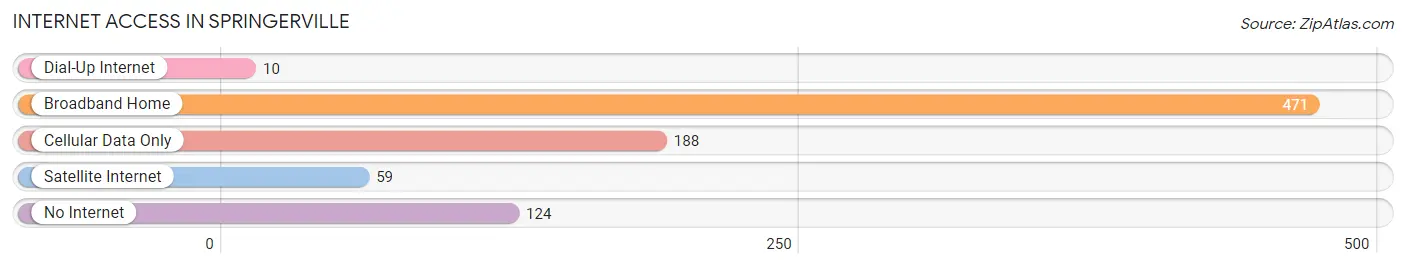
| Internet Type | # Households | % Households |
| Dial-Up Internet | 10 | 1.2% |
| Broadband Home | 471 | 57.2% |
| Cellular Data Only | 188 | 22.8% |
| Satellite Internet | 59 | 7.2% |
| No Internet | 124 | 15.1% |
| Total | 823 | 100.0% |
Springerville Summary
History
The town of Springerville, Arizona is located in the White Mountains of Apache County, and is the county seat. The town was founded in 1876 by Mormon settlers, and was originally known as “Cottonwood”. The name was changed to Springerville in 1879, when the post office was established. The town was incorporated in 1948.
The area around Springerville has a long history of human habitation. The earliest known inhabitants were the Mogollon people, who lived in the area from around 200 BC to around 1450 AD. The area was later inhabited by the Apache people, who were displaced by the arrival of the Spanish in the 16th century. The area was part of the New Mexico Territory until 1863, when it became part of the Arizona Territory.
Geography
Springerville is located in the White Mountains of Apache County, at an elevation of 6,845 feet. The town is situated on the Little Colorado River, and is surrounded by the Apache-Sitgreaves National Forest. The town is located about 100 miles east of Flagstaff, and about 200 miles northeast of Phoenix.
The climate in Springerville is semi-arid, with hot summers and cold winters. The average annual precipitation is about 13 inches, with most of it falling in the summer months. The average high temperature in July is about 85 degrees Fahrenheit, and the average low temperature in January is about 20 degrees Fahrenheit.
Economy
The economy of Springerville is largely based on tourism and agriculture. The town is a popular destination for outdoor recreation, and is home to several ski resorts. The town is also home to several farms and ranches, which produce hay, cattle, and other agricultural products.
The town is also home to several manufacturing companies, including a wood products plant and a plastics plant. The town is also home to several retail stores, restaurants, and other businesses.
Demographics
As of the 2010 census, the population of Springerville was 2,963. The racial makeup of the town was 87.3% White, 0.7% African American, 0.9% Native American, 0.3% Asian, 0.1% Pacific Islander, 8.7% from other races, and 2.0% from two or more races. Hispanic or Latino of any race were 18.2% of the population.
The median household income in Springerville was $37,917, and the median family income was $45,938. The per capita income was $19,945. About 16.2% of the population was below the poverty line.
Common Questions
What is Per Capita Income in Springerville?
Per Capita income in Springerville is $26,578.
What is the Median Family Income in Springerville?
Median Family Income in Springerville is $57,188.
What is the Median Household income in Springerville?
Median Household Income in Springerville is $48,475.
What is Income or Wage Gap in Springerville?
Income or Wage Gap in Springerville is 50.4%.
Women in Springerville earn 49.6 cents for every dollar earned by a man.
What is Family Income Deficit in Springerville?
Family Income Deficit in Springerville is $8,612.
Families that are below poverty line in Springerville earn $8,612 less on average than the poverty threshold level.
What is Inequality or Gini Index in Springerville?
Inequality or Gini Index in Springerville is 0.40.
What is the Total Population of Springerville?
Total Population of Springerville is 2,006.
What is the Total Male Population of Springerville?
Total Male Population of Springerville is 881.
What is the Total Female Population of Springerville?
Total Female Population of Springerville is 1,125.
What is the Ratio of Males per 100 Females in Springerville?
There are 78.31 Males per 100 Females in Springerville.
What is the Ratio of Females per 100 Males in Springerville?
There are 127.70 Females per 100 Males in Springerville.
What is the Median Population Age in Springerville?
Median Population Age in Springerville is 41.5 Years.
What is the Average Family Size in Springerville
Average Family Size in Springerville is 2.9 People.
What is the Average Household Size in Springerville
Average Household Size in Springerville is 2.4 People.
How Large is the Labor Force in Springerville?
There are 740 People in the Labor Forcein in Springerville.
What is the Percentage of People in the Labor Force in Springerville?
46.6% of People are in the Labor Force in Springerville.
What is the Unemployment Rate in Springerville?
Unemployment Rate in Springerville is 1.9%.