Canyon Day, AZ Map & Demographics
Canyon Day Map
Canyon Day Overview
$8,398
PER CAPITA INCOME
$29,792
AVG FAMILY INCOME
$33,284
AVG HOUSEHOLD INCOME
57.4%
WAGE / INCOME GAP [ % ]
42.6¢/ $1
WAGE / INCOME GAP [ $ ]
$17,213
FAMILY INCOME DEFICIT
0.47
INEQUALITY / GINI INDEX
1,621
TOTAL POPULATION
831
MALE POPULATION
790
FEMALE POPULATION
105.19
MALES / 100 FEMALES
95.07
FEMALES / 100 MALES
20.3
MEDIAN AGE
5.2
AVG FAMILY SIZE
5.2
AVG HOUSEHOLD SIZE
275
LABOR FORCE [ PEOPLE ]
29.8%
PERCENT IN LABOR FORCE
13.1%
UNEMPLOYMENT RATE
Income in Canyon Day
Income Overview in Canyon Day
Per Capita Income in Canyon Day is $8,398, while median incomes of families and households are $29,792 and $33,284 respectively.
| Characteristic | Number | Measure |
| Per Capita Income | 1,621 | $8,398 |
| Median Family Income | 289 | $29,792 |
| Mean Family Income | 289 | $36,978 |
| Median Household Income | 310 | $33,284 |
| Mean Household Income | 310 | $42,155 |
| Income Deficit | 289 | $17,213 |
| Wage / Income Gap (%) | 1,621 | 57.40% |
| Wage / Income Gap ($) | 1,621 | 42.60¢ per $1 |
| Gini / Inequality Index | 1,621 | 0.47 |
Earnings by Sex in Canyon Day
Average Earnings in Canyon Day are $28,409, $39,318 for men and $16,750 for women, a difference of 57.4%.
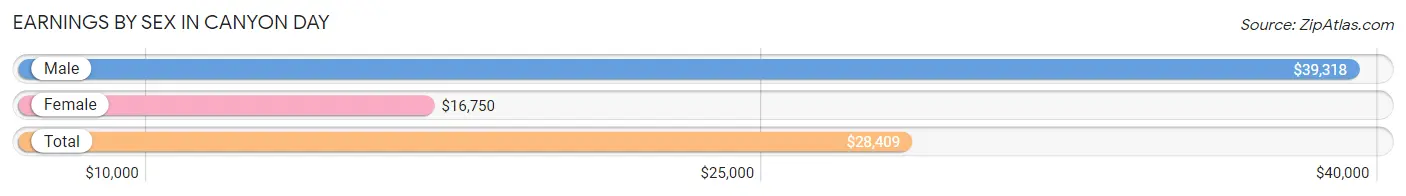
| Sex | Number | Average Earnings |
| Male | 156 (45.4%) | $39,318 |
| Female | 188 (54.6%) | $16,750 |
| Total | 344 (100.0%) | $28,409 |
Earnings by Sex by Income Bracket in Canyon Day
The most common earnings brackets in Canyon Day are $45,000 to $49,999 for men (43 | 27.6%) and $5,000 to $7,499 for women (31 | 16.5%).
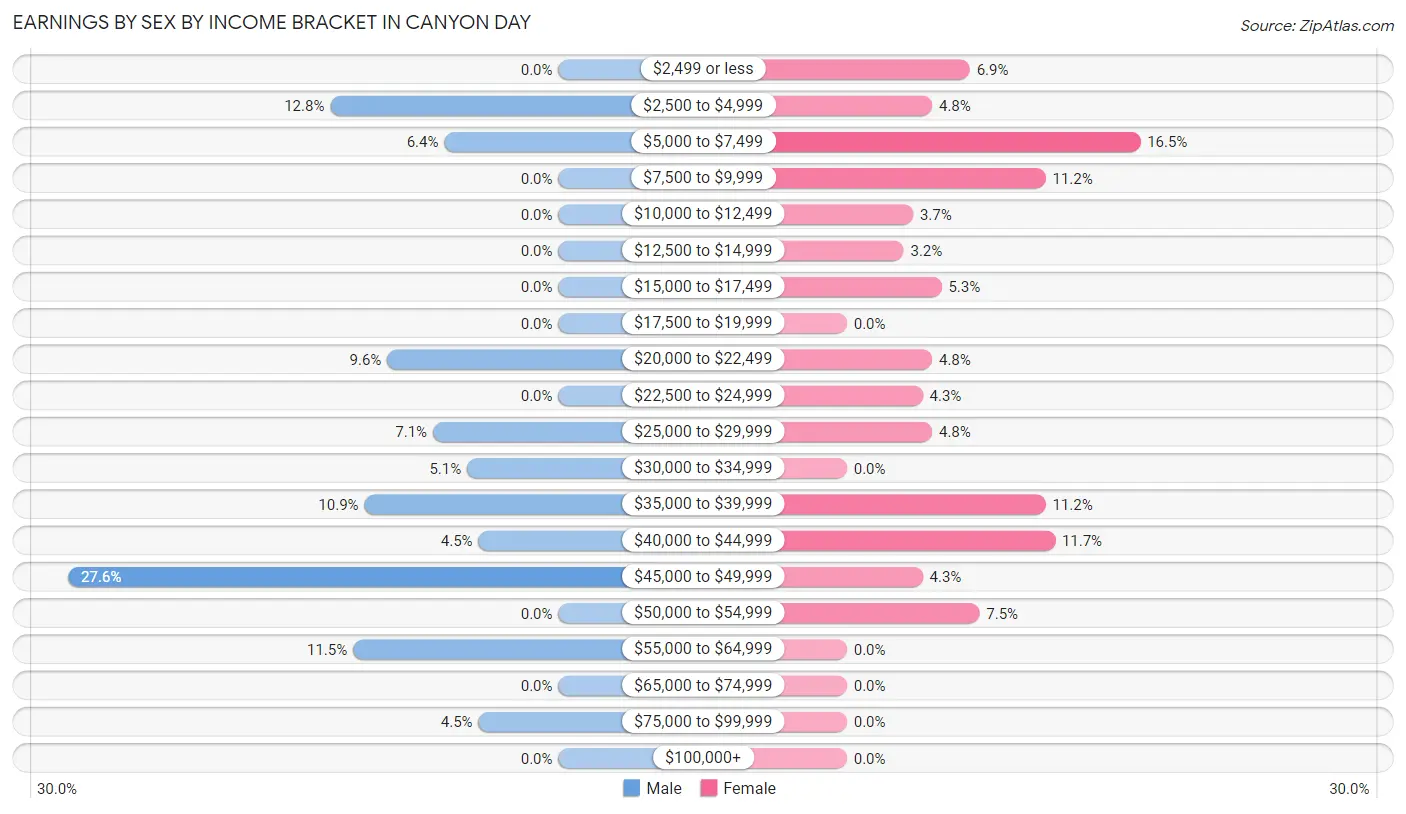
| Income | Male | Female |
| $2,499 or less | 0 (0.0%) | 13 (6.9%) |
| $2,500 to $4,999 | 20 (12.8%) | 9 (4.8%) |
| $5,000 to $7,499 | 10 (6.4%) | 31 (16.5%) |
| $7,500 to $9,999 | 0 (0.0%) | 21 (11.2%) |
| $10,000 to $12,499 | 0 (0.0%) | 7 (3.7%) |
| $12,500 to $14,999 | 0 (0.0%) | 6 (3.2%) |
| $15,000 to $17,499 | 0 (0.0%) | 10 (5.3%) |
| $17,500 to $19,999 | 0 (0.0%) | 0 (0.0%) |
| $20,000 to $22,499 | 15 (9.6%) | 9 (4.8%) |
| $22,500 to $24,999 | 0 (0.0%) | 8 (4.3%) |
| $25,000 to $29,999 | 11 (7.0%) | 9 (4.8%) |
| $30,000 to $34,999 | 8 (5.1%) | 0 (0.0%) |
| $35,000 to $39,999 | 17 (10.9%) | 21 (11.2%) |
| $40,000 to $44,999 | 7 (4.5%) | 22 (11.7%) |
| $45,000 to $49,999 | 43 (27.6%) | 8 (4.3%) |
| $50,000 to $54,999 | 0 (0.0%) | 14 (7.4%) |
| $55,000 to $64,999 | 18 (11.5%) | 0 (0.0%) |
| $65,000 to $74,999 | 0 (0.0%) | 0 (0.0%) |
| $75,000 to $99,999 | 7 (4.5%) | 0 (0.0%) |
| $100,000+ | 0 (0.0%) | 0 (0.0%) |
| Total | 156 (100.0%) | 188 (100.0%) |
Earnings by Sex by Educational Attainment in Canyon Day
Average earnings in Canyon Day are $45,500 for men and $20,833 for women, a difference of 54.2%. Men with an educational attainment of high school diploma enjoy the highest average annual earnings of $45,643, while those with high school diploma education earn the least with $45,643. Women with an educational attainment of high school diploma earn the most with the average annual earnings of $15,875, while those with high school diploma education have the smallest earnings of $15,875.
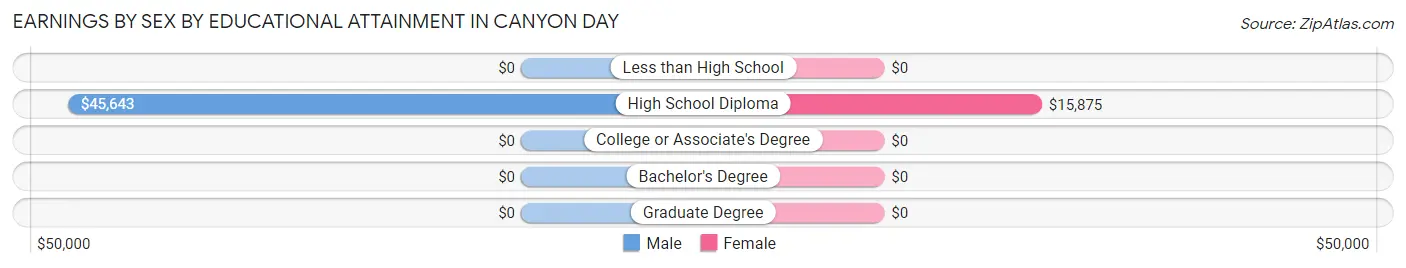
| Educational Attainment | Male Income | Female Income |
| Less than High School | - | - |
| High School Diploma | $45,643 | $15,875 |
| College or Associate's Degree | - | - |
| Bachelor's Degree | - | - |
| Graduate Degree | - | - |
| Total | $45,500 | $20,833 |
Family Income in Canyon Day
Family Income Brackets in Canyon Day
According to the Canyon Day family income data, there are 67 families falling into the less than $10,000 income range, which is the most common income bracket and makes up 23.2% of all families.
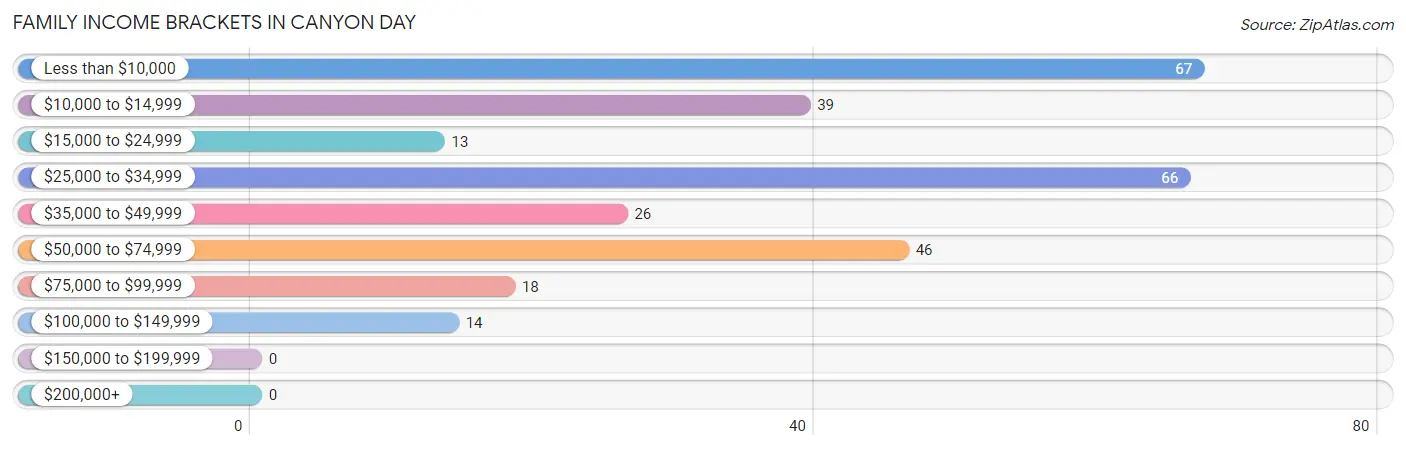
| Income Bracket | # Families | % Families |
| Less than $10,000 | 67 | 23.2% |
| $10,000 to $14,999 | 39 | 13.5% |
| $15,000 to $24,999 | 13 | 4.5% |
| $25,000 to $34,999 | 66 | 22.8% |
| $35,000 to $49,999 | 26 | 9.0% |
| $50,000 to $74,999 | 46 | 15.9% |
| $75,000 to $99,999 | 18 | 6.2% |
| $100,000 to $149,999 | 14 | 4.8% |
| $150,000 to $199,999 | 0 | 0.0% |
| $200,000+ | 0 | 0.0% |
Family Income by Famaliy Size in Canyon Day
7+ person families (86 | 29.8%) account for the highest median family income in Canyon Day with $52,500 per family, while 4-person families (38 | 13.2%) have the highest median income of $8,409 per family member.
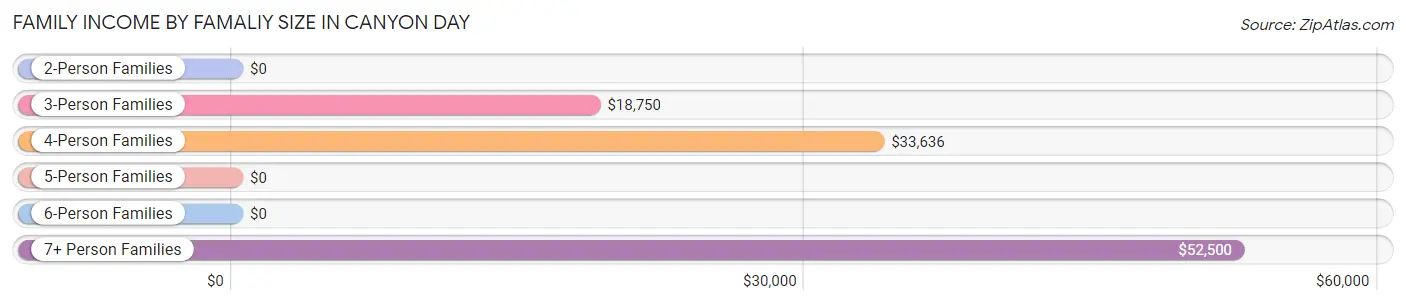
| Income Bracket | # Families | Median Income |
| 2-Person Families | 37 (12.8%) | $0 |
| 3-Person Families | 73 (25.3%) | $18,750 |
| 4-Person Families | 38 (13.2%) | $33,636 |
| 5-Person Families | 37 (12.8%) | $0 |
| 6-Person Families | 18 (6.2%) | $0 |
| 7+ Person Families | 86 (29.8%) | $52,500 |
| Total | 289 (100.0%) | $29,792 |
Family Income by Number of Earners in Canyon Day
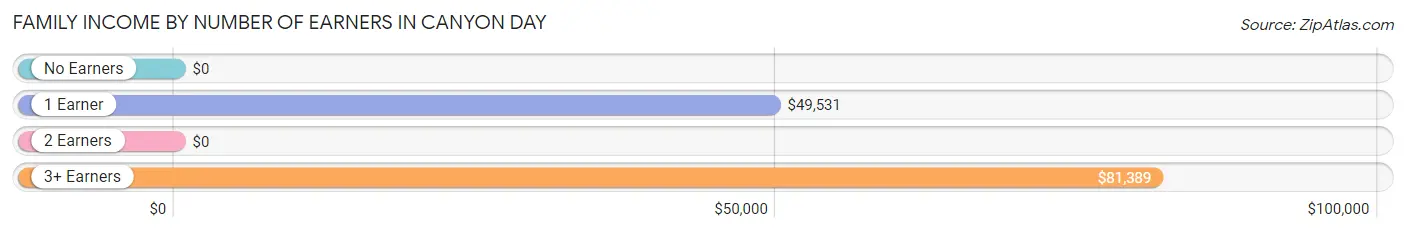
| Number of Earners | # Families | Median Income |
| No Earners | 126 (43.6%) | $0 |
| 1 Earner | 83 (28.7%) | $49,531 |
| 2 Earners | 44 (15.2%) | $0 |
| 3+ Earners | 36 (12.5%) | $81,389 |
| Total | 289 (100.0%) | $29,792 |
Household Income in Canyon Day
Household Income Brackets in Canyon Day
With 86 households falling in the category, the $25,000 to $34,999 income range is the most frequent in Canyon Day, accounting for 27.7% of all households.
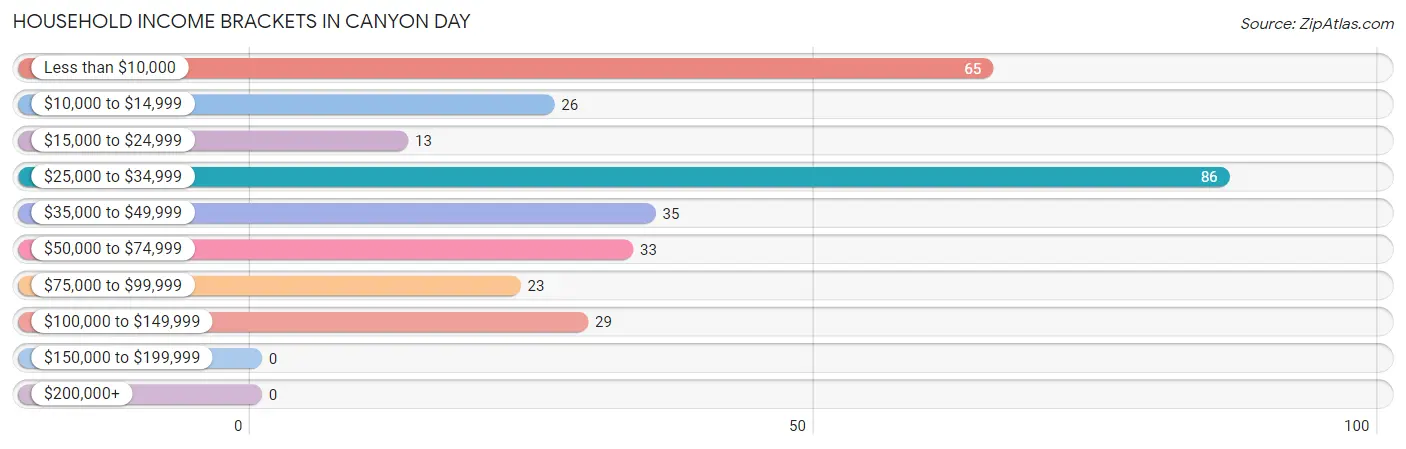
| Income Bracket | # Households | % Households |
| Less than $10,000 | 65 | 21.0% |
| $10,000 to $14,999 | 26 | 8.4% |
| $15,000 to $24,999 | 13 | 4.2% |
| $25,000 to $34,999 | 86 | 27.7% |
| $35,000 to $49,999 | 35 | 11.3% |
| $50,000 to $74,999 | 33 | 10.6% |
| $75,000 to $99,999 | 23 | 7.4% |
| $100,000 to $149,999 | 29 | 9.4% |
| $150,000 to $199,999 | 0 | 0.0% |
| $200,000+ | 0 | 0.0% |
Household Income by Householder Age in Canyon Day
The median household income in Canyon Day is $33,284, with the highest median household income of $33,147 found in the 65+ years age bracket for the primary householder. A total of 87 households (28.1%) fall into this category. Meanwhile, the 15 to 24 years age bracket for the primary householder has the lowest median household income of $0, with 9 households (2.9%) in this group.
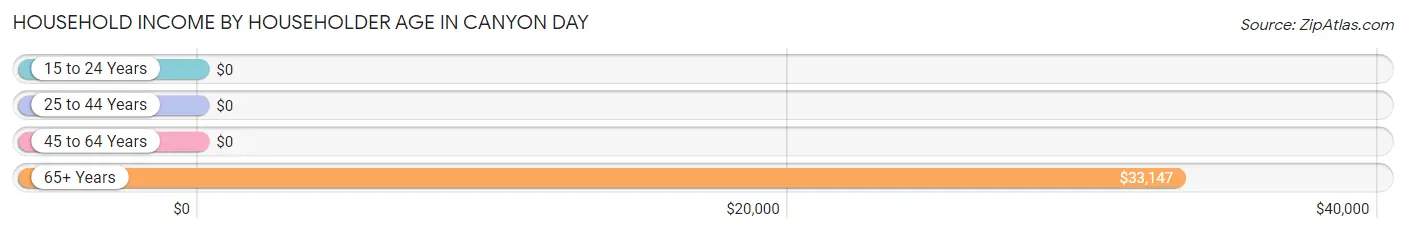
| Income Bracket | # Households | Median Income |
| 15 to 24 Years | 9 (2.9%) | $0 |
| 25 to 44 Years | 97 (31.3%) | $0 |
| 45 to 64 Years | 117 (37.7%) | $0 |
| 65+ Years | 87 (28.1%) | $33,147 |
| Total | 310 (100.0%) | $33,284 |
Poverty in Canyon Day
Income Below Poverty by Sex and Age in Canyon Day
With 50.7% poverty level for males and 54.7% for females among the residents of Canyon Day, 5 year old males and 75 year old and over females are the most vulnerable to poverty, with 29 males (100.0%) and 17 females (100.0%) in their respective age groups living below the poverty level.
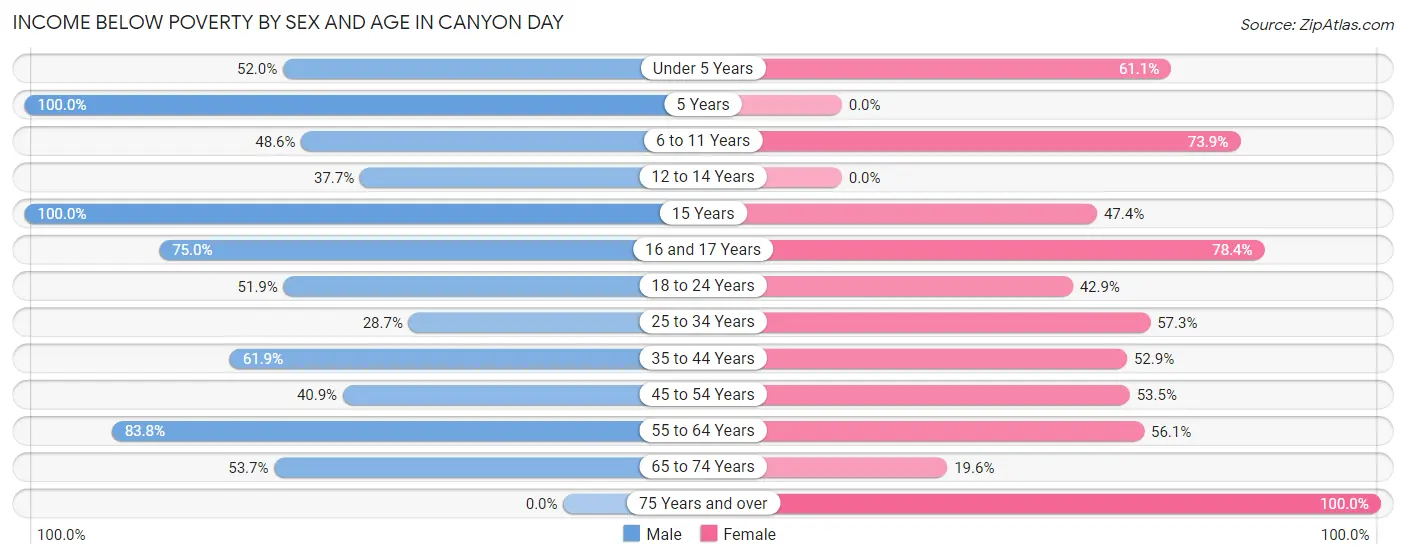
| Age Bracket | Male | Female |
| Under 5 Years | 64 (52.0%) | 77 (61.1%) |
| 5 Years | 29 (100.0%) | 0 (0.0%) |
| 6 to 11 Years | 89 (48.6%) | 68 (73.9%) |
| 12 to 14 Years | 20 (37.7%) | 0 (0.0%) |
| 15 Years | 20 (100.0%) | 9 (47.4%) |
| 16 and 17 Years | 21 (75.0%) | 40 (78.4%) |
| 18 to 24 Years | 27 (51.9%) | 24 (42.9%) |
| 25 to 34 Years | 33 (28.7%) | 75 (57.3%) |
| 35 to 44 Years | 26 (61.9%) | 36 (52.9%) |
| 45 to 54 Years | 9 (40.9%) | 31 (53.4%) |
| 55 to 64 Years | 57 (83.8%) | 46 (56.1%) |
| 65 to 74 Years | 22 (53.7%) | 9 (19.6%) |
| 75 Years and over | 0 (0.0%) | 17 (100.0%) |
| Total | 417 (50.7%) | 432 (54.7%) |
Income Above Poverty by Sex and Age in Canyon Day
According to the poverty statistics in Canyon Day, males aged 75 years and over and females aged 12 to 14 years are the age groups that are most secure financially, with 100.0% of males and 100.0% of females in these age groups living above the poverty line.
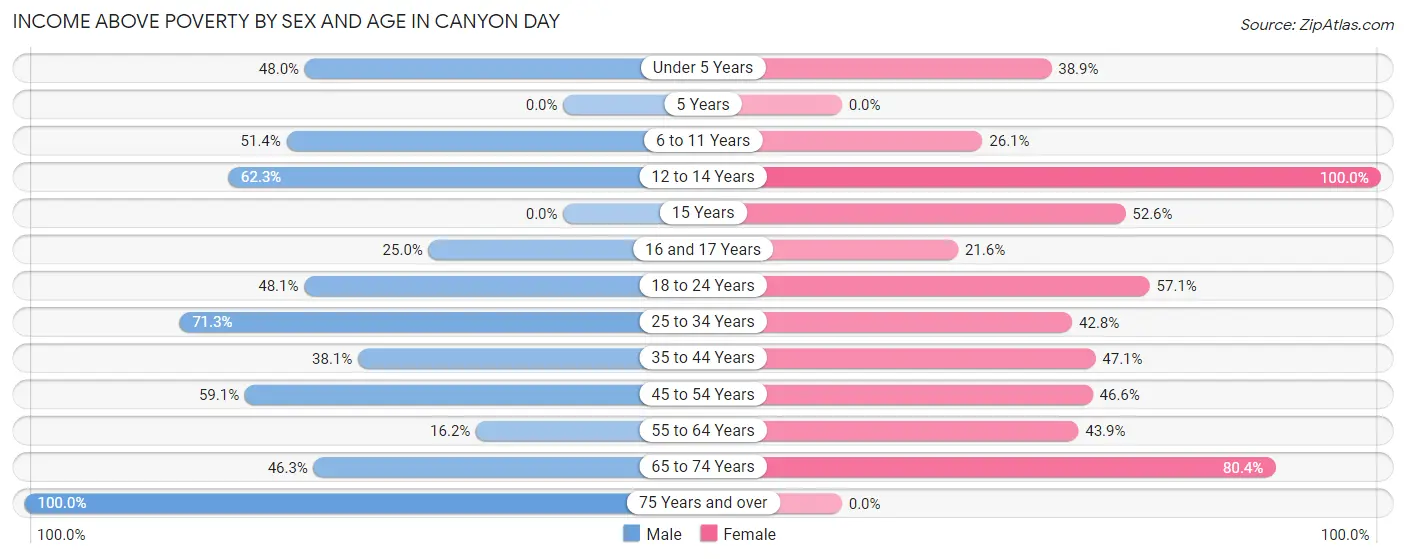
| Age Bracket | Male | Female |
| Under 5 Years | 59 (48.0%) | 49 (38.9%) |
| 5 Years | 0 (0.0%) | 0 (0.0%) |
| 6 to 11 Years | 94 (51.4%) | 24 (26.1%) |
| 12 to 14 Years | 33 (62.3%) | 44 (100.0%) |
| 15 Years | 0 (0.0%) | 10 (52.6%) |
| 16 and 17 Years | 7 (25.0%) | 11 (21.6%) |
| 18 to 24 Years | 25 (48.1%) | 32 (57.1%) |
| 25 to 34 Years | 82 (71.3%) | 56 (42.7%) |
| 35 to 44 Years | 16 (38.1%) | 32 (47.1%) |
| 45 to 54 Years | 13 (59.1%) | 27 (46.6%) |
| 55 to 64 Years | 11 (16.2%) | 36 (43.9%) |
| 65 to 74 Years | 19 (46.3%) | 37 (80.4%) |
| 75 Years and over | 47 (100.0%) | 0 (0.0%) |
| Total | 406 (49.3%) | 358 (45.3%) |
Income Below Poverty Among Married-Couple Families in Canyon Day
The poverty statistics for married-couple families in Canyon Day show that 44.0% or 55 of the total 125 families live below the poverty line. Families with no children have the highest poverty rate of 100.0%, comprising of 22 families. On the other hand, families with 3 or 4 children have the lowest poverty rate of 0.0%, which includes 0 families.
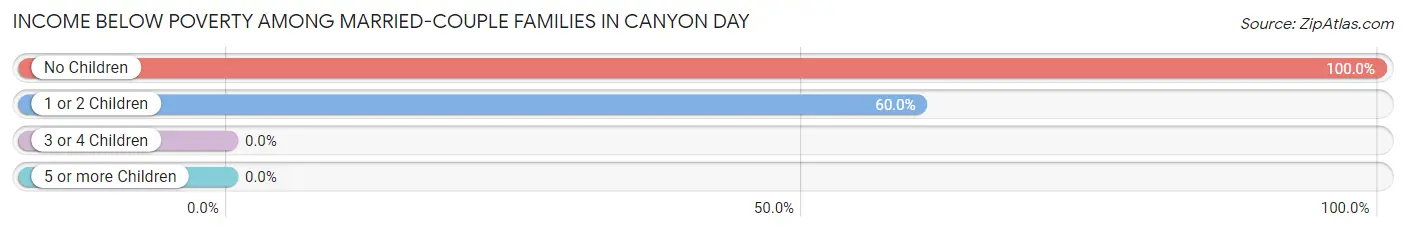
| Children | Above Poverty | Below Poverty |
| No Children | 0 (0.0%) | 22 (100.0%) |
| 1 or 2 Children | 22 (40.0%) | 33 (60.0%) |
| 3 or 4 Children | 20 (100.0%) | 0 (0.0%) |
| 5 or more Children | 28 (100.0%) | 0 (0.0%) |
| Total | 70 (56.0%) | 55 (44.0%) |
Income Below Poverty Among Single-Parent Households in Canyon Day
According to the poverty data in Canyon Day, 62.5% or 25 single-father households and 66.1% or 82 single-mother households are living below the poverty line. Among single-father households, those with 5 or more children have the highest poverty rate, with 8 households (100.0%) experiencing poverty. Likewise, among single-mother households, those with 3 or 4 children have the highest poverty rate, with 13 households (100.0%) falling below the poverty line.
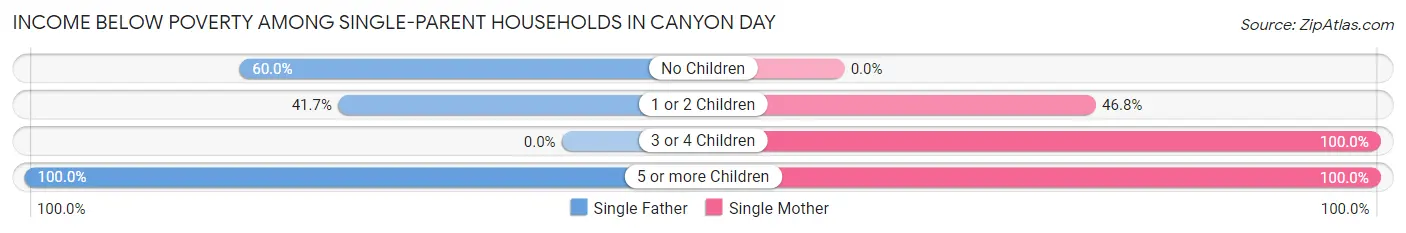
| Children | Single Father | Single Mother |
| No Children | 12 (60.0%) | 0 (0.0%) |
| 1 or 2 Children | 5 (41.7%) | 37 (46.8%) |
| 3 or 4 Children | 0 (0.0%) | 13 (100.0%) |
| 5 or more Children | 8 (100.0%) | 32 (100.0%) |
| Total | 25 (62.5%) | 82 (66.1%) |
Income Below Poverty Among Married-Couple vs Single-Parent Households in Canyon Day
The poverty data for Canyon Day shows that 55 of the married-couple family households (44.0%) and 107 of the single-parent households (65.2%) are living below the poverty level. Within the married-couple family households, those with no children have the highest poverty rate, with 22 households (100.0%) falling below the poverty line. Among the single-parent households, those with 3 or 4 children have the highest poverty rate, with 13 household (100.0%) living below poverty.
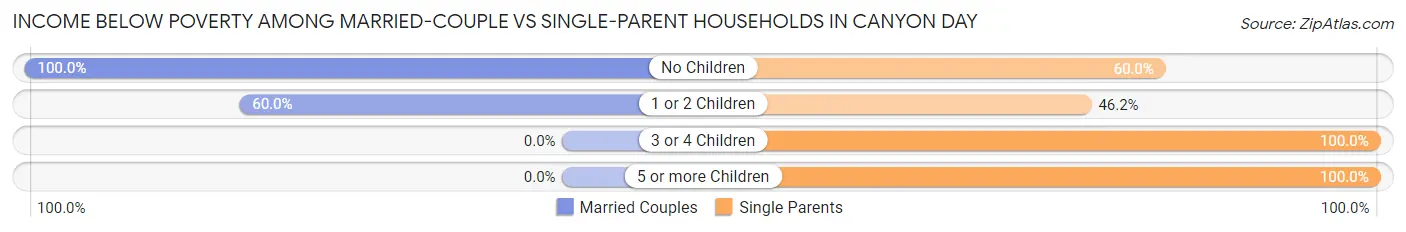
| Children | Married-Couple Families | Single-Parent Households |
| No Children | 22 (100.0%) | 12 (60.0%) |
| 1 or 2 Children | 33 (60.0%) | 42 (46.2%) |
| 3 or 4 Children | 0 (0.0%) | 13 (100.0%) |
| 5 or more Children | 0 (0.0%) | 40 (100.0%) |
| Total | 55 (44.0%) | 107 (65.2%) |
Race in Canyon Day
The most populous races in Canyon Day are Native / Alaskan (1,517 | 93.6%), Two or more Races (69 | 4.3%), and White / Caucasian (35 | 2.2%).
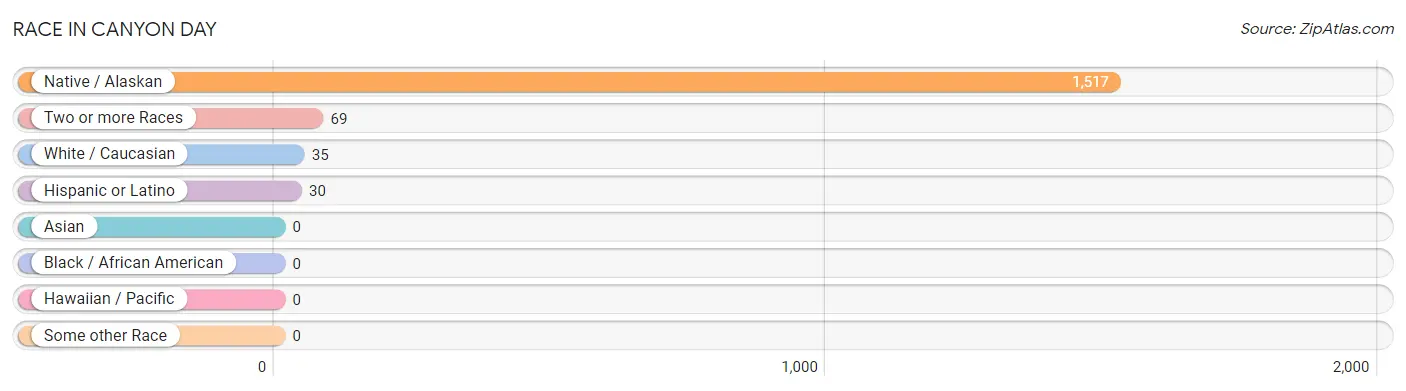
| Race | # Population | % Population |
| Asian | 0 | 0.0% |
| Black / African American | 0 | 0.0% |
| Hawaiian / Pacific | 0 | 0.0% |
| Hispanic or Latino | 30 | 1.8% |
| Native / Alaskan | 1,517 | 93.6% |
| White / Caucasian | 35 | 2.2% |
| Two or more Races | 69 | 4.3% |
| Some other Race | 0 | 0.0% |
| Total | 1,621 | 100.0% |
Ancestry in Canyon Day
The most populous ancestries reported in Canyon Day are Apache (1,445 | 89.1%), Navajo (198 | 12.2%), Puerto Rican (30 | 1.8%), and Sioux (8 | 0.5%), together accounting for 103.7% of all Canyon Day residents.
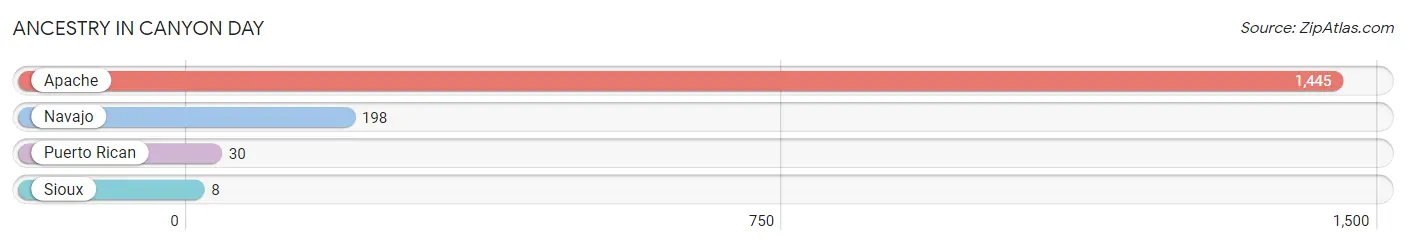
| Ancestry | # Population | % Population |
| Apache | 1,445 | 89.1% |
| Navajo | 198 | 12.2% |
| Puerto Rican | 30 | 1.8% |
| Sioux | 8 | 0.5% | View All 4 Rows |
Immigrants in Canyon Day

| Immigration Origin | # Population | % Population | View All 0 Rows |
Sex and Age in Canyon Day
Sex and Age in Canyon Day
The most populous age groups in Canyon Day are 10 to 14 Years (170 | 20.5%) for men and Under 5 Years (126 | 16.0%) for women.
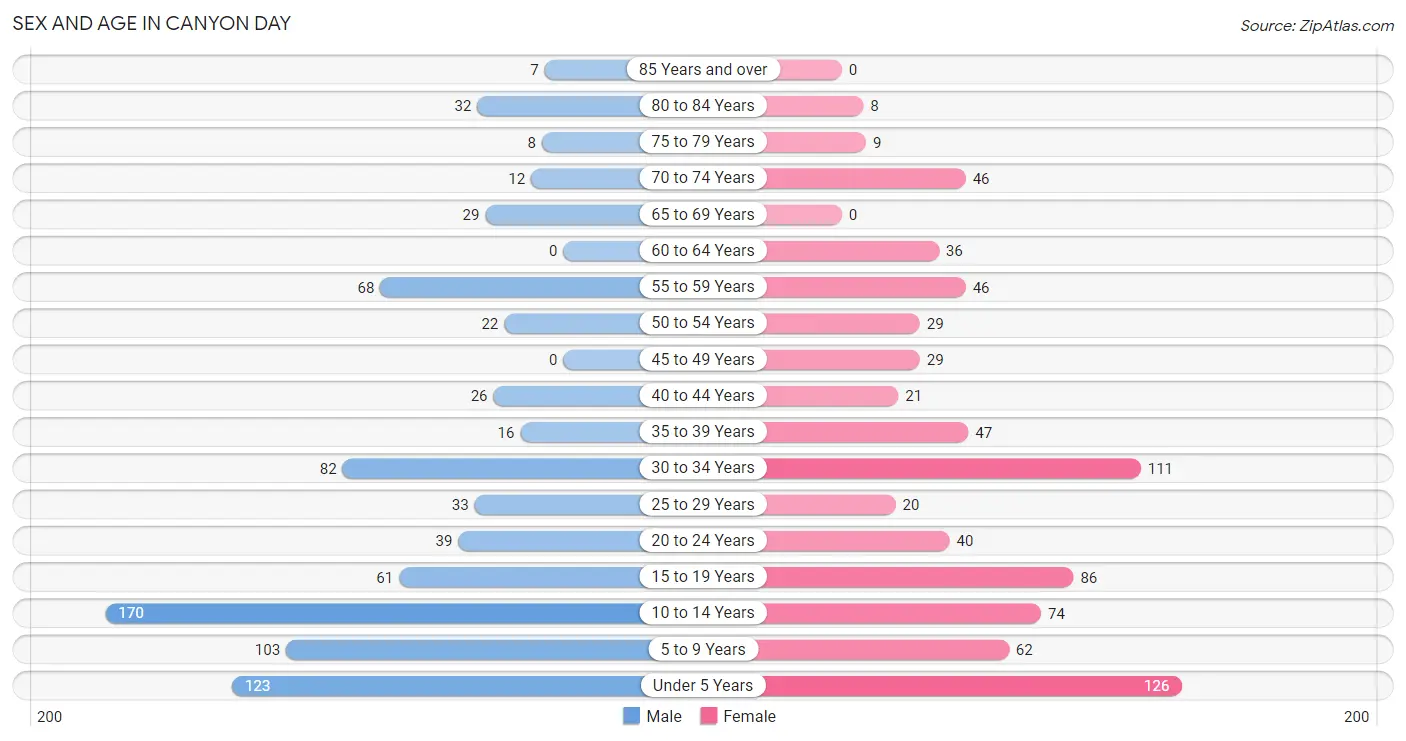
| Age Bracket | Male | Female |
| Under 5 Years | 123 (14.8%) | 126 (16.0%) |
| 5 to 9 Years | 103 (12.4%) | 62 (7.9%) |
| 10 to 14 Years | 170 (20.5%) | 74 (9.4%) |
| 15 to 19 Years | 61 (7.3%) | 86 (10.9%) |
| 20 to 24 Years | 39 (4.7%) | 40 (5.1%) |
| 25 to 29 Years | 33 (4.0%) | 20 (2.5%) |
| 30 to 34 Years | 82 (9.9%) | 111 (14.1%) |
| 35 to 39 Years | 16 (1.9%) | 47 (5.9%) |
| 40 to 44 Years | 26 (3.1%) | 21 (2.7%) |
| 45 to 49 Years | 0 (0.0%) | 29 (3.7%) |
| 50 to 54 Years | 22 (2.6%) | 29 (3.7%) |
| 55 to 59 Years | 68 (8.2%) | 46 (5.8%) |
| 60 to 64 Years | 0 (0.0%) | 36 (4.6%) |
| 65 to 69 Years | 29 (3.5%) | 0 (0.0%) |
| 70 to 74 Years | 12 (1.4%) | 46 (5.8%) |
| 75 to 79 Years | 8 (1.0%) | 9 (1.1%) |
| 80 to 84 Years | 32 (3.8%) | 8 (1.0%) |
| 85 Years and over | 7 (0.8%) | 0 (0.0%) |
| Total | 831 (100.0%) | 790 (100.0%) |
Families and Households in Canyon Day
Median Family Size in Canyon Day
The median family size in Canyon Day is 5.22 persons per family, with married-couple families (125 | 43.2%) accounting for the largest median family size of 6.01 persons per family. On the other hand, single male/father families (40 | 13.8%) represent the smallest median family size with 4.10 persons per family.
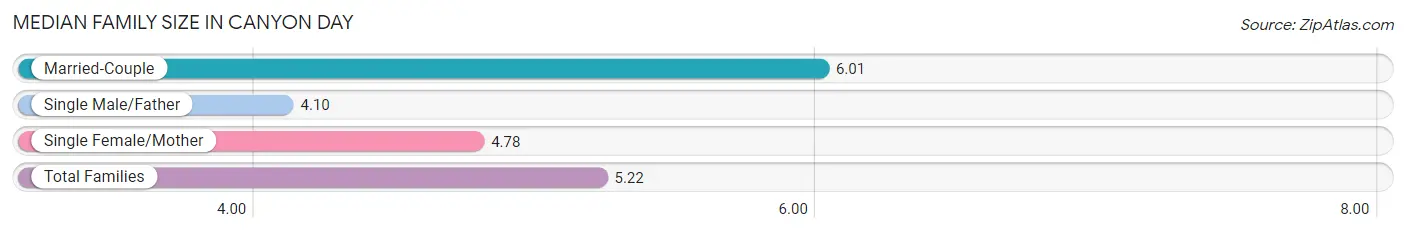
| Family Type | # Families | Family Size |
| Married-Couple | 125 (43.2%) | 6.01 |
| Single Male/Father | 40 (13.8%) | 4.10 |
| Single Female/Mother | 124 (42.9%) | 4.78 |
| Total Families | 289 (100.0%) | 5.22 |
Median Household Size in Canyon Day
The median household size in Canyon Day is 5.23 persons per household, with married-couple households (125 | 40.3%) accounting for the largest median household size of 6.01 persons per household. non-family households (21 | 6.8%) represent the smallest median household size with 1.52 persons per household.
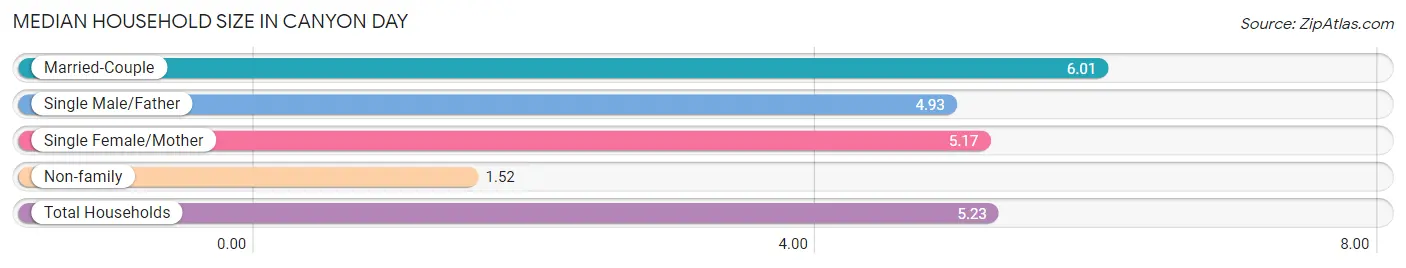
| Household Type | # Households | Household Size |
| Married-Couple | 125 (40.3%) | 6.01 |
| Single Male/Father | 40 (12.9%) | 4.93 |
| Single Female/Mother | 124 (40.0%) | 5.17 |
| Non-family | 21 (6.8%) | 1.52 |
| Total Households | 310 (100.0%) | 5.23 |
Household Size by Marriage Status in Canyon Day
Out of a total of 310 households in Canyon Day, 289 (93.2%) are family households, while 21 (6.8%) are nonfamily households. The most numerous type of family households are 7+ person households, comprising 99, and the most common type of nonfamily households are 2-person households, comprising 12.
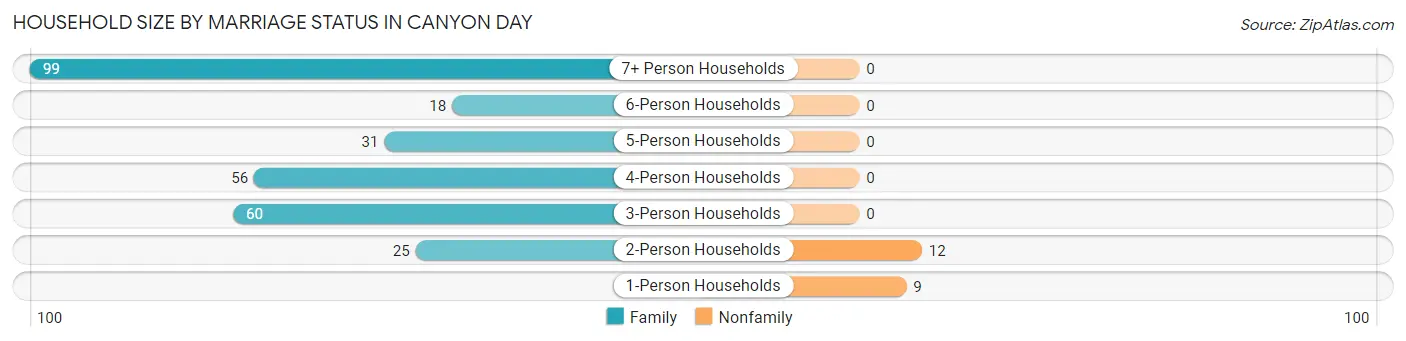
| Household Size | Family Households | Nonfamily Households |
| 1-Person Households | - | 9 (2.9%) |
| 2-Person Households | 25 (8.1%) | 12 (3.9%) |
| 3-Person Households | 60 (19.4%) | 0 (0.0%) |
| 4-Person Households | 56 (18.1%) | 0 (0.0%) |
| 5-Person Households | 31 (10.0%) | 0 (0.0%) |
| 6-Person Households | 18 (5.8%) | 0 (0.0%) |
| 7+ Person Households | 99 (31.9%) | 0 (0.0%) |
| Total | 289 (93.2%) | 21 (6.8%) |
Female Fertility in Canyon Day
Fertility by Age in Canyon Day
Average fertility rate in Canyon Day is 125.0 births per 1,000 women. Women in the age bracket of 20 to 34 years have the highest fertility rate with 193.0 births per 1,000 women. Women in the age bracket of 20 to 34 years acount for 71.7% of all women with births.
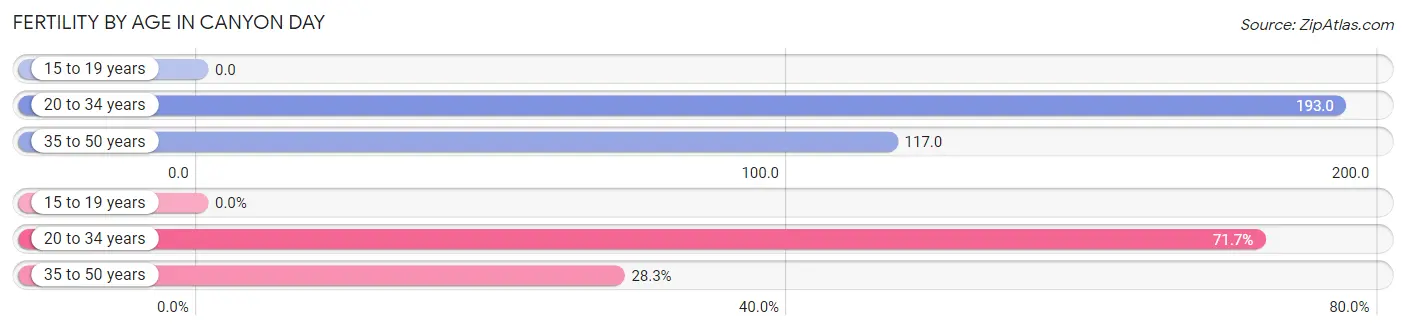
| Age Bracket | Women with Births | Births / 1,000 Women |
| 15 to 19 years | 0 (0.0%) | 0.0 |
| 20 to 34 years | 33 (71.7%) | 193.0 |
| 35 to 50 years | 13 (28.3%) | 117.0 |
| Total | 46 (100.0%) | 125.0 |
Fertility by Age by Marriage Status in Canyon Day
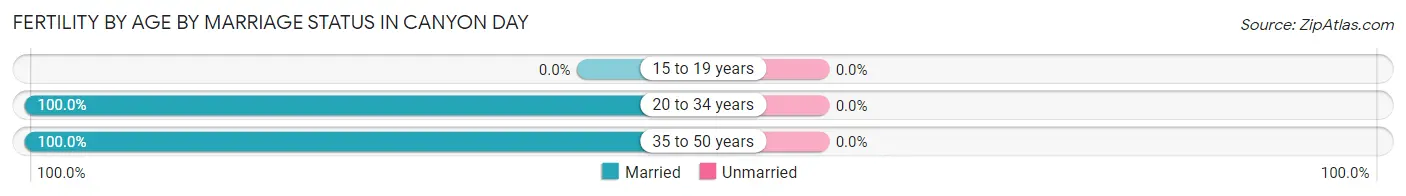
| Age Bracket | Married | Unmarried |
| 15 to 19 years | 0 (0.0%) | 0 (0.0%) |
| 20 to 34 years | 33 (100.0%) | 0 (0.0%) |
| 35 to 50 years | 13 (100.0%) | 0 (0.0%) |
| Total | 46 (100.0%) | 0 (0.0%) |
Fertility by Education in Canyon Day
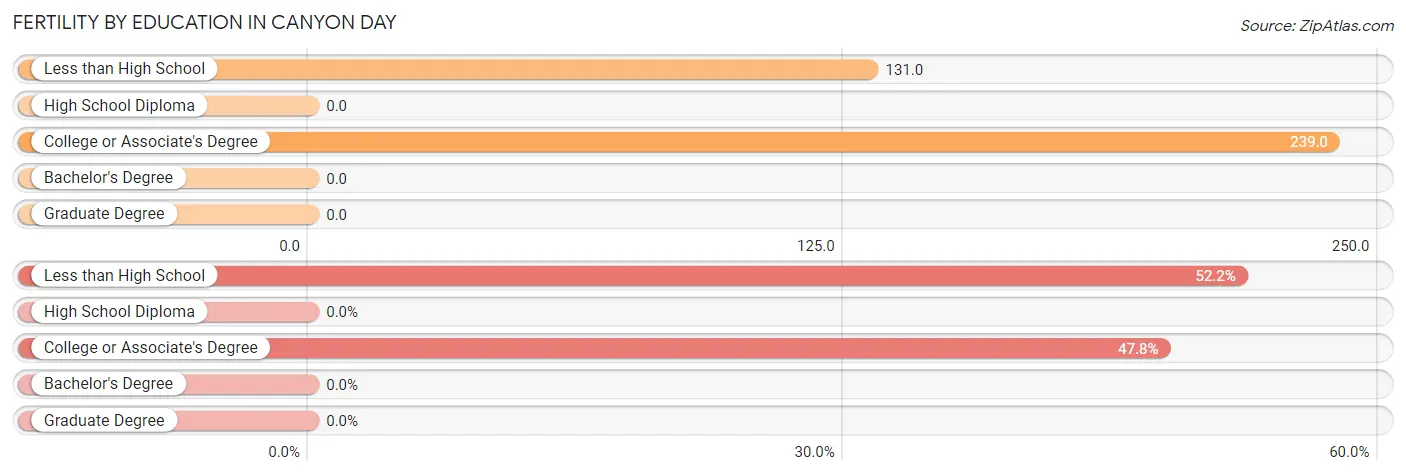
| Educational Attainment | Women with Births | Births / 1,000 Women |
| Less than High School | 24 (52.2%) | 131.0 |
| High School Diploma | 0 (0.0%) | 0.0 |
| College or Associate's Degree | 22 (47.8%) | 239.0 |
| Bachelor's Degree | 0 (0.0%) | 0.0 |
| Graduate Degree | 0 (0.0%) | 0.0 |
| Total | 46 (100.0%) | 125.0 |
Fertility by Education by Marriage Status in Canyon Day
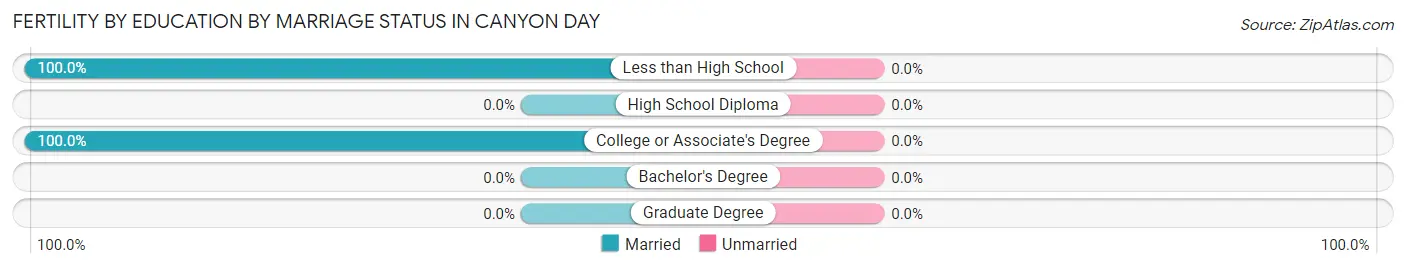
| Educational Attainment | Married | Unmarried |
| Less than High School | 24 (100.0%) | 0 (0.0%) |
| High School Diploma | 0 (0.0%) | 0 (0.0%) |
| College or Associate's Degree | 22 (100.0%) | 0 (0.0%) |
| Bachelor's Degree | 0 (0.0%) | 0 (0.0%) |
| Graduate Degree | 0 (0.0%) | 0 (0.0%) |
| Total | 46 (100.0%) | 0 (0.0%) |
Employment Characteristics in Canyon Day
Employment by Class of Employer in Canyon Day
Among the 239 employed individuals in Canyon Day, local government employees (87 | 36.4%), private company employees (85 | 35.6%), and federal government employees (57 | 23.8%) make up the most common classes of employment.
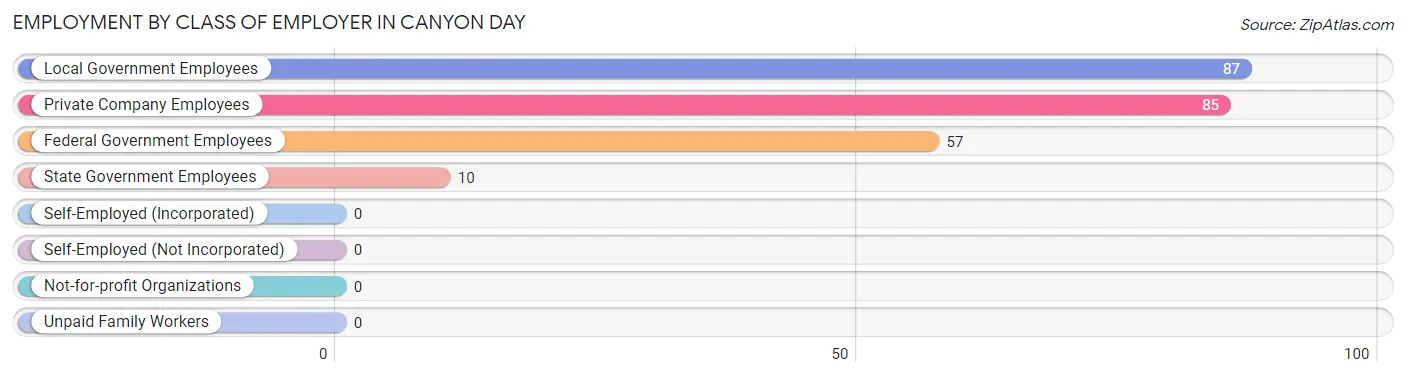
| Employer Class | # Employees | % Employees |
| Private Company Employees | 85 | 35.6% |
| Self-Employed (Incorporated) | 0 | 0.0% |
| Self-Employed (Not Incorporated) | 0 | 0.0% |
| Not-for-profit Organizations | 0 | 0.0% |
| Local Government Employees | 87 | 36.4% |
| State Government Employees | 10 | 4.2% |
| Federal Government Employees | 57 | 23.8% |
| Unpaid Family Workers | 0 | 0.0% |
| Total | 239 | 100.0% |
Employment Status by Age in Canyon Day
According to the labor force statistics for Canyon Day, out of the total population over 16 years of age (924), 29.8% or 275 individuals are in the labor force, with 13.1% or 36 of them unemployed. The age group with the highest labor force participation rate is 60 to 64 years, with 75.0% or 27 individuals in the labor force. Within the labor force, the 30 to 34 years age range has the highest percentage of unemployed individuals, with 26.5% or 13 of them being unemployed.
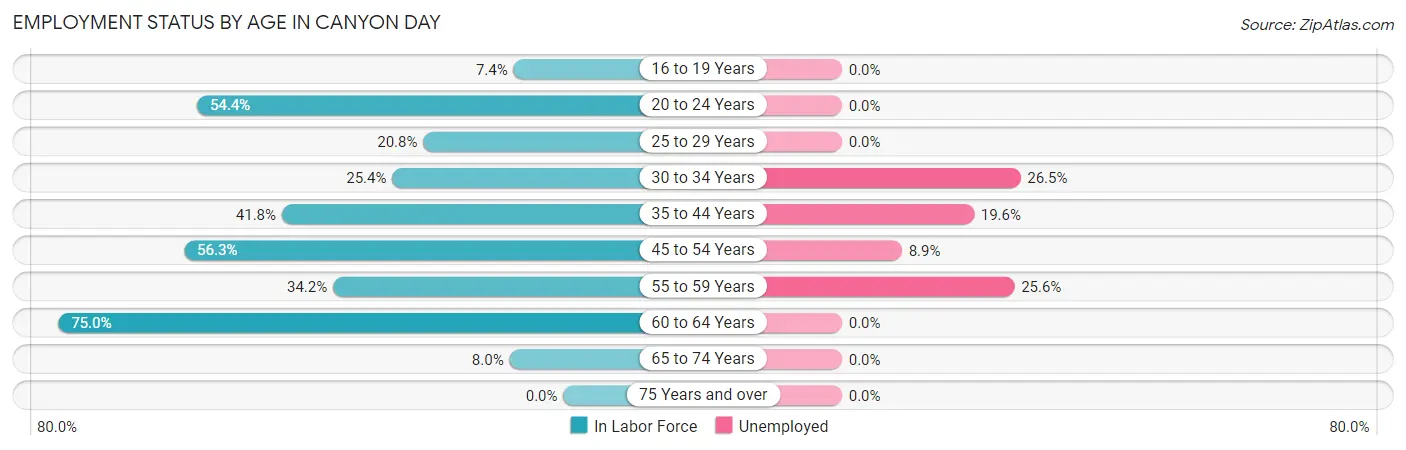
| Age Bracket | In Labor Force | Unemployed |
| 16 to 19 Years | 8 (7.4%) | 0 (0.0%) |
| 20 to 24 Years | 43 (54.4%) | 0 (0.0%) |
| 25 to 29 Years | 11 (20.8%) | 0 (0.0%) |
| 30 to 34 Years | 49 (25.4%) | 13 (26.5%) |
| 35 to 44 Years | 46 (41.8%) | 9 (19.6%) |
| 45 to 54 Years | 45 (56.3%) | 4 (8.9%) |
| 55 to 59 Years | 39 (34.2%) | 10 (25.6%) |
| 60 to 64 Years | 27 (75.0%) | 0 (0.0%) |
| 65 to 74 Years | 7 (8.0%) | 0 (0.0%) |
| 75 Years and over | 0 (0.0%) | 0 (0.0%) |
| Total | 275 (29.8%) | 36 (13.1%) |
Employment Status by Educational Attainment in Canyon Day
According to labor force statistics for Canyon Day, 37.0% of individuals (217) out of the total population between 25 and 64 years of age (586) are in the labor force, with 16.6% or 36 of them being unemployed. The group with the highest labor force participation rate are those with the educational attainment of bachelor's degree or higher, with 100.0% or 32 individuals in the labor force. Within the labor force, individuals with less than high school education have the highest percentage of unemployment, with 54.2% or 13 of them being unemployed.
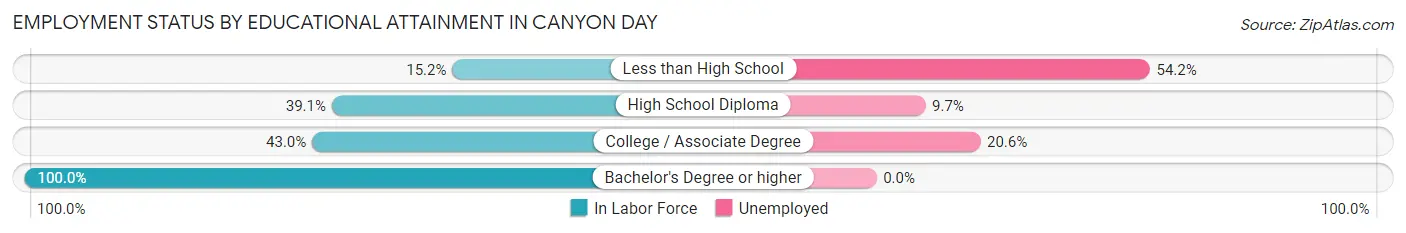
| Educational Attainment | In Labor Force | Unemployed |
| Less than High School | 24 (15.2%) | 86 (54.2%) |
| High School Diploma | 93 (39.1%) | 23 (9.7%) |
| College / Associate Degree | 68 (43.0%) | 33 (20.6%) |
| Bachelor's Degree or higher | 32 (100.0%) | 0 (0.0%) |
| Total | 217 (37.0%) | 97 (16.6%) |
Employment Occupations by Sex in Canyon Day
Management, Business, Science and Arts Occupations
The most common Management, Business, Science and Arts occupations in Canyon Day are Management (10 | 4.2%), Community & Social Service (7 | 2.9%), and Education Instruction & Library (7 | 2.9%).
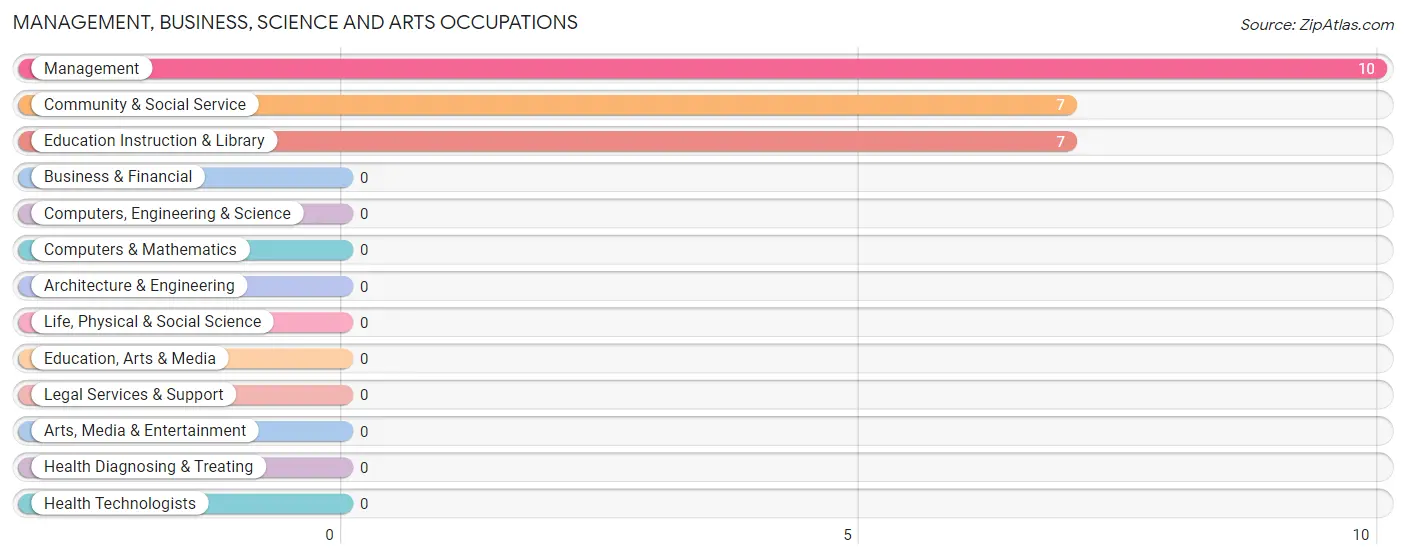
Management, Business, Science and Arts Occupations by Sex
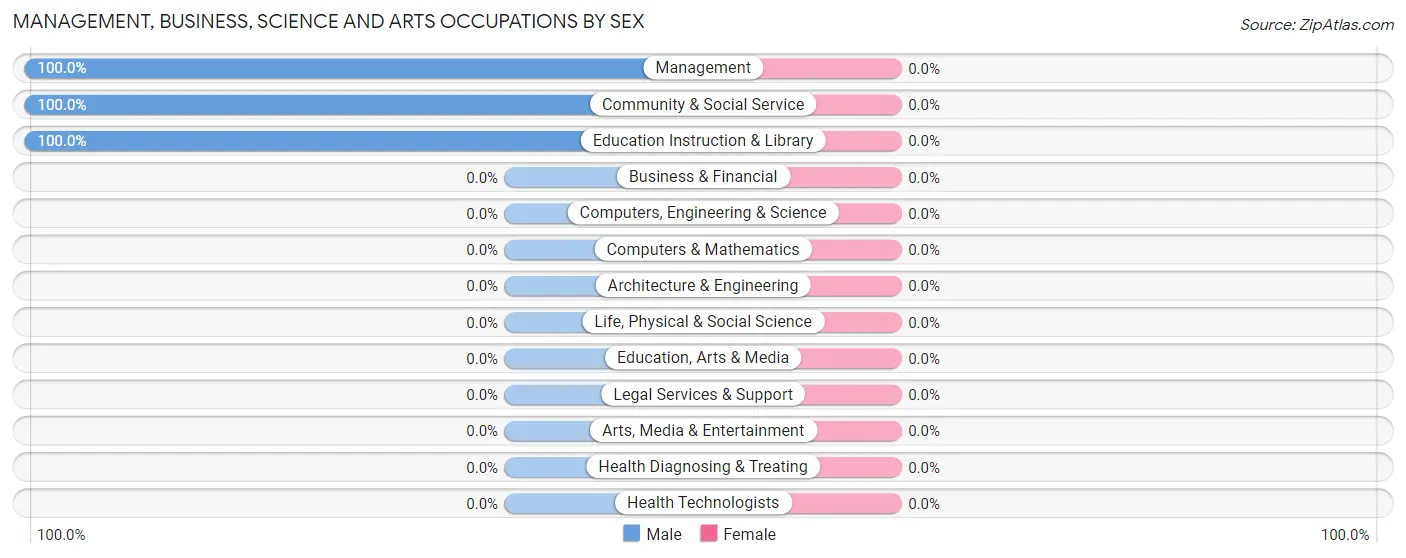
| Occupation | Male | Female |
| Management | 10 (100.0%) | 0 (0.0%) |
| Business & Financial | 0 (0.0%) | 0 (0.0%) |
| Computers, Engineering & Science | 0 (0.0%) | 0 (0.0%) |
| Computers & Mathematics | 0 (0.0%) | 0 (0.0%) |
| Architecture & Engineering | 0 (0.0%) | 0 (0.0%) |
| Life, Physical & Social Science | 0 (0.0%) | 0 (0.0%) |
| Community & Social Service | 7 (100.0%) | 0 (0.0%) |
| Education, Arts & Media | 0 (0.0%) | 0 (0.0%) |
| Legal Services & Support | 0 (0.0%) | 0 (0.0%) |
| Education Instruction & Library | 7 (100.0%) | 0 (0.0%) |
| Arts, Media & Entertainment | 0 (0.0%) | 0 (0.0%) |
| Health Diagnosing & Treating | 0 (0.0%) | 0 (0.0%) |
| Health Technologists | 0 (0.0%) | 0 (0.0%) |
| Total (Category) | 17 (100.0%) | 0 (0.0%) |
| Total (Overall) | 95 (39.8%) | 144 (60.3%) |
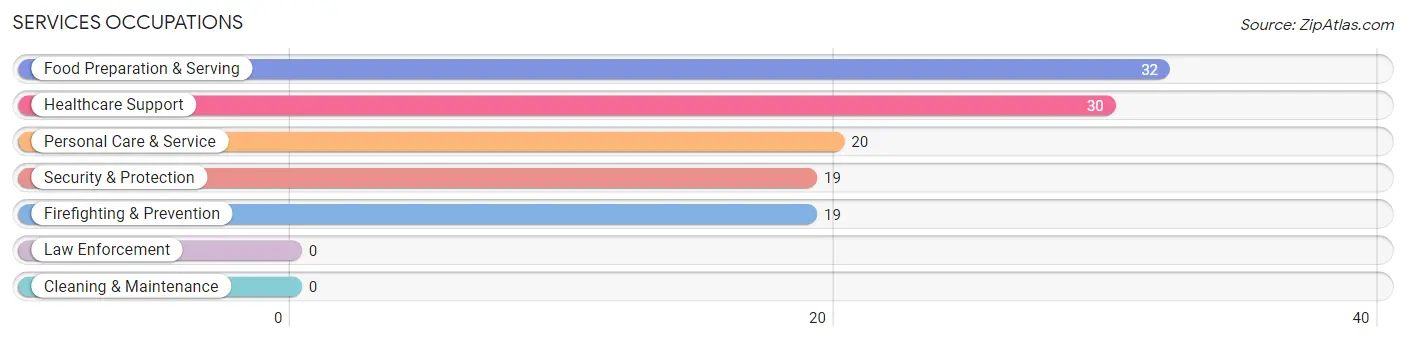
Services Occupations
The most common Services occupations in Canyon Day are Food Preparation & Serving (32 | 13.4%), Healthcare Support (30 | 12.6%), Personal Care & Service (20 | 8.4%), Security & Protection (19 | 8.0%), and Firefighting & Prevention (19 | 8.0%).
Services Occupations by Sex
Within the Services occupations in Canyon Day, the most male-oriented occupations are Security & Protection (100.0%), Firefighting & Prevention (100.0%), and Personal Care & Service (55.0%), while the most female-oriented occupations are Healthcare Support (100.0%), Food Preparation & Serving (56.2%), and Personal Care & Service (45.0%).
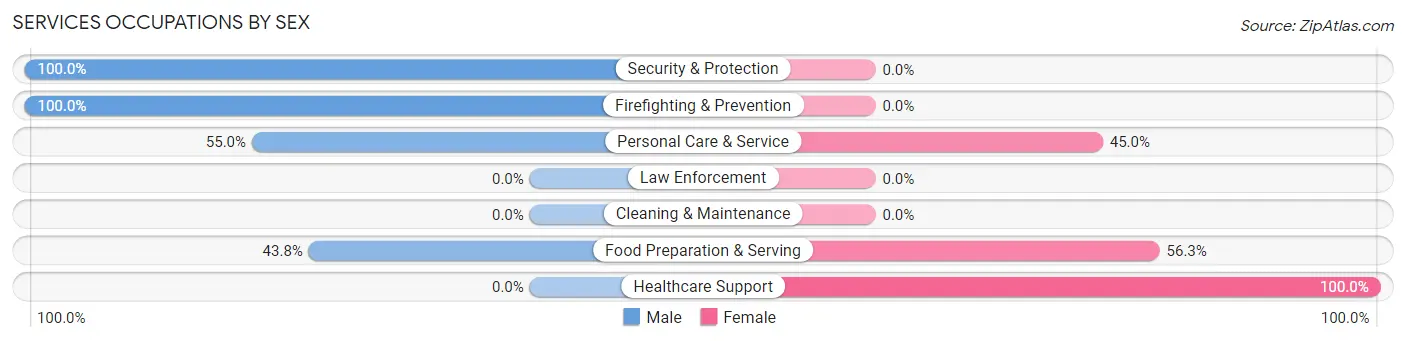
| Occupation | Male | Female |
| Healthcare Support | 0 (0.0%) | 30 (100.0%) |
| Security & Protection | 19 (100.0%) | 0 (0.0%) |
| Firefighting & Prevention | 19 (100.0%) | 0 (0.0%) |
| Law Enforcement | 0 (0.0%) | 0 (0.0%) |
| Food Preparation & Serving | 14 (43.8%) | 18 (56.2%) |
| Cleaning & Maintenance | 0 (0.0%) | 0 (0.0%) |
| Personal Care & Service | 11 (55.0%) | 9 (45.0%) |
| Total (Category) | 44 (43.6%) | 57 (56.4%) |
| Total (Overall) | 95 (39.8%) | 144 (60.3%) |
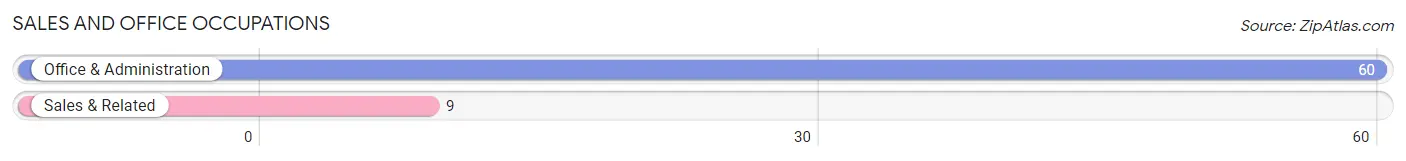
Sales and Office Occupations
The most common Sales and Office occupations in Canyon Day are Office & Administration (60 | 25.1%), and Sales & Related (9 | 3.8%).
Sales and Office Occupations by Sex
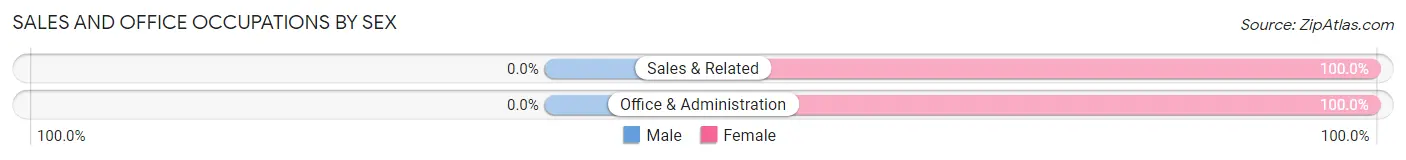
| Occupation | Male | Female |
| Sales & Related | 0 (0.0%) | 9 (100.0%) |
| Office & Administration | 0 (0.0%) | 60 (100.0%) |
| Total (Category) | 0 (0.0%) | 69 (100.0%) |
| Total (Overall) | 95 (39.8%) | 144 (60.3%) |
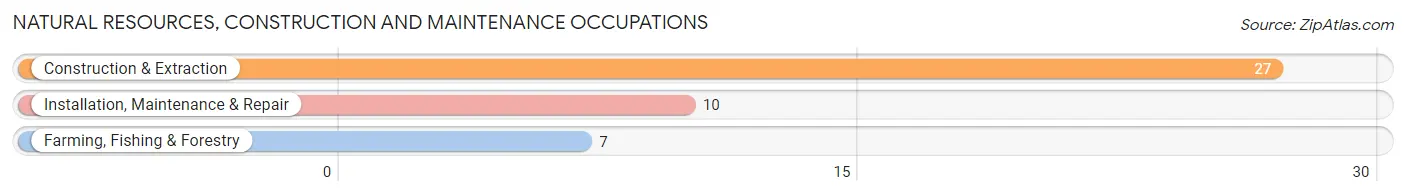
Natural Resources, Construction and Maintenance Occupations
The most common Natural Resources, Construction and Maintenance occupations in Canyon Day are Construction & Extraction (27 | 11.3%), Installation, Maintenance & Repair (10 | 4.2%), and Farming, Fishing & Forestry (7 | 2.9%).
Natural Resources, Construction and Maintenance Occupations by Sex
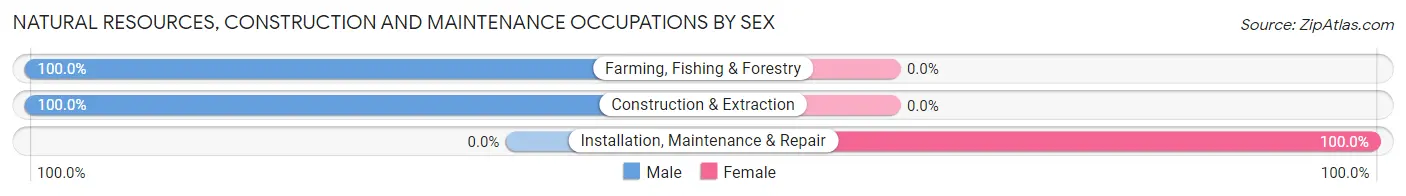
| Occupation | Male | Female |
| Farming, Fishing & Forestry | 7 (100.0%) | 0 (0.0%) |
| Construction & Extraction | 27 (100.0%) | 0 (0.0%) |
| Installation, Maintenance & Repair | 0 (0.0%) | 10 (100.0%) |
| Total (Category) | 34 (77.3%) | 10 (22.7%) |
| Total (Overall) | 95 (39.8%) | 144 (60.3%) |
Production, Transportation and Moving Occupations
The most common Production, Transportation and Moving occupations in Canyon Day are , and Material Moving (8 | 3.4%).
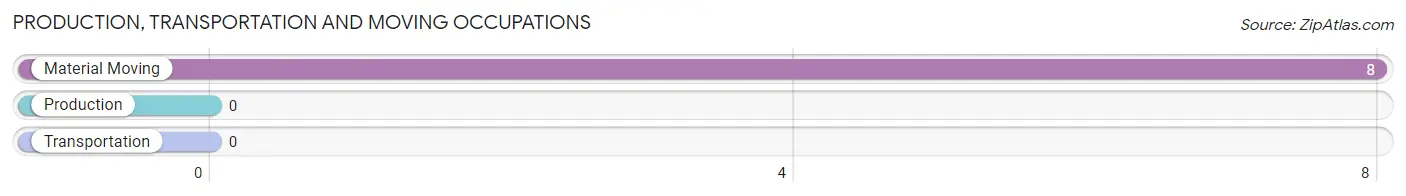
Production, Transportation and Moving Occupations by Sex
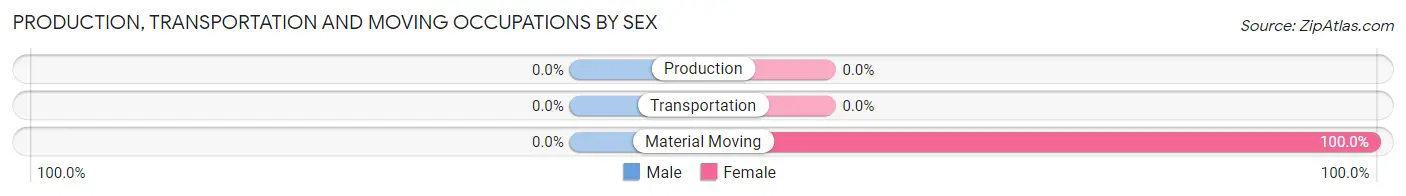
| Occupation | Male | Female |
| Production | 0 (0.0%) | 0 (0.0%) |
| Transportation | 0 (0.0%) | 0 (0.0%) |
| Material Moving | 0 (0.0%) | 8 (100.0%) |
| Total (Category) | 0 (0.0%) | 8 (100.0%) |
| Total (Overall) | 95 (39.8%) | 144 (60.3%) |
Employment Industries by Sex in Canyon Day
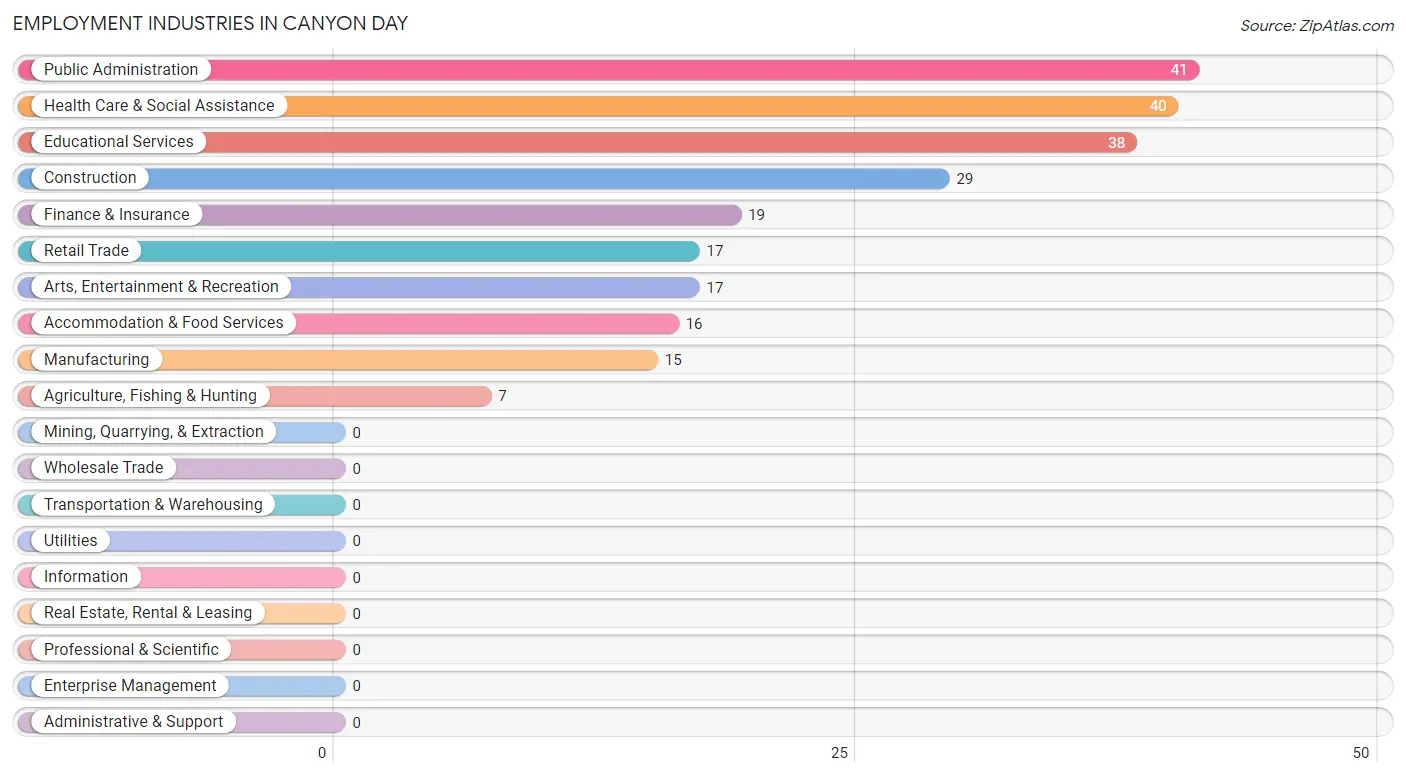
Employment Industries in Canyon Day
The major employment industries in Canyon Day include Public Administration (41 | 17.2%), Health Care & Social Assistance (40 | 16.7%), Educational Services (38 | 15.9%), Construction (29 | 12.1%), and Finance & Insurance (19 | 8.0%).
Employment Industries by Sex in Canyon Day
The Canyon Day industries that see more men than women are Agriculture, Fishing & Hunting (100.0%), Arts, Entertainment & Recreation (100.0%), and Construction (69.0%), whereas the industries that tend to have a higher number of women are Finance & Insurance (100.0%), Health Care & Social Assistance (100.0%), and Educational Services (81.6%).
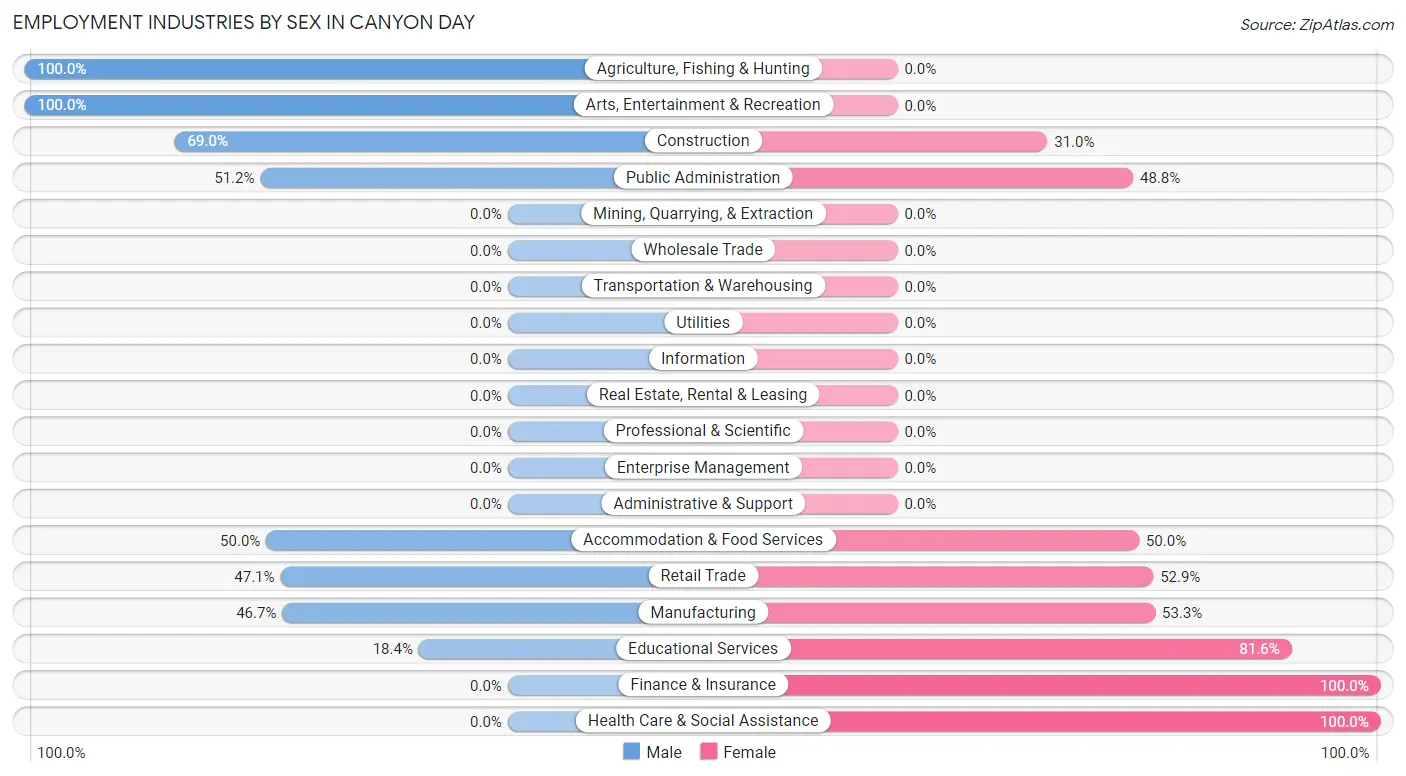
| Industry | Male | Female |
| Agriculture, Fishing & Hunting | 7 (100.0%) | 0 (0.0%) |
| Mining, Quarrying, & Extraction | 0 (0.0%) | 0 (0.0%) |
| Construction | 20 (69.0%) | 9 (31.0%) |
| Manufacturing | 7 (46.7%) | 8 (53.3%) |
| Wholesale Trade | 0 (0.0%) | 0 (0.0%) |
| Retail Trade | 8 (47.1%) | 9 (52.9%) |
| Transportation & Warehousing | 0 (0.0%) | 0 (0.0%) |
| Utilities | 0 (0.0%) | 0 (0.0%) |
| Information | 0 (0.0%) | 0 (0.0%) |
| Finance & Insurance | 0 (0.0%) | 19 (100.0%) |
| Real Estate, Rental & Leasing | 0 (0.0%) | 0 (0.0%) |
| Professional & Scientific | 0 (0.0%) | 0 (0.0%) |
| Enterprise Management | 0 (0.0%) | 0 (0.0%) |
| Administrative & Support | 0 (0.0%) | 0 (0.0%) |
| Educational Services | 7 (18.4%) | 31 (81.6%) |
| Health Care & Social Assistance | 0 (0.0%) | 40 (100.0%) |
| Arts, Entertainment & Recreation | 17 (100.0%) | 0 (0.0%) |
| Accommodation & Food Services | 8 (50.0%) | 8 (50.0%) |
| Public Administration | 21 (51.2%) | 20 (48.8%) |
| Total | 95 (39.8%) | 144 (60.3%) |
Education in Canyon Day
School Enrollment in Canyon Day
The most common levels of schooling among the 656 students in Canyon Day are elementary school (204 | 31.1%), high school (156 | 23.8%), and middle school (138 | 21.0%).
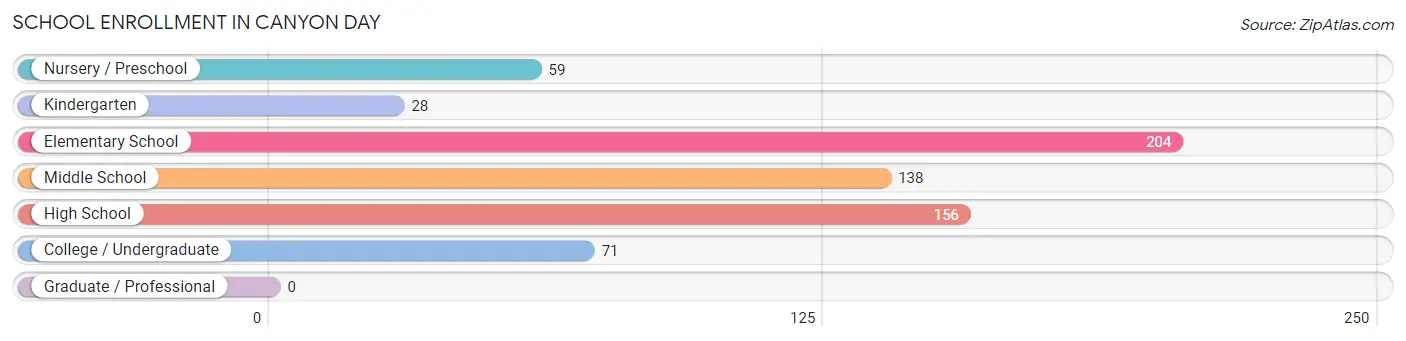
| School Level | # Students | % Students |
| Nursery / Preschool | 59 | 9.0% |
| Kindergarten | 28 | 4.3% |
| Elementary School | 204 | 31.1% |
| Middle School | 138 | 21.0% |
| High School | 156 | 23.8% |
| College / Undergraduate | 71 | 10.8% |
| Graduate / Professional | 0 | 0.0% |
| Total | 656 | 100.0% |
School Enrollment by Age by Funding Source in Canyon Day
Out of a total of 656 students who are enrolled in schools in Canyon Day, 13 (2.0%) attend a private institution, while the remaining 643 (98.0%) are enrolled in public schools. The age group of 25 to 34 year olds has the highest likelihood of being enrolled in private schools, with 13 (21.3% in the age bracket) enrolled. Conversely, the age group of 3 to 4 year olds has the lowest likelihood of being enrolled in a private school, with 50 (100.0% in the age bracket) attending a public institution.
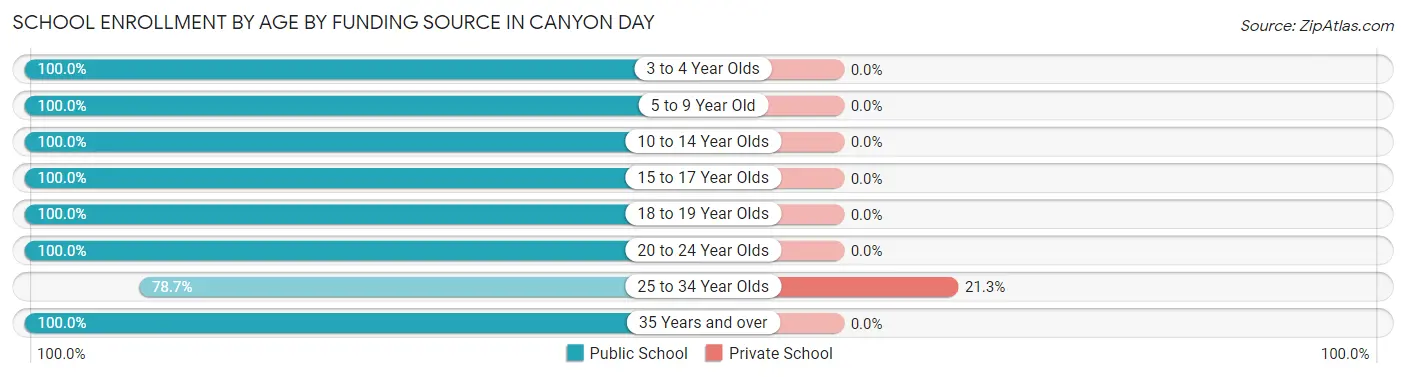
| Age Bracket | Public School | Private School |
| 3 to 4 Year Olds | 50 (100.0%) | 0 (0.0%) |
| 5 to 9 Year Old | 165 (100.0%) | 0 (0.0%) |
| 10 to 14 Year Olds | 225 (100.0%) | 0 (0.0%) |
| 15 to 17 Year Olds | 118 (100.0%) | 0 (0.0%) |
| 18 to 19 Year Olds | 14 (100.0%) | 0 (0.0%) |
| 20 to 24 Year Olds | 14 (100.0%) | 0 (0.0%) |
| 25 to 34 Year Olds | 48 (78.7%) | 13 (21.3%) |
| 35 Years and over | 9 (100.0%) | 0 (0.0%) |
| Total | 643 (98.0%) | 13 (2.0%) |
Educational Attainment by Field of Study in Canyon Day
Arts & humanities (20 | 43.5%), business (10 | 21.7%), engineering (8 | 17.4%), and education (8 | 17.4%) are the most common fields of study among 46 individuals in Canyon Day who have obtained a bachelor's degree or higher.
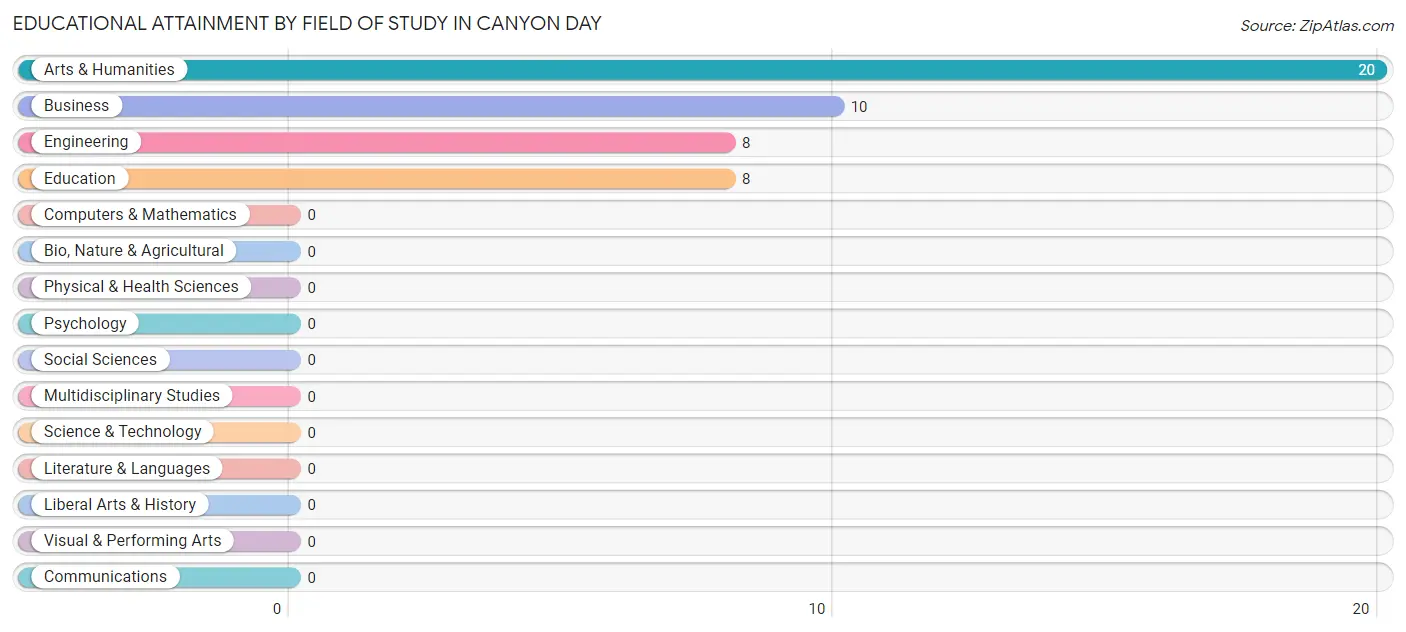
| Field of Study | # Graduates | % Graduates |
| Computers & Mathematics | 0 | 0.0% |
| Bio, Nature & Agricultural | 0 | 0.0% |
| Physical & Health Sciences | 0 | 0.0% |
| Psychology | 0 | 0.0% |
| Social Sciences | 0 | 0.0% |
| Engineering | 8 | 17.4% |
| Multidisciplinary Studies | 0 | 0.0% |
| Science & Technology | 0 | 0.0% |
| Business | 10 | 21.7% |
| Education | 8 | 17.4% |
| Literature & Languages | 0 | 0.0% |
| Liberal Arts & History | 0 | 0.0% |
| Visual & Performing Arts | 0 | 0.0% |
| Communications | 0 | 0.0% |
| Arts & Humanities | 20 | 43.5% |
| Total | 46 | 100.0% |
Transportation & Commute in Canyon Day
Vehicle Availability by Sex in Canyon Day
The most prevalent vehicle ownership categories in Canyon Day are males with 3 vehicles (40, accounting for 42.1%) and females with 3 vehicles (68, making up 27.8%).
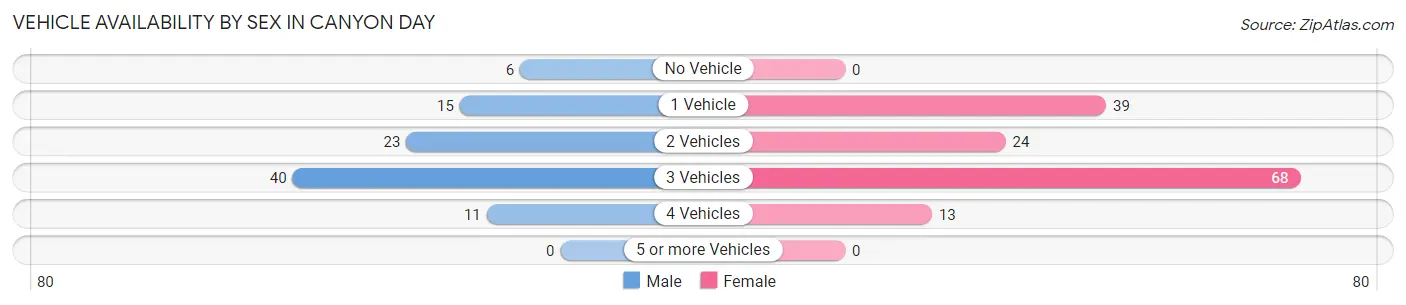
| Vehicles Available | Male | Female |
| No Vehicle | 6 (6.3%) | 0 (0.0%) |
| 1 Vehicle | 15 (15.8%) | 39 (27.1%) |
| 2 Vehicles | 23 (24.2%) | 24 (16.7%) |
| 3 Vehicles | 40 (42.1%) | 68 (47.2%) |
| 4 Vehicles | 11 (11.6%) | 13 (9.0%) |
| 5 or more Vehicles | 0 (0.0%) | 0 (0.0%) |
| Total | 95 (100.0%) | 144 (100.0%) |
Commute Time in Canyon Day
The most frequently occuring commute durations in Canyon Day are 15 to 19 minutes (66 commuters, 29.3%), 10 to 14 minutes (42 commuters, 18.7%), and 5 to 9 minutes (40 commuters, 17.8%).
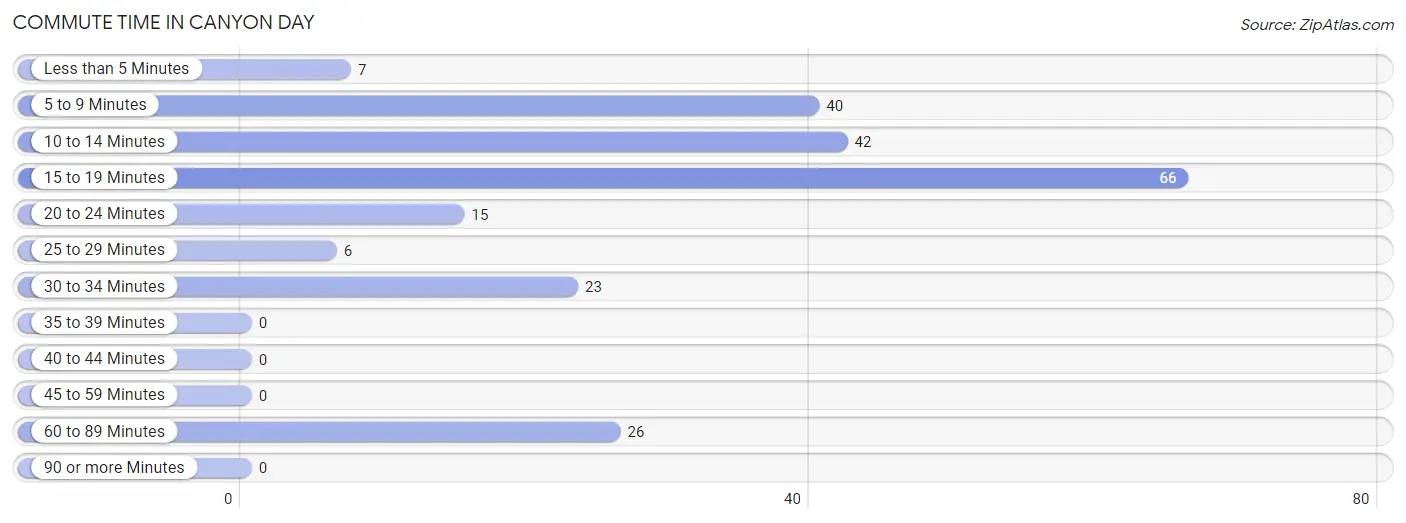
| Commute Time | # Commuters | % Commuters |
| Less than 5 Minutes | 7 | 3.1% |
| 5 to 9 Minutes | 40 | 17.8% |
| 10 to 14 Minutes | 42 | 18.7% |
| 15 to 19 Minutes | 66 | 29.3% |
| 20 to 24 Minutes | 15 | 6.7% |
| 25 to 29 Minutes | 6 | 2.7% |
| 30 to 34 Minutes | 23 | 10.2% |
| 35 to 39 Minutes | 0 | 0.0% |
| 40 to 44 Minutes | 0 | 0.0% |
| 45 to 59 Minutes | 0 | 0.0% |
| 60 to 89 Minutes | 26 | 11.6% |
| 90 or more Minutes | 0 | 0.0% |
Commute Time by Sex in Canyon Day
The most common commute times in Canyon Day are 15 to 19 minutes (34 commuters, 35.8%) for males and 10 to 14 minutes (32 commuters, 24.6%) for females.
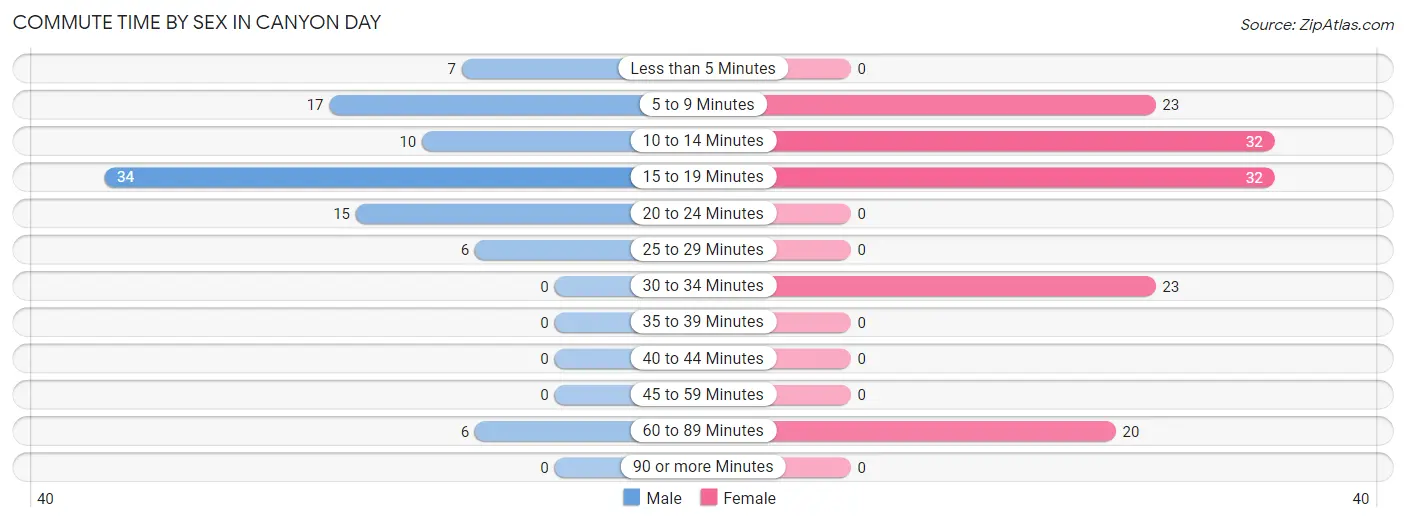
| Commute Time | Male | Female |
| Less than 5 Minutes | 7 (7.4%) | 0 (0.0%) |
| 5 to 9 Minutes | 17 (17.9%) | 23 (17.7%) |
| 10 to 14 Minutes | 10 (10.5%) | 32 (24.6%) |
| 15 to 19 Minutes | 34 (35.8%) | 32 (24.6%) |
| 20 to 24 Minutes | 15 (15.8%) | 0 (0.0%) |
| 25 to 29 Minutes | 6 (6.3%) | 0 (0.0%) |
| 30 to 34 Minutes | 0 (0.0%) | 23 (17.7%) |
| 35 to 39 Minutes | 0 (0.0%) | 0 (0.0%) |
| 40 to 44 Minutes | 0 (0.0%) | 0 (0.0%) |
| 45 to 59 Minutes | 0 (0.0%) | 0 (0.0%) |
| 60 to 89 Minutes | 6 (6.3%) | 20 (15.4%) |
| 90 or more Minutes | 0 (0.0%) | 0 (0.0%) |
Time of Departure to Work by Sex in Canyon Day
The most frequent times of departure to work in Canyon Day are 7:00 AM to 7:29 AM (27, 28.4%) for males and 7:30 AM to 7:59 AM (24, 18.5%) for females.
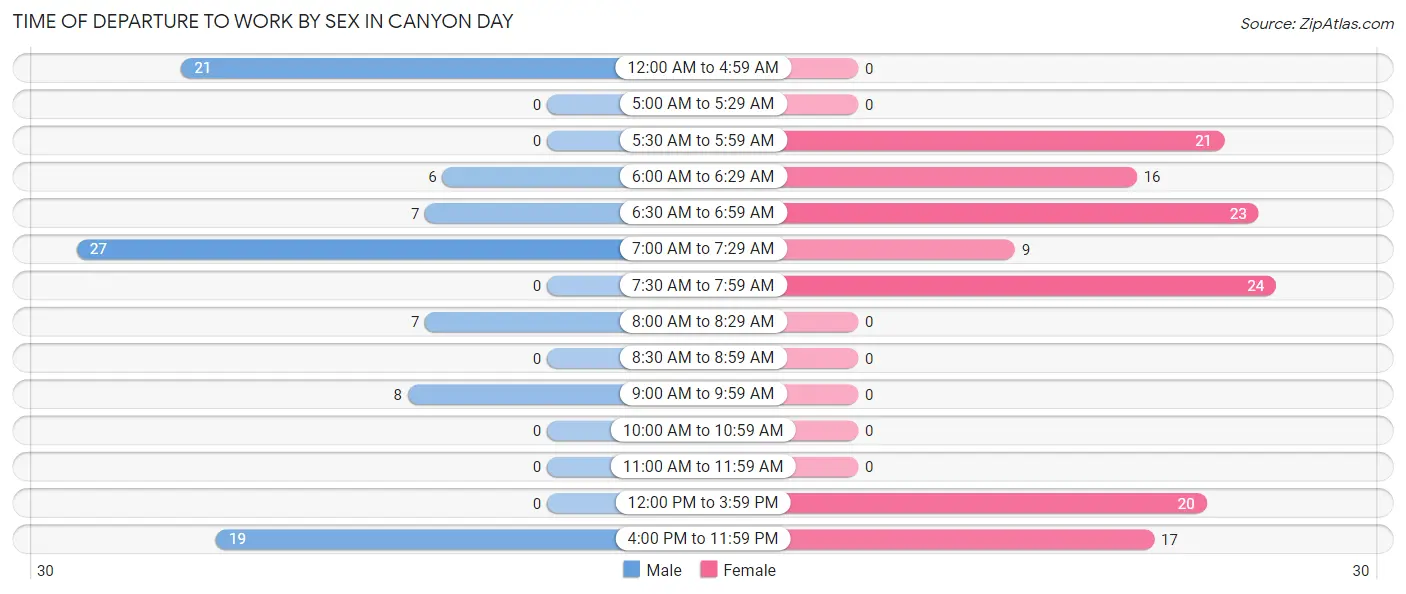
| Time of Departure | Male | Female |
| 12:00 AM to 4:59 AM | 21 (22.1%) | 0 (0.0%) |
| 5:00 AM to 5:29 AM | 0 (0.0%) | 0 (0.0%) |
| 5:30 AM to 5:59 AM | 0 (0.0%) | 21 (16.2%) |
| 6:00 AM to 6:29 AM | 6 (6.3%) | 16 (12.3%) |
| 6:30 AM to 6:59 AM | 7 (7.4%) | 23 (17.7%) |
| 7:00 AM to 7:29 AM | 27 (28.4%) | 9 (6.9%) |
| 7:30 AM to 7:59 AM | 0 (0.0%) | 24 (18.5%) |
| 8:00 AM to 8:29 AM | 7 (7.4%) | 0 (0.0%) |
| 8:30 AM to 8:59 AM | 0 (0.0%) | 0 (0.0%) |
| 9:00 AM to 9:59 AM | 8 (8.4%) | 0 (0.0%) |
| 10:00 AM to 10:59 AM | 0 (0.0%) | 0 (0.0%) |
| 11:00 AM to 11:59 AM | 0 (0.0%) | 0 (0.0%) |
| 12:00 PM to 3:59 PM | 0 (0.0%) | 20 (15.4%) |
| 4:00 PM to 11:59 PM | 19 (20.0%) | 17 (13.1%) |
| Total | 95 (100.0%) | 130 (100.0%) |
Housing Occupancy in Canyon Day
Occupancy by Ownership in Canyon Day
Of the total 310 dwellings in Canyon Day, owner-occupied units account for 190 (61.3%), while renter-occupied units make up 120 (38.7%).
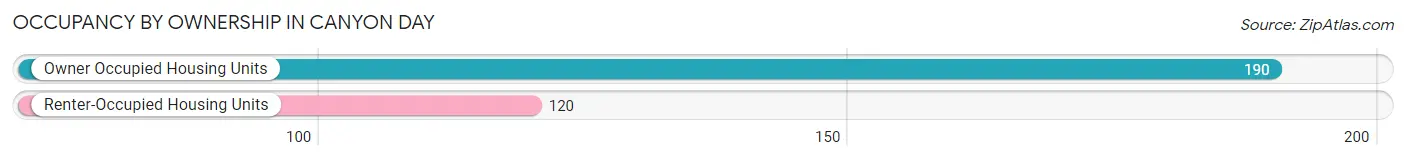
| Occupancy | # Housing Units | % Housing Units |
| Owner Occupied Housing Units | 190 | 61.3% |
| Renter-Occupied Housing Units | 120 | 38.7% |
| Total Occupied Housing Units | 310 | 100.0% |
Occupancy by Household Size in Canyon Day
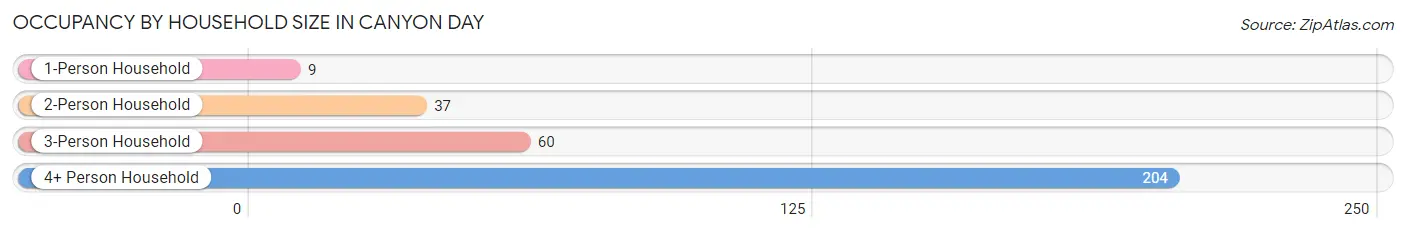
| Household Size | # Housing Units | % Housing Units |
| 1-Person Household | 9 | 2.9% |
| 2-Person Household | 37 | 11.9% |
| 3-Person Household | 60 | 19.4% |
| 4+ Person Household | 204 | 65.8% |
| Total Housing Units | 310 | 100.0% |
Occupancy by Ownership by Household Size in Canyon Day
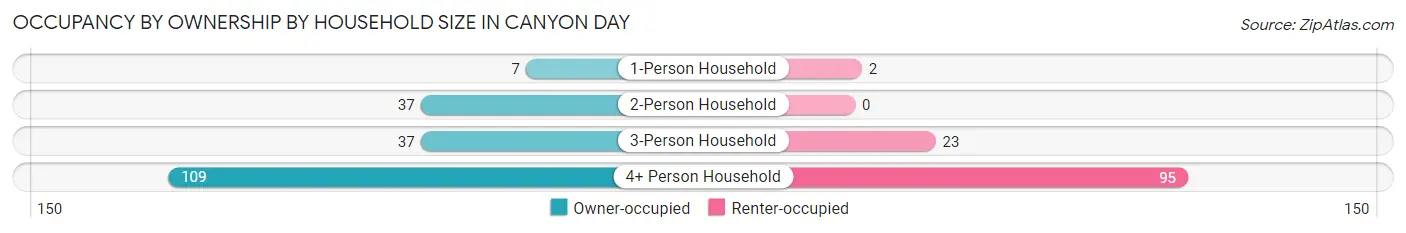
| Household Size | Owner-occupied | Renter-occupied |
| 1-Person Household | 7 (77.8%) | 2 (22.2%) |
| 2-Person Household | 37 (100.0%) | 0 (0.0%) |
| 3-Person Household | 37 (61.7%) | 23 (38.3%) |
| 4+ Person Household | 109 (53.4%) | 95 (46.6%) |
| Total Housing Units | 190 (61.3%) | 120 (38.7%) |
Occupancy by Educational Attainment in Canyon Day
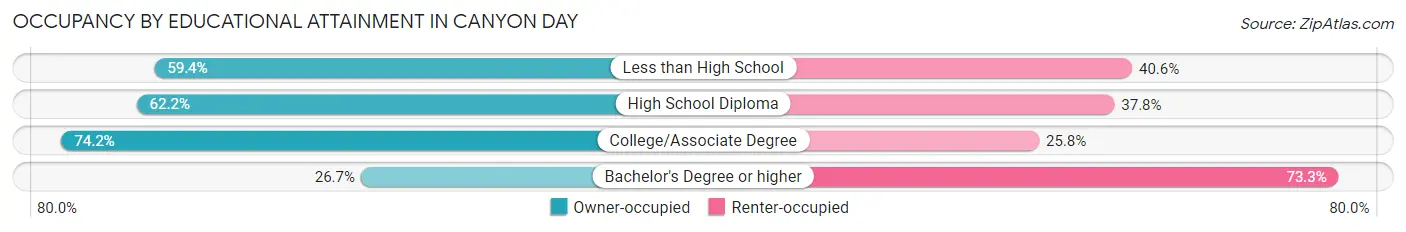
| Household Size | Owner-occupied | Renter-occupied |
| Less than High School | 60 (59.4%) | 41 (40.6%) |
| High School Diploma | 56 (62.2%) | 34 (37.8%) |
| College/Associate Degree | 66 (74.2%) | 23 (25.8%) |
| Bachelor's Degree or higher | 8 (26.7%) | 22 (73.3%) |
Occupancy by Age of Householder in Canyon Day
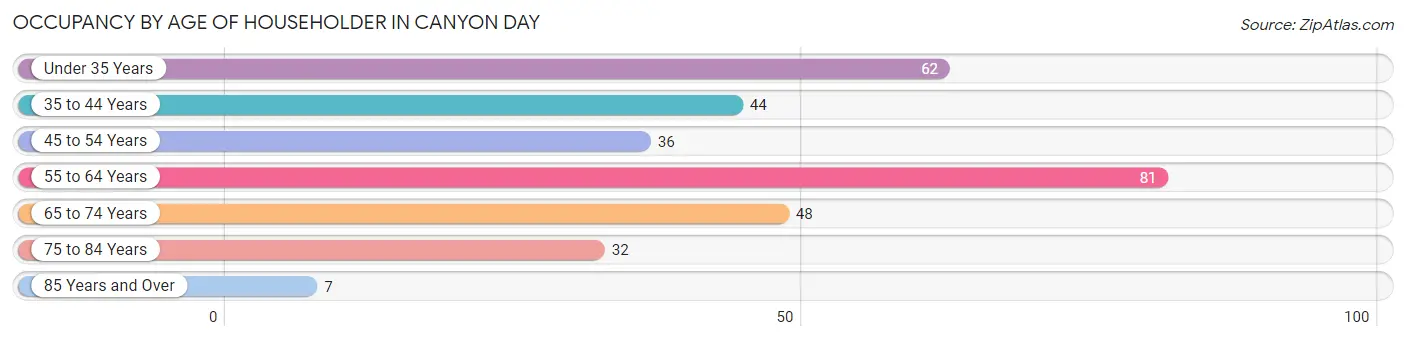
| Age Bracket | # Households | % Households |
| Under 35 Years | 62 | 20.0% |
| 35 to 44 Years | 44 | 14.2% |
| 45 to 54 Years | 36 | 11.6% |
| 55 to 64 Years | 81 | 26.1% |
| 65 to 74 Years | 48 | 15.5% |
| 75 to 84 Years | 32 | 10.3% |
| 85 Years and Over | 7 | 2.3% |
| Total | 310 | 100.0% |
Housing Finances in Canyon Day
Median Income by Occupancy in Canyon Day
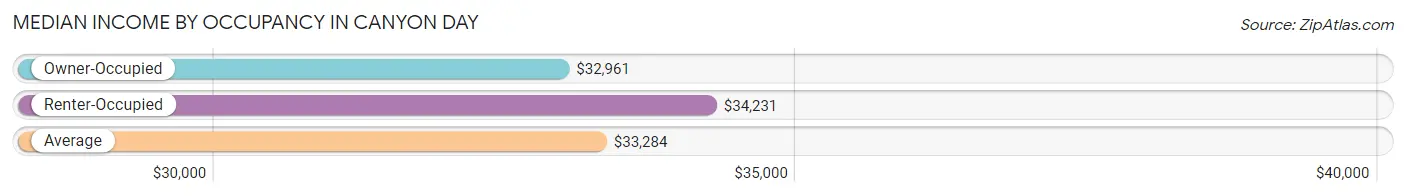
| Occupancy Type | # Households | Median Income |
| Owner-Occupied | 190 (61.3%) | $32,961 |
| Renter-Occupied | 120 (38.7%) | $34,231 |
| Average | 310 (100.0%) | $33,284 |
Occupancy by Householder Income Bracket in Canyon Day
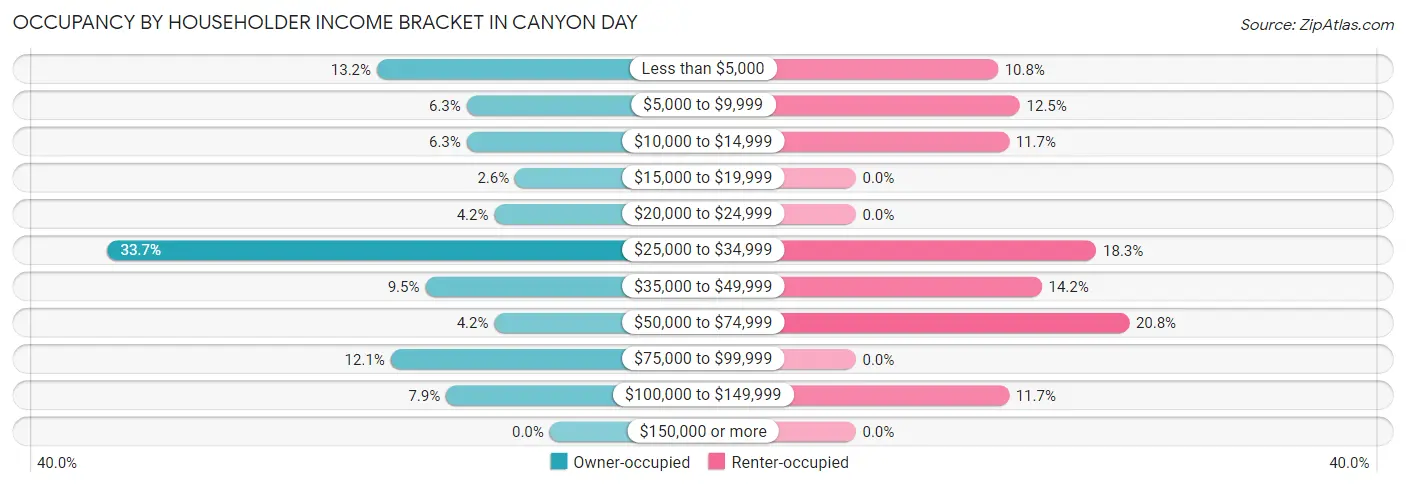
| Income Bracket | Owner-occupied | Renter-occupied |
| Less than $5,000 | 25 (13.2%) | 13 (10.8%) |
| $5,000 to $9,999 | 12 (6.3%) | 15 (12.5%) |
| $10,000 to $14,999 | 12 (6.3%) | 14 (11.7%) |
| $15,000 to $19,999 | 5 (2.6%) | 0 (0.0%) |
| $20,000 to $24,999 | 8 (4.2%) | 0 (0.0%) |
| $25,000 to $34,999 | 64 (33.7%) | 22 (18.3%) |
| $35,000 to $49,999 | 18 (9.5%) | 17 (14.2%) |
| $50,000 to $74,999 | 8 (4.2%) | 25 (20.8%) |
| $75,000 to $99,999 | 23 (12.1%) | 0 (0.0%) |
| $100,000 to $149,999 | 15 (7.9%) | 14 (11.7%) |
| $150,000 or more | 0 (0.0%) | 0 (0.0%) |
| Total | 190 (100.0%) | 120 (100.0%) |
Monthly Housing Cost Tiers in Canyon Day
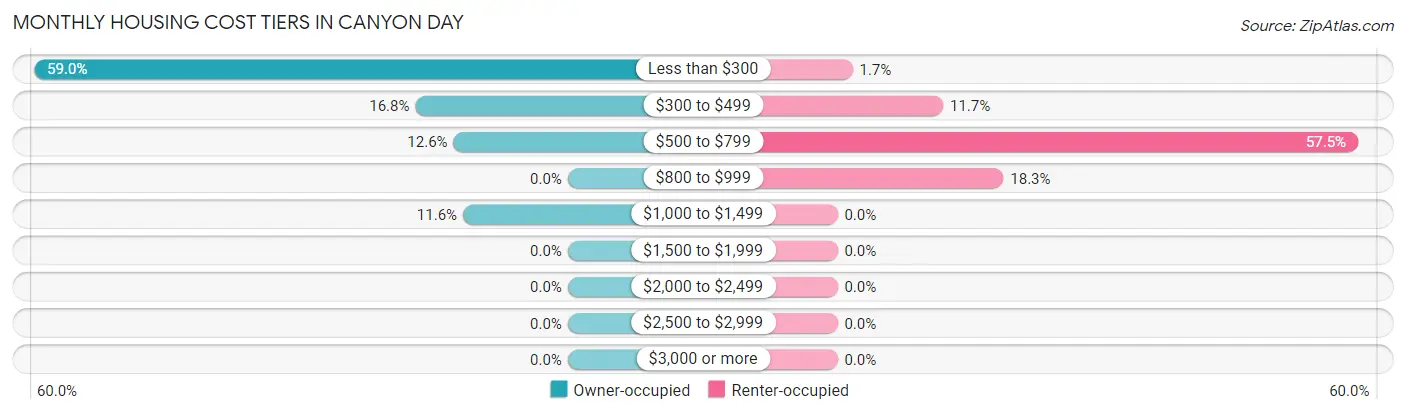
| Monthly Cost | Owner-occupied | Renter-occupied |
| Less than $300 | 112 (59.0%) | 2 (1.7%) |
| $300 to $499 | 32 (16.8%) | 14 (11.7%) |
| $500 to $799 | 24 (12.6%) | 69 (57.5%) |
| $800 to $999 | 0 (0.0%) | 22 (18.3%) |
| $1,000 to $1,499 | 22 (11.6%) | 0 (0.0%) |
| $1,500 to $1,999 | 0 (0.0%) | 0 (0.0%) |
| $2,000 to $2,499 | 0 (0.0%) | 0 (0.0%) |
| $2,500 to $2,999 | 0 (0.0%) | 0 (0.0%) |
| $3,000 or more | 0 (0.0%) | 0 (0.0%) |
| Total | 190 (100.0%) | 120 (100.0%) |
Physical Housing Characteristics in Canyon Day
Housing Structures in Canyon Day
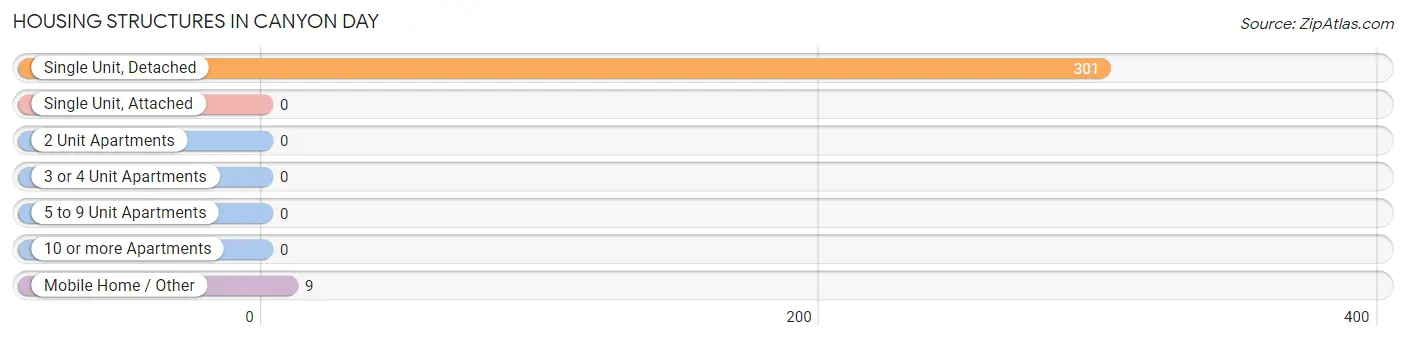
| Structure Type | # Housing Units | % Housing Units |
| Single Unit, Detached | 301 | 97.1% |
| Single Unit, Attached | 0 | 0.0% |
| 2 Unit Apartments | 0 | 0.0% |
| 3 or 4 Unit Apartments | 0 | 0.0% |
| 5 to 9 Unit Apartments | 0 | 0.0% |
| 10 or more Apartments | 0 | 0.0% |
| Mobile Home / Other | 9 | 2.9% |
| Total | 310 | 100.0% |
Housing Structures by Occupancy in Canyon Day
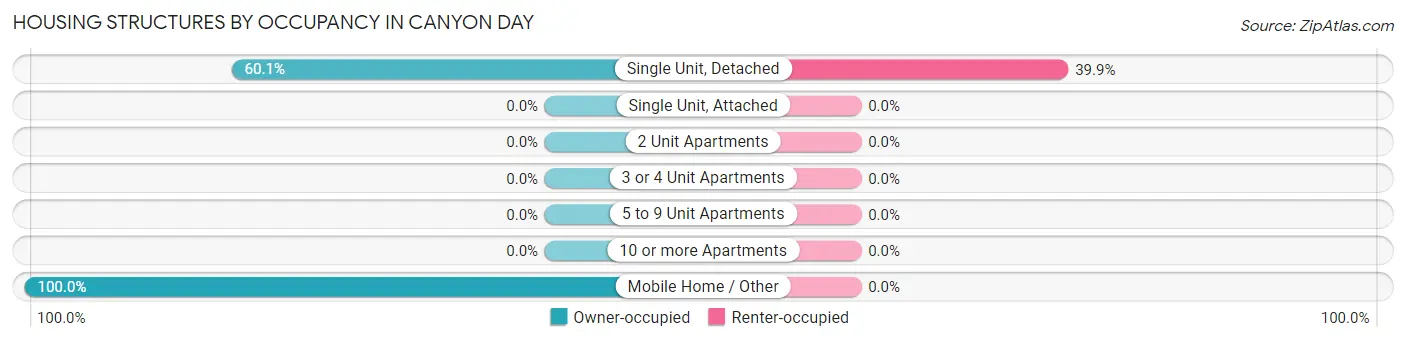
| Structure Type | Owner-occupied | Renter-occupied |
| Single Unit, Detached | 181 (60.1%) | 120 (39.9%) |
| Single Unit, Attached | 0 (0.0%) | 0 (0.0%) |
| 2 Unit Apartments | 0 (0.0%) | 0 (0.0%) |
| 3 or 4 Unit Apartments | 0 (0.0%) | 0 (0.0%) |
| 5 to 9 Unit Apartments | 0 (0.0%) | 0 (0.0%) |
| 10 or more Apartments | 0 (0.0%) | 0 (0.0%) |
| Mobile Home / Other | 9 (100.0%) | 0 (0.0%) |
| Total | 190 (61.3%) | 120 (38.7%) |
Housing Structures by Number of Rooms in Canyon Day
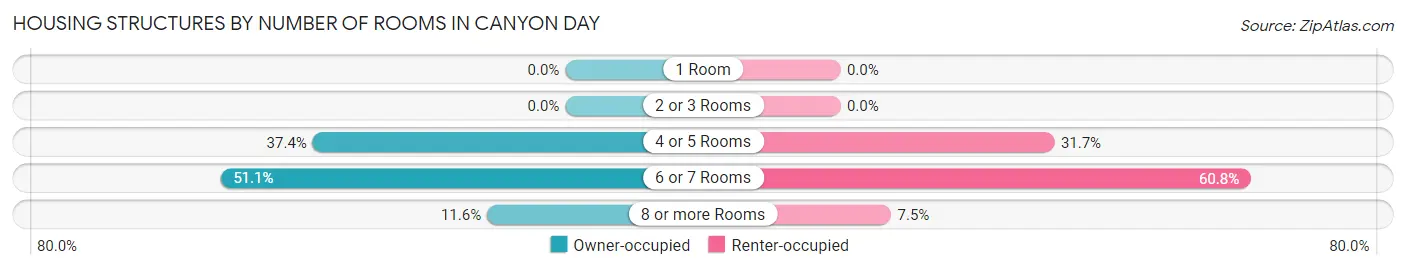
| Number of Rooms | Owner-occupied | Renter-occupied |
| 1 Room | 0 (0.0%) | 0 (0.0%) |
| 2 or 3 Rooms | 0 (0.0%) | 0 (0.0%) |
| 4 or 5 Rooms | 71 (37.4%) | 38 (31.7%) |
| 6 or 7 Rooms | 97 (51.0%) | 73 (60.8%) |
| 8 or more Rooms | 22 (11.6%) | 9 (7.5%) |
| Total | 190 (100.0%) | 120 (100.0%) |
Housing Structure by Heating Type in Canyon Day
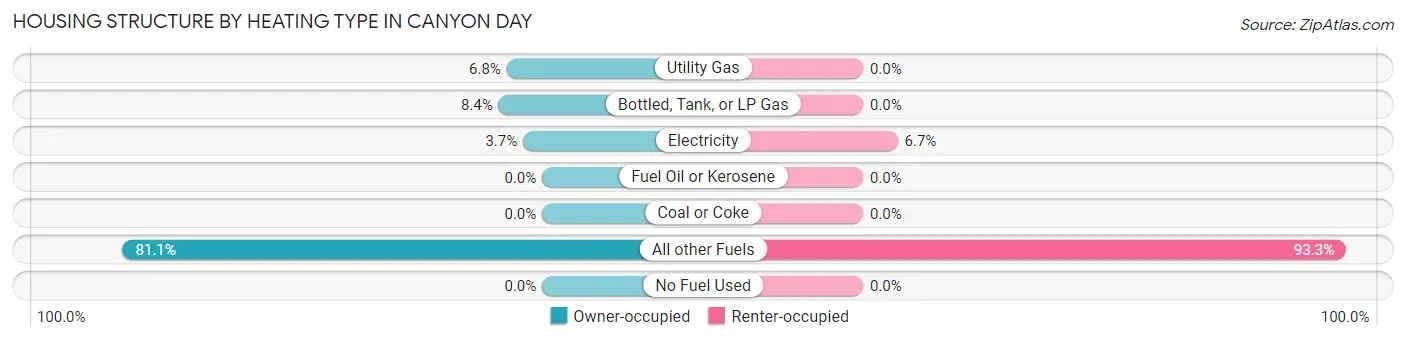
| Heating Type | Owner-occupied | Renter-occupied |
| Utility Gas | 13 (6.8%) | 0 (0.0%) |
| Bottled, Tank, or LP Gas | 16 (8.4%) | 0 (0.0%) |
| Electricity | 7 (3.7%) | 8 (6.7%) |
| Fuel Oil or Kerosene | 0 (0.0%) | 0 (0.0%) |
| Coal or Coke | 0 (0.0%) | 0 (0.0%) |
| All other Fuels | 154 (81.0%) | 112 (93.3%) |
| No Fuel Used | 0 (0.0%) | 0 (0.0%) |
| Total | 190 (100.0%) | 120 (100.0%) |
Household Vehicle Usage in Canyon Day
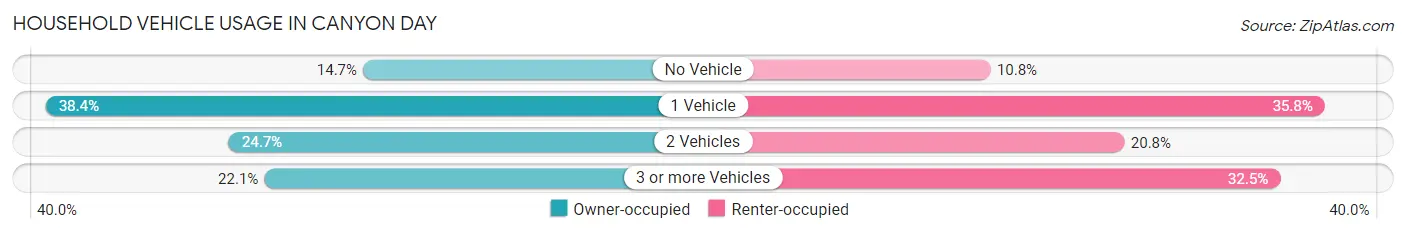
| Vehicles per Household | Owner-occupied | Renter-occupied |
| No Vehicle | 28 (14.7%) | 13 (10.8%) |
| 1 Vehicle | 73 (38.4%) | 43 (35.8%) |
| 2 Vehicles | 47 (24.7%) | 25 (20.8%) |
| 3 or more Vehicles | 42 (22.1%) | 39 (32.5%) |
| Total | 190 (100.0%) | 120 (100.0%) |
Real Estate & Mortgages in Canyon Day
Real Estate and Mortgage Overview in Canyon Day
| Characteristic | Without Mortgage | With Mortgage |
| Housing Units | 166 | 24 |
| Median Property Value | $74,400 | $0 |
| Median Household Income | $32,759 | $0 |
| Monthly Housing Costs | $250 | $0 |
| Real Estate Taxes | - | - |
Property Value by Mortgage Status in Canyon Day
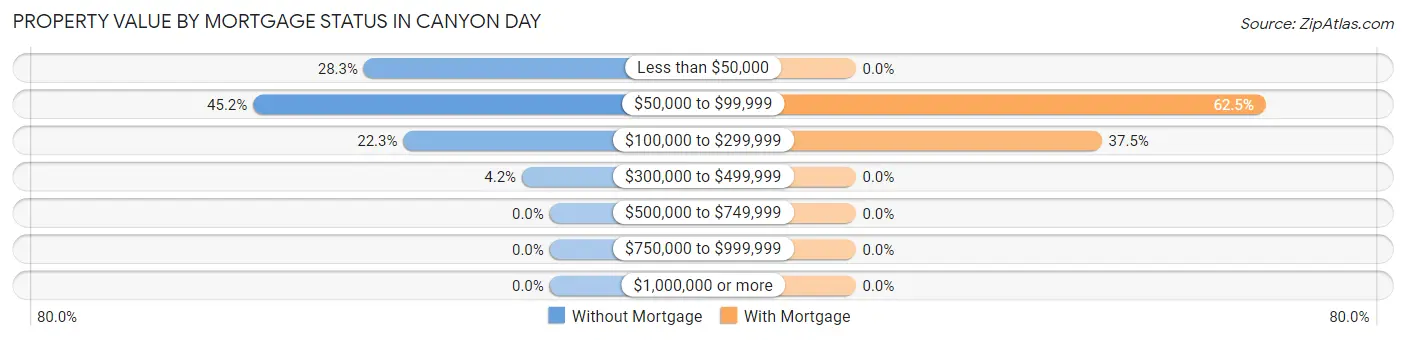
| Property Value | Without Mortgage | With Mortgage |
| Less than $50,000 | 47 (28.3%) | 0 (0.0%) |
| $50,000 to $99,999 | 75 (45.2%) | 15 (62.5%) |
| $100,000 to $299,999 | 37 (22.3%) | 9 (37.5%) |
| $300,000 to $499,999 | 7 (4.2%) | 0 (0.0%) |
| $500,000 to $749,999 | 0 (0.0%) | 0 (0.0%) |
| $750,000 to $999,999 | 0 (0.0%) | 0 (0.0%) |
| $1,000,000 or more | 0 (0.0%) | 0 (0.0%) |
| Total | 166 (100.0%) | 24 (100.0%) |
Household Income by Mortgage Status in Canyon Day
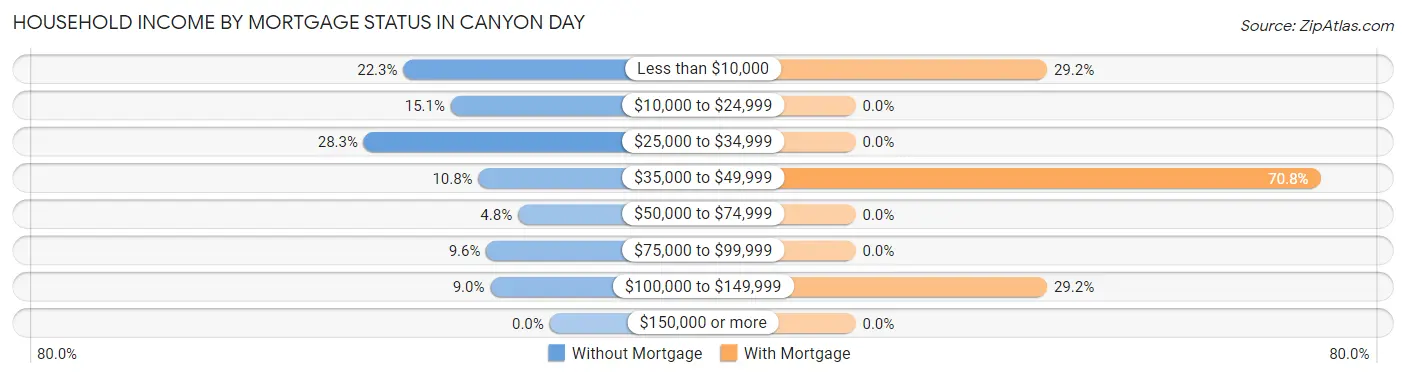
| Household Income | Without Mortgage | With Mortgage |
| Less than $10,000 | 37 (22.3%) | 7 (29.2%) |
| $10,000 to $24,999 | 25 (15.1%) | 0 (0.0%) |
| $25,000 to $34,999 | 47 (28.3%) | 0 (0.0%) |
| $35,000 to $49,999 | 18 (10.8%) | 17 (70.8%) |
| $50,000 to $74,999 | 8 (4.8%) | 0 (0.0%) |
| $75,000 to $99,999 | 16 (9.6%) | 0 (0.0%) |
| $100,000 to $149,999 | 15 (9.0%) | 7 (29.2%) |
| $150,000 or more | 0 (0.0%) | 0 (0.0%) |
| Total | 166 (100.0%) | 24 (100.0%) |
Property Value to Household Income Ratio in Canyon Day
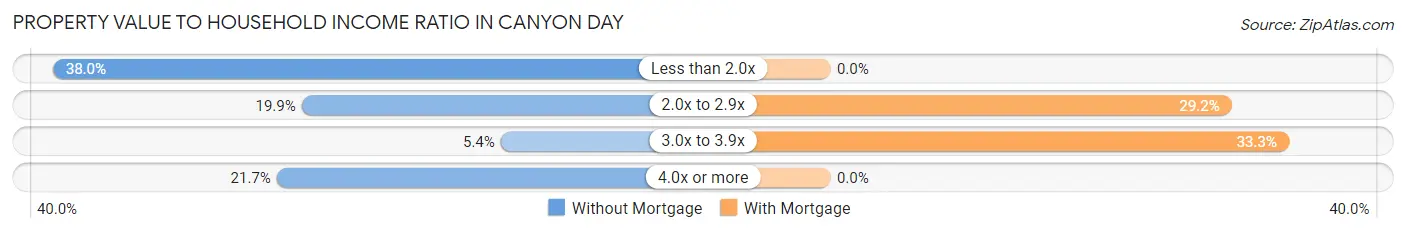
| Value-to-Income Ratio | Without Mortgage | With Mortgage |
| Less than 2.0x | 63 (38.0%) | 0 (0.0%) |
| 2.0x to 2.9x | 33 (19.9%) | 7 (29.2%) |
| 3.0x to 3.9x | 9 (5.4%) | 8 (33.3%) |
| 4.0x or more | 36 (21.7%) | 0 (0.0%) |
| Total | 166 (100.0%) | 24 (100.0%) |
Real Estate Taxes by Mortgage Status in Canyon Day
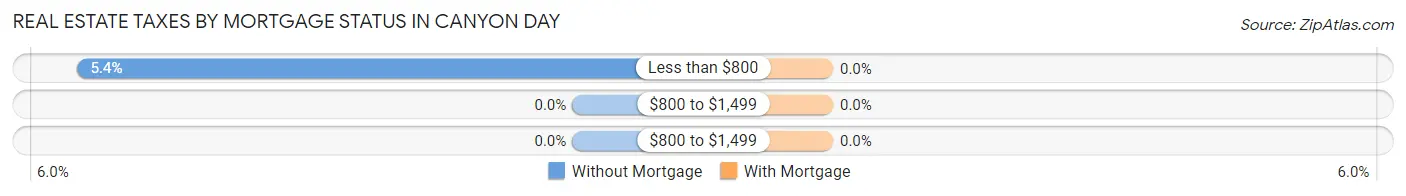
| Property Taxes | Without Mortgage | With Mortgage |
| Less than $800 | 9 (5.4%) | 0 (0.0%) |
| $800 to $1,499 | 0 (0.0%) | 0 (0.0%) |
| $800 to $1,499 | 0 (0.0%) | 0 (0.0%) |
| Total | 166 (100.0%) | 24 (100.0%) |
Health & Disability in Canyon Day
Health Insurance Coverage by Age in Canyon Day
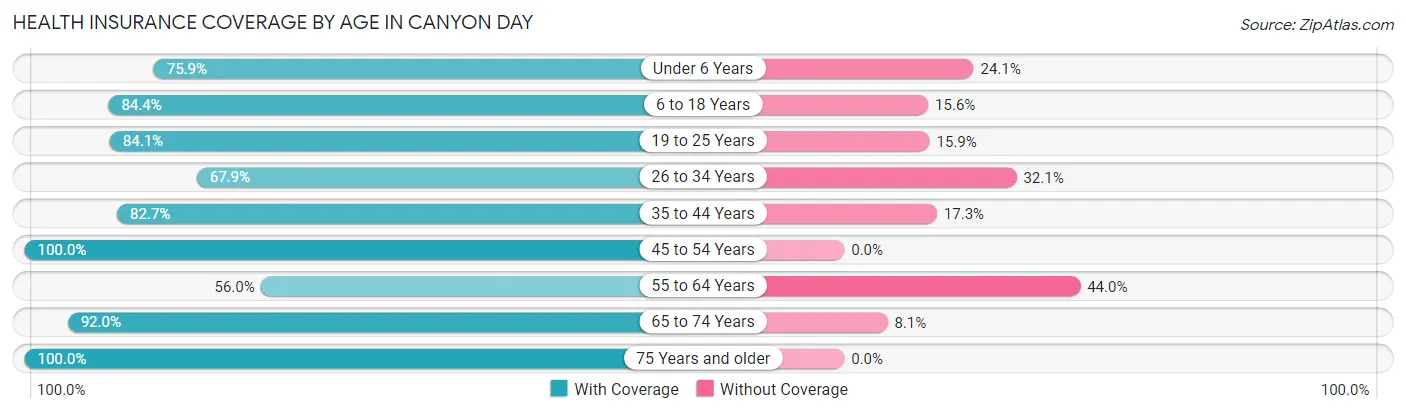
| Age Bracket | With Coverage | Without Coverage |
| Under 6 Years | 211 (75.9%) | 67 (24.1%) |
| 6 to 18 Years | 437 (84.4%) | 81 (15.6%) |
| 19 to 25 Years | 74 (84.1%) | 14 (15.9%) |
| 26 to 34 Years | 167 (67.9%) | 79 (32.1%) |
| 35 to 44 Years | 91 (82.7%) | 19 (17.3%) |
| 45 to 54 Years | 80 (100.0%) | 0 (0.0%) |
| 55 to 64 Years | 84 (56.0%) | 66 (44.0%) |
| 65 to 74 Years | 80 (91.9%) | 7 (8.1%) |
| 75 Years and older | 64 (100.0%) | 0 (0.0%) |
| Total | 1,288 (79.5%) | 333 (20.5%) |
Health Insurance Coverage by Citizenship Status in Canyon Day
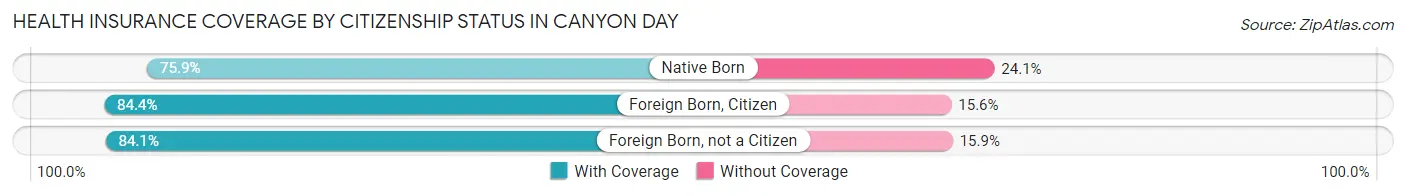
| Citizenship Status | With Coverage | Without Coverage |
| Native Born | 211 (75.9%) | 67 (24.1%) |
| Foreign Born, Citizen | 437 (84.4%) | 81 (15.6%) |
| Foreign Born, not a Citizen | 74 (84.1%) | 14 (15.9%) |
Health Insurance Coverage by Household Income in Canyon Day
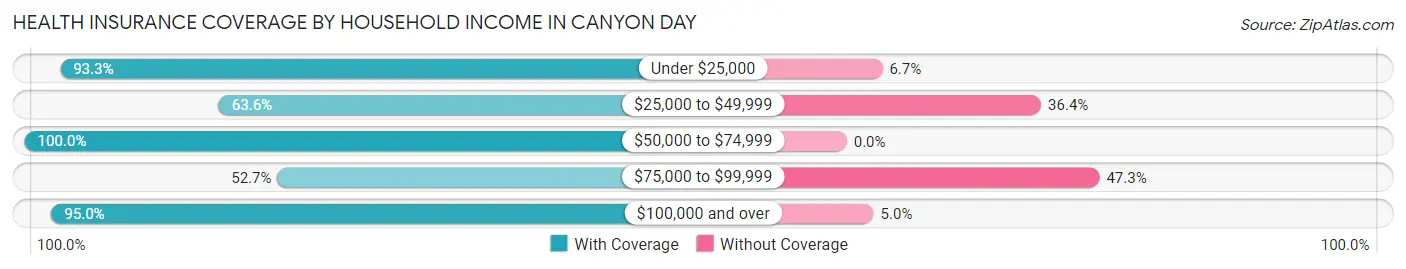
| Household Income | With Coverage | Without Coverage |
| Under $25,000 | 377 (93.3%) | 27 (6.7%) |
| $25,000 to $49,999 | 365 (63.6%) | 209 (36.4%) |
| $50,000 to $74,999 | 136 (100.0%) | 0 (0.0%) |
| $75,000 to $99,999 | 89 (52.7%) | 80 (47.3%) |
| $100,000 and over | 321 (95.0%) | 17 (5.0%) |
Public vs Private Health Insurance Coverage by Age in Canyon Day
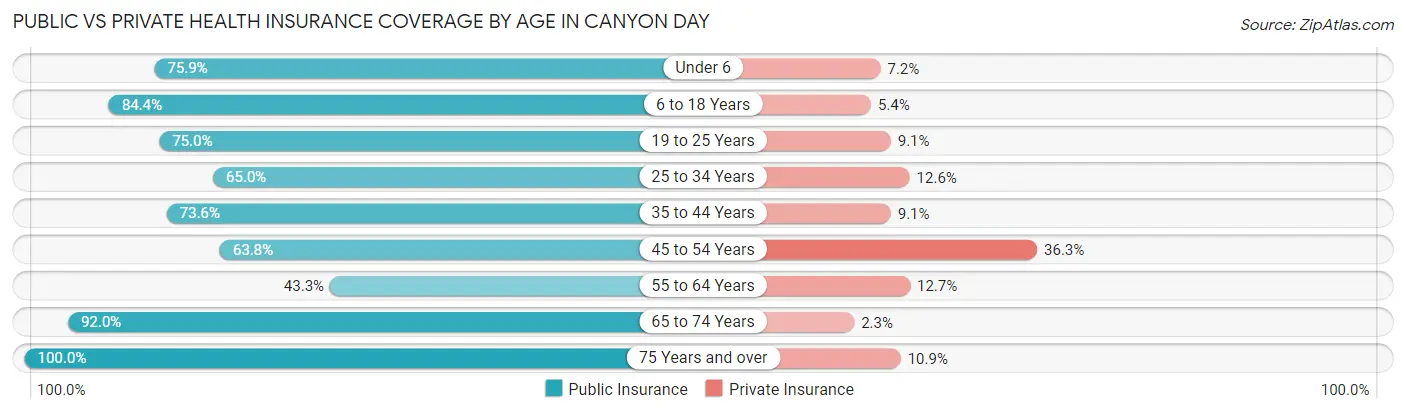
| Age Bracket | Public Insurance | Private Insurance |
| Under 6 | 211 (75.9%) | 20 (7.2%) |
| 6 to 18 Years | 437 (84.4%) | 28 (5.4%) |
| 19 to 25 Years | 66 (75.0%) | 8 (9.1%) |
| 25 to 34 Years | 160 (65.0%) | 31 (12.6%) |
| 35 to 44 Years | 81 (73.6%) | 10 (9.1%) |
| 45 to 54 Years | 51 (63.7%) | 29 (36.2%) |
| 55 to 64 Years | 65 (43.3%) | 19 (12.7%) |
| 65 to 74 Years | 80 (91.9%) | 2 (2.3%) |
| 75 Years and over | 64 (100.0%) | 7 (10.9%) |
| Total | 1,215 (75.0%) | 154 (9.5%) |
Disability Status by Sex by Age in Canyon Day
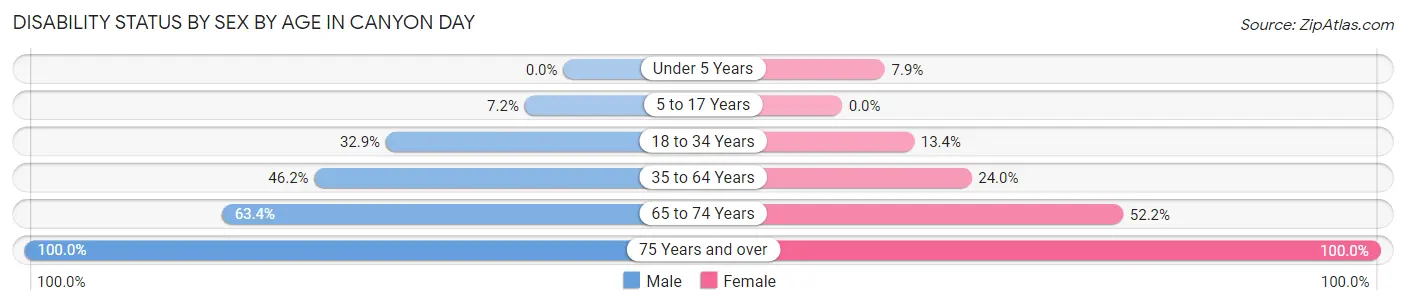
| Age Bracket | Male | Female |
| Under 5 Years | 0 (0.0%) | 10 (7.9%) |
| 5 to 17 Years | 23 (7.2%) | 0 (0.0%) |
| 18 to 34 Years | 55 (32.9%) | 25 (13.4%) |
| 35 to 64 Years | 61 (46.2%) | 50 (24.0%) |
| 65 to 74 Years | 26 (63.4%) | 24 (52.2%) |
| 75 Years and over | 47 (100.0%) | 17 (100.0%) |
Disability Class by Sex by Age in Canyon Day
Disability Class: Hearing Difficulty
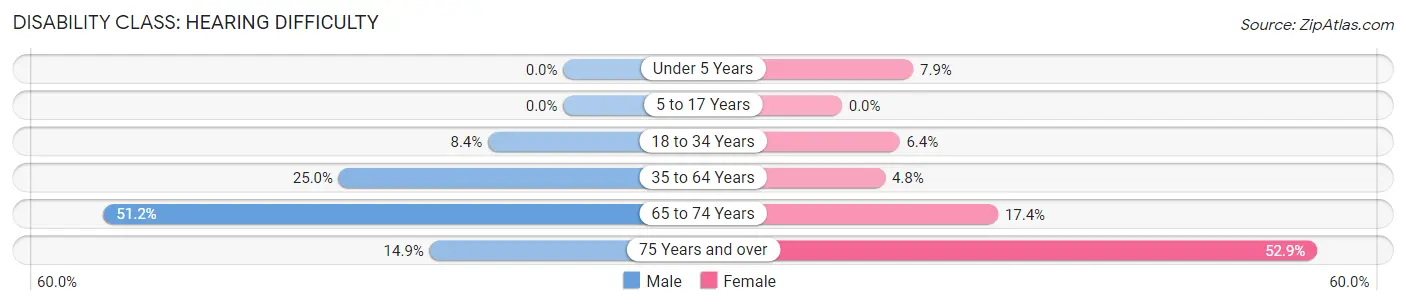
| Age Bracket | Male | Female |
| Under 5 Years | 0 (0.0%) | 10 (7.9%) |
| 5 to 17 Years | 0 (0.0%) | 0 (0.0%) |
| 18 to 34 Years | 14 (8.4%) | 12 (6.4%) |
| 35 to 64 Years | 33 (25.0%) | 10 (4.8%) |
| 65 to 74 Years | 21 (51.2%) | 8 (17.4%) |
| 75 Years and over | 7 (14.9%) | 9 (52.9%) |
Disability Class: Vision Difficulty
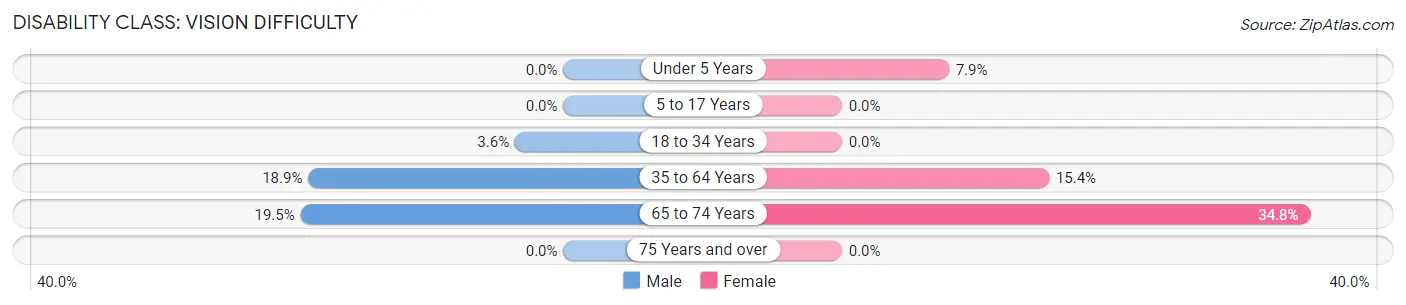
| Age Bracket | Male | Female |
| Under 5 Years | 0 (0.0%) | 10 (7.9%) |
| 5 to 17 Years | 0 (0.0%) | 0 (0.0%) |
| 18 to 34 Years | 6 (3.6%) | 0 (0.0%) |
| 35 to 64 Years | 25 (18.9%) | 32 (15.4%) |
| 65 to 74 Years | 8 (19.5%) | 16 (34.8%) |
| 75 Years and over | 0 (0.0%) | 0 (0.0%) |
Disability Class: Cognitive Difficulty
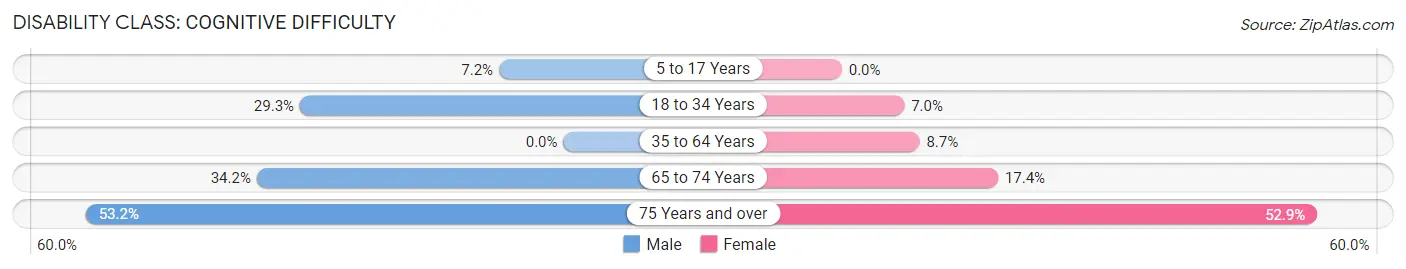
| Age Bracket | Male | Female |
| 5 to 17 Years | 23 (7.2%) | 0 (0.0%) |
| 18 to 34 Years | 49 (29.3%) | 13 (7.0%) |
| 35 to 64 Years | 0 (0.0%) | 18 (8.6%) |
| 65 to 74 Years | 14 (34.2%) | 8 (17.4%) |
| 75 Years and over | 25 (53.2%) | 9 (52.9%) |
Disability Class: Ambulatory Difficulty
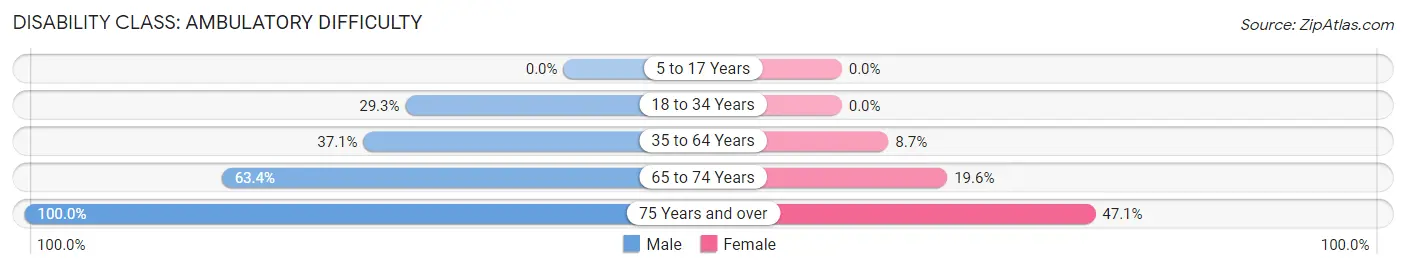
| Age Bracket | Male | Female |
| 5 to 17 Years | 0 (0.0%) | 0 (0.0%) |
| 18 to 34 Years | 49 (29.3%) | 0 (0.0%) |
| 35 to 64 Years | 49 (37.1%) | 18 (8.6%) |
| 65 to 74 Years | 26 (63.4%) | 9 (19.6%) |
| 75 Years and over | 47 (100.0%) | 8 (47.1%) |
Disability Class: Self-Care Difficulty
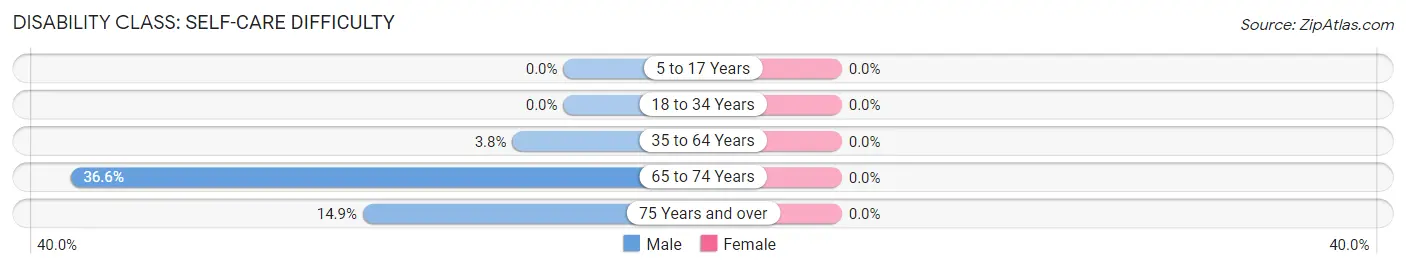
| Age Bracket | Male | Female |
| 5 to 17 Years | 0 (0.0%) | 0 (0.0%) |
| 18 to 34 Years | 0 (0.0%) | 0 (0.0%) |
| 35 to 64 Years | 5 (3.8%) | 0 (0.0%) |
| 65 to 74 Years | 15 (36.6%) | 0 (0.0%) |
| 75 Years and over | 7 (14.9%) | 0 (0.0%) |
Technology Access in Canyon Day
Computing Device Access in Canyon Day
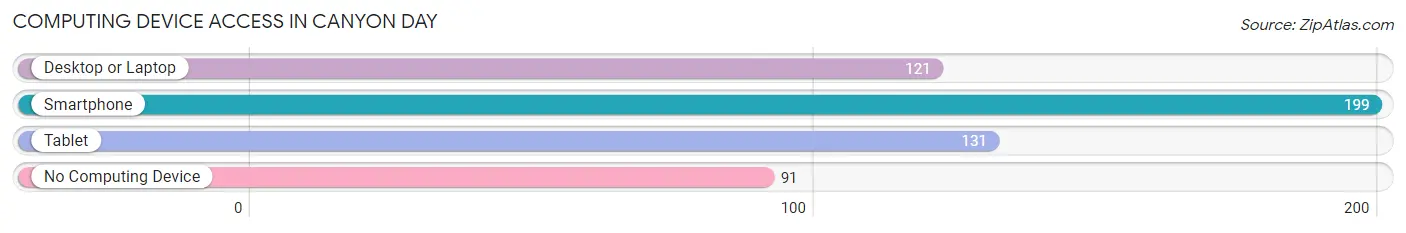
| Device Type | # Households | % Households |
| Desktop or Laptop | 121 | 39.0% |
| Smartphone | 199 | 64.2% |
| Tablet | 131 | 42.3% |
| No Computing Device | 91 | 29.3% |
| Total | 310 | 100.0% |
Internet Access in Canyon Day
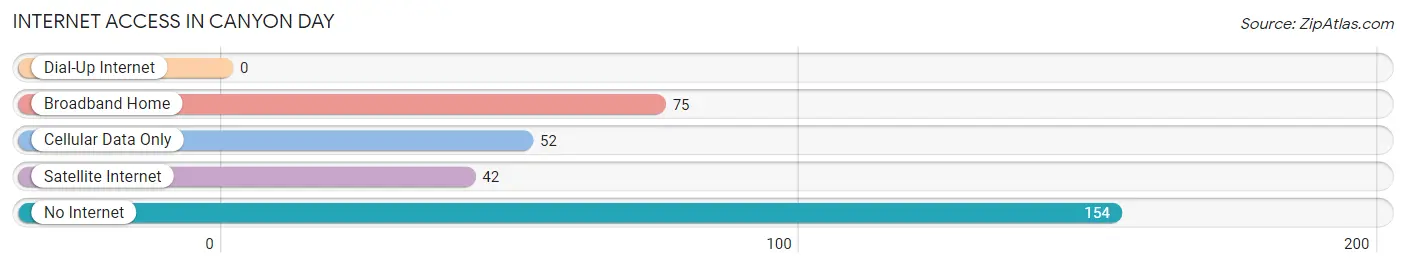
| Internet Type | # Households | % Households |
| Dial-Up Internet | 0 | 0.0% |
| Broadband Home | 75 | 24.2% |
| Cellular Data Only | 52 | 16.8% |
| Satellite Internet | 42 | 13.6% |
| No Internet | 154 | 49.7% |
| Total | 310 | 100.0% |
Canyon Day Summary
Canyon Day is a small unincorporated community located in Coconino County, Arizona. It is situated in the Coconino National Forest, approximately 25 miles south of Flagstaff. The community is located along the Mogollon Rim, a prominent escarpment that marks the southern edge of the Colorado Plateau. The area is known for its spectacular views of the surrounding canyons and mountains.
History
The area around Canyon Day has been inhabited for thousands of years by the ancestral Puebloan people. The first European settlers arrived in the late 19th century, and the community was established in the early 20th century. The town was named after a nearby canyon, which was named after a local rancher, John Day.
The town was originally a small farming and ranching community, but it has since become a popular tourist destination. The area is known for its spectacular views of the surrounding canyons and mountains, and it is a popular spot for camping, hiking, and fishing.
Geography
Canyon Day is located in Coconino County, Arizona, approximately 25 miles south of Flagstaff. The community is situated in the Coconino National Forest, along the Mogollon Rim. The area is characterized by its rugged terrain, with steep canyons and mountains. The climate is semi-arid, with hot summers and cold winters.
Economy
The economy of Canyon Day is largely based on tourism. The area is a popular destination for camping, hiking, and fishing, and it is also home to several resorts and lodges. The town also has a few small businesses, including a general store and a gas station.
Demographics
As of the 2010 census, the population of Canyon Day was 545. The racial makeup of the town was 95.3% White, 0.7% Native American, 0.2% Asian, 0.2% from other races, and 3.6% from two or more races. The median household income was $37,500, and the median family income was $41,250.
Conclusion
Canyon Day is a small unincorporated community located in Coconino County, Arizona. It is situated in the Coconino National Forest, along the Mogollon Rim. The area is known for its spectacular views of the surrounding canyons and mountains, and it is a popular spot for camping, hiking, and fishing. The economy of Canyon Day is largely based on tourism, and the town has a population of 545 as of the 2010 census.
Common Questions
What is Per Capita Income in Canyon Day?
Per Capita income in Canyon Day is $8,398.
What is the Median Family Income in Canyon Day?
Median Family Income in Canyon Day is $29,792.
What is the Median Household income in Canyon Day?
Median Household Income in Canyon Day is $33,284.
What is Income or Wage Gap in Canyon Day?
Income or Wage Gap in Canyon Day is 57.4%.
Women in Canyon Day earn 42.6 cents for every dollar earned by a man.
What is Family Income Deficit in Canyon Day?
Family Income Deficit in Canyon Day is $17,213.
Families that are below poverty line in Canyon Day earn $17,213 less on average than the poverty threshold level.
What is Inequality or Gini Index in Canyon Day?
Inequality or Gini Index in Canyon Day is 0.47.
What is the Total Population of Canyon Day?
Total Population of Canyon Day is 1,621.
What is the Total Male Population of Canyon Day?
Total Male Population of Canyon Day is 831.
What is the Total Female Population of Canyon Day?
Total Female Population of Canyon Day is 790.
What is the Ratio of Males per 100 Females in Canyon Day?
There are 105.19 Males per 100 Females in Canyon Day.
What is the Ratio of Females per 100 Males in Canyon Day?
There are 95.07 Females per 100 Males in Canyon Day.
What is the Median Population Age in Canyon Day?
Median Population Age in Canyon Day is 20.3 Years.
What is the Average Family Size in Canyon Day
Average Family Size in Canyon Day is 5.2 People.
What is the Average Household Size in Canyon Day
Average Household Size in Canyon Day is 5.2 People.
How Large is the Labor Force in Canyon Day?
There are 275 People in the Labor Forcein in Canyon Day.
What is the Percentage of People in the Labor Force in Canyon Day?
29.8% of People are in the Labor Force in Canyon Day.
What is the Unemployment Rate in Canyon Day?
Unemployment Rate in Canyon Day is 13.1%.