Three Points, AZ Map & Demographics
Three Points Map
Three Points Overview
$25,963
PER CAPITA INCOME
$67,790
AVG FAMILY INCOME
$55,074
AVG HOUSEHOLD INCOME
1.6%
WAGE / INCOME GAP [ % ]
98.4¢/ $1
WAGE / INCOME GAP [ $ ]
0.42
INEQUALITY / GINI INDEX
5,100
TOTAL POPULATION
2,810
MALE POPULATION
2,290
FEMALE POPULATION
122.71
MALES / 100 FEMALES
81.49
FEMALES / 100 MALES
41.3
MEDIAN AGE
3.4
AVG FAMILY SIZE
2.6
AVG HOUSEHOLD SIZE
1,596
LABOR FORCE [ PEOPLE ]
40.1%
PERCENT IN LABOR FORCE
4.9%
UNEMPLOYMENT RATE
Income in Three Points
Income Overview in Three Points
Per Capita Income in Three Points is $25,963, while median incomes of families and households are $67,790 and $55,074 respectively.
| Characteristic | Number | Measure |
| Per Capita Income | 5,100 | $25,963 |
| Median Family Income | 1,220 | $67,790 |
| Mean Family Income | 1,220 | $79,454 |
| Median Household Income | 1,975 | $55,074 |
| Mean Household Income | 1,975 | $65,885 |
| Income Deficit | 1,220 | $0 |
| Wage / Income Gap (%) | 5,100 | 1.55% |
| Wage / Income Gap ($) | 5,100 | 98.45¢ per $1 |
| Gini / Inequality Index | 5,100 | 0.42 |
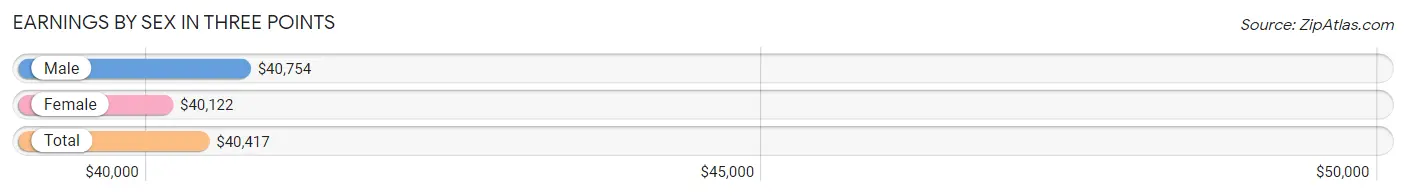
Earnings by Sex in Three Points
Average Earnings in Three Points are $40,417, $40,754 for men and $40,122 for women, a difference of 1.5%.
| Sex | Number | Average Earnings |
| Male | 1,078 (60.7%) | $40,754 |
| Female | 699 (39.3%) | $40,122 |
| Total | 1,777 (100.0%) | $40,417 |
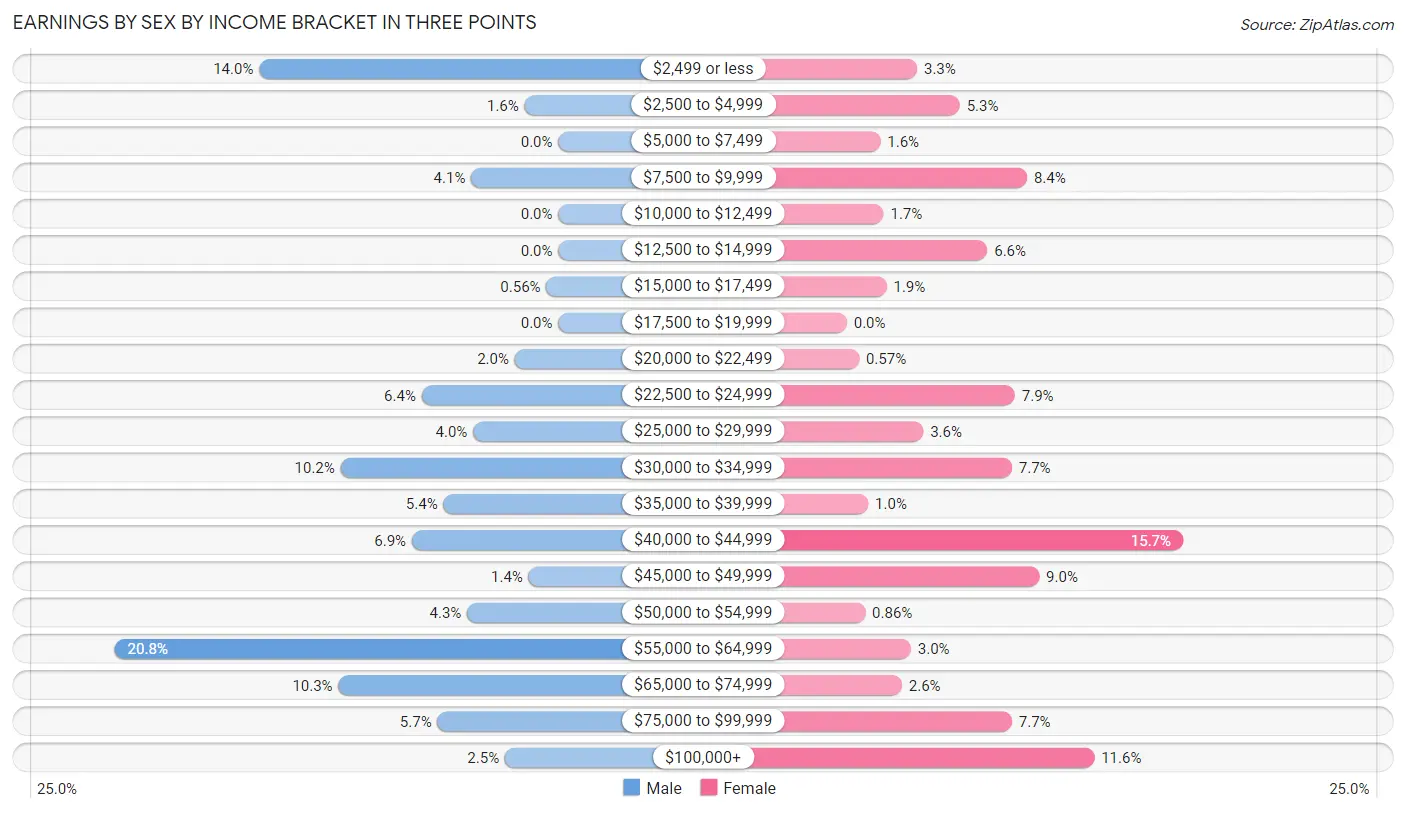
Earnings by Sex by Income Bracket in Three Points
The most common earnings brackets in Three Points are $55,000 to $64,999 for men (224 | 20.8%) and $40,000 to $44,999 for women (110 | 15.7%).
| Income | Male | Female |
| $2,499 or less | 151 (14.0%) | 23 (3.3%) |
| $2,500 to $4,999 | 17 (1.6%) | 37 (5.3%) |
| $5,000 to $7,499 | 0 (0.0%) | 11 (1.6%) |
| $7,500 to $9,999 | 44 (4.1%) | 59 (8.4%) |
| $10,000 to $12,499 | 0 (0.0%) | 12 (1.7%) |
| $12,500 to $14,999 | 0 (0.0%) | 46 (6.6%) |
| $15,000 to $17,499 | 6 (0.6%) | 13 (1.9%) |
| $17,500 to $19,999 | 0 (0.0%) | 0 (0.0%) |
| $20,000 to $22,499 | 22 (2.0%) | 4 (0.6%) |
| $22,500 to $24,999 | 69 (6.4%) | 55 (7.9%) |
| $25,000 to $29,999 | 43 (4.0%) | 25 (3.6%) |
| $30,000 to $34,999 | 110 (10.2%) | 54 (7.7%) |
| $35,000 to $39,999 | 58 (5.4%) | 7 (1.0%) |
| $40,000 to $44,999 | 74 (6.9%) | 110 (15.7%) |
| $45,000 to $49,999 | 15 (1.4%) | 63 (9.0%) |
| $50,000 to $54,999 | 46 (4.3%) | 6 (0.9%) |
| $55,000 to $64,999 | 224 (20.8%) | 21 (3.0%) |
| $65,000 to $74,999 | 111 (10.3%) | 18 (2.6%) |
| $75,000 to $99,999 | 61 (5.7%) | 54 (7.7%) |
| $100,000+ | 27 (2.5%) | 81 (11.6%) |
| Total | 1,078 (100.0%) | 699 (100.0%) |
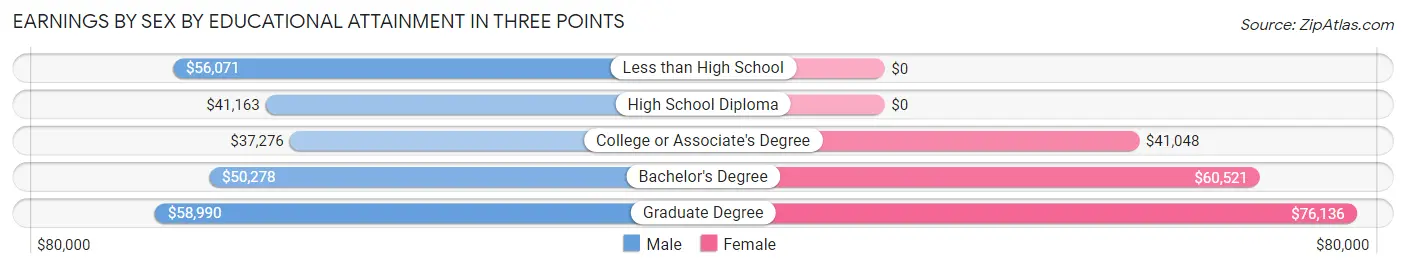
Earnings by Sex by Educational Attainment in Three Points
Average earnings in Three Points are $42,103 for men and $41,580 for women, a difference of 1.2%. Men with an educational attainment of graduate degree enjoy the highest average annual earnings of $58,990, while those with college or associate's degree education earn the least with $37,276. Women with an educational attainment of graduate degree earn the most with the average annual earnings of $76,136, while those with college or associate's degree education have the smallest earnings of $41,048.
| Educational Attainment | Male Income | Female Income |
| Less than High School | $56,071 | $0 |
| High School Diploma | $41,163 | $0 |
| College or Associate's Degree | $37,276 | $41,048 |
| Bachelor's Degree | $50,278 | $60,521 |
| Graduate Degree | $58,990 | $76,136 |
| Total | $42,103 | $41,580 |
Family Income in Three Points
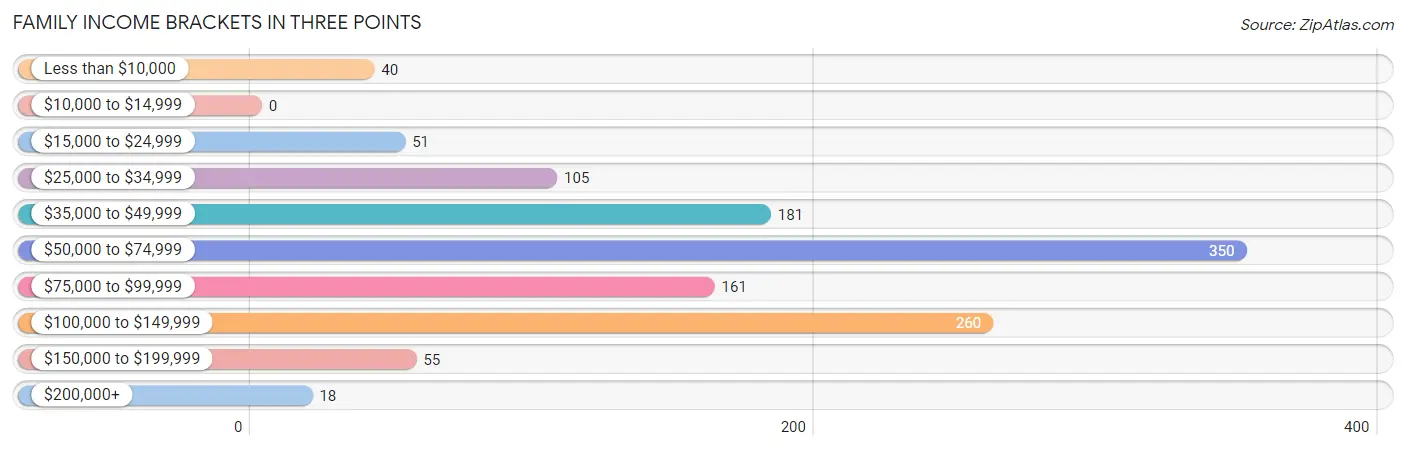
Family Income Brackets in Three Points
According to the Three Points family income data, there are 350 families falling into the $50,000 to $74,999 income range, which is the most common income bracket and makes up 28.7% of all families.
| Income Bracket | # Families | % Families |
| Less than $10,000 | 40 | 3.3% |
| $10,000 to $14,999 | 0 | 0.0% |
| $15,000 to $24,999 | 51 | 4.2% |
| $25,000 to $34,999 | 105 | 8.6% |
| $35,000 to $49,999 | 181 | 14.8% |
| $50,000 to $74,999 | 350 | 28.7% |
| $75,000 to $99,999 | 161 | 13.2% |
| $100,000 to $149,999 | 260 | 21.3% |
| $150,000 to $199,999 | 55 | 4.5% |
| $200,000+ | 18 | 1.5% |
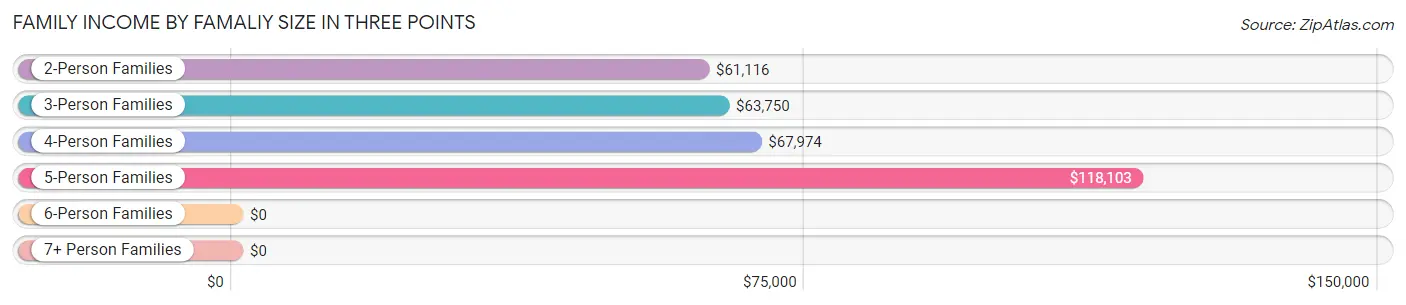
Family Income by Famaliy Size in Three Points
5-person families (159 | 13.0%) account for the highest median family income in Three Points with $118,103 per family, while 2-person families (395 | 32.4%) have the highest median income of $30,558 per family member.
| Income Bracket | # Families | Median Income |
| 2-Person Families | 395 (32.4%) | $61,116 |
| 3-Person Families | 320 (26.2%) | $63,750 |
| 4-Person Families | 256 (21.0%) | $67,974 |
| 5-Person Families | 159 (13.0%) | $118,103 |
| 6-Person Families | 64 (5.2%) | $0 |
| 7+ Person Families | 26 (2.1%) | $0 |
| Total | 1,220 (100.0%) | $67,790 |
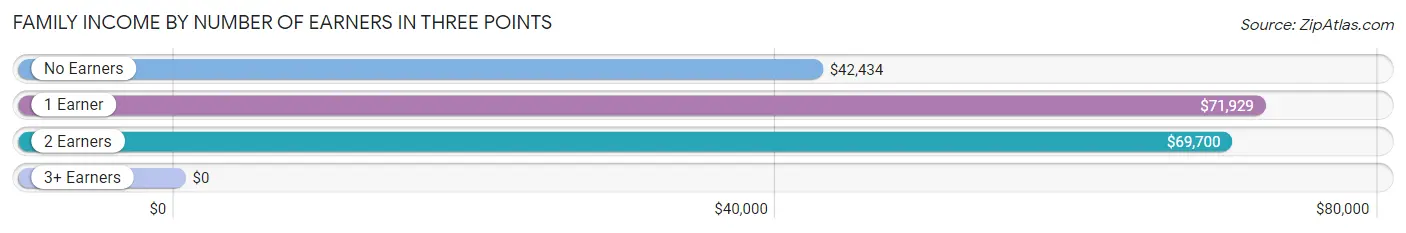
Family Income by Number of Earners in Three Points
| Number of Earners | # Families | Median Income |
| No Earners | 269 (22.1%) | $42,434 |
| 1 Earner | 544 (44.6%) | $71,929 |
| 2 Earners | 346 (28.4%) | $69,700 |
| 3+ Earners | 61 (5.0%) | $0 |
| Total | 1,220 (100.0%) | $67,790 |
Household Income in Three Points
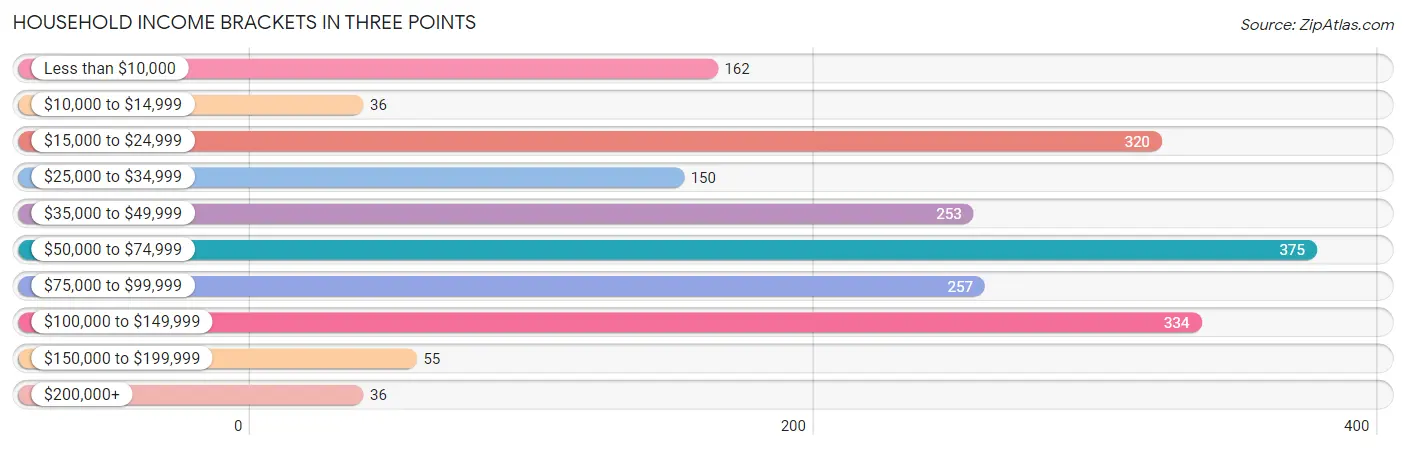
Household Income Brackets in Three Points
With 375 households falling in the category, the $50,000 to $74,999 income range is the most frequent in Three Points, accounting for 19.0% of all households. In contrast, only 36 households (1.8%) fall into the $10,000 to $14,999 income bracket, making it the least populous group.
| Income Bracket | # Households | % Households |
| Less than $10,000 | 162 | 8.2% |
| $10,000 to $14,999 | 36 | 1.8% |
| $15,000 to $24,999 | 320 | 16.2% |
| $25,000 to $34,999 | 150 | 7.6% |
| $35,000 to $49,999 | 253 | 12.8% |
| $50,000 to $74,999 | 375 | 19.0% |
| $75,000 to $99,999 | 257 | 13.0% |
| $100,000 to $149,999 | 334 | 16.9% |
| $150,000 to $199,999 | 55 | 2.8% |
| $200,000+ | 36 | 1.8% |
Household Income by Householder Age in Three Points
The median household income in Three Points is $55,074, with the highest median household income of $105,464 found in the 25 to 44 years age bracket for the primary householder. A total of 405 households (20.5%) fall into this category.
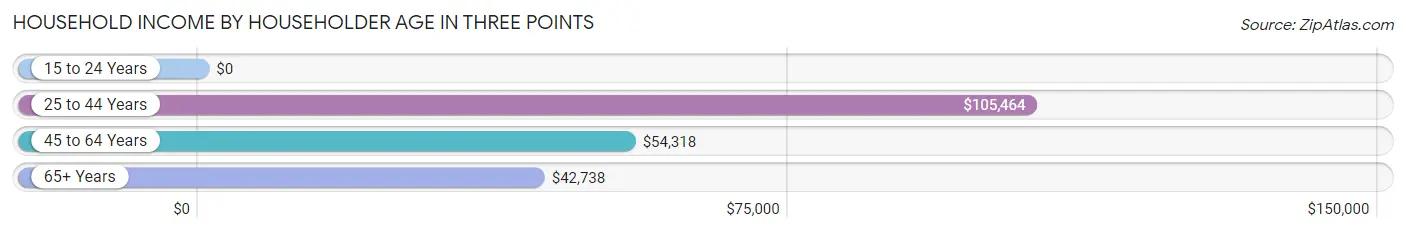
| Income Bracket | # Households | Median Income |
| 15 to 24 Years | 0 (0.0%) | $0 |
| 25 to 44 Years | 405 (20.5%) | $105,464 |
| 45 to 64 Years | 754 (38.2%) | $54,318 |
| 65+ Years | 816 (41.3%) | $42,738 |
| Total | 1,975 (100.0%) | $55,074 |
Poverty in Three Points
Income Below Poverty by Sex and Age in Three Points
With 11.8% poverty level for males and 12.3% for females among the residents of Three Points, 15 year old males and under 5 year old females are the most vulnerable to poverty, with 23 males (100.0%) and 47 females (42.7%) in their respective age groups living below the poverty level.
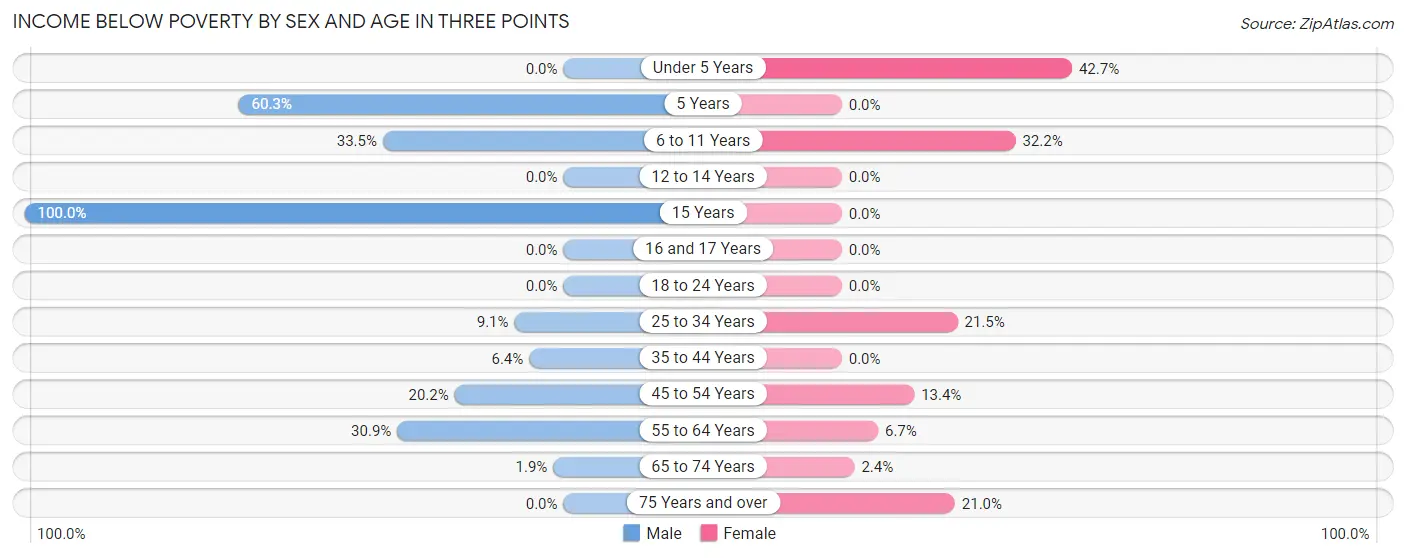
| Age Bracket | Male | Female |
| Under 5 Years | 0 (0.0%) | 47 (42.7%) |
| 5 Years | 44 (60.3%) | 0 (0.0%) |
| 6 to 11 Years | 65 (33.5%) | 49 (32.2%) |
| 12 to 14 Years | 0 (0.0%) | 0 (0.0%) |
| 15 Years | 23 (100.0%) | 0 (0.0%) |
| 16 and 17 Years | 0 (0.0%) | 0 (0.0%) |
| 18 to 24 Years | 0 (0.0%) | 0 (0.0%) |
| 25 to 34 Years | 39 (9.1%) | 75 (21.5%) |
| 35 to 44 Years | 20 (6.4%) | 0 (0.0%) |
| 45 to 54 Years | 40 (20.2%) | 41 (13.4%) |
| 55 to 64 Years | 91 (30.8%) | 22 (6.7%) |
| 65 to 74 Years | 9 (1.9%) | 8 (2.4%) |
| 75 Years and over | 0 (0.0%) | 38 (21.0%) |
| Total | 331 (11.8%) | 280 (12.3%) |
Income Above Poverty by Sex and Age in Three Points
According to the poverty statistics in Three Points, males aged under 5 years and females aged 5 years are the age groups that are most secure financially, with 100.0% of males and 100.0% of females in these age groups living above the poverty line.
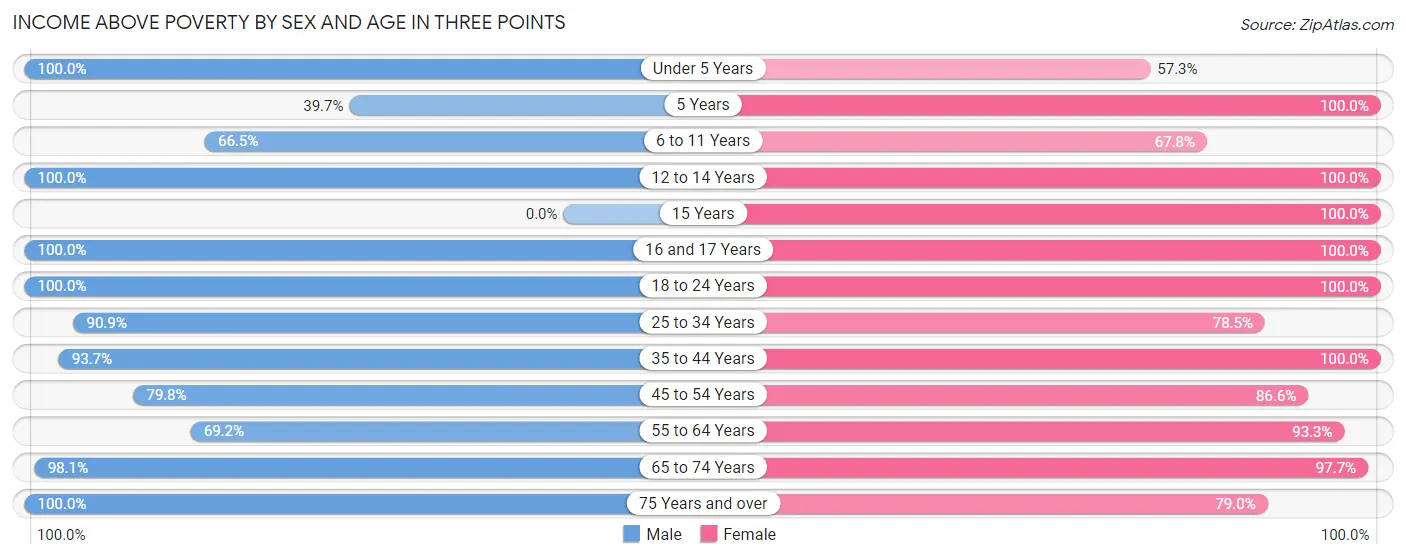
| Age Bracket | Male | Female |
| Under 5 Years | 375 (100.0%) | 63 (57.3%) |
| 5 Years | 29 (39.7%) | 30 (100.0%) |
| 6 to 11 Years | 129 (66.5%) | 103 (67.8%) |
| 12 to 14 Years | 43 (100.0%) | 89 (100.0%) |
| 15 Years | 0 (0.0%) | 20 (100.0%) |
| 16 and 17 Years | 110 (100.0%) | 88 (100.0%) |
| 18 to 24 Years | 19 (100.0%) | 128 (100.0%) |
| 25 to 34 Years | 390 (90.9%) | 274 (78.5%) |
| 35 to 44 Years | 295 (93.6%) | 158 (100.0%) |
| 45 to 54 Years | 158 (79.8%) | 264 (86.6%) |
| 55 to 64 Years | 204 (69.2%) | 305 (93.3%) |
| 65 to 74 Years | 466 (98.1%) | 333 (97.7%) |
| 75 Years and over | 261 (100.0%) | 143 (79.0%) |
| Total | 2,479 (88.2%) | 1,998 (87.7%) |
Income Below Poverty Among Married-Couple Families in Three Points
The poverty statistics for married-couple families in Three Points show that 5.9% or 52 of the total 878 families live below the poverty line. Families with 3 or 4 children have the highest poverty rate of 29.4%, comprising of 43 families. On the other hand, families with 1 or 2 children have the lowest poverty rate of 0.0%, which includes 0 families.
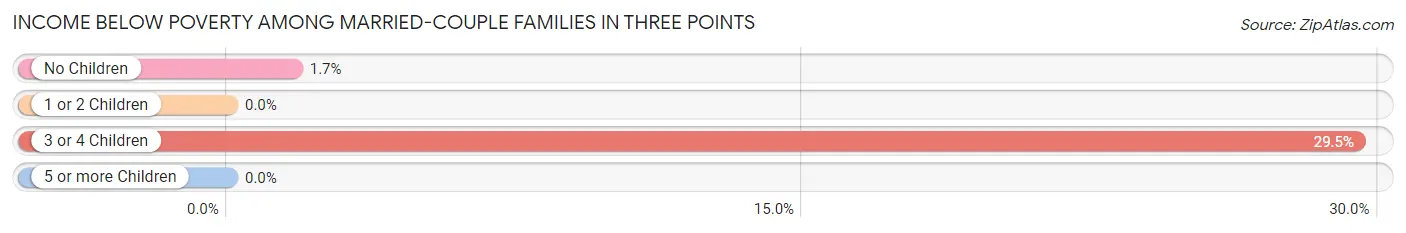
| Children | Above Poverty | Below Poverty |
| No Children | 522 (98.3%) | 9 (1.7%) |
| 1 or 2 Children | 201 (100.0%) | 0 (0.0%) |
| 3 or 4 Children | 103 (70.6%) | 43 (29.4%) |
| 5 or more Children | 0 (0.0%) | 0 (0.0%) |
| Total | 826 (94.1%) | 52 (5.9%) |
Income Below Poverty Among Single-Parent Households in Three Points
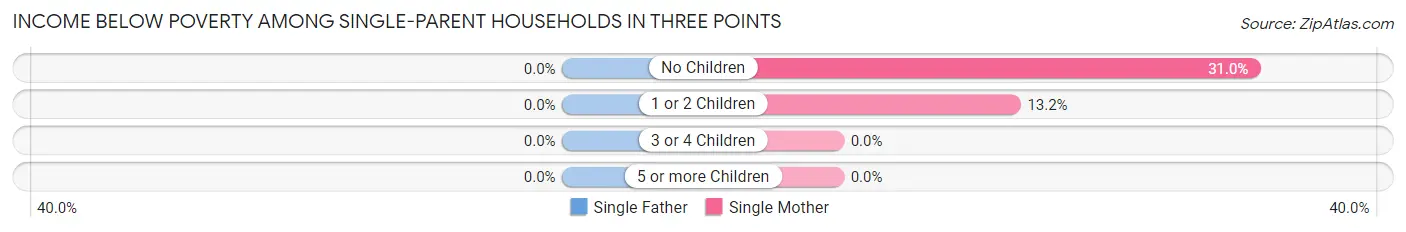
| Children | Single Father | Single Mother |
| No Children | 0 (0.0%) | 9 (31.0%) |
| 1 or 2 Children | 0 (0.0%) | 22 (13.2%) |
| 3 or 4 Children | 0 (0.0%) | 0 (0.0%) |
| 5 or more Children | 0 (0.0%) | 0 (0.0%) |
| Total | 0 (0.0%) | 31 (13.4%) |
Income Below Poverty Among Married-Couple vs Single-Parent Households in Three Points
The poverty data for Three Points shows that 52 of the married-couple family households (5.9%) and 31 of the single-parent households (9.1%) are living below the poverty level. Within the married-couple family households, those with 3 or 4 children have the highest poverty rate, with 43 households (29.4%) falling below the poverty line. Among the single-parent households, those with 1 or 2 children have the highest poverty rate, with 22 household (11.4%) living below poverty.
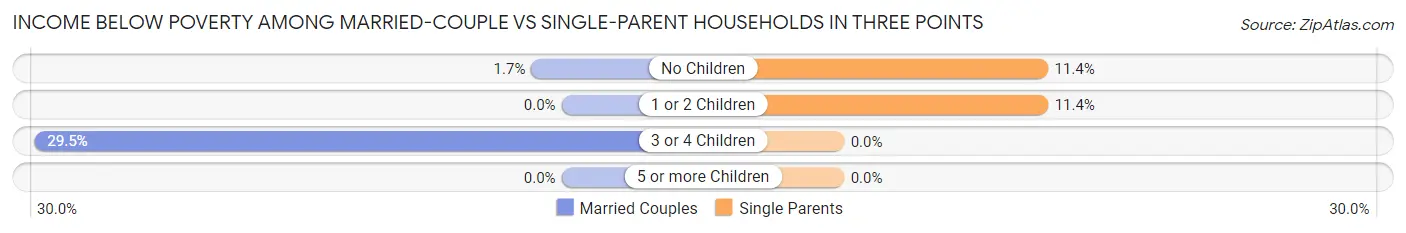
| Children | Married-Couple Families | Single-Parent Households |
| No Children | 9 (1.7%) | 9 (11.4%) |
| 1 or 2 Children | 0 (0.0%) | 22 (11.4%) |
| 3 or 4 Children | 43 (29.4%) | 0 (0.0%) |
| 5 or more Children | 0 (0.0%) | 0 (0.0%) |
| Total | 52 (5.9%) | 31 (9.1%) |
Race in Three Points
The most populous races in Three Points are White / Caucasian (3,326 | 65.2%), Hispanic or Latino (1,718 | 33.7%), and Some other Race (801 | 15.7%).
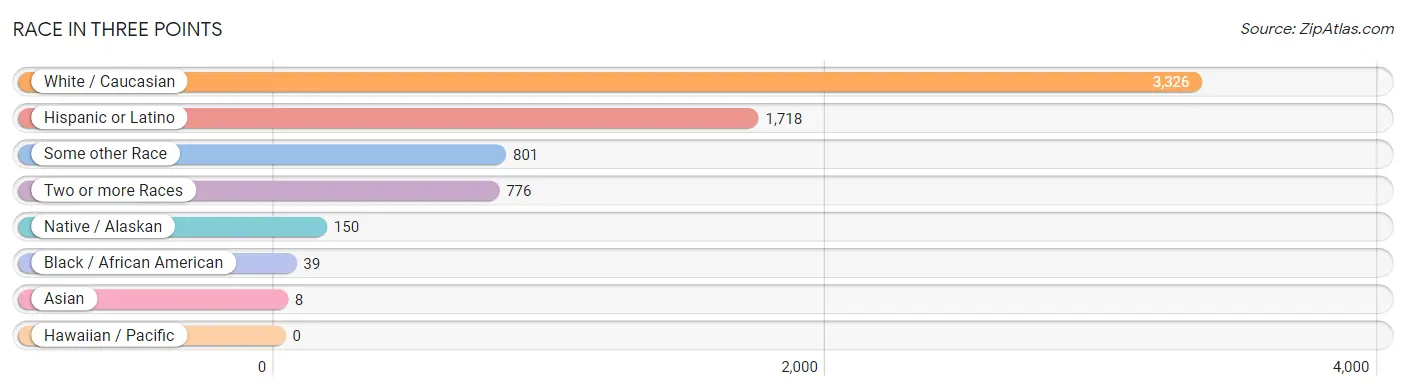
| Race | # Population | % Population |
| Asian | 8 | 0.2% |
| Black / African American | 39 | 0.8% |
| Hawaiian / Pacific | 0 | 0.0% |
| Hispanic or Latino | 1,718 | 33.7% |
| Native / Alaskan | 150 | 2.9% |
| White / Caucasian | 3,326 | 65.2% |
| Two or more Races | 776 | 15.2% |
| Some other Race | 801 | 15.7% |
| Total | 5,100 | 100.0% |
Ancestry in Three Points
The most populous ancestries reported in Three Points are Mexican (1,554 | 30.5%), German (879 | 17.2%), Irish (521 | 10.2%), English (301 | 5.9%), and Italian (287 | 5.6%), together accounting for 69.5% of all Three Points residents.
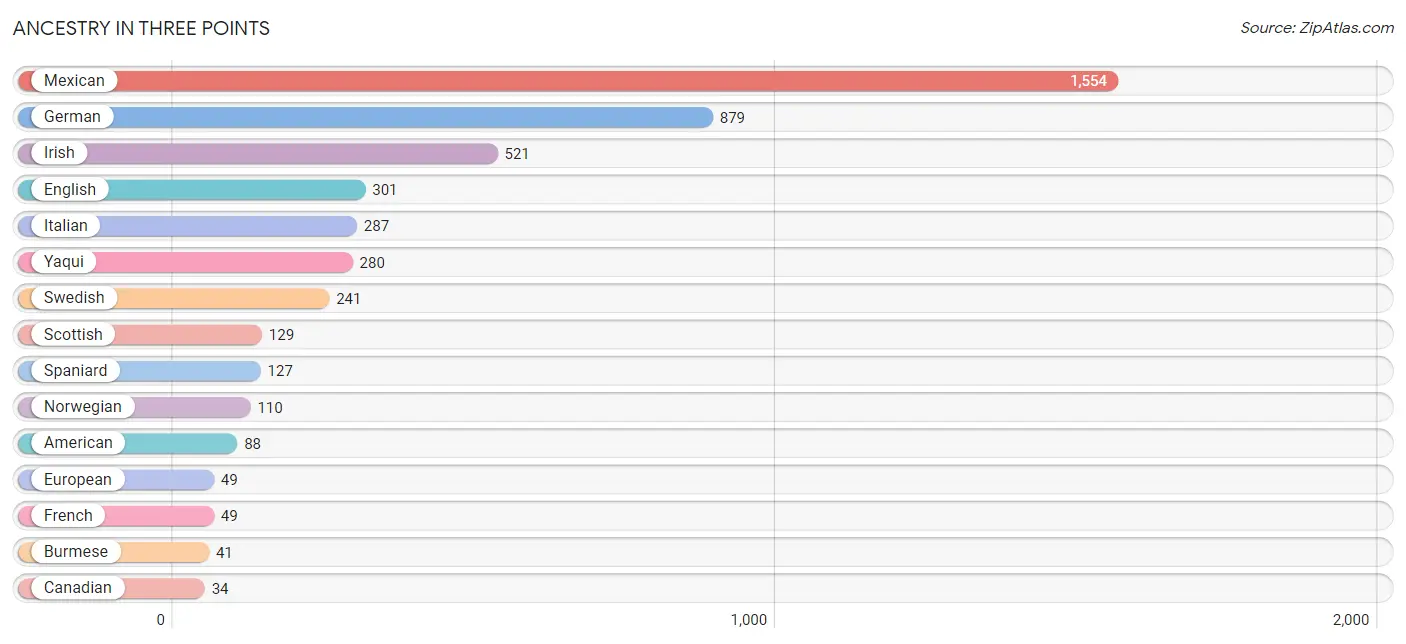
| Ancestry | # Population | % Population |
| African | 20 | 0.4% |
| American | 88 | 1.7% |
| Austrian | 28 | 0.5% |
| Bhutanese | 7 | 0.1% |
| Burmese | 41 | 0.8% |
| Canadian | 34 | 0.7% |
| Central American | 17 | 0.3% |
| Cherokee | 19 | 0.4% |
| Czechoslovakian | 7 | 0.1% |
| Danish | 9 | 0.2% |
| Dutch | 30 | 0.6% |
| English | 301 | 5.9% |
| European | 49 | 1.0% |
| French | 49 | 1.0% |
| French Canadian | 13 | 0.3% |
| German | 879 | 17.2% |
| German Russian | 8 | 0.2% |
| Irish | 521 | 10.2% |
| Italian | 287 | 5.6% |
| Korean | 28 | 0.5% |
| Mexican | 1,554 | 30.5% |
| Norwegian | 110 | 2.2% |
| Polish | 27 | 0.5% |
| Portuguese | 11 | 0.2% |
| Puerto Rican | 6 | 0.1% |
| Russian | 10 | 0.2% |
| Salvadoran | 17 | 0.3% |
| Scotch-Irish | 9 | 0.2% |
| Scottish | 129 | 2.5% |
| Sioux | 11 | 0.2% |
| Spaniard | 127 | 2.5% |
| Subsaharan African | 20 | 0.4% |
| Swedish | 241 | 4.7% |
| Ukrainian | 10 | 0.2% |
| Yaqui | 280 | 5.5% | View All 35 Rows |
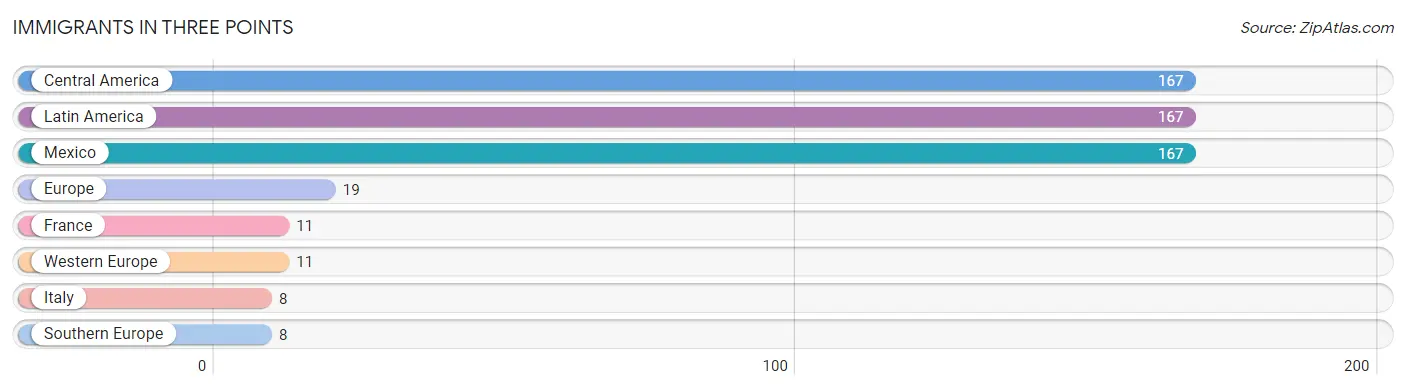
Immigrants in Three Points
The most numerous immigrant groups reported in Three Points came from Central America (167 | 3.3%), Latin America (167 | 3.3%), Mexico (167 | 3.3%), Europe (19 | 0.4%), and France (11 | 0.2%), together accounting for 10.4% of all Three Points residents.
| Immigration Origin | # Population | % Population |
| Central America | 167 | 3.3% |
| Europe | 19 | 0.4% |
| France | 11 | 0.2% |
| Italy | 8 | 0.2% |
| Latin America | 167 | 3.3% |
| Mexico | 167 | 3.3% |
| Southern Europe | 8 | 0.2% |
| Western Europe | 11 | 0.2% | View All 8 Rows |
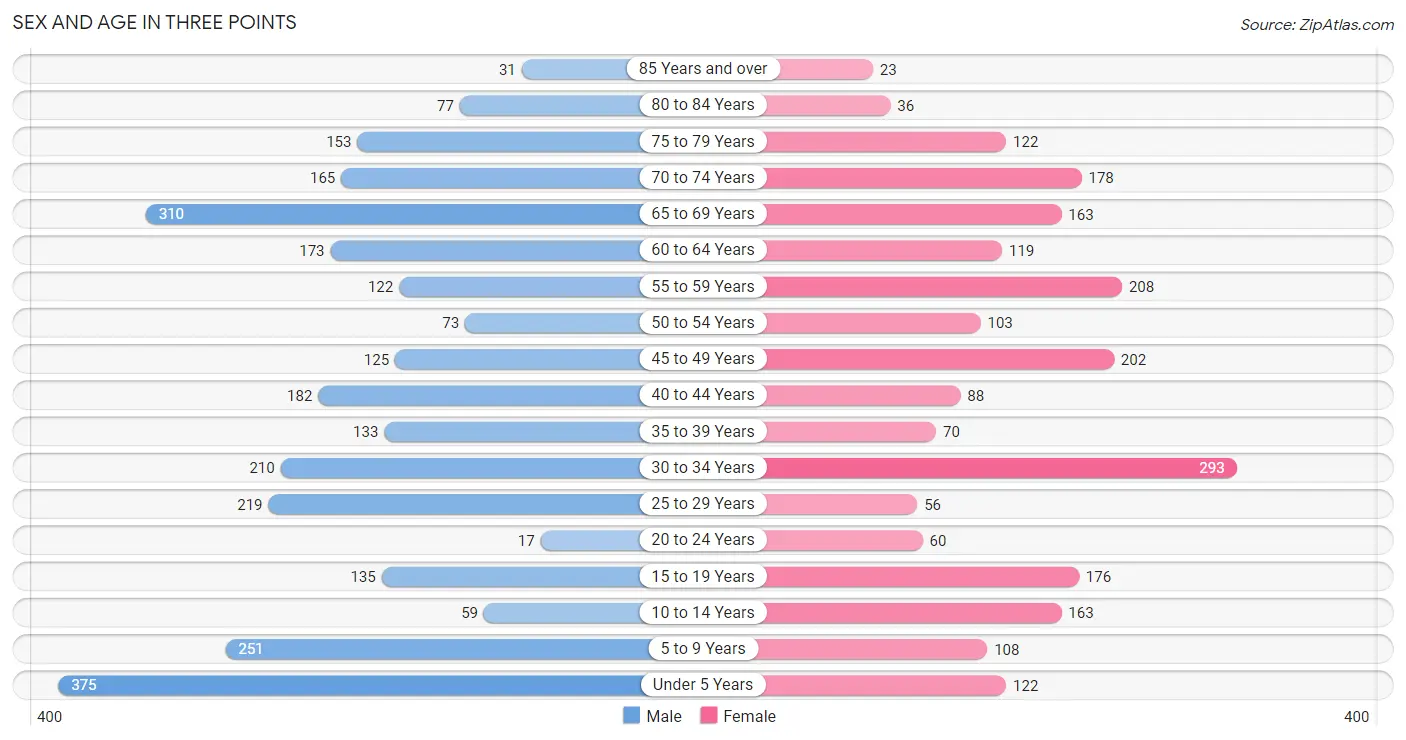
Sex and Age in Three Points
Sex and Age in Three Points
The most populous age groups in Three Points are Under 5 Years (375 | 13.4%) for men and 30 to 34 Years (293 | 12.8%) for women.
| Age Bracket | Male | Female |
| Under 5 Years | 375 (13.4%) | 122 (5.3%) |
| 5 to 9 Years | 251 (8.9%) | 108 (4.7%) |
| 10 to 14 Years | 59 (2.1%) | 163 (7.1%) |
| 15 to 19 Years | 135 (4.8%) | 176 (7.7%) |
| 20 to 24 Years | 17 (0.6%) | 60 (2.6%) |
| 25 to 29 Years | 219 (7.8%) | 56 (2.5%) |
| 30 to 34 Years | 210 (7.5%) | 293 (12.8%) |
| 35 to 39 Years | 133 (4.7%) | 70 (3.1%) |
| 40 to 44 Years | 182 (6.5%) | 88 (3.8%) |
| 45 to 49 Years | 125 (4.4%) | 202 (8.8%) |
| 50 to 54 Years | 73 (2.6%) | 103 (4.5%) |
| 55 to 59 Years | 122 (4.3%) | 208 (9.1%) |
| 60 to 64 Years | 173 (6.2%) | 119 (5.2%) |
| 65 to 69 Years | 310 (11.0%) | 163 (7.1%) |
| 70 to 74 Years | 165 (5.9%) | 178 (7.8%) |
| 75 to 79 Years | 153 (5.4%) | 122 (5.3%) |
| 80 to 84 Years | 77 (2.7%) | 36 (1.6%) |
| 85 Years and over | 31 (1.1%) | 23 (1.0%) |
| Total | 2,810 (100.0%) | 2,290 (100.0%) |
Families and Households in Three Points
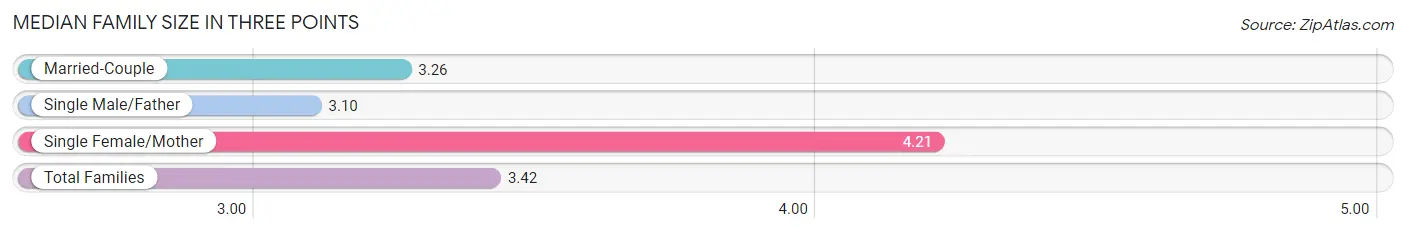
Median Family Size in Three Points
The median family size in Three Points is 3.42 persons per family, with single female/mother families (231 | 18.9%) accounting for the largest median family size of 4.21 persons per family. On the other hand, single male/father families (111 | 9.1%) represent the smallest median family size with 3.10 persons per family.
| Family Type | # Families | Family Size |
| Married-Couple | 878 (72.0%) | 3.26 |
| Single Male/Father | 111 (9.1%) | 3.10 |
| Single Female/Mother | 231 (18.9%) | 4.21 |
| Total Families | 1,220 (100.0%) | 3.42 |
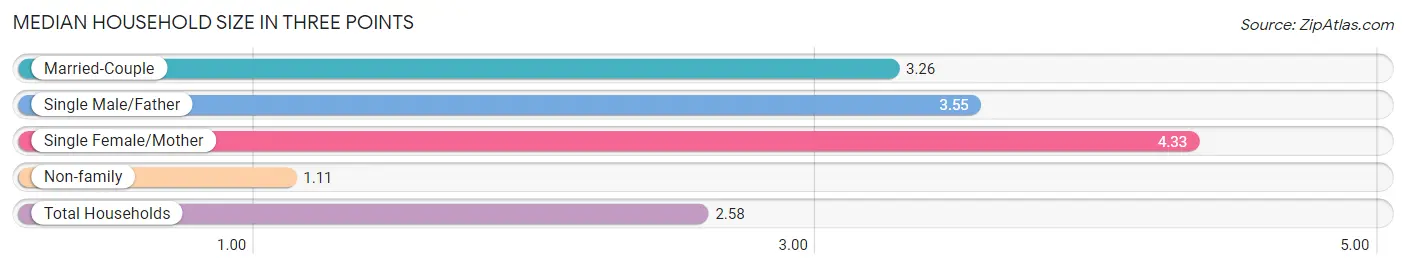
Median Household Size in Three Points
The median household size in Three Points is 2.58 persons per household, with single female/mother households (231 | 11.7%) accounting for the largest median household size of 4.33 persons per household. non-family households (755 | 38.2%) represent the smallest median household size with 1.11 persons per household.
| Household Type | # Households | Household Size |
| Married-Couple | 878 (44.5%) | 3.26 |
| Single Male/Father | 111 (5.6%) | 3.55 |
| Single Female/Mother | 231 (11.7%) | 4.33 |
| Non-family | 755 (38.2%) | 1.11 |
| Total Households | 1,975 (100.0%) | 2.58 |
Household Size by Marriage Status in Three Points
Out of a total of 1,975 households in Three Points, 1,220 (61.8%) are family households, while 755 (38.2%) are nonfamily households. The most numerous type of family households are 2-person households, comprising 386, and the most common type of nonfamily households are 1-person households, comprising 686.
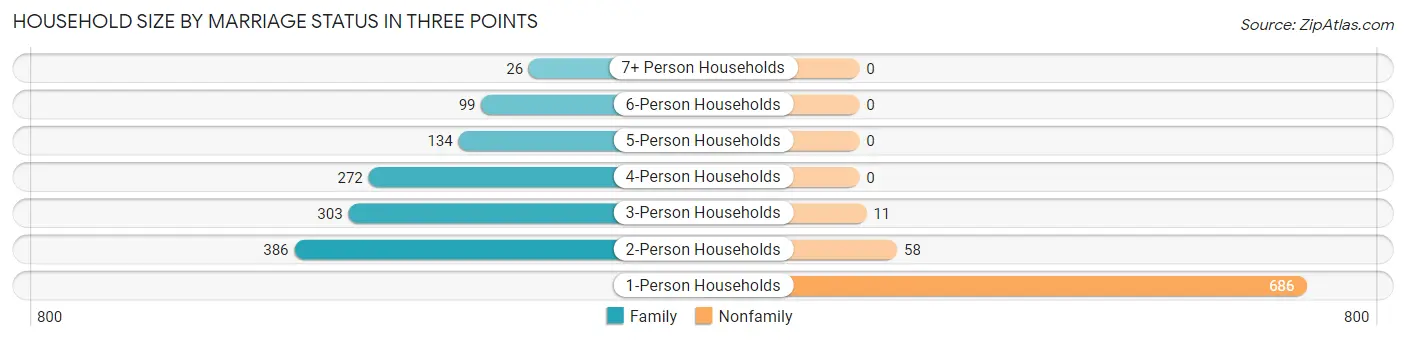
| Household Size | Family Households | Nonfamily Households |
| 1-Person Households | - | 686 (34.7%) |
| 2-Person Households | 386 (19.5%) | 58 (2.9%) |
| 3-Person Households | 303 (15.3%) | 11 (0.6%) |
| 4-Person Households | 272 (13.8%) | 0 (0.0%) |
| 5-Person Households | 134 (6.8%) | 0 (0.0%) |
| 6-Person Households | 99 (5.0%) | 0 (0.0%) |
| 7+ Person Households | 26 (1.3%) | 0 (0.0%) |
| Total | 1,220 (61.8%) | 755 (38.2%) |
Female Fertility in Three Points
Fertility by Age in Three Points
Average fertility rate in Three Points is 112.0 births per 1,000 women. Women in the age bracket of 20 to 34 years have the highest fertility rate with 259.0 births per 1,000 women. Women in the age bracket of 20 to 34 years acount for 100.0% of all women with births.
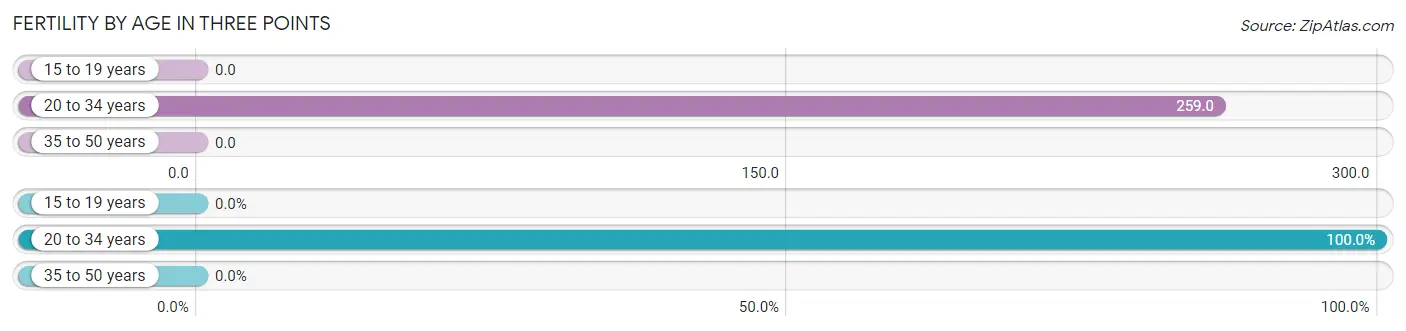
| Age Bracket | Women with Births | Births / 1,000 Women |
| 15 to 19 years | 0 (0.0%) | 0.0 |
| 20 to 34 years | 106 (100.0%) | 259.0 |
| 35 to 50 years | 0 (0.0%) | 0.0 |
| Total | 106 (100.0%) | 112.0 |
Fertility by Age by Marriage Status in Three Points
78.3% of women with births (106) in Three Points are married. The highest percentage of unmarried women with births falls into 20 to 34 years age bracket with 21.7% of them unmarried at the time of birth, while the lowest percentage of unmarried women with births belong to 20 to 34 years age bracket with 21.7% of them unmarried.
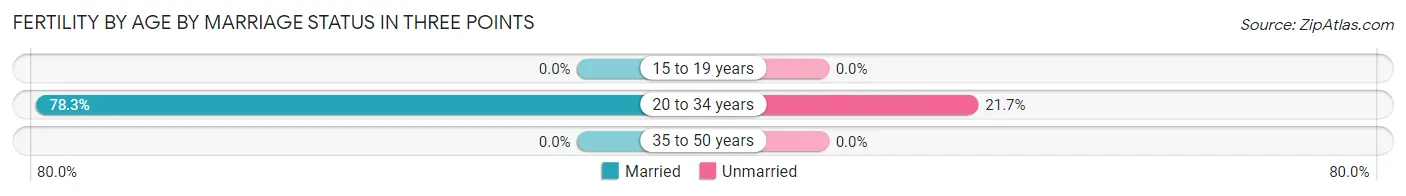
| Age Bracket | Married | Unmarried |
| 15 to 19 years | 0 (0.0%) | 0 (0.0%) |
| 20 to 34 years | 83 (78.3%) | 23 (21.7%) |
| 35 to 50 years | 0 (0.0%) | 0 (0.0%) |
| Total | 83 (78.3%) | 23 (21.7%) |
Fertility by Education in Three Points
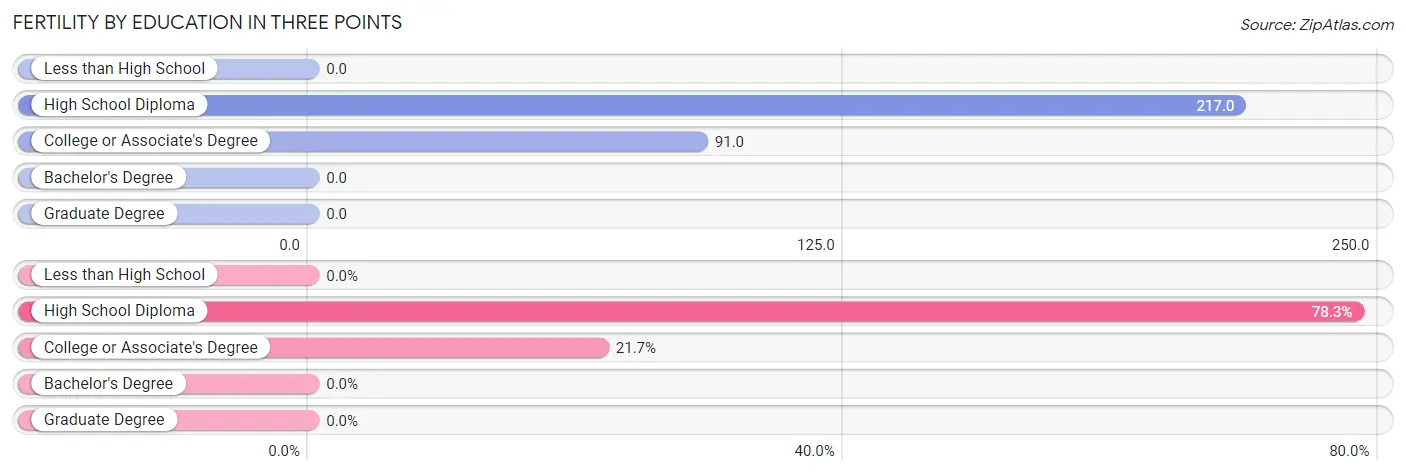
| Educational Attainment | Women with Births | Births / 1,000 Women |
| Less than High School | 0 (0.0%) | 0.0 |
| High School Diploma | 83 (78.3%) | 217.0 |
| College or Associate's Degree | 23 (21.7%) | 91.0 |
| Bachelor's Degree | 0 (0.0%) | 0.0 |
| Graduate Degree | 0 (0.0%) | 0.0 |
| Total | 106 (100.0%) | 112.0 |
Fertility by Education by Marriage Status in Three Points
21.7% of women with births in Three Points are unmarried. Women with the educational attainment of high school diploma are most likely to be married with 100.0% of them married at childbirth, while women with the educational attainment of college or associate's degree are least likely to be married with 100.0% of them unmarried at childbirth.
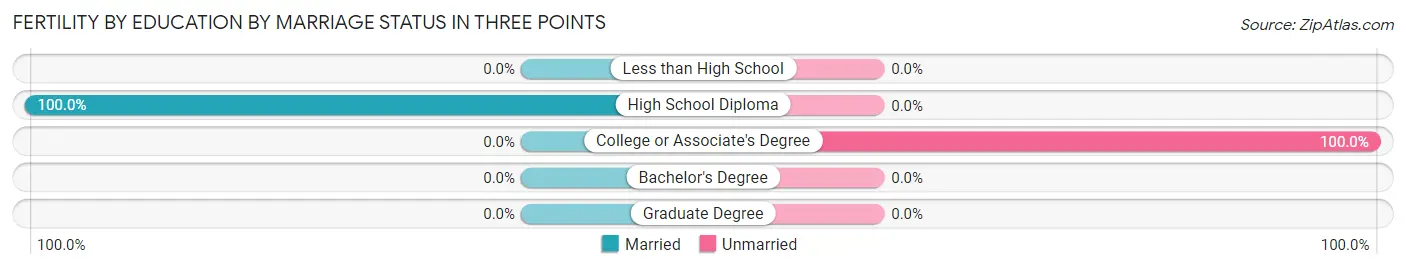
| Educational Attainment | Married | Unmarried |
| Less than High School | 0 (0.0%) | 0 (0.0%) |
| High School Diploma | 83 (100.0%) | 0 (0.0%) |
| College or Associate's Degree | 0 (0.0%) | 23 (100.0%) |
| Bachelor's Degree | 0 (0.0%) | 0 (0.0%) |
| Graduate Degree | 0 (0.0%) | 0 (0.0%) |
| Total | 83 (78.3%) | 23 (21.7%) |
Employment Characteristics in Three Points
Employment by Class of Employer in Three Points
Among the 1,520 employed individuals in Three Points, private company employees (1,118 | 73.6%), federal government employees (111 | 7.3%), and not-for-profit organizations (103 | 6.8%) make up the most common classes of employment.
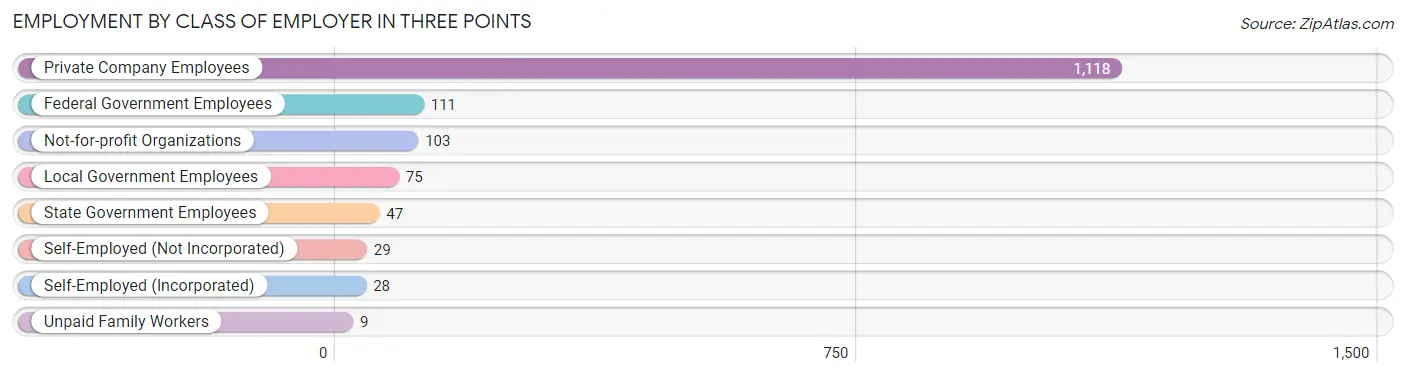
| Employer Class | # Employees | % Employees |
| Private Company Employees | 1,118 | 73.6% |
| Self-Employed (Incorporated) | 28 | 1.8% |
| Self-Employed (Not Incorporated) | 29 | 1.9% |
| Not-for-profit Organizations | 103 | 6.8% |
| Local Government Employees | 75 | 4.9% |
| State Government Employees | 47 | 3.1% |
| Federal Government Employees | 111 | 7.3% |
| Unpaid Family Workers | 9 | 0.6% |
| Total | 1,520 | 100.0% |
Employment Status by Age in Three Points
According to the labor force statistics for Three Points, out of the total population over 16 years of age (3,979), 40.1% or 1,596 individuals are in the labor force, with 4.9% or 78 of them unemployed. The age group with the highest labor force participation rate is 25 to 29 years, with 97.1% or 267 individuals in the labor force. Within the labor force, the 16 to 19 years age range has the highest percentage of unemployed individuals, with 24.7% or 20 of them being unemployed.
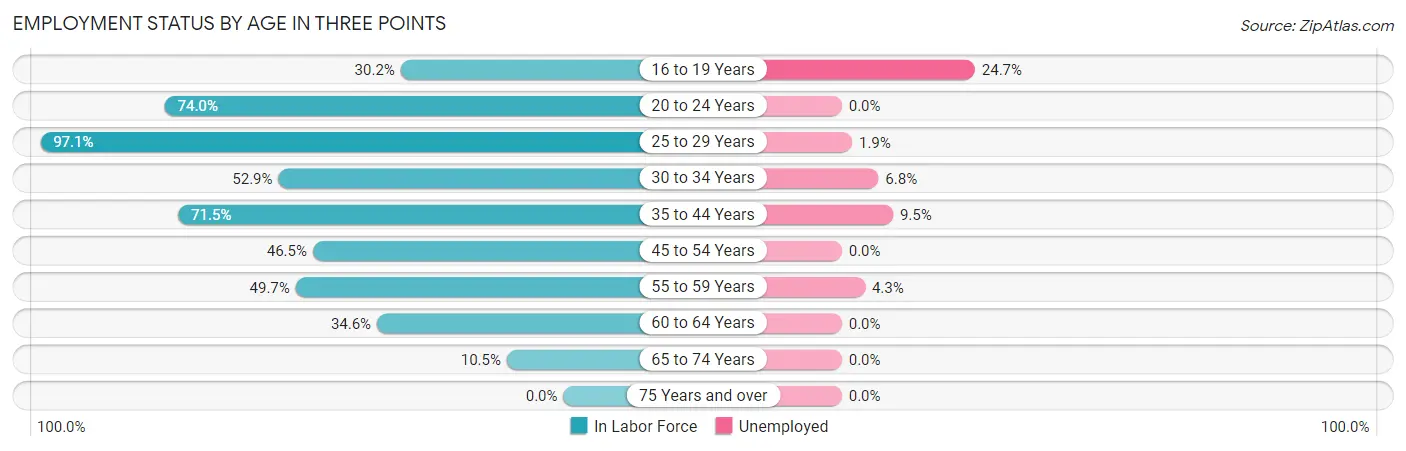
| Age Bracket | In Labor Force | Unemployed |
| 16 to 19 Years | 81 (30.2%) | 20 (24.7%) |
| 20 to 24 Years | 57 (74.0%) | 0 (0.0%) |
| 25 to 29 Years | 267 (97.1%) | 5 (1.9%) |
| 30 to 34 Years | 266 (52.9%) | 18 (6.8%) |
| 35 to 44 Years | 338 (71.5%) | 32 (9.5%) |
| 45 to 54 Years | 234 (46.5%) | 0 (0.0%) |
| 55 to 59 Years | 164 (49.7%) | 7 (4.3%) |
| 60 to 64 Years | 101 (34.6%) | 0 (0.0%) |
| 65 to 74 Years | 86 (10.5%) | 0 (0.0%) |
| 75 Years and over | 0 (0.0%) | 0 (0.0%) |
| Total | 1,596 (40.1%) | 78 (4.9%) |
Employment Status by Educational Attainment in Three Points
According to labor force statistics for Three Points, 57.7% of individuals (1,371) out of the total population between 25 and 64 years of age (2,376) are in the labor force, with 4.2% or 58 of them being unemployed. The group with the highest labor force participation rate are those with the educational attainment of bachelor's degree or higher, with 82.8% or 236 individuals in the labor force. Within the labor force, individuals with bachelor's degree or higher education have the highest percentage of unemployment, with 10.2% or 24 of them being unemployed.
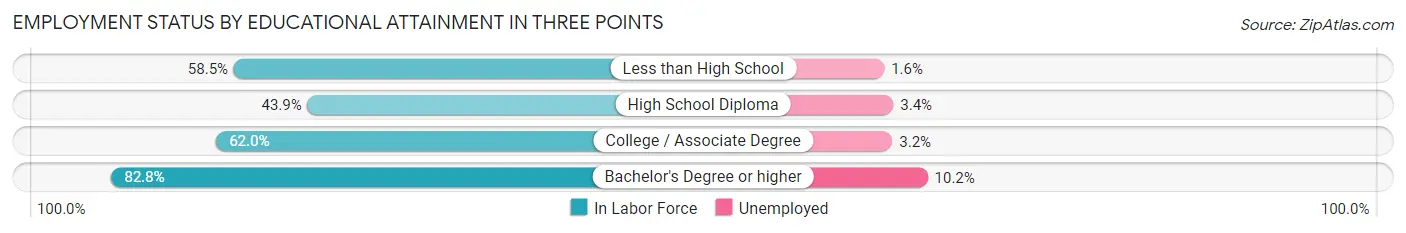
| Educational Attainment | In Labor Force | Unemployed |
| Less than High School | 248 (58.5%) | 7 (1.6%) |
| High School Diploma | 358 (43.9%) | 28 (3.4%) |
| College / Associate Degree | 528 (62.0%) | 27 (3.2%) |
| Bachelor's Degree or higher | 236 (82.8%) | 29 (10.2%) |
| Total | 1,371 (57.7%) | 100 (4.2%) |
Employment Occupations by Sex in Three Points
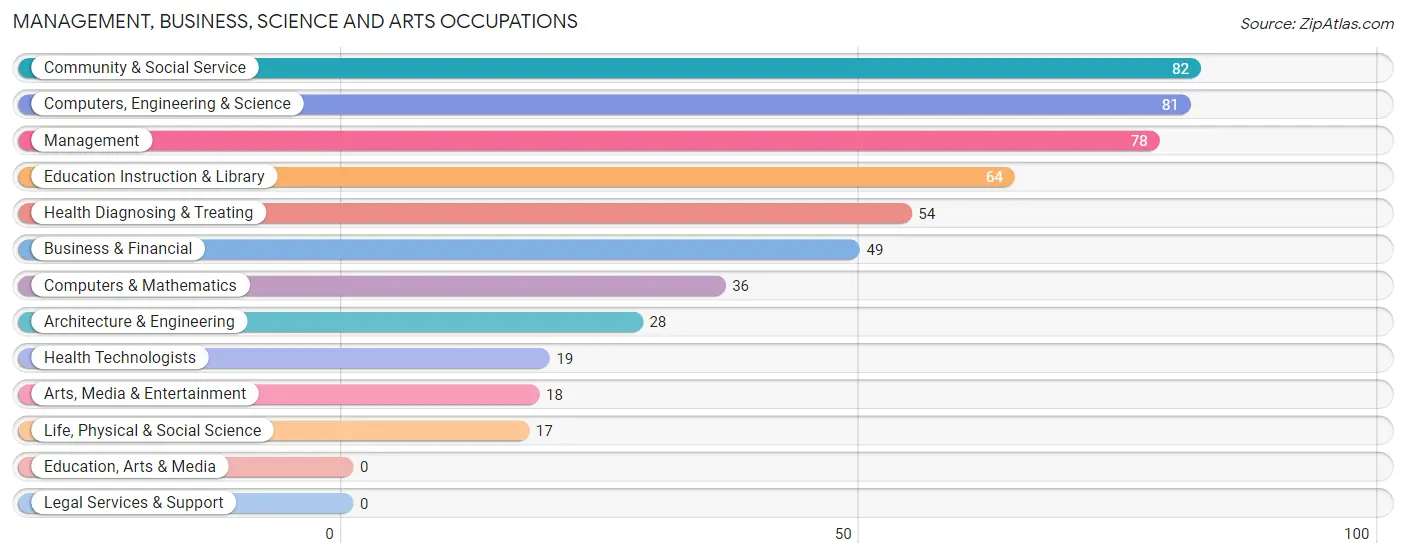
Management, Business, Science and Arts Occupations
The most common Management, Business, Science and Arts occupations in Three Points are Community & Social Service (82 | 5.7%), Computers, Engineering & Science (81 | 5.6%), Management (78 | 5.4%), Education Instruction & Library (64 | 4.5%), and Health Diagnosing & Treating (54 | 3.8%).
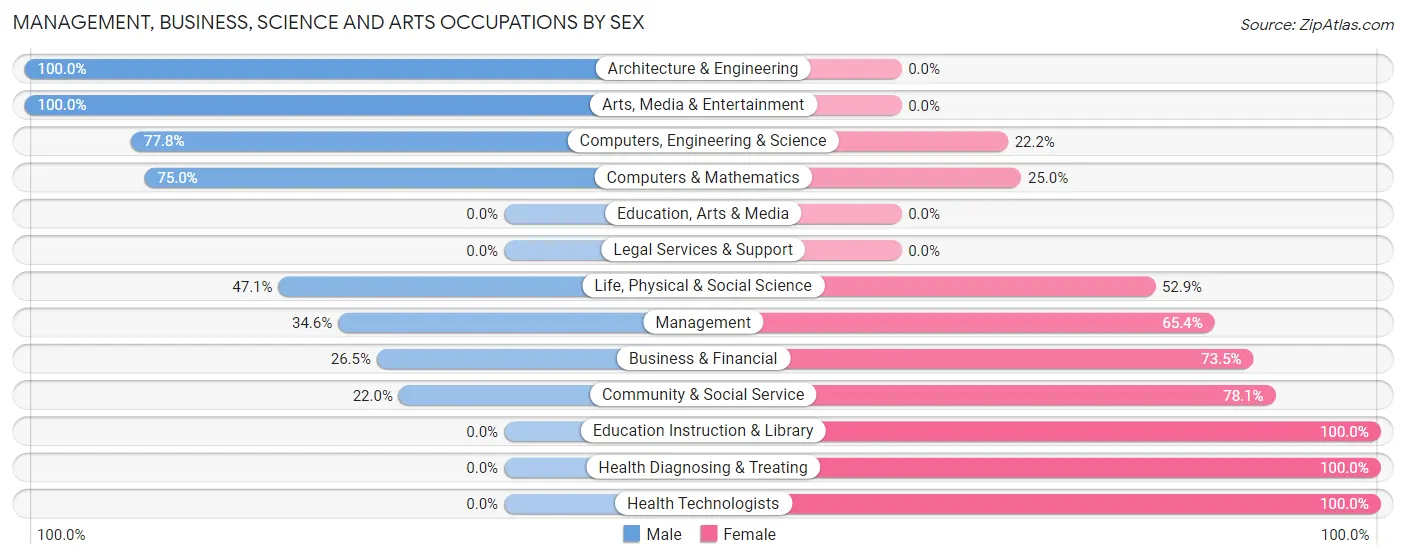
Management, Business, Science and Arts Occupations by Sex
Within the Management, Business, Science and Arts occupations in Three Points, the most male-oriented occupations are Architecture & Engineering (100.0%), Arts, Media & Entertainment (100.0%), and Computers, Engineering & Science (77.8%), while the most female-oriented occupations are Education Instruction & Library (100.0%), Health Diagnosing & Treating (100.0%), and Health Technologists (100.0%).
| Occupation | Male | Female |
| Management | 27 (34.6%) | 51 (65.4%) |
| Business & Financial | 13 (26.5%) | 36 (73.5%) |
| Computers, Engineering & Science | 63 (77.8%) | 18 (22.2%) |
| Computers & Mathematics | 27 (75.0%) | 9 (25.0%) |
| Architecture & Engineering | 28 (100.0%) | 0 (0.0%) |
| Life, Physical & Social Science | 8 (47.1%) | 9 (52.9%) |
| Community & Social Service | 18 (22.0%) | 64 (78.0%) |
| Education, Arts & Media | 0 (0.0%) | 0 (0.0%) |
| Legal Services & Support | 0 (0.0%) | 0 (0.0%) |
| Education Instruction & Library | 0 (0.0%) | 64 (100.0%) |
| Arts, Media & Entertainment | 18 (100.0%) | 0 (0.0%) |
| Health Diagnosing & Treating | 0 (0.0%) | 54 (100.0%) |
| Health Technologists | 0 (0.0%) | 19 (100.0%) |
| Total (Category) | 121 (35.2%) | 223 (64.8%) |
| Total (Overall) | 842 (58.7%) | 593 (41.3%) |
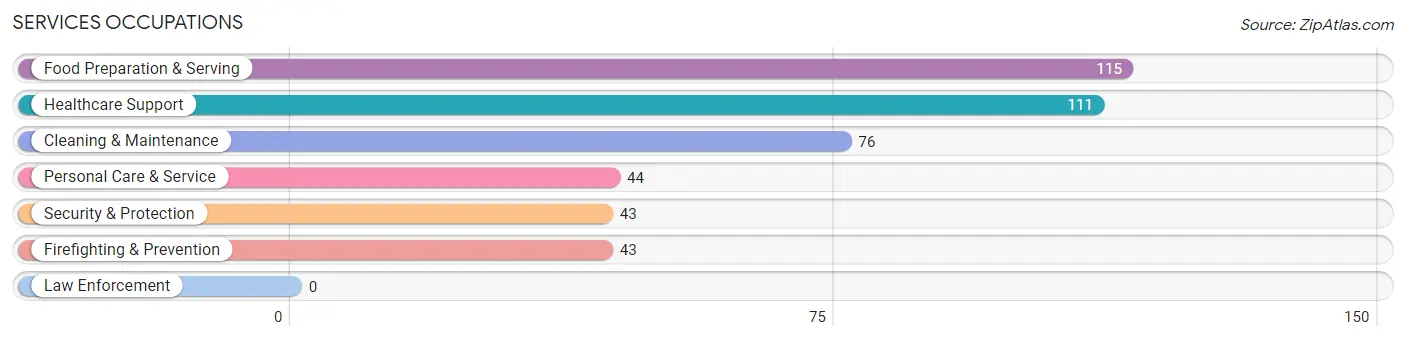
Services Occupations
The most common Services occupations in Three Points are Food Preparation & Serving (115 | 8.0%), Healthcare Support (111 | 7.7%), Cleaning & Maintenance (76 | 5.3%), Personal Care & Service (44 | 3.1%), and Security & Protection (43 | 3.0%).
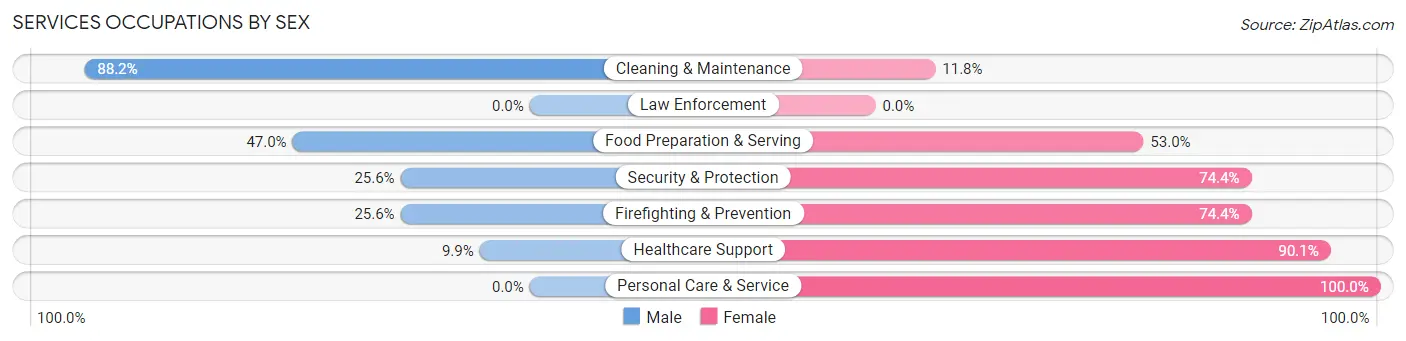
Services Occupations by Sex
Within the Services occupations in Three Points, the most male-oriented occupations are Cleaning & Maintenance (88.2%), Food Preparation & Serving (47.0%), and Security & Protection (25.6%), while the most female-oriented occupations are Personal Care & Service (100.0%), Healthcare Support (90.1%), and Security & Protection (74.4%).
| Occupation | Male | Female |
| Healthcare Support | 11 (9.9%) | 100 (90.1%) |
| Security & Protection | 11 (25.6%) | 32 (74.4%) |
| Firefighting & Prevention | 11 (25.6%) | 32 (74.4%) |
| Law Enforcement | 0 (0.0%) | 0 (0.0%) |
| Food Preparation & Serving | 54 (47.0%) | 61 (53.0%) |
| Cleaning & Maintenance | 67 (88.2%) | 9 (11.8%) |
| Personal Care & Service | 0 (0.0%) | 44 (100.0%) |
| Total (Category) | 143 (36.8%) | 246 (63.2%) |
| Total (Overall) | 842 (58.7%) | 593 (41.3%) |
Sales and Office Occupations
The most common Sales and Office occupations in Three Points are Sales & Related (114 | 7.9%), and Office & Administration (75 | 5.2%).
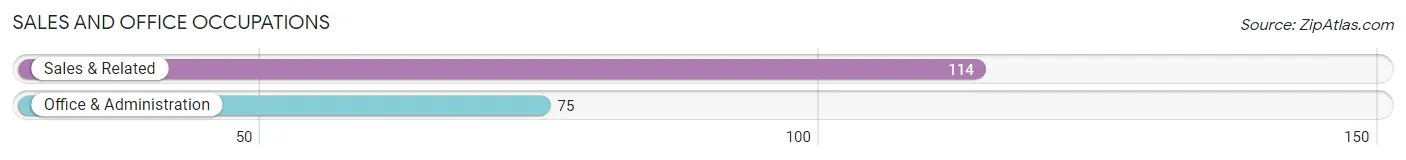
Sales and Office Occupations by Sex
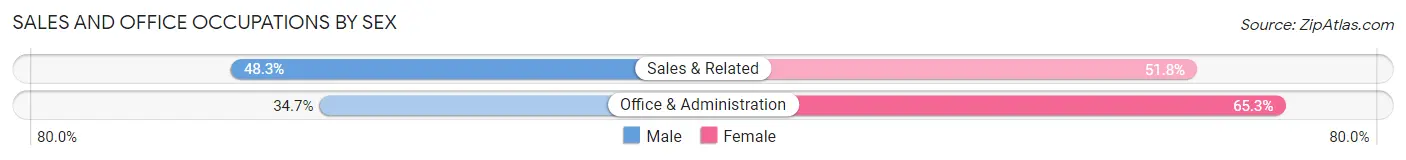
| Occupation | Male | Female |
| Sales & Related | 55 (48.2%) | 59 (51.7%) |
| Office & Administration | 26 (34.7%) | 49 (65.3%) |
| Total (Category) | 81 (42.9%) | 108 (57.1%) |
| Total (Overall) | 842 (58.7%) | 593 (41.3%) |
Natural Resources, Construction and Maintenance Occupations
The most common Natural Resources, Construction and Maintenance occupations in Three Points are Installation, Maintenance & Repair (258 | 18.0%), and Construction & Extraction (131 | 9.1%).
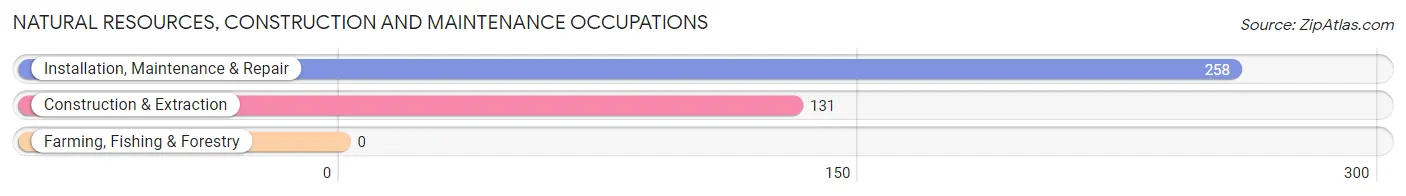
Natural Resources, Construction and Maintenance Occupations by Sex
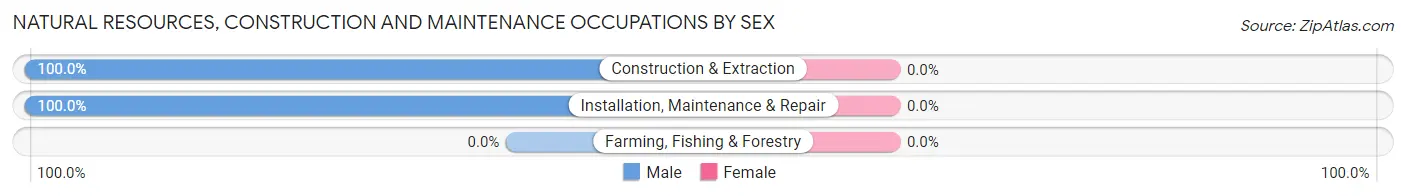
| Occupation | Male | Female |
| Farming, Fishing & Forestry | 0 (0.0%) | 0 (0.0%) |
| Construction & Extraction | 131 (100.0%) | 0 (0.0%) |
| Installation, Maintenance & Repair | 258 (100.0%) | 0 (0.0%) |
| Total (Category) | 389 (100.0%) | 0 (0.0%) |
| Total (Overall) | 842 (58.7%) | 593 (41.3%) |
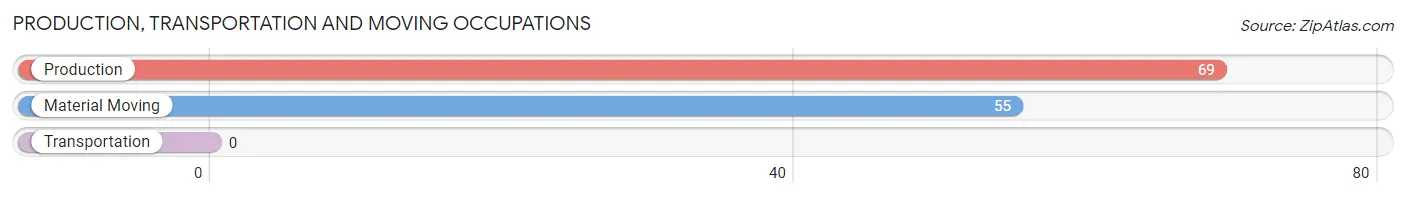
Production, Transportation and Moving Occupations
The most common Production, Transportation and Moving occupations in Three Points are Production (69 | 4.8%), and Material Moving (55 | 3.8%).
Production, Transportation and Moving Occupations by Sex
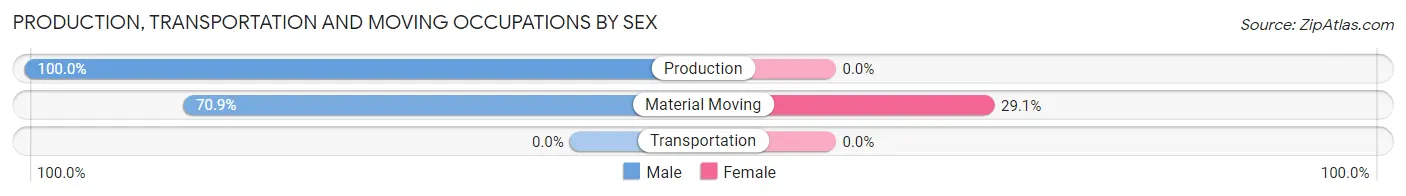
| Occupation | Male | Female |
| Production | 69 (100.0%) | 0 (0.0%) |
| Transportation | 0 (0.0%) | 0 (0.0%) |
| Material Moving | 39 (70.9%) | 16 (29.1%) |
| Total (Category) | 108 (87.1%) | 16 (12.9%) |
| Total (Overall) | 842 (58.7%) | 593 (41.3%) |
Employment Industries by Sex in Three Points
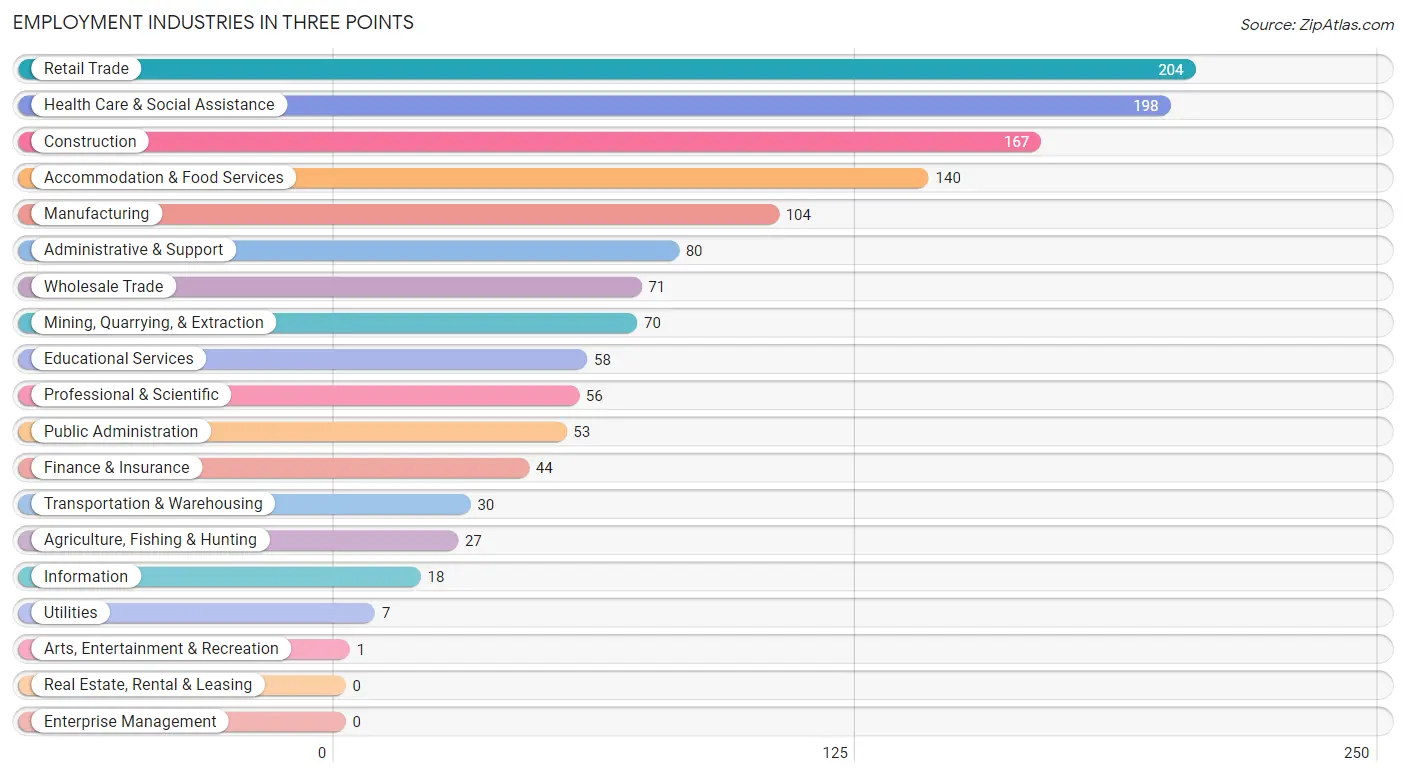
Employment Industries in Three Points
The major employment industries in Three Points include Retail Trade (204 | 14.2%), Health Care & Social Assistance (198 | 13.8%), Construction (167 | 11.6%), Accommodation & Food Services (140 | 9.8%), and Manufacturing (104 | 7.2%).
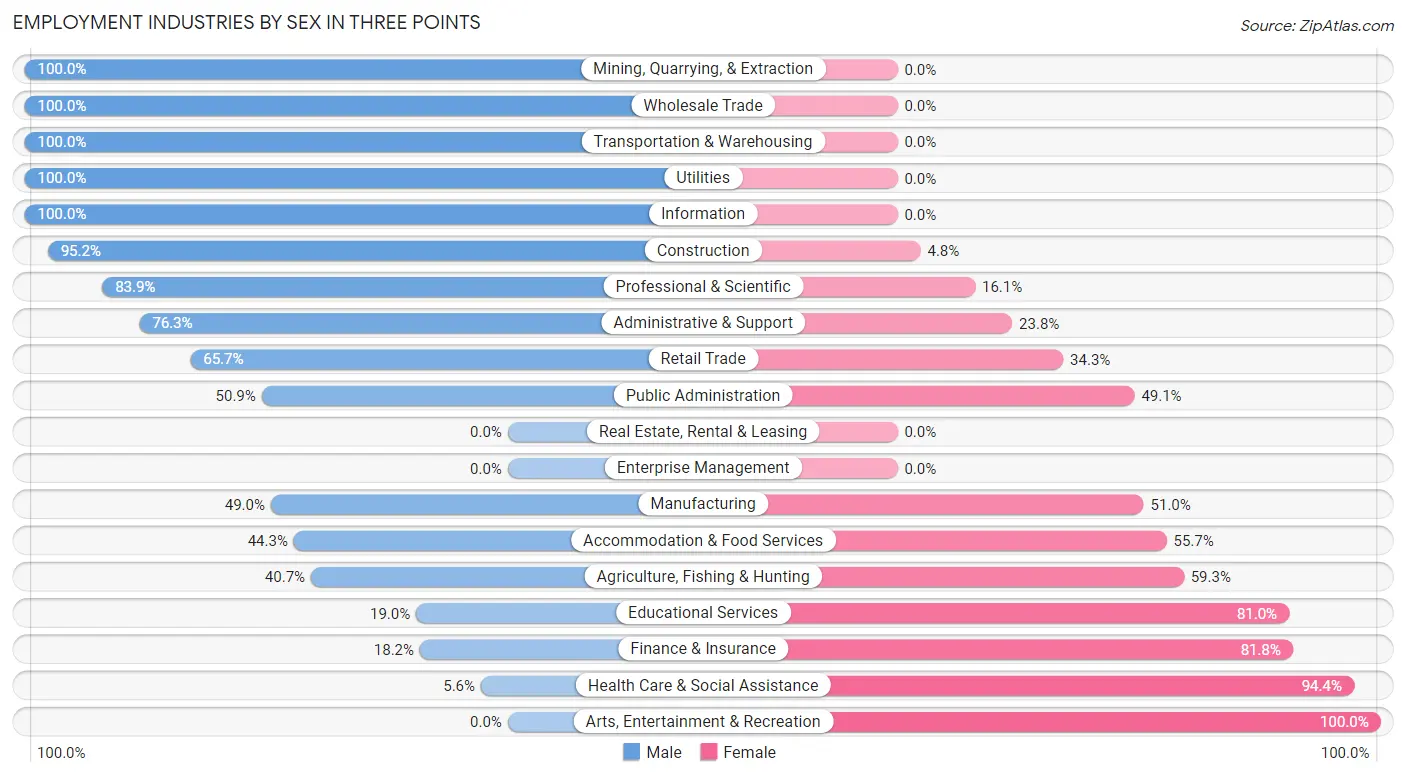
Employment Industries by Sex in Three Points
The Three Points industries that see more men than women are Mining, Quarrying, & Extraction (100.0%), Wholesale Trade (100.0%), and Transportation & Warehousing (100.0%), whereas the industries that tend to have a higher number of women are Arts, Entertainment & Recreation (100.0%), Health Care & Social Assistance (94.4%), and Finance & Insurance (81.8%).
| Industry | Male | Female |
| Agriculture, Fishing & Hunting | 11 (40.7%) | 16 (59.3%) |
| Mining, Quarrying, & Extraction | 70 (100.0%) | 0 (0.0%) |
| Construction | 159 (95.2%) | 8 (4.8%) |
| Manufacturing | 51 (49.0%) | 53 (51.0%) |
| Wholesale Trade | 71 (100.0%) | 0 (0.0%) |
| Retail Trade | 134 (65.7%) | 70 (34.3%) |
| Transportation & Warehousing | 30 (100.0%) | 0 (0.0%) |
| Utilities | 7 (100.0%) | 0 (0.0%) |
| Information | 18 (100.0%) | 0 (0.0%) |
| Finance & Insurance | 8 (18.2%) | 36 (81.8%) |
| Real Estate, Rental & Leasing | 0 (0.0%) | 0 (0.0%) |
| Professional & Scientific | 47 (83.9%) | 9 (16.1%) |
| Enterprise Management | 0 (0.0%) | 0 (0.0%) |
| Administrative & Support | 61 (76.2%) | 19 (23.7%) |
| Educational Services | 11 (19.0%) | 47 (81.0%) |
| Health Care & Social Assistance | 11 (5.6%) | 187 (94.4%) |
| Arts, Entertainment & Recreation | 0 (0.0%) | 1 (100.0%) |
| Accommodation & Food Services | 62 (44.3%) | 78 (55.7%) |
| Public Administration | 27 (50.9%) | 26 (49.1%) |
| Total | 842 (58.7%) | 593 (41.3%) |
Education in Three Points
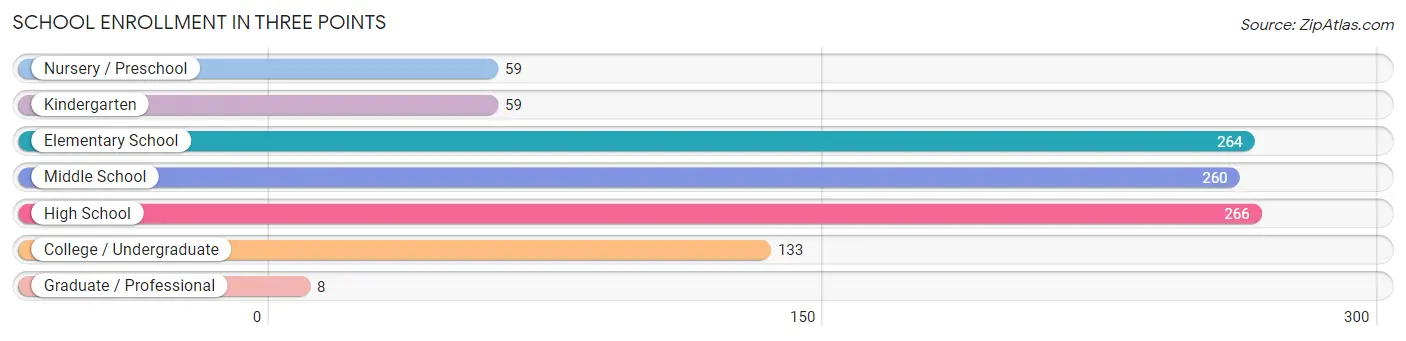
School Enrollment in Three Points
The most common levels of schooling among the 1,049 students in Three Points are high school (266 | 25.4%), elementary school (264 | 25.2%), and middle school (260 | 24.8%).
| School Level | # Students | % Students |
| Nursery / Preschool | 59 | 5.6% |
| Kindergarten | 59 | 5.6% |
| Elementary School | 264 | 25.2% |
| Middle School | 260 | 24.8% |
| High School | 266 | 25.4% |
| College / Undergraduate | 133 | 12.7% |
| Graduate / Professional | 8 | 0.8% |
| Total | 1,049 | 100.0% |
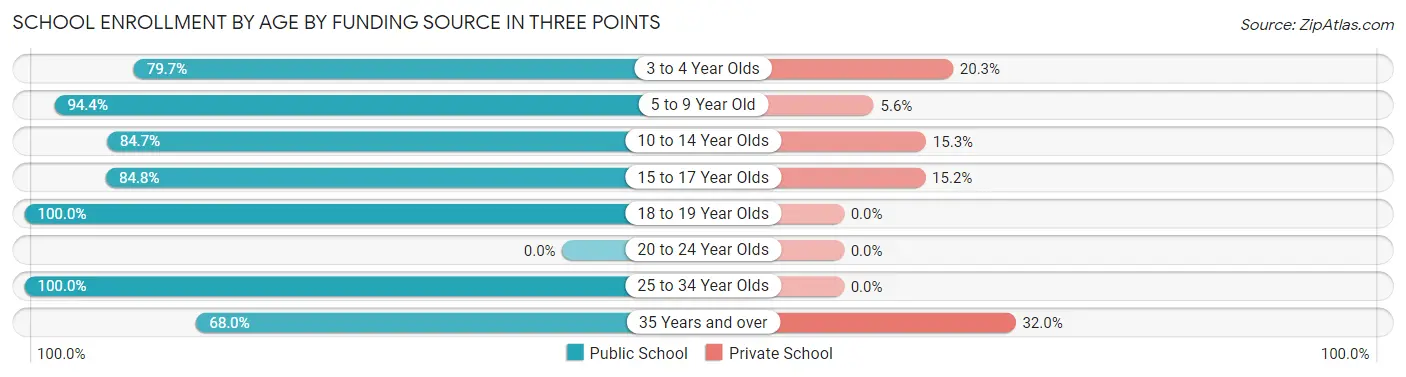
School Enrollment by Age by Funding Source in Three Points
Out of a total of 1,049 students who are enrolled in schools in Three Points, 108 (10.3%) attend a private institution, while the remaining 941 (89.7%) are enrolled in public schools. The age group of 35 years and over has the highest likelihood of being enrolled in private schools, with 8 (32.0% in the age bracket) enrolled. Conversely, the age group of 18 to 19 year olds has the lowest likelihood of being enrolled in a private school, with 68 (100.0% in the age bracket) attending a public institution.
| Age Bracket | Public School | Private School |
| 3 to 4 Year Olds | 47 (79.7%) | 12 (20.3%) |
| 5 to 9 Year Old | 339 (94.4%) | 20 (5.6%) |
| 10 to 14 Year Olds | 188 (84.7%) | 34 (15.3%) |
| 15 to 17 Year Olds | 190 (84.8%) | 34 (15.2%) |
| 18 to 19 Year Olds | 68 (100.0%) | 0 (0.0%) |
| 20 to 24 Year Olds | 0 (0.0%) | 0 (0.0%) |
| 25 to 34 Year Olds | 92 (100.0%) | 0 (0.0%) |
| 35 Years and over | 17 (68.0%) | 8 (32.0%) |
| Total | 941 (89.7%) | 108 (10.3%) |
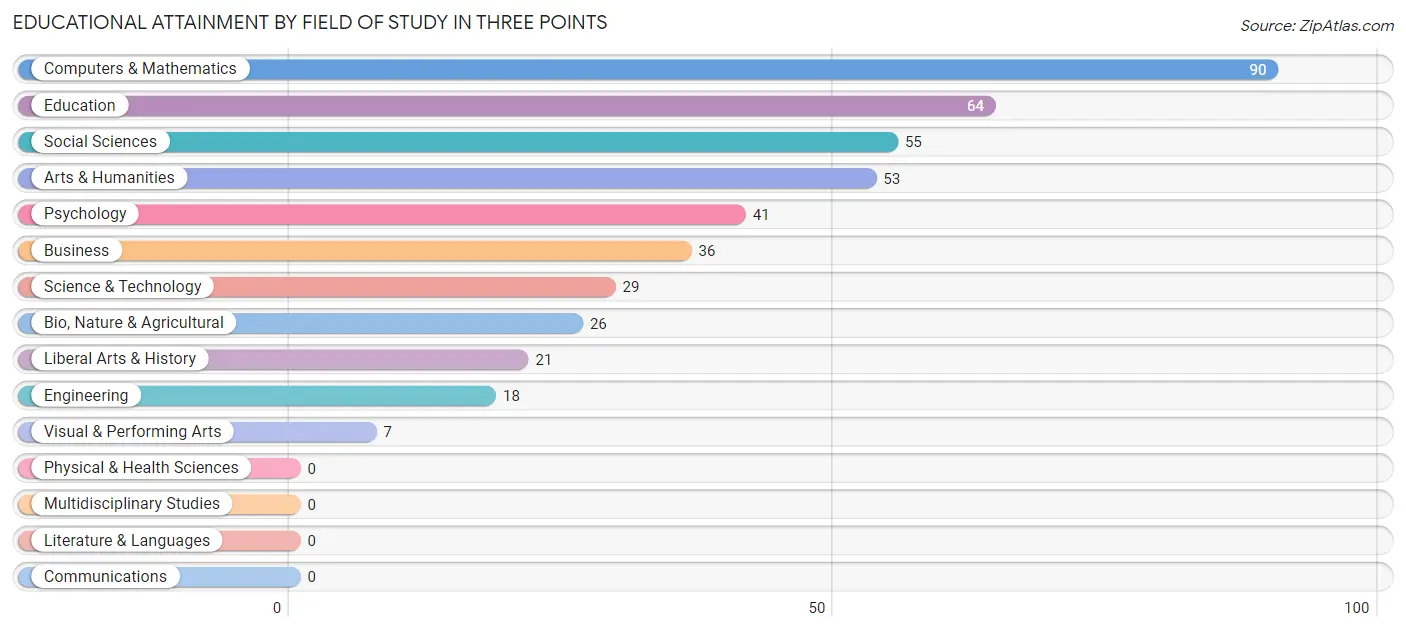
Educational Attainment by Field of Study in Three Points
Computers & mathematics (90 | 20.4%), education (64 | 14.5%), social sciences (55 | 12.5%), arts & humanities (53 | 12.0%), and psychology (41 | 9.3%) are the most common fields of study among 440 individuals in Three Points who have obtained a bachelor's degree or higher.
| Field of Study | # Graduates | % Graduates |
| Computers & Mathematics | 90 | 20.4% |
| Bio, Nature & Agricultural | 26 | 5.9% |
| Physical & Health Sciences | 0 | 0.0% |
| Psychology | 41 | 9.3% |
| Social Sciences | 55 | 12.5% |
| Engineering | 18 | 4.1% |
| Multidisciplinary Studies | 0 | 0.0% |
| Science & Technology | 29 | 6.6% |
| Business | 36 | 8.2% |
| Education | 64 | 14.5% |
| Literature & Languages | 0 | 0.0% |
| Liberal Arts & History | 21 | 4.8% |
| Visual & Performing Arts | 7 | 1.6% |
| Communications | 0 | 0.0% |
| Arts & Humanities | 53 | 12.0% |
| Total | 440 | 100.0% |
Transportation & Commute in Three Points
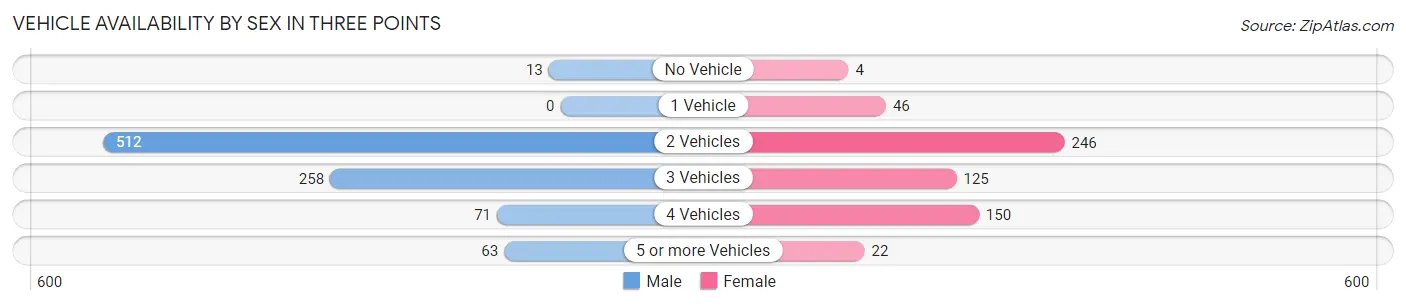
Vehicle Availability by Sex in Three Points
The most prevalent vehicle ownership categories in Three Points are males with 2 vehicles (512, accounting for 55.8%) and females with 2 vehicles (246, making up 86.3%).
| Vehicles Available | Male | Female |
| No Vehicle | 13 (1.4%) | 4 (0.7%) |
| 1 Vehicle | 0 (0.0%) | 46 (7.8%) |
| 2 Vehicles | 512 (55.8%) | 246 (41.5%) |
| 3 Vehicles | 258 (28.1%) | 125 (21.1%) |
| 4 Vehicles | 71 (7.7%) | 150 (25.3%) |
| 5 or more Vehicles | 63 (6.9%) | 22 (3.7%) |
| Total | 917 (100.0%) | 593 (100.0%) |
Commute Time in Three Points
The most frequently occuring commute durations in Three Points are 15 to 19 minutes (254 commuters, 18.0%), 30 to 34 minutes (248 commuters, 17.6%), and 40 to 44 minutes (213 commuters, 15.1%).
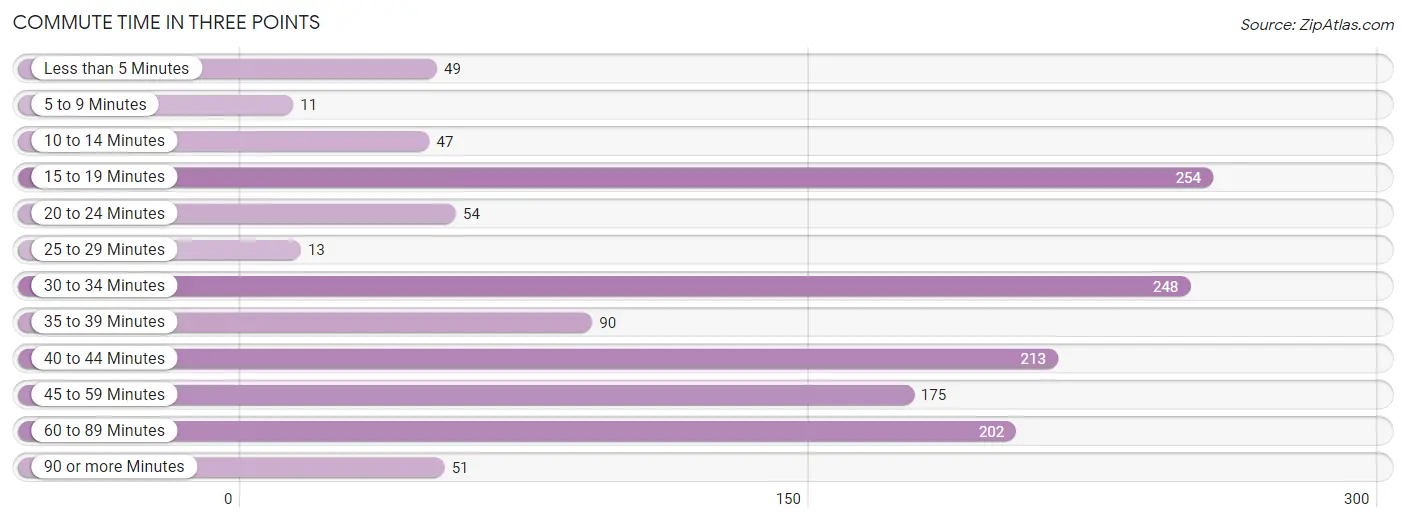
| Commute Time | # Commuters | % Commuters |
| Less than 5 Minutes | 49 | 3.5% |
| 5 to 9 Minutes | 11 | 0.8% |
| 10 to 14 Minutes | 47 | 3.3% |
| 15 to 19 Minutes | 254 | 18.0% |
| 20 to 24 Minutes | 54 | 3.8% |
| 25 to 29 Minutes | 13 | 0.9% |
| 30 to 34 Minutes | 248 | 17.6% |
| 35 to 39 Minutes | 90 | 6.4% |
| 40 to 44 Minutes | 213 | 15.1% |
| 45 to 59 Minutes | 175 | 12.4% |
| 60 to 89 Minutes | 202 | 14.4% |
| 90 or more Minutes | 51 | 3.6% |
Commute Time by Sex in Three Points
The most common commute times in Three Points are 15 to 19 minutes (231 commuters, 25.1%) for males and 40 to 44 minutes (114 commuters, 23.4%) for females.
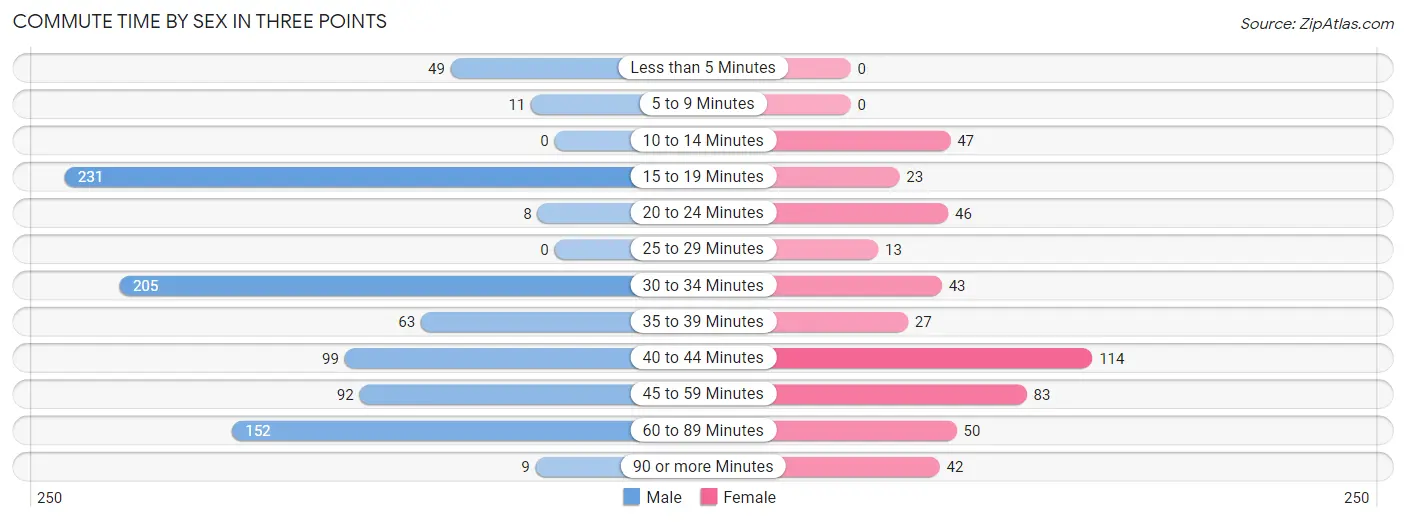
| Commute Time | Male | Female |
| Less than 5 Minutes | 49 (5.3%) | 0 (0.0%) |
| 5 to 9 Minutes | 11 (1.2%) | 0 (0.0%) |
| 10 to 14 Minutes | 0 (0.0%) | 47 (9.6%) |
| 15 to 19 Minutes | 231 (25.1%) | 23 (4.7%) |
| 20 to 24 Minutes | 8 (0.9%) | 46 (9.4%) |
| 25 to 29 Minutes | 0 (0.0%) | 13 (2.7%) |
| 30 to 34 Minutes | 205 (22.3%) | 43 (8.8%) |
| 35 to 39 Minutes | 63 (6.9%) | 27 (5.5%) |
| 40 to 44 Minutes | 99 (10.8%) | 114 (23.4%) |
| 45 to 59 Minutes | 92 (10.0%) | 83 (17.0%) |
| 60 to 89 Minutes | 152 (16.5%) | 50 (10.2%) |
| 90 or more Minutes | 9 (1.0%) | 42 (8.6%) |
Time of Departure to Work by Sex in Three Points
The most frequent times of departure to work in Three Points are 12:00 AM to 4:59 AM (246, 26.8%) for males and 9:00 AM to 9:59 AM (74, 15.2%) for females.
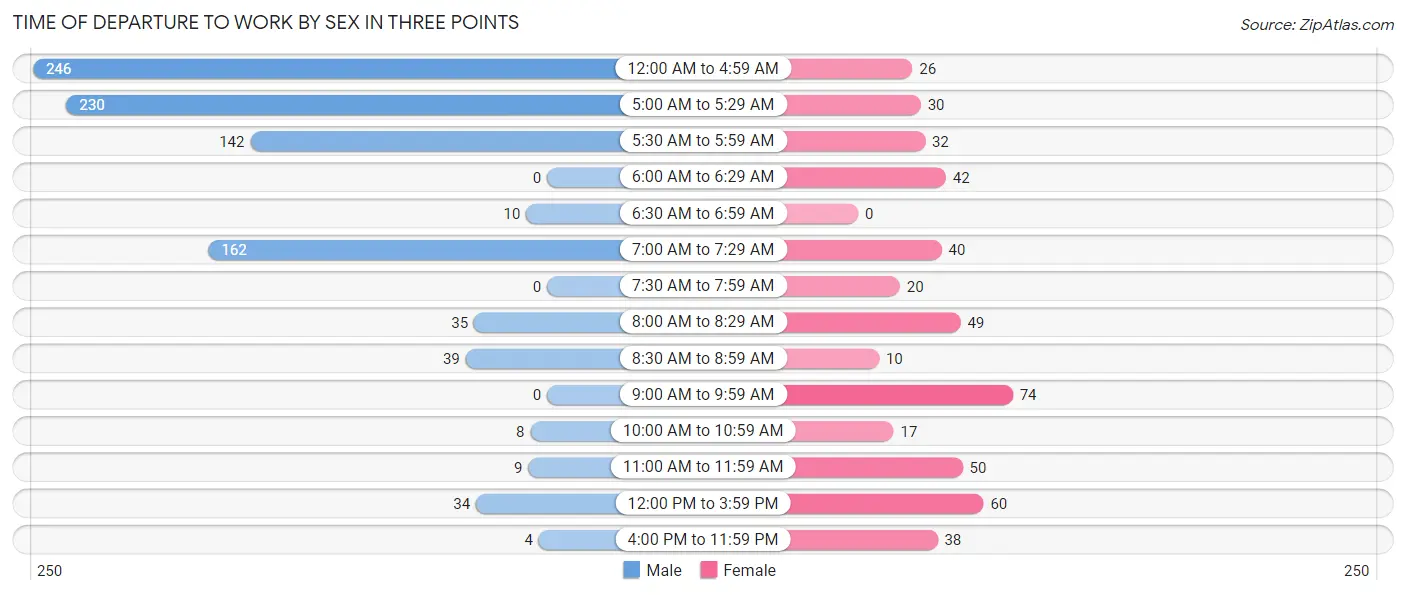
| Time of Departure | Male | Female |
| 12:00 AM to 4:59 AM | 246 (26.8%) | 26 (5.3%) |
| 5:00 AM to 5:29 AM | 230 (25.0%) | 30 (6.1%) |
| 5:30 AM to 5:59 AM | 142 (15.4%) | 32 (6.6%) |
| 6:00 AM to 6:29 AM | 0 (0.0%) | 42 (8.6%) |
| 6:30 AM to 6:59 AM | 10 (1.1%) | 0 (0.0%) |
| 7:00 AM to 7:29 AM | 162 (17.6%) | 40 (8.2%) |
| 7:30 AM to 7:59 AM | 0 (0.0%) | 20 (4.1%) |
| 8:00 AM to 8:29 AM | 35 (3.8%) | 49 (10.0%) |
| 8:30 AM to 8:59 AM | 39 (4.2%) | 10 (2.1%) |
| 9:00 AM to 9:59 AM | 0 (0.0%) | 74 (15.2%) |
| 10:00 AM to 10:59 AM | 8 (0.9%) | 17 (3.5%) |
| 11:00 AM to 11:59 AM | 9 (1.0%) | 50 (10.2%) |
| 12:00 PM to 3:59 PM | 34 (3.7%) | 60 (12.3%) |
| 4:00 PM to 11:59 PM | 4 (0.4%) | 38 (7.8%) |
| Total | 919 (100.0%) | 488 (100.0%) |
Housing Occupancy in Three Points
Occupancy by Ownership in Three Points
Of the total 1,975 dwellings in Three Points, owner-occupied units account for 1,724 (87.3%), while renter-occupied units make up 251 (12.7%).
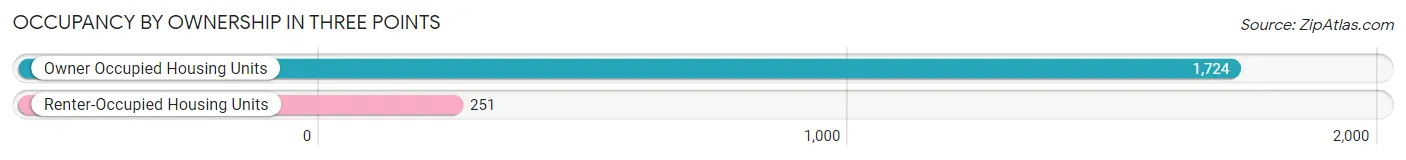
| Occupancy | # Housing Units | % Housing Units |
| Owner Occupied Housing Units | 1,724 | 87.3% |
| Renter-Occupied Housing Units | 251 | 12.7% |
| Total Occupied Housing Units | 1,975 | 100.0% |
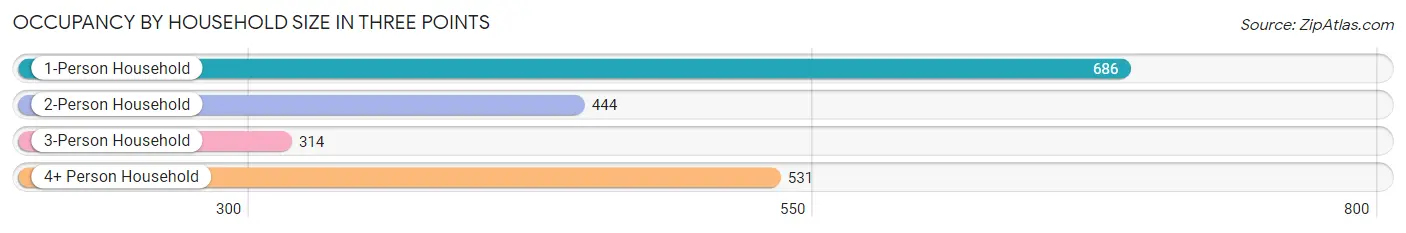
Occupancy by Household Size in Three Points
| Household Size | # Housing Units | % Housing Units |
| 1-Person Household | 686 | 34.7% |
| 2-Person Household | 444 | 22.5% |
| 3-Person Household | 314 | 15.9% |
| 4+ Person Household | 531 | 26.9% |
| Total Housing Units | 1,975 | 100.0% |
Occupancy by Ownership by Household Size in Three Points
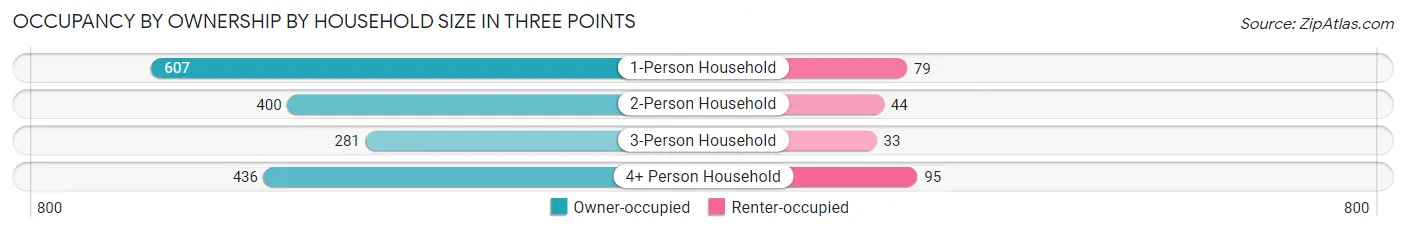
| Household Size | Owner-occupied | Renter-occupied |
| 1-Person Household | 607 (88.5%) | 79 (11.5%) |
| 2-Person Household | 400 (90.1%) | 44 (9.9%) |
| 3-Person Household | 281 (89.5%) | 33 (10.5%) |
| 4+ Person Household | 436 (82.1%) | 95 (17.9%) |
| Total Housing Units | 1,724 (87.3%) | 251 (12.7%) |
Occupancy by Educational Attainment in Three Points
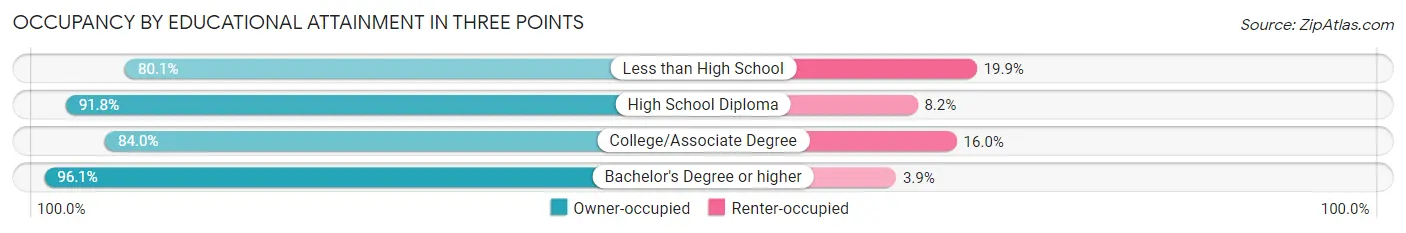
| Household Size | Owner-occupied | Renter-occupied |
| Less than High School | 233 (80.1%) | 58 (19.9%) |
| High School Diploma | 460 (91.8%) | 41 (8.2%) |
| College/Associate Degree | 737 (84.0%) | 140 (16.0%) |
| Bachelor's Degree or higher | 294 (96.1%) | 12 (3.9%) |
Occupancy by Age of Householder in Three Points
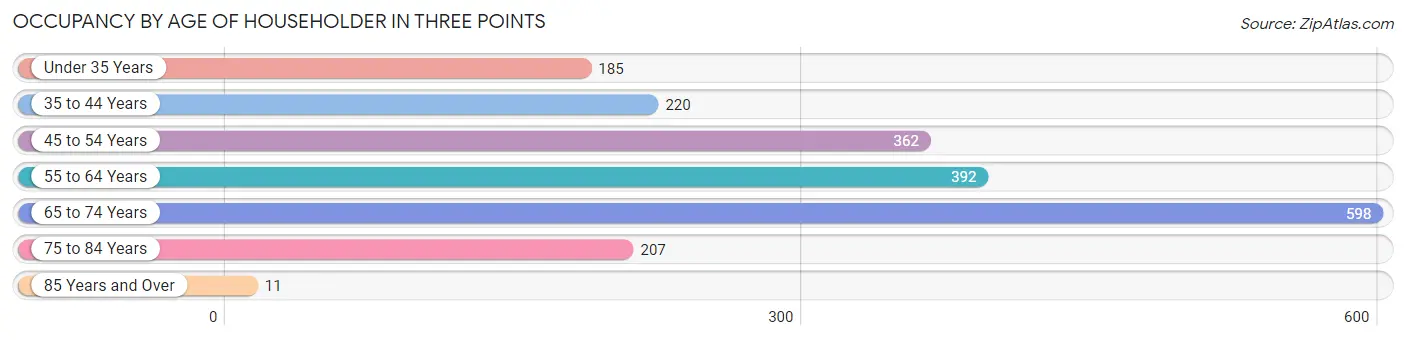
| Age Bracket | # Households | % Households |
| Under 35 Years | 185 | 9.4% |
| 35 to 44 Years | 220 | 11.1% |
| 45 to 54 Years | 362 | 18.3% |
| 55 to 64 Years | 392 | 19.9% |
| 65 to 74 Years | 598 | 30.3% |
| 75 to 84 Years | 207 | 10.5% |
| 85 Years and Over | 11 | 0.6% |
| Total | 1,975 | 100.0% |
Housing Finances in Three Points
Median Income by Occupancy in Three Points
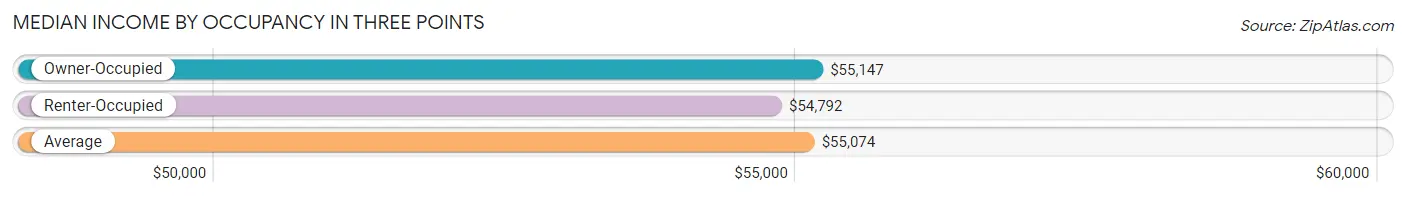
| Occupancy Type | # Households | Median Income |
| Owner-Occupied | 1,724 (87.3%) | $55,147 |
| Renter-Occupied | 251 (12.7%) | $54,792 |
| Average | 1,975 (100.0%) | $55,074 |
Occupancy by Householder Income Bracket in Three Points
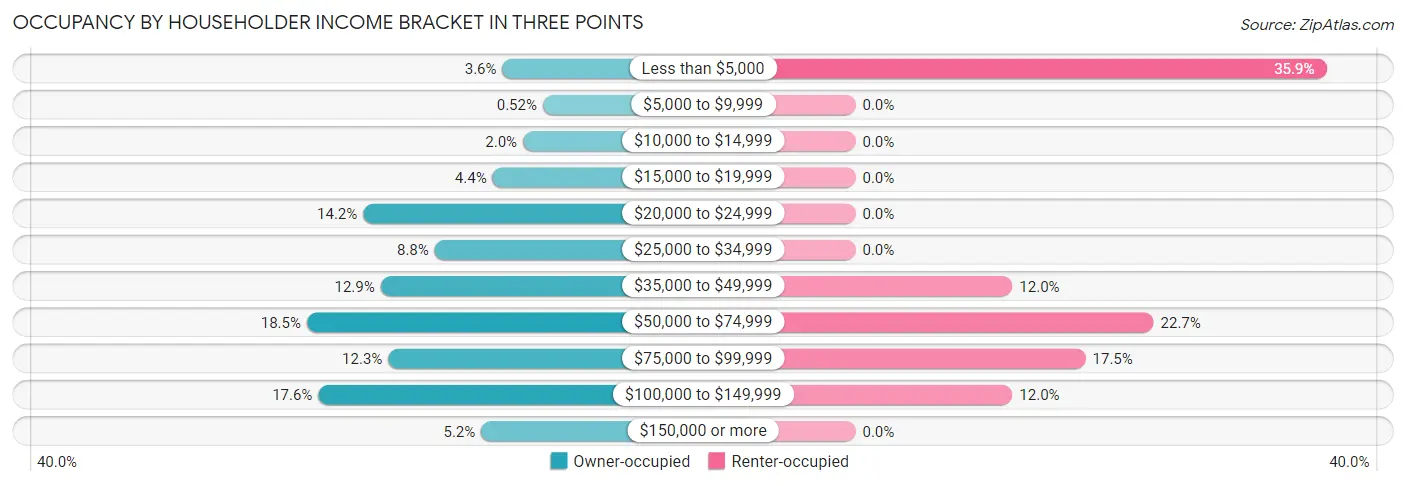
| Income Bracket | Owner-occupied | Renter-occupied |
| Less than $5,000 | 62 (3.6%) | 90 (35.9%) |
| $5,000 to $9,999 | 9 (0.5%) | 0 (0.0%) |
| $10,000 to $14,999 | 35 (2.0%) | 0 (0.0%) |
| $15,000 to $19,999 | 75 (4.3%) | 0 (0.0%) |
| $20,000 to $24,999 | 245 (14.2%) | 0 (0.0%) |
| $25,000 to $34,999 | 151 (8.8%) | 0 (0.0%) |
| $35,000 to $49,999 | 222 (12.9%) | 30 (11.9%) |
| $50,000 to $74,999 | 319 (18.5%) | 57 (22.7%) |
| $75,000 to $99,999 | 212 (12.3%) | 44 (17.5%) |
| $100,000 to $149,999 | 304 (17.6%) | 30 (11.9%) |
| $150,000 or more | 90 (5.2%) | 0 (0.0%) |
| Total | 1,724 (100.0%) | 251 (100.0%) |
Monthly Housing Cost Tiers in Three Points
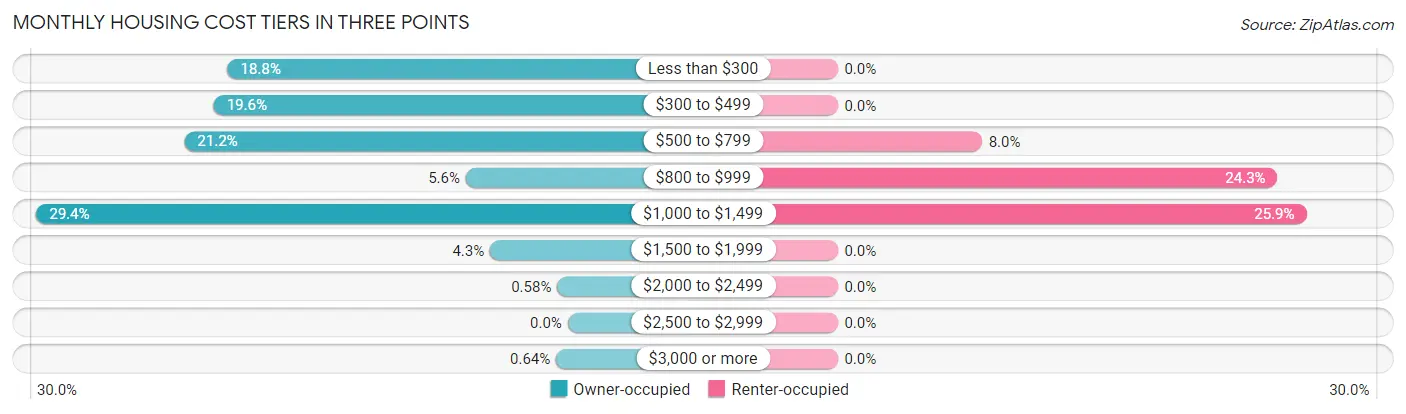
| Monthly Cost | Owner-occupied | Renter-occupied |
| Less than $300 | 324 (18.8%) | 0 (0.0%) |
| $300 to $499 | 337 (19.6%) | 0 (0.0%) |
| $500 to $799 | 365 (21.2%) | 20 (8.0%) |
| $800 to $999 | 97 (5.6%) | 61 (24.3%) |
| $1,000 to $1,499 | 506 (29.3%) | 65 (25.9%) |
| $1,500 to $1,999 | 74 (4.3%) | 0 (0.0%) |
| $2,000 to $2,499 | 10 (0.6%) | 0 (0.0%) |
| $2,500 to $2,999 | 0 (0.0%) | 0 (0.0%) |
| $3,000 or more | 11 (0.6%) | 0 (0.0%) |
| Total | 1,724 (100.0%) | 251 (100.0%) |
Physical Housing Characteristics in Three Points
Housing Structures in Three Points
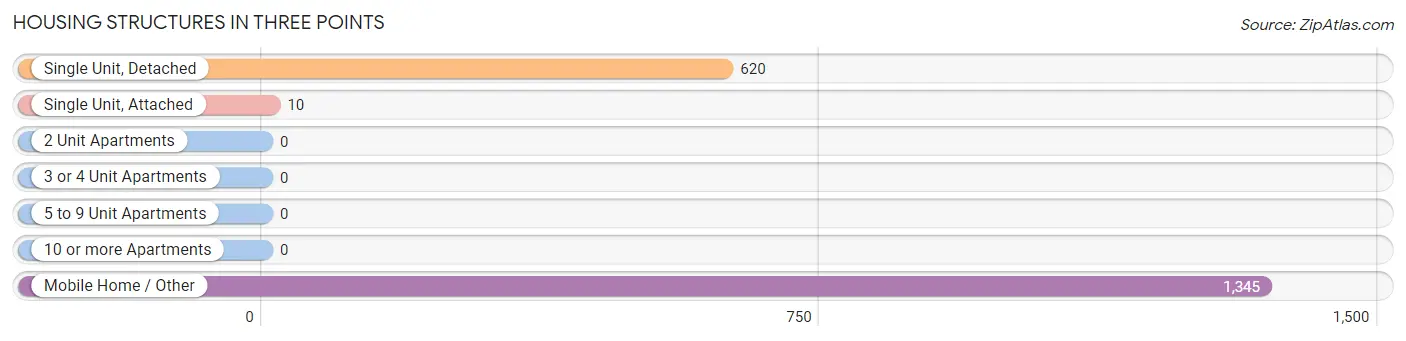
| Structure Type | # Housing Units | % Housing Units |
| Single Unit, Detached | 620 | 31.4% |
| Single Unit, Attached | 10 | 0.5% |
| 2 Unit Apartments | 0 | 0.0% |
| 3 or 4 Unit Apartments | 0 | 0.0% |
| 5 to 9 Unit Apartments | 0 | 0.0% |
| 10 or more Apartments | 0 | 0.0% |
| Mobile Home / Other | 1,345 | 68.1% |
| Total | 1,975 | 100.0% |
Housing Structures by Occupancy in Three Points
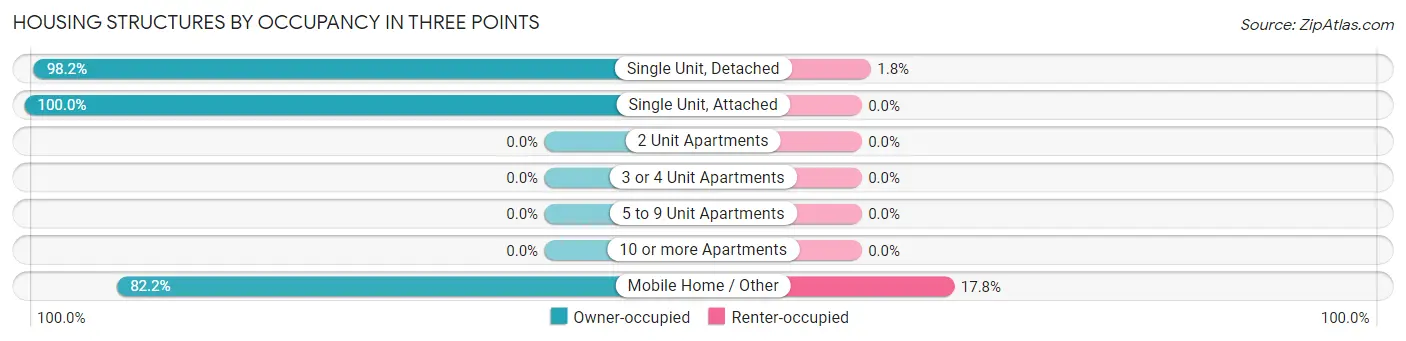
| Structure Type | Owner-occupied | Renter-occupied |
| Single Unit, Detached | 609 (98.2%) | 11 (1.8%) |
| Single Unit, Attached | 10 (100.0%) | 0 (0.0%) |
| 2 Unit Apartments | 0 (0.0%) | 0 (0.0%) |
| 3 or 4 Unit Apartments | 0 (0.0%) | 0 (0.0%) |
| 5 to 9 Unit Apartments | 0 (0.0%) | 0 (0.0%) |
| 10 or more Apartments | 0 (0.0%) | 0 (0.0%) |
| Mobile Home / Other | 1,105 (82.2%) | 240 (17.8%) |
| Total | 1,724 (87.3%) | 251 (12.7%) |
Housing Structures by Number of Rooms in Three Points
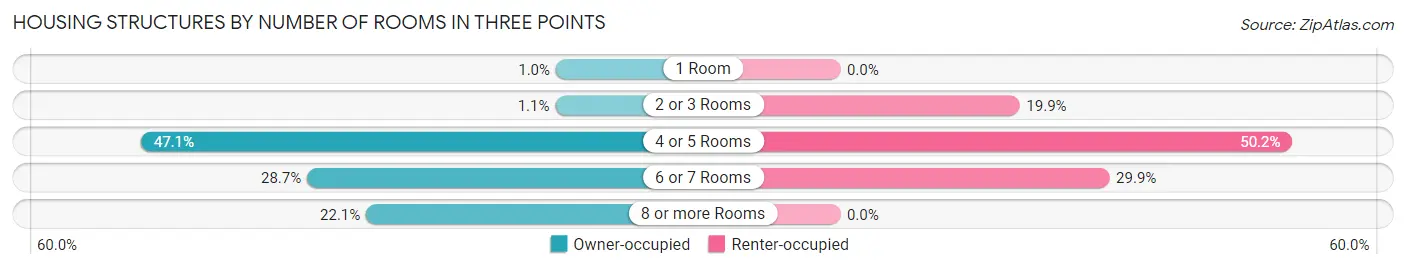
| Number of Rooms | Owner-occupied | Renter-occupied |
| 1 Room | 18 (1.0%) | 0 (0.0%) |
| 2 or 3 Rooms | 19 (1.1%) | 50 (19.9%) |
| 4 or 5 Rooms | 812 (47.1%) | 126 (50.2%) |
| 6 or 7 Rooms | 494 (28.6%) | 75 (29.9%) |
| 8 or more Rooms | 381 (22.1%) | 0 (0.0%) |
| Total | 1,724 (100.0%) | 251 (100.0%) |
Housing Structure by Heating Type in Three Points
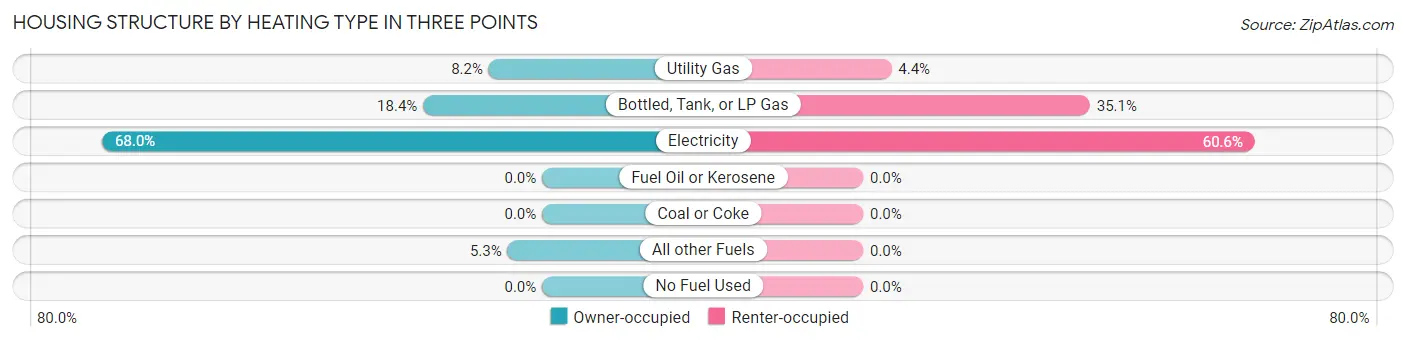
| Heating Type | Owner-occupied | Renter-occupied |
| Utility Gas | 142 (8.2%) | 11 (4.4%) |
| Bottled, Tank, or LP Gas | 317 (18.4%) | 88 (35.1%) |
| Electricity | 1,173 (68.0%) | 152 (60.6%) |
| Fuel Oil or Kerosene | 0 (0.0%) | 0 (0.0%) |
| Coal or Coke | 0 (0.0%) | 0 (0.0%) |
| All other Fuels | 92 (5.3%) | 0 (0.0%) |
| No Fuel Used | 0 (0.0%) | 0 (0.0%) |
| Total | 1,724 (100.0%) | 251 (100.0%) |
Household Vehicle Usage in Three Points
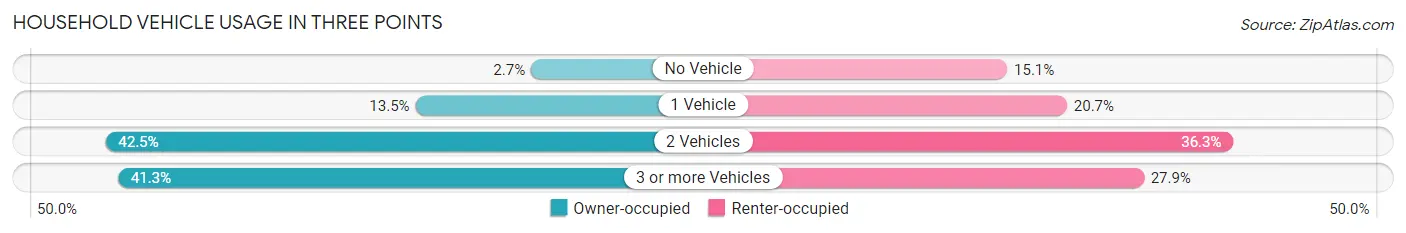
| Vehicles per Household | Owner-occupied | Renter-occupied |
| No Vehicle | 47 (2.7%) | 38 (15.1%) |
| 1 Vehicle | 233 (13.5%) | 52 (20.7%) |
| 2 Vehicles | 732 (42.5%) | 91 (36.2%) |
| 3 or more Vehicles | 712 (41.3%) | 70 (27.9%) |
| Total | 1,724 (100.0%) | 251 (100.0%) |
Real Estate & Mortgages in Three Points
Real Estate and Mortgage Overview in Three Points
| Characteristic | Without Mortgage | With Mortgage |
| Housing Units | 855 | 869 |
| Median Property Value | $110,700 | $161,400 |
| Median Household Income | $42,125 | $75 |
| Monthly Housing Costs | $338 | $11 |
| Real Estate Taxes | $919 | $42 |
Property Value by Mortgage Status in Three Points
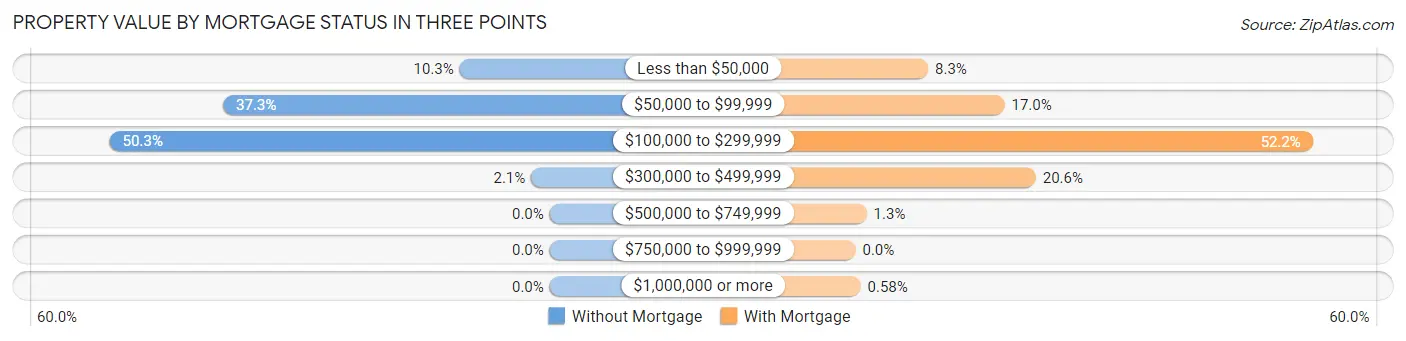
| Property Value | Without Mortgage | With Mortgage |
| Less than $50,000 | 88 (10.3%) | 72 (8.3%) |
| $50,000 to $99,999 | 319 (37.3%) | 148 (17.0%) |
| $100,000 to $299,999 | 430 (50.3%) | 454 (52.2%) |
| $300,000 to $499,999 | 18 (2.1%) | 179 (20.6%) |
| $500,000 to $749,999 | 0 (0.0%) | 11 (1.3%) |
| $750,000 to $999,999 | 0 (0.0%) | 0 (0.0%) |
| $1,000,000 or more | 0 (0.0%) | 5 (0.6%) |
| Total | 855 (100.0%) | 869 (100.0%) |
Household Income by Mortgage Status in Three Points
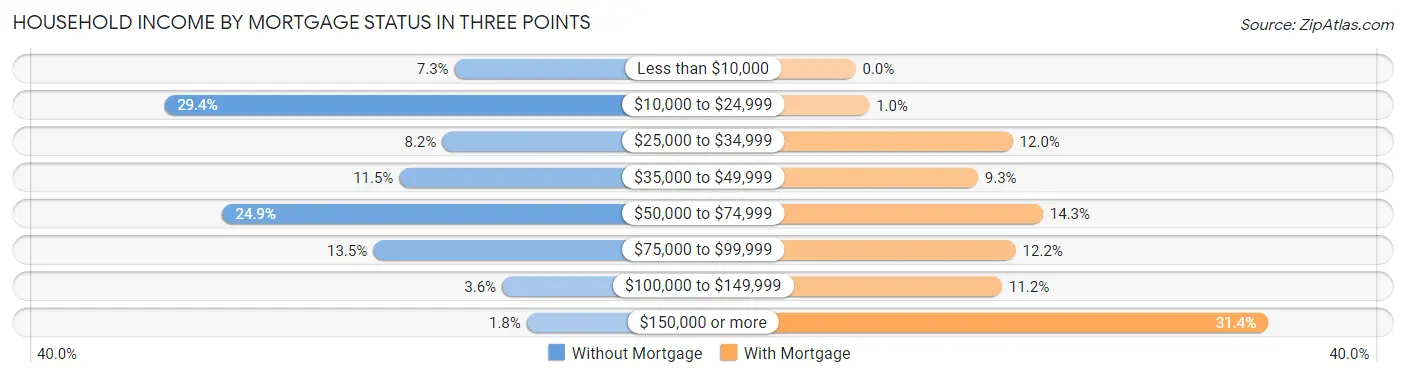
| Household Income | Without Mortgage | With Mortgage |
| Less than $10,000 | 62 (7.2%) | 0 (0.0%) |
| $10,000 to $24,999 | 251 (29.4%) | 9 (1.0%) |
| $25,000 to $34,999 | 70 (8.2%) | 104 (12.0%) |
| $35,000 to $49,999 | 98 (11.5%) | 81 (9.3%) |
| $50,000 to $74,999 | 213 (24.9%) | 124 (14.3%) |
| $75,000 to $99,999 | 115 (13.5%) | 106 (12.2%) |
| $100,000 to $149,999 | 31 (3.6%) | 97 (11.2%) |
| $150,000 or more | 15 (1.8%) | 273 (31.4%) |
| Total | 855 (100.0%) | 869 (100.0%) |
Property Value to Household Income Ratio in Three Points
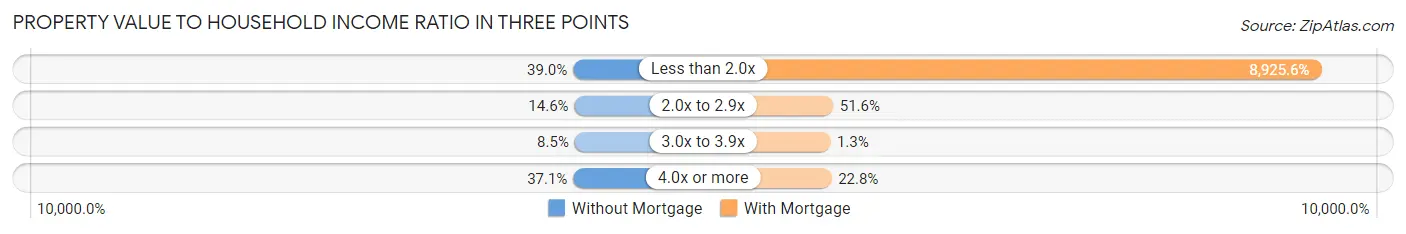
| Value-to-Income Ratio | Without Mortgage | With Mortgage |
| Less than 2.0x | 333 (39.0%) | 77,563 (8,925.5%) |
| 2.0x to 2.9x | 125 (14.6%) | 448 (51.5%) |
| 3.0x to 3.9x | 73 (8.5%) | 11 (1.3%) |
| 4.0x or more | 317 (37.1%) | 198 (22.8%) |
| Total | 855 (100.0%) | 869 (100.0%) |
Real Estate Taxes by Mortgage Status in Three Points
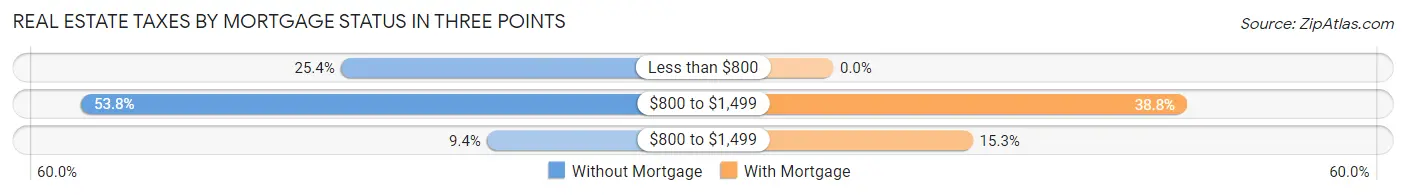
| Property Taxes | Without Mortgage | With Mortgage |
| Less than $800 | 217 (25.4%) | 0 (0.0%) |
| $800 to $1,499 | 460 (53.8%) | 337 (38.8%) |
| $800 to $1,499 | 80 (9.4%) | 133 (15.3%) |
| Total | 855 (100.0%) | 869 (100.0%) |
Health & Disability in Three Points
Health Insurance Coverage by Age in Three Points
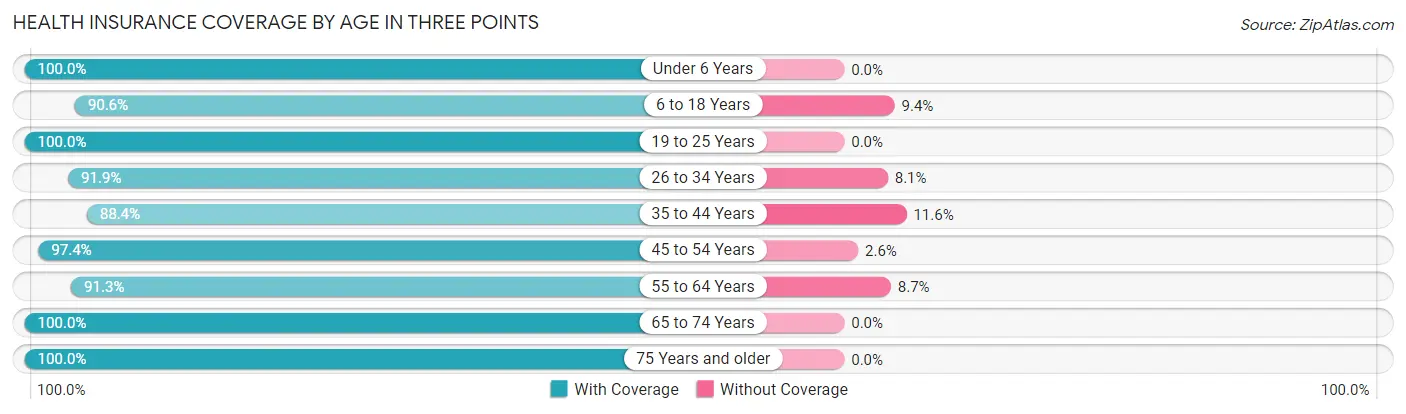
| Age Bracket | With Coverage | Without Coverage |
| Under 6 Years | 600 (100.0%) | 0 (0.0%) |
| 6 to 18 Years | 676 (90.6%) | 70 (9.4%) |
| 19 to 25 Years | 195 (100.0%) | 0 (0.0%) |
| 26 to 34 Years | 646 (91.9%) | 57 (8.1%) |
| 35 to 44 Years | 343 (88.4%) | 45 (11.6%) |
| 45 to 54 Years | 490 (97.4%) | 13 (2.6%) |
| 55 to 64 Years | 568 (91.3%) | 54 (8.7%) |
| 65 to 74 Years | 816 (100.0%) | 0 (0.0%) |
| 75 Years and older | 442 (100.0%) | 0 (0.0%) |
| Total | 4,776 (95.2%) | 239 (4.8%) |
Health Insurance Coverage by Citizenship Status in Three Points
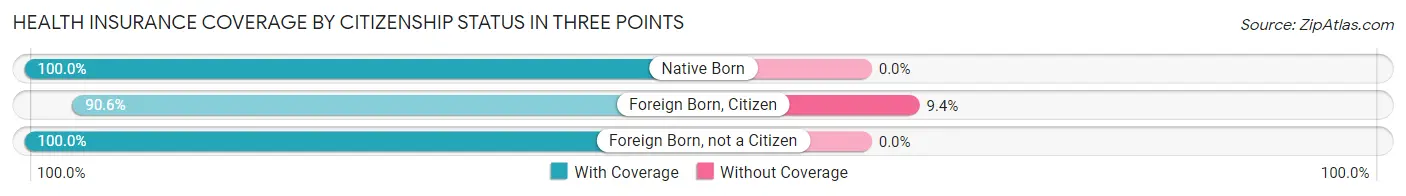
| Citizenship Status | With Coverage | Without Coverage |
| Native Born | 600 (100.0%) | 0 (0.0%) |
| Foreign Born, Citizen | 676 (90.6%) | 70 (9.4%) |
| Foreign Born, not a Citizen | 195 (100.0%) | 0 (0.0%) |
Health Insurance Coverage by Household Income in Three Points
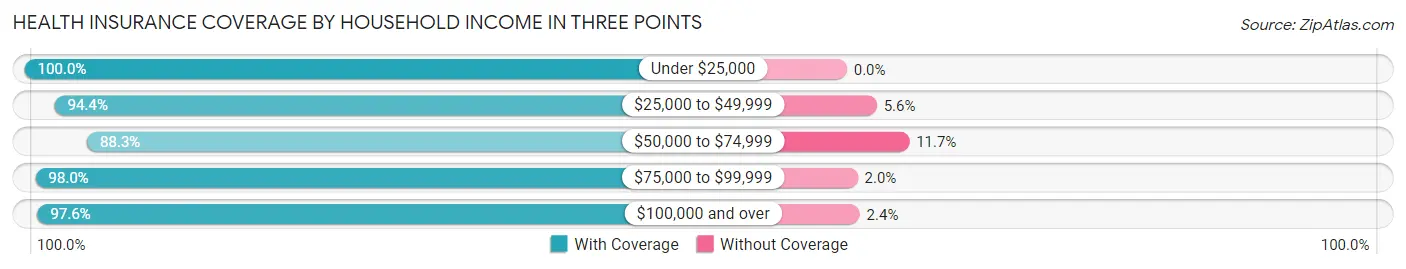
| Household Income | With Coverage | Without Coverage |
| Under $25,000 | 828 (100.0%) | 0 (0.0%) |
| $25,000 to $49,999 | 909 (94.4%) | 54 (5.6%) |
| $50,000 to $74,999 | 1,043 (88.3%) | 138 (11.7%) |
| $75,000 to $99,999 | 530 (98.0%) | 11 (2.0%) |
| $100,000 and over | 1,456 (97.6%) | 36 (2.4%) |
Public vs Private Health Insurance Coverage by Age in Three Points
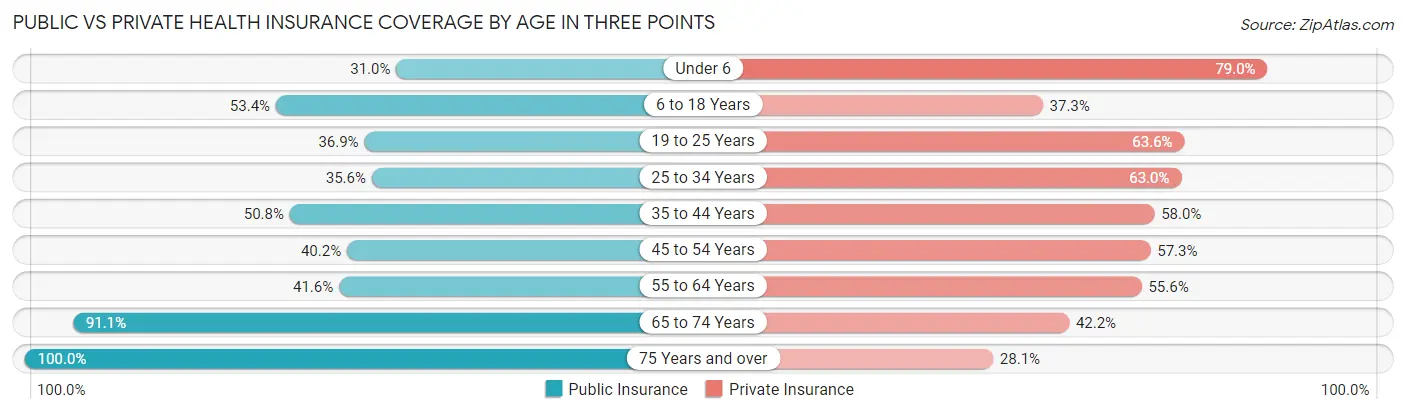
| Age Bracket | Public Insurance | Private Insurance |
| Under 6 | 186 (31.0%) | 474 (79.0%) |
| 6 to 18 Years | 398 (53.3%) | 278 (37.3%) |
| 19 to 25 Years | 72 (36.9%) | 124 (63.6%) |
| 25 to 34 Years | 250 (35.6%) | 443 (63.0%) |
| 35 to 44 Years | 197 (50.8%) | 225 (58.0%) |
| 45 to 54 Years | 202 (40.2%) | 288 (57.3%) |
| 55 to 64 Years | 259 (41.6%) | 346 (55.6%) |
| 65 to 74 Years | 743 (91.0%) | 344 (42.2%) |
| 75 Years and over | 442 (100.0%) | 124 (28.1%) |
| Total | 2,749 (54.8%) | 2,646 (52.8%) |
Disability Status by Sex by Age in Three Points
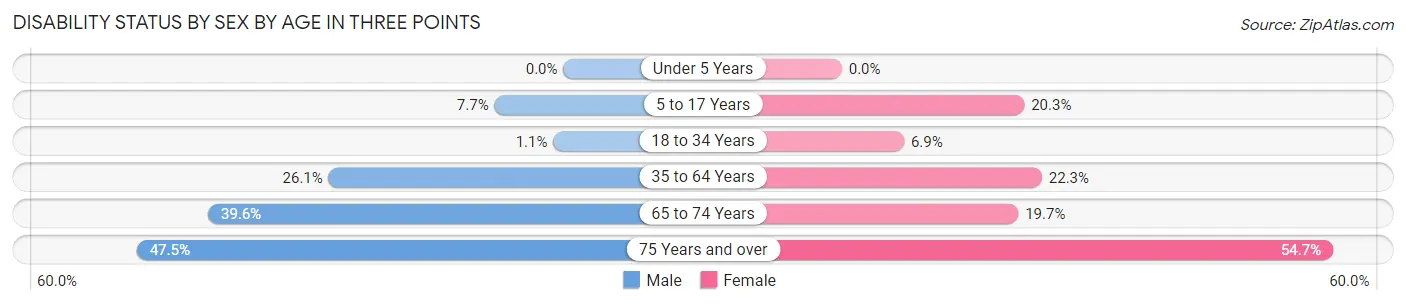
| Age Bracket | Male | Female |
| Under 5 Years | 0 (0.0%) | 0 (0.0%) |
| 5 to 17 Years | 34 (7.7%) | 77 (20.3%) |
| 18 to 34 Years | 5 (1.1%) | 33 (6.9%) |
| 35 to 64 Years | 189 (26.1%) | 176 (22.3%) |
| 65 to 74 Years | 188 (39.6%) | 67 (19.7%) |
| 75 Years and over | 124 (47.5%) | 99 (54.7%) |
Disability Class by Sex by Age in Three Points
Disability Class: Hearing Difficulty
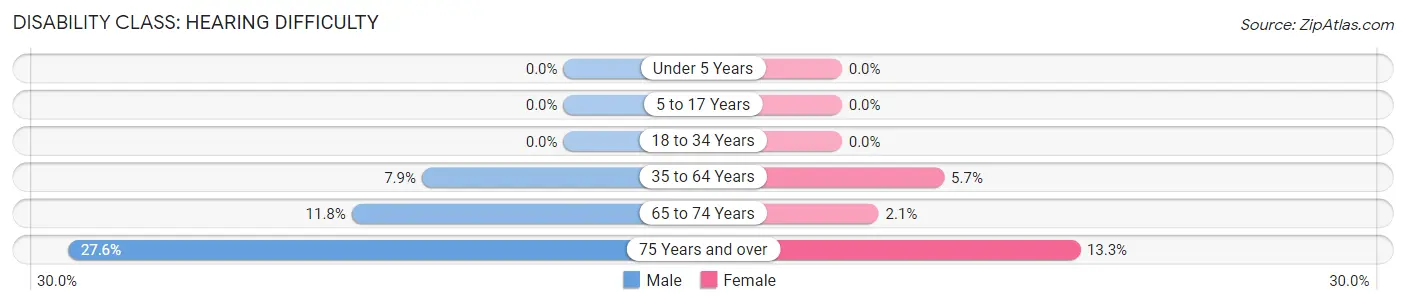
| Age Bracket | Male | Female |
| Under 5 Years | 0 (0.0%) | 0 (0.0%) |
| 5 to 17 Years | 0 (0.0%) | 0 (0.0%) |
| 18 to 34 Years | 0 (0.0%) | 0 (0.0%) |
| 35 to 64 Years | 57 (7.9%) | 45 (5.7%) |
| 65 to 74 Years | 56 (11.8%) | 7 (2.1%) |
| 75 Years and over | 72 (27.6%) | 24 (13.3%) |
Disability Class: Vision Difficulty
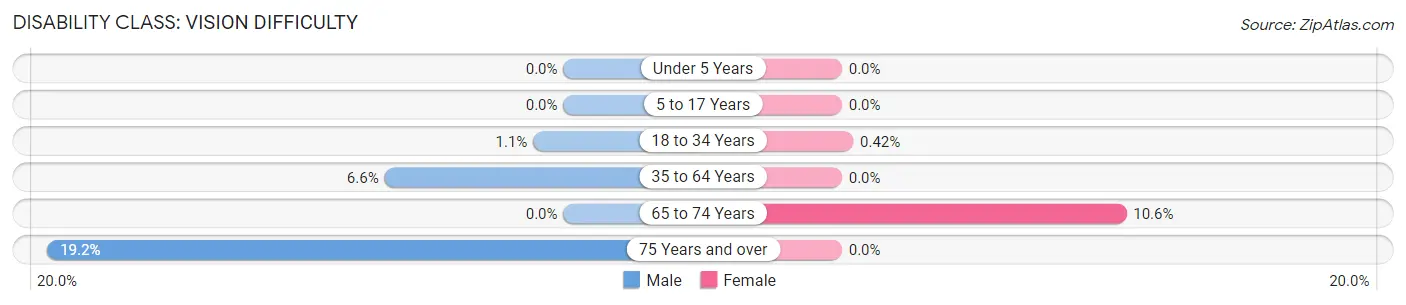
| Age Bracket | Male | Female |
| Under 5 Years | 0 (0.0%) | 0 (0.0%) |
| 5 to 17 Years | 0 (0.0%) | 0 (0.0%) |
| 18 to 34 Years | 5 (1.1%) | 2 (0.4%) |
| 35 to 64 Years | 48 (6.6%) | 0 (0.0%) |
| 65 to 74 Years | 0 (0.0%) | 36 (10.6%) |
| 75 Years and over | 50 (19.2%) | 0 (0.0%) |
Disability Class: Cognitive Difficulty
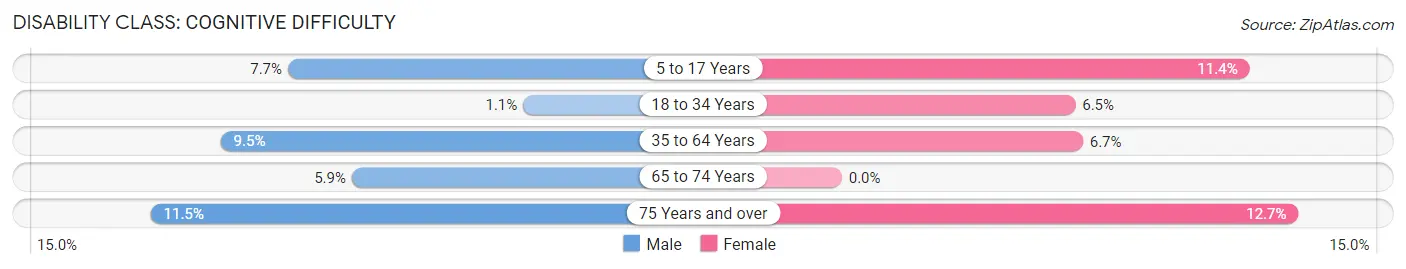
| Age Bracket | Male | Female |
| 5 to 17 Years | 34 (7.7%) | 43 (11.4%) |
| 18 to 34 Years | 5 (1.1%) | 31 (6.5%) |
| 35 to 64 Years | 69 (9.5%) | 53 (6.7%) |
| 65 to 74 Years | 28 (5.9%) | 0 (0.0%) |
| 75 Years and over | 30 (11.5%) | 23 (12.7%) |
Disability Class: Ambulatory Difficulty
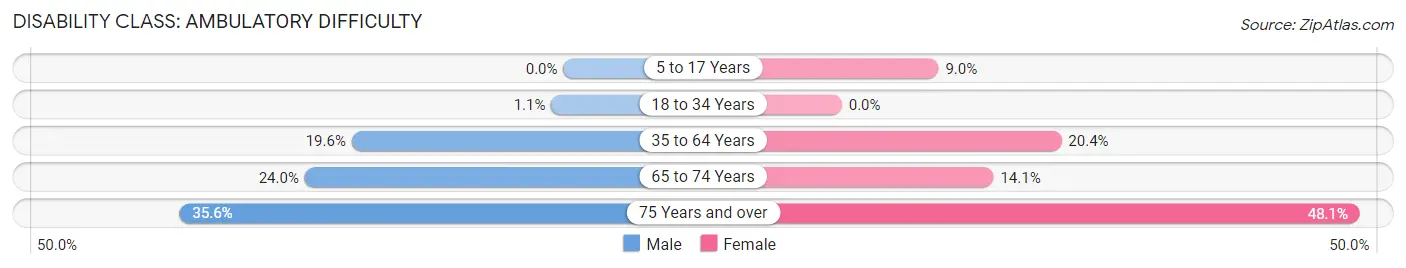
| Age Bracket | Male | Female |
| 5 to 17 Years | 0 (0.0%) | 34 (9.0%) |
| 18 to 34 Years | 5 (1.1%) | 0 (0.0%) |
| 35 to 64 Years | 142 (19.6%) | 161 (20.4%) |
| 65 to 74 Years | 114 (24.0%) | 48 (14.1%) |
| 75 Years and over | 93 (35.6%) | 87 (48.1%) |
Disability Class: Self-Care Difficulty
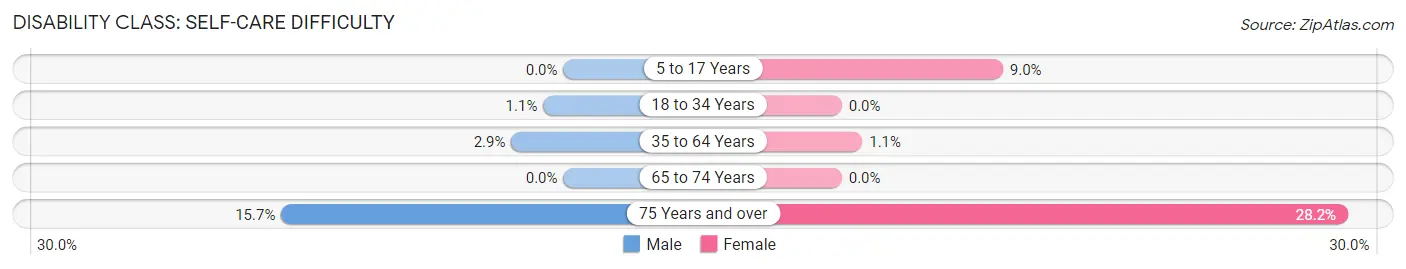
| Age Bracket | Male | Female |
| 5 to 17 Years | 0 (0.0%) | 34 (9.0%) |
| 18 to 34 Years | 5 (1.1%) | 0 (0.0%) |
| 35 to 64 Years | 21 (2.9%) | 9 (1.1%) |
| 65 to 74 Years | 0 (0.0%) | 0 (0.0%) |
| 75 Years and over | 41 (15.7%) | 51 (28.2%) |
Technology Access in Three Points
Computing Device Access in Three Points
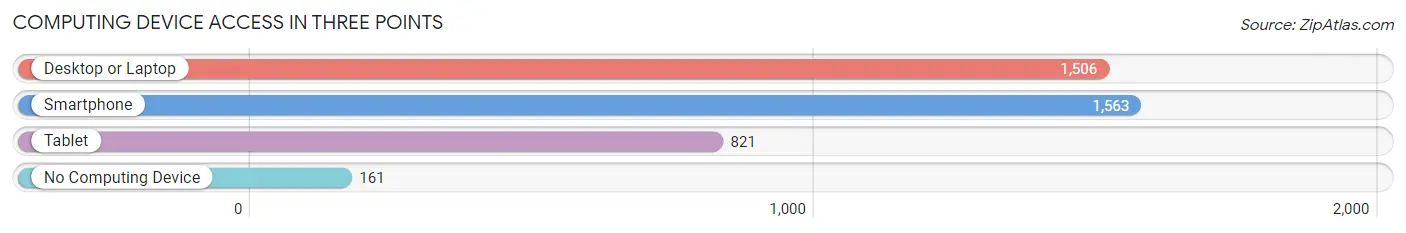
| Device Type | # Households | % Households |
| Desktop or Laptop | 1,506 | 76.2% |
| Smartphone | 1,563 | 79.1% |
| Tablet | 821 | 41.6% |
| No Computing Device | 161 | 8.2% |
| Total | 1,975 | 100.0% |
Internet Access in Three Points
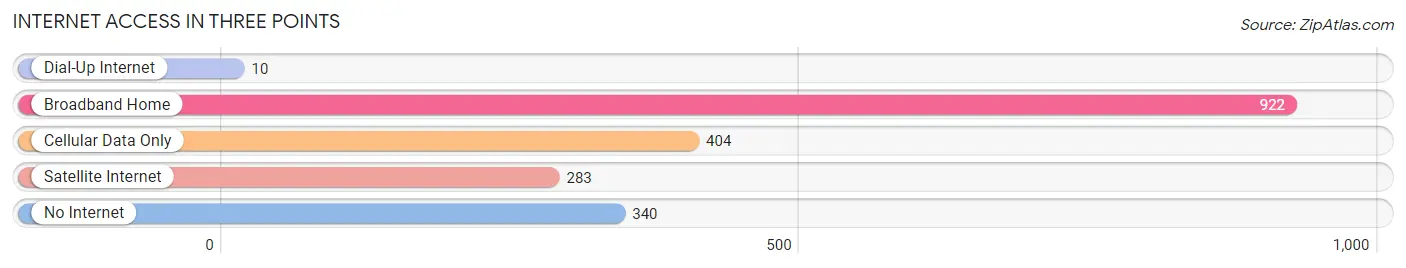
| Internet Type | # Households | % Households |
| Dial-Up Internet | 10 | 0.5% |
| Broadband Home | 922 | 46.7% |
| Cellular Data Only | 404 | 20.5% |
| Satellite Internet | 283 | 14.3% |
| No Internet | 340 | 17.2% |
| Total | 1,975 | 100.0% |
Three Points Summary
History
Three Points, Arizona is a small unincorporated community located in Pima County, Arizona. It is situated in the Sonoran Desert, approximately 40 miles west of Tucson. The area was first settled in the late 1800s by ranchers and farmers, and the town was officially established in the early 1900s.
The town was originally named “Three Points” because of its location at the intersection of three roads. The roads were the Tucson-Ajo Highway, the Marana-Tucson Road, and the Three Points-Tucson Road. The town was a popular stop for travelers and ranchers, and it quickly grew into a small community.
In the early 1900s, the town was home to a post office, a general store, a school, and a few other businesses. The town was also home to a number of ranches, which provided employment for many of the residents.
In the 1950s, the town began to decline as the population shifted to larger cities. The post office closed in the 1960s, and the school closed in the 1970s. By the 1980s, the town was largely abandoned.
In the 1990s, the town began to experience a resurgence as people began to move back to the area. The population has grown steadily since then, and the town now has a population of around 500 people.
Geography
Three Points is located in the Sonoran Desert, approximately 40 miles west of Tucson. The town is situated at an elevation of 2,400 feet, and the surrounding area is mostly flat desert terrain. The town is located at the intersection of three roads, which is where it gets its name.
The climate in Three Points is hot and dry, with temperatures ranging from the mid-90s in the summer to the mid-50s in the winter. The area receives very little rainfall, with an average of only 8 inches per year.
Economy
The economy of Three Points is largely based on agriculture and ranching. The area is home to a number of ranches, which provide employment for many of the residents. The town also has a few small businesses, including a general store and a gas station.
Demographics
As of the 2010 census, the population of Three Points was 498. The racial makeup of the town was 94.4% White, 0.2% African American, 0.4% Native American, 0.2% Asian, 0.2% Pacific Islander, and 4.6% from other races. The median household income was $35,000, and the median age was 37.
Conclusion
Three Points, Arizona is a small unincorporated community located in Pima County, Arizona. It is situated in the Sonoran Desert, approximately 40 miles west of Tucson. The town was originally settled in the late 1800s by ranchers and farmers, and it has experienced a resurgence in recent years. The economy of Three Points is largely based on agriculture and ranching, and the population is around 500 people.
Common Questions
What is Per Capita Income in Three Points?
Per Capita income in Three Points is $25,963.
What is the Median Family Income in Three Points?
Median Family Income in Three Points is $67,790.
What is the Median Household income in Three Points?
Median Household Income in Three Points is $55,074.
What is Income or Wage Gap in Three Points?
Income or Wage Gap in Three Points is 1.6%.
Women in Three Points earn 98.4 cents for every dollar earned by a man.
What is Inequality or Gini Index in Three Points?
Inequality or Gini Index in Three Points is 0.42.
What is the Total Population of Three Points?
Total Population of Three Points is 5,100.
What is the Total Male Population of Three Points?
Total Male Population of Three Points is 2,810.
What is the Total Female Population of Three Points?
Total Female Population of Three Points is 2,290.
What is the Ratio of Males per 100 Females in Three Points?
There are 122.71 Males per 100 Females in Three Points.
What is the Ratio of Females per 100 Males in Three Points?
There are 81.49 Females per 100 Males in Three Points.
What is the Median Population Age in Three Points?
Median Population Age in Three Points is 41.3 Years.
What is the Average Family Size in Three Points
Average Family Size in Three Points is 3.4 People.
What is the Average Household Size in Three Points
Average Household Size in Three Points is 2.6 People.
How Large is the Labor Force in Three Points?
There are 1,596 People in the Labor Forcein in Three Points.
What is the Percentage of People in the Labor Force in Three Points?
40.1% of People are in the Labor Force in Three Points.
What is the Unemployment Rate in Three Points?
Unemployment Rate in Three Points is 4.9%.