Zip Codes with the Highest Percentage of Population Employed in Food Preparation & Serving in Gilbert, AZ
RELATED REPORTS & OPTIONS
Food Preparation & Serving
Gilbert
Compare Zip Codes
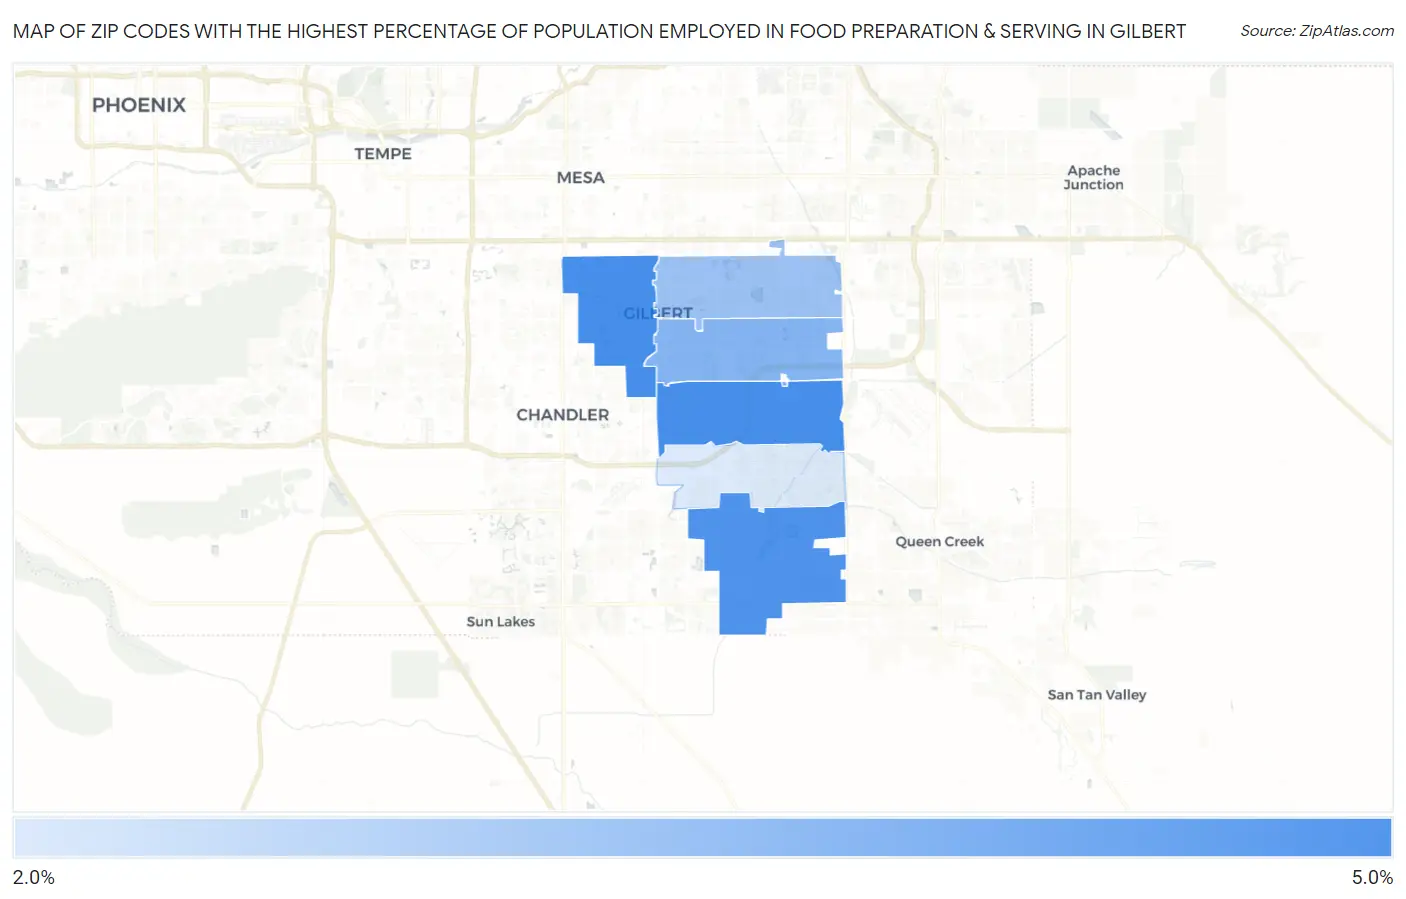
Map of Zip Codes with the Highest Percentage of Population Employed in Food Preparation & Serving in Gilbert
2.7%
4.7%
Zip Codes with the Highest Percentage of Population Employed in Food Preparation & Serving in Gilbert, AZ
| Zip Code | % Employed | vs State | vs National | |
| 1. | 85233 | 4.7% | 5.7%(-0.956)#210 | 5.3%(-0.575)#14,117 |
| 2. | 85295 | 4.7% | 5.7%(-0.970)#212 | 5.3%(-0.589)#14,170 |
| 3. | 85298 | 4.6% | 5.7%(-1.04)#217 | 5.3%(-0.655)#14,446 |
| 4. | 85296 | 3.9% | 5.7%(-1.77)#251 | 5.3%(-1.39)#17,535 |
| 5. | 85234 | 3.6% | 5.7%(-2.09)#269 | 5.3%(-1.71)#18,861 |
| 6. | 85297 | 2.7% | 5.7%(-2.92)#310 | 5.3%(-2.54)#22,271 |
1
Common Questions
What are the Top 5 Zip Codes with the Highest Percentage of Population Employed in Food Preparation & Serving in Gilbert, AZ?
Top 5 Zip Codes with the Highest Percentage of Population Employed in Food Preparation & Serving in Gilbert, AZ are:
What zip code has the Highest Percentage of Population Employed in Food Preparation & Serving in Gilbert, AZ?
85233 has the Highest Percentage of Population Employed in Food Preparation & Serving in Gilbert, AZ with 4.7%.
What is the Percentage of Population Employed in Food Preparation & Serving in Gilbert, AZ?
Percentage of Population Employed in Food Preparation & Serving in Gilbert is 4.1%.
What is the Percentage of Population Employed in Food Preparation & Serving in Arizona?
Percentage of Population Employed in Food Preparation & Serving in Arizona is 5.7%.
What is the Percentage of Population Employed in Food Preparation & Serving in the United States?
Percentage of Population Employed in Food Preparation & Serving in the United States is 5.3%.