Avenue B and C, AZ Map & Demographics
Avenue B and C Map
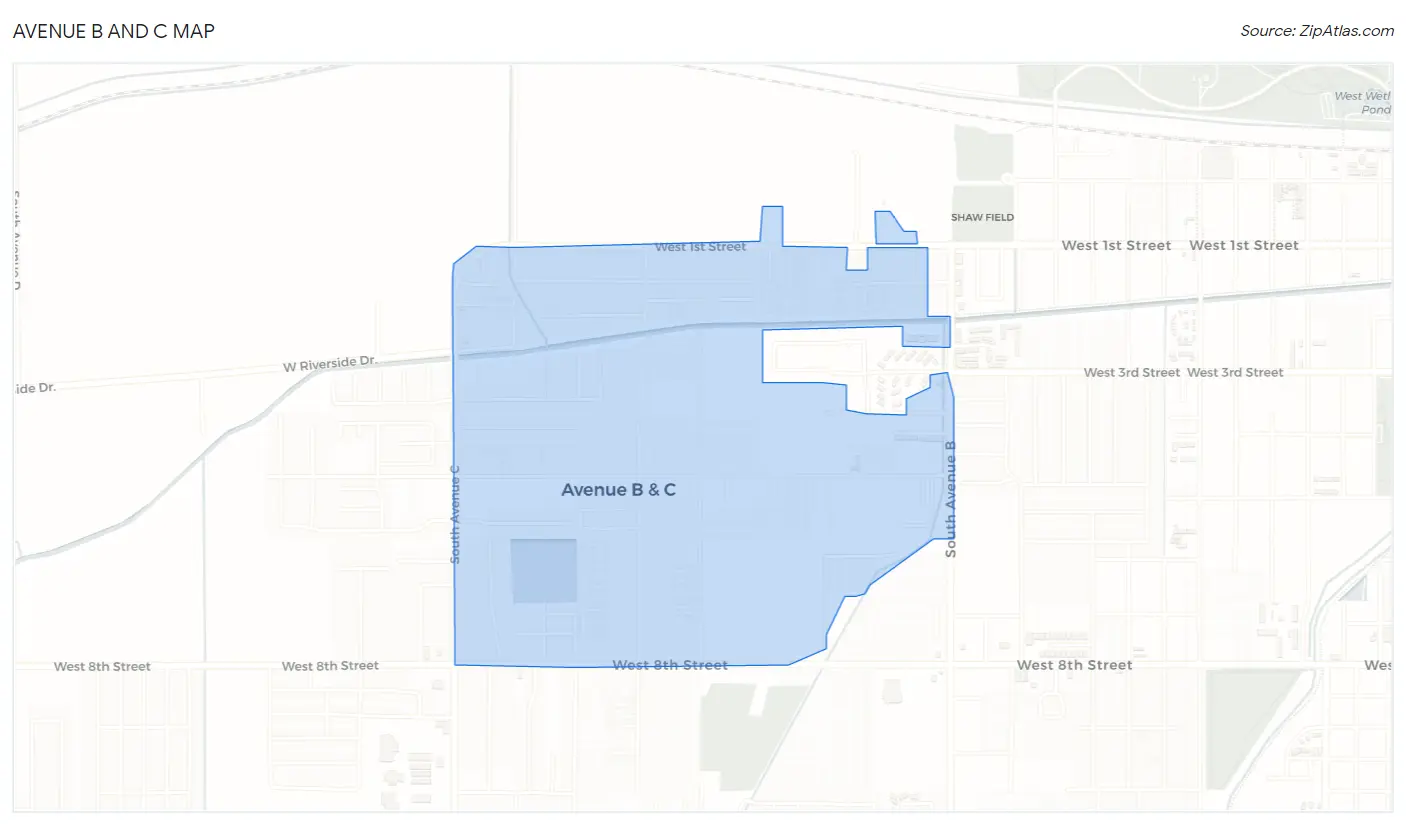
Avenue B and C Overview
$21,045
PER CAPITA INCOME
$39,126
AVG FAMILY INCOME
$37,346
AVG HOUSEHOLD INCOME
43.7%
WAGE / INCOME GAP [ % ]
56.3¢/ $1
WAGE / INCOME GAP [ $ ]
$4,509
FAMILY INCOME DEFICIT
0.47
INEQUALITY / GINI INDEX
3,850
TOTAL POPULATION
1,908
MALE POPULATION
1,942
FEMALE POPULATION
98.25
MALES / 100 FEMALES
101.78
FEMALES / 100 MALES
30.5
MEDIAN AGE
3.0
AVG FAMILY SIZE
2.5
AVG HOUSEHOLD SIZE
1,490
LABOR FORCE [ PEOPLE ]
54.7%
PERCENT IN LABOR FORCE
21.5%
UNEMPLOYMENT RATE
Income in Avenue B and C
Income Overview in Avenue B and C
Per Capita Income in Avenue B and C is $21,045, while median incomes of families and households are $39,126 and $37,346 respectively.
| Characteristic | Number | Measure |
| Per Capita Income | 3,850 | $21,045 |
| Median Family Income | 1,057 | $39,126 |
| Mean Family Income | 1,057 | $44,229 |
| Median Household Income | 1,520 | $37,346 |
| Mean Household Income | 1,520 | $49,645 |
| Income Deficit | 1,057 | $4,509 |
| Wage / Income Gap (%) | 3,850 | 43.66% |
| Wage / Income Gap ($) | 3,850 | 56.34¢ per $1 |
| Gini / Inequality Index | 3,850 | 0.47 |
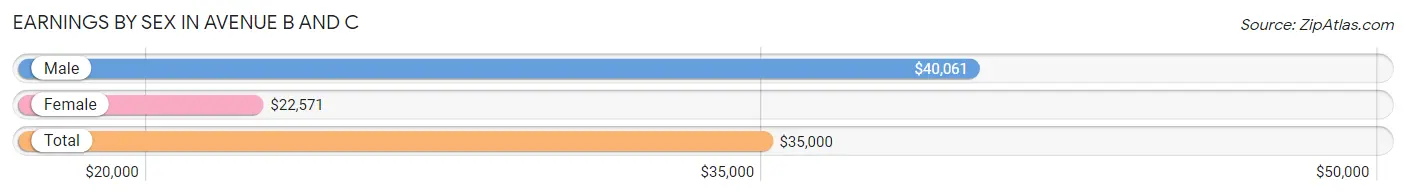
Earnings by Sex in Avenue B and C
Average Earnings in Avenue B and C are $35,000, $40,061 for men and $22,571 for women, a difference of 43.7%.
| Sex | Number | Average Earnings |
| Male | 846 (59.9%) | $40,061 |
| Female | 566 (40.1%) | $22,571 |
| Total | 1,412 (100.0%) | $35,000 |
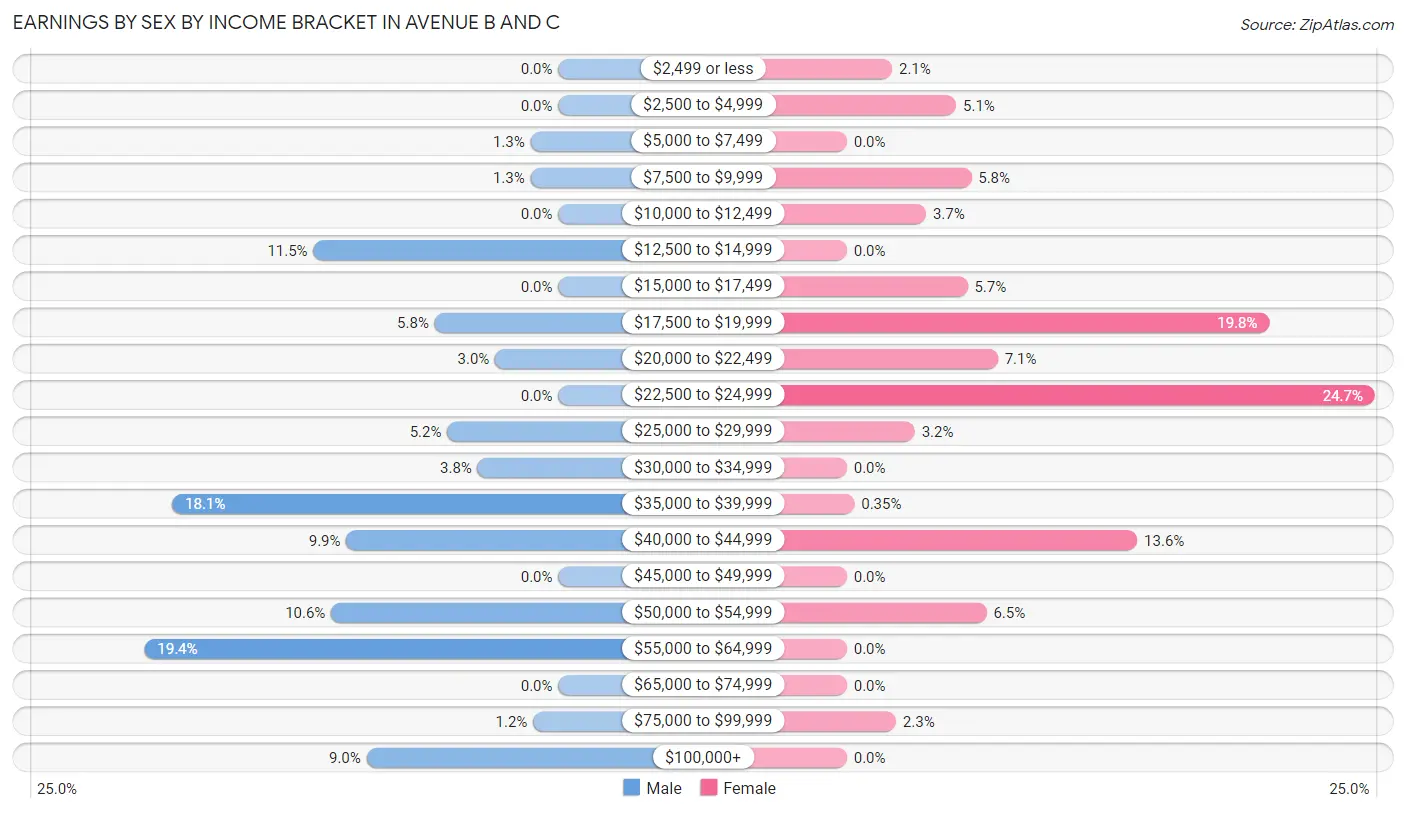
Earnings by Sex by Income Bracket in Avenue B and C
The most common earnings brackets in Avenue B and C are $55,000 to $64,999 for men (164 | 19.4%) and $22,500 to $24,999 for women (140 | 24.7%).
| Income | Male | Female |
| $2,499 or less | 0 (0.0%) | 12 (2.1%) |
| $2,500 to $4,999 | 0 (0.0%) | 29 (5.1%) |
| $5,000 to $7,499 | 11 (1.3%) | 0 (0.0%) |
| $7,500 to $9,999 | 11 (1.3%) | 33 (5.8%) |
| $10,000 to $12,499 | 0 (0.0%) | 21 (3.7%) |
| $12,500 to $14,999 | 97 (11.5%) | 0 (0.0%) |
| $15,000 to $17,499 | 0 (0.0%) | 32 (5.7%) |
| $17,500 to $19,999 | 49 (5.8%) | 112 (19.8%) |
| $20,000 to $22,499 | 25 (3.0%) | 40 (7.1%) |
| $22,500 to $24,999 | 0 (0.0%) | 140 (24.7%) |
| $25,000 to $29,999 | 44 (5.2%) | 18 (3.2%) |
| $30,000 to $34,999 | 32 (3.8%) | 0 (0.0%) |
| $35,000 to $39,999 | 153 (18.1%) | 2 (0.4%) |
| $40,000 to $44,999 | 84 (9.9%) | 77 (13.6%) |
| $45,000 to $49,999 | 0 (0.0%) | 0 (0.0%) |
| $50,000 to $54,999 | 90 (10.6%) | 37 (6.5%) |
| $55,000 to $64,999 | 164 (19.4%) | 0 (0.0%) |
| $65,000 to $74,999 | 0 (0.0%) | 0 (0.0%) |
| $75,000 to $99,999 | 10 (1.2%) | 13 (2.3%) |
| $100,000+ | 76 (9.0%) | 0 (0.0%) |
| Total | 846 (100.0%) | 566 (100.0%) |
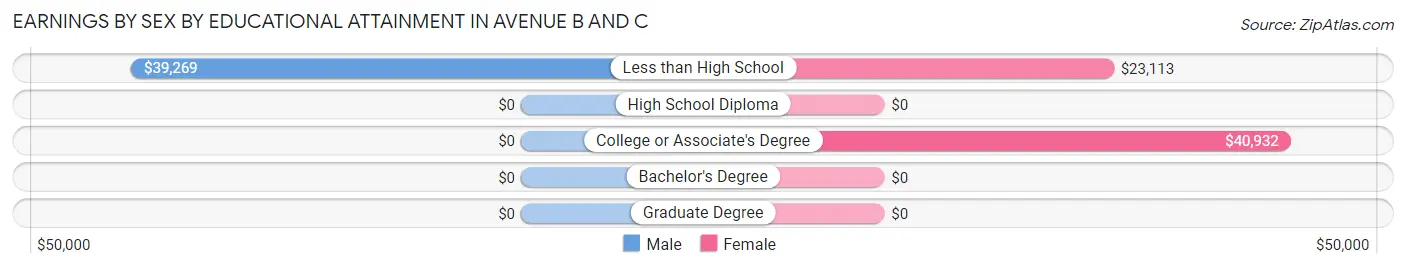
Earnings by Sex by Educational Attainment in Avenue B and C
Average earnings in Avenue B and C are $38,511 for men and $24,027 for women, a difference of 37.6%. Men with an educational attainment of less than high school enjoy the highest average annual earnings of $39,269, while those with less than high school education earn the least with $39,269. Women with an educational attainment of college or associate's degree earn the most with the average annual earnings of $40,932, while those with less than high school education have the smallest earnings of $23,113.
| Educational Attainment | Male Income | Female Income |
| Less than High School | $39,269 | $23,113 |
| High School Diploma | - | - |
| College or Associate's Degree | - | - |
| Bachelor's Degree | - | - |
| Graduate Degree | - | - |
| Total | $38,511 | $24,027 |
Family Income in Avenue B and C
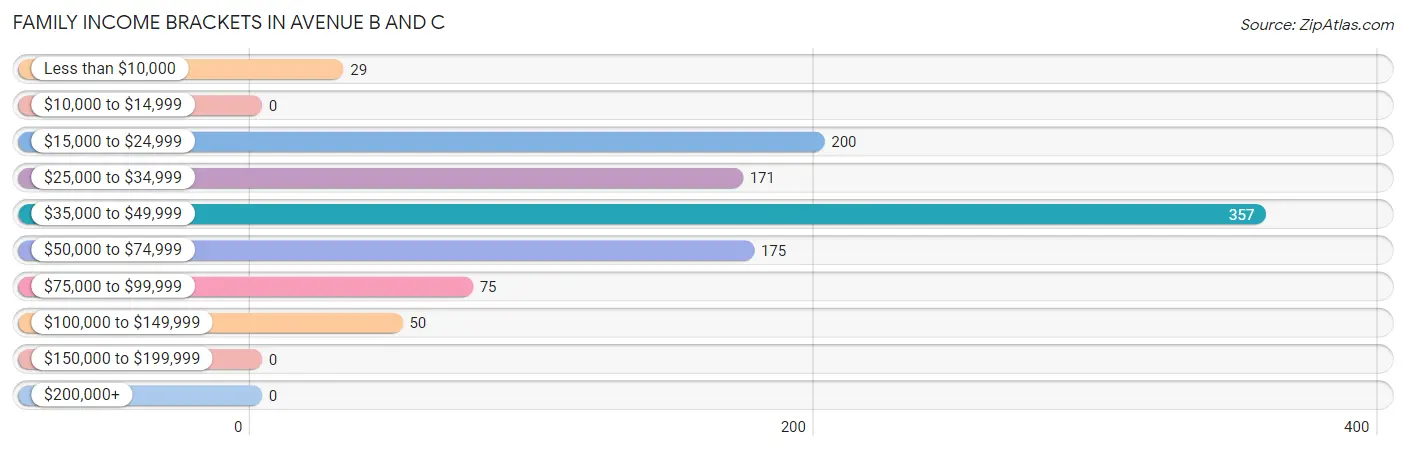
Family Income Brackets in Avenue B and C
According to the Avenue B and C family income data, there are 357 families falling into the $35,000 to $49,999 income range, which is the most common income bracket and makes up 33.8% of all families.
| Income Bracket | # Families | % Families |
| Less than $10,000 | 29 | 2.7% |
| $10,000 to $14,999 | 0 | 0.0% |
| $15,000 to $24,999 | 200 | 18.9% |
| $25,000 to $34,999 | 171 | 16.2% |
| $35,000 to $49,999 | 357 | 33.8% |
| $50,000 to $74,999 | 175 | 16.6% |
| $75,000 to $99,999 | 75 | 7.1% |
| $100,000 to $149,999 | 50 | 4.7% |
| $150,000 to $199,999 | 0 | 0.0% |
| $200,000+ | 0 | 0.0% |
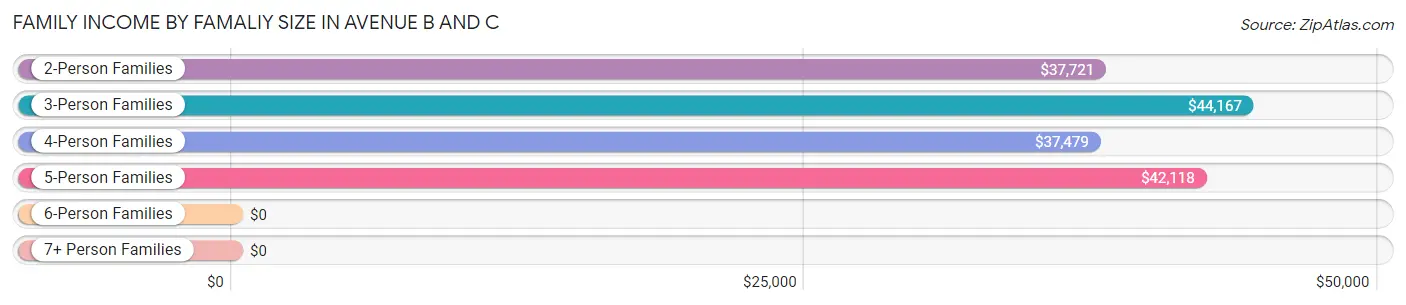
Family Income by Famaliy Size in Avenue B and C
3-person families (108 | 10.2%) account for the highest median family income in Avenue B and C with $44,167 per family, while 2-person families (544 | 51.5%) have the highest median income of $18,860 per family member.
| Income Bracket | # Families | Median Income |
| 2-Person Families | 544 (51.5%) | $37,721 |
| 3-Person Families | 108 (10.2%) | $44,167 |
| 4-Person Families | 169 (16.0%) | $37,479 |
| 5-Person Families | 135 (12.8%) | $42,118 |
| 6-Person Families | 78 (7.4%) | $0 |
| 7+ Person Families | 23 (2.2%) | $0 |
| Total | 1,057 (100.0%) | $39,126 |
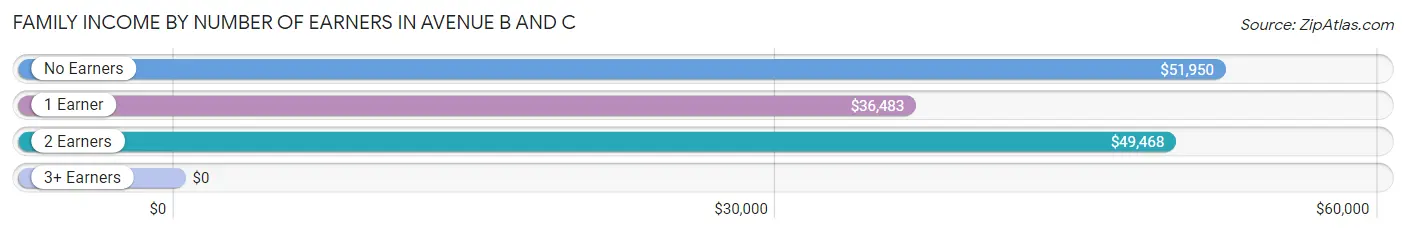
Family Income by Number of Earners in Avenue B and C
| Number of Earners | # Families | Median Income |
| No Earners | 145 (13.7%) | $51,950 |
| 1 Earner | 706 (66.8%) | $36,483 |
| 2 Earners | 166 (15.7%) | $49,468 |
| 3+ Earners | 40 (3.8%) | $0 |
| Total | 1,057 (100.0%) | $39,126 |
Household Income in Avenue B and C
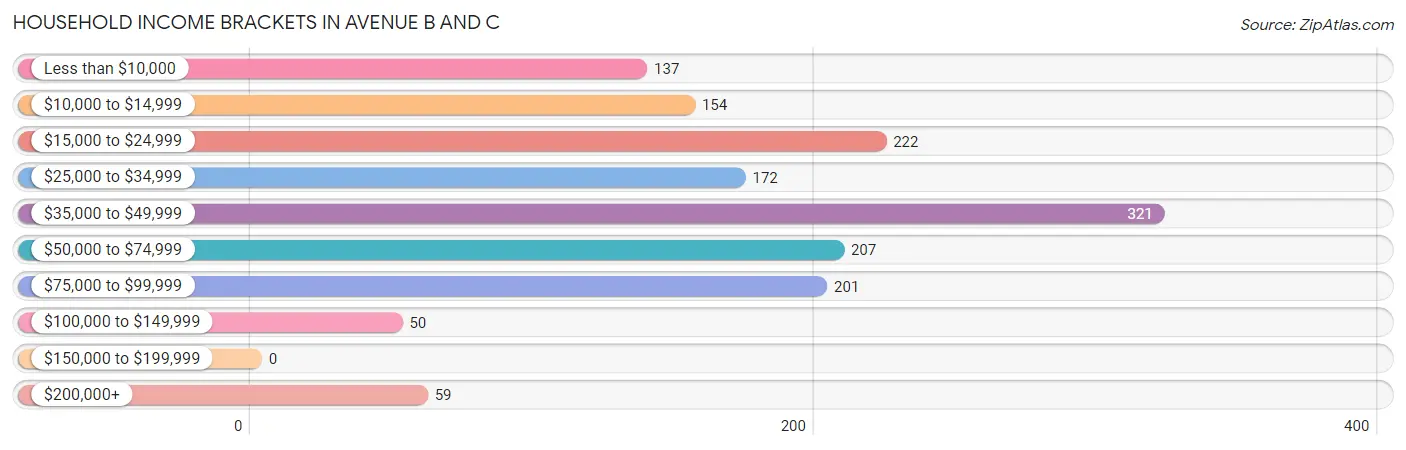
Household Income Brackets in Avenue B and C
With 321 households falling in the category, the $35,000 to $49,999 income range is the most frequent in Avenue B and C, accounting for 21.1% of all households.
| Income Bracket | # Households | % Households |
| Less than $10,000 | 137 | 9.0% |
| $10,000 to $14,999 | 154 | 10.1% |
| $15,000 to $24,999 | 222 | 14.6% |
| $25,000 to $34,999 | 172 | 11.3% |
| $35,000 to $49,999 | 321 | 21.1% |
| $50,000 to $74,999 | 207 | 13.6% |
| $75,000 to $99,999 | 201 | 13.2% |
| $100,000 to $149,999 | 50 | 3.3% |
| $150,000 to $199,999 | 0 | 0.0% |
| $200,000+ | 59 | 3.9% |
Household Income by Householder Age in Avenue B and C
The median household income in Avenue B and C is $37,346, with the highest median household income of $37,957 found in the 25 to 44 years age bracket for the primary householder. A total of 512 households (33.7%) fall into this category. Meanwhile, the 15 to 24 years age bracket for the primary householder has the lowest median household income of $0, with 125 households (8.2%) in this group.
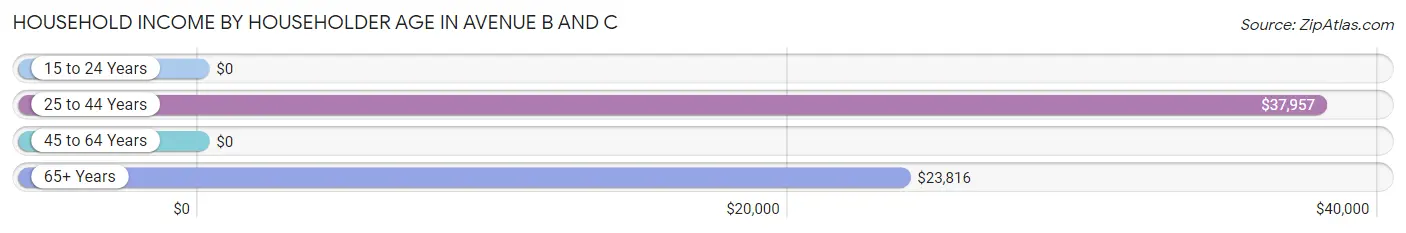
| Income Bracket | # Households | Median Income |
| 15 to 24 Years | 125 (8.2%) | $0 |
| 25 to 44 Years | 512 (33.7%) | $37,957 |
| 45 to 64 Years | 355 (23.4%) | $0 |
| 65+ Years | 528 (34.7%) | $23,816 |
| Total | 1,520 (100.0%) | $37,346 |
Poverty in Avenue B and C
Income Below Poverty by Sex and Age in Avenue B and C
With 22.1% poverty level for males and 32.2% for females among the residents of Avenue B and C, 16 and 17 year old males and 18 to 24 year old females are the most vulnerable to poverty, with 7 males (100.0%) and 150 females (92.0%) in their respective age groups living below the poverty level.
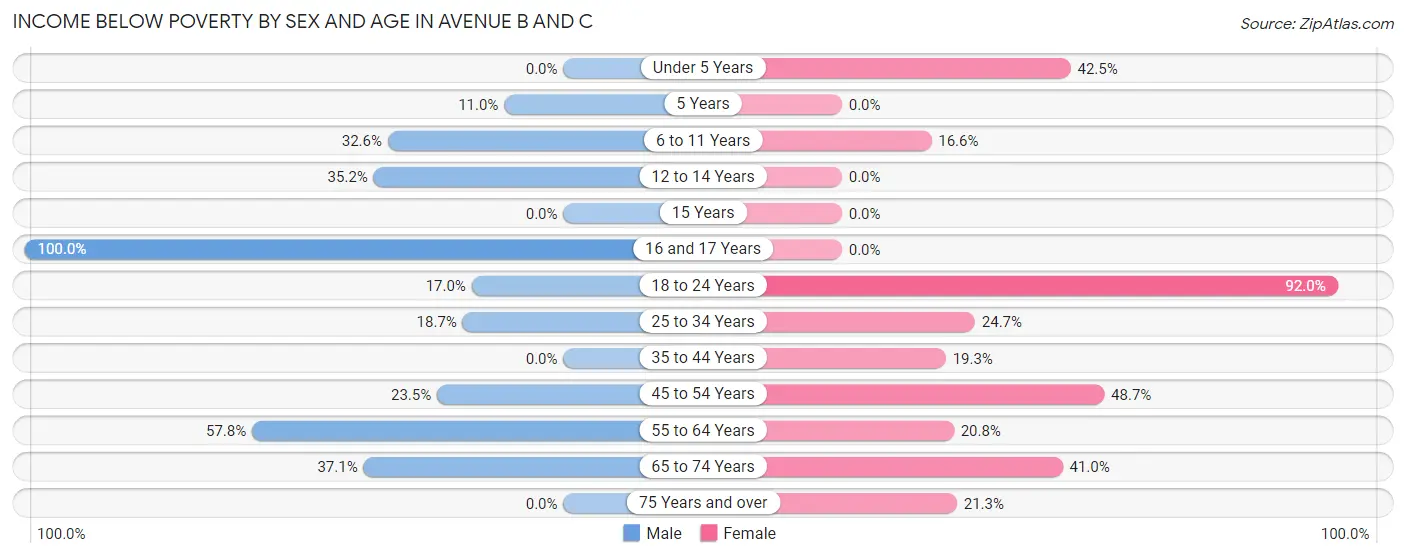
| Age Bracket | Male | Female |
| Under 5 Years | 0 (0.0%) | 107 (42.5%) |
| 5 Years | 9 (11.0%) | 0 (0.0%) |
| 6 to 11 Years | 72 (32.6%) | 53 (16.6%) |
| 12 to 14 Years | 25 (35.2%) | 0 (0.0%) |
| 15 Years | 0 (0.0%) | 0 (0.0%) |
| 16 and 17 Years | 7 (100.0%) | 0 (0.0%) |
| 18 to 24 Years | 50 (17.0%) | 150 (92.0%) |
| 25 to 34 Years | 54 (18.7%) | 81 (24.7%) |
| 35 to 44 Years | 0 (0.0%) | 38 (19.3%) |
| 45 to 54 Years | 34 (23.4%) | 56 (48.7%) |
| 55 to 64 Years | 78 (57.8%) | 27 (20.8%) |
| 65 to 74 Years | 92 (37.1%) | 59 (41.0%) |
| 75 Years and over | 0 (0.0%) | 54 (21.3%) |
| Total | 421 (22.1%) | 625 (32.2%) |
Income Above Poverty by Sex and Age in Avenue B and C
According to the poverty statistics in Avenue B and C, males aged under 5 years and females aged 5 years are the age groups that are most secure financially, with 100.0% of males and 100.0% of females in these age groups living above the poverty line.
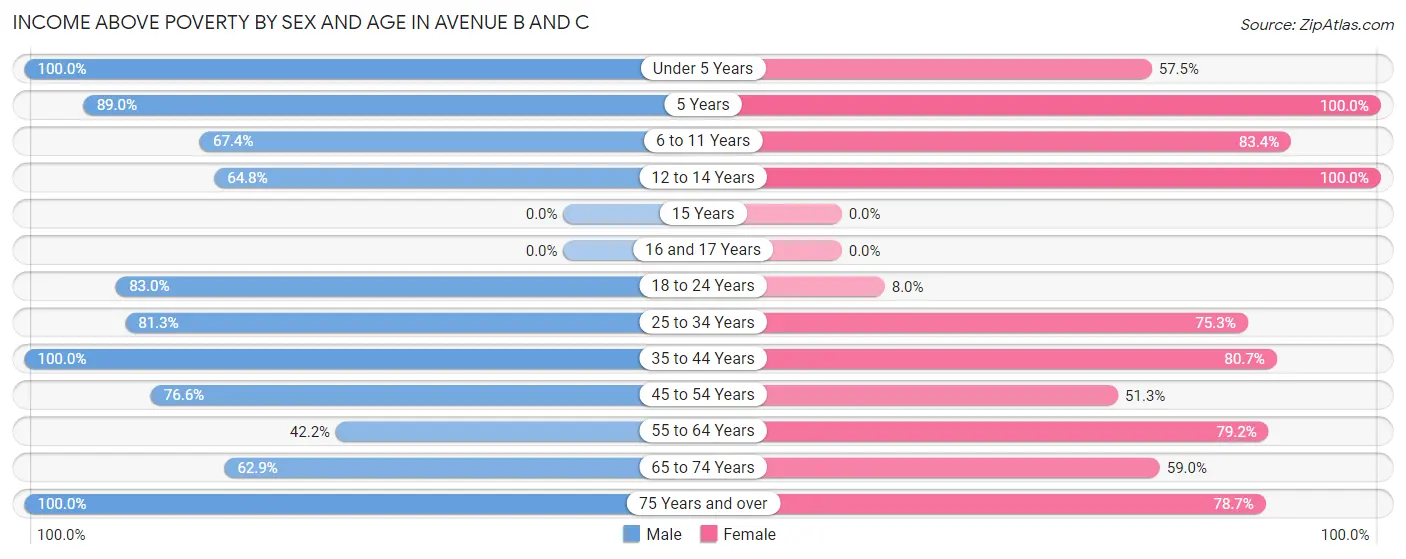
| Age Bracket | Male | Female |
| Under 5 Years | 140 (100.0%) | 145 (57.5%) |
| 5 Years | 73 (89.0%) | 21 (100.0%) |
| 6 to 11 Years | 149 (67.4%) | 266 (83.4%) |
| 12 to 14 Years | 46 (64.8%) | 20 (100.0%) |
| 15 Years | 0 (0.0%) | 0 (0.0%) |
| 16 and 17 Years | 0 (0.0%) | 0 (0.0%) |
| 18 to 24 Years | 244 (83.0%) | 13 (8.0%) |
| 25 to 34 Years | 235 (81.3%) | 247 (75.3%) |
| 35 to 44 Years | 201 (100.0%) | 159 (80.7%) |
| 45 to 54 Years | 111 (76.5%) | 59 (51.3%) |
| 55 to 64 Years | 57 (42.2%) | 103 (79.2%) |
| 65 to 74 Years | 156 (62.9%) | 85 (59.0%) |
| 75 Years and over | 75 (100.0%) | 199 (78.7%) |
| Total | 1,487 (77.9%) | 1,317 (67.8%) |
Income Below Poverty Among Married-Couple Families in Avenue B and C
The poverty statistics for married-couple families in Avenue B and C show that 20.8% or 98 of the total 470 families live below the poverty line. Families with 1 or 2 children have the highest poverty rate of 40.4%, comprising of 40 families. On the other hand, families with no children have the lowest poverty rate of 13.3%, which includes 35 families.
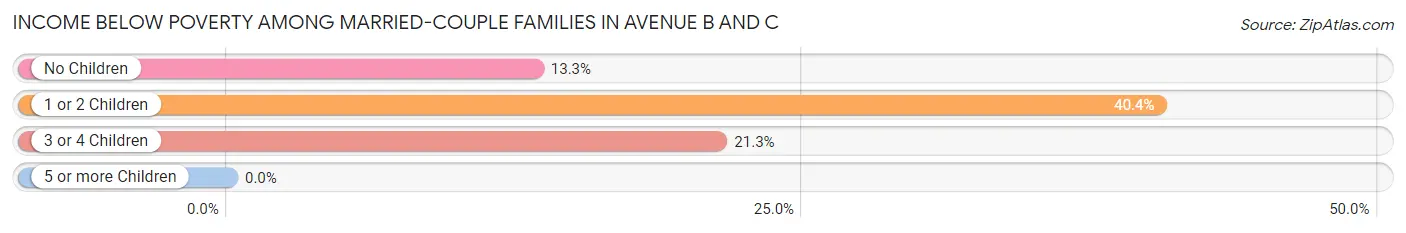
| Children | Above Poverty | Below Poverty |
| No Children | 228 (86.7%) | 35 (13.3%) |
| 1 or 2 Children | 59 (59.6%) | 40 (40.4%) |
| 3 or 4 Children | 85 (78.7%) | 23 (21.3%) |
| 5 or more Children | 0 (0.0%) | 0 (0.0%) |
| Total | 372 (79.1%) | 98 (20.8%) |
Income Below Poverty Among Single-Parent Households in Avenue B and C
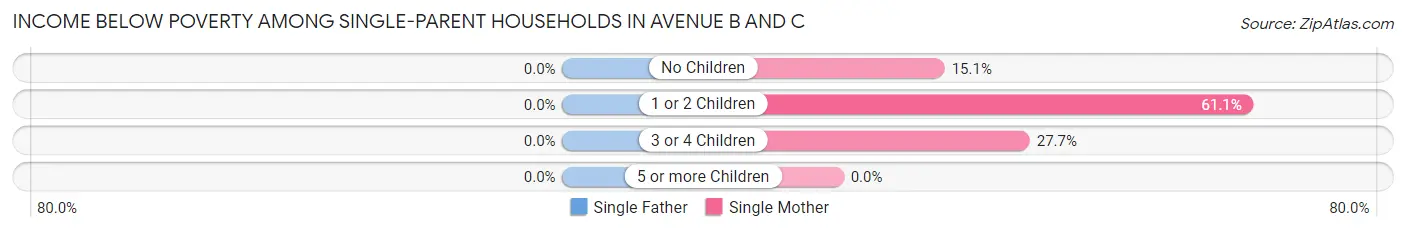
| Children | Single Father | Single Mother |
| No Children | 0 (0.0%) | 25 (15.1%) |
| 1 or 2 Children | 0 (0.0%) | 124 (61.1%) |
| 3 or 4 Children | 0 (0.0%) | 38 (27.7%) |
| 5 or more Children | 0 (0.0%) | 0 (0.0%) |
| Total | 0 (0.0%) | 187 (37.0%) |
Income Below Poverty Among Married-Couple vs Single-Parent Households in Avenue B and C
The poverty data for Avenue B and C shows that 98 of the married-couple family households (20.8%) and 187 of the single-parent households (31.9%) are living below the poverty level. Within the married-couple family households, those with 1 or 2 children have the highest poverty rate, with 40 households (40.4%) falling below the poverty line. Among the single-parent households, those with 1 or 2 children have the highest poverty rate, with 124 household (54.6%) living below poverty.
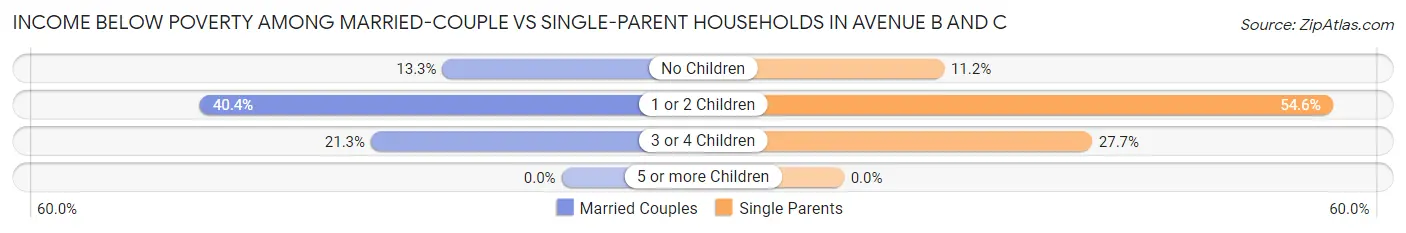
| Children | Married-Couple Families | Single-Parent Households |
| No Children | 35 (13.3%) | 25 (11.2%) |
| 1 or 2 Children | 40 (40.4%) | 124 (54.6%) |
| 3 or 4 Children | 23 (21.3%) | 38 (27.7%) |
| 5 or more Children | 0 (0.0%) | 0 (0.0%) |
| Total | 98 (20.8%) | 187 (31.9%) |
Race in Avenue B and C
The most populous races in Avenue B and C are Hispanic or Latino (3,006 | 78.1%), White / Caucasian (1,951 | 50.7%), and Two or more Races (1,011 | 26.3%).
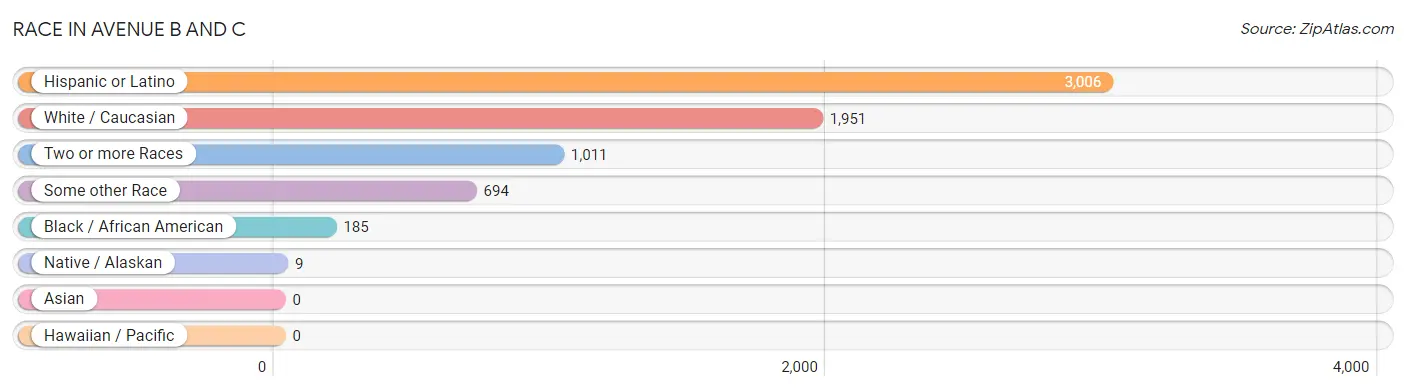
| Race | # Population | % Population |
| Asian | 0 | 0.0% |
| Black / African American | 185 | 4.8% |
| Hawaiian / Pacific | 0 | 0.0% |
| Hispanic or Latino | 3,006 | 78.1% |
| Native / Alaskan | 9 | 0.2% |
| White / Caucasian | 1,951 | 50.7% |
| Two or more Races | 1,011 | 26.3% |
| Some other Race | 694 | 18.0% |
| Total | 3,850 | 100.0% |
Ancestry in Avenue B and C
The most populous ancestries reported in Avenue B and C are Mexican (2,830 | 73.5%), German (236 | 6.1%), English (152 | 4.0%), Canadian (116 | 3.0%), and Irish (112 | 2.9%), together accounting for 89.5% of all Avenue B and C residents.
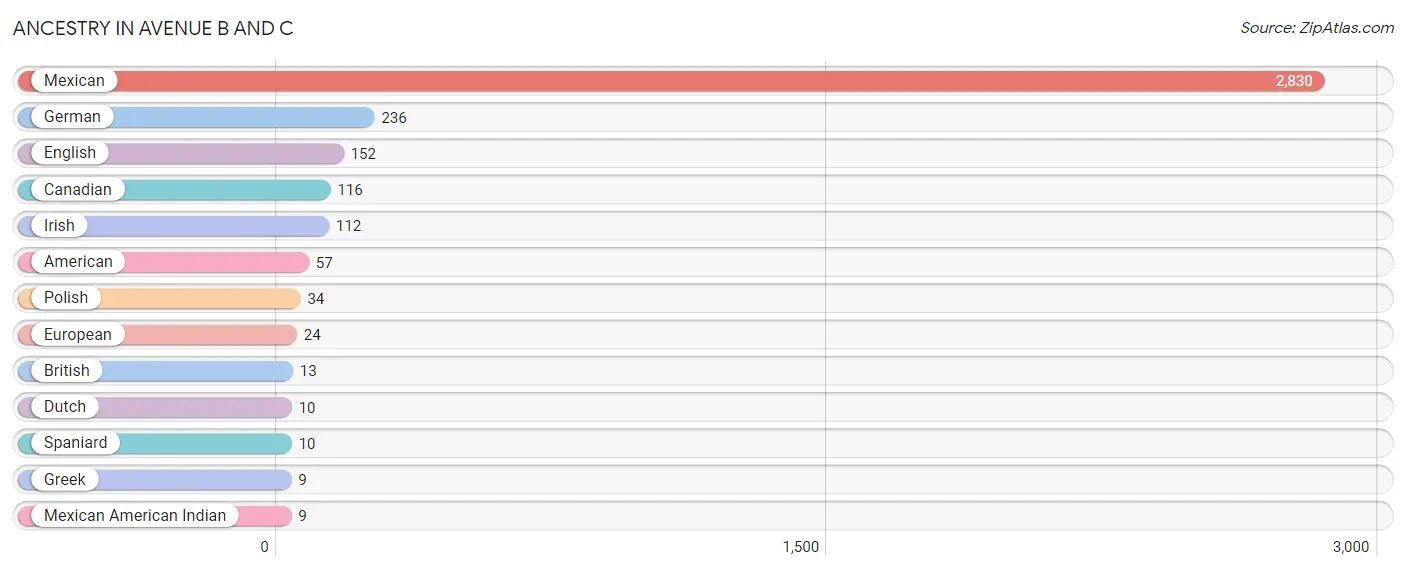
| Ancestry | # Population | % Population |
| American | 57 | 1.5% |
| British | 13 | 0.3% |
| Canadian | 116 | 3.0% |
| Dutch | 10 | 0.3% |
| English | 152 | 4.0% |
| European | 24 | 0.6% |
| German | 236 | 6.1% |
| Greek | 9 | 0.2% |
| Irish | 112 | 2.9% |
| Mexican | 2,830 | 73.5% |
| Mexican American Indian | 9 | 0.2% |
| Polish | 34 | 0.9% |
| Spaniard | 10 | 0.3% | View All 13 Rows |
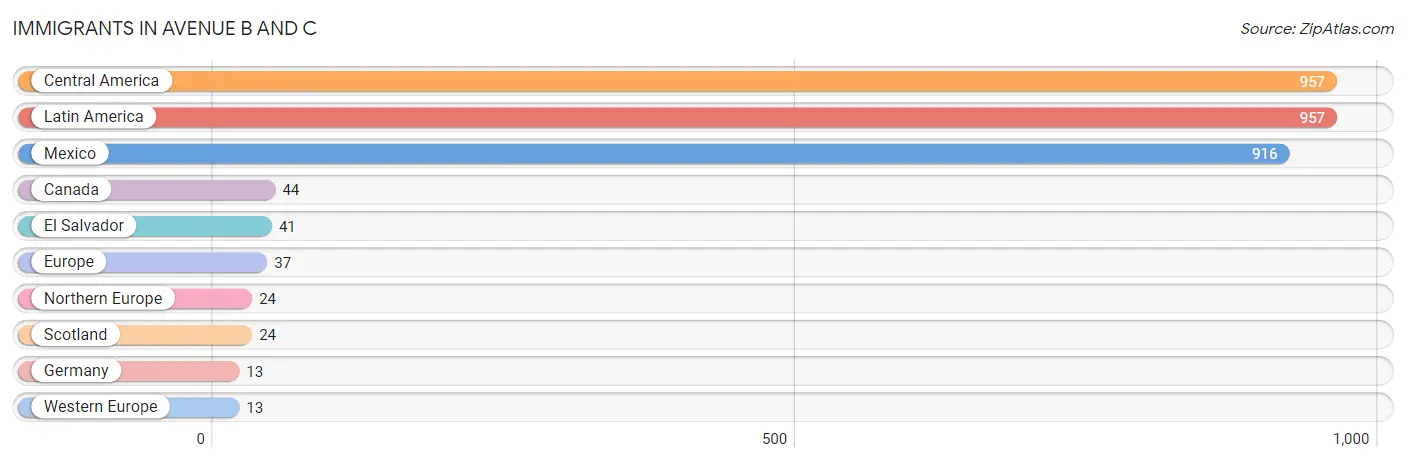
Immigrants in Avenue B and C
The most numerous immigrant groups reported in Avenue B and C came from Central America (957 | 24.9%), Latin America (957 | 24.9%), Mexico (916 | 23.8%), Canada (44 | 1.1%), and El Salvador (41 | 1.1%), together accounting for 75.7% of all Avenue B and C residents.
| Immigration Origin | # Population | % Population |
| Canada | 44 | 1.1% |
| Central America | 957 | 24.9% |
| El Salvador | 41 | 1.1% |
| Europe | 37 | 1.0% |
| Germany | 13 | 0.3% |
| Latin America | 957 | 24.9% |
| Mexico | 916 | 23.8% |
| Northern Europe | 24 | 0.6% |
| Scotland | 24 | 0.6% |
| Western Europe | 13 | 0.3% | View All 10 Rows |
Sex and Age in Avenue B and C
Sex and Age in Avenue B and C
The most populous age groups in Avenue B and C are 5 to 9 Years (256 | 13.4%) for men and Under 5 Years (252 | 13.0%) for women.
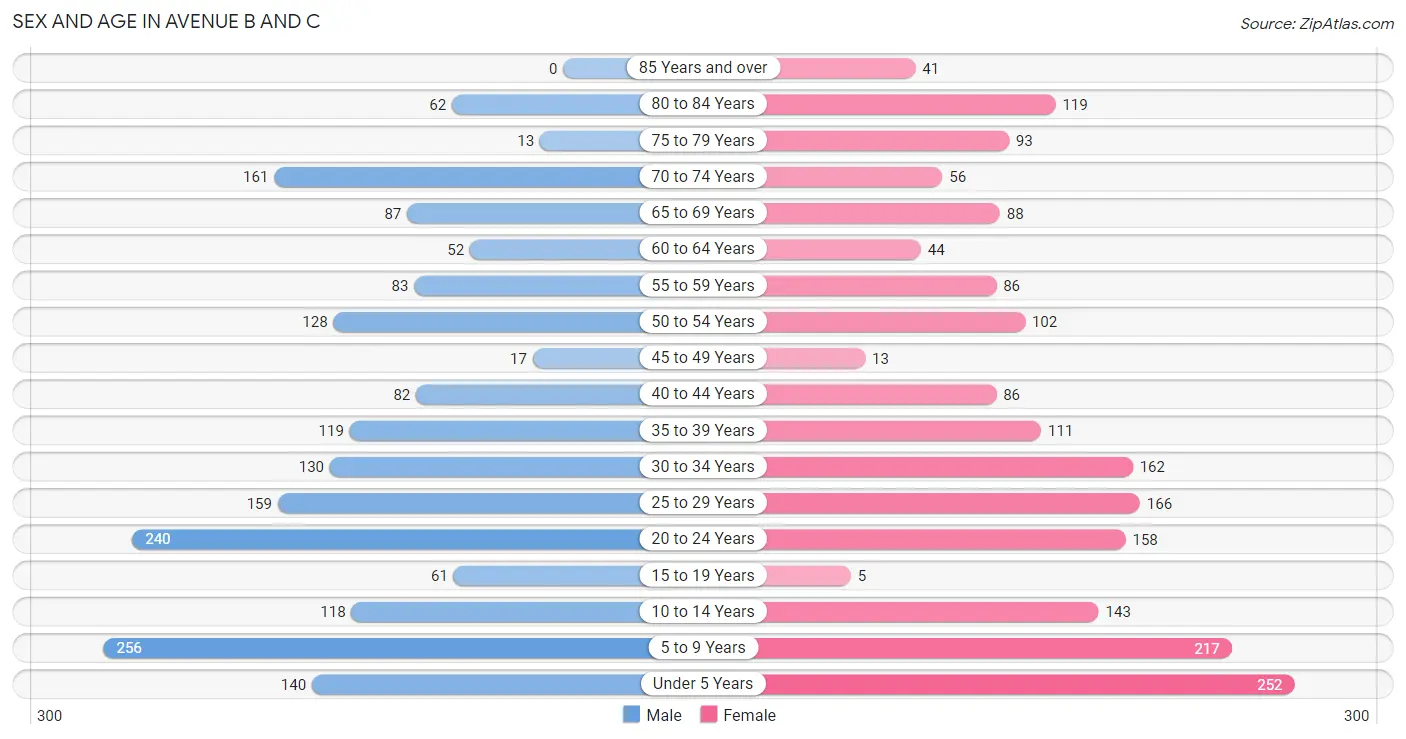
| Age Bracket | Male | Female |
| Under 5 Years | 140 (7.3%) | 252 (13.0%) |
| 5 to 9 Years | 256 (13.4%) | 217 (11.2%) |
| 10 to 14 Years | 118 (6.2%) | 143 (7.4%) |
| 15 to 19 Years | 61 (3.2%) | 5 (0.3%) |
| 20 to 24 Years | 240 (12.6%) | 158 (8.1%) |
| 25 to 29 Years | 159 (8.3%) | 166 (8.6%) |
| 30 to 34 Years | 130 (6.8%) | 162 (8.3%) |
| 35 to 39 Years | 119 (6.2%) | 111 (5.7%) |
| 40 to 44 Years | 82 (4.3%) | 86 (4.4%) |
| 45 to 49 Years | 17 (0.9%) | 13 (0.7%) |
| 50 to 54 Years | 128 (6.7%) | 102 (5.2%) |
| 55 to 59 Years | 83 (4.3%) | 86 (4.4%) |
| 60 to 64 Years | 52 (2.7%) | 44 (2.3%) |
| 65 to 69 Years | 87 (4.6%) | 88 (4.5%) |
| 70 to 74 Years | 161 (8.4%) | 56 (2.9%) |
| 75 to 79 Years | 13 (0.7%) | 93 (4.8%) |
| 80 to 84 Years | 62 (3.3%) | 119 (6.1%) |
| 85 Years and over | 0 (0.0%) | 41 (2.1%) |
| Total | 1,908 (100.0%) | 1,942 (100.0%) |
Families and Households in Avenue B and C
Median Family Size in Avenue B and C
The median family size in Avenue B and C is 2.95 persons per family, with married-couple families (470 | 44.5%) accounting for the largest median family size of 3.13 persons per family. On the other hand, single male/father families (81 | 7.7%) represent the smallest median family size with 2.10 persons per family.
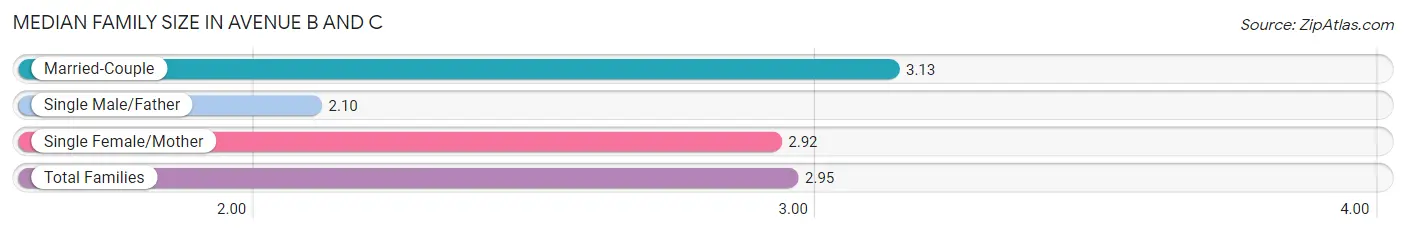
| Family Type | # Families | Family Size |
| Married-Couple | 470 (44.5%) | 3.13 |
| Single Male/Father | 81 (7.7%) | 2.10 |
| Single Female/Mother | 506 (47.9%) | 2.92 |
| Total Families | 1,057 (100.0%) | 2.95 |
Median Household Size in Avenue B and C
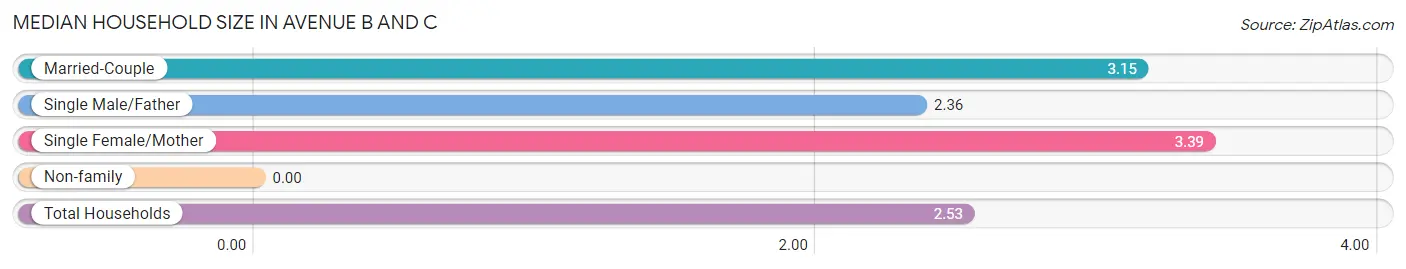
| Household Type | # Households | Household Size |
| Married-Couple | 470 (30.9%) | 3.15 |
| Single Male/Father | 81 (5.3%) | 2.36 |
| Single Female/Mother | 506 (33.3%) | 3.39 |
| Non-family | 463 (30.5%) | - |
| Total Households | 1,520 (100.0%) | 2.53 |
Household Size by Marriage Status in Avenue B and C
Out of a total of 1,520 households in Avenue B and C, 1,057 (69.5%) are family households, while 463 (30.5%) are nonfamily households. The most numerous type of family households are 2-person households, comprising 415, and the most common type of nonfamily households are 1-person households, comprising 463.
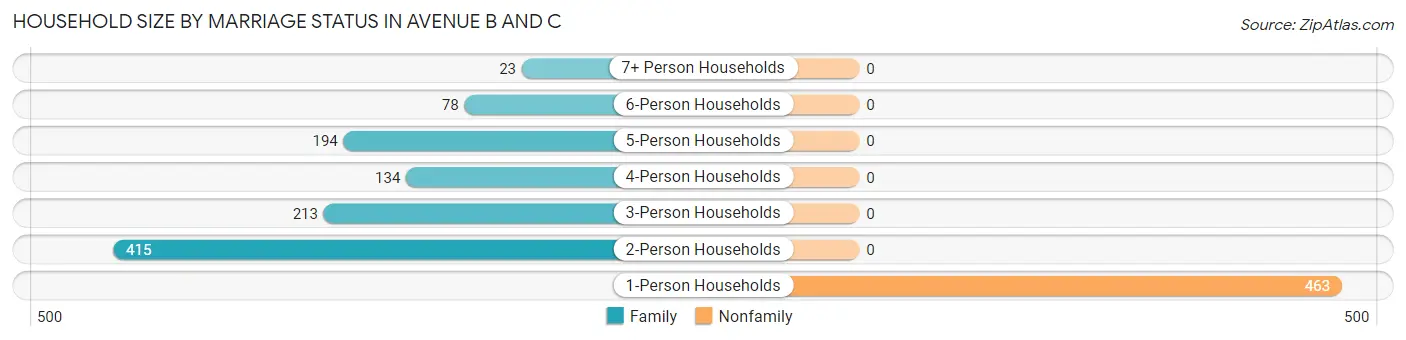
| Household Size | Family Households | Nonfamily Households |
| 1-Person Households | - | 463 (30.5%) |
| 2-Person Households | 415 (27.3%) | 0 (0.0%) |
| 3-Person Households | 213 (14.0%) | 0 (0.0%) |
| 4-Person Households | 134 (8.8%) | 0 (0.0%) |
| 5-Person Households | 194 (12.8%) | 0 (0.0%) |
| 6-Person Households | 78 (5.1%) | 0 (0.0%) |
| 7+ Person Households | 23 (1.5%) | 0 (0.0%) |
| Total | 1,057 (69.5%) | 463 (30.5%) |
Female Fertility in Avenue B and C
Fertility by Age in Avenue B and C
Average fertility rate in Avenue B and C is 159.0 births per 1,000 women. Women in the age bracket of 20 to 34 years have the highest fertility rate with 230.0 births per 1,000 women. Women in the age bracket of 20 to 34 years acount for 100.0% of all women with births.
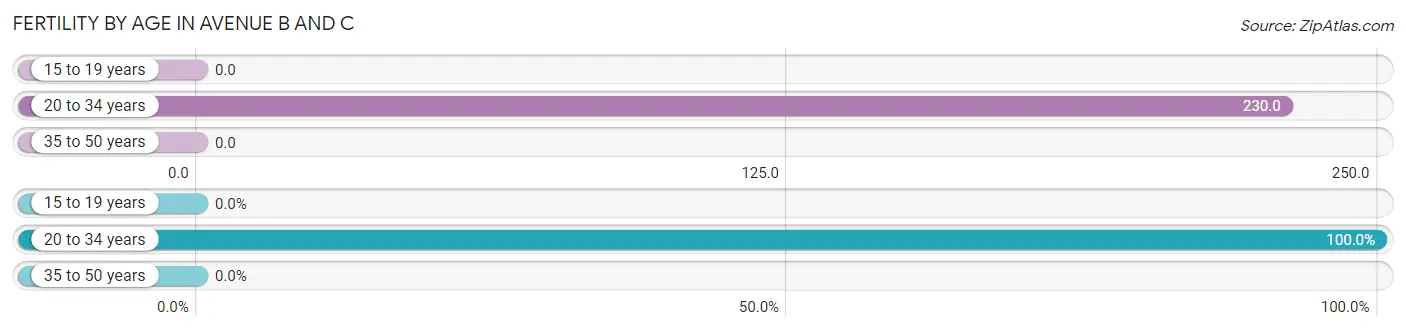
| Age Bracket | Women with Births | Births / 1,000 Women |
| 15 to 19 years | 0 (0.0%) | 0.0 |
| 20 to 34 years | 112 (100.0%) | 230.0 |
| 35 to 50 years | 0 (0.0%) | 0.0 |
| Total | 112 (100.0%) | 159.0 |
Fertility by Age by Marriage Status in Avenue B and C
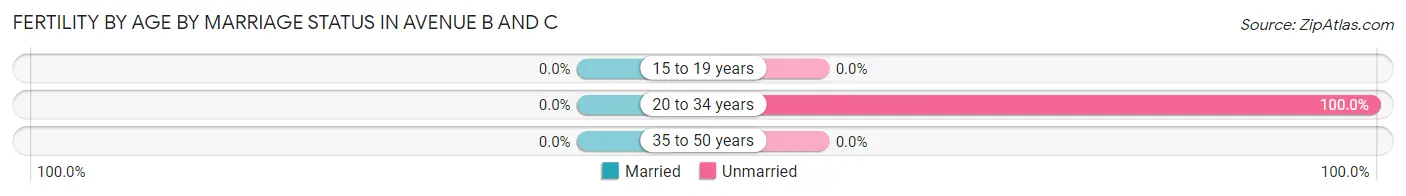
| Age Bracket | Married | Unmarried |
| 15 to 19 years | 0 (0.0%) | 0 (0.0%) |
| 20 to 34 years | 0 (0.0%) | 112 (100.0%) |
| 35 to 50 years | 0 (0.0%) | 0 (0.0%) |
| Total | 0 (0.0%) | 112 (100.0%) |
Fertility by Education in Avenue B and C
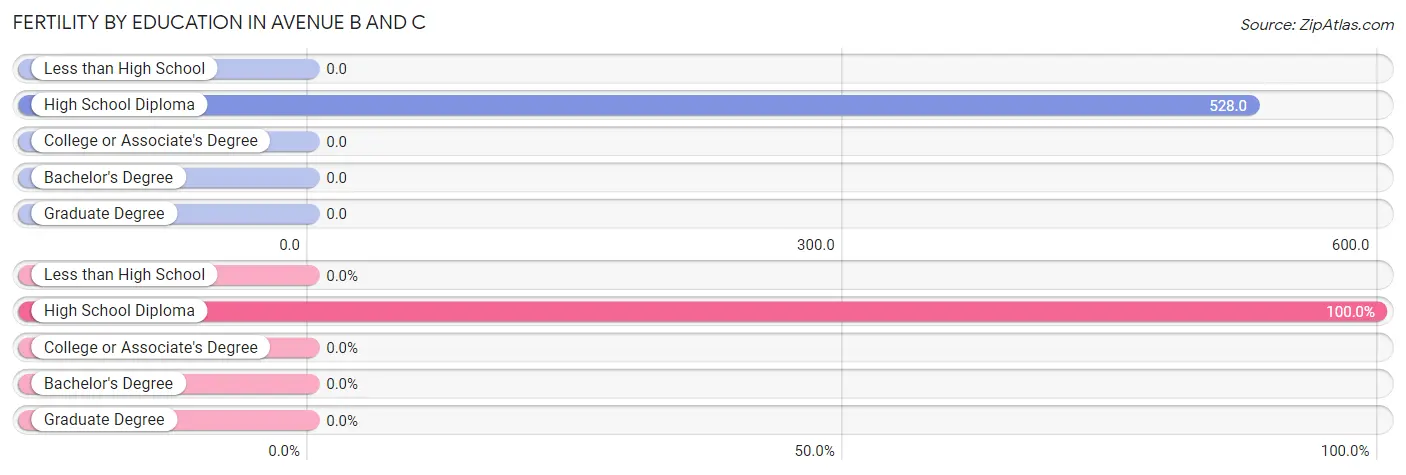
| Educational Attainment | Women with Births | Births / 1,000 Women |
| Less than High School | 0 (0.0%) | 0.0 |
| High School Diploma | 112 (100.0%) | 528.0 |
| College or Associate's Degree | 0 (0.0%) | 0.0 |
| Bachelor's Degree | 0 (0.0%) | 0.0 |
| Graduate Degree | 0 (0.0%) | 0.0 |
| Total | 112 (100.0%) | 159.0 |
Fertility by Education by Marriage Status in Avenue B and C
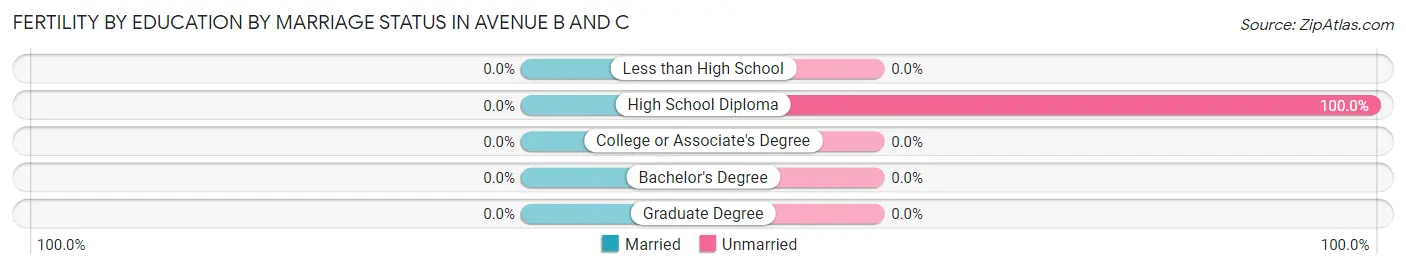
| Educational Attainment | Married | Unmarried |
| Less than High School | 0 (0.0%) | 0 (0.0%) |
| High School Diploma | 0 (0.0%) | 112 (100.0%) |
| College or Associate's Degree | 0 (0.0%) | 0 (0.0%) |
| Bachelor's Degree | 0 (0.0%) | 0 (0.0%) |
| Graduate Degree | 0 (0.0%) | 0 (0.0%) |
| Total | 0 (0.0%) | 112 (100.0%) |
Employment Characteristics in Avenue B and C
Employment by Class of Employer in Avenue B and C
Among the 1,162 employed individuals in Avenue B and C, private company employees (987 | 84.9%), not-for-profit organizations (80 | 6.9%), and self-employed (not incorporated) (57 | 4.9%) make up the most common classes of employment.
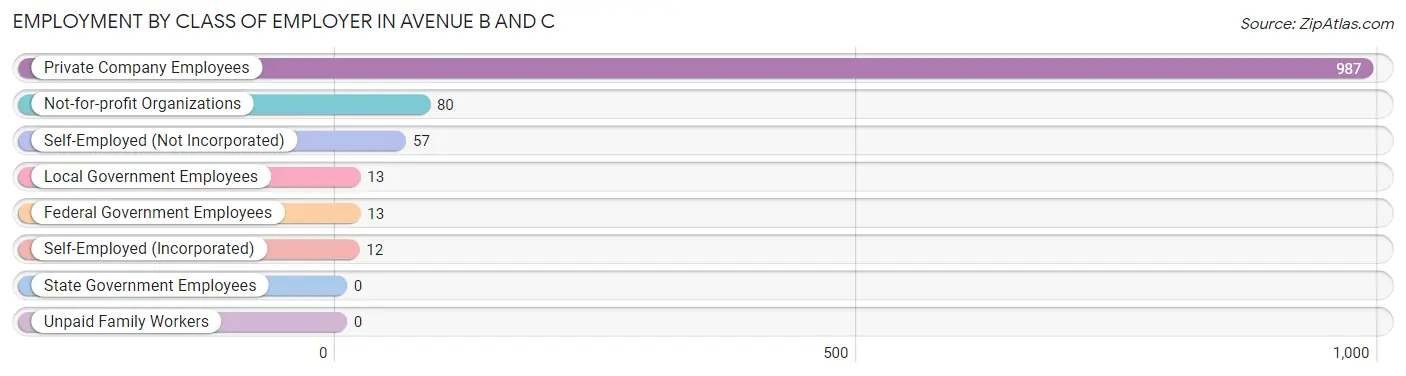
| Employer Class | # Employees | % Employees |
| Private Company Employees | 987 | 84.9% |
| Self-Employed (Incorporated) | 12 | 1.0% |
| Self-Employed (Not Incorporated) | 57 | 4.9% |
| Not-for-profit Organizations | 80 | 6.9% |
| Local Government Employees | 13 | 1.1% |
| State Government Employees | 0 | 0.0% |
| Federal Government Employees | 13 | 1.1% |
| Unpaid Family Workers | 0 | 0.0% |
| Total | 1,162 | 100.0% |
Employment Status by Age in Avenue B and C
According to the labor force statistics for Avenue B and C, out of the total population over 16 years of age (2,724), 54.7% or 1,490 individuals are in the labor force, with 21.5% or 320 of them unemployed. The age group with the highest labor force participation rate is 20 to 24 years, with 100.0% or 398 individuals in the labor force. Within the labor force, the 16 to 19 years age range has the highest percentage of unemployed individuals, with 77.3% or 17 of them being unemployed.
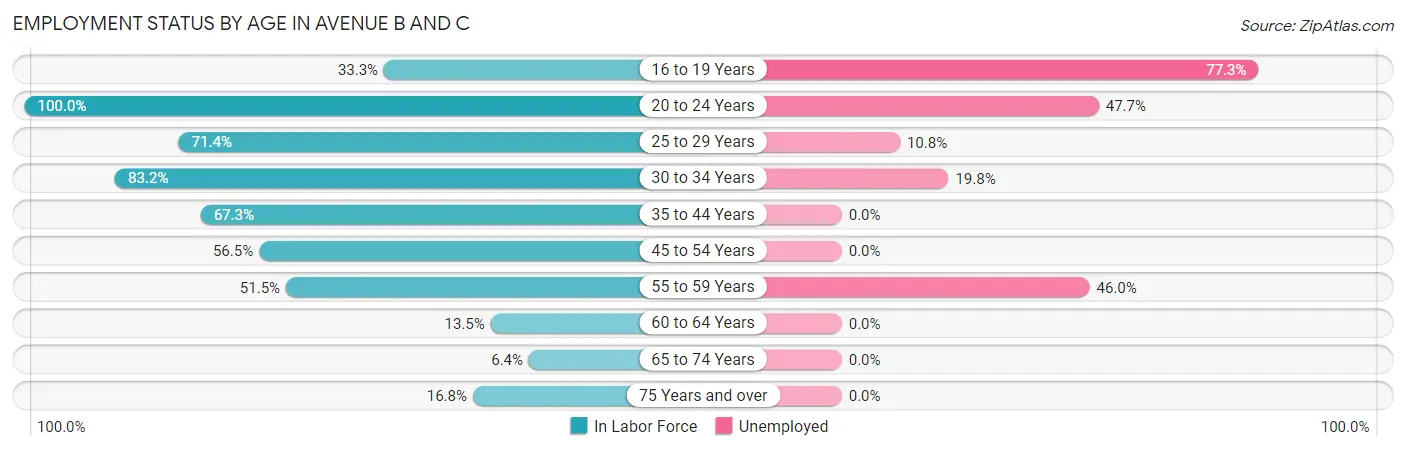
| Age Bracket | In Labor Force | Unemployed |
| 16 to 19 Years | 22 (33.3%) | 17 (77.3%) |
| 20 to 24 Years | 398 (100.0%) | 190 (47.7%) |
| 25 to 29 Years | 232 (71.4%) | 25 (10.8%) |
| 30 to 34 Years | 243 (83.2%) | 48 (19.8%) |
| 35 to 44 Years | 268 (67.3%) | 0 (0.0%) |
| 45 to 54 Years | 147 (56.5%) | 0 (0.0%) |
| 55 to 59 Years | 87 (51.5%) | 40 (46.0%) |
| 60 to 64 Years | 13 (13.5%) | 0 (0.0%) |
| 65 to 74 Years | 25 (6.4%) | 0 (0.0%) |
| 75 Years and over | 55 (16.8%) | 0 (0.0%) |
| Total | 1,490 (54.7%) | 320 (21.5%) |
Employment Status by Educational Attainment in Avenue B and C
According to labor force statistics for Avenue B and C, 64.3% of individuals (990) out of the total population between 25 and 64 years of age (1,540) are in the labor force, with 11.4% or 113 of them being unemployed. The group with the highest labor force participation rate are those with the educational attainment of less than high school, with 73.2% or 585 individuals in the labor force. Within the labor force, individuals with less than high school education have the highest percentage of unemployment, with 19.3% or 113 of them being unemployed.
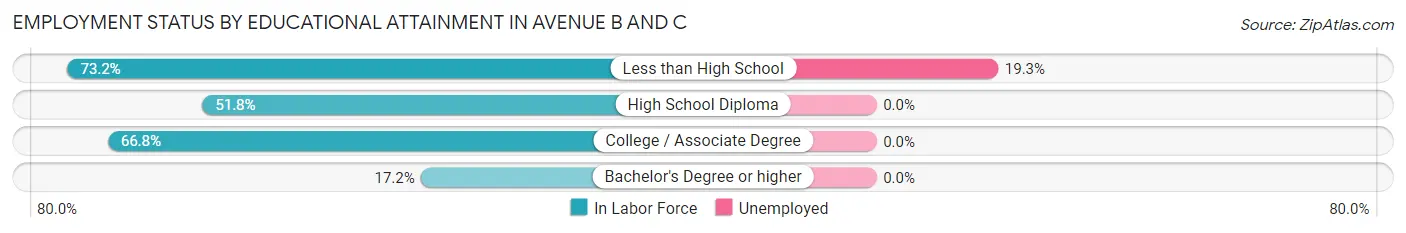
| Educational Attainment | In Labor Force | Unemployed |
| Less than High School | 585 (73.2%) | 154 (19.3%) |
| High School Diploma | 212 (51.8%) | 0 (0.0%) |
| College / Associate Degree | 183 (66.8%) | 0 (0.0%) |
| Bachelor's Degree or higher | 10 (17.2%) | 0 (0.0%) |
| Total | 990 (64.3%) | 176 (11.4%) |
Employment Occupations by Sex in Avenue B and C
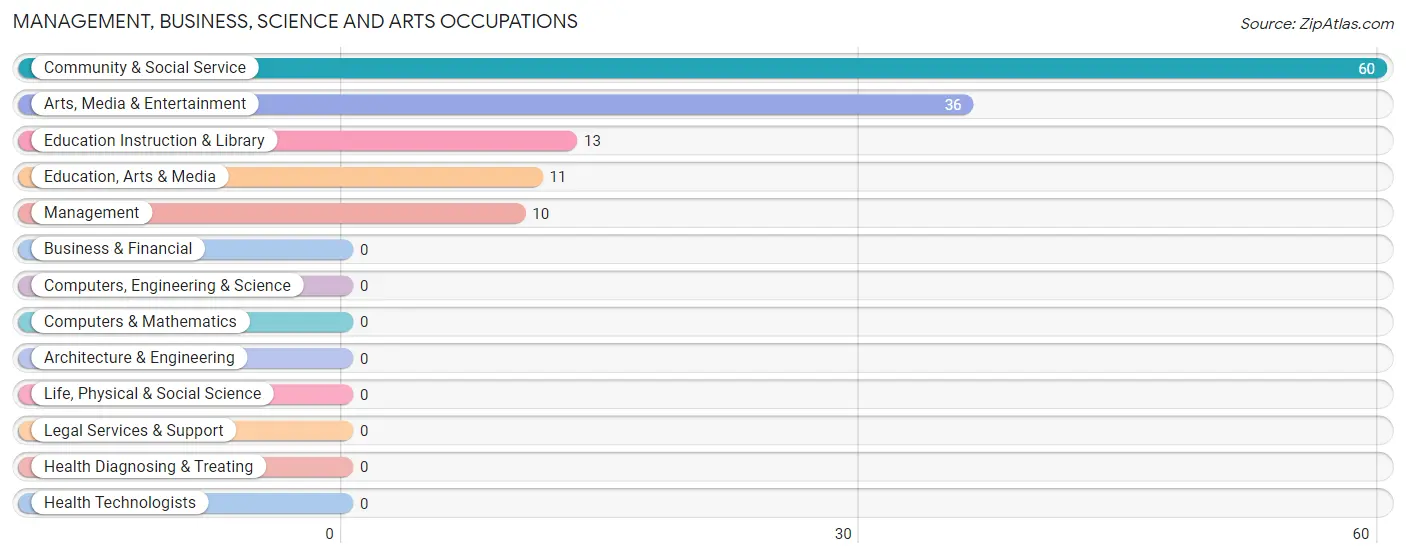
Management, Business, Science and Arts Occupations
The most common Management, Business, Science and Arts occupations in Avenue B and C are Community & Social Service (60 | 5.1%), Arts, Media & Entertainment (36 | 3.1%), Education Instruction & Library (13 | 1.1%), Education, Arts & Media (11 | 0.9%), and Management (10 | 0.9%).
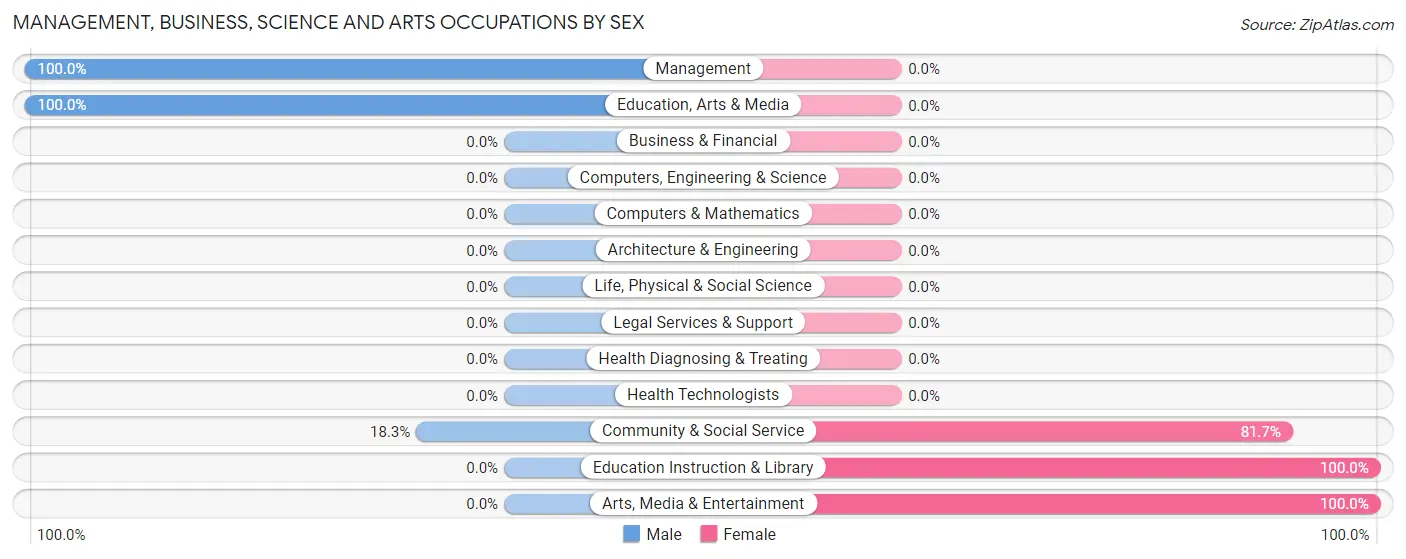
Management, Business, Science and Arts Occupations by Sex
Within the Management, Business, Science and Arts occupations in Avenue B and C, the most male-oriented occupations are Management (100.0%), Education, Arts & Media (100.0%), and Community & Social Service (18.3%), while the most female-oriented occupations are Education Instruction & Library (100.0%), Arts, Media & Entertainment (100.0%), and Community & Social Service (81.7%).
| Occupation | Male | Female |
| Management | 10 (100.0%) | 0 (0.0%) |
| Business & Financial | 0 (0.0%) | 0 (0.0%) |
| Computers, Engineering & Science | 0 (0.0%) | 0 (0.0%) |
| Computers & Mathematics | 0 (0.0%) | 0 (0.0%) |
| Architecture & Engineering | 0 (0.0%) | 0 (0.0%) |
| Life, Physical & Social Science | 0 (0.0%) | 0 (0.0%) |
| Community & Social Service | 11 (18.3%) | 49 (81.7%) |
| Education, Arts & Media | 11 (100.0%) | 0 (0.0%) |
| Legal Services & Support | 0 (0.0%) | 0 (0.0%) |
| Education Instruction & Library | 0 (0.0%) | 13 (100.0%) |
| Arts, Media & Entertainment | 0 (0.0%) | 36 (100.0%) |
| Health Diagnosing & Treating | 0 (0.0%) | 0 (0.0%) |
| Health Technologists | 0 (0.0%) | 0 (0.0%) |
| Total (Category) | 21 (30.0%) | 49 (70.0%) |
| Total (Overall) | 682 (58.3%) | 488 (41.7%) |
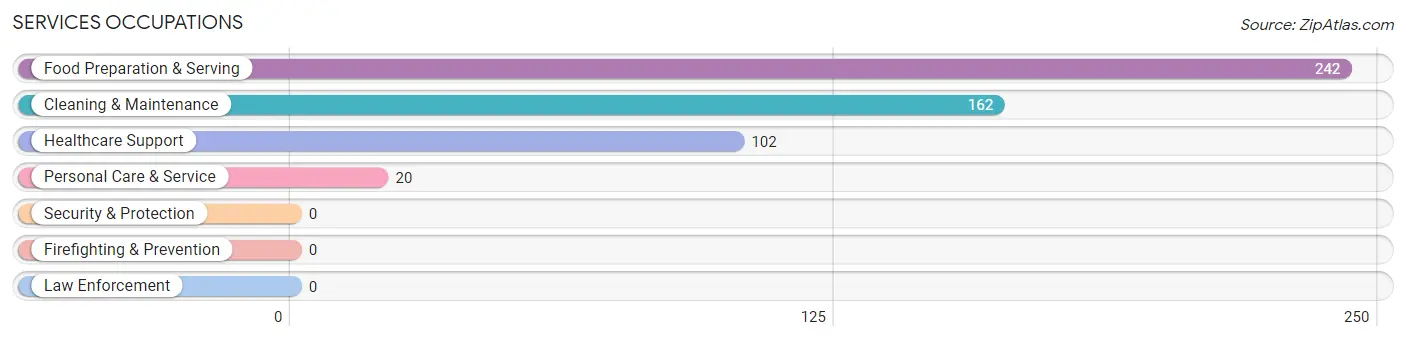
Services Occupations
The most common Services occupations in Avenue B and C are Food Preparation & Serving (242 | 20.7%), Cleaning & Maintenance (162 | 13.9%), Healthcare Support (102 | 8.7%), and Personal Care & Service (20 | 1.7%).
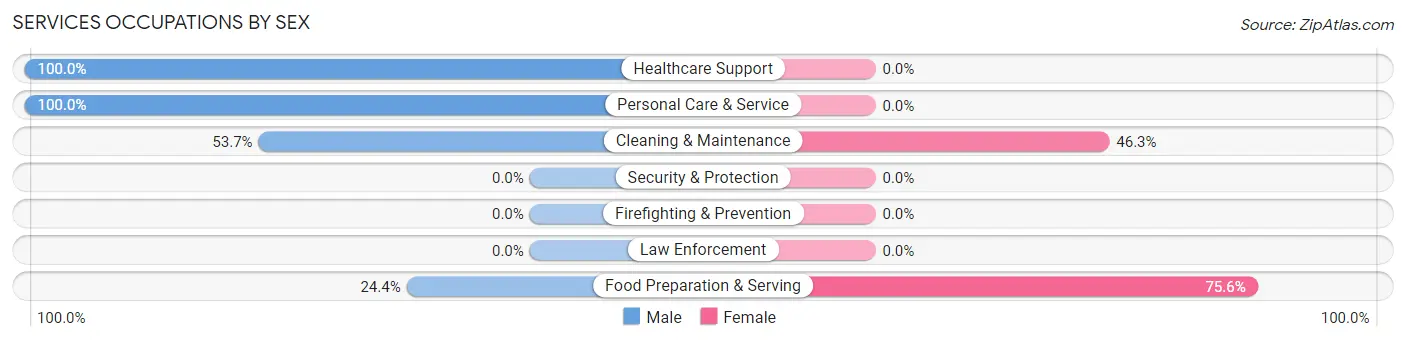
Services Occupations by Sex
Within the Services occupations in Avenue B and C, the most male-oriented occupations are Healthcare Support (100.0%), Personal Care & Service (100.0%), and Cleaning & Maintenance (53.7%), while the most female-oriented occupations are Food Preparation & Serving (75.6%), and Cleaning & Maintenance (46.3%).
| Occupation | Male | Female |
| Healthcare Support | 102 (100.0%) | 0 (0.0%) |
| Security & Protection | 0 (0.0%) | 0 (0.0%) |
| Firefighting & Prevention | 0 (0.0%) | 0 (0.0%) |
| Law Enforcement | 0 (0.0%) | 0 (0.0%) |
| Food Preparation & Serving | 59 (24.4%) | 183 (75.6%) |
| Cleaning & Maintenance | 87 (53.7%) | 75 (46.3%) |
| Personal Care & Service | 20 (100.0%) | 0 (0.0%) |
| Total (Category) | 268 (50.9%) | 258 (49.0%) |
| Total (Overall) | 682 (58.3%) | 488 (41.7%) |
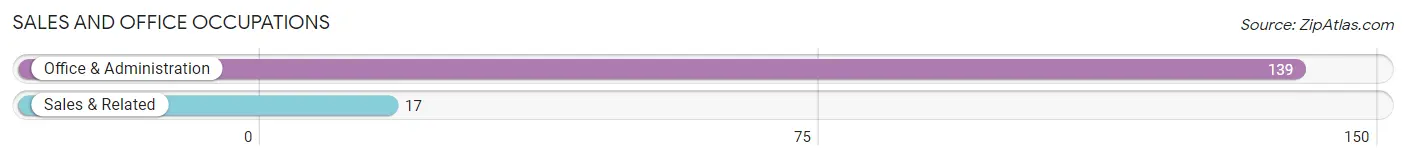
Sales and Office Occupations
The most common Sales and Office occupations in Avenue B and C are Office & Administration (139 | 11.9%), and Sales & Related (17 | 1.5%).
Sales and Office Occupations by Sex
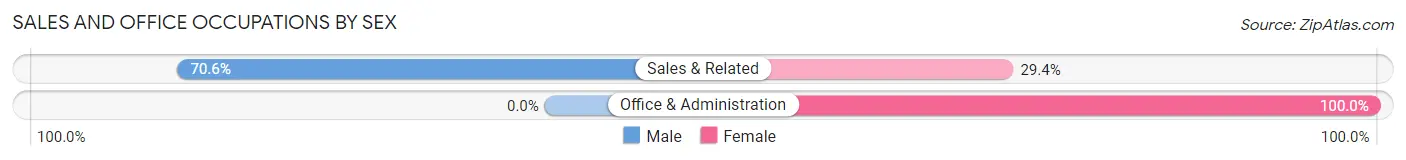
| Occupation | Male | Female |
| Sales & Related | 12 (70.6%) | 5 (29.4%) |
| Office & Administration | 0 (0.0%) | 139 (100.0%) |
| Total (Category) | 12 (7.7%) | 144 (92.3%) |
| Total (Overall) | 682 (58.3%) | 488 (41.7%) |
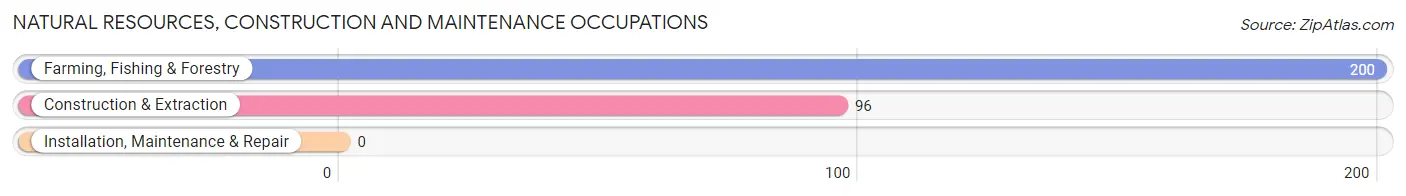
Natural Resources, Construction and Maintenance Occupations
The most common Natural Resources, Construction and Maintenance occupations in Avenue B and C are Farming, Fishing & Forestry (200 | 17.1%), and Construction & Extraction (96 | 8.2%).
Natural Resources, Construction and Maintenance Occupations by Sex
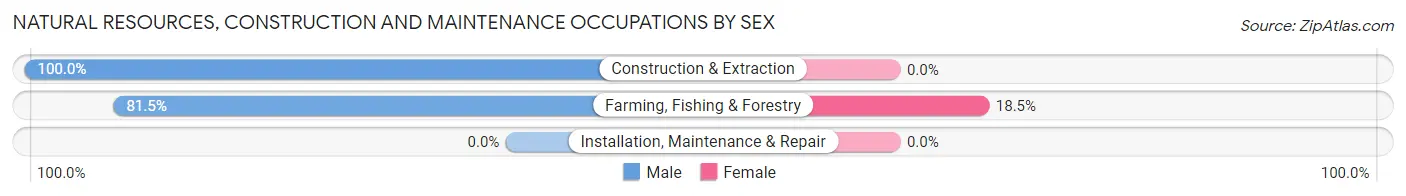
| Occupation | Male | Female |
| Farming, Fishing & Forestry | 163 (81.5%) | 37 (18.5%) |
| Construction & Extraction | 96 (100.0%) | 0 (0.0%) |
| Installation, Maintenance & Repair | 0 (0.0%) | 0 (0.0%) |
| Total (Category) | 259 (87.5%) | 37 (12.5%) |
| Total (Overall) | 682 (58.3%) | 488 (41.7%) |
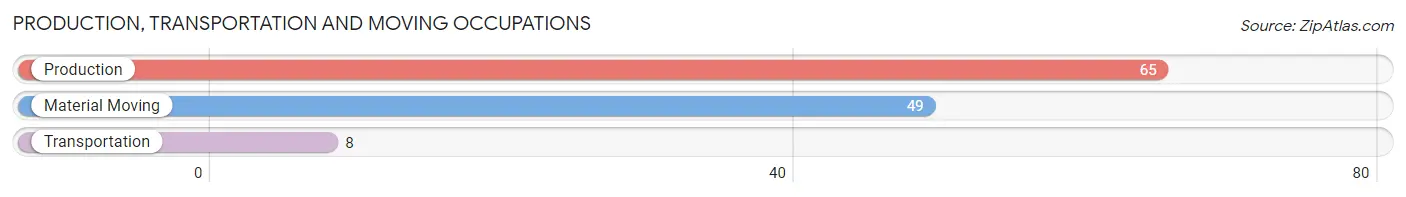
Production, Transportation and Moving Occupations
The most common Production, Transportation and Moving occupations in Avenue B and C are Production (65 | 5.6%), Material Moving (49 | 4.2%), and Transportation (8 | 0.7%).
Production, Transportation and Moving Occupations by Sex
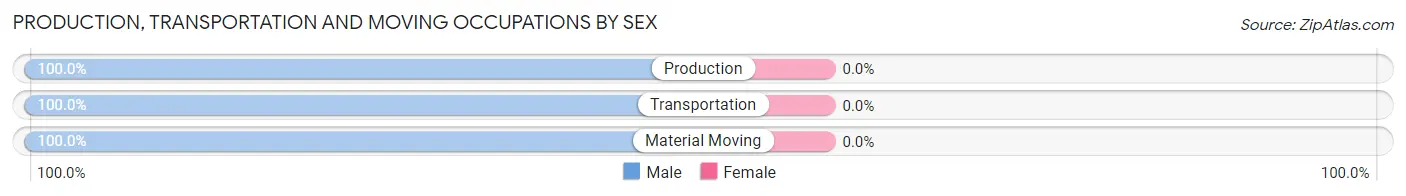
| Occupation | Male | Female |
| Production | 65 (100.0%) | 0 (0.0%) |
| Transportation | 8 (100.0%) | 0 (0.0%) |
| Material Moving | 49 (100.0%) | 0 (0.0%) |
| Total (Category) | 122 (100.0%) | 0 (0.0%) |
| Total (Overall) | 682 (58.3%) | 488 (41.7%) |
Employment Industries by Sex in Avenue B and C
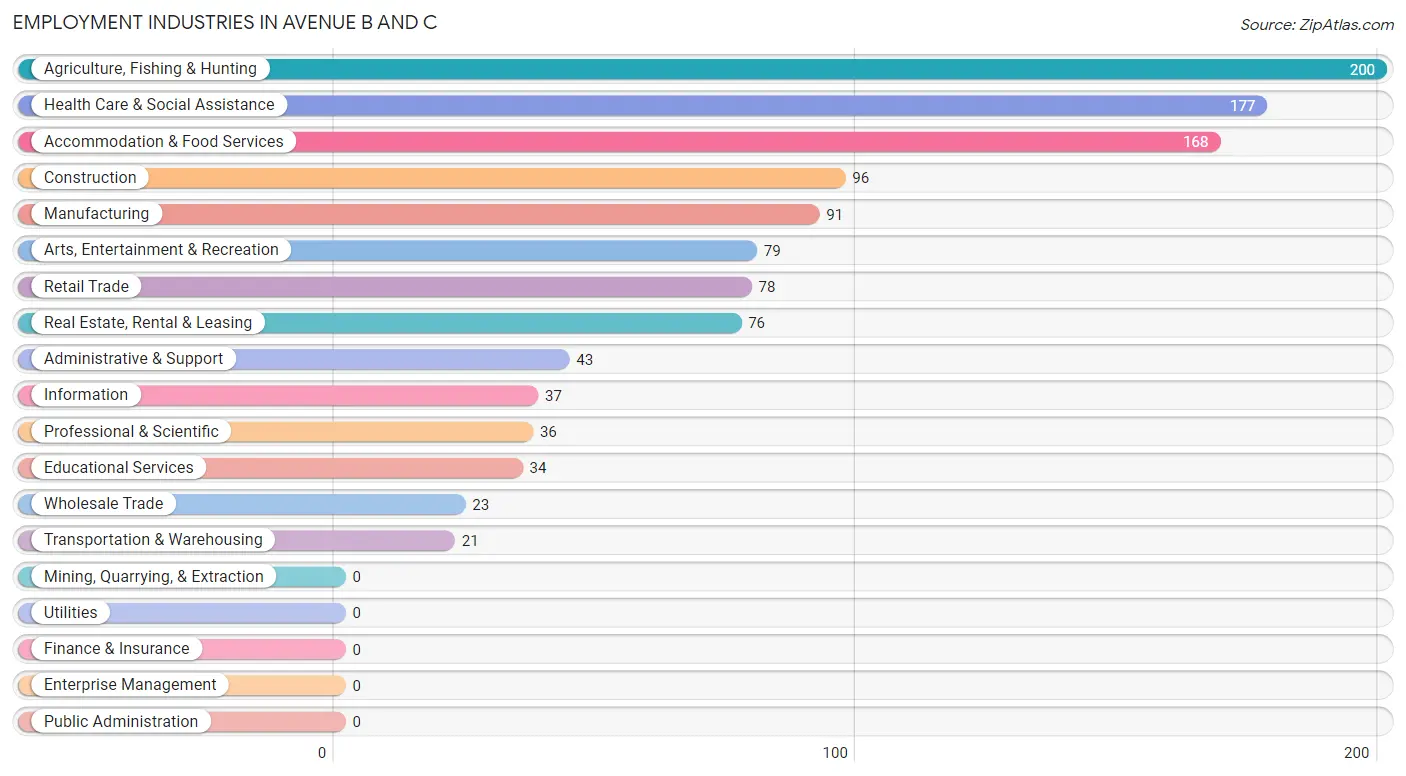
Employment Industries in Avenue B and C
The major employment industries in Avenue B and C include Agriculture, Fishing & Hunting (200 | 17.1%), Health Care & Social Assistance (177 | 15.1%), Accommodation & Food Services (168 | 14.4%), Construction (96 | 8.2%), and Manufacturing (91 | 7.8%).
Employment Industries by Sex in Avenue B and C
The Avenue B and C industries that see more men than women are Construction (100.0%), Manufacturing (100.0%), and Wholesale Trade (100.0%), whereas the industries that tend to have a higher number of women are Information (100.0%), Professional & Scientific (100.0%), and Accommodation & Food Services (100.0%).
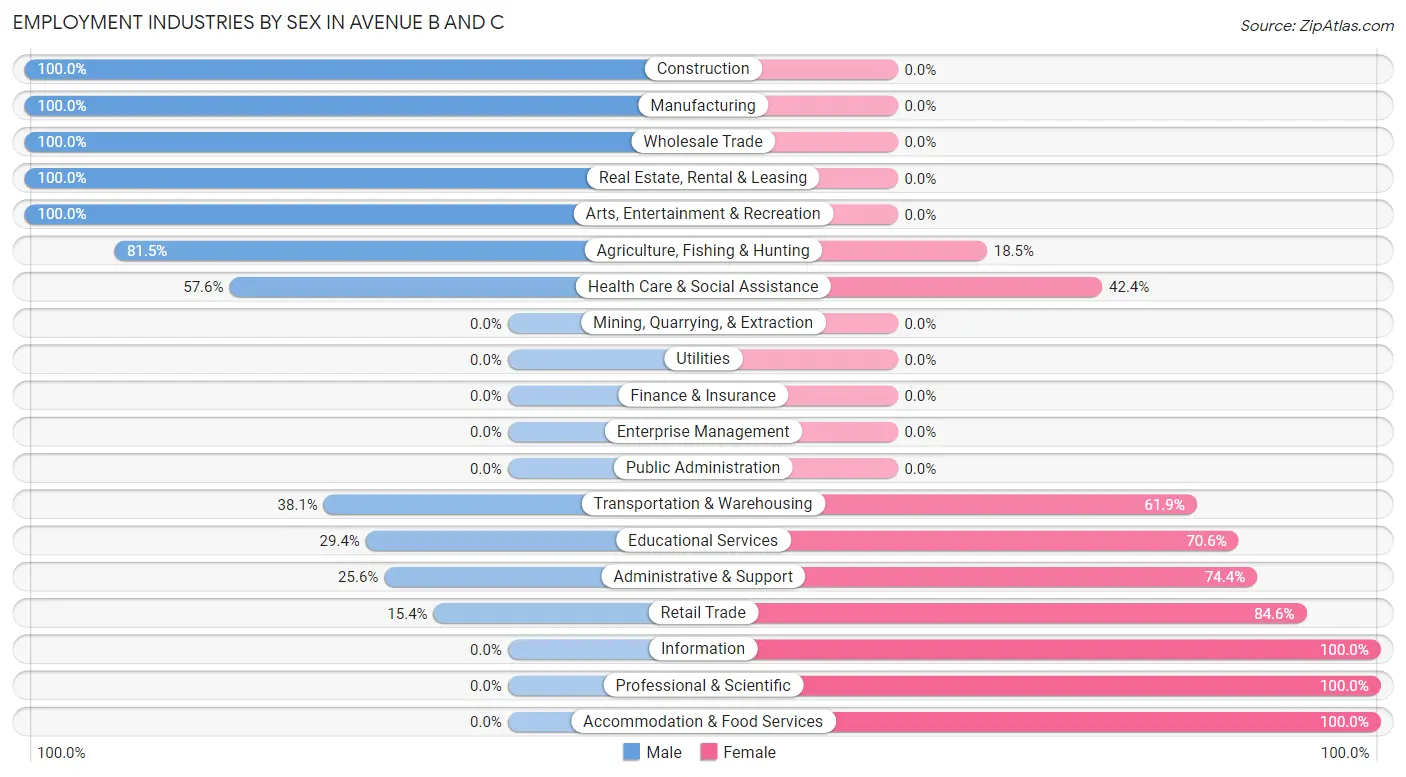
| Industry | Male | Female |
| Agriculture, Fishing & Hunting | 163 (81.5%) | 37 (18.5%) |
| Mining, Quarrying, & Extraction | 0 (0.0%) | 0 (0.0%) |
| Construction | 96 (100.0%) | 0 (0.0%) |
| Manufacturing | 91 (100.0%) | 0 (0.0%) |
| Wholesale Trade | 23 (100.0%) | 0 (0.0%) |
| Retail Trade | 12 (15.4%) | 66 (84.6%) |
| Transportation & Warehousing | 8 (38.1%) | 13 (61.9%) |
| Utilities | 0 (0.0%) | 0 (0.0%) |
| Information | 0 (0.0%) | 37 (100.0%) |
| Finance & Insurance | 0 (0.0%) | 0 (0.0%) |
| Real Estate, Rental & Leasing | 76 (100.0%) | 0 (0.0%) |
| Professional & Scientific | 0 (0.0%) | 36 (100.0%) |
| Enterprise Management | 0 (0.0%) | 0 (0.0%) |
| Administrative & Support | 11 (25.6%) | 32 (74.4%) |
| Educational Services | 10 (29.4%) | 24 (70.6%) |
| Health Care & Social Assistance | 102 (57.6%) | 75 (42.4%) |
| Arts, Entertainment & Recreation | 79 (100.0%) | 0 (0.0%) |
| Accommodation & Food Services | 0 (0.0%) | 168 (100.0%) |
| Public Administration | 0 (0.0%) | 0 (0.0%) |
| Total | 682 (58.3%) | 488 (41.7%) |
Education in Avenue B and C
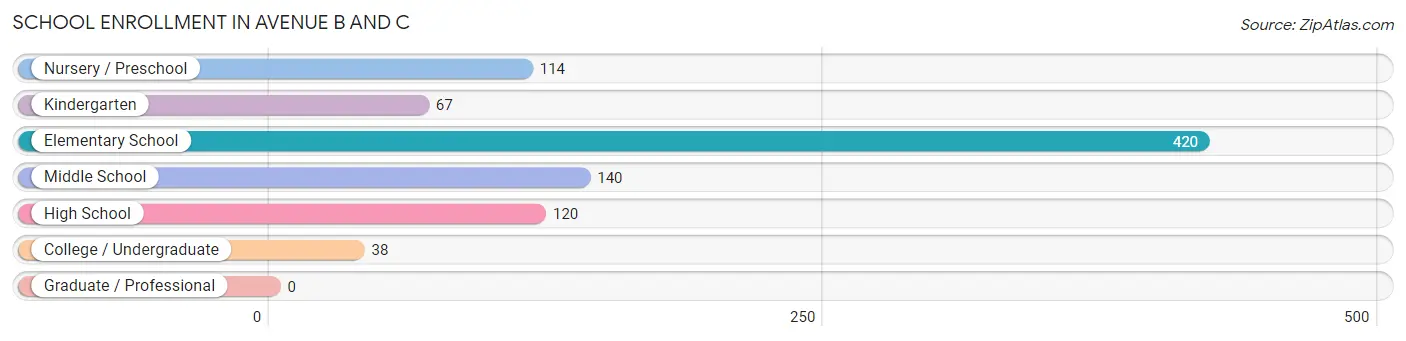
School Enrollment in Avenue B and C
The most common levels of schooling among the 899 students in Avenue B and C are elementary school (420 | 46.7%), middle school (140 | 15.6%), and high school (120 | 13.4%).
| School Level | # Students | % Students |
| Nursery / Preschool | 114 | 12.7% |
| Kindergarten | 67 | 7.4% |
| Elementary School | 420 | 46.7% |
| Middle School | 140 | 15.6% |
| High School | 120 | 13.4% |
| College / Undergraduate | 38 | 4.2% |
| Graduate / Professional | 0 | 0.0% |
| Total | 899 | 100.0% |
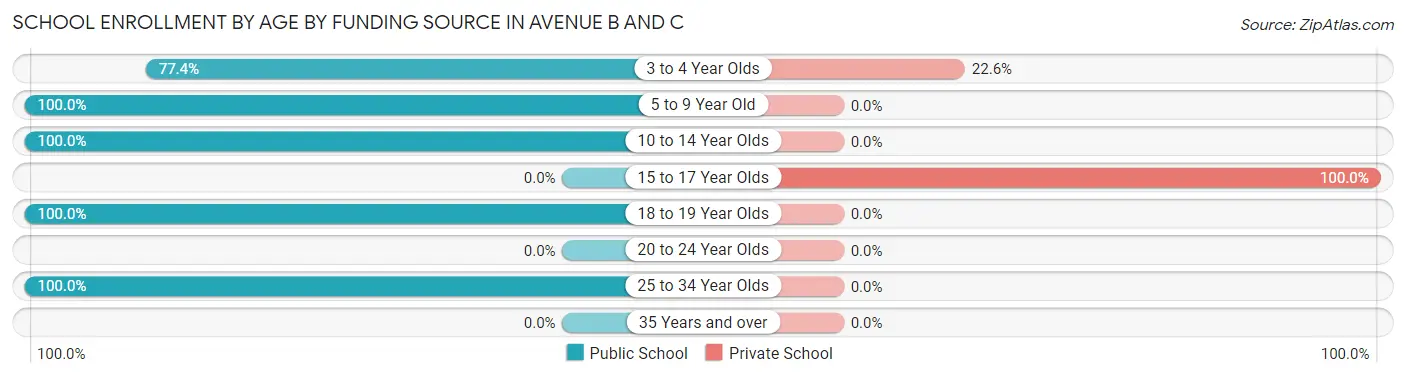
School Enrollment by Age by Funding Source in Avenue B and C
Out of a total of 899 students who are enrolled in schools in Avenue B and C, 28 (3.1%) attend a private institution, while the remaining 871 (96.9%) are enrolled in public schools. The age group of 15 to 17 year olds has the highest likelihood of being enrolled in private schools, with 7 (100.0% in the age bracket) enrolled. Conversely, the age group of 5 to 9 year old has the lowest likelihood of being enrolled in a private school, with 458 (100.0% in the age bracket) attending a public institution.
| Age Bracket | Public School | Private School |
| 3 to 4 Year Olds | 72 (77.4%) | 21 (22.6%) |
| 5 to 9 Year Old | 458 (100.0%) | 0 (0.0%) |
| 10 to 14 Year Olds | 261 (100.0%) | 0 (0.0%) |
| 15 to 17 Year Olds | 0 (0.0%) | 7 (100.0%) |
| 18 to 19 Year Olds | 42 (100.0%) | 0 (0.0%) |
| 20 to 24 Year Olds | 0 (0.0%) | 0 (0.0%) |
| 25 to 34 Year Olds | 38 (100.0%) | 0 (0.0%) |
| 35 Years and over | 0 (0.0%) | 0 (0.0%) |
| Total | 871 (96.9%) | 28 (3.1%) |
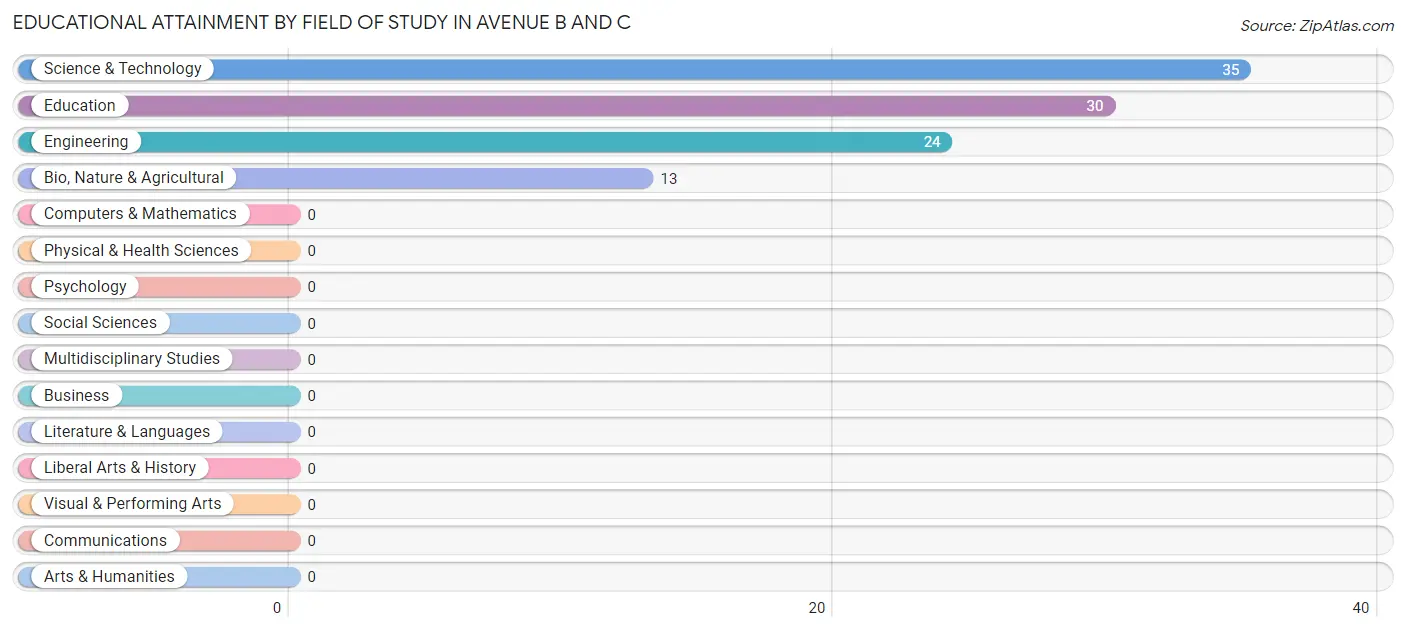
Educational Attainment by Field of Study in Avenue B and C
Science & technology (35 | 34.3%), education (30 | 29.4%), engineering (24 | 23.5%), and bio, nature & agricultural (13 | 12.8%) are the most common fields of study among 102 individuals in Avenue B and C who have obtained a bachelor's degree or higher.
| Field of Study | # Graduates | % Graduates |
| Computers & Mathematics | 0 | 0.0% |
| Bio, Nature & Agricultural | 13 | 12.8% |
| Physical & Health Sciences | 0 | 0.0% |
| Psychology | 0 | 0.0% |
| Social Sciences | 0 | 0.0% |
| Engineering | 24 | 23.5% |
| Multidisciplinary Studies | 0 | 0.0% |
| Science & Technology | 35 | 34.3% |
| Business | 0 | 0.0% |
| Education | 30 | 29.4% |
| Literature & Languages | 0 | 0.0% |
| Liberal Arts & History | 0 | 0.0% |
| Visual & Performing Arts | 0 | 0.0% |
| Communications | 0 | 0.0% |
| Arts & Humanities | 0 | 0.0% |
| Total | 102 | 100.0% |
Transportation & Commute in Avenue B and C
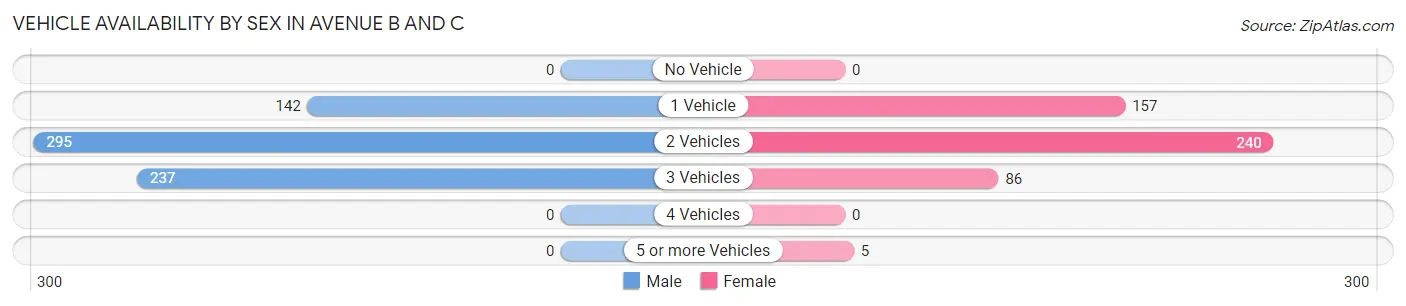
Vehicle Availability by Sex in Avenue B and C
The most prevalent vehicle ownership categories in Avenue B and C are males with 2 vehicles (295, accounting for 43.8%) and females with 2 vehicles (240, making up 60.5%).
| Vehicles Available | Male | Female |
| No Vehicle | 0 (0.0%) | 0 (0.0%) |
| 1 Vehicle | 142 (21.1%) | 157 (32.2%) |
| 2 Vehicles | 295 (43.8%) | 240 (49.2%) |
| 3 Vehicles | 237 (35.2%) | 86 (17.6%) |
| 4 Vehicles | 0 (0.0%) | 0 (0.0%) |
| 5 or more Vehicles | 0 (0.0%) | 5 (1.0%) |
| Total | 674 (100.0%) | 488 (100.0%) |
Commute Time in Avenue B and C
The most frequently occuring commute durations in Avenue B and C are 20 to 24 minutes (260 commuters, 23.1%), 30 to 34 minutes (255 commuters, 22.7%), and 25 to 29 minutes (137 commuters, 12.2%).
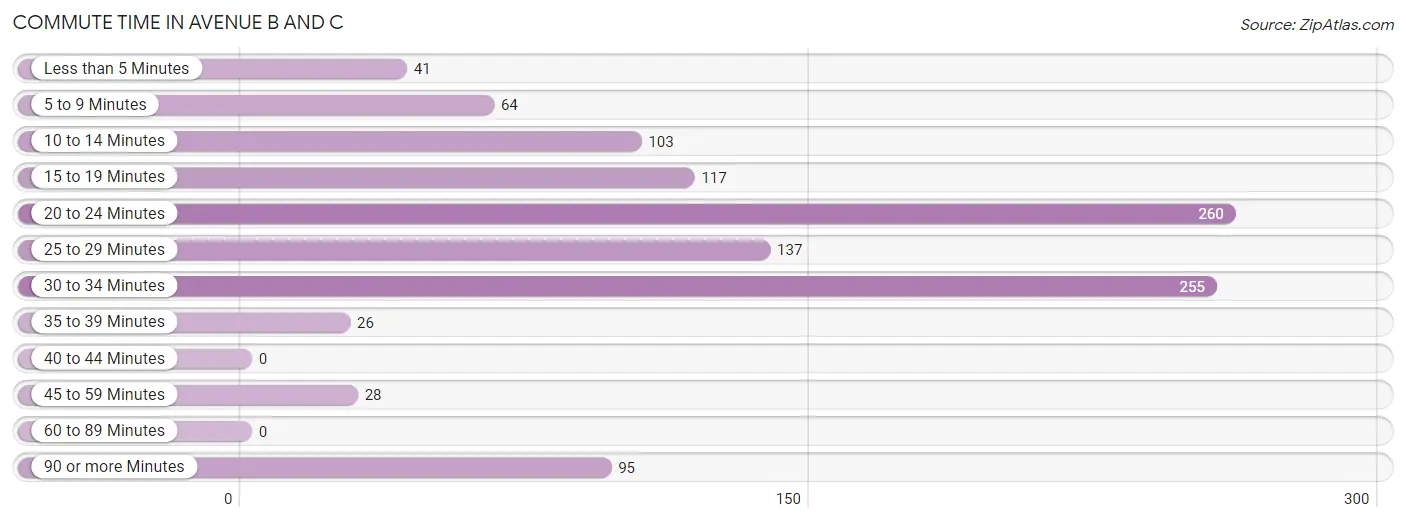
| Commute Time | # Commuters | % Commuters |
| Less than 5 Minutes | 41 | 3.6% |
| 5 to 9 Minutes | 64 | 5.7% |
| 10 to 14 Minutes | 103 | 9.1% |
| 15 to 19 Minutes | 117 | 10.4% |
| 20 to 24 Minutes | 260 | 23.1% |
| 25 to 29 Minutes | 137 | 12.2% |
| 30 to 34 Minutes | 255 | 22.7% |
| 35 to 39 Minutes | 26 | 2.3% |
| 40 to 44 Minutes | 0 | 0.0% |
| 45 to 59 Minutes | 28 | 2.5% |
| 60 to 89 Minutes | 0 | 0.0% |
| 90 or more Minutes | 95 | 8.4% |
Commute Time by Sex in Avenue B and C
The most common commute times in Avenue B and C are 20 to 24 minutes (245 commuters, 36.3%) for males and 25 to 29 minutes (125 commuters, 27.7%) for females.
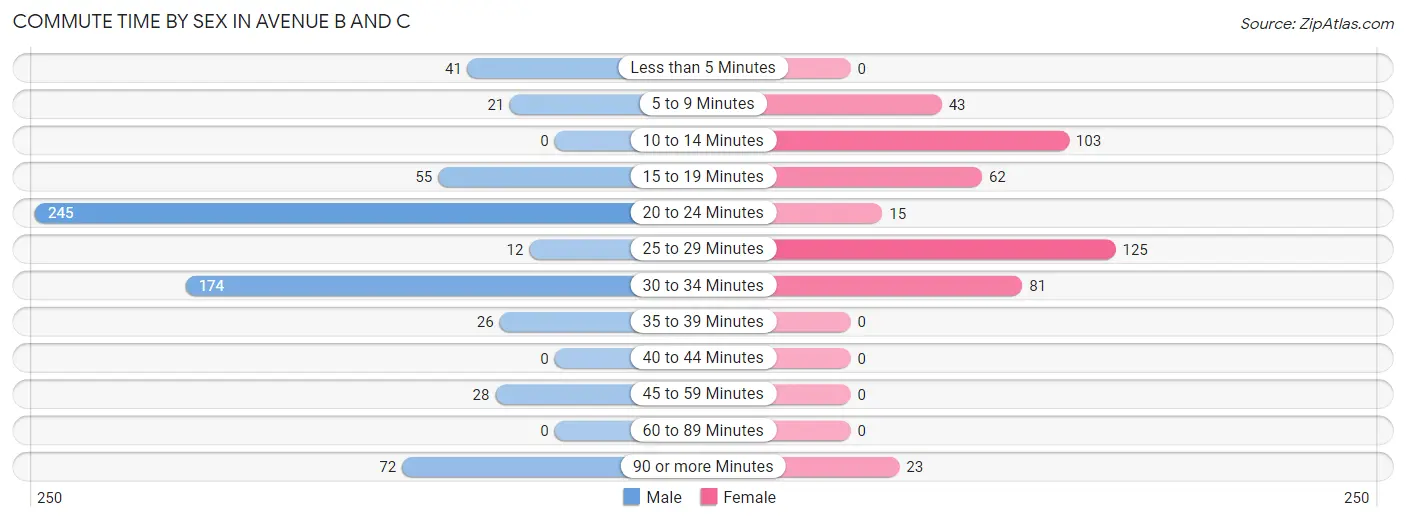
| Commute Time | Male | Female |
| Less than 5 Minutes | 41 (6.1%) | 0 (0.0%) |
| 5 to 9 Minutes | 21 (3.1%) | 43 (9.5%) |
| 10 to 14 Minutes | 0 (0.0%) | 103 (22.8%) |
| 15 to 19 Minutes | 55 (8.2%) | 62 (13.7%) |
| 20 to 24 Minutes | 245 (36.3%) | 15 (3.3%) |
| 25 to 29 Minutes | 12 (1.8%) | 125 (27.7%) |
| 30 to 34 Minutes | 174 (25.8%) | 81 (17.9%) |
| 35 to 39 Minutes | 26 (3.9%) | 0 (0.0%) |
| 40 to 44 Minutes | 0 (0.0%) | 0 (0.0%) |
| 45 to 59 Minutes | 28 (4.2%) | 0 (0.0%) |
| 60 to 89 Minutes | 0 (0.0%) | 0 (0.0%) |
| 90 or more Minutes | 72 (10.7%) | 23 (5.1%) |
Time of Departure to Work by Sex in Avenue B and C
The most frequent times of departure to work in Avenue B and C are 6:00 AM to 6:29 AM (158, 23.4%) for males and 6:00 AM to 6:29 AM (175, 38.7%) for females.
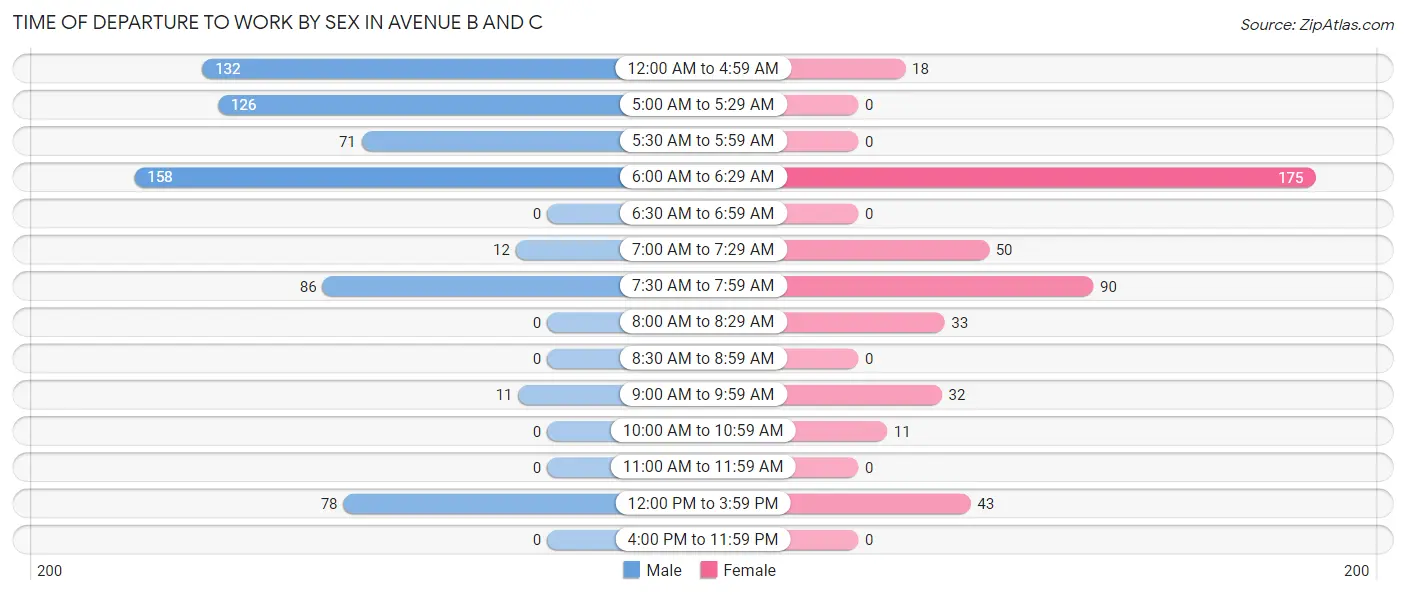
| Time of Departure | Male | Female |
| 12:00 AM to 4:59 AM | 132 (19.6%) | 18 (4.0%) |
| 5:00 AM to 5:29 AM | 126 (18.7%) | 0 (0.0%) |
| 5:30 AM to 5:59 AM | 71 (10.5%) | 0 (0.0%) |
| 6:00 AM to 6:29 AM | 158 (23.4%) | 175 (38.7%) |
| 6:30 AM to 6:59 AM | 0 (0.0%) | 0 (0.0%) |
| 7:00 AM to 7:29 AM | 12 (1.8%) | 50 (11.1%) |
| 7:30 AM to 7:59 AM | 86 (12.8%) | 90 (19.9%) |
| 8:00 AM to 8:29 AM | 0 (0.0%) | 33 (7.3%) |
| 8:30 AM to 8:59 AM | 0 (0.0%) | 0 (0.0%) |
| 9:00 AM to 9:59 AM | 11 (1.6%) | 32 (7.1%) |
| 10:00 AM to 10:59 AM | 0 (0.0%) | 11 (2.4%) |
| 11:00 AM to 11:59 AM | 0 (0.0%) | 0 (0.0%) |
| 12:00 PM to 3:59 PM | 78 (11.6%) | 43 (9.5%) |
| 4:00 PM to 11:59 PM | 0 (0.0%) | 0 (0.0%) |
| Total | 674 (100.0%) | 452 (100.0%) |
Housing Occupancy in Avenue B and C
Occupancy by Ownership in Avenue B and C
Of the total 1,520 dwellings in Avenue B and C, owner-occupied units account for 691 (45.5%), while renter-occupied units make up 829 (54.5%).
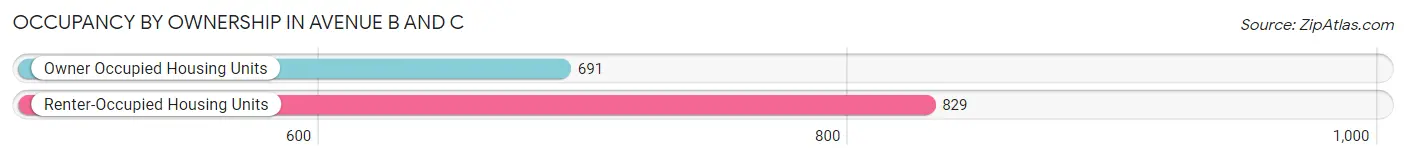
| Occupancy | # Housing Units | % Housing Units |
| Owner Occupied Housing Units | 691 | 45.5% |
| Renter-Occupied Housing Units | 829 | 54.5% |
| Total Occupied Housing Units | 1,520 | 100.0% |
Occupancy by Household Size in Avenue B and C
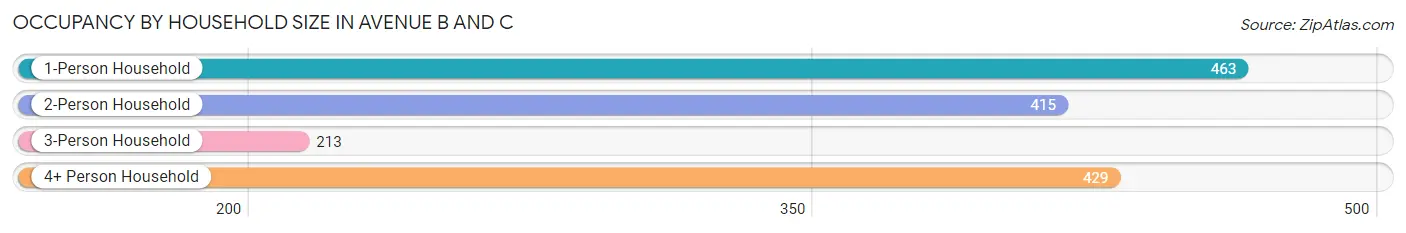
| Household Size | # Housing Units | % Housing Units |
| 1-Person Household | 463 | 30.5% |
| 2-Person Household | 415 | 27.3% |
| 3-Person Household | 213 | 14.0% |
| 4+ Person Household | 429 | 28.2% |
| Total Housing Units | 1,520 | 100.0% |
Occupancy by Ownership by Household Size in Avenue B and C
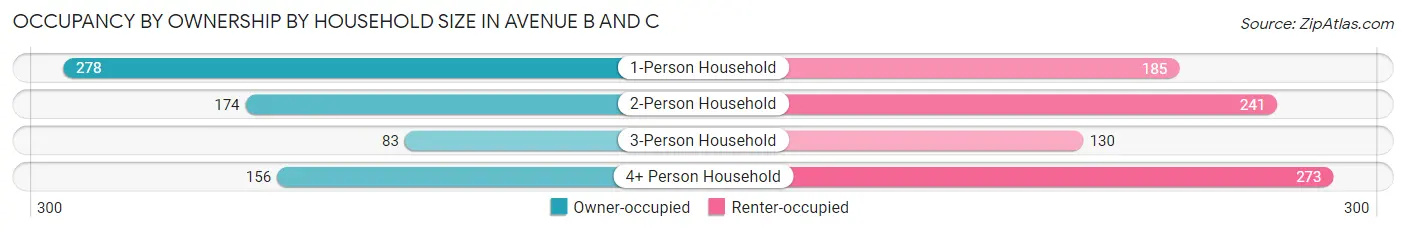
| Household Size | Owner-occupied | Renter-occupied |
| 1-Person Household | 278 (60.0%) | 185 (40.0%) |
| 2-Person Household | 174 (41.9%) | 241 (58.1%) |
| 3-Person Household | 83 (39.0%) | 130 (61.0%) |
| 4+ Person Household | 156 (36.4%) | 273 (63.6%) |
| Total Housing Units | 691 (45.5%) | 829 (54.5%) |
Occupancy by Educational Attainment in Avenue B and C
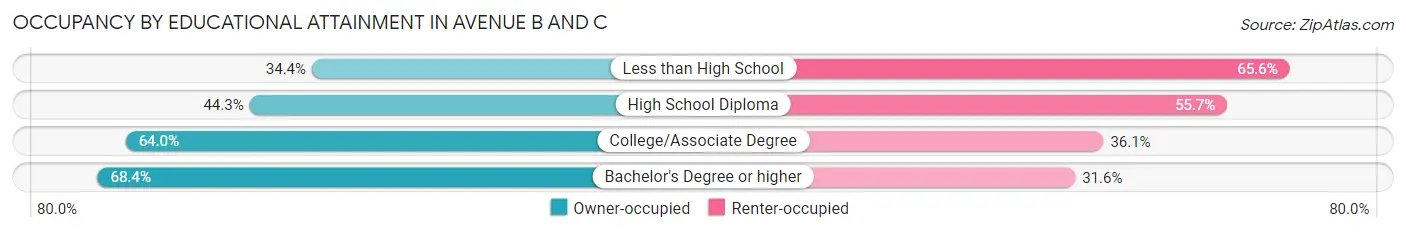
| Household Size | Owner-occupied | Renter-occupied |
| Less than High School | 239 (34.4%) | 455 (65.6%) |
| High School Diploma | 180 (44.3%) | 226 (55.7%) |
| College/Associate Degree | 220 (63.9%) | 124 (36.0%) |
| Bachelor's Degree or higher | 52 (68.4%) | 24 (31.6%) |
Occupancy by Age of Householder in Avenue B and C
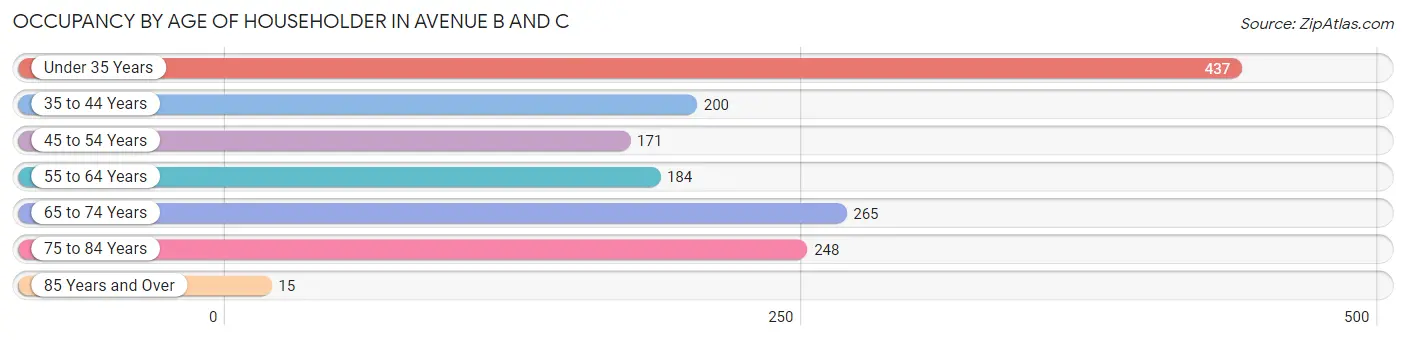
| Age Bracket | # Households | % Households |
| Under 35 Years | 437 | 28.7% |
| 35 to 44 Years | 200 | 13.2% |
| 45 to 54 Years | 171 | 11.3% |
| 55 to 64 Years | 184 | 12.1% |
| 65 to 74 Years | 265 | 17.4% |
| 75 to 84 Years | 248 | 16.3% |
| 85 Years and Over | 15 | 1.0% |
| Total | 1,520 | 100.0% |
Housing Finances in Avenue B and C
Median Income by Occupancy in Avenue B and C
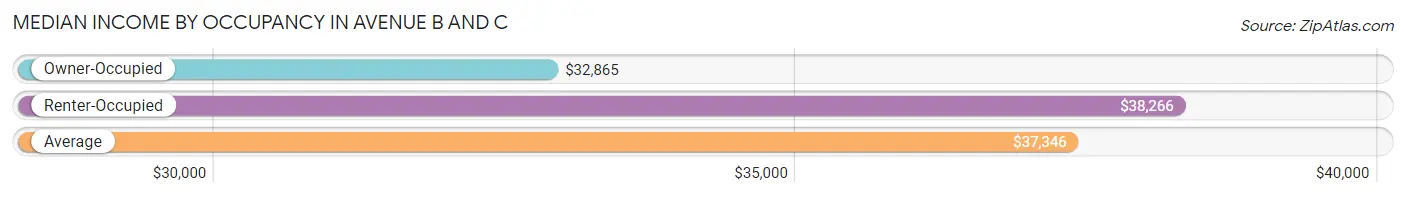
| Occupancy Type | # Households | Median Income |
| Owner-Occupied | 691 (45.5%) | $32,865 |
| Renter-Occupied | 829 (54.5%) | $38,266 |
| Average | 1,520 (100.0%) | $37,346 |
Occupancy by Householder Income Bracket in Avenue B and C
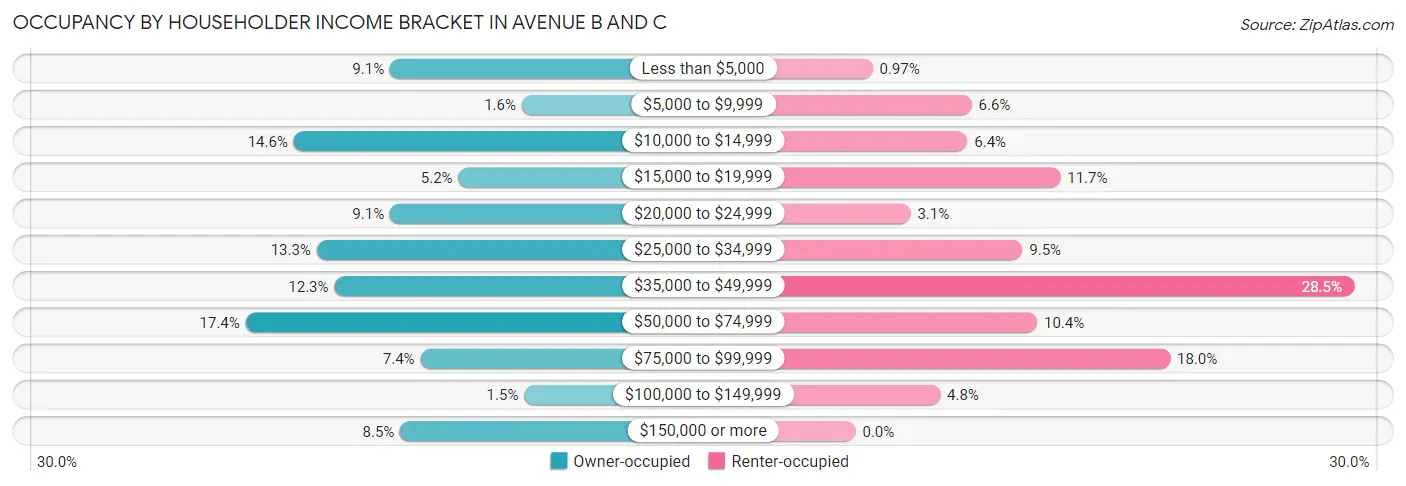
| Income Bracket | Owner-occupied | Renter-occupied |
| Less than $5,000 | 63 (9.1%) | 8 (1.0%) |
| $5,000 to $9,999 | 11 (1.6%) | 55 (6.6%) |
| $10,000 to $14,999 | 101 (14.6%) | 53 (6.4%) |
| $15,000 to $19,999 | 36 (5.2%) | 97 (11.7%) |
| $20,000 to $24,999 | 63 (9.1%) | 26 (3.1%) |
| $25,000 to $34,999 | 92 (13.3%) | 79 (9.5%) |
| $35,000 to $49,999 | 85 (12.3%) | 236 (28.5%) |
| $50,000 to $74,999 | 120 (17.4%) | 86 (10.4%) |
| $75,000 to $99,999 | 51 (7.4%) | 149 (18.0%) |
| $100,000 to $149,999 | 10 (1.5%) | 40 (4.8%) |
| $150,000 or more | 59 (8.5%) | 0 (0.0%) |
| Total | 691 (100.0%) | 829 (100.0%) |
Monthly Housing Cost Tiers in Avenue B and C
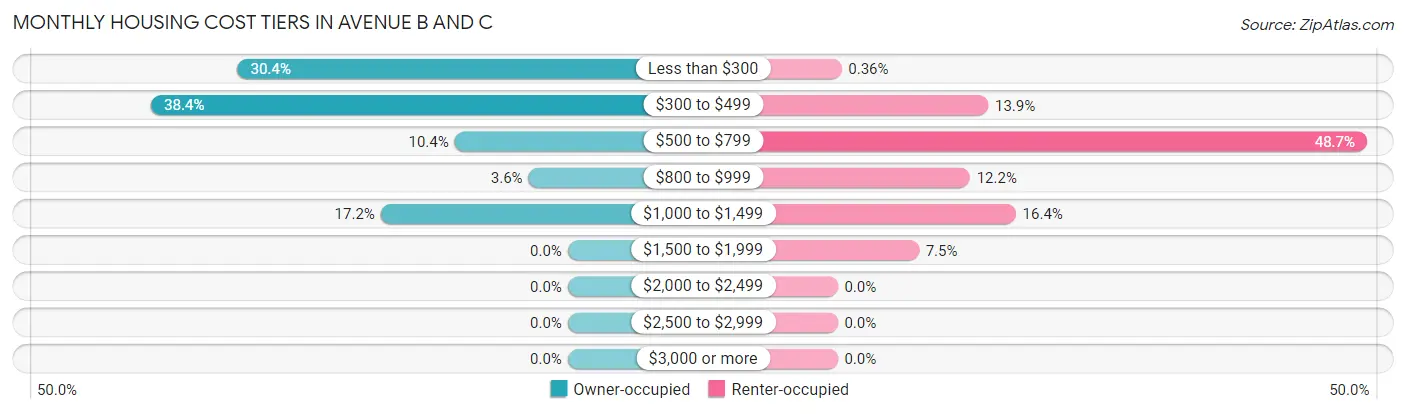
| Monthly Cost | Owner-occupied | Renter-occupied |
| Less than $300 | 210 (30.4%) | 3 (0.4%) |
| $300 to $499 | 265 (38.4%) | 115 (13.9%) |
| $500 to $799 | 72 (10.4%) | 404 (48.7%) |
| $800 to $999 | 25 (3.6%) | 101 (12.2%) |
| $1,000 to $1,499 | 119 (17.2%) | 136 (16.4%) |
| $1,500 to $1,999 | 0 (0.0%) | 62 (7.5%) |
| $2,000 to $2,499 | 0 (0.0%) | 0 (0.0%) |
| $2,500 to $2,999 | 0 (0.0%) | 0 (0.0%) |
| $3,000 or more | 0 (0.0%) | 0 (0.0%) |
| Total | 691 (100.0%) | 829 (100.0%) |
Physical Housing Characteristics in Avenue B and C
Housing Structures in Avenue B and C
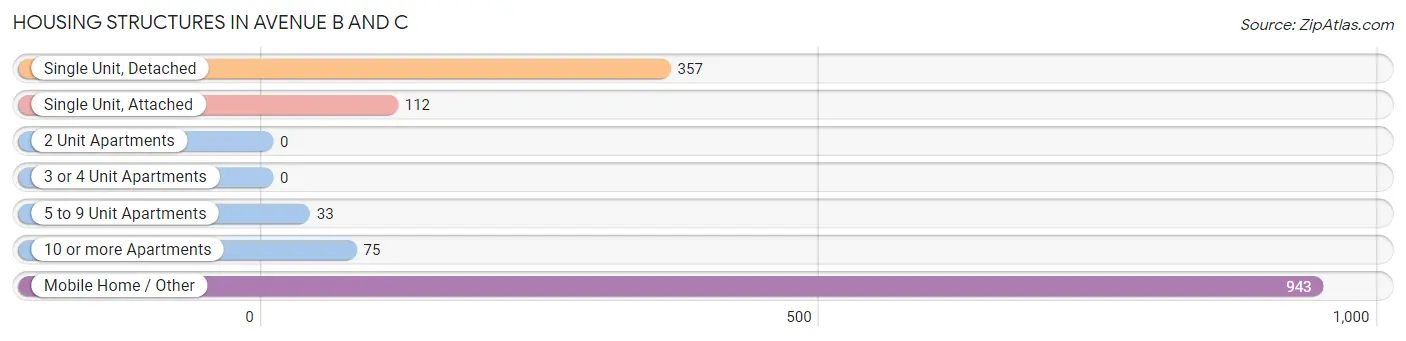
| Structure Type | # Housing Units | % Housing Units |
| Single Unit, Detached | 357 | 23.5% |
| Single Unit, Attached | 112 | 7.4% |
| 2 Unit Apartments | 0 | 0.0% |
| 3 or 4 Unit Apartments | 0 | 0.0% |
| 5 to 9 Unit Apartments | 33 | 2.2% |
| 10 or more Apartments | 75 | 4.9% |
| Mobile Home / Other | 943 | 62.0% |
| Total | 1,520 | 100.0% |
Housing Structures by Occupancy in Avenue B and C
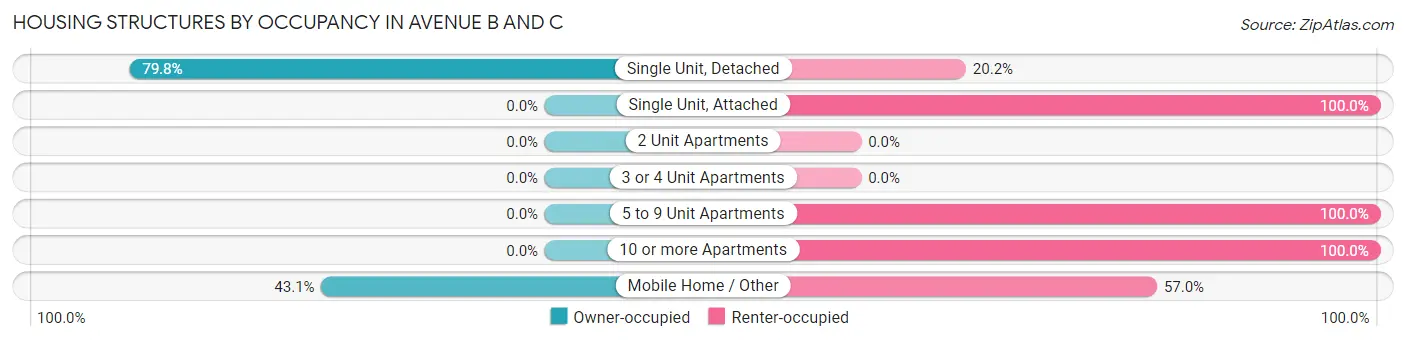
| Structure Type | Owner-occupied | Renter-occupied |
| Single Unit, Detached | 285 (79.8%) | 72 (20.2%) |
| Single Unit, Attached | 0 (0.0%) | 112 (100.0%) |
| 2 Unit Apartments | 0 (0.0%) | 0 (0.0%) |
| 3 or 4 Unit Apartments | 0 (0.0%) | 0 (0.0%) |
| 5 to 9 Unit Apartments | 0 (0.0%) | 33 (100.0%) |
| 10 or more Apartments | 0 (0.0%) | 75 (100.0%) |
| Mobile Home / Other | 406 (43.0%) | 537 (57.0%) |
| Total | 691 (45.5%) | 829 (54.5%) |
Housing Structures by Number of Rooms in Avenue B and C
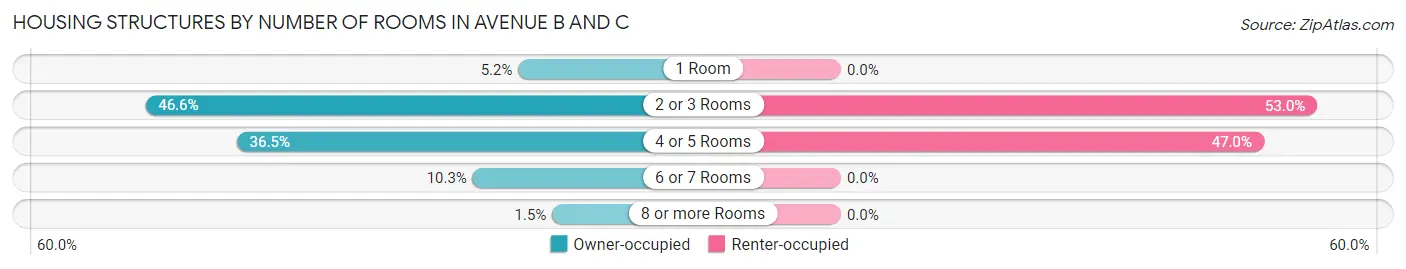
| Number of Rooms | Owner-occupied | Renter-occupied |
| 1 Room | 36 (5.2%) | 0 (0.0%) |
| 2 or 3 Rooms | 322 (46.6%) | 439 (53.0%) |
| 4 or 5 Rooms | 252 (36.5%) | 390 (47.0%) |
| 6 or 7 Rooms | 71 (10.3%) | 0 (0.0%) |
| 8 or more Rooms | 10 (1.5%) | 0 (0.0%) |
| Total | 691 (100.0%) | 829 (100.0%) |
Housing Structure by Heating Type in Avenue B and C
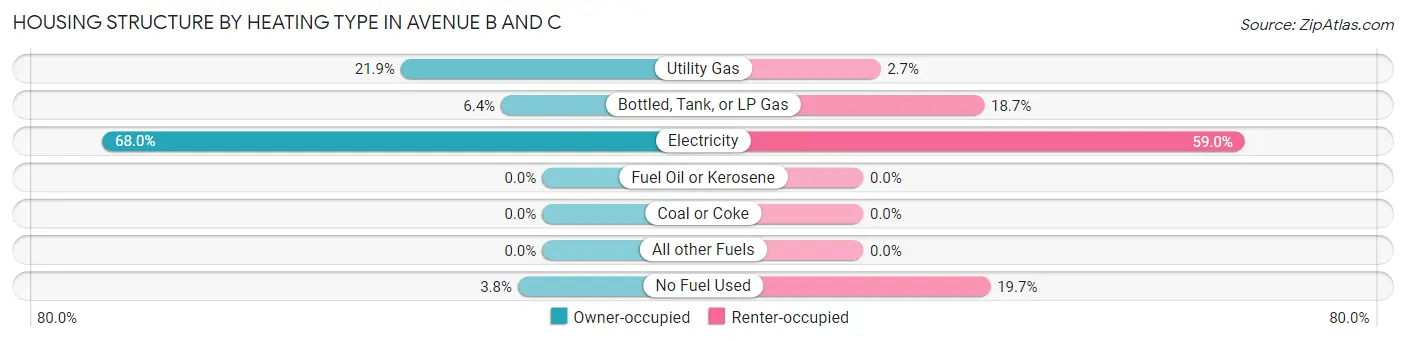
| Heating Type | Owner-occupied | Renter-occupied |
| Utility Gas | 151 (21.8%) | 22 (2.6%) |
| Bottled, Tank, or LP Gas | 44 (6.4%) | 155 (18.7%) |
| Electricity | 470 (68.0%) | 489 (59.0%) |
| Fuel Oil or Kerosene | 0 (0.0%) | 0 (0.0%) |
| Coal or Coke | 0 (0.0%) | 0 (0.0%) |
| All other Fuels | 0 (0.0%) | 0 (0.0%) |
| No Fuel Used | 26 (3.8%) | 163 (19.7%) |
| Total | 691 (100.0%) | 829 (100.0%) |
Household Vehicle Usage in Avenue B and C
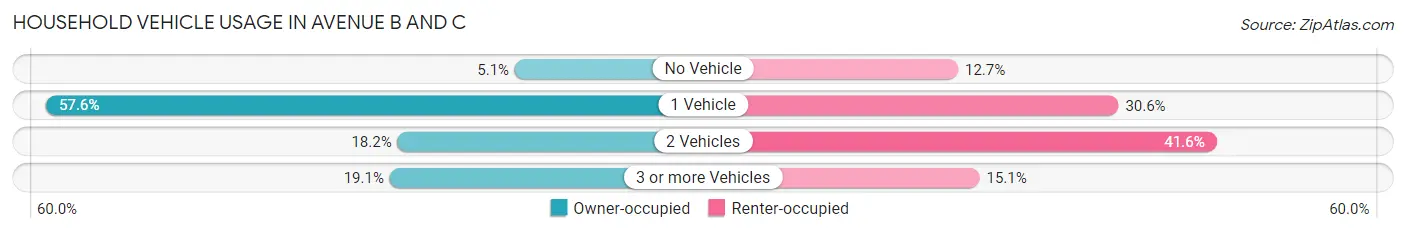
| Vehicles per Household | Owner-occupied | Renter-occupied |
| No Vehicle | 35 (5.1%) | 105 (12.7%) |
| 1 Vehicle | 398 (57.6%) | 254 (30.6%) |
| 2 Vehicles | 126 (18.2%) | 345 (41.6%) |
| 3 or more Vehicles | 132 (19.1%) | 125 (15.1%) |
| Total | 691 (100.0%) | 829 (100.0%) |
Real Estate & Mortgages in Avenue B and C
Real Estate and Mortgage Overview in Avenue B and C
| Characteristic | Without Mortgage | With Mortgage |
| Housing Units | 369 | 322 |
| Median Property Value | - | - |
| Median Household Income | $27,776 | $59 |
| Monthly Housing Costs | $234 | $0 |
| Real Estate Taxes | $199 | $78 |
Property Value by Mortgage Status in Avenue B and C
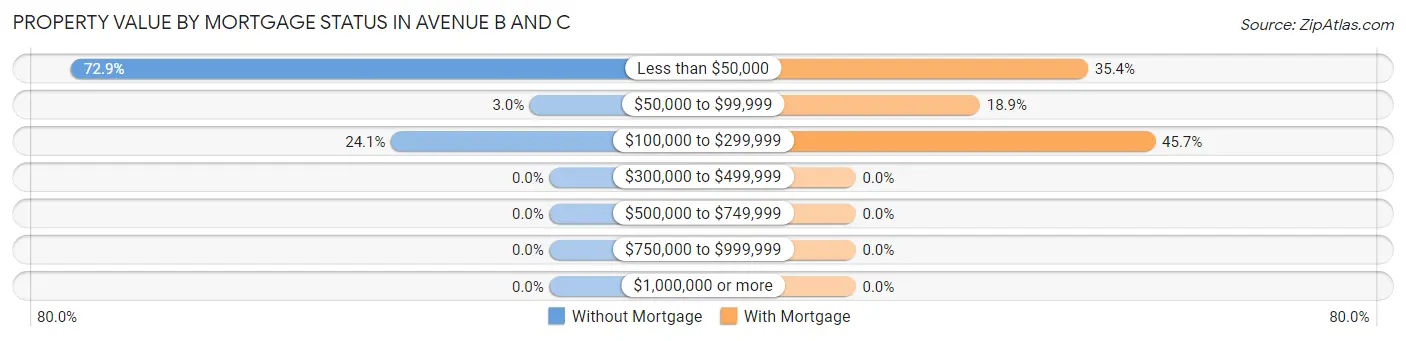
| Property Value | Without Mortgage | With Mortgage |
| Less than $50,000 | 269 (72.9%) | 114 (35.4%) |
| $50,000 to $99,999 | 11 (3.0%) | 61 (18.9%) |
| $100,000 to $299,999 | 89 (24.1%) | 147 (45.7%) |
| $300,000 to $499,999 | 0 (0.0%) | 0 (0.0%) |
| $500,000 to $749,999 | 0 (0.0%) | 0 (0.0%) |
| $750,000 to $999,999 | 0 (0.0%) | 0 (0.0%) |
| $1,000,000 or more | 0 (0.0%) | 0 (0.0%) |
| Total | 369 (100.0%) | 322 (100.0%) |
Household Income by Mortgage Status in Avenue B and C
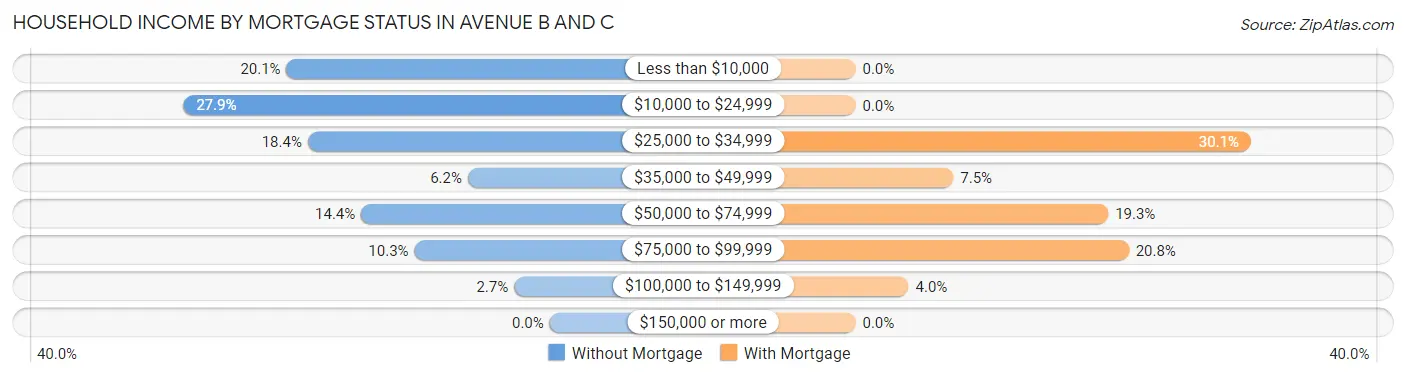
| Household Income | Without Mortgage | With Mortgage |
| Less than $10,000 | 74 (20.1%) | 0 (0.0%) |
| $10,000 to $24,999 | 103 (27.9%) | 0 (0.0%) |
| $25,000 to $34,999 | 68 (18.4%) | 97 (30.1%) |
| $35,000 to $49,999 | 23 (6.2%) | 24 (7.4%) |
| $50,000 to $74,999 | 53 (14.4%) | 62 (19.3%) |
| $75,000 to $99,999 | 38 (10.3%) | 67 (20.8%) |
| $100,000 to $149,999 | 10 (2.7%) | 13 (4.0%) |
| $150,000 or more | 0 (0.0%) | 0 (0.0%) |
| Total | 369 (100.0%) | 322 (100.0%) |
Property Value to Household Income Ratio in Avenue B and C
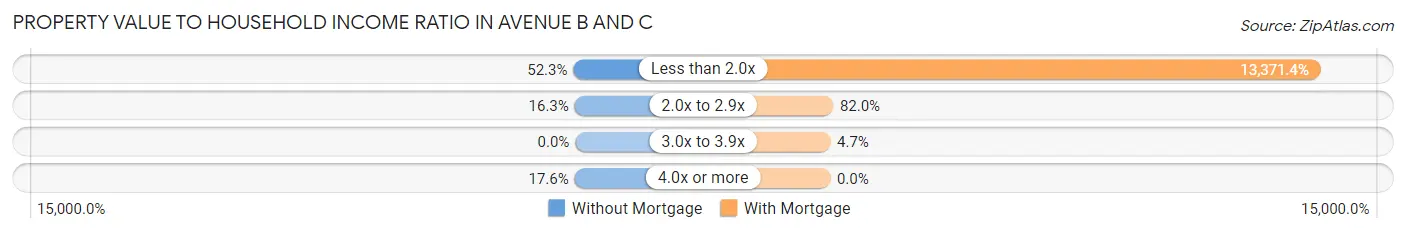
| Value-to-Income Ratio | Without Mortgage | With Mortgage |
| Less than 2.0x | 193 (52.3%) | 43,056 (13,371.4%) |
| 2.0x to 2.9x | 60 (16.3%) | 264 (82.0%) |
| 3.0x to 3.9x | 0 (0.0%) | 15 (4.7%) |
| 4.0x or more | 65 (17.6%) | 0 (0.0%) |
| Total | 369 (100.0%) | 322 (100.0%) |
Real Estate Taxes by Mortgage Status in Avenue B and C
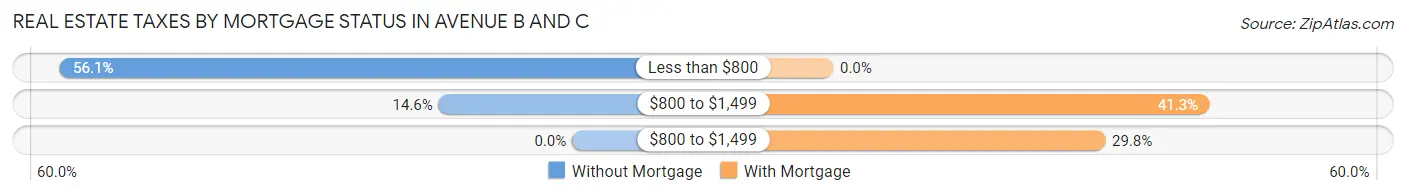
| Property Taxes | Without Mortgage | With Mortgage |
| Less than $800 | 207 (56.1%) | 0 (0.0%) |
| $800 to $1,499 | 54 (14.6%) | 133 (41.3%) |
| $800 to $1,499 | 0 (0.0%) | 96 (29.8%) |
| Total | 369 (100.0%) | 322 (100.0%) |
Health & Disability in Avenue B and C
Health Insurance Coverage by Age in Avenue B and C
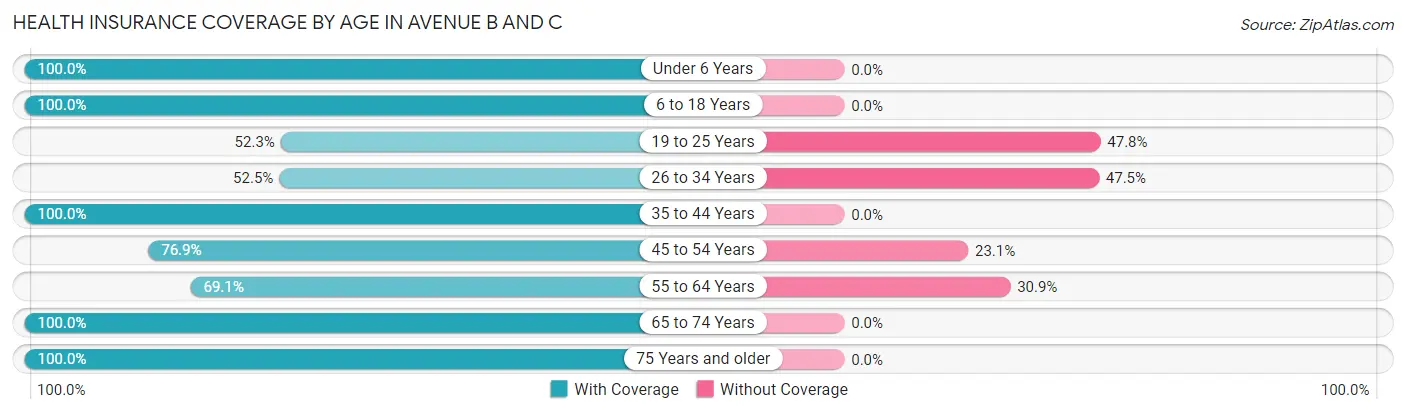
| Age Bracket | With Coverage | Without Coverage |
| Under 6 Years | 495 (100.0%) | 0 (0.0%) |
| 6 to 18 Years | 697 (100.0%) | 0 (0.0%) |
| 19 to 25 Years | 221 (52.2%) | 202 (47.7%) |
| 26 to 34 Years | 311 (52.5%) | 281 (47.5%) |
| 35 to 44 Years | 398 (100.0%) | 0 (0.0%) |
| 45 to 54 Years | 200 (76.9%) | 60 (23.1%) |
| 55 to 64 Years | 183 (69.1%) | 82 (30.9%) |
| 65 to 74 Years | 392 (100.0%) | 0 (0.0%) |
| 75 Years and older | 328 (100.0%) | 0 (0.0%) |
| Total | 3,225 (83.8%) | 625 (16.2%) |
Health Insurance Coverage by Citizenship Status in Avenue B and C
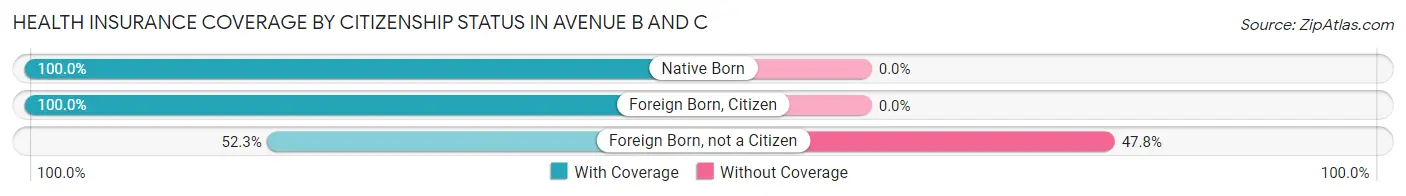
| Citizenship Status | With Coverage | Without Coverage |
| Native Born | 495 (100.0%) | 0 (0.0%) |
| Foreign Born, Citizen | 697 (100.0%) | 0 (0.0%) |
| Foreign Born, not a Citizen | 221 (52.2%) | 202 (47.7%) |
Health Insurance Coverage by Household Income in Avenue B and C
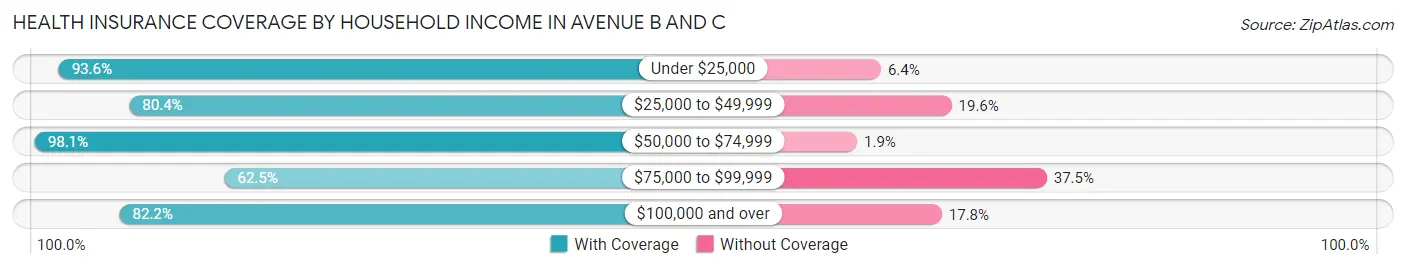
| Household Income | With Coverage | Without Coverage |
| Under $25,000 | 629 (93.6%) | 43 (6.4%) |
| $25,000 to $49,999 | 1,150 (80.4%) | 281 (19.6%) |
| $50,000 to $74,999 | 659 (98.1%) | 13 (1.9%) |
| $75,000 to $99,999 | 307 (62.5%) | 184 (37.5%) |
| $100,000 and over | 480 (82.2%) | 104 (17.8%) |
Public vs Private Health Insurance Coverage by Age in Avenue B and C
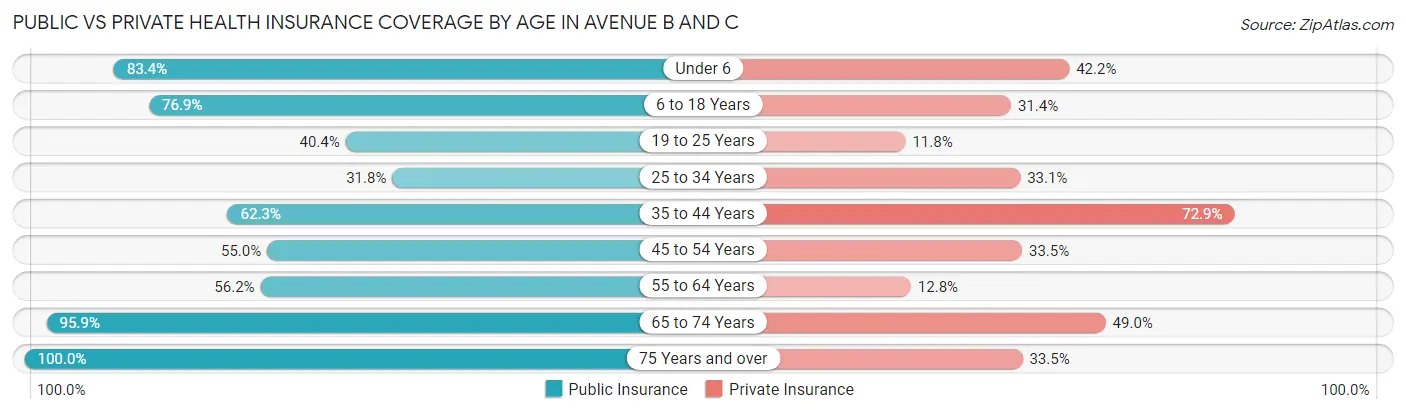
| Age Bracket | Public Insurance | Private Insurance |
| Under 6 | 413 (83.4%) | 209 (42.2%) |
| 6 to 18 Years | 536 (76.9%) | 219 (31.4%) |
| 19 to 25 Years | 171 (40.4%) | 50 (11.8%) |
| 25 to 34 Years | 188 (31.8%) | 196 (33.1%) |
| 35 to 44 Years | 248 (62.3%) | 290 (72.9%) |
| 45 to 54 Years | 143 (55.0%) | 87 (33.5%) |
| 55 to 64 Years | 149 (56.2%) | 34 (12.8%) |
| 65 to 74 Years | 376 (95.9%) | 192 (49.0%) |
| 75 Years and over | 328 (100.0%) | 110 (33.5%) |
| Total | 2,552 (66.3%) | 1,387 (36.0%) |
Disability Status by Sex by Age in Avenue B and C
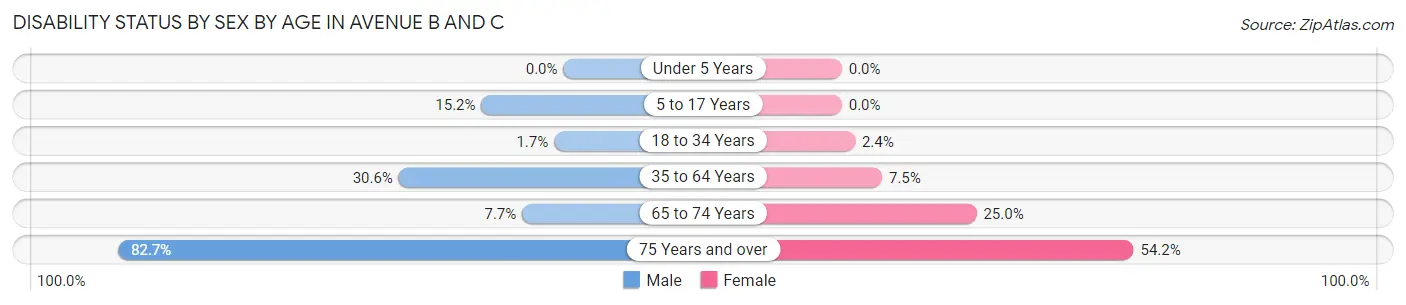
| Age Bracket | Male | Female |
| Under 5 Years | 0 (0.0%) | 0 (0.0%) |
| 5 to 17 Years | 58 (15.2%) | 0 (0.0%) |
| 18 to 34 Years | 10 (1.7%) | 12 (2.4%) |
| 35 to 64 Years | 147 (30.6%) | 33 (7.5%) |
| 65 to 74 Years | 19 (7.7%) | 36 (25.0%) |
| 75 Years and over | 62 (82.7%) | 137 (54.1%) |
Disability Class by Sex by Age in Avenue B and C
Disability Class: Hearing Difficulty
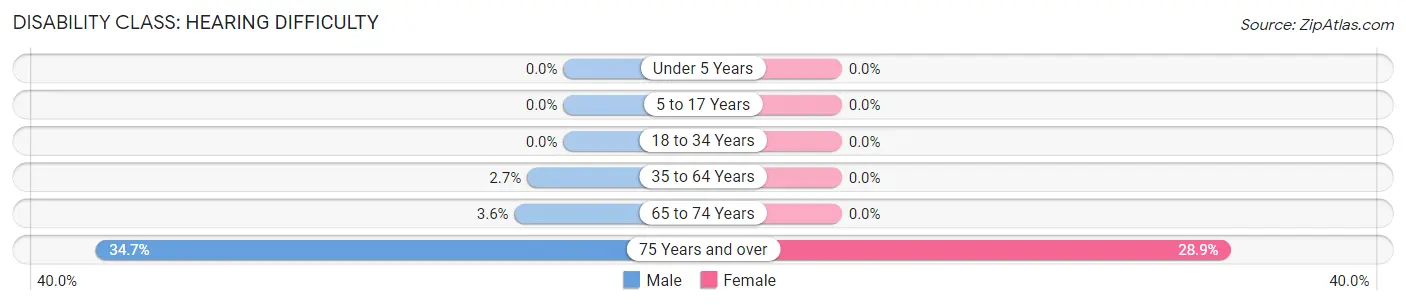
| Age Bracket | Male | Female |
| Under 5 Years | 0 (0.0%) | 0 (0.0%) |
| 5 to 17 Years | 0 (0.0%) | 0 (0.0%) |
| 18 to 34 Years | 0 (0.0%) | 0 (0.0%) |
| 35 to 64 Years | 13 (2.7%) | 0 (0.0%) |
| 65 to 74 Years | 9 (3.6%) | 0 (0.0%) |
| 75 Years and over | 26 (34.7%) | 73 (28.8%) |
Disability Class: Vision Difficulty
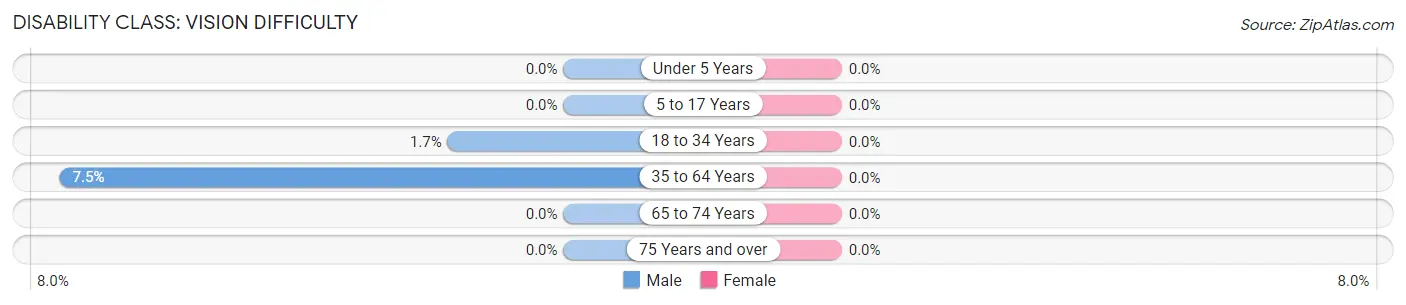
| Age Bracket | Male | Female |
| Under 5 Years | 0 (0.0%) | 0 (0.0%) |
| 5 to 17 Years | 0 (0.0%) | 0 (0.0%) |
| 18 to 34 Years | 10 (1.7%) | 0 (0.0%) |
| 35 to 64 Years | 36 (7.5%) | 0 (0.0%) |
| 65 to 74 Years | 0 (0.0%) | 0 (0.0%) |
| 75 Years and over | 0 (0.0%) | 0 (0.0%) |
Disability Class: Cognitive Difficulty
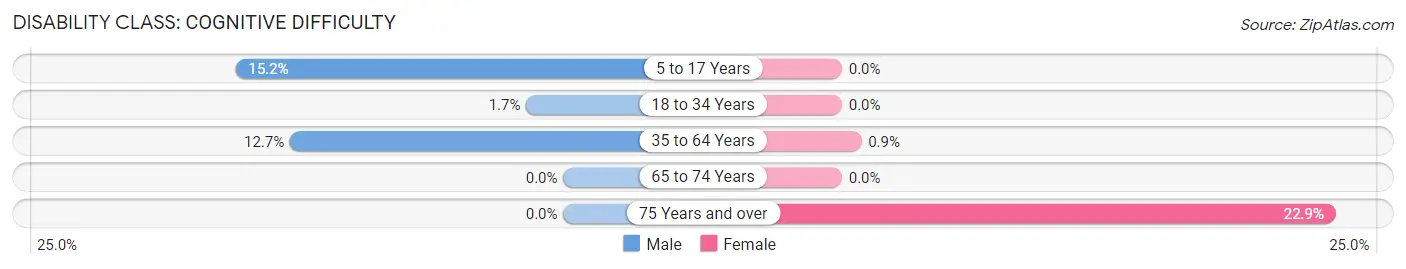
| Age Bracket | Male | Female |
| 5 to 17 Years | 58 (15.2%) | 0 (0.0%) |
| 18 to 34 Years | 10 (1.7%) | 0 (0.0%) |
| 35 to 64 Years | 61 (12.7%) | 4 (0.9%) |
| 65 to 74 Years | 0 (0.0%) | 0 (0.0%) |
| 75 Years and over | 0 (0.0%) | 58 (22.9%) |
Disability Class: Ambulatory Difficulty
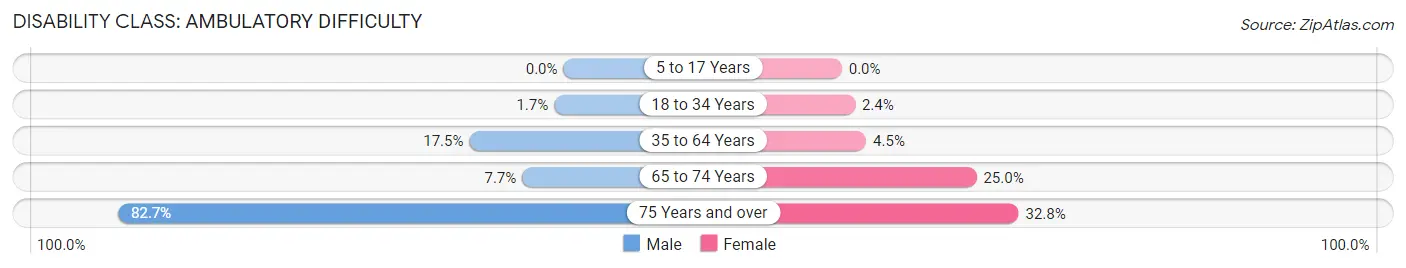
| Age Bracket | Male | Female |
| 5 to 17 Years | 0 (0.0%) | 0 (0.0%) |
| 18 to 34 Years | 10 (1.7%) | 12 (2.4%) |
| 35 to 64 Years | 84 (17.5%) | 20 (4.5%) |
| 65 to 74 Years | 19 (7.7%) | 36 (25.0%) |
| 75 Years and over | 62 (82.7%) | 83 (32.8%) |
Disability Class: Self-Care Difficulty
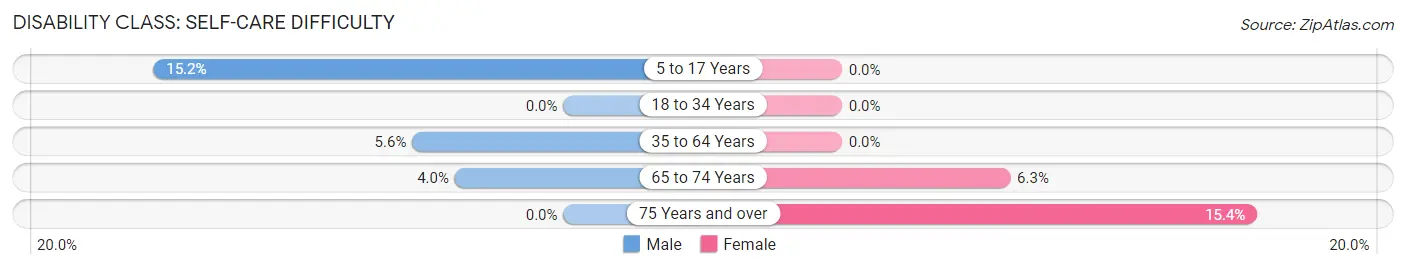
| Age Bracket | Male | Female |
| 5 to 17 Years | 58 (15.2%) | 0 (0.0%) |
| 18 to 34 Years | 0 (0.0%) | 0 (0.0%) |
| 35 to 64 Years | 27 (5.6%) | 0 (0.0%) |
| 65 to 74 Years | 10 (4.0%) | 9 (6.2%) |
| 75 Years and over | 0 (0.0%) | 39 (15.4%) |
Technology Access in Avenue B and C
Computing Device Access in Avenue B and C
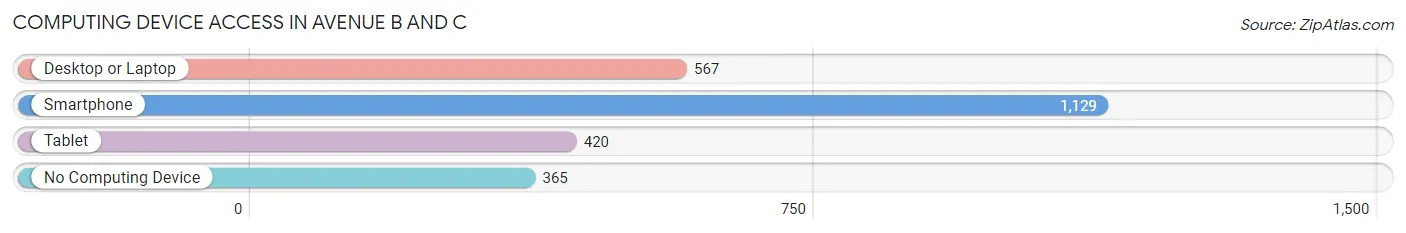
| Device Type | # Households | % Households |
| Desktop or Laptop | 567 | 37.3% |
| Smartphone | 1,129 | 74.3% |
| Tablet | 420 | 27.6% |
| No Computing Device | 365 | 24.0% |
| Total | 1,520 | 100.0% |
Internet Access in Avenue B and C
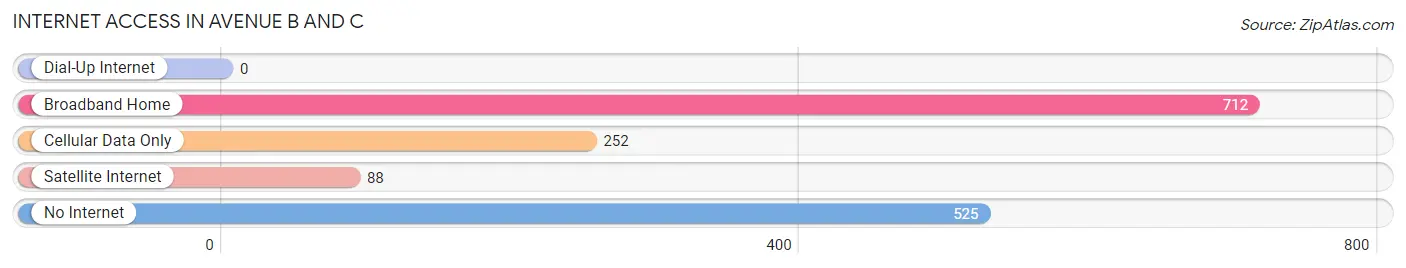
| Internet Type | # Households | % Households |
| Dial-Up Internet | 0 | 0.0% |
| Broadband Home | 712 | 46.8% |
| Cellular Data Only | 252 | 16.6% |
| Satellite Internet | 88 | 5.8% |
| No Internet | 525 | 34.5% |
| Total | 1,520 | 100.0% |
Avenue B and C Summary
Avenue B and C is a small neighborhood located in the city of Phoenix, Arizona. It is located in the heart of the city, just south of downtown and is bordered by the Grand Canal to the east, Seventh Street to the south, Seventh Avenue to the west, and Seventh Street to the north. The neighborhood is home to a diverse population of people from all walks of life, including families, students, and professionals.
History
Avenue B and C was originally part of the Phoenix Indian School, which was established in 1891. The school was established to educate Native American children and was located on the site of the present-day neighborhood. The school was closed in 1990 and the land was sold to developers. The area was then developed into a residential neighborhood, with the first homes being built in the early 1990s.
Geography
Avenue B and C is located in the heart of Phoenix, just south of downtown. It is bordered by the Grand Canal to the east, Seventh Street to the south, Seventh Avenue to the west, and Seventh Street to the north. The neighborhood is located in the Central City Planning Area, which is part of the larger Phoenix metropolitan area. The area is characterized by flat terrain and is located at an elevation of 1,087 feet.
Economy
Avenue B and C is a primarily residential neighborhood, with most of the residents employed in the service industry. The neighborhood is home to a variety of businesses, including restaurants, retail stores, and professional services. The area is also home to a number of small businesses, such as auto repair shops, beauty salons, and dry cleaners.
Demographics
As of the 2010 census, the population of Avenue B and C was 4,845. The population is primarily Hispanic, with a large percentage of the population being of Mexican descent. The median household income in the neighborhood is $35,945, which is slightly lower than the median household income for the city of Phoenix. The median age of the population is 33.7 years, which is slightly lower than the median age for the city of Phoenix.
Conclusion
Avenue B and C is a small, diverse neighborhood located in the heart of Phoenix, Arizona. It is bordered by the Grand Canal to the east, Seventh Street to the south, Seventh Avenue to the west, and Seventh Street to the north. The area is primarily residential, with most of the residents employed in the service industry. The population is primarily Hispanic, with a median household income of $35,945 and a median age of 33.7 years. The neighborhood is home to a variety of businesses, including restaurants, retail stores, and professional services.
Common Questions
What is Per Capita Income in Avenue B and C?
Per Capita income in Avenue B and C is $21,045.
What is the Median Family Income in Avenue B and C?
Median Family Income in Avenue B and C is $39,126.
What is the Median Household income in Avenue B and C?
Median Household Income in Avenue B and C is $37,346.
What is Income or Wage Gap in Avenue B and C?
Income or Wage Gap in Avenue B and C is 43.7%.
Women in Avenue B and C earn 56.3 cents for every dollar earned by a man.
What is Family Income Deficit in Avenue B and C?
Family Income Deficit in Avenue B and C is $4,509.
Families that are below poverty line in Avenue B and C earn $4,509 less on average than the poverty threshold level.
What is Inequality or Gini Index in Avenue B and C?
Inequality or Gini Index in Avenue B and C is 0.47.
What is the Total Population of Avenue B and C?
Total Population of Avenue B and C is 3,850.
What is the Total Male Population of Avenue B and C?
Total Male Population of Avenue B and C is 1,908.
What is the Total Female Population of Avenue B and C?
Total Female Population of Avenue B and C is 1,942.
What is the Ratio of Males per 100 Females in Avenue B and C?
There are 98.25 Males per 100 Females in Avenue B and C.
What is the Ratio of Females per 100 Males in Avenue B and C?
There are 101.78 Females per 100 Males in Avenue B and C.
What is the Median Population Age in Avenue B and C?
Median Population Age in Avenue B and C is 30.5 Years.
What is the Average Family Size in Avenue B and C
Average Family Size in Avenue B and C is 3.0 People.
What is the Average Household Size in Avenue B and C
Average Household Size in Avenue B and C is 2.5 People.
How Large is the Labor Force in Avenue B and C?
There are 1,490 People in the Labor Forcein in Avenue B and C.
What is the Percentage of People in the Labor Force in Avenue B and C?
54.7% of People are in the Labor Force in Avenue B and C.
What is the Unemployment Rate in Avenue B and C?
Unemployment Rate in Avenue B and C is 21.5%.