Pirtleville, AZ Map & Demographics
Pirtleville Map
Pirtleville Overview
$17,801
PER CAPITA INCOME
$63,798
AVG FAMILY INCOME
$48,594
AVG HOUSEHOLD INCOME
0.42
INEQUALITY / GINI INDEX
1,483
TOTAL POPULATION
814
MALE POPULATION
669
FEMALE POPULATION
121.67
MALES / 100 FEMALES
82.19
FEMALES / 100 MALES
32.4
MEDIAN AGE
4.3
AVG FAMILY SIZE
3.7
AVG HOUSEHOLD SIZE
606
LABOR FORCE [ PEOPLE ]
52.7%
PERCENT IN LABOR FORCE
21.1%
UNEMPLOYMENT RATE
Pirtleville Zip Codes
Pirtleville Area Codes
Income in Pirtleville
Income Overview in Pirtleville
Per Capita Income in Pirtleville is $17,801, while median incomes of families and households are $63,798 and $48,594 respectively.
| Characteristic | Number | Measure |
| Per Capita Income | 1,483 | $17,801 |
| Median Family Income | 309 | $63,798 |
| Mean Family Income | 309 | $64,745 |
| Median Household Income | 397 | $48,594 |
| Mean Household Income | 397 | $59,846 |
| Income Deficit | 309 | $0 |
| Wage / Income Gap (%) | 1,483 | 0.00% |
| Wage / Income Gap ($) | 1,483 | 100.00¢ per $1 |
| Gini / Inequality Index | 1,483 | 0.42 |
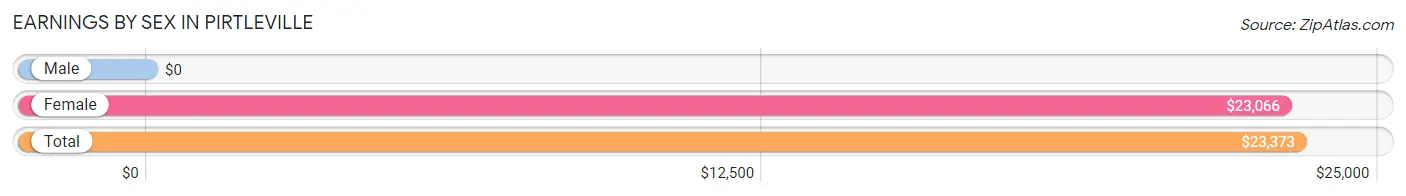
Earnings by Sex in Pirtleville
| Sex | Number | Average Earnings |
| Male | 223 (37.9%) | $0 |
| Female | 366 (62.1%) | $23,066 |
| Total | 589 (100.0%) | $23,373 |
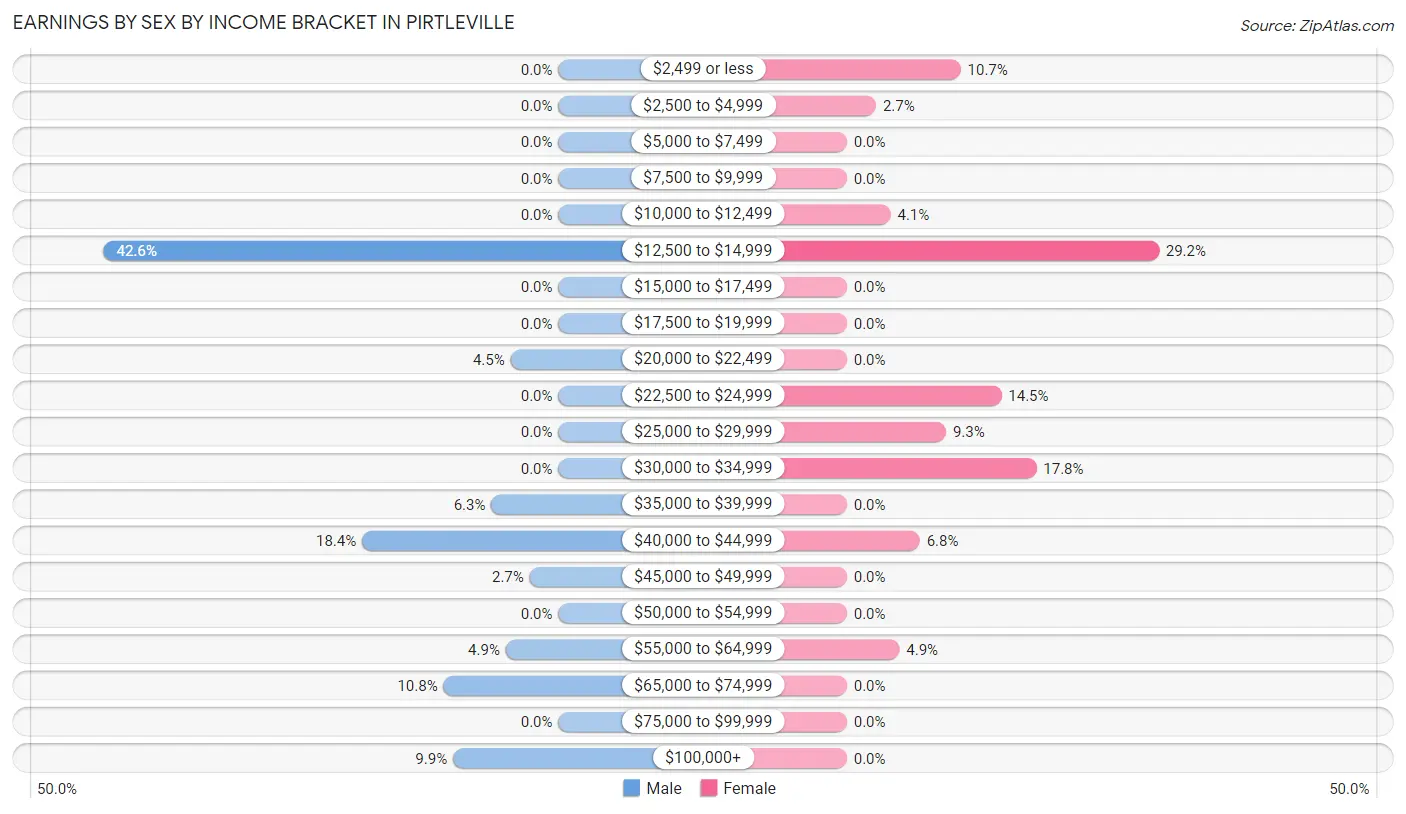
Earnings by Sex by Income Bracket in Pirtleville
The most common earnings brackets in Pirtleville are $12,500 to $14,999 for men (95 | 42.6%) and $12,500 to $14,999 for women (107 | 29.2%).
| Income | Male | Female |
| $2,499 or less | 0 (0.0%) | 39 (10.7%) |
| $2,500 to $4,999 | 0 (0.0%) | 10 (2.7%) |
| $5,000 to $7,499 | 0 (0.0%) | 0 (0.0%) |
| $7,500 to $9,999 | 0 (0.0%) | 0 (0.0%) |
| $10,000 to $12,499 | 0 (0.0%) | 15 (4.1%) |
| $12,500 to $14,999 | 95 (42.6%) | 107 (29.2%) |
| $15,000 to $17,499 | 0 (0.0%) | 0 (0.0%) |
| $17,500 to $19,999 | 0 (0.0%) | 0 (0.0%) |
| $20,000 to $22,499 | 10 (4.5%) | 0 (0.0%) |
| $22,500 to $24,999 | 0 (0.0%) | 53 (14.5%) |
| $25,000 to $29,999 | 0 (0.0%) | 34 (9.3%) |
| $30,000 to $34,999 | 0 (0.0%) | 65 (17.8%) |
| $35,000 to $39,999 | 14 (6.3%) | 0 (0.0%) |
| $40,000 to $44,999 | 41 (18.4%) | 25 (6.8%) |
| $45,000 to $49,999 | 6 (2.7%) | 0 (0.0%) |
| $50,000 to $54,999 | 0 (0.0%) | 0 (0.0%) |
| $55,000 to $64,999 | 11 (4.9%) | 18 (4.9%) |
| $65,000 to $74,999 | 24 (10.8%) | 0 (0.0%) |
| $75,000 to $99,999 | 0 (0.0%) | 0 (0.0%) |
| $100,000+ | 22 (9.9%) | 0 (0.0%) |
| Total | 223 (100.0%) | 366 (100.0%) |
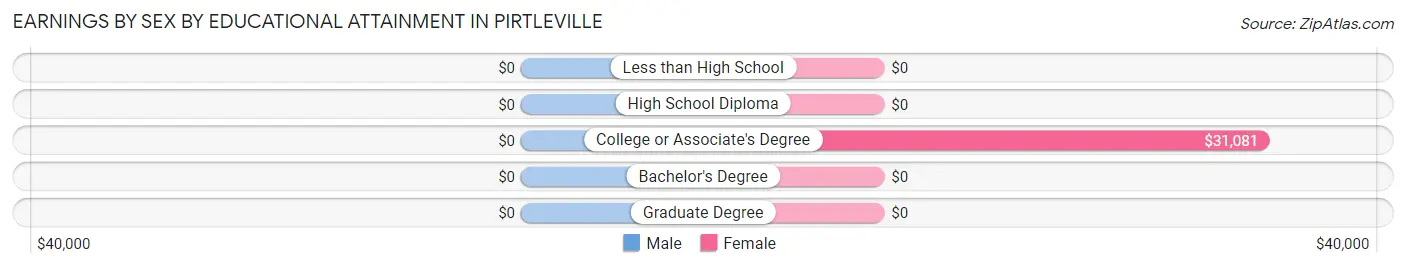
Earnings by Sex by Educational Attainment in Pirtleville
| Educational Attainment | Male Income | Female Income |
| Less than High School | - | - |
| High School Diploma | - | - |
| College or Associate's Degree | - | - |
| Bachelor's Degree | - | - |
| Graduate Degree | - | - |
| Total | $40,758 | $23,325 |
Family Income in Pirtleville
Family Income Brackets in Pirtleville
According to the Pirtleville family income data, there are 69 families falling into the $50,000 to $74,999 income range, which is the most common income bracket and makes up 22.3% of all families.
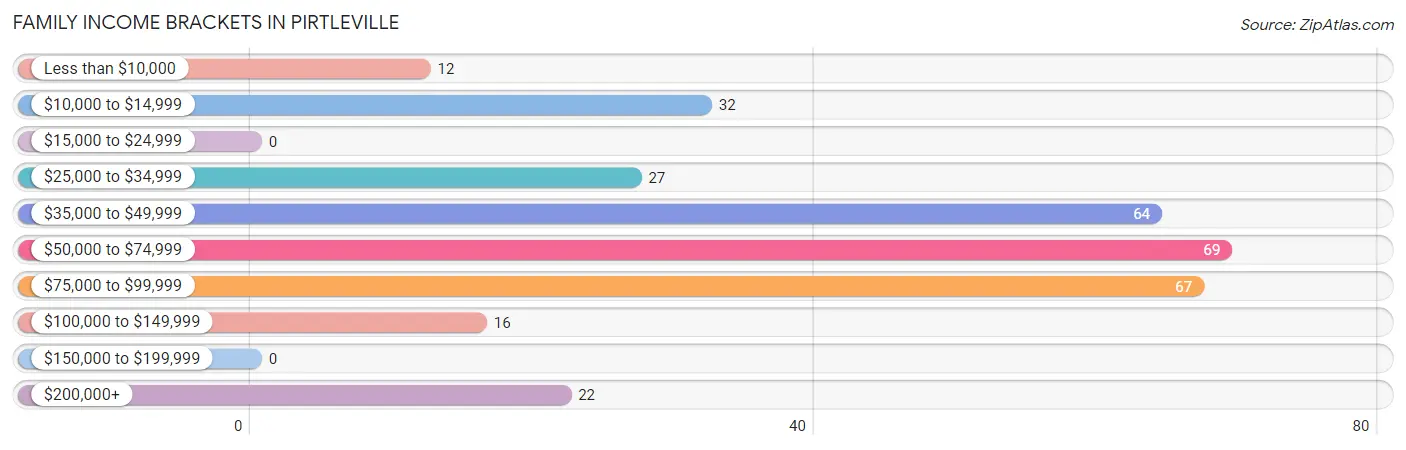
| Income Bracket | # Families | % Families |
| Less than $10,000 | 12 | 3.9% |
| $10,000 to $14,999 | 32 | 10.4% |
| $15,000 to $24,999 | 0 | 0.0% |
| $25,000 to $34,999 | 27 | 8.7% |
| $35,000 to $49,999 | 64 | 20.7% |
| $50,000 to $74,999 | 69 | 22.3% |
| $75,000 to $99,999 | 67 | 21.7% |
| $100,000 to $149,999 | 16 | 5.2% |
| $150,000 to $199,999 | 0 | 0.0% |
| $200,000+ | 22 | 7.1% |
Family Income by Famaliy Size in Pirtleville
2-person families (133 | 43.0%) account for the highest median family income in Pirtleville with $57,292 per family, while 2-person families (133 | 43.0%) have the highest median income of $28,646 per family member.
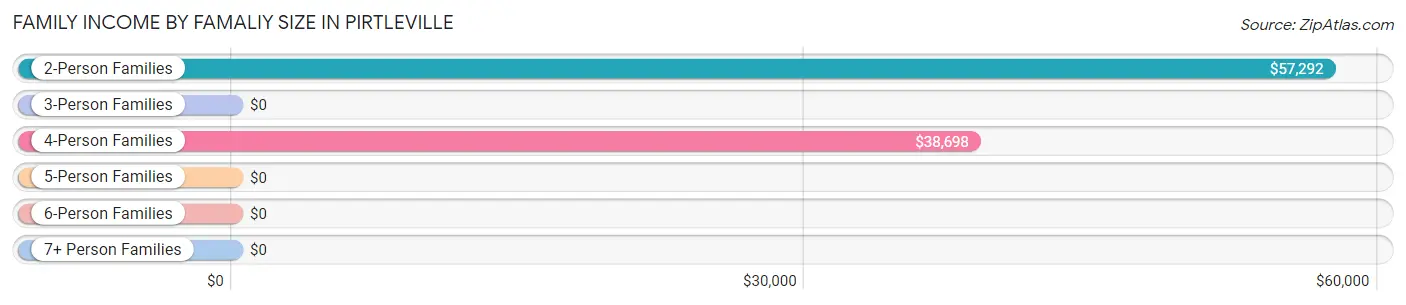
| Income Bracket | # Families | Median Income |
| 2-Person Families | 133 (43.0%) | $57,292 |
| 3-Person Families | 51 (16.5%) | $0 |
| 4-Person Families | 37 (12.0%) | $38,698 |
| 5-Person Families | 45 (14.6%) | $0 |
| 6-Person Families | 0 (0.0%) | $0 |
| 7+ Person Families | 43 (13.9%) | $0 |
| Total | 309 (100.0%) | $63,798 |
Family Income by Number of Earners in Pirtleville
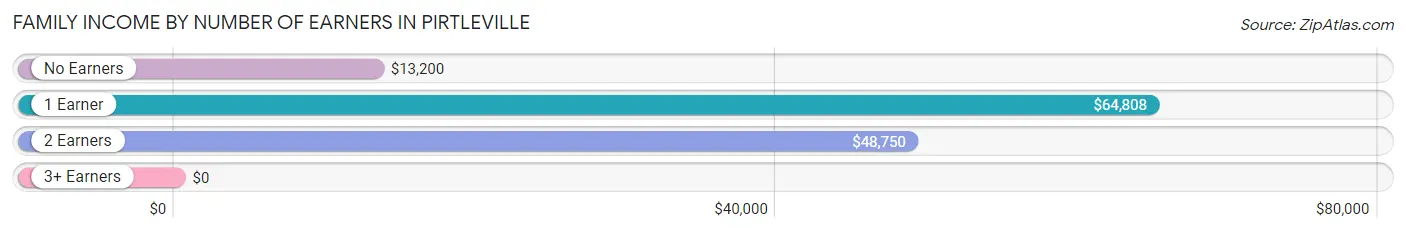
| Number of Earners | # Families | Median Income |
| No Earners | 52 (16.8%) | $13,200 |
| 1 Earner | 92 (29.8%) | $64,808 |
| 2 Earners | 122 (39.5%) | $48,750 |
| 3+ Earners | 43 (13.9%) | $0 |
| Total | 309 (100.0%) | $63,798 |
Household Income in Pirtleville
Household Income Brackets in Pirtleville
With 88 households falling in the category, the $35,000 to $49,999 income range is the most frequent in Pirtleville, accounting for 22.2% of all households.
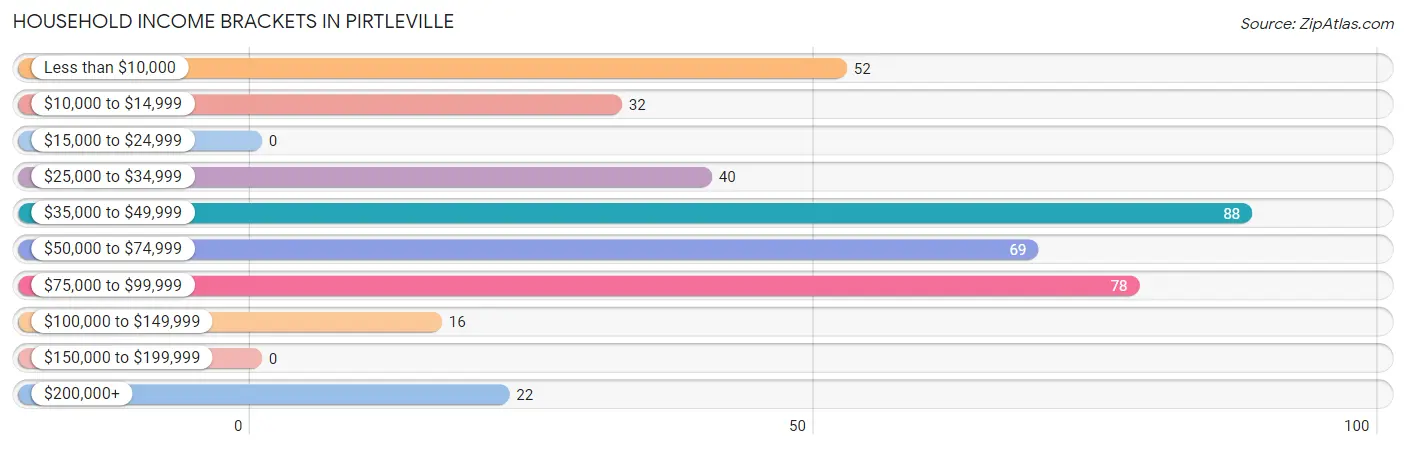
| Income Bracket | # Households | % Households |
| Less than $10,000 | 52 | 13.1% |
| $10,000 to $14,999 | 32 | 8.1% |
| $15,000 to $24,999 | 0 | 0.0% |
| $25,000 to $34,999 | 40 | 10.1% |
| $35,000 to $49,999 | 88 | 22.2% |
| $50,000 to $74,999 | 69 | 17.4% |
| $75,000 to $99,999 | 78 | 19.6% |
| $100,000 to $149,999 | 16 | 4.0% |
| $150,000 to $199,999 | 0 | 0.0% |
| $200,000+ | 22 | 5.5% |
Household Income by Householder Age in Pirtleville
The median household income in Pirtleville is $48,594, with the highest median household income of $83,227 found in the 45 to 64 years age bracket for the primary householder. A total of 117 households (29.5%) fall into this category. Meanwhile, the 15 to 24 years age bracket for the primary householder has the lowest median household income of $0, with 16 households (4.0%) in this group.
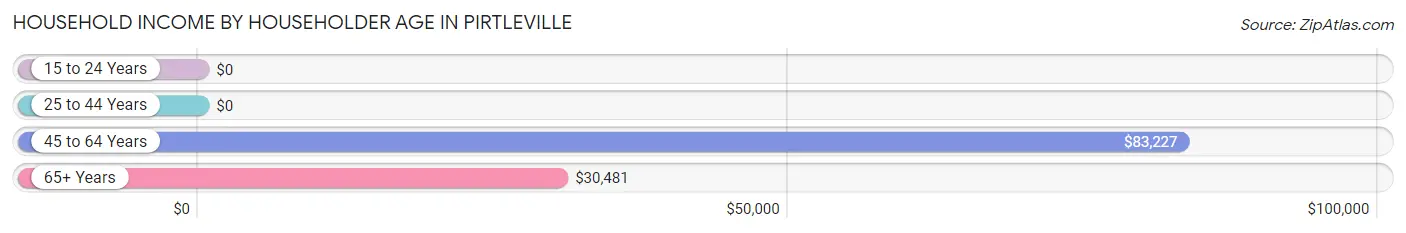
| Income Bracket | # Households | Median Income |
| 15 to 24 Years | 16 (4.0%) | $0 |
| 25 to 44 Years | 49 (12.3%) | $0 |
| 45 to 64 Years | 117 (29.5%) | $83,227 |
| 65+ Years | 215 (54.2%) | $30,481 |
| Total | 397 (100.0%) | $48,594 |
Poverty in Pirtleville
Income Below Poverty by Sex and Age in Pirtleville
With 15.2% poverty level for males and 34.8% for females among the residents of Pirtleville, 16 and 17 year old males and 65 to 74 year old females are the most vulnerable to poverty, with 9 males (100.0%) and 44 females (95.7%) in their respective age groups living below the poverty level.
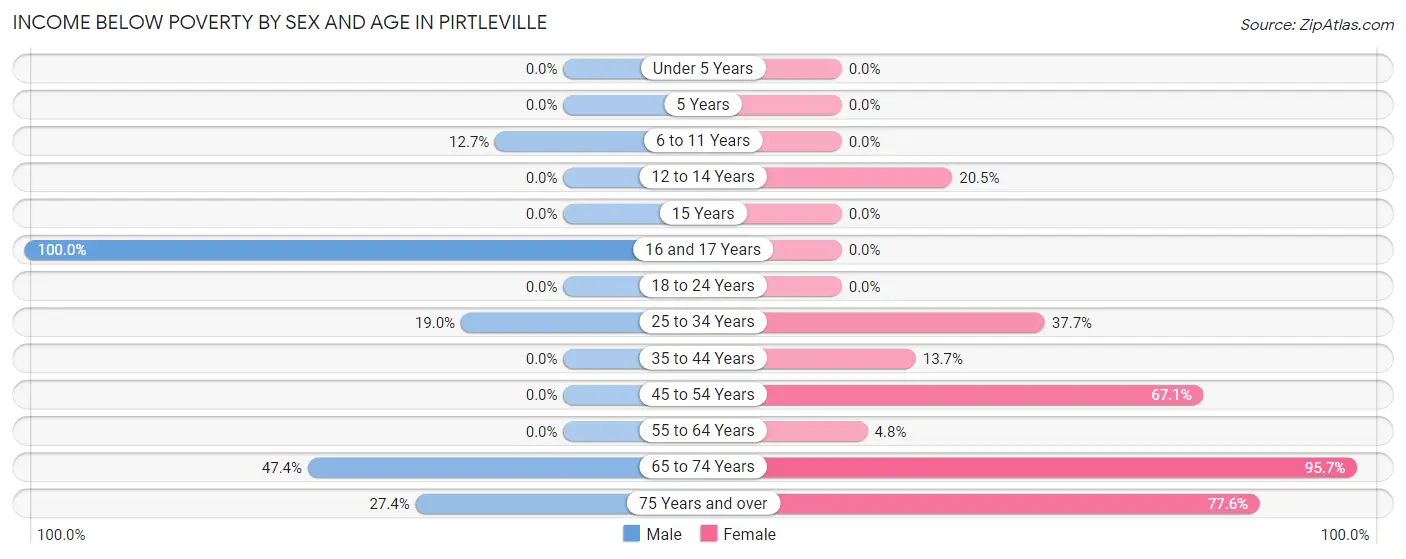
| Age Bracket | Male | Female |
| Under 5 Years | 0 (0.0%) | 0 (0.0%) |
| 5 Years | 0 (0.0%) | 0 (0.0%) |
| 6 to 11 Years | 29 (12.7%) | 0 (0.0%) |
| 12 to 14 Years | 0 (0.0%) | 8 (20.5%) |
| 15 Years | 0 (0.0%) | 0 (0.0%) |
| 16 and 17 Years | 9 (100.0%) | 0 (0.0%) |
| 18 to 24 Years | 0 (0.0%) | 0 (0.0%) |
| 25 to 34 Years | 23 (19.0%) | 69 (37.7%) |
| 35 to 44 Years | 0 (0.0%) | 7 (13.7%) |
| 45 to 54 Years | 0 (0.0%) | 47 (67.1%) |
| 55 to 64 Years | 0 (0.0%) | 6 (4.8%) |
| 65 to 74 Years | 46 (47.4%) | 44 (95.7%) |
| 75 Years and over | 17 (27.4%) | 52 (77.6%) |
| Total | 124 (15.2%) | 233 (34.8%) |
Income Above Poverty by Sex and Age in Pirtleville
According to the poverty statistics in Pirtleville, males aged under 5 years and females aged under 5 years are the age groups that are most secure financially, with 100.0% of males and 100.0% of females in these age groups living above the poverty line.
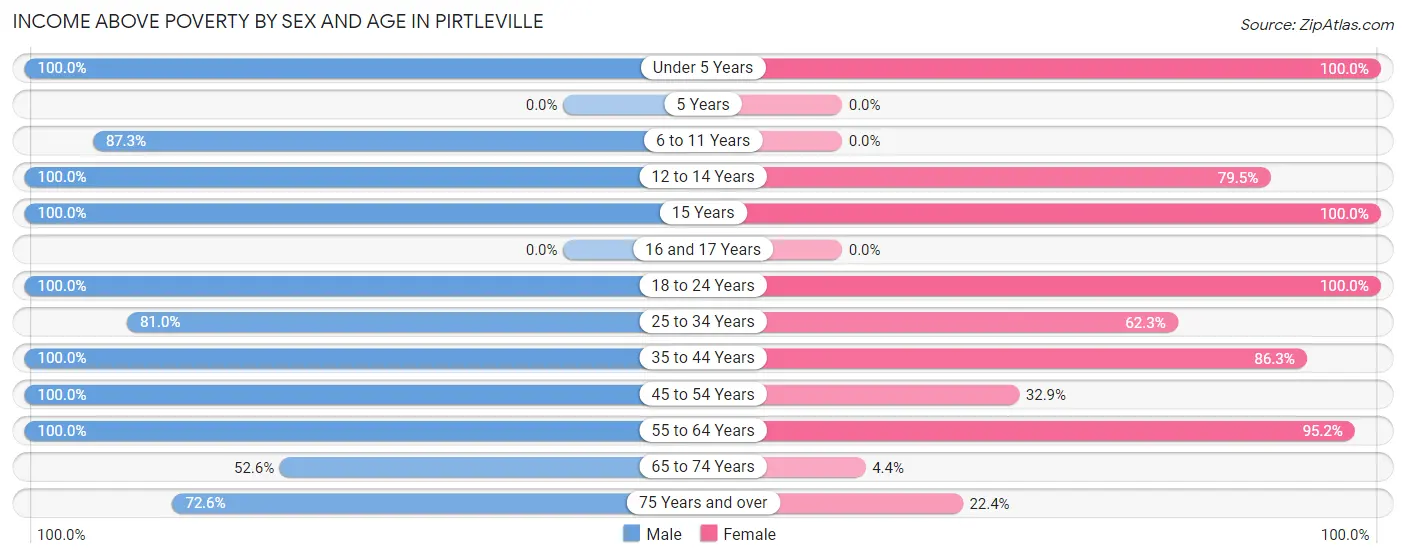
| Age Bracket | Male | Female |
| Under 5 Years | 9 (100.0%) | 18 (100.0%) |
| 5 Years | 0 (0.0%) | 0 (0.0%) |
| 6 to 11 Years | 200 (87.3%) | 0 (0.0%) |
| 12 to 14 Years | 2 (100.0%) | 31 (79.5%) |
| 15 Years | 17 (100.0%) | 19 (100.0%) |
| 16 and 17 Years | 0 (0.0%) | 0 (0.0%) |
| 18 to 24 Years | 103 (100.0%) | 51 (100.0%) |
| 25 to 34 Years | 98 (81.0%) | 114 (62.3%) |
| 35 to 44 Years | 33 (100.0%) | 44 (86.3%) |
| 45 to 54 Years | 56 (100.0%) | 23 (32.9%) |
| 55 to 64 Years | 76 (100.0%) | 119 (95.2%) |
| 65 to 74 Years | 51 (52.6%) | 2 (4.3%) |
| 75 Years and over | 45 (72.6%) | 15 (22.4%) |
| Total | 690 (84.8%) | 436 (65.2%) |
Income Below Poverty Among Married-Couple Families in Pirtleville
The poverty statistics for married-couple families in Pirtleville show that 9.6% or 19 of the total 197 families live below the poverty line. Families with 1 or 2 children have the highest poverty rate of 15.2%, comprising of 7 families. On the other hand, families with 3 or 4 children have the lowest poverty rate of 0.0%, which includes 0 families.
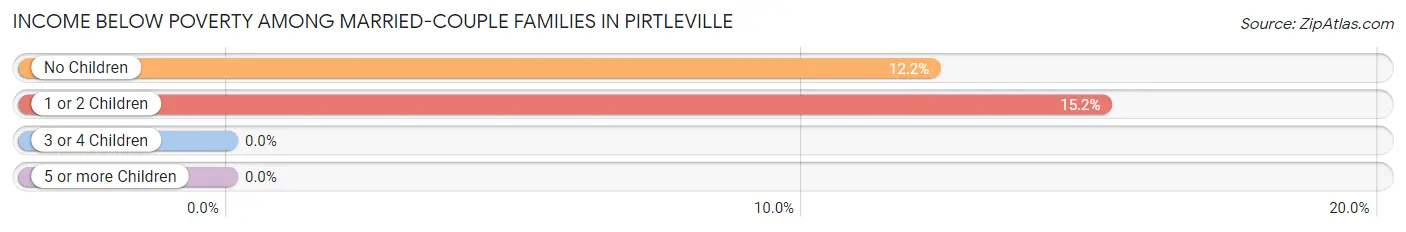
| Children | Above Poverty | Below Poverty |
| No Children | 86 (87.8%) | 12 (12.2%) |
| 1 or 2 Children | 39 (84.8%) | 7 (15.2%) |
| 3 or 4 Children | 53 (100.0%) | 0 (0.0%) |
| 5 or more Children | 0 (0.0%) | 0 (0.0%) |
| Total | 178 (90.4%) | 19 (9.6%) |
Income Below Poverty Among Single-Parent Households in Pirtleville
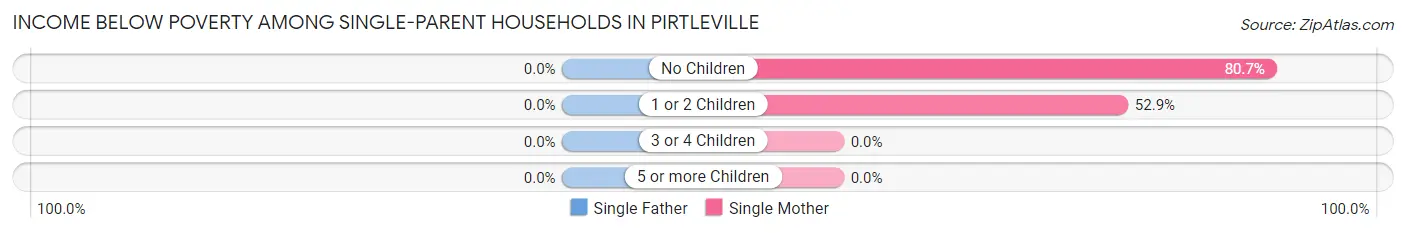
| Children | Single Father | Single Mother |
| No Children | 0 (0.0%) | 25 (80.6%) |
| 1 or 2 Children | 0 (0.0%) | 27 (52.9%) |
| 3 or 4 Children | 0 (0.0%) | 0 (0.0%) |
| 5 or more Children | 0 (0.0%) | 0 (0.0%) |
| Total | 0 (0.0%) | 52 (63.4%) |
Income Below Poverty Among Married-Couple vs Single-Parent Households in Pirtleville
The poverty data for Pirtleville shows that 19 of the married-couple family households (9.6%) and 52 of the single-parent households (46.4%) are living below the poverty level. Within the married-couple family households, those with 1 or 2 children have the highest poverty rate, with 7 households (15.2%) falling below the poverty line. Among the single-parent households, those with 1 or 2 children have the highest poverty rate, with 27 household (52.9%) living below poverty.
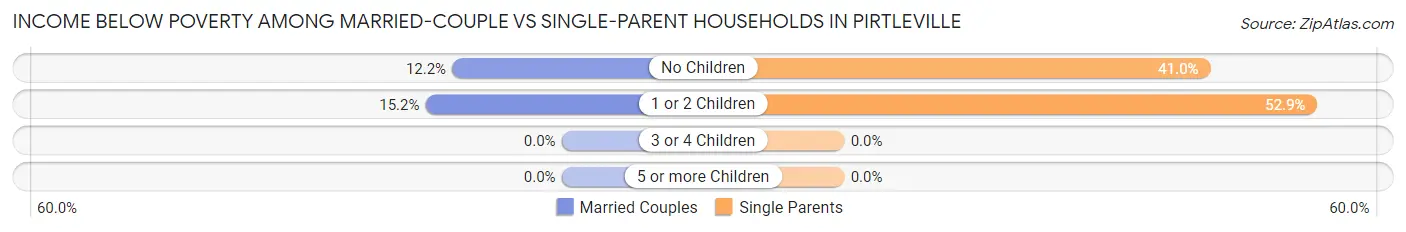
| Children | Married-Couple Families | Single-Parent Households |
| No Children | 12 (12.2%) | 25 (41.0%) |
| 1 or 2 Children | 7 (15.2%) | 27 (52.9%) |
| 3 or 4 Children | 0 (0.0%) | 0 (0.0%) |
| 5 or more Children | 0 (0.0%) | 0 (0.0%) |
| Total | 19 (9.6%) | 52 (46.4%) |
Race in Pirtleville
The most populous races in Pirtleville are Hispanic or Latino (1,483 | 100.0%), White / Caucasian (1,078 | 72.7%), and Two or more Races (374 | 25.2%).
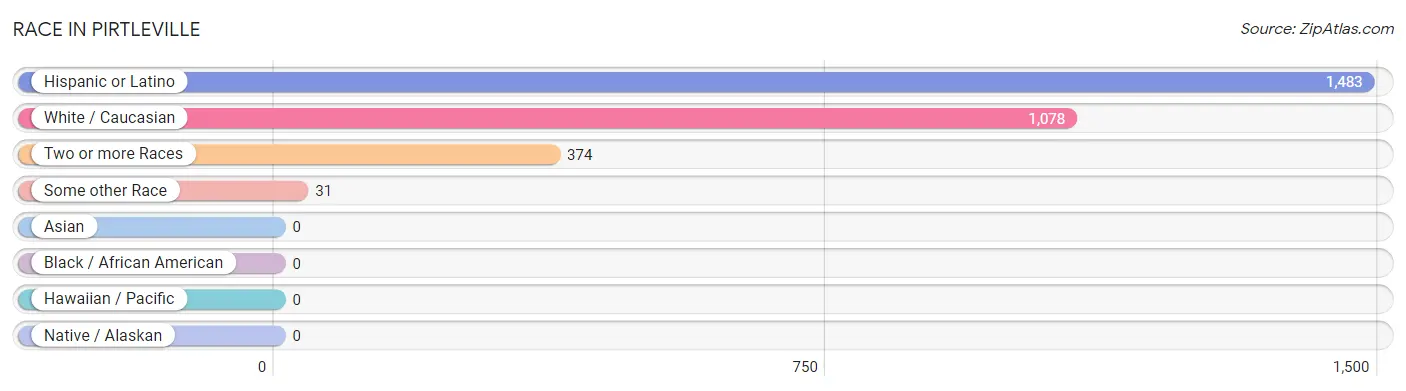
| Race | # Population | % Population |
| Asian | 0 | 0.0% |
| Black / African American | 0 | 0.0% |
| Hawaiian / Pacific | 0 | 0.0% |
| Hispanic or Latino | 1,483 | 100.0% |
| Native / Alaskan | 0 | 0.0% |
| White / Caucasian | 1,078 | 72.7% |
| Two or more Races | 374 | 25.2% |
| Some other Race | 31 | 2.1% |
| Total | 1,483 | 100.0% |
Ancestry in Pirtleville
The most populous ancestries reported in Pirtleville are Mexican (1,483 | 100.0%), and Mexican American Indian (10 | 0.7%), together accounting for 100.7% of all Pirtleville residents.
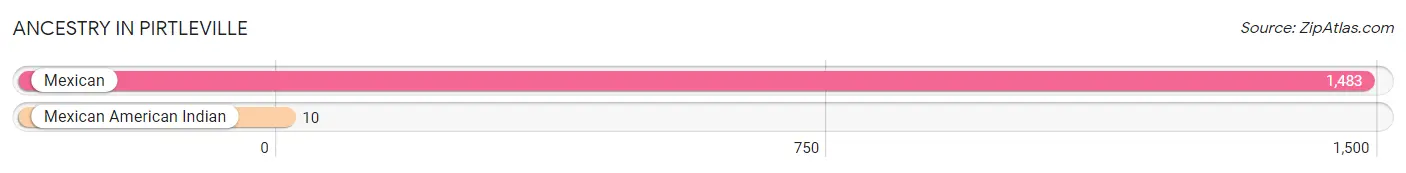
| Ancestry | # Population | % Population |
| Mexican | 1,483 | 100.0% |
| Mexican American Indian | 10 | 0.7% | View All 2 Rows |
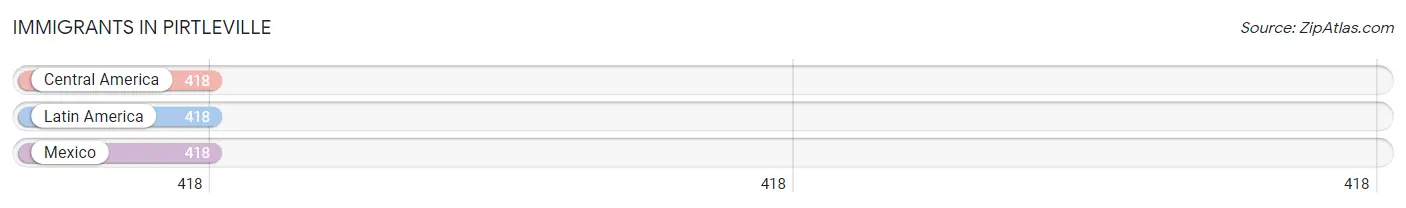
Immigrants in Pirtleville
The most numerous immigrant groups reported in Pirtleville came from Central America (418 | 28.2%), Latin America (418 | 28.2%), and Mexico (418 | 28.2%), together accounting for 84.6% of all Pirtleville residents.
| Immigration Origin | # Population | % Population |
| Central America | 418 | 28.2% |
| Latin America | 418 | 28.2% |
| Mexico | 418 | 28.2% | View All 3 Rows |
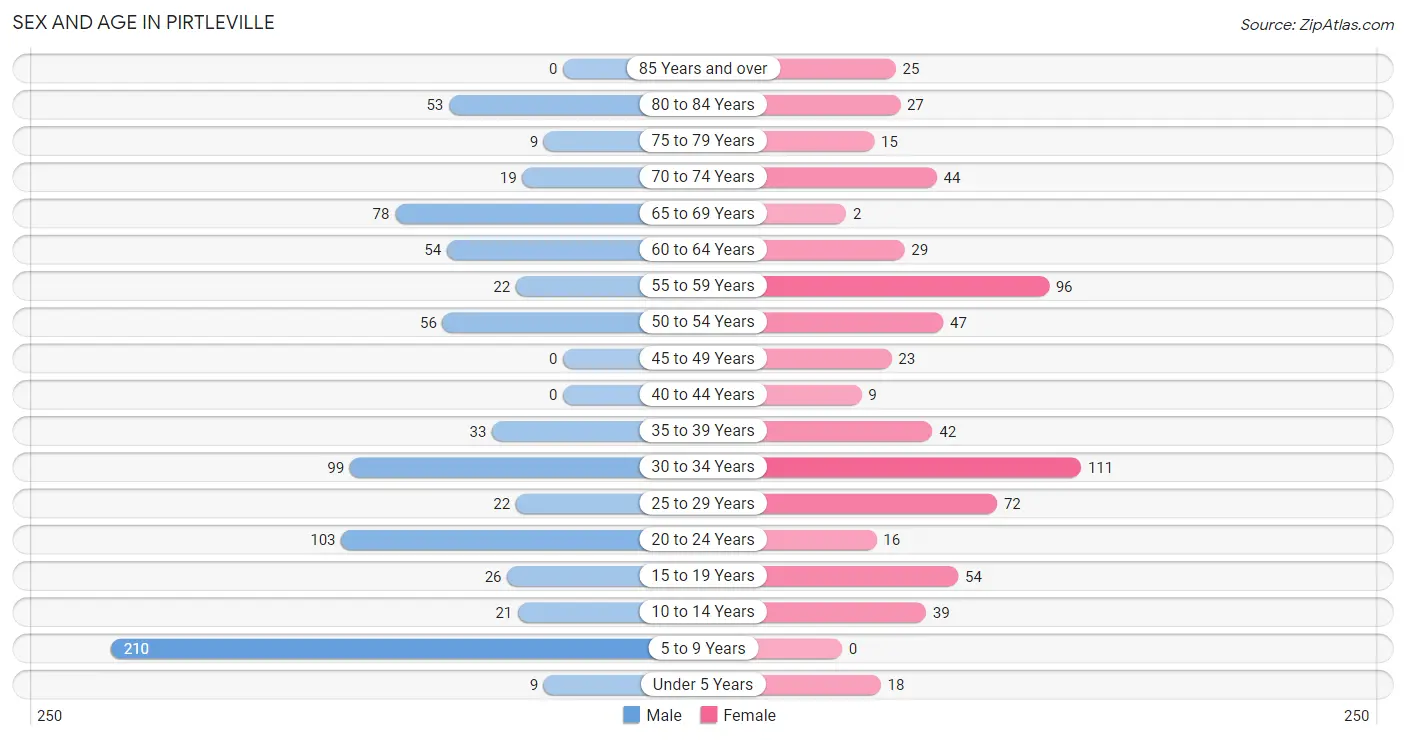
Sex and Age in Pirtleville
Sex and Age in Pirtleville
The most populous age groups in Pirtleville are 5 to 9 Years (210 | 25.8%) for men and 30 to 34 Years (111 | 16.6%) for women.
| Age Bracket | Male | Female |
| Under 5 Years | 9 (1.1%) | 18 (2.7%) |
| 5 to 9 Years | 210 (25.8%) | 0 (0.0%) |
| 10 to 14 Years | 21 (2.6%) | 39 (5.8%) |
| 15 to 19 Years | 26 (3.2%) | 54 (8.1%) |
| 20 to 24 Years | 103 (12.7%) | 16 (2.4%) |
| 25 to 29 Years | 22 (2.7%) | 72 (10.8%) |
| 30 to 34 Years | 99 (12.2%) | 111 (16.6%) |
| 35 to 39 Years | 33 (4.1%) | 42 (6.3%) |
| 40 to 44 Years | 0 (0.0%) | 9 (1.3%) |
| 45 to 49 Years | 0 (0.0%) | 23 (3.4%) |
| 50 to 54 Years | 56 (6.9%) | 47 (7.0%) |
| 55 to 59 Years | 22 (2.7%) | 96 (14.3%) |
| 60 to 64 Years | 54 (6.6%) | 29 (4.3%) |
| 65 to 69 Years | 78 (9.6%) | 2 (0.3%) |
| 70 to 74 Years | 19 (2.3%) | 44 (6.6%) |
| 75 to 79 Years | 9 (1.1%) | 15 (2.2%) |
| 80 to 84 Years | 53 (6.5%) | 27 (4.0%) |
| 85 Years and over | 0 (0.0%) | 25 (3.7%) |
| Total | 814 (100.0%) | 669 (100.0%) |
Families and Households in Pirtleville
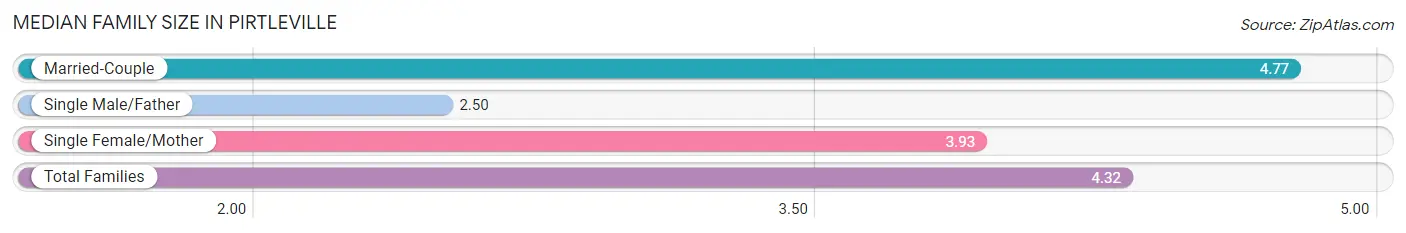
Median Family Size in Pirtleville
The median family size in Pirtleville is 4.32 persons per family, with married-couple families (197 | 63.7%) accounting for the largest median family size of 4.77 persons per family. On the other hand, single male/father families (30 | 9.7%) represent the smallest median family size with 2.50 persons per family.
| Family Type | # Families | Family Size |
| Married-Couple | 197 (63.7%) | 4.77 |
| Single Male/Father | 30 (9.7%) | 2.50 |
| Single Female/Mother | 82 (26.5%) | 3.93 |
| Total Families | 309 (100.0%) | 4.32 |
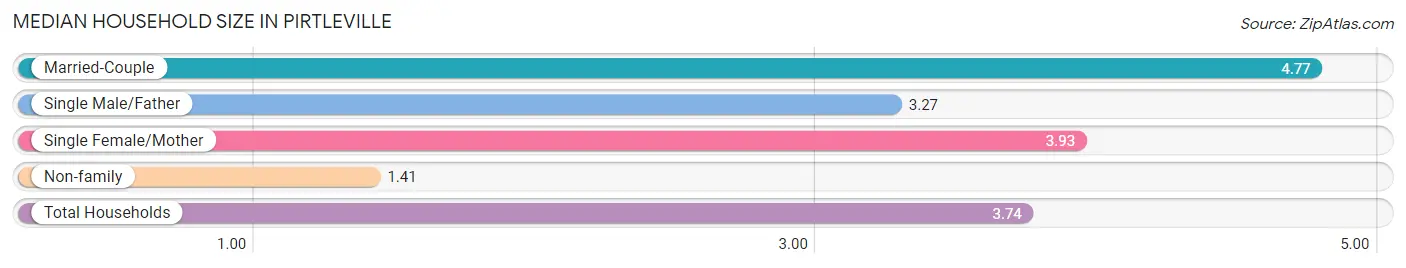
Median Household Size in Pirtleville
The median household size in Pirtleville is 3.74 persons per household, with married-couple households (197 | 49.6%) accounting for the largest median household size of 4.77 persons per household. non-family households (88 | 22.2%) represent the smallest median household size with 1.41 persons per household.
| Household Type | # Households | Household Size |
| Married-Couple | 197 (49.6%) | 4.77 |
| Single Male/Father | 30 (7.6%) | 3.27 |
| Single Female/Mother | 82 (20.6%) | 3.93 |
| Non-family | 88 (22.2%) | 1.41 |
| Total Households | 397 (100.0%) | 3.74 |
Household Size by Marriage Status in Pirtleville
Out of a total of 397 households in Pirtleville, 309 (77.8%) are family households, while 88 (22.2%) are nonfamily households. The most numerous type of family households are 2-person households, comprising 111, and the most common type of nonfamily households are 1-person households, comprising 75.
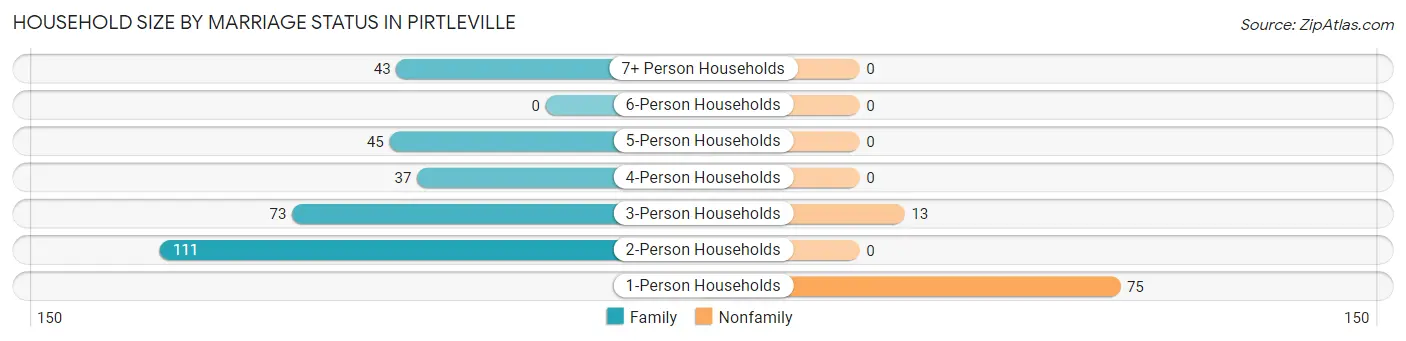
| Household Size | Family Households | Nonfamily Households |
| 1-Person Households | - | 75 (18.9%) |
| 2-Person Households | 111 (28.0%) | 0 (0.0%) |
| 3-Person Households | 73 (18.4%) | 13 (3.3%) |
| 4-Person Households | 37 (9.3%) | 0 (0.0%) |
| 5-Person Households | 45 (11.3%) | 0 (0.0%) |
| 6-Person Households | 0 (0.0%) | 0 (0.0%) |
| 7+ Person Households | 43 (10.8%) | 0 (0.0%) |
| Total | 309 (77.8%) | 88 (22.2%) |
Female Fertility in Pirtleville
Fertility by Age in Pirtleville
Average fertility rate in Pirtleville is 18.0 births per 1,000 women. Women in the age bracket of 20 to 34 years have the highest fertility rate with 30.0 births per 1,000 women. Women in the age bracket of 20 to 34 years acount for 100.0% of all women with births.
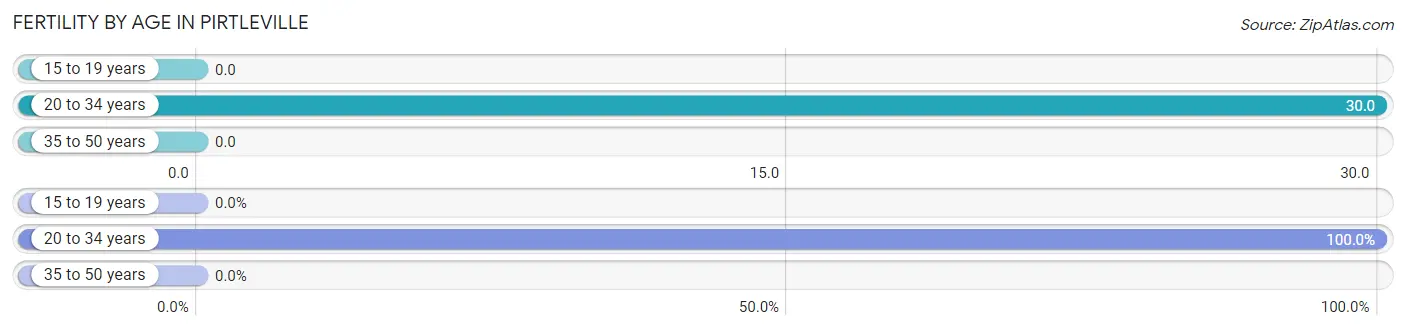
| Age Bracket | Women with Births | Births / 1,000 Women |
| 15 to 19 years | 0 (0.0%) | 0.0 |
| 20 to 34 years | 6 (100.0%) | 30.0 |
| 35 to 50 years | 0 (0.0%) | 0.0 |
| Total | 6 (100.0%) | 18.0 |
Fertility by Age by Marriage Status in Pirtleville
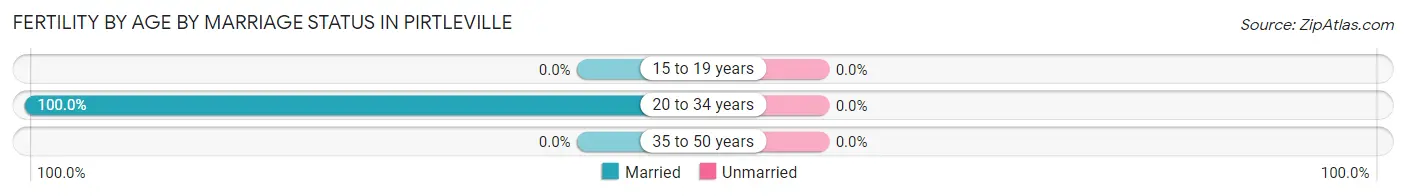
| Age Bracket | Married | Unmarried |
| 15 to 19 years | 0 (0.0%) | 0 (0.0%) |
| 20 to 34 years | 6 (100.0%) | 0 (0.0%) |
| 35 to 50 years | 0 (0.0%) | 0 (0.0%) |
| Total | 6 (100.0%) | 0 (0.0%) |
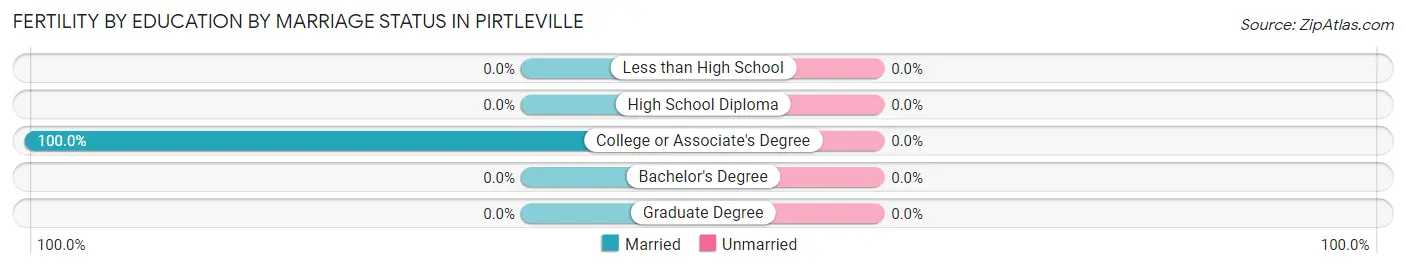
Fertility by Education in Pirtleville
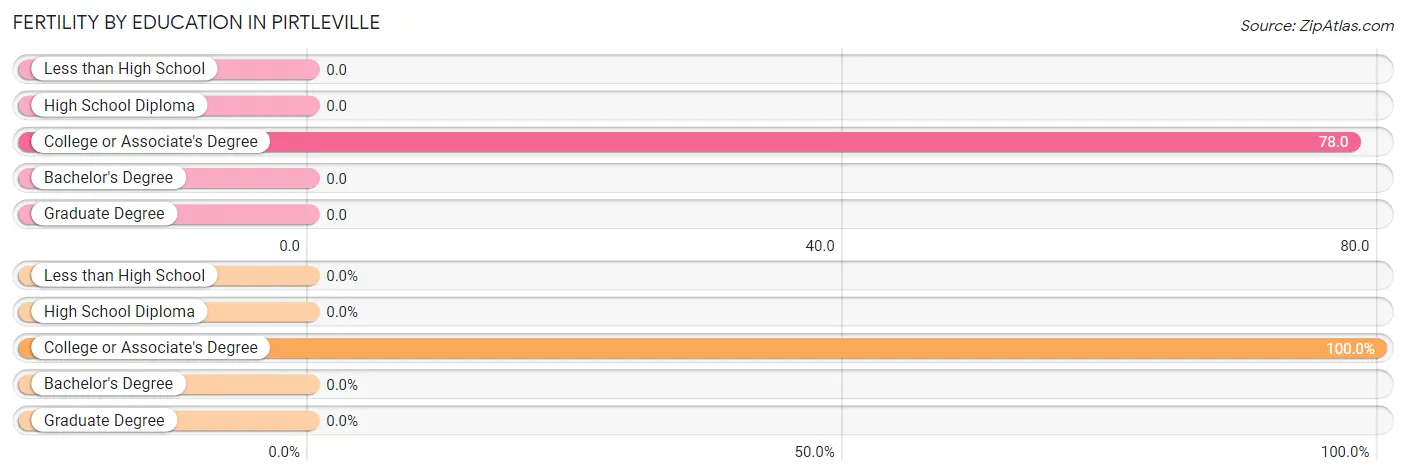
| Educational Attainment | Women with Births | Births / 1,000 Women |
| Less than High School | 0 (0.0%) | 0.0 |
| High School Diploma | 0 (0.0%) | 0.0 |
| College or Associate's Degree | 6 (100.0%) | 78.0 |
| Bachelor's Degree | 0 (0.0%) | 0.0 |
| Graduate Degree | 0 (0.0%) | 0.0 |
| Total | 6 (100.0%) | 18.0 |
Fertility by Education by Marriage Status in Pirtleville
| Educational Attainment | Married | Unmarried |
| Less than High School | 0 (0.0%) | 0 (0.0%) |
| High School Diploma | 0 (0.0%) | 0 (0.0%) |
| College or Associate's Degree | 6 (100.0%) | 0 (0.0%) |
| Bachelor's Degree | 0 (0.0%) | 0 (0.0%) |
| Graduate Degree | 0 (0.0%) | 0 (0.0%) |
| Total | 6 (100.0%) | 0 (0.0%) |
Employment Characteristics in Pirtleville
Employment by Class of Employer in Pirtleville
Among the 478 employed individuals in Pirtleville, private company employees (258 | 54.0%), not-for-profit organizations (87 | 18.2%), and state government employees (77 | 16.1%) make up the most common classes of employment.
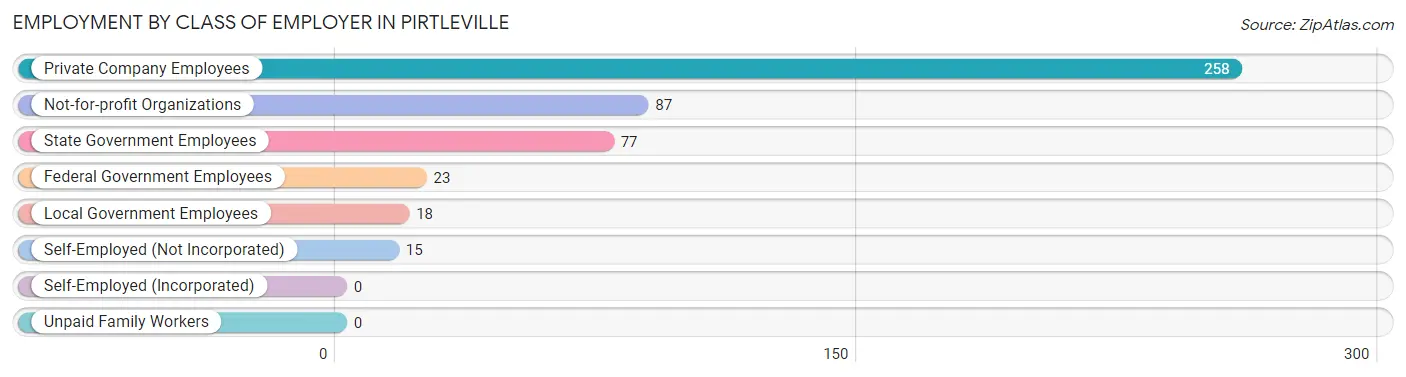
| Employer Class | # Employees | % Employees |
| Private Company Employees | 258 | 54.0% |
| Self-Employed (Incorporated) | 0 | 0.0% |
| Self-Employed (Not Incorporated) | 15 | 3.1% |
| Not-for-profit Organizations | 87 | 18.2% |
| Local Government Employees | 18 | 3.8% |
| State Government Employees | 77 | 16.1% |
| Federal Government Employees | 23 | 4.8% |
| Unpaid Family Workers | 0 | 0.0% |
| Total | 478 | 100.0% |
Employment Status by Age in Pirtleville
According to the labor force statistics for Pirtleville, out of the total population over 16 years of age (1,150), 52.7% or 606 individuals are in the labor force, with 21.1% or 128 of them unemployed. The age group with the highest labor force participation rate is 25 to 29 years, with 100.0% or 94 individuals in the labor force. Within the labor force, the 20 to 24 years age range has the highest percentage of unemployed individuals, with 71.4% or 25 of them being unemployed.
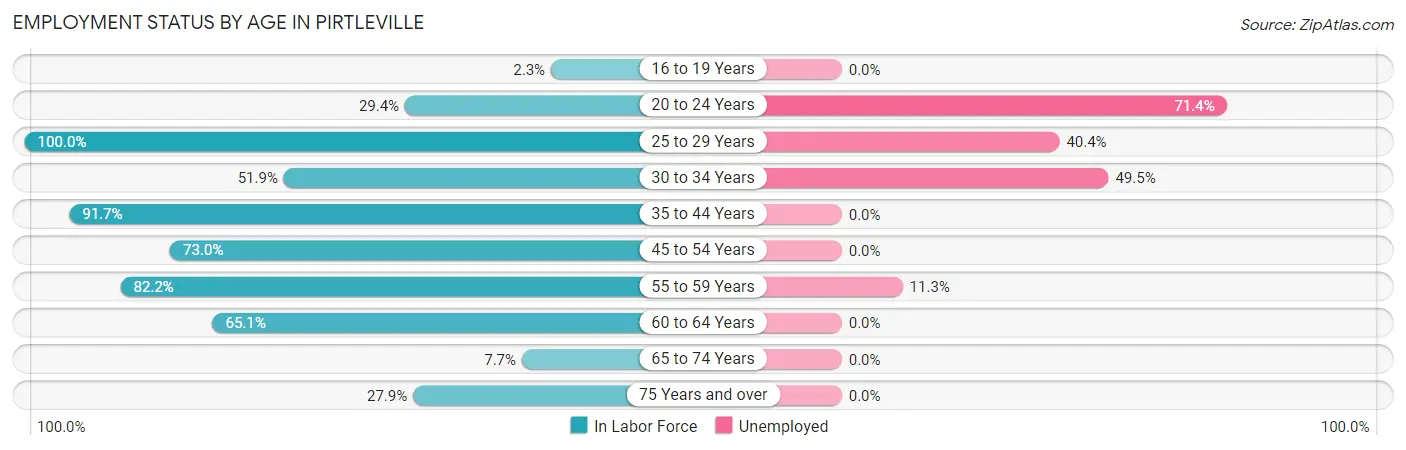
| Age Bracket | In Labor Force | Unemployed |
| 16 to 19 Years | 1 (2.3%) | 0 (0.0%) |
| 20 to 24 Years | 35 (29.4%) | 25 (71.4%) |
| 25 to 29 Years | 94 (100.0%) | 38 (40.4%) |
| 30 to 34 Years | 109 (51.9%) | 54 (49.5%) |
| 35 to 44 Years | 77 (91.7%) | 0 (0.0%) |
| 45 to 54 Years | 92 (73.0%) | 0 (0.0%) |
| 55 to 59 Years | 97 (82.2%) | 11 (11.3%) |
| 60 to 64 Years | 54 (65.1%) | 0 (0.0%) |
| 65 to 74 Years | 11 (7.7%) | 0 (0.0%) |
| 75 Years and over | 36 (27.9%) | 0 (0.0%) |
| Total | 606 (52.7%) | 128 (21.1%) |
Employment Status by Educational Attainment in Pirtleville
According to labor force statistics for Pirtleville, 73.1% of individuals (523) out of the total population between 25 and 64 years of age (715) are in the labor force, with 19.7% or 103 of them being unemployed. The group with the highest labor force participation rate are those with the educational attainment of bachelor's degree or higher, with 100.0% or 36 individuals in the labor force. Within the labor force, individuals with high school diploma education have the highest percentage of unemployment, with 29.2% or 31 of them being unemployed.
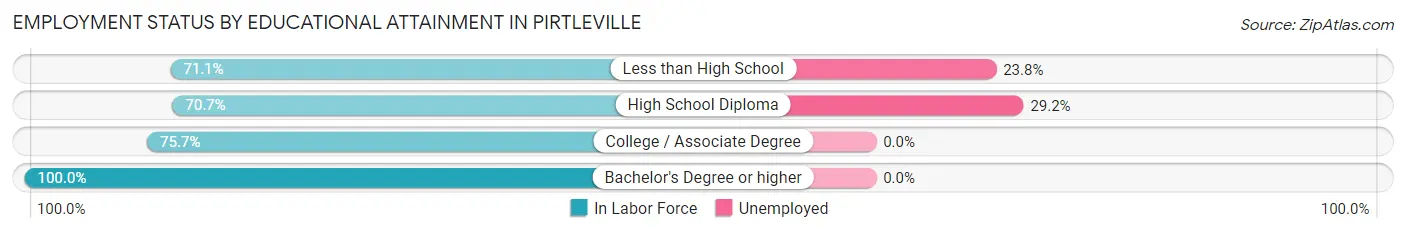
| Educational Attainment | In Labor Force | Unemployed |
| Less than High School | 303 (71.1%) | 101 (23.8%) |
| High School Diploma | 106 (70.7%) | 44 (29.2%) |
| College / Associate Degree | 78 (75.7%) | 0 (0.0%) |
| Bachelor's Degree or higher | 36 (100.0%) | 0 (0.0%) |
| Total | 523 (73.1%) | 141 (19.7%) |
Employment Occupations by Sex in Pirtleville
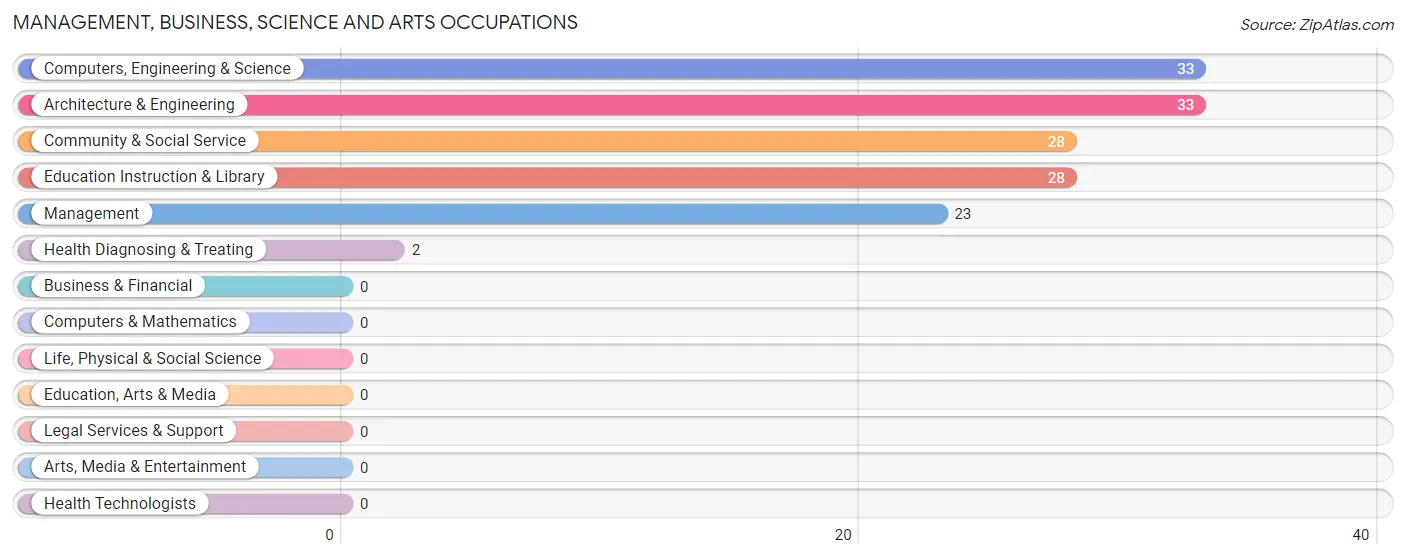
Management, Business, Science and Arts Occupations
The most common Management, Business, Science and Arts occupations in Pirtleville are Computers, Engineering & Science (33 | 6.9%), Architecture & Engineering (33 | 6.9%), Community & Social Service (28 | 5.9%), Education Instruction & Library (28 | 5.9%), and Management (23 | 4.8%).
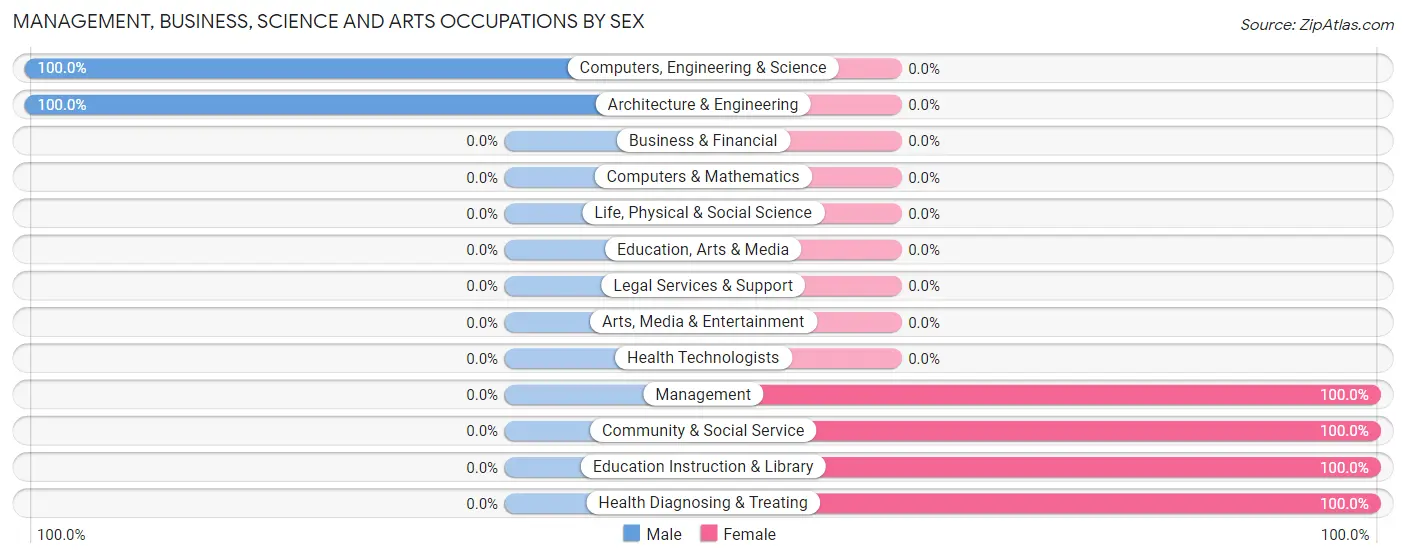
Management, Business, Science and Arts Occupations by Sex
Within the Management, Business, Science and Arts occupations in Pirtleville, the most male-oriented occupations are Computers, Engineering & Science (100.0%), and Architecture & Engineering (100.0%), while the most female-oriented occupations are Management (100.0%), Community & Social Service (100.0%), and Education Instruction & Library (100.0%).
| Occupation | Male | Female |
| Management | 0 (0.0%) | 23 (100.0%) |
| Business & Financial | 0 (0.0%) | 0 (0.0%) |
| Computers, Engineering & Science | 33 (100.0%) | 0 (0.0%) |
| Computers & Mathematics | 0 (0.0%) | 0 (0.0%) |
| Architecture & Engineering | 33 (100.0%) | 0 (0.0%) |
| Life, Physical & Social Science | 0 (0.0%) | 0 (0.0%) |
| Community & Social Service | 0 (0.0%) | 28 (100.0%) |
| Education, Arts & Media | 0 (0.0%) | 0 (0.0%) |
| Legal Services & Support | 0 (0.0%) | 0 (0.0%) |
| Education Instruction & Library | 0 (0.0%) | 28 (100.0%) |
| Arts, Media & Entertainment | 0 (0.0%) | 0 (0.0%) |
| Health Diagnosing & Treating | 0 (0.0%) | 2 (100.0%) |
| Health Technologists | 0 (0.0%) | 0 (0.0%) |
| Total (Category) | 33 (38.4%) | 53 (61.6%) |
| Total (Overall) | 198 (41.4%) | 280 (58.6%) |
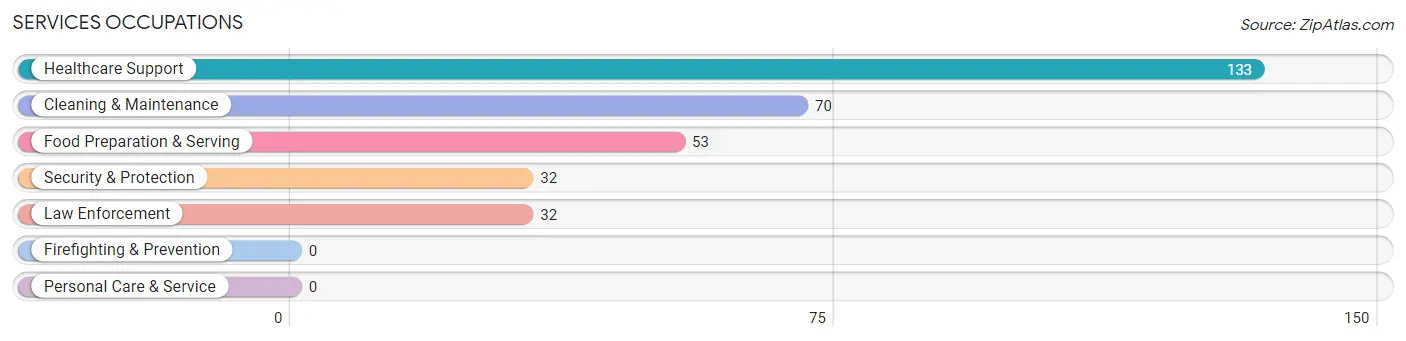
Services Occupations
The most common Services occupations in Pirtleville are Healthcare Support (133 | 27.8%), Cleaning & Maintenance (70 | 14.6%), Food Preparation & Serving (53 | 11.1%), Security & Protection (32 | 6.7%), and Law Enforcement (32 | 6.7%).
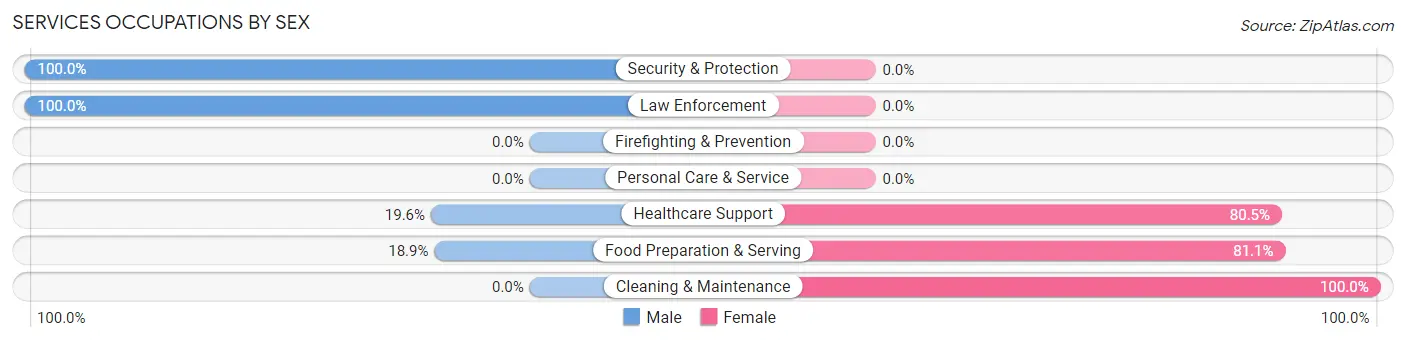
Services Occupations by Sex
Within the Services occupations in Pirtleville, the most male-oriented occupations are Security & Protection (100.0%), Law Enforcement (100.0%), and Healthcare Support (19.6%), while the most female-oriented occupations are Cleaning & Maintenance (100.0%), Food Preparation & Serving (81.1%), and Healthcare Support (80.4%).
| Occupation | Male | Female |
| Healthcare Support | 26 (19.6%) | 107 (80.4%) |
| Security & Protection | 32 (100.0%) | 0 (0.0%) |
| Firefighting & Prevention | 0 (0.0%) | 0 (0.0%) |
| Law Enforcement | 32 (100.0%) | 0 (0.0%) |
| Food Preparation & Serving | 10 (18.9%) | 43 (81.1%) |
| Cleaning & Maintenance | 0 (0.0%) | 70 (100.0%) |
| Personal Care & Service | 0 (0.0%) | 0 (0.0%) |
| Total (Category) | 68 (23.6%) | 220 (76.4%) |
| Total (Overall) | 198 (41.4%) | 280 (58.6%) |
Sales and Office Occupations
The most common Sales and Office occupations in Pirtleville are Office & Administration (6 | 1.3%), and Sales & Related (1 | 0.2%).
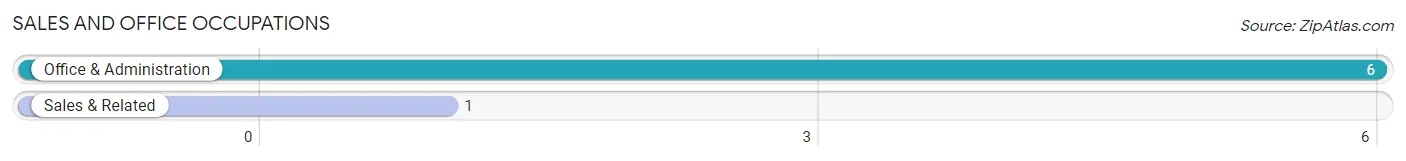
Sales and Office Occupations by Sex
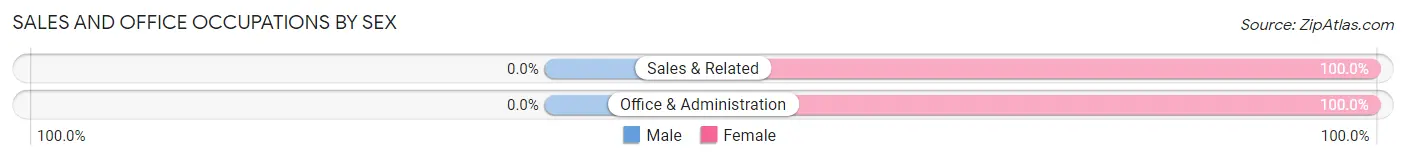
| Occupation | Male | Female |
| Sales & Related | 0 (0.0%) | 1 (100.0%) |
| Office & Administration | 0 (0.0%) | 6 (100.0%) |
| Total (Category) | 0 (0.0%) | 7 (100.0%) |
| Total (Overall) | 198 (41.4%) | 280 (58.6%) |
Natural Resources, Construction and Maintenance Occupations
The most common Natural Resources, Construction and Maintenance occupations in Pirtleville are Construction & Extraction (50 | 10.5%), and Farming, Fishing & Forestry (14 | 2.9%).
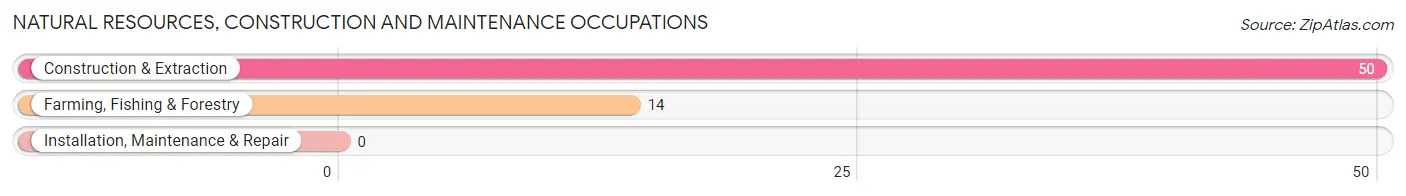
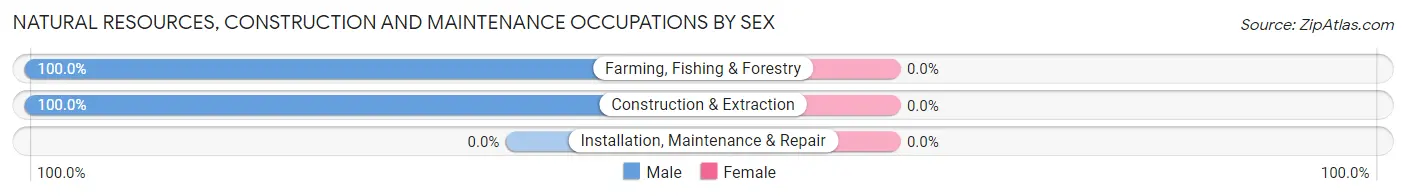
Natural Resources, Construction and Maintenance Occupations by Sex
| Occupation | Male | Female |
| Farming, Fishing & Forestry | 14 (100.0%) | 0 (0.0%) |
| Construction & Extraction | 50 (100.0%) | 0 (0.0%) |
| Installation, Maintenance & Repair | 0 (0.0%) | 0 (0.0%) |
| Total (Category) | 64 (100.0%) | 0 (0.0%) |
| Total (Overall) | 198 (41.4%) | 280 (58.6%) |
Production, Transportation and Moving Occupations
The most common Production, Transportation and Moving occupations in Pirtleville are , and Material Moving (33 | 6.9%).
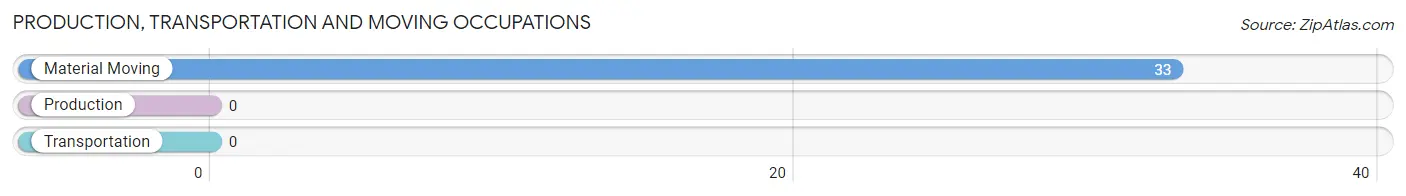
Production, Transportation and Moving Occupations by Sex
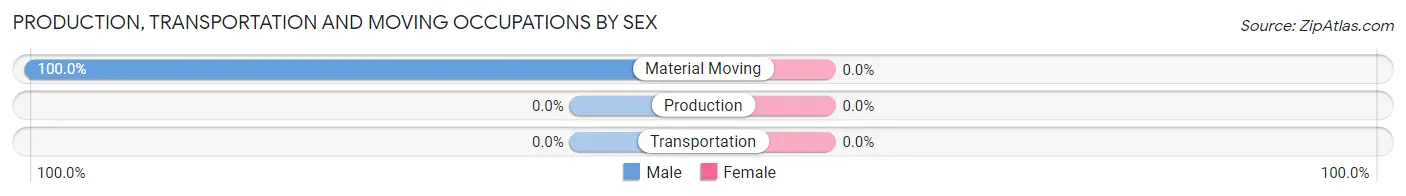
| Occupation | Male | Female |
| Production | 0 (0.0%) | 0 (0.0%) |
| Transportation | 0 (0.0%) | 0 (0.0%) |
| Material Moving | 33 (100.0%) | 0 (0.0%) |
| Total (Category) | 33 (100.0%) | 0 (0.0%) |
| Total (Overall) | 198 (41.4%) | 280 (58.6%) |
Employment Industries by Sex in Pirtleville
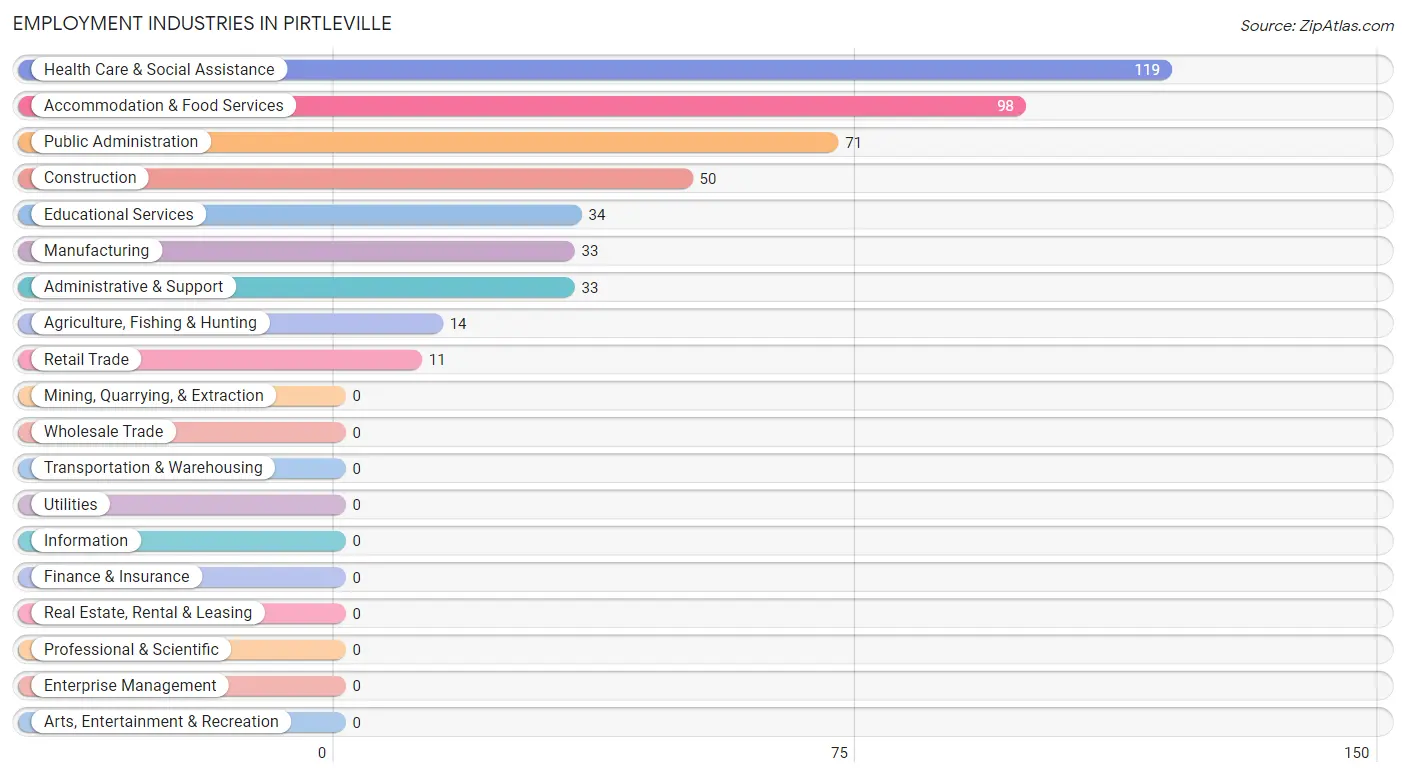
Employment Industries in Pirtleville
The major employment industries in Pirtleville include Health Care & Social Assistance (119 | 24.9%), Accommodation & Food Services (98 | 20.5%), Public Administration (71 | 14.8%), Construction (50 | 10.5%), and Educational Services (34 | 7.1%).
Employment Industries by Sex in Pirtleville
The Pirtleville industries that see more men than women are Agriculture, Fishing & Hunting (100.0%), Construction (100.0%), and Manufacturing (100.0%), whereas the industries that tend to have a higher number of women are Educational Services (100.0%), Accommodation & Food Services (100.0%), and Health Care & Social Assistance (78.1%).
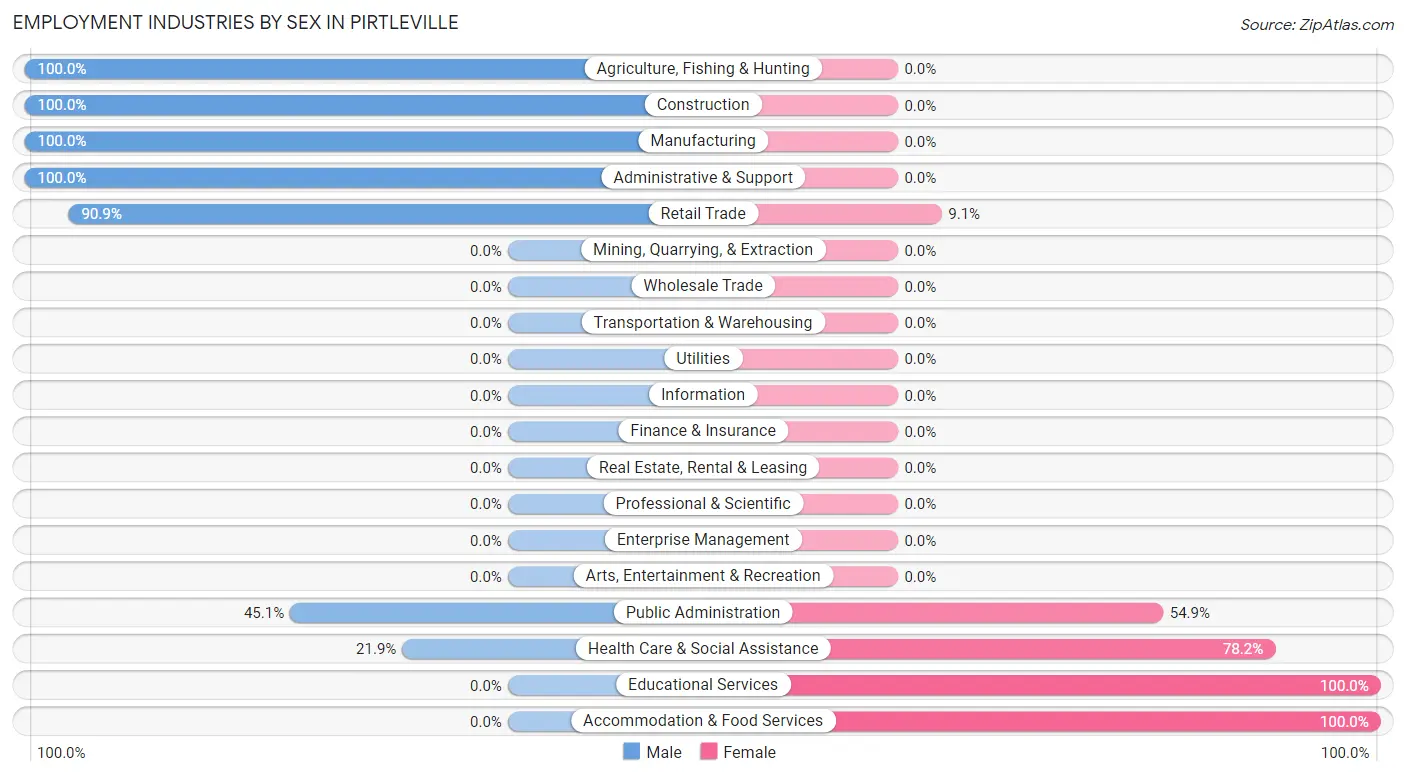
| Industry | Male | Female |
| Agriculture, Fishing & Hunting | 14 (100.0%) | 0 (0.0%) |
| Mining, Quarrying, & Extraction | 0 (0.0%) | 0 (0.0%) |
| Construction | 50 (100.0%) | 0 (0.0%) |
| Manufacturing | 33 (100.0%) | 0 (0.0%) |
| Wholesale Trade | 0 (0.0%) | 0 (0.0%) |
| Retail Trade | 10 (90.9%) | 1 (9.1%) |
| Transportation & Warehousing | 0 (0.0%) | 0 (0.0%) |
| Utilities | 0 (0.0%) | 0 (0.0%) |
| Information | 0 (0.0%) | 0 (0.0%) |
| Finance & Insurance | 0 (0.0%) | 0 (0.0%) |
| Real Estate, Rental & Leasing | 0 (0.0%) | 0 (0.0%) |
| Professional & Scientific | 0 (0.0%) | 0 (0.0%) |
| Enterprise Management | 0 (0.0%) | 0 (0.0%) |
| Administrative & Support | 33 (100.0%) | 0 (0.0%) |
| Educational Services | 0 (0.0%) | 34 (100.0%) |
| Health Care & Social Assistance | 26 (21.8%) | 93 (78.1%) |
| Arts, Entertainment & Recreation | 0 (0.0%) | 0 (0.0%) |
| Accommodation & Food Services | 0 (0.0%) | 98 (100.0%) |
| Public Administration | 32 (45.1%) | 39 (54.9%) |
| Total | 198 (41.4%) | 280 (58.6%) |
Education in Pirtleville
School Enrollment in Pirtleville
The most common levels of schooling among the 341 students in Pirtleville are elementary school (210 | 61.6%), middle school (58 | 17.0%), and high school (47 | 13.8%).
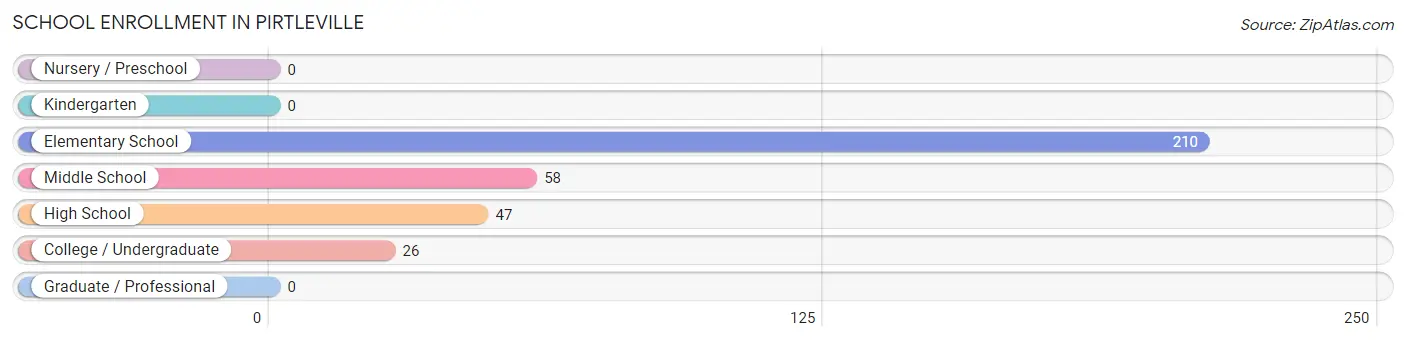
| School Level | # Students | % Students |
| Nursery / Preschool | 0 | 0.0% |
| Kindergarten | 0 | 0.0% |
| Elementary School | 210 | 61.6% |
| Middle School | 58 | 17.0% |
| High School | 47 | 13.8% |
| College / Undergraduate | 26 | 7.6% |
| Graduate / Professional | 0 | 0.0% |
| Total | 341 | 100.0% |
School Enrollment by Age by Funding Source in Pirtleville
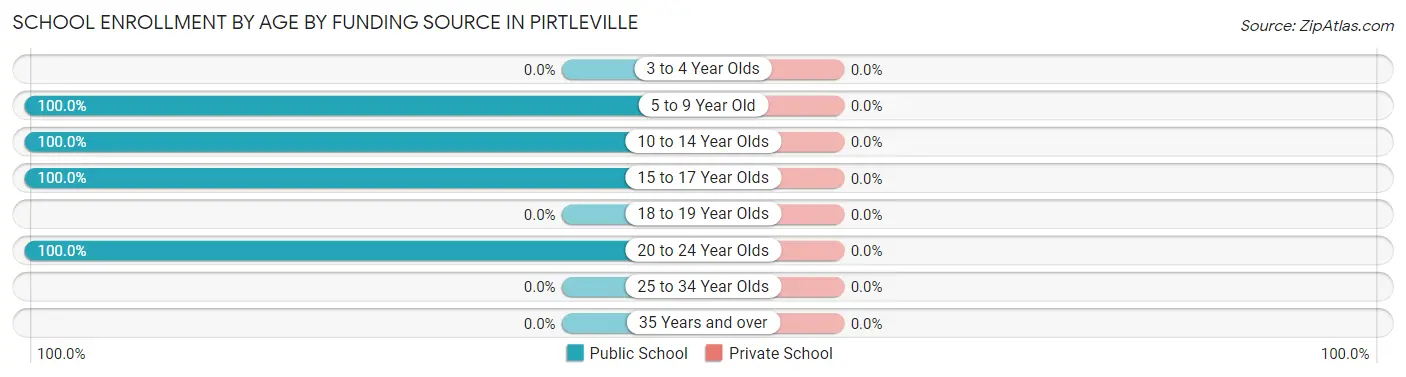
| Age Bracket | Public School | Private School |
| 3 to 4 Year Olds | 0 (0.0%) | 0 (0.0%) |
| 5 to 9 Year Old | 210 (100.0%) | 0 (0.0%) |
| 10 to 14 Year Olds | 60 (100.0%) | 0 (0.0%) |
| 15 to 17 Year Olds | 45 (100.0%) | 0 (0.0%) |
| 18 to 19 Year Olds | 0 (0.0%) | 0 (0.0%) |
| 20 to 24 Year Olds | 26 (100.0%) | 0 (0.0%) |
| 25 to 34 Year Olds | 0 (0.0%) | 0 (0.0%) |
| 35 Years and over | 0 (0.0%) | 0 (0.0%) |
| Total | 341 (100.0%) | 0 (0.0%) |
Educational Attainment by Field of Study in Pirtleville
Education (46 | 76.7%), and bio, nature & agricultural (14 | 23.3%) are the most common fields of study among 60 individuals in Pirtleville who have obtained a bachelor's degree or higher.
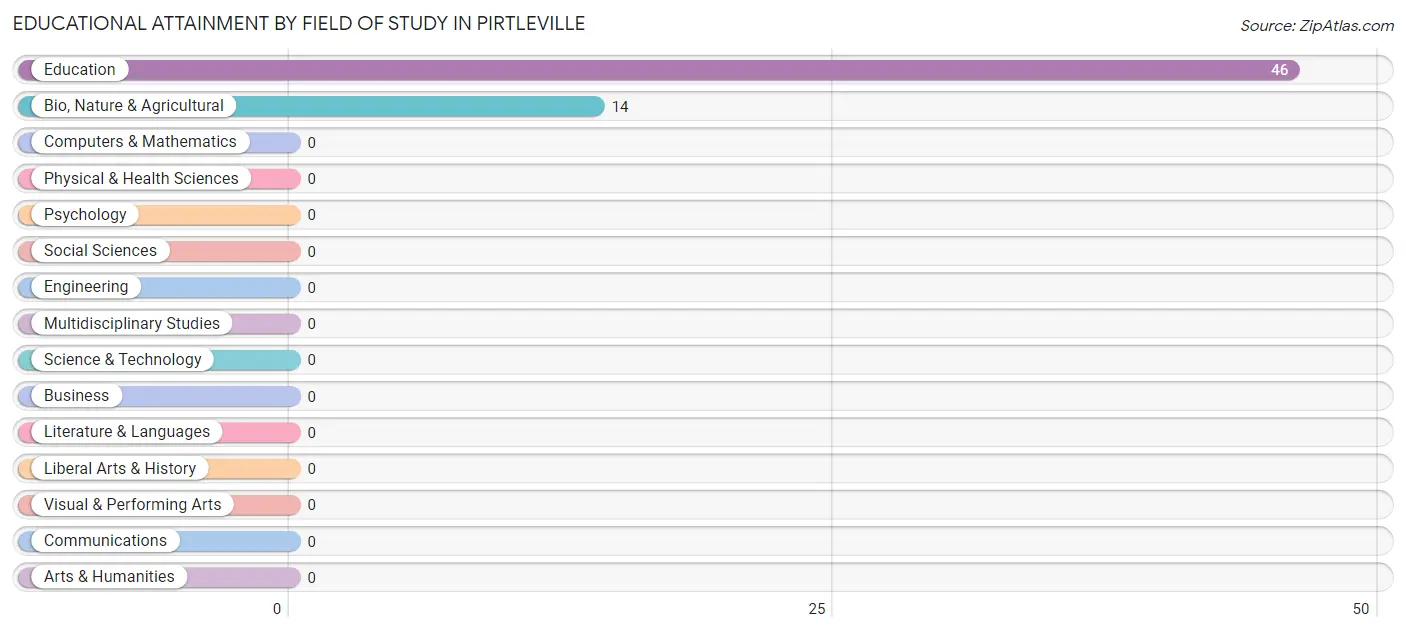
| Field of Study | # Graduates | % Graduates |
| Computers & Mathematics | 0 | 0.0% |
| Bio, Nature & Agricultural | 14 | 23.3% |
| Physical & Health Sciences | 0 | 0.0% |
| Psychology | 0 | 0.0% |
| Social Sciences | 0 | 0.0% |
| Engineering | 0 | 0.0% |
| Multidisciplinary Studies | 0 | 0.0% |
| Science & Technology | 0 | 0.0% |
| Business | 0 | 0.0% |
| Education | 46 | 76.7% |
| Literature & Languages | 0 | 0.0% |
| Liberal Arts & History | 0 | 0.0% |
| Visual & Performing Arts | 0 | 0.0% |
| Communications | 0 | 0.0% |
| Arts & Humanities | 0 | 0.0% |
| Total | 60 | 100.0% |
Transportation & Commute in Pirtleville
Vehicle Availability by Sex in Pirtleville
The most prevalent vehicle ownership categories in Pirtleville are males with 4 vehicles (82, accounting for 41.4%) and females with 4 vehicles (116, making up 29.3%).
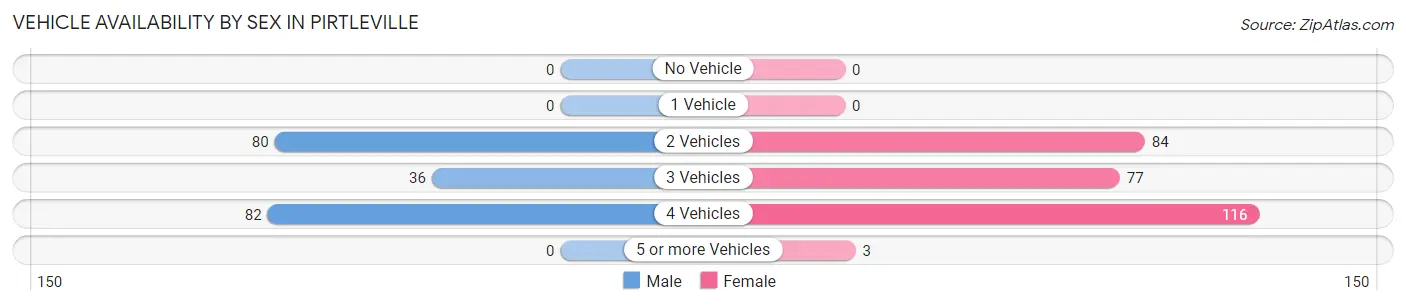
| Vehicles Available | Male | Female |
| No Vehicle | 0 (0.0%) | 0 (0.0%) |
| 1 Vehicle | 0 (0.0%) | 0 (0.0%) |
| 2 Vehicles | 80 (40.4%) | 84 (30.0%) |
| 3 Vehicles | 36 (18.2%) | 77 (27.5%) |
| 4 Vehicles | 82 (41.4%) | 116 (41.4%) |
| 5 or more Vehicles | 0 (0.0%) | 3 (1.1%) |
| Total | 198 (100.0%) | 280 (100.0%) |
Commute Time in Pirtleville
The most frequently occuring commute durations in Pirtleville are 60 to 89 minutes (142 commuters, 32.8%), 10 to 14 minutes (62 commuters, 14.3%), and 15 to 19 minutes (52 commuters, 12.0%).
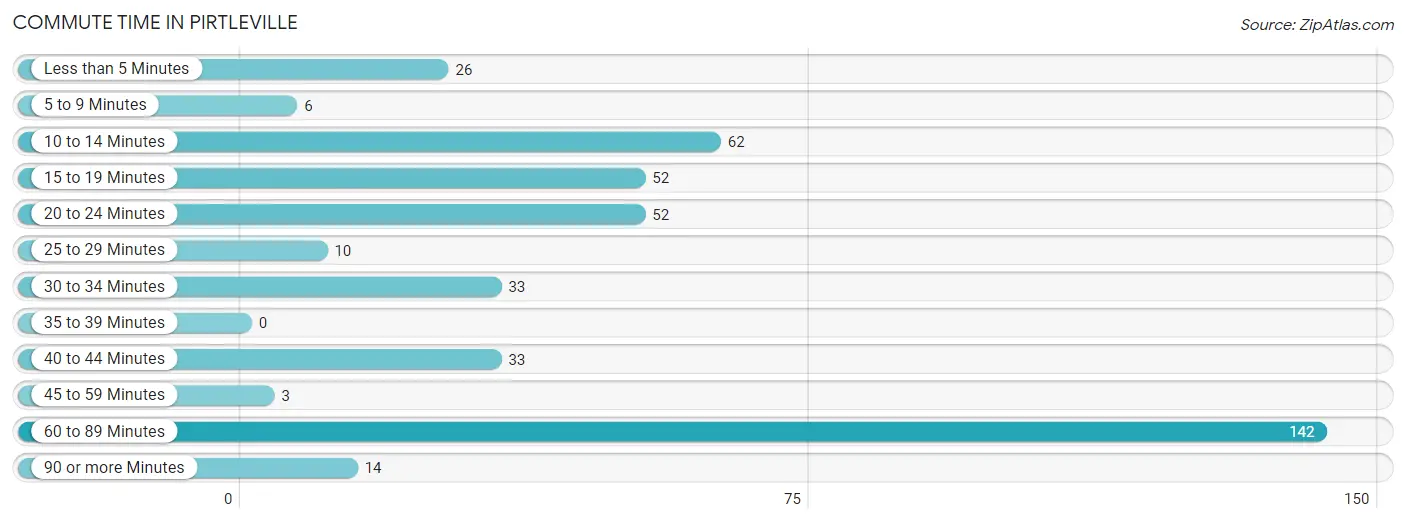
| Commute Time | # Commuters | % Commuters |
| Less than 5 Minutes | 26 | 6.0% |
| 5 to 9 Minutes | 6 | 1.4% |
| 10 to 14 Minutes | 62 | 14.3% |
| 15 to 19 Minutes | 52 | 12.0% |
| 20 to 24 Minutes | 52 | 12.0% |
| 25 to 29 Minutes | 10 | 2.3% |
| 30 to 34 Minutes | 33 | 7.6% |
| 35 to 39 Minutes | 0 | 0.0% |
| 40 to 44 Minutes | 33 | 7.6% |
| 45 to 59 Minutes | 3 | 0.7% |
| 60 to 89 Minutes | 142 | 32.8% |
| 90 or more Minutes | 14 | 3.2% |
Commute Time by Sex in Pirtleville
The most common commute times in Pirtleville are 15 to 19 minutes (52 commuters, 27.1%) for males and 60 to 89 minutes (142 commuters, 58.9%) for females.
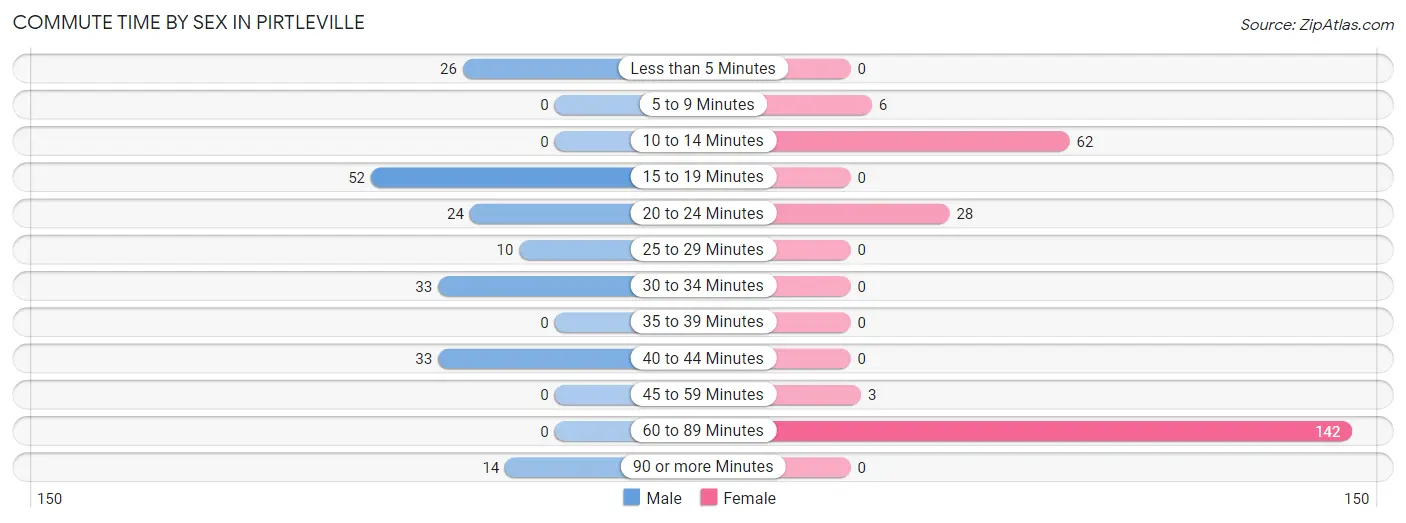
| Commute Time | Male | Female |
| Less than 5 Minutes | 26 (13.5%) | 0 (0.0%) |
| 5 to 9 Minutes | 0 (0.0%) | 6 (2.5%) |
| 10 to 14 Minutes | 0 (0.0%) | 62 (25.7%) |
| 15 to 19 Minutes | 52 (27.1%) | 0 (0.0%) |
| 20 to 24 Minutes | 24 (12.5%) | 28 (11.6%) |
| 25 to 29 Minutes | 10 (5.2%) | 0 (0.0%) |
| 30 to 34 Minutes | 33 (17.2%) | 0 (0.0%) |
| 35 to 39 Minutes | 0 (0.0%) | 0 (0.0%) |
| 40 to 44 Minutes | 33 (17.2%) | 0 (0.0%) |
| 45 to 59 Minutes | 0 (0.0%) | 3 (1.2%) |
| 60 to 89 Minutes | 0 (0.0%) | 142 (58.9%) |
| 90 or more Minutes | 14 (7.3%) | 0 (0.0%) |
Time of Departure to Work by Sex in Pirtleville
The most frequent times of departure to work in Pirtleville are 12:00 AM to 4:59 AM (69, 35.9%) for males and 12:00 AM to 4:59 AM (76, 31.5%) for females.
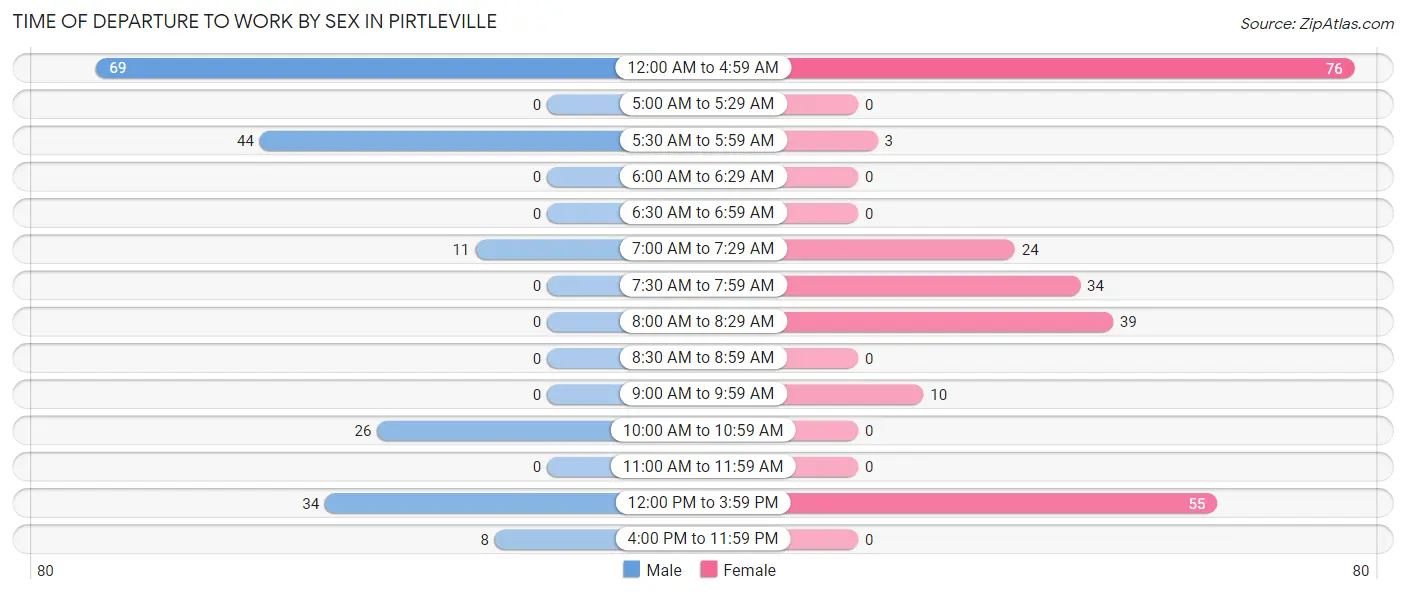
| Time of Departure | Male | Female |
| 12:00 AM to 4:59 AM | 69 (35.9%) | 76 (31.5%) |
| 5:00 AM to 5:29 AM | 0 (0.0%) | 0 (0.0%) |
| 5:30 AM to 5:59 AM | 44 (22.9%) | 3 (1.2%) |
| 6:00 AM to 6:29 AM | 0 (0.0%) | 0 (0.0%) |
| 6:30 AM to 6:59 AM | 0 (0.0%) | 0 (0.0%) |
| 7:00 AM to 7:29 AM | 11 (5.7%) | 24 (10.0%) |
| 7:30 AM to 7:59 AM | 0 (0.0%) | 34 (14.1%) |
| 8:00 AM to 8:29 AM | 0 (0.0%) | 39 (16.2%) |
| 8:30 AM to 8:59 AM | 0 (0.0%) | 0 (0.0%) |
| 9:00 AM to 9:59 AM | 0 (0.0%) | 10 (4.2%) |
| 10:00 AM to 10:59 AM | 26 (13.5%) | 0 (0.0%) |
| 11:00 AM to 11:59 AM | 0 (0.0%) | 0 (0.0%) |
| 12:00 PM to 3:59 PM | 34 (17.7%) | 55 (22.8%) |
| 4:00 PM to 11:59 PM | 8 (4.2%) | 0 (0.0%) |
| Total | 192 (100.0%) | 241 (100.0%) |
Housing Occupancy in Pirtleville
Occupancy by Ownership in Pirtleville
Of the total 397 dwellings in Pirtleville, owner-occupied units account for 331 (83.4%), while renter-occupied units make up 66 (16.6%).
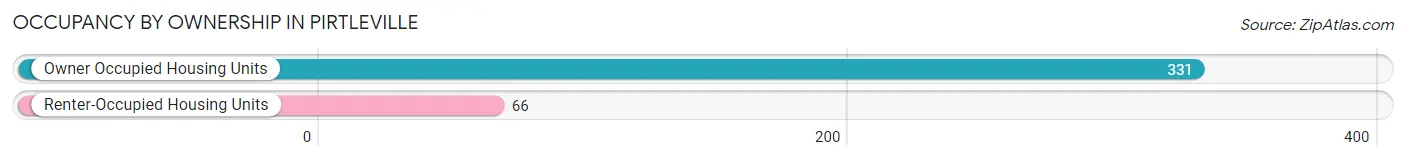
| Occupancy | # Housing Units | % Housing Units |
| Owner Occupied Housing Units | 331 | 83.4% |
| Renter-Occupied Housing Units | 66 | 16.6% |
| Total Occupied Housing Units | 397 | 100.0% |
Occupancy by Household Size in Pirtleville
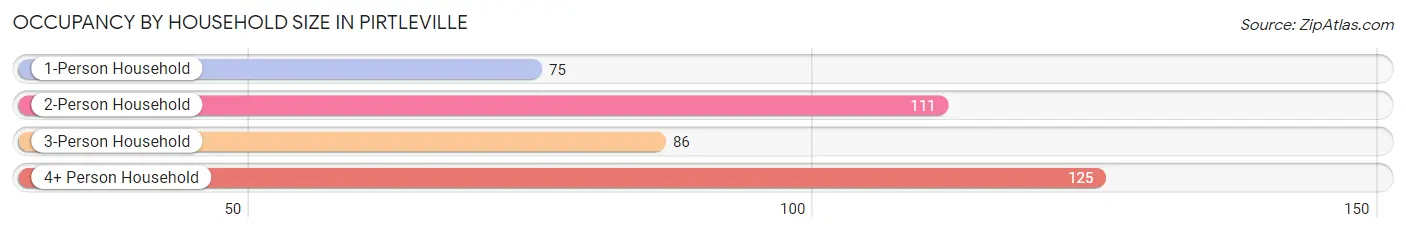
| Household Size | # Housing Units | % Housing Units |
| 1-Person Household | 75 | 18.9% |
| 2-Person Household | 111 | 28.0% |
| 3-Person Household | 86 | 21.7% |
| 4+ Person Household | 125 | 31.5% |
| Total Housing Units | 397 | 100.0% |
Occupancy by Ownership by Household Size in Pirtleville
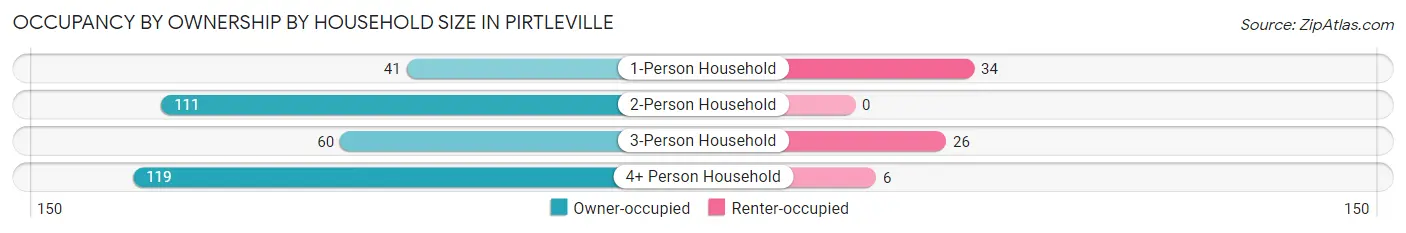
| Household Size | Owner-occupied | Renter-occupied |
| 1-Person Household | 41 (54.7%) | 34 (45.3%) |
| 2-Person Household | 111 (100.0%) | 0 (0.0%) |
| 3-Person Household | 60 (69.8%) | 26 (30.2%) |
| 4+ Person Household | 119 (95.2%) | 6 (4.8%) |
| Total Housing Units | 331 (83.4%) | 66 (16.6%) |
Occupancy by Educational Attainment in Pirtleville
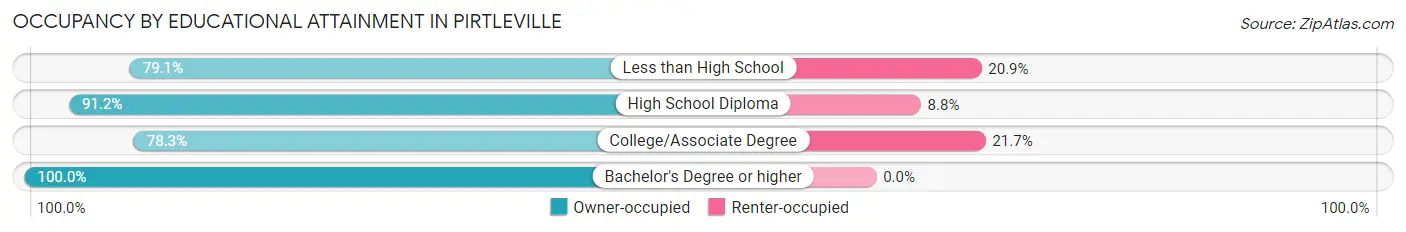
| Household Size | Owner-occupied | Renter-occupied |
| Less than High School | 129 (79.1%) | 34 (20.9%) |
| High School Diploma | 62 (91.2%) | 6 (8.8%) |
| College/Associate Degree | 94 (78.3%) | 26 (21.7%) |
| Bachelor's Degree or higher | 46 (100.0%) | 0 (0.0%) |
Occupancy by Age of Householder in Pirtleville
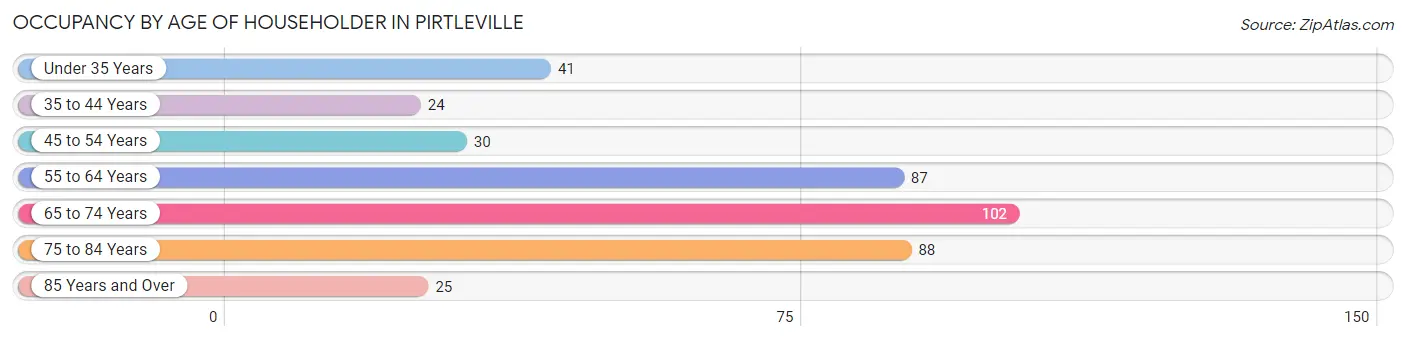
| Age Bracket | # Households | % Households |
| Under 35 Years | 41 | 10.3% |
| 35 to 44 Years | 24 | 6.0% |
| 45 to 54 Years | 30 | 7.6% |
| 55 to 64 Years | 87 | 21.9% |
| 65 to 74 Years | 102 | 25.7% |
| 75 to 84 Years | 88 | 22.2% |
| 85 Years and Over | 25 | 6.3% |
| Total | 397 | 100.0% |
Housing Finances in Pirtleville
Median Income by Occupancy in Pirtleville
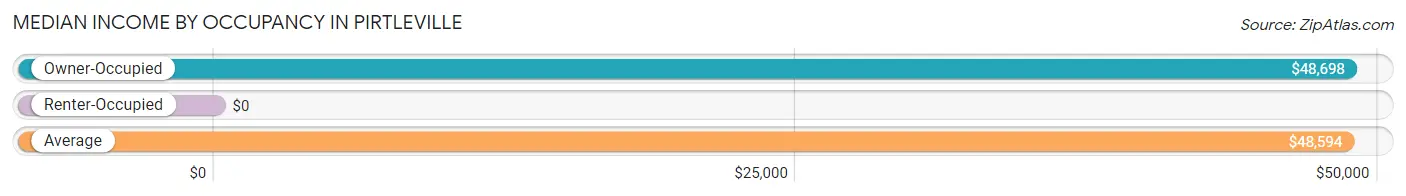
| Occupancy Type | # Households | Median Income |
| Owner-Occupied | 331 (83.4%) | $48,698 |
| Renter-Occupied | 66 (16.6%) | $0 |
| Average | 397 (100.0%) | $48,594 |
Occupancy by Householder Income Bracket in Pirtleville
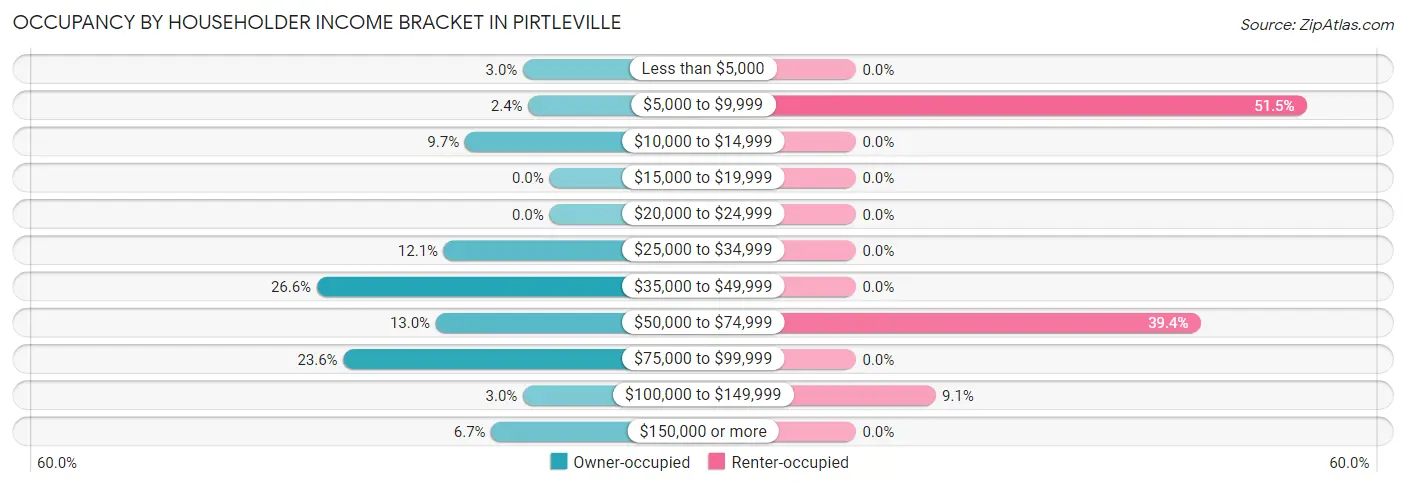
| Income Bracket | Owner-occupied | Renter-occupied |
| Less than $5,000 | 10 (3.0%) | 0 (0.0%) |
| $5,000 to $9,999 | 8 (2.4%) | 34 (51.5%) |
| $10,000 to $14,999 | 32 (9.7%) | 0 (0.0%) |
| $15,000 to $19,999 | 0 (0.0%) | 0 (0.0%) |
| $20,000 to $24,999 | 0 (0.0%) | 0 (0.0%) |
| $25,000 to $34,999 | 40 (12.1%) | 0 (0.0%) |
| $35,000 to $49,999 | 88 (26.6%) | 0 (0.0%) |
| $50,000 to $74,999 | 43 (13.0%) | 26 (39.4%) |
| $75,000 to $99,999 | 78 (23.6%) | 0 (0.0%) |
| $100,000 to $149,999 | 10 (3.0%) | 6 (9.1%) |
| $150,000 or more | 22 (6.7%) | 0 (0.0%) |
| Total | 331 (100.0%) | 66 (100.0%) |
Monthly Housing Cost Tiers in Pirtleville
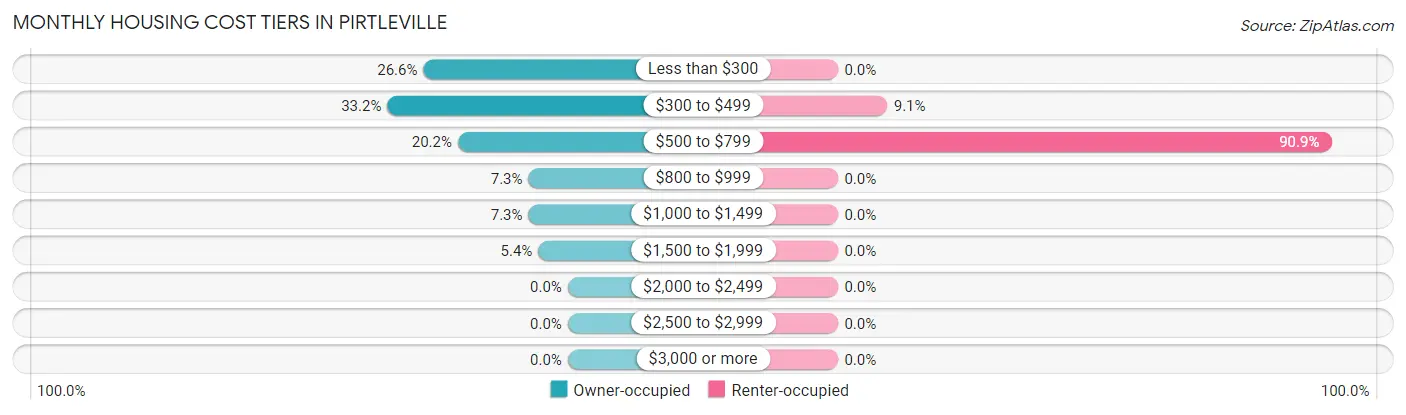
| Monthly Cost | Owner-occupied | Renter-occupied |
| Less than $300 | 88 (26.6%) | 0 (0.0%) |
| $300 to $499 | 110 (33.2%) | 6 (9.1%) |
| $500 to $799 | 67 (20.2%) | 60 (90.9%) |
| $800 to $999 | 24 (7.2%) | 0 (0.0%) |
| $1,000 to $1,499 | 24 (7.2%) | 0 (0.0%) |
| $1,500 to $1,999 | 18 (5.4%) | 0 (0.0%) |
| $2,000 to $2,499 | 0 (0.0%) | 0 (0.0%) |
| $2,500 to $2,999 | 0 (0.0%) | 0 (0.0%) |
| $3,000 or more | 0 (0.0%) | 0 (0.0%) |
| Total | 331 (100.0%) | 66 (100.0%) |
Physical Housing Characteristics in Pirtleville
Housing Structures in Pirtleville
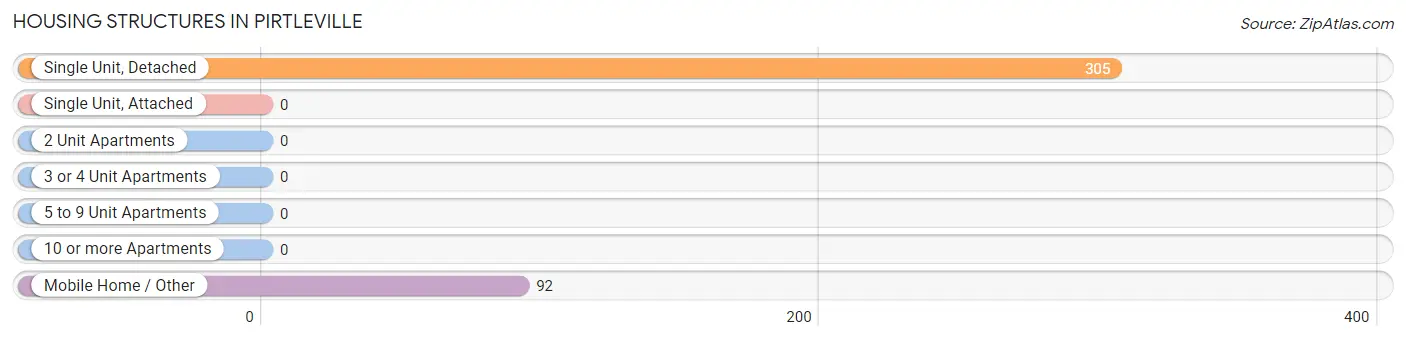
| Structure Type | # Housing Units | % Housing Units |
| Single Unit, Detached | 305 | 76.8% |
| Single Unit, Attached | 0 | 0.0% |
| 2 Unit Apartments | 0 | 0.0% |
| 3 or 4 Unit Apartments | 0 | 0.0% |
| 5 to 9 Unit Apartments | 0 | 0.0% |
| 10 or more Apartments | 0 | 0.0% |
| Mobile Home / Other | 92 | 23.2% |
| Total | 397 | 100.0% |
Housing Structures by Occupancy in Pirtleville
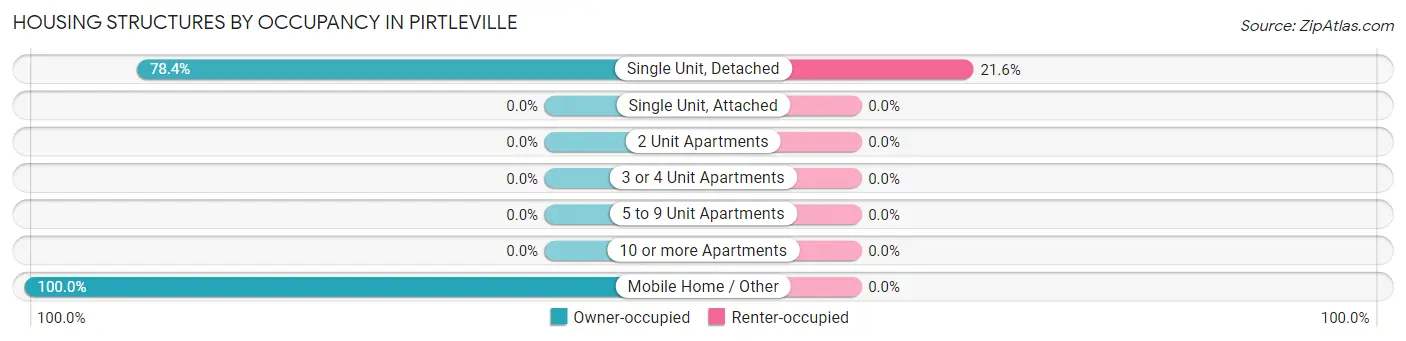
| Structure Type | Owner-occupied | Renter-occupied |
| Single Unit, Detached | 239 (78.4%) | 66 (21.6%) |
| Single Unit, Attached | 0 (0.0%) | 0 (0.0%) |
| 2 Unit Apartments | 0 (0.0%) | 0 (0.0%) |
| 3 or 4 Unit Apartments | 0 (0.0%) | 0 (0.0%) |
| 5 to 9 Unit Apartments | 0 (0.0%) | 0 (0.0%) |
| 10 or more Apartments | 0 (0.0%) | 0 (0.0%) |
| Mobile Home / Other | 92 (100.0%) | 0 (0.0%) |
| Total | 331 (83.4%) | 66 (16.6%) |
Housing Structures by Number of Rooms in Pirtleville
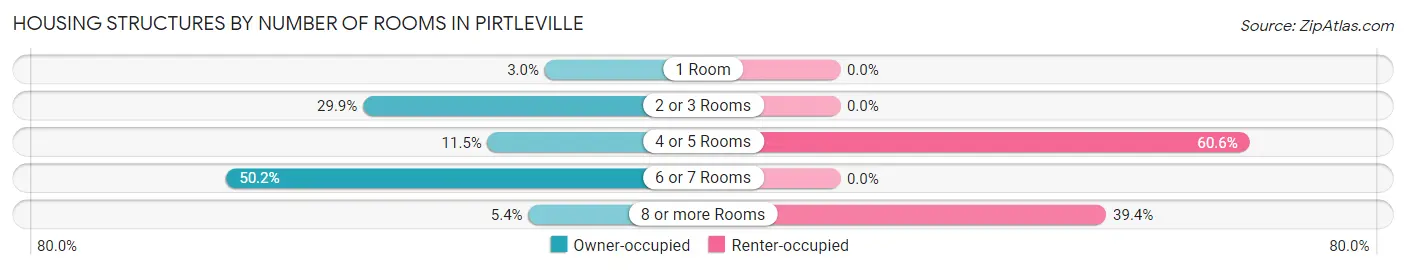
| Number of Rooms | Owner-occupied | Renter-occupied |
| 1 Room | 10 (3.0%) | 0 (0.0%) |
| 2 or 3 Rooms | 99 (29.9%) | 0 (0.0%) |
| 4 or 5 Rooms | 38 (11.5%) | 40 (60.6%) |
| 6 or 7 Rooms | 166 (50.1%) | 0 (0.0%) |
| 8 or more Rooms | 18 (5.4%) | 26 (39.4%) |
| Total | 331 (100.0%) | 66 (100.0%) |
Housing Structure by Heating Type in Pirtleville
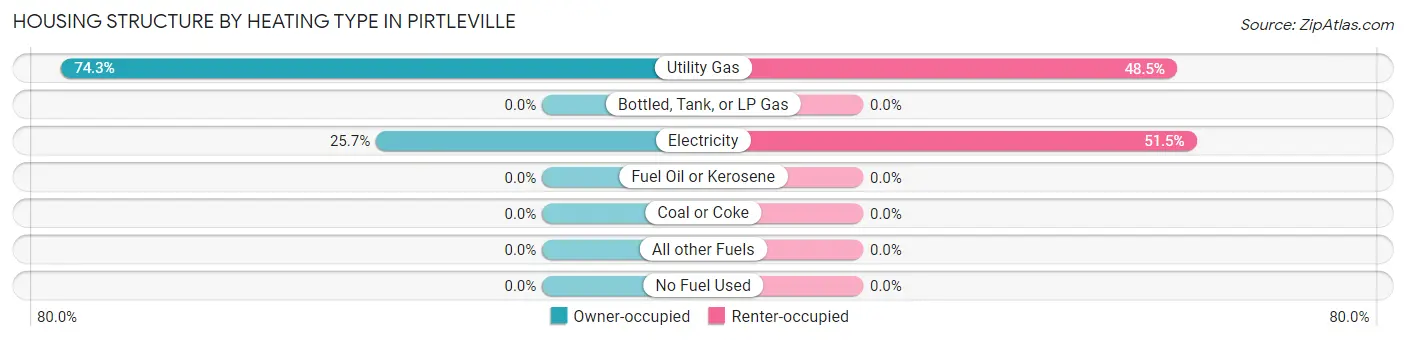
| Heating Type | Owner-occupied | Renter-occupied |
| Utility Gas | 246 (74.3%) | 32 (48.5%) |
| Bottled, Tank, or LP Gas | 0 (0.0%) | 0 (0.0%) |
| Electricity | 85 (25.7%) | 34 (51.5%) |
| Fuel Oil or Kerosene | 0 (0.0%) | 0 (0.0%) |
| Coal or Coke | 0 (0.0%) | 0 (0.0%) |
| All other Fuels | 0 (0.0%) | 0 (0.0%) |
| No Fuel Used | 0 (0.0%) | 0 (0.0%) |
| Total | 331 (100.0%) | 66 (100.0%) |
Household Vehicle Usage in Pirtleville
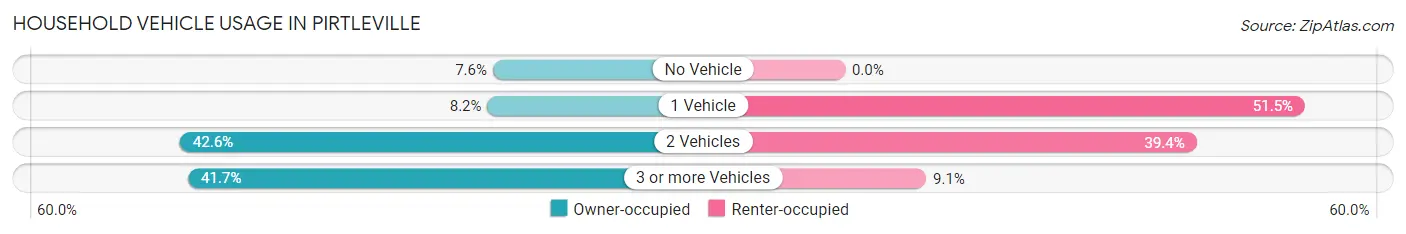
| Vehicles per Household | Owner-occupied | Renter-occupied |
| No Vehicle | 25 (7.5%) | 0 (0.0%) |
| 1 Vehicle | 27 (8.2%) | 34 (51.5%) |
| 2 Vehicles | 141 (42.6%) | 26 (39.4%) |
| 3 or more Vehicles | 138 (41.7%) | 6 (9.1%) |
| Total | 331 (100.0%) | 66 (100.0%) |
Real Estate & Mortgages in Pirtleville
Real Estate and Mortgage Overview in Pirtleville
| Characteristic | Without Mortgage | With Mortgage |
| Housing Units | 218 | 113 |
| Median Property Value | $65,800 | $92,300 |
| Median Household Income | $49,792 | $22 |
| Monthly Housing Costs | $342 | $0 |
| Real Estate Taxes | $805 | $24 |
Property Value by Mortgage Status in Pirtleville
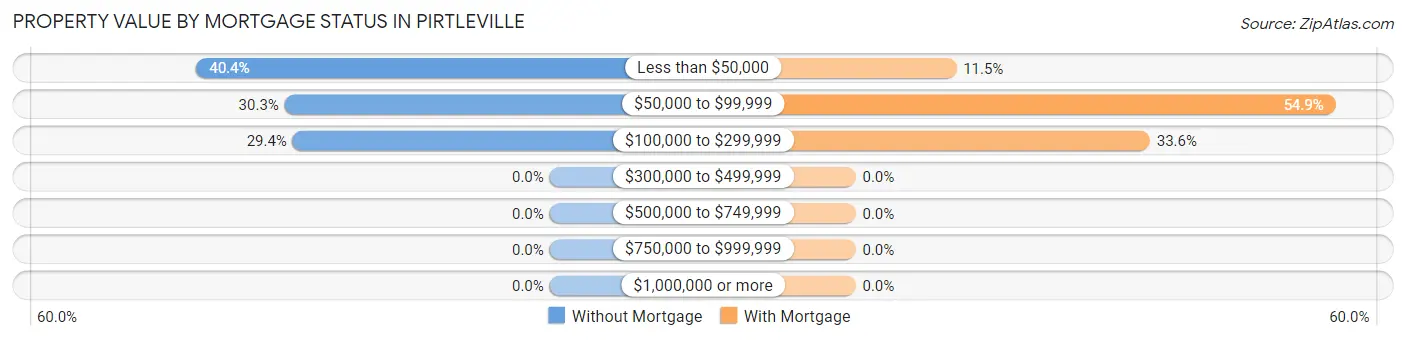
| Property Value | Without Mortgage | With Mortgage |
| Less than $50,000 | 88 (40.4%) | 13 (11.5%) |
| $50,000 to $99,999 | 66 (30.3%) | 62 (54.9%) |
| $100,000 to $299,999 | 64 (29.4%) | 38 (33.6%) |
| $300,000 to $499,999 | 0 (0.0%) | 0 (0.0%) |
| $500,000 to $749,999 | 0 (0.0%) | 0 (0.0%) |
| $750,000 to $999,999 | 0 (0.0%) | 0 (0.0%) |
| $1,000,000 or more | 0 (0.0%) | 0 (0.0%) |
| Total | 218 (100.0%) | 113 (100.0%) |
Household Income by Mortgage Status in Pirtleville
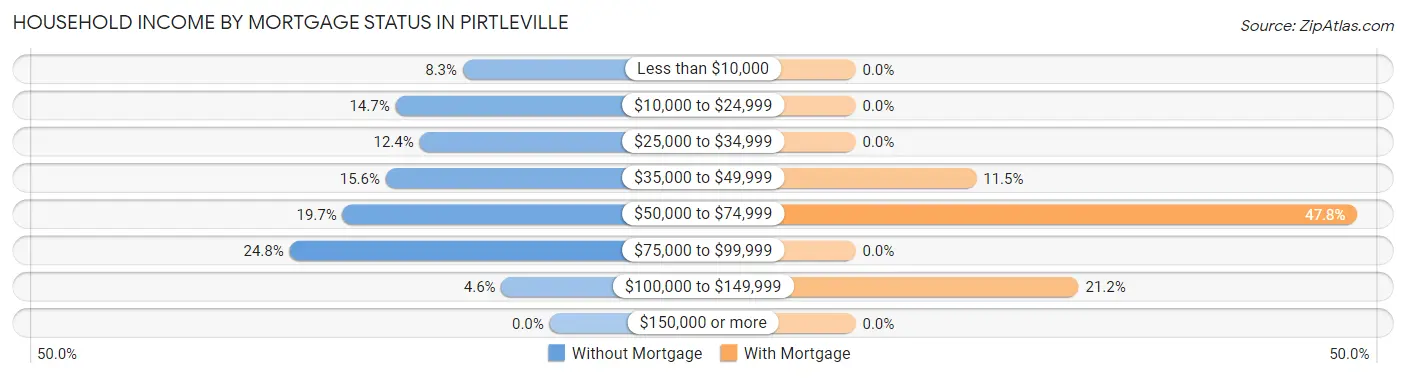
| Household Income | Without Mortgage | With Mortgage |
| Less than $10,000 | 18 (8.3%) | 0 (0.0%) |
| $10,000 to $24,999 | 32 (14.7%) | 0 (0.0%) |
| $25,000 to $34,999 | 27 (12.4%) | 0 (0.0%) |
| $35,000 to $49,999 | 34 (15.6%) | 13 (11.5%) |
| $50,000 to $74,999 | 43 (19.7%) | 54 (47.8%) |
| $75,000 to $99,999 | 54 (24.8%) | 0 (0.0%) |
| $100,000 to $149,999 | 10 (4.6%) | 24 (21.2%) |
| $150,000 or more | 0 (0.0%) | 0 (0.0%) |
| Total | 218 (100.0%) | 113 (100.0%) |
Property Value to Household Income Ratio in Pirtleville
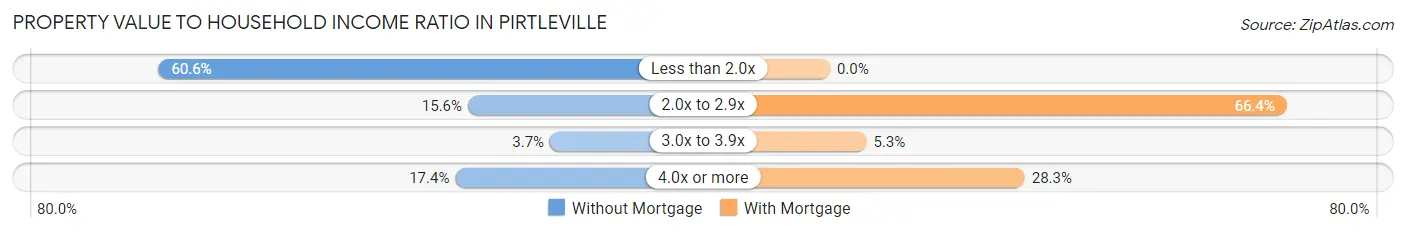
| Value-to-Income Ratio | Without Mortgage | With Mortgage |
| Less than 2.0x | 132 (60.6%) | 0 (0.0%) |
| 2.0x to 2.9x | 34 (15.6%) | 75 (66.4%) |
| 3.0x to 3.9x | 8 (3.7%) | 6 (5.3%) |
| 4.0x or more | 38 (17.4%) | 32 (28.3%) |
| Total | 218 (100.0%) | 113 (100.0%) |
Real Estate Taxes by Mortgage Status in Pirtleville
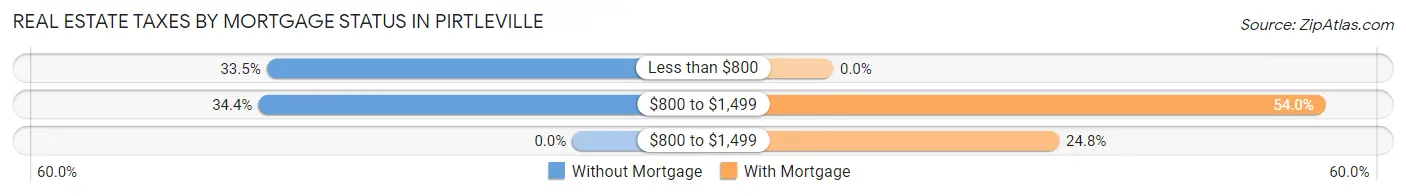
| Property Taxes | Without Mortgage | With Mortgage |
| Less than $800 | 73 (33.5%) | 0 (0.0%) |
| $800 to $1,499 | 75 (34.4%) | 61 (54.0%) |
| $800 to $1,499 | 0 (0.0%) | 28 (24.8%) |
| Total | 218 (100.0%) | 113 (100.0%) |
Health & Disability in Pirtleville
Health Insurance Coverage by Age in Pirtleville
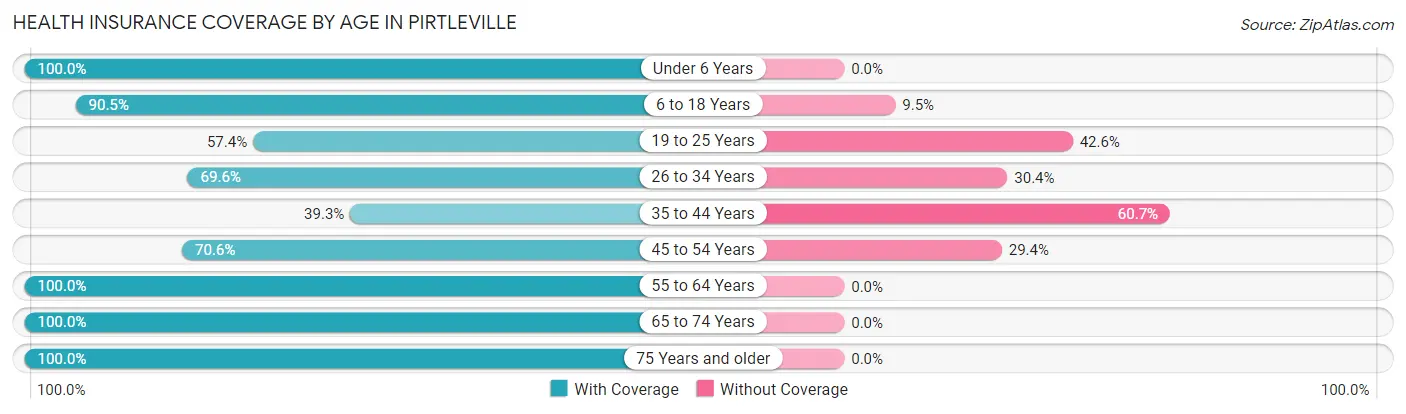
| Age Bracket | With Coverage | Without Coverage |
| Under 6 Years | 27 (100.0%) | 0 (0.0%) |
| 6 to 18 Years | 285 (90.5%) | 30 (9.5%) |
| 19 to 25 Years | 93 (57.4%) | 69 (42.6%) |
| 26 to 34 Years | 206 (69.6%) | 90 (30.4%) |
| 35 to 44 Years | 33 (39.3%) | 51 (60.7%) |
| 45 to 54 Years | 89 (70.6%) | 37 (29.4%) |
| 55 to 64 Years | 201 (100.0%) | 0 (0.0%) |
| 65 to 74 Years | 143 (100.0%) | 0 (0.0%) |
| 75 Years and older | 129 (100.0%) | 0 (0.0%) |
| Total | 1,206 (81.3%) | 277 (18.7%) |
Health Insurance Coverage by Citizenship Status in Pirtleville
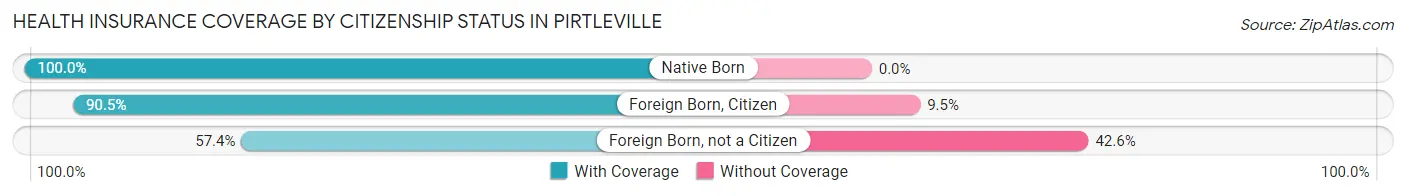
| Citizenship Status | With Coverage | Without Coverage |
| Native Born | 27 (100.0%) | 0 (0.0%) |
| Foreign Born, Citizen | 285 (90.5%) | 30 (9.5%) |
| Foreign Born, not a Citizen | 93 (57.4%) | 69 (42.6%) |
Health Insurance Coverage by Household Income in Pirtleville
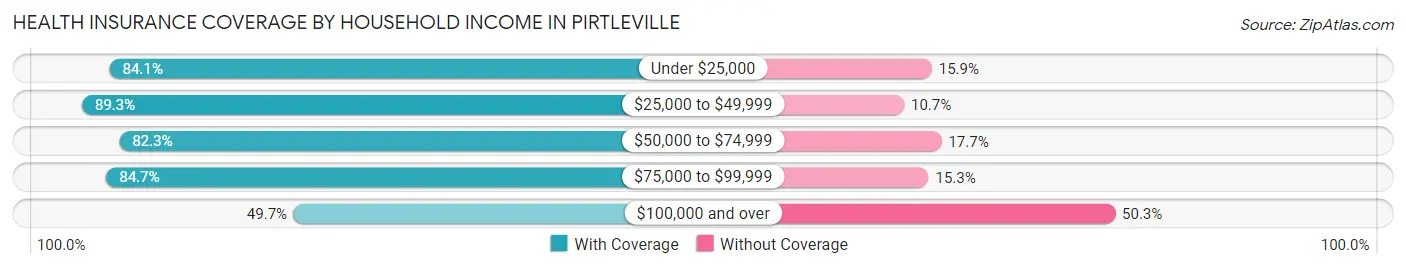
| Household Income | With Coverage | Without Coverage |
| Under $25,000 | 132 (84.1%) | 25 (15.9%) |
| $25,000 to $49,999 | 408 (89.3%) | 49 (10.7%) |
| $50,000 to $74,999 | 153 (82.3%) | 33 (17.7%) |
| $75,000 to $99,999 | 420 (84.7%) | 76 (15.3%) |
| $100,000 and over | 93 (49.7%) | 94 (50.3%) |
Public vs Private Health Insurance Coverage by Age in Pirtleville
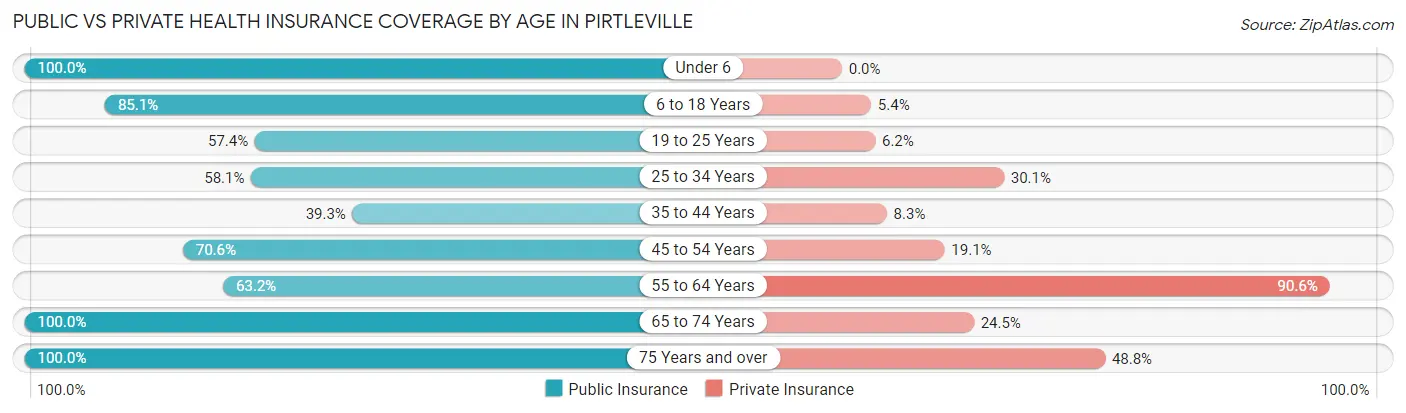
| Age Bracket | Public Insurance | Private Insurance |
| Under 6 | 27 (100.0%) | 0 (0.0%) |
| 6 to 18 Years | 268 (85.1%) | 17 (5.4%) |
| 19 to 25 Years | 93 (57.4%) | 10 (6.2%) |
| 25 to 34 Years | 172 (58.1%) | 89 (30.1%) |
| 35 to 44 Years | 33 (39.3%) | 7 (8.3%) |
| 45 to 54 Years | 89 (70.6%) | 24 (19.1%) |
| 55 to 64 Years | 127 (63.2%) | 182 (90.5%) |
| 65 to 74 Years | 143 (100.0%) | 35 (24.5%) |
| 75 Years and over | 129 (100.0%) | 63 (48.8%) |
| Total | 1,081 (72.9%) | 427 (28.8%) |
Disability Status by Sex by Age in Pirtleville
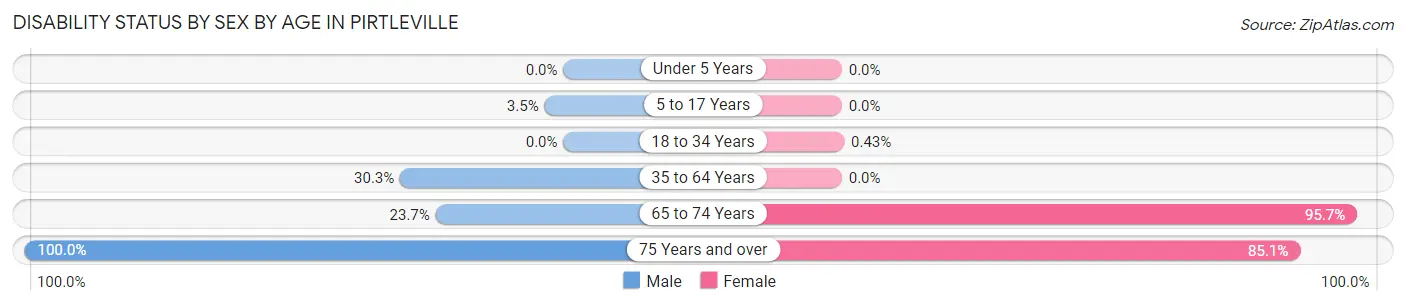
| Age Bracket | Male | Female |
| Under 5 Years | 0 (0.0%) | 0 (0.0%) |
| 5 to 17 Years | 9 (3.5%) | 0 (0.0%) |
| 18 to 34 Years | 0 (0.0%) | 1 (0.4%) |
| 35 to 64 Years | 50 (30.3%) | 0 (0.0%) |
| 65 to 74 Years | 23 (23.7%) | 44 (95.7%) |
| 75 Years and over | 62 (100.0%) | 57 (85.1%) |
Disability Class by Sex by Age in Pirtleville
Disability Class: Hearing Difficulty
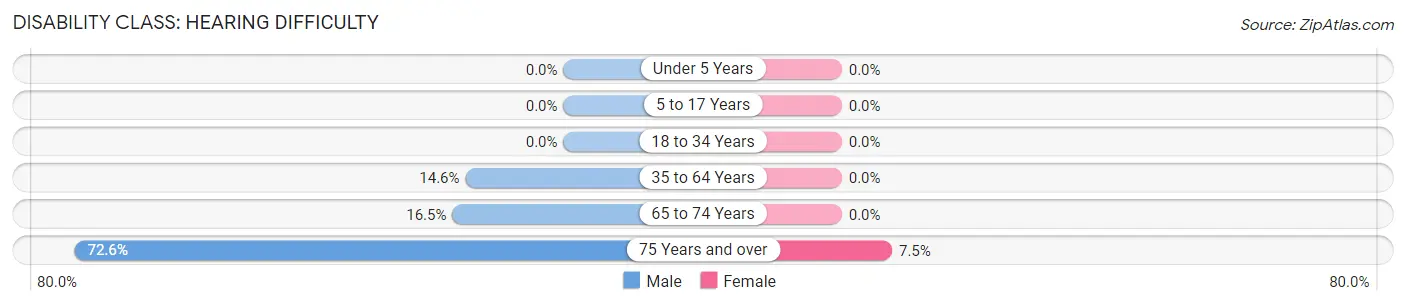
| Age Bracket | Male | Female |
| Under 5 Years | 0 (0.0%) | 0 (0.0%) |
| 5 to 17 Years | 0 (0.0%) | 0 (0.0%) |
| 18 to 34 Years | 0 (0.0%) | 0 (0.0%) |
| 35 to 64 Years | 24 (14.5%) | 0 (0.0%) |
| 65 to 74 Years | 16 (16.5%) | 0 (0.0%) |
| 75 Years and over | 45 (72.6%) | 5 (7.5%) |
Disability Class: Vision Difficulty
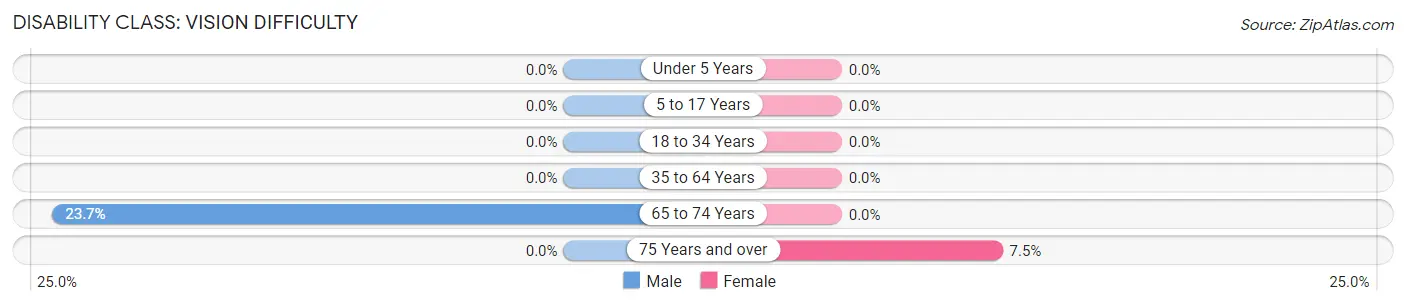
| Age Bracket | Male | Female |
| Under 5 Years | 0 (0.0%) | 0 (0.0%) |
| 5 to 17 Years | 0 (0.0%) | 0 (0.0%) |
| 18 to 34 Years | 0 (0.0%) | 0 (0.0%) |
| 35 to 64 Years | 0 (0.0%) | 0 (0.0%) |
| 65 to 74 Years | 23 (23.7%) | 0 (0.0%) |
| 75 Years and over | 0 (0.0%) | 5 (7.5%) |
Disability Class: Cognitive Difficulty
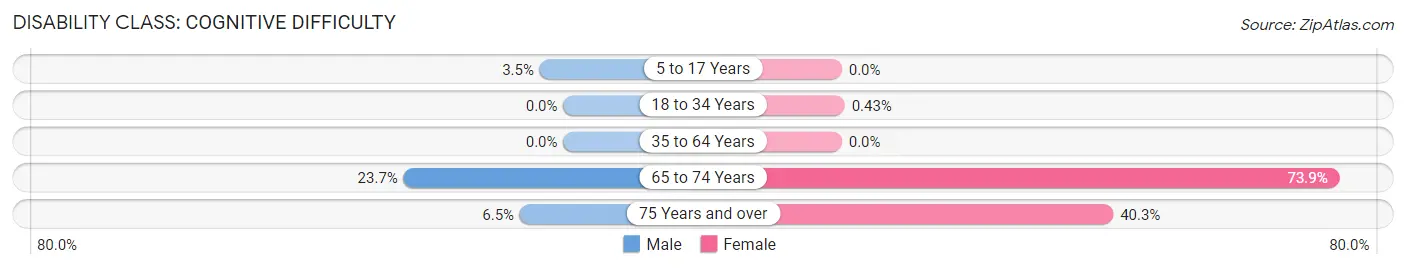
| Age Bracket | Male | Female |
| 5 to 17 Years | 9 (3.5%) | 0 (0.0%) |
| 18 to 34 Years | 0 (0.0%) | 1 (0.4%) |
| 35 to 64 Years | 0 (0.0%) | 0 (0.0%) |
| 65 to 74 Years | 23 (23.7%) | 34 (73.9%) |
| 75 Years and over | 4 (6.5%) | 27 (40.3%) |
Disability Class: Ambulatory Difficulty
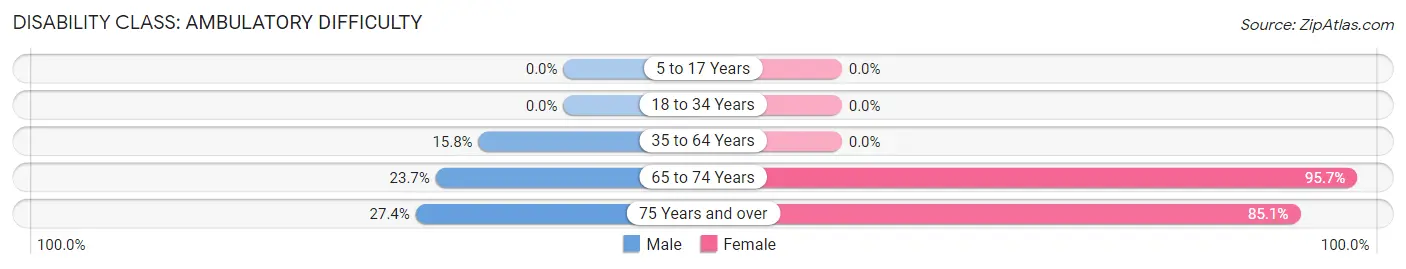
| Age Bracket | Male | Female |
| 5 to 17 Years | 0 (0.0%) | 0 (0.0%) |
| 18 to 34 Years | 0 (0.0%) | 0 (0.0%) |
| 35 to 64 Years | 26 (15.8%) | 0 (0.0%) |
| 65 to 74 Years | 23 (23.7%) | 44 (95.7%) |
| 75 Years and over | 17 (27.4%) | 57 (85.1%) |
Disability Class: Self-Care Difficulty
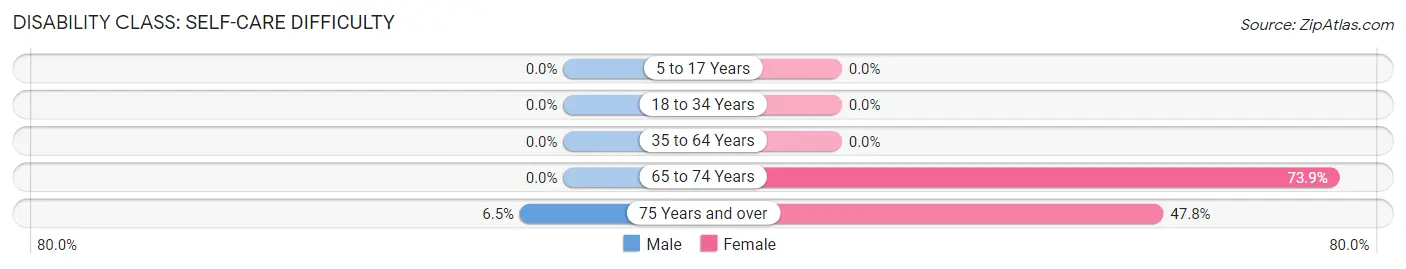
| Age Bracket | Male | Female |
| 5 to 17 Years | 0 (0.0%) | 0 (0.0%) |
| 18 to 34 Years | 0 (0.0%) | 0 (0.0%) |
| 35 to 64 Years | 0 (0.0%) | 0 (0.0%) |
| 65 to 74 Years | 0 (0.0%) | 34 (73.9%) |
| 75 Years and over | 4 (6.5%) | 32 (47.8%) |
Technology Access in Pirtleville
Computing Device Access in Pirtleville
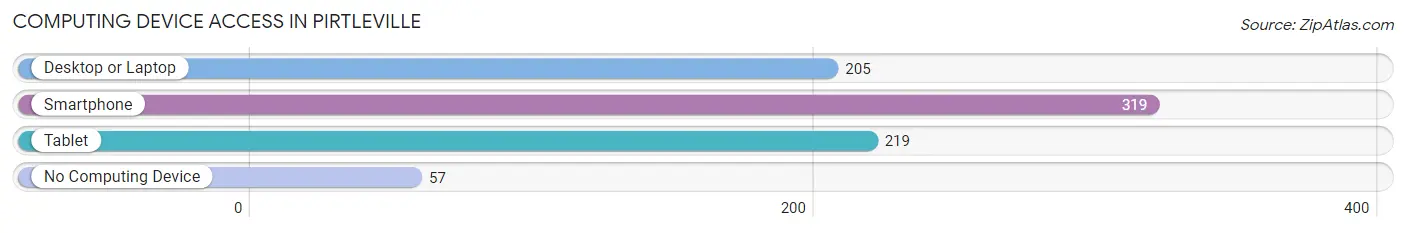
| Device Type | # Households | % Households |
| Desktop or Laptop | 205 | 51.6% |
| Smartphone | 319 | 80.3% |
| Tablet | 219 | 55.2% |
| No Computing Device | 57 | 14.4% |
| Total | 397 | 100.0% |
Internet Access in Pirtleville
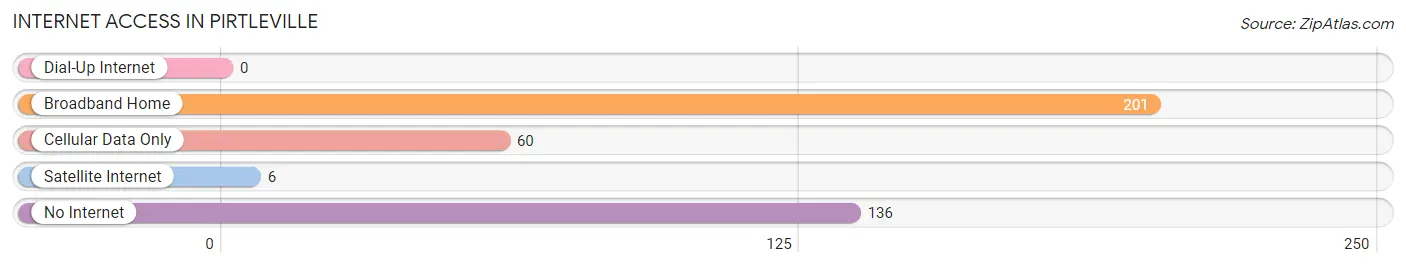
| Internet Type | # Households | % Households |
| Dial-Up Internet | 0 | 0.0% |
| Broadband Home | 201 | 50.6% |
| Cellular Data Only | 60 | 15.1% |
| Satellite Internet | 6 | 1.5% |
| No Internet | 136 | 34.3% |
| Total | 397 | 100.0% |
Pirtleville Summary
Pirtleville is a small unincorporated community located in Cochise County, Arizona. It is situated in the San Pedro Valley, approximately 10 miles south of the city of Douglas. The population of Pirtleville was estimated to be 1,845 in 2019.
History
Pirtleville was founded in 1881 by William Pirtle, a rancher from Texas. He named the town after himself and established a post office in 1883. The town was originally a stagecoach stop and a trading post for local ranchers. In the early 1900s, Pirtleville became a popular destination for tourists, who came to enjoy the area’s mild climate and scenic beauty.
In the 1920s, Pirtleville experienced a period of growth and development. The town was home to several businesses, including a hotel, a general store, a bank, and a movie theater. The town also had a school, a library, and a hospital.
Geography
Pirtleville is located in the San Pedro Valley, which is part of the Sonoran Desert. The town is situated at an elevation of 3,845 feet and is surrounded by mountains and hills. The San Pedro River runs through the valley, providing a source of water for the town.
The climate in Pirtleville is arid and semi-arid, with hot summers and mild winters. The average annual temperature is 68°F, and the average annual precipitation is 11.5 inches.
Economy
The economy of Pirtleville is largely based on agriculture and ranching. The town is home to several farms and ranches, which produce a variety of crops, including alfalfa, cotton, and wheat. The town also has a few small businesses, including a gas station, a grocery store, and a restaurant.
Demographics
As of 2019, the population of Pirtleville was estimated to be 1,845. The racial makeup of the town was 79.3% White, 0.2% African American, 0.2% Native American, 0.2% Asian, 0.1% Pacific Islander, 17.7% from other races, and 2.5% from two or more races. Hispanic or Latino of any race were 33.2% of the population.
The median household income in Pirtleville was $30,938 in 2019. The per capita income was $14,945. About 18.3% of the population was below the poverty line.
Conclusion
Pirtleville is a small unincorporated community located in Cochise County, Arizona. It was founded in 1881 by William Pirtle and is situated in the San Pedro Valley. The town has a population of 1,845 and is largely based on agriculture and ranching. The town has a diverse population, with a median household income of $30,938 and a per capita income of $14,945.
Common Questions
What is Per Capita Income in Pirtleville?
Per Capita income in Pirtleville is $17,801.
What is the Median Family Income in Pirtleville?
Median Family Income in Pirtleville is $63,798.
What is the Median Household income in Pirtleville?
Median Household Income in Pirtleville is $48,594.
What is Inequality or Gini Index in Pirtleville?
Inequality or Gini Index in Pirtleville is 0.42.
What is the Total Population of Pirtleville?
Total Population of Pirtleville is 1,483.
What is the Total Male Population of Pirtleville?
Total Male Population of Pirtleville is 814.
What is the Total Female Population of Pirtleville?
Total Female Population of Pirtleville is 669.
What is the Ratio of Males per 100 Females in Pirtleville?
There are 121.67 Males per 100 Females in Pirtleville.
What is the Ratio of Females per 100 Males in Pirtleville?
There are 82.19 Females per 100 Males in Pirtleville.
What is the Median Population Age in Pirtleville?
Median Population Age in Pirtleville is 32.4 Years.
What is the Average Family Size in Pirtleville
Average Family Size in Pirtleville is 4.3 People.
What is the Average Household Size in Pirtleville
Average Household Size in Pirtleville is 3.7 People.
How Large is the Labor Force in Pirtleville?
There are 606 People in the Labor Forcein in Pirtleville.
What is the Percentage of People in the Labor Force in Pirtleville?
52.7% of People are in the Labor Force in Pirtleville.
What is the Unemployment Rate in Pirtleville?
Unemployment Rate in Pirtleville is 21.1%.