Zip Codes with the Highest Percentage of Population Employed in Food Preparation & Serving in Prescott Valley, AZ
RELATED REPORTS & OPTIONS
Food Preparation & Serving
Prescott Valley
Compare Zip Codes
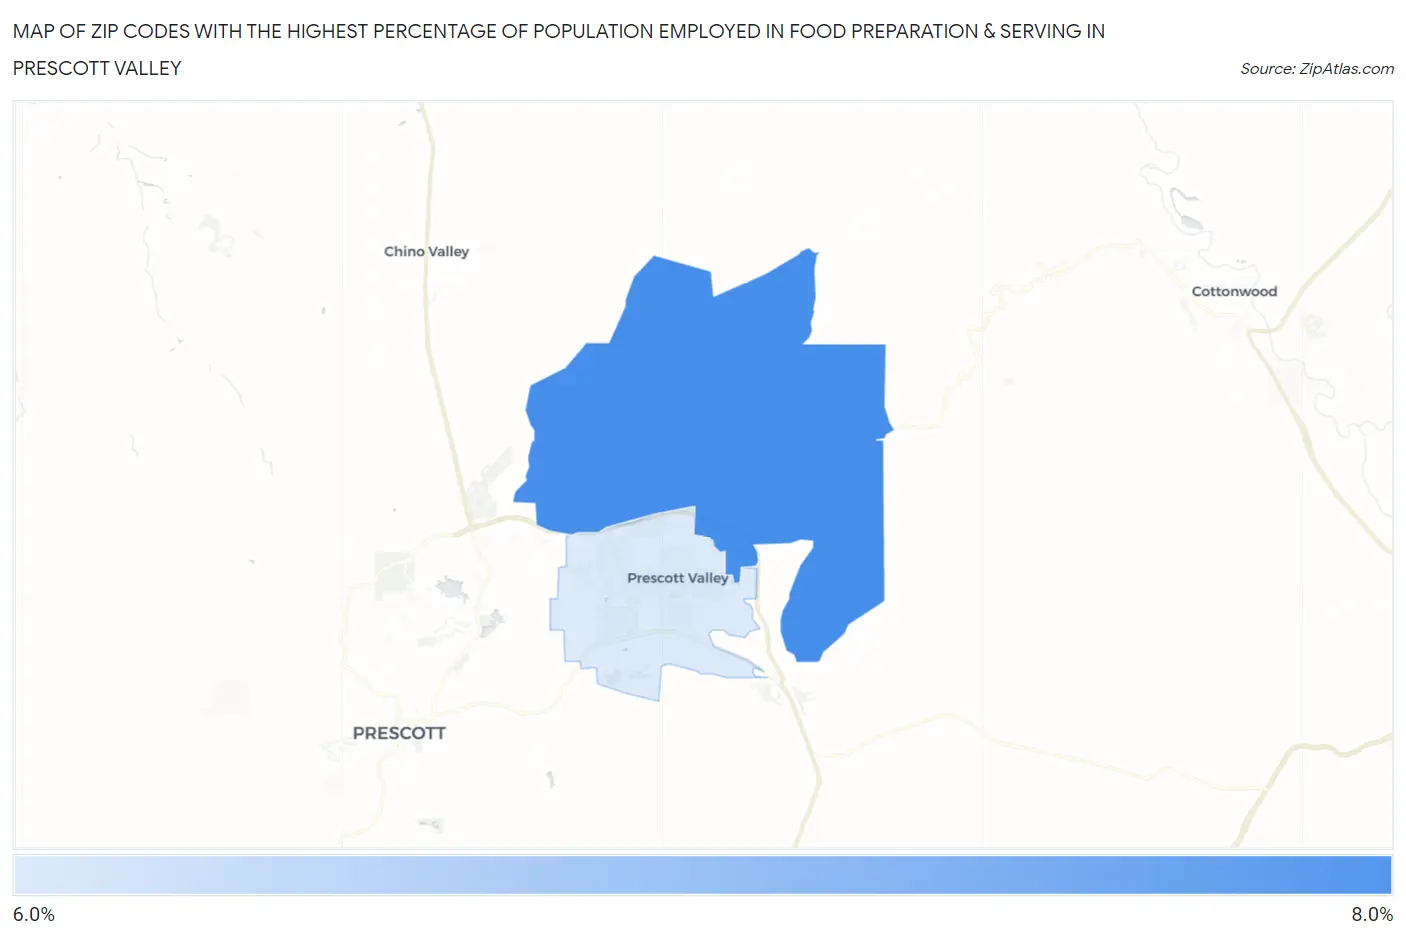
Map of Zip Codes with the Highest Percentage of Population Employed in Food Preparation & Serving in Prescott Valley
6.1%
6.8%
Zip Codes with the Highest Percentage of Population Employed in Food Preparation & Serving in Prescott Valley, AZ
| Zip Code | % Employed | vs State | vs National | |
| 1. | 86315 | 6.8% | 5.7%(+1.13)#112 | 5.3%(+1.51)#7,067 |
| 2. | 86314 | 6.1% | 5.7%(+0.386)#149 | 5.3%(+0.768)#9,166 |
1
Common Questions
What are the Top Zip Codes with the Highest Percentage of Population Employed in Food Preparation & Serving in Prescott Valley, AZ?
Top Zip Codes with the Highest Percentage of Population Employed in Food Preparation & Serving in Prescott Valley, AZ are:
What zip code has the Highest Percentage of Population Employed in Food Preparation & Serving in Prescott Valley, AZ?
86315 has the Highest Percentage of Population Employed in Food Preparation & Serving in Prescott Valley, AZ with 6.8%.
What is the Percentage of Population Employed in Food Preparation & Serving in Prescott Valley, AZ?
Percentage of Population Employed in Food Preparation & Serving in Prescott Valley is 6.3%.
What is the Percentage of Population Employed in Food Preparation & Serving in Arizona?
Percentage of Population Employed in Food Preparation & Serving in Arizona is 5.7%.
What is the Percentage of Population Employed in Food Preparation & Serving in the United States?
Percentage of Population Employed in Food Preparation & Serving in the United States is 5.3%.