Sells, AZ Map & Demographics
Sells Map
Sells Overview
$12,560
PER CAPITA INCOME
$43,452
AVG FAMILY INCOME
$44,038
AVG HOUSEHOLD INCOME
33.1%
WAGE / INCOME GAP [ % ]
66.9¢/ $1
WAGE / INCOME GAP [ $ ]
0.46
INEQUALITY / GINI INDEX
2,422
TOTAL POPULATION
1,241
MALE POPULATION
1,181
FEMALE POPULATION
105.08
MALES / 100 FEMALES
95.17
FEMALES / 100 MALES
24.8
MEDIAN AGE
4.1
AVG FAMILY SIZE
3.9
AVG HOUSEHOLD SIZE
652
LABOR FORCE [ PEOPLE ]
39.5%
PERCENT IN LABOR FORCE
15.5%
UNEMPLOYMENT RATE
Sells Zip Codes
Sells Area Codes
Income in Sells
Income Overview in Sells
Per Capita Income in Sells is $12,560, while median incomes of families and households are $43,452 and $44,038 respectively.
| Characteristic | Number | Measure |
| Per Capita Income | 2,422 | $12,560 |
| Median Family Income | 480 | $43,452 |
| Mean Family Income | 480 | $48,450 |
| Median Household Income | 586 | $44,038 |
| Mean Household Income | 586 | $49,269 |
| Income Deficit | 480 | $0 |
| Wage / Income Gap (%) | 2,422 | 33.14% |
| Wage / Income Gap ($) | 2,422 | 66.86¢ per $1 |
| Gini / Inequality Index | 2,422 | 0.46 |
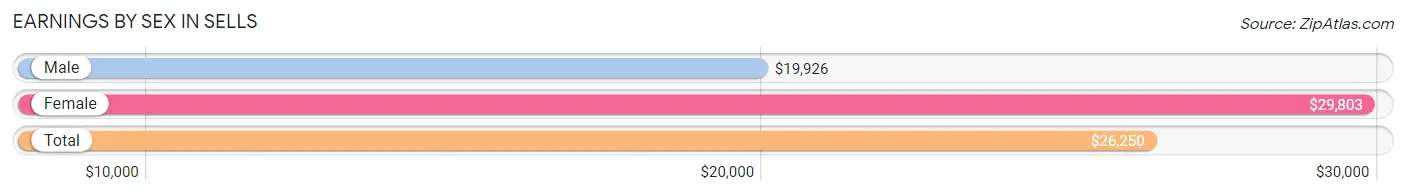
Earnings by Sex in Sells
Average Earnings in Sells are $26,250, $19,926 for men and $29,803 for women, a difference of 33.1%.
| Sex | Number | Average Earnings |
| Male | 333 (44.3%) | $19,926 |
| Female | 418 (55.7%) | $29,803 |
| Total | 751 (100.0%) | $26,250 |
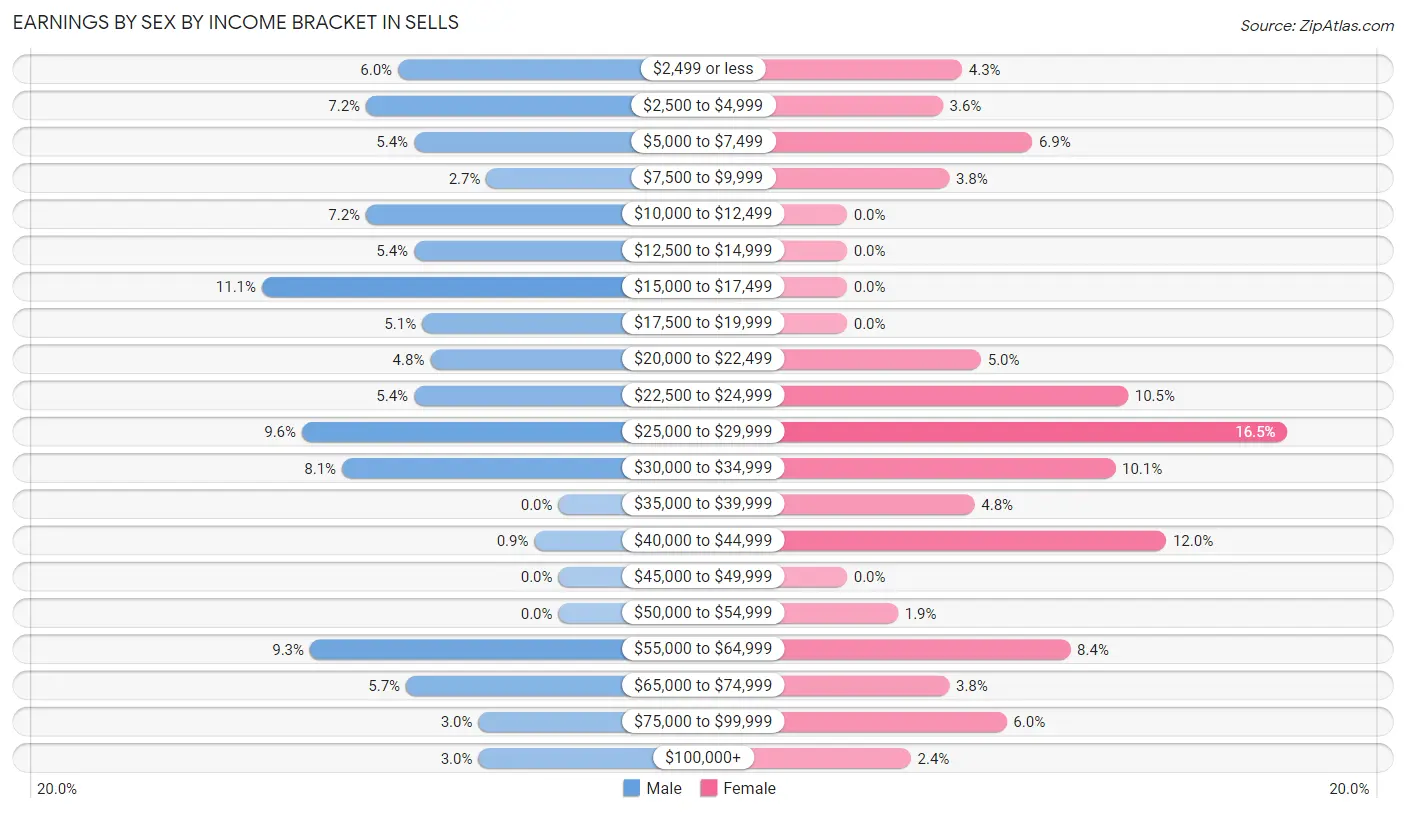
Earnings by Sex by Income Bracket in Sells
The most common earnings brackets in Sells are $15,000 to $17,499 for men (37 | 11.1%) and $25,000 to $29,999 for women (69 | 16.5%).
| Income | Male | Female |
| $2,499 or less | 20 (6.0%) | 18 (4.3%) |
| $2,500 to $4,999 | 24 (7.2%) | 15 (3.6%) |
| $5,000 to $7,499 | 18 (5.4%) | 29 (6.9%) |
| $7,500 to $9,999 | 9 (2.7%) | 16 (3.8%) |
| $10,000 to $12,499 | 24 (7.2%) | 0 (0.0%) |
| $12,500 to $14,999 | 18 (5.4%) | 0 (0.0%) |
| $15,000 to $17,499 | 37 (11.1%) | 0 (0.0%) |
| $17,500 to $19,999 | 17 (5.1%) | 0 (0.0%) |
| $20,000 to $22,499 | 16 (4.8%) | 21 (5.0%) |
| $22,500 to $24,999 | 18 (5.4%) | 44 (10.5%) |
| $25,000 to $29,999 | 32 (9.6%) | 69 (16.5%) |
| $30,000 to $34,999 | 27 (8.1%) | 42 (10.1%) |
| $35,000 to $39,999 | 0 (0.0%) | 20 (4.8%) |
| $40,000 to $44,999 | 3 (0.9%) | 50 (12.0%) |
| $45,000 to $49,999 | 0 (0.0%) | 0 (0.0%) |
| $50,000 to $54,999 | 0 (0.0%) | 8 (1.9%) |
| $55,000 to $64,999 | 31 (9.3%) | 35 (8.4%) |
| $65,000 to $74,999 | 19 (5.7%) | 16 (3.8%) |
| $75,000 to $99,999 | 10 (3.0%) | 25 (6.0%) |
| $100,000+ | 10 (3.0%) | 10 (2.4%) |
| Total | 333 (100.0%) | 418 (100.0%) |
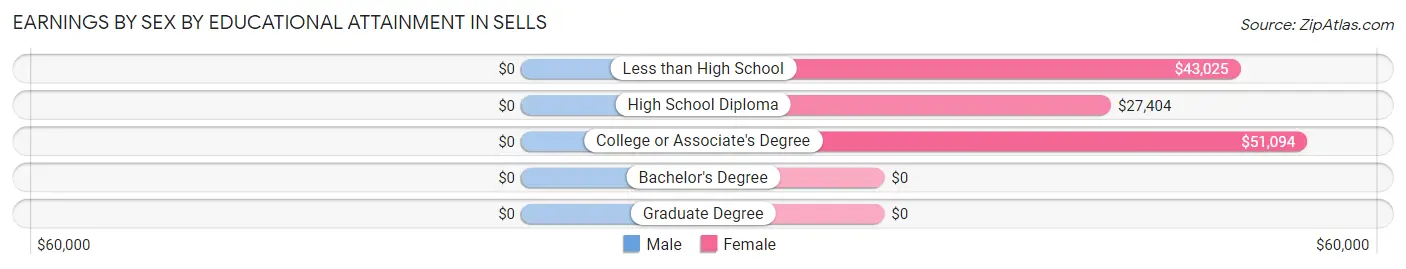
Earnings by Sex by Educational Attainment in Sells
| Educational Attainment | Male Income | Female Income |
| Less than High School | - | - |
| High School Diploma | - | - |
| College or Associate's Degree | - | - |
| Bachelor's Degree | - | - |
| Graduate Degree | - | - |
| Total | $24,514 | $30,962 |
Family Income in Sells
Family Income Brackets in Sells
According to the Sells family income data, there are 110 families falling into the $35,000 to $49,999 income range, which is the most common income bracket and makes up 22.9% of all families.
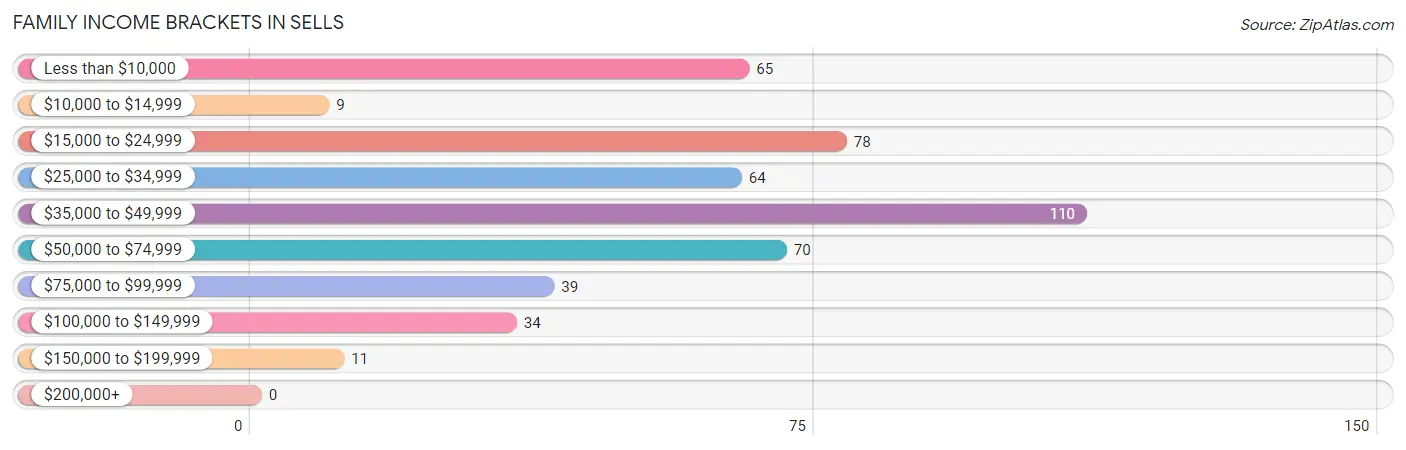
| Income Bracket | # Families | % Families |
| Less than $10,000 | 65 | 13.5% |
| $10,000 to $14,999 | 9 | 1.9% |
| $15,000 to $24,999 | 78 | 16.3% |
| $25,000 to $34,999 | 64 | 13.3% |
| $35,000 to $49,999 | 110 | 22.9% |
| $50,000 to $74,999 | 70 | 14.6% |
| $75,000 to $99,999 | 39 | 8.1% |
| $100,000 to $149,999 | 34 | 7.1% |
| $150,000 to $199,999 | 11 | 2.3% |
| $200,000+ | 0 | 0.0% |
Family Income by Famaliy Size in Sells
2-person families (104 | 21.7%) account for the highest median family income in Sells with $47,700 per family, while 2-person families (104 | 21.7%) have the highest median income of $23,850 per family member.
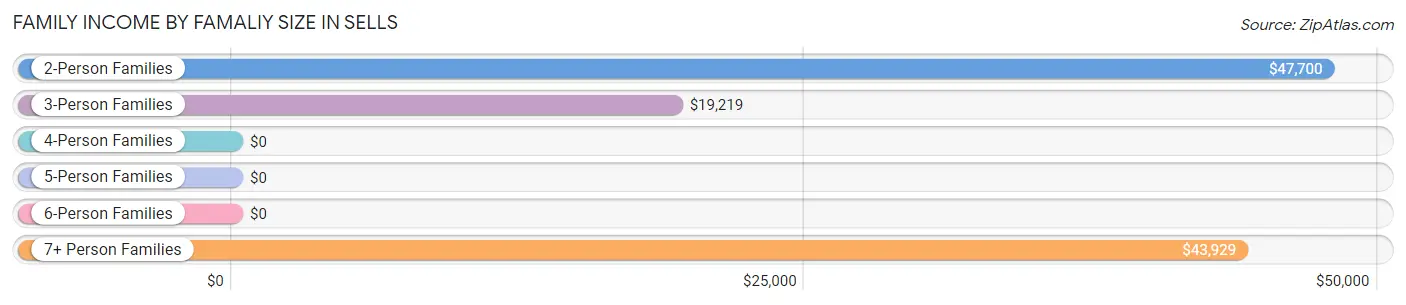
| Income Bracket | # Families | Median Income |
| 2-Person Families | 104 (21.7%) | $47,700 |
| 3-Person Families | 92 (19.2%) | $19,219 |
| 4-Person Families | 108 (22.5%) | $0 |
| 5-Person Families | 43 (9.0%) | $0 |
| 6-Person Families | 19 (4.0%) | $0 |
| 7+ Person Families | 114 (23.7%) | $43,929 |
| Total | 480 (100.0%) | $43,452 |
Family Income by Number of Earners in Sells
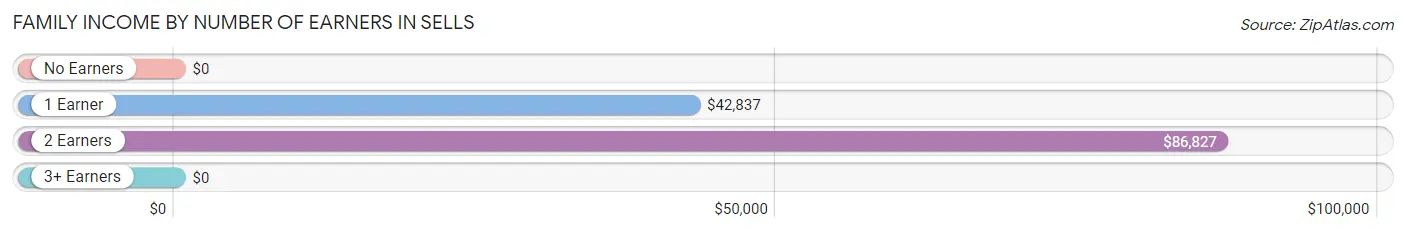
| Number of Earners | # Families | Median Income |
| No Earners | 84 (17.5%) | $0 |
| 1 Earner | 247 (51.5%) | $42,837 |
| 2 Earners | 149 (31.0%) | $86,827 |
| 3+ Earners | 0 (0.0%) | $0 |
| Total | 480 (100.0%) | $43,452 |
Household Income in Sells
Household Income Brackets in Sells
With 139 households falling in the category, the $50,000 to $74,999 income range is the most frequent in Sells, accounting for 23.7% of all households.
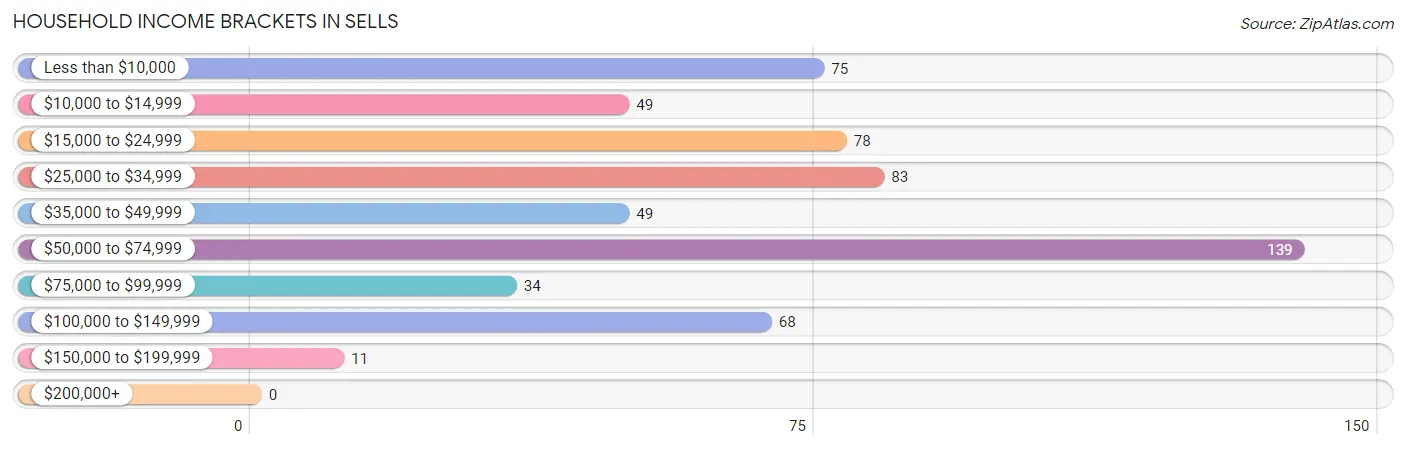
| Income Bracket | # Households | % Households |
| Less than $10,000 | 75 | 12.8% |
| $10,000 to $14,999 | 49 | 8.4% |
| $15,000 to $24,999 | 78 | 13.3% |
| $25,000 to $34,999 | 83 | 14.2% |
| $35,000 to $49,999 | 49 | 8.4% |
| $50,000 to $74,999 | 139 | 23.7% |
| $75,000 to $99,999 | 34 | 5.8% |
| $100,000 to $149,999 | 68 | 11.6% |
| $150,000 to $199,999 | 11 | 1.9% |
| $200,000+ | 0 | 0.0% |
Household Income by Householder Age in Sells
The median household income in Sells is $44,038, with the highest median household income of $49,271 found in the 65+ years age bracket for the primary householder. A total of 129 households (22.0%) fall into this category. Meanwhile, the 15 to 24 years age bracket for the primary householder has the lowest median household income of $0, with 18 households (3.1%) in this group.
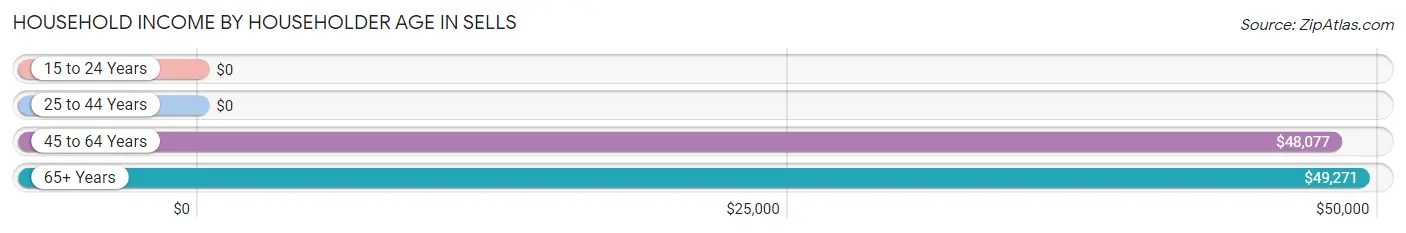
| Income Bracket | # Households | Median Income |
| 15 to 24 Years | 18 (3.1%) | $0 |
| 25 to 44 Years | 119 (20.3%) | $0 |
| 45 to 64 Years | 320 (54.6%) | $48,077 |
| 65+ Years | 129 (22.0%) | $49,271 |
| Total | 586 (100.0%) | $44,038 |
Poverty in Sells
Income Below Poverty by Sex and Age in Sells
With 45.0% poverty level for males and 58.7% for females among the residents of Sells, 15 year old males and 5 year old females are the most vulnerable to poverty, with 31 males (100.0%) and 35 females (100.0%) in their respective age groups living below the poverty level.
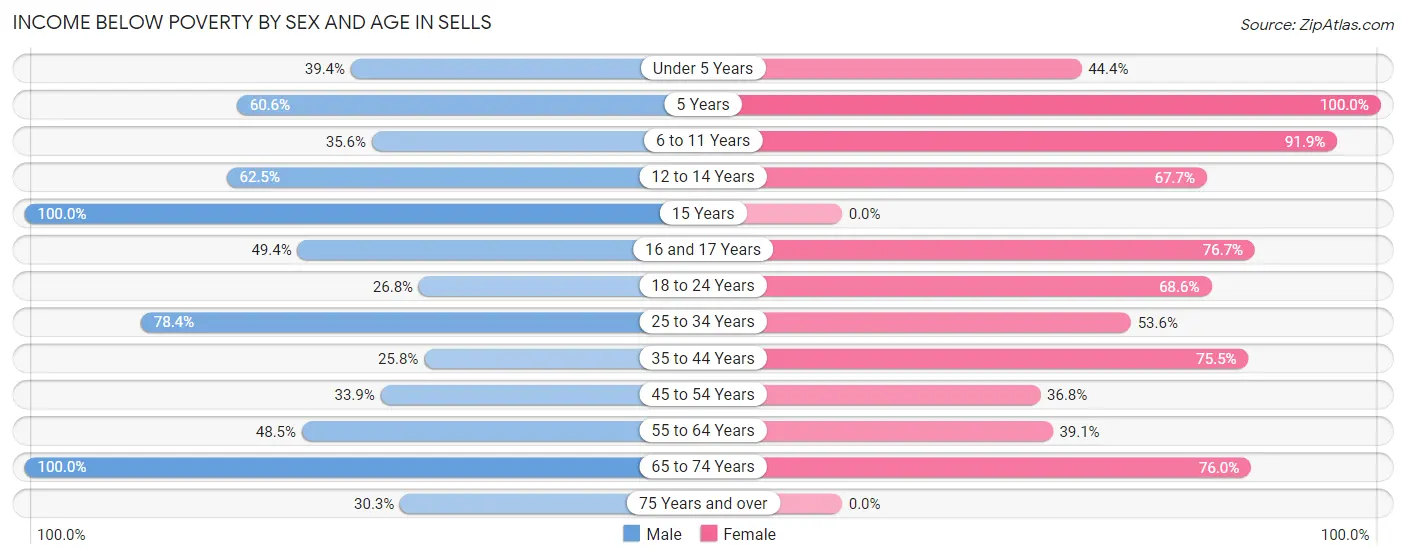
| Age Bracket | Male | Female |
| Under 5 Years | 71 (39.4%) | 44 (44.4%) |
| 5 Years | 20 (60.6%) | 35 (100.0%) |
| 6 to 11 Years | 48 (35.6%) | 114 (91.9%) |
| 12 to 14 Years | 25 (62.5%) | 21 (67.7%) |
| 15 Years | 31 (100.0%) | 0 (0.0%) |
| 16 and 17 Years | 38 (49.3%) | 46 (76.7%) |
| 18 to 24 Years | 37 (26.8%) | 96 (68.6%) |
| 25 to 34 Years | 69 (78.4%) | 96 (53.6%) |
| 35 to 44 Years | 23 (25.8%) | 40 (75.5%) |
| 45 to 54 Years | 38 (33.9%) | 53 (36.8%) |
| 55 to 64 Years | 50 (48.5%) | 61 (39.1%) |
| 65 to 74 Years | 30 (100.0%) | 60 (75.9%) |
| 75 Years and over | 10 (30.3%) | 0 (0.0%) |
| Total | 490 (45.0%) | 666 (58.7%) |
Income Above Poverty by Sex and Age in Sells
According to the poverty statistics in Sells, males aged 35 to 44 years and females aged 15 years are the age groups that are most secure financially, with 74.2% of males and 100.0% of females in these age groups living above the poverty line.
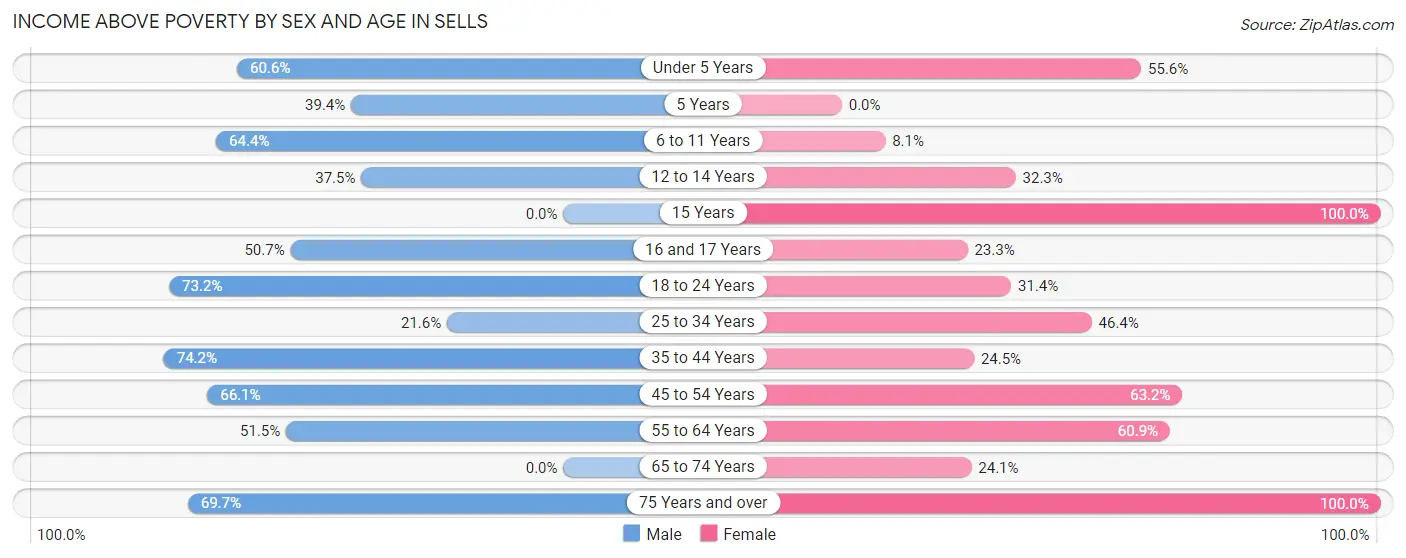
| Age Bracket | Male | Female |
| Under 5 Years | 109 (60.6%) | 55 (55.6%) |
| 5 Years | 13 (39.4%) | 0 (0.0%) |
| 6 to 11 Years | 87 (64.4%) | 10 (8.1%) |
| 12 to 14 Years | 15 (37.5%) | 10 (32.3%) |
| 15 Years | 0 (0.0%) | 12 (100.0%) |
| 16 and 17 Years | 39 (50.6%) | 14 (23.3%) |
| 18 to 24 Years | 101 (73.2%) | 44 (31.4%) |
| 25 to 34 Years | 19 (21.6%) | 83 (46.4%) |
| 35 to 44 Years | 66 (74.2%) | 13 (24.5%) |
| 45 to 54 Years | 74 (66.1%) | 91 (63.2%) |
| 55 to 64 Years | 53 (51.5%) | 95 (60.9%) |
| 65 to 74 Years | 0 (0.0%) | 19 (24.0%) |
| 75 Years and over | 23 (69.7%) | 23 (100.0%) |
| Total | 599 (55.0%) | 469 (41.3%) |
Income Below Poverty Among Married-Couple Families in Sells
The poverty statistics for married-couple families in Sells show that 32.7% or 32 of the total 98 families live below the poverty line. Families with 3 or 4 children have the highest poverty rate of 100.0%, comprising of 14 families. On the other hand, families with no children have the lowest poverty rate of 0.0%, which includes 0 families.
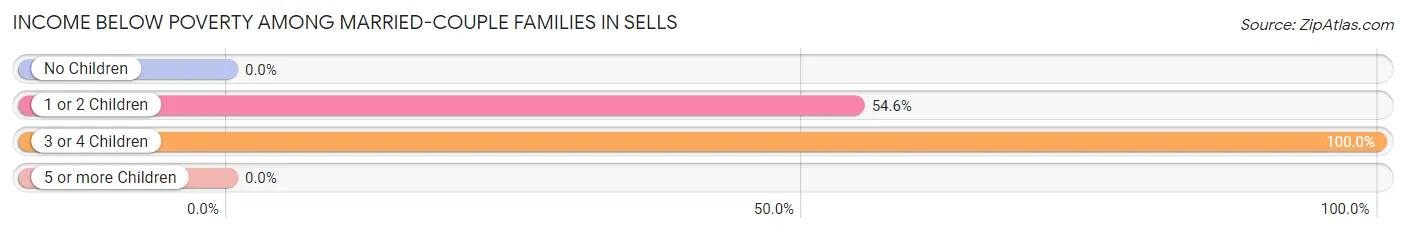
| Children | Above Poverty | Below Poverty |
| No Children | 33 (100.0%) | 0 (0.0%) |
| 1 or 2 Children | 15 (45.5%) | 18 (54.5%) |
| 3 or 4 Children | 0 (0.0%) | 14 (100.0%) |
| 5 or more Children | 18 (100.0%) | 0 (0.0%) |
| Total | 66 (67.3%) | 32 (32.7%) |
Income Below Poverty Among Single-Parent Households in Sells
According to the poverty data in Sells, 19.7% or 14 single-father households and 59.5% or 185 single-mother households are living below the poverty line. Among single-father households, those with no children have the highest poverty rate, with 14 households (37.8%) experiencing poverty. Likewise, among single-mother households, those with 5 or more children have the highest poverty rate, with 70 households (89.7%) falling below the poverty line.
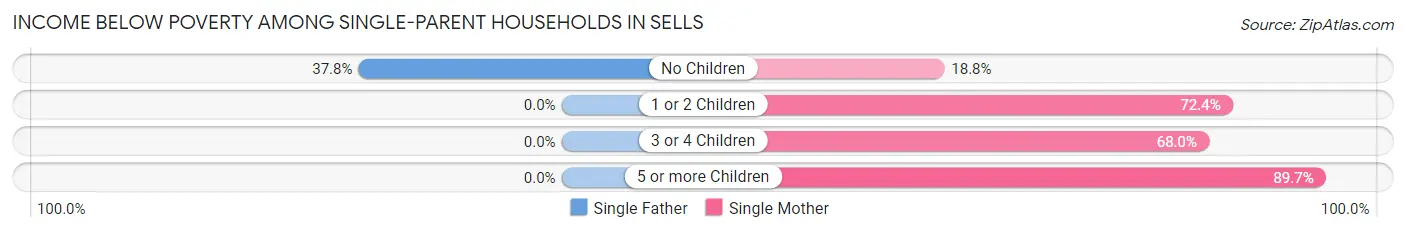
| Children | Single Father | Single Mother |
| No Children | 14 (37.8%) | 18 (18.8%) |
| 1 or 2 Children | 0 (0.0%) | 63 (72.4%) |
| 3 or 4 Children | 0 (0.0%) | 34 (68.0%) |
| 5 or more Children | 0 (0.0%) | 70 (89.7%) |
| Total | 14 (19.7%) | 185 (59.5%) |
Income Below Poverty Among Married-Couple vs Single-Parent Households in Sells
The poverty data for Sells shows that 32 of the married-couple family households (32.7%) and 199 of the single-parent households (52.1%) are living below the poverty level. Within the married-couple family households, those with 3 or 4 children have the highest poverty rate, with 14 households (100.0%) falling below the poverty line. Among the single-parent households, those with 5 or more children have the highest poverty rate, with 70 household (89.7%) living below poverty.
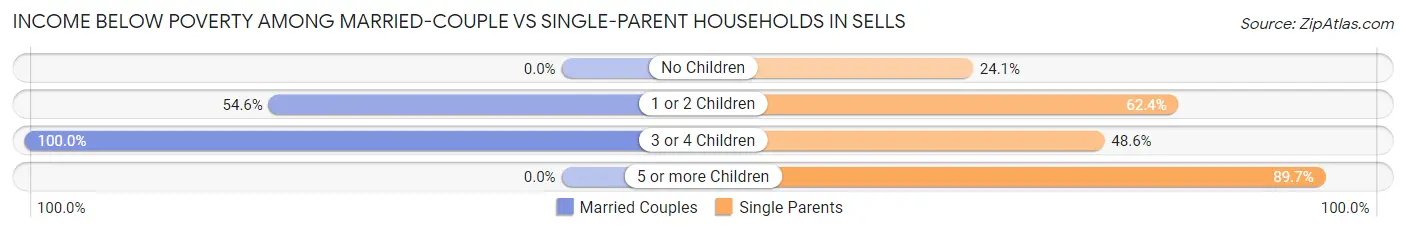
| Children | Married-Couple Families | Single-Parent Households |
| No Children | 0 (0.0%) | 32 (24.1%) |
| 1 or 2 Children | 18 (54.5%) | 63 (62.4%) |
| 3 or 4 Children | 14 (100.0%) | 34 (48.6%) |
| 5 or more Children | 0 (0.0%) | 70 (89.7%) |
| Total | 32 (32.7%) | 199 (52.1%) |
Race in Sells
The most populous races in Sells are Native / Alaskan (2,075 | 85.7%), White / Caucasian (209 | 8.6%), and Hispanic or Latino (119 | 4.9%).
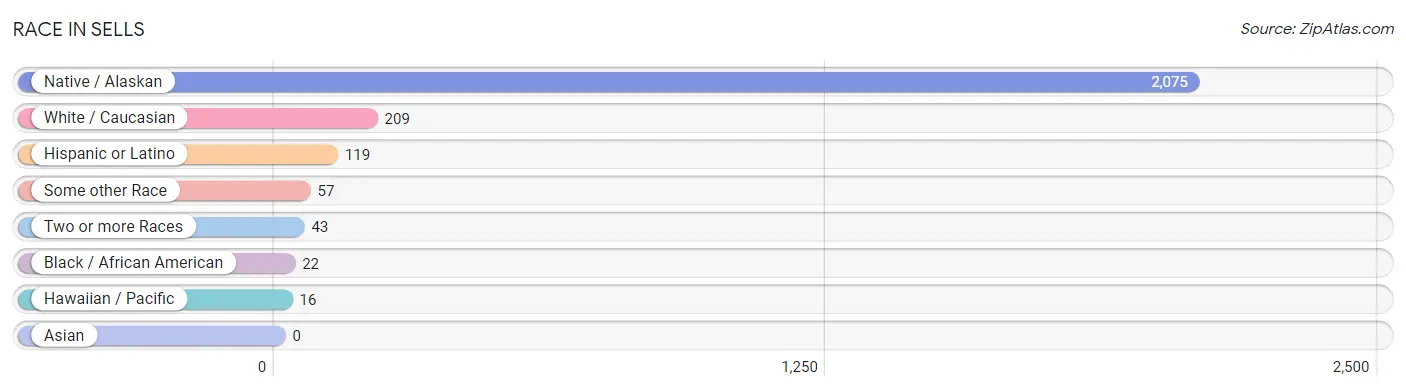
| Race | # Population | % Population |
| Asian | 0 | 0.0% |
| Black / African American | 22 | 0.9% |
| Hawaiian / Pacific | 16 | 0.7% |
| Hispanic or Latino | 119 | 4.9% |
| Native / Alaskan | 2,075 | 85.7% |
| White / Caucasian | 209 | 8.6% |
| Two or more Races | 43 | 1.8% |
| Some other Race | 57 | 2.4% |
| Total | 2,422 | 100.0% |
Ancestry in Sells
The most populous ancestries reported in Sells are Tohono O'Odham (1,912 | 78.9%), Mexican (92 | 3.8%), Jamaican (40 | 1.7%), Pima (39 | 1.6%), and Italian (38 | 1.6%), together accounting for 87.6% of all Sells residents.
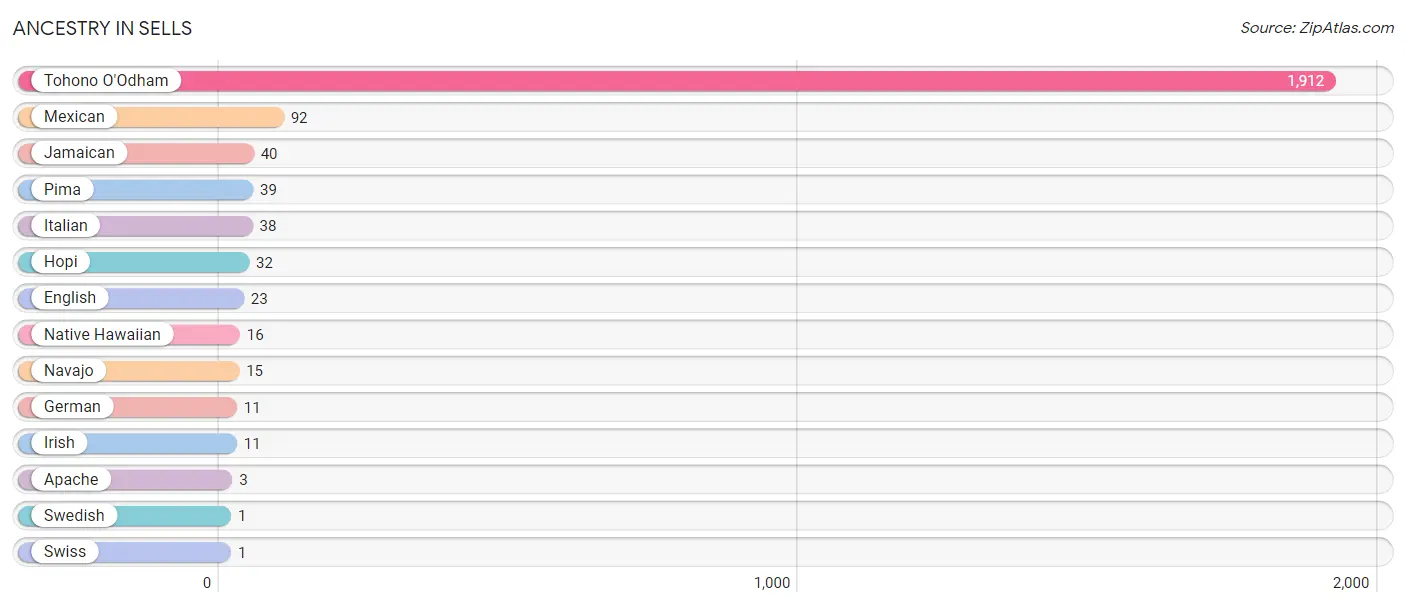
| Ancestry | # Population | % Population |
| Apache | 3 | 0.1% |
| English | 23 | 0.9% |
| German | 11 | 0.4% |
| Hopi | 32 | 1.3% |
| Irish | 11 | 0.4% |
| Italian | 38 | 1.6% |
| Jamaican | 40 | 1.7% |
| Mexican | 92 | 3.8% |
| Native Hawaiian | 16 | 0.7% |
| Navajo | 15 | 0.6% |
| Pima | 39 | 1.6% |
| Swedish | 1 | 0.0% |
| Swiss | 1 | 0.0% |
| Tohono O'Odham | 1,912 | 78.9% | View All 14 Rows |
Immigrants in Sells
The most numerous immigrant groups reported in Sells came from Central America (1 | 0.0%), Latin America (1 | 0.0%), and Mexico (1 | 0.0%), together accounting for 0.1% of all Sells residents.
| Immigration Origin | # Population | % Population |
| Central America | 1 | 0.0% |
| Latin America | 1 | 0.0% |
| Mexico | 1 | 0.0% | View All 3 Rows |
Sex and Age in Sells
Sex and Age in Sells
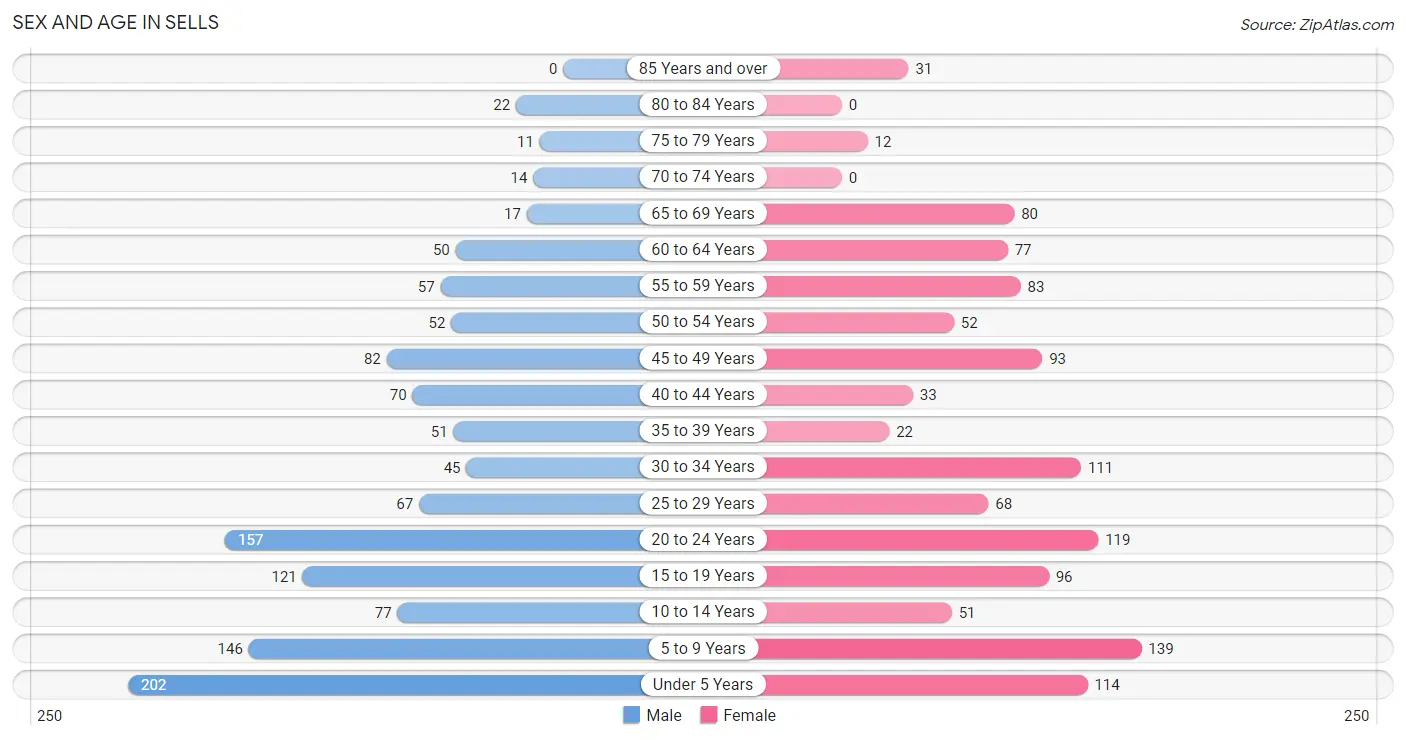
The most populous age groups in Sells are Under 5 Years (202 | 16.3%) for men and 5 to 9 Years (139 | 11.8%) for women.
| Age Bracket | Male | Female |
| Under 5 Years | 202 (16.3%) | 114 (9.7%) |
| 5 to 9 Years | 146 (11.8%) | 139 (11.8%) |
| 10 to 14 Years | 77 (6.2%) | 51 (4.3%) |
| 15 to 19 Years | 121 (9.8%) | 96 (8.1%) |
| 20 to 24 Years | 157 (12.7%) | 119 (10.1%) |
| 25 to 29 Years | 67 (5.4%) | 68 (5.8%) |
| 30 to 34 Years | 45 (3.6%) | 111 (9.4%) |
| 35 to 39 Years | 51 (4.1%) | 22 (1.9%) |
| 40 to 44 Years | 70 (5.6%) | 33 (2.8%) |
| 45 to 49 Years | 82 (6.6%) | 93 (7.9%) |
| 50 to 54 Years | 52 (4.2%) | 52 (4.4%) |
| 55 to 59 Years | 57 (4.6%) | 83 (7.0%) |
| 60 to 64 Years | 50 (4.0%) | 77 (6.5%) |
| 65 to 69 Years | 17 (1.4%) | 80 (6.8%) |
| 70 to 74 Years | 14 (1.1%) | 0 (0.0%) |
| 75 to 79 Years | 11 (0.9%) | 12 (1.0%) |
| 80 to 84 Years | 22 (1.8%) | 0 (0.0%) |
| 85 Years and over | 0 (0.0%) | 31 (2.6%) |
| Total | 1,241 (100.0%) | 1,181 (100.0%) |
Families and Households in Sells
Median Family Size in Sells
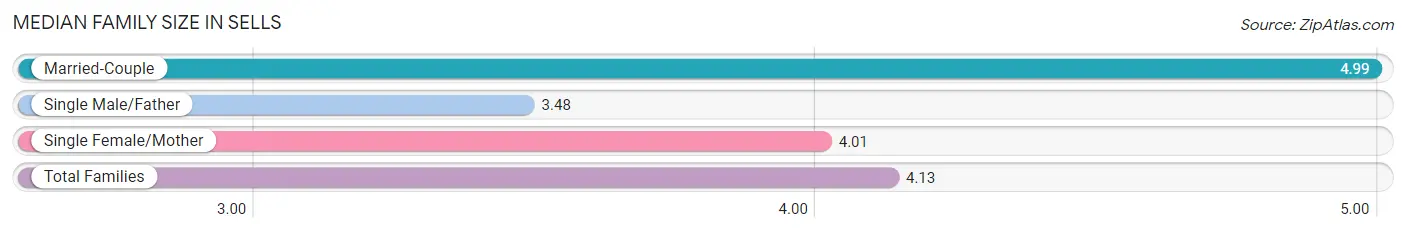
The median family size in Sells is 4.13 persons per family, with married-couple families (98 | 20.4%) accounting for the largest median family size of 4.99 persons per family. On the other hand, single male/father families (71 | 14.8%) represent the smallest median family size with 3.48 persons per family.
| Family Type | # Families | Family Size |
| Married-Couple | 98 (20.4%) | 4.99 |
| Single Male/Father | 71 (14.8%) | 3.48 |
| Single Female/Mother | 311 (64.8%) | 4.01 |
| Total Families | 480 (100.0%) | 4.13 |
Median Household Size in Sells
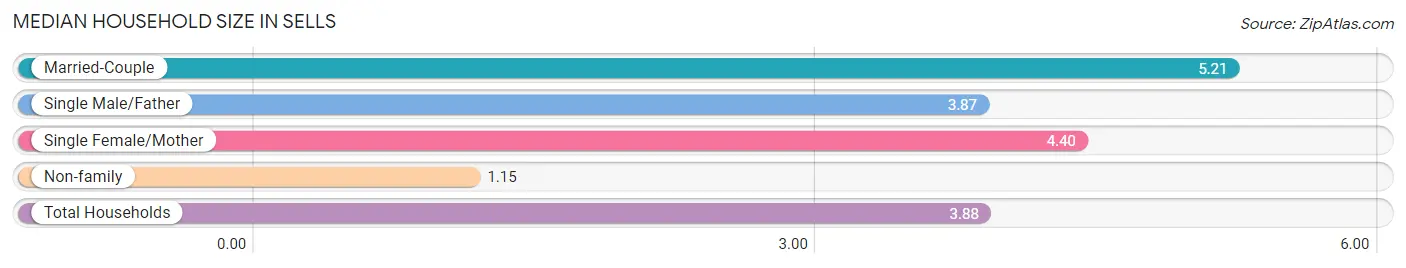
The median household size in Sells is 3.88 persons per household, with married-couple households (98 | 16.7%) accounting for the largest median household size of 5.21 persons per household. non-family households (106 | 18.1%) represent the smallest median household size with 1.15 persons per household.
| Household Type | # Households | Household Size |
| Married-Couple | 98 (16.7%) | 5.21 |
| Single Male/Father | 71 (12.1%) | 3.87 |
| Single Female/Mother | 311 (53.1%) | 4.40 |
| Non-family | 106 (18.1%) | 1.15 |
| Total Households | 586 (100.0%) | 3.88 |
Household Size by Marriage Status in Sells
Out of a total of 586 households in Sells, 480 (81.9%) are family households, while 106 (18.1%) are nonfamily households. The most numerous type of family households are 7+ person households, comprising 133, and the most common type of nonfamily households are 1-person households, comprising 84.
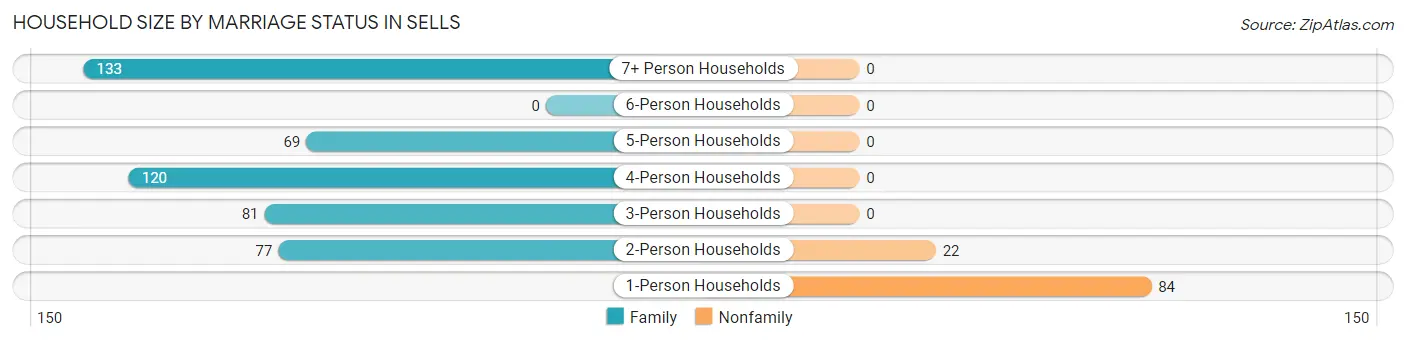
| Household Size | Family Households | Nonfamily Households |
| 1-Person Households | - | 84 (14.3%) |
| 2-Person Households | 77 (13.1%) | 22 (3.7%) |
| 3-Person Households | 81 (13.8%) | 0 (0.0%) |
| 4-Person Households | 120 (20.5%) | 0 (0.0%) |
| 5-Person Households | 69 (11.8%) | 0 (0.0%) |
| 6-Person Households | 0 (0.0%) | 0 (0.0%) |
| 7+ Person Households | 133 (22.7%) | 0 (0.0%) |
| Total | 480 (81.9%) | 106 (18.1%) |
Female Fertility in Sells
Fertility by Age in Sells
| Age Bracket | Women with Births | Births / 1,000 Women |
| 15 to 19 years | 0 (0.0%) | 0.0 |
| 20 to 34 years | 0 (0.0%) | 0.0 |
| 35 to 50 years | 0 (0.0%) | 0.0 |
| Total | 0 (0.0%) | 0.0 |
Fertility by Age by Marriage Status in Sells
| Age Bracket | Married | Unmarried |
| 15 to 19 years | 0 (0.0%) | 0 (0.0%) |
| 20 to 34 years | 0 (0.0%) | 0 (0.0%) |
| 35 to 50 years | 0 (0.0%) | 0 (0.0%) |
| Total | 0 (0.0%) | 0 (0.0%) |
Fertility by Education in Sells
| Educational Attainment | Women with Births | Births / 1,000 Women |
| Less than High School | 0 (0.0%) | 0.0 |
| High School Diploma | 0 (0.0%) | 0.0 |
| College or Associate's Degree | 0 (0.0%) | 0.0 |
| Bachelor's Degree | 0 (0.0%) | 0.0 |
| Graduate Degree | 0 (0.0%) | 0.0 |
| Total | 0 (0.0%) | 0.0 |
Fertility by Education by Marriage Status in Sells
| Educational Attainment | Married | Unmarried |
| Less than High School | 0 (0.0%) | 0 (0.0%) |
| High School Diploma | 0 (0.0%) | 0 (0.0%) |
| College or Associate's Degree | 0 (0.0%) | 0 (0.0%) |
| Bachelor's Degree | 0 (0.0%) | 0 (0.0%) |
| Graduate Degree | 0 (0.0%) | 0 (0.0%) |
| Total | 0 (0.0%) | 0 (0.0%) |
Employment Characteristics in Sells
Employment by Class of Employer in Sells
Among the 550 employed individuals in Sells, local government employees (230 | 41.8%), private company employees (182 | 33.1%), and state government employees (59 | 10.7%) make up the most common classes of employment.
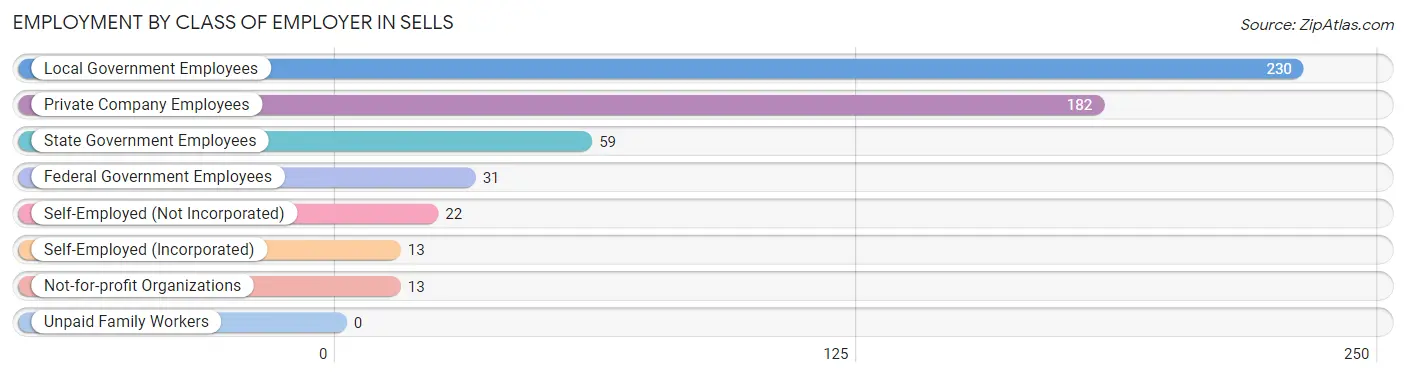
| Employer Class | # Employees | % Employees |
| Private Company Employees | 182 | 33.1% |
| Self-Employed (Incorporated) | 13 | 2.4% |
| Self-Employed (Not Incorporated) | 22 | 4.0% |
| Not-for-profit Organizations | 13 | 2.4% |
| Local Government Employees | 230 | 41.8% |
| State Government Employees | 59 | 10.7% |
| Federal Government Employees | 31 | 5.6% |
| Unpaid Family Workers | 0 | 0.0% |
| Total | 550 | 100.0% |
Employment Status by Age in Sells
According to the labor force statistics for Sells, out of the total population over 16 years of age (1,650), 39.5% or 652 individuals are in the labor force, with 15.5% or 101 of them unemployed. The age group with the highest labor force participation rate is 45 to 54 years, with 61.3% or 171 individuals in the labor force. Within the labor force, the 25 to 29 years age range has the highest percentage of unemployed individuals, with 42.6% or 23 of them being unemployed.
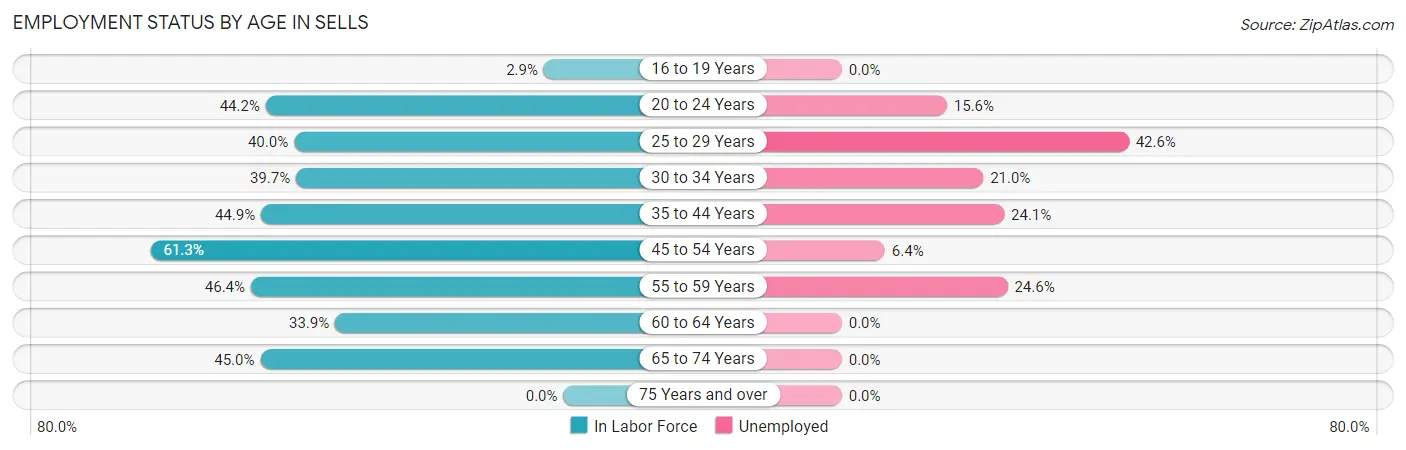
| Age Bracket | In Labor Force | Unemployed |
| 16 to 19 Years | 5 (2.9%) | 0 (0.0%) |
| 20 to 24 Years | 122 (44.2%) | 19 (15.6%) |
| 25 to 29 Years | 54 (40.0%) | 23 (42.6%) |
| 30 to 34 Years | 62 (39.7%) | 13 (21.0%) |
| 35 to 44 Years | 79 (44.9%) | 19 (24.1%) |
| 45 to 54 Years | 171 (61.3%) | 11 (6.4%) |
| 55 to 59 Years | 65 (46.4%) | 16 (24.6%) |
| 60 to 64 Years | 43 (33.9%) | 0 (0.0%) |
| 65 to 74 Years | 50 (45.0%) | 0 (0.0%) |
| 75 Years and over | 0 (0.0%) | 0 (0.0%) |
| Total | 652 (39.5%) | 101 (15.5%) |
Employment Status by Educational Attainment in Sells
According to labor force statistics for Sells, 46.8% of individuals (474) out of the total population between 25 and 64 years of age (1,013) are in the labor force, with 17.3% or 82 of them being unemployed. The group with the highest labor force participation rate are those with the educational attainment of college / associate degree, with 56.8% or 159 individuals in the labor force. Within the labor force, individuals with less than high school education have the highest percentage of unemployment, with 40.0% or 24 of them being unemployed.
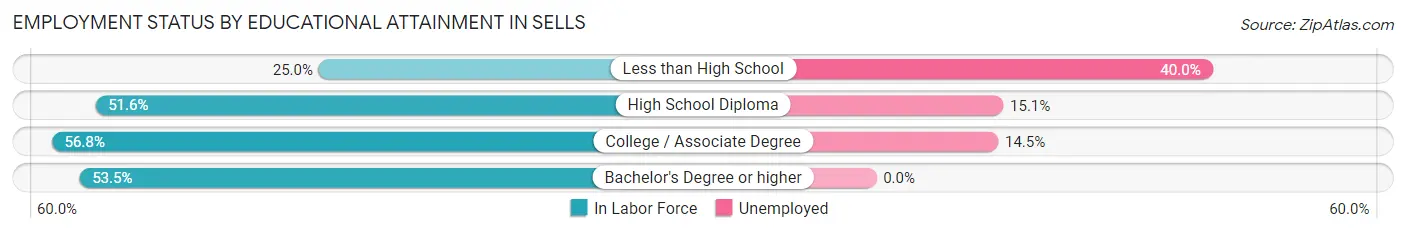
| Educational Attainment | In Labor Force | Unemployed |
| Less than High School | 60 (25.0%) | 96 (40.0%) |
| High School Diploma | 232 (51.6%) | 68 (15.1%) |
| College / Associate Degree | 159 (56.8%) | 41 (14.5%) |
| Bachelor's Degree or higher | 23 (53.5%) | 0 (0.0%) |
| Total | 474 (46.8%) | 175 (17.3%) |
Employment Occupations by Sex in Sells
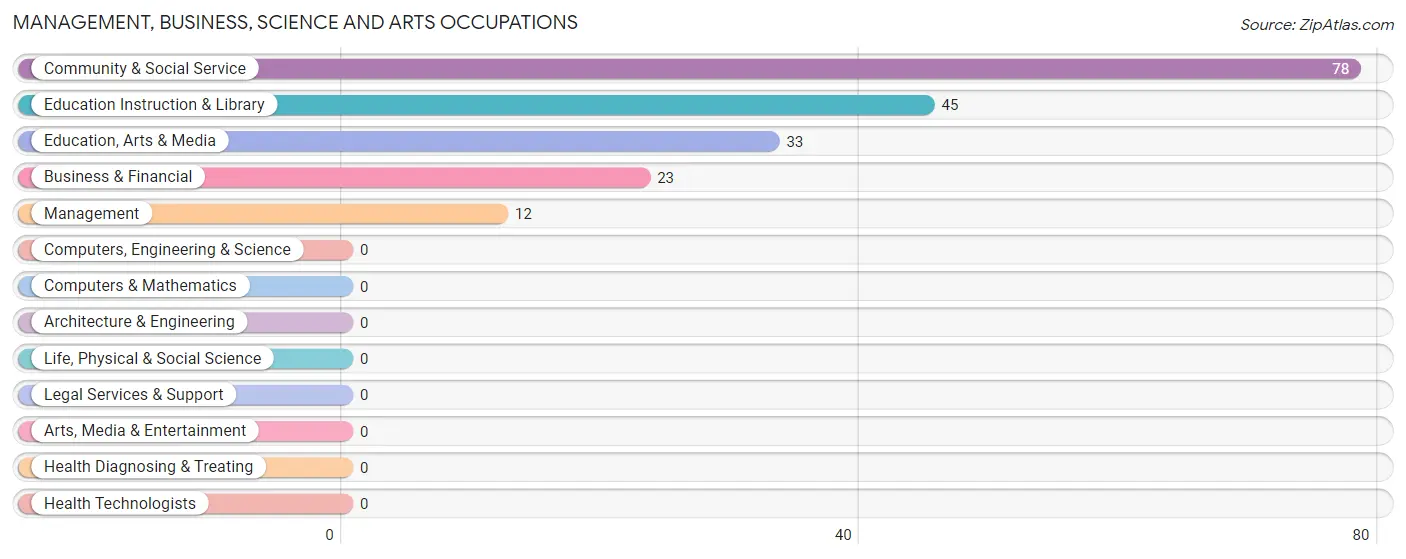
Management, Business, Science and Arts Occupations
The most common Management, Business, Science and Arts occupations in Sells are Community & Social Service (78 | 14.2%), Education Instruction & Library (45 | 8.2%), Education, Arts & Media (33 | 6.0%), Business & Financial (23 | 4.2%), and Management (12 | 2.2%).
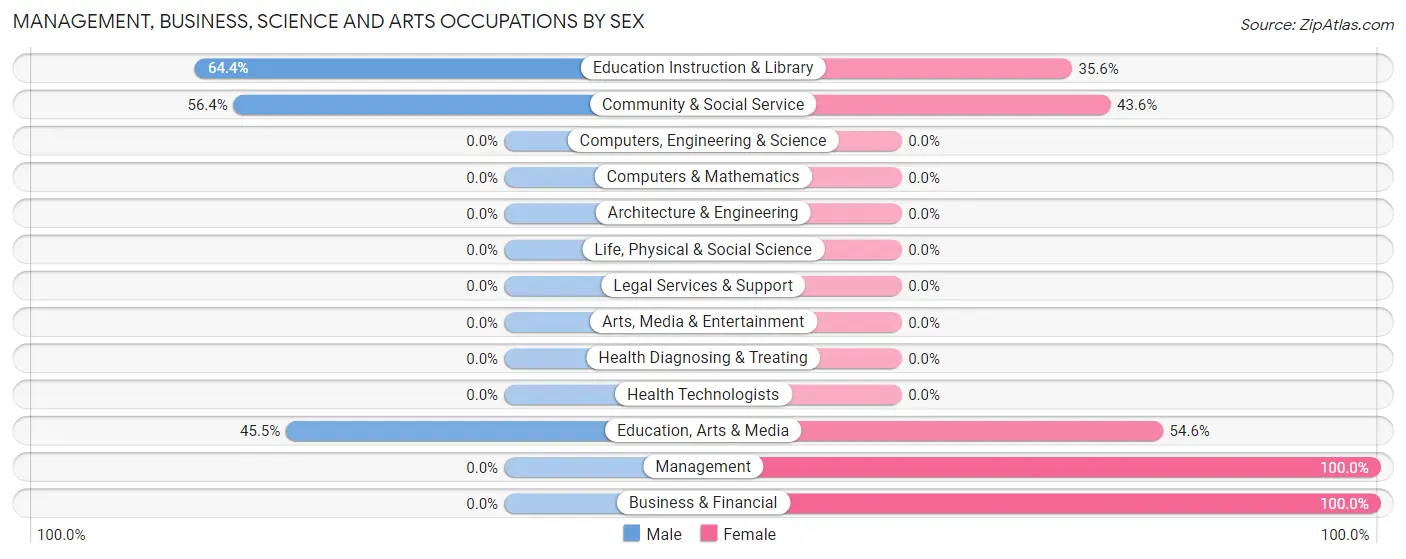
Management, Business, Science and Arts Occupations by Sex
Within the Management, Business, Science and Arts occupations in Sells, the most male-oriented occupations are Education Instruction & Library (64.4%), Community & Social Service (56.4%), and Education, Arts & Media (45.5%), while the most female-oriented occupations are Management (100.0%), Business & Financial (100.0%), and Education, Arts & Media (54.5%).
| Occupation | Male | Female |
| Management | 0 (0.0%) | 12 (100.0%) |
| Business & Financial | 0 (0.0%) | 23 (100.0%) |
| Computers, Engineering & Science | 0 (0.0%) | 0 (0.0%) |
| Computers & Mathematics | 0 (0.0%) | 0 (0.0%) |
| Architecture & Engineering | 0 (0.0%) | 0 (0.0%) |
| Life, Physical & Social Science | 0 (0.0%) | 0 (0.0%) |
| Community & Social Service | 44 (56.4%) | 34 (43.6%) |
| Education, Arts & Media | 15 (45.5%) | 18 (54.5%) |
| Legal Services & Support | 0 (0.0%) | 0 (0.0%) |
| Education Instruction & Library | 29 (64.4%) | 16 (35.6%) |
| Arts, Media & Entertainment | 0 (0.0%) | 0 (0.0%) |
| Health Diagnosing & Treating | 0 (0.0%) | 0 (0.0%) |
| Health Technologists | 0 (0.0%) | 0 (0.0%) |
| Total (Category) | 44 (38.9%) | 69 (61.1%) |
| Total (Overall) | 191 (34.7%) | 359 (65.3%) |
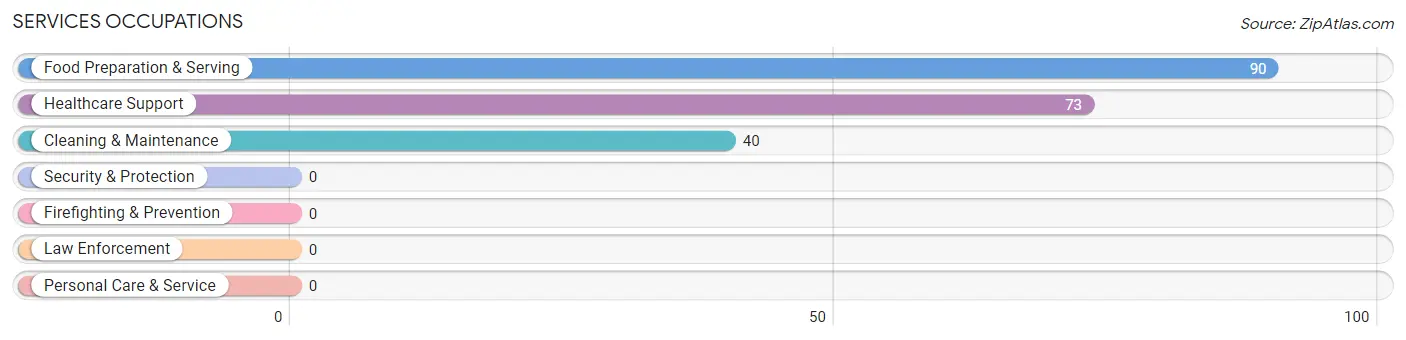
Services Occupations
The most common Services occupations in Sells are Food Preparation & Serving (90 | 16.4%), Healthcare Support (73 | 13.3%), and Cleaning & Maintenance (40 | 7.3%).
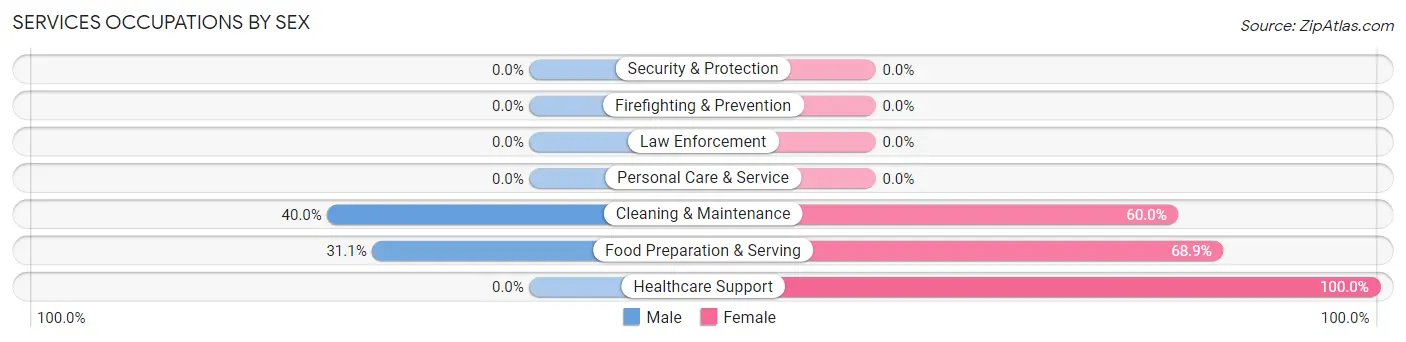
Services Occupations by Sex
Within the Services occupations in Sells, the most male-oriented occupations are Cleaning & Maintenance (40.0%), and Food Preparation & Serving (31.1%), while the most female-oriented occupations are Healthcare Support (100.0%), Food Preparation & Serving (68.9%), and Cleaning & Maintenance (60.0%).
| Occupation | Male | Female |
| Healthcare Support | 0 (0.0%) | 73 (100.0%) |
| Security & Protection | 0 (0.0%) | 0 (0.0%) |
| Firefighting & Prevention | 0 (0.0%) | 0 (0.0%) |
| Law Enforcement | 0 (0.0%) | 0 (0.0%) |
| Food Preparation & Serving | 28 (31.1%) | 62 (68.9%) |
| Cleaning & Maintenance | 16 (40.0%) | 24 (60.0%) |
| Personal Care & Service | 0 (0.0%) | 0 (0.0%) |
| Total (Category) | 44 (21.7%) | 159 (78.3%) |
| Total (Overall) | 191 (34.7%) | 359 (65.3%) |
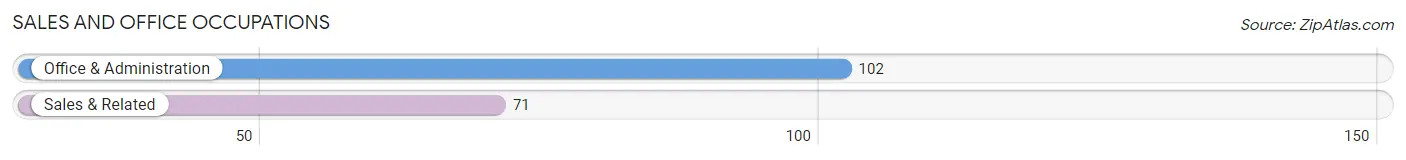
Sales and Office Occupations
The most common Sales and Office occupations in Sells are Office & Administration (102 | 18.5%), and Sales & Related (71 | 12.9%).
Sales and Office Occupations by Sex
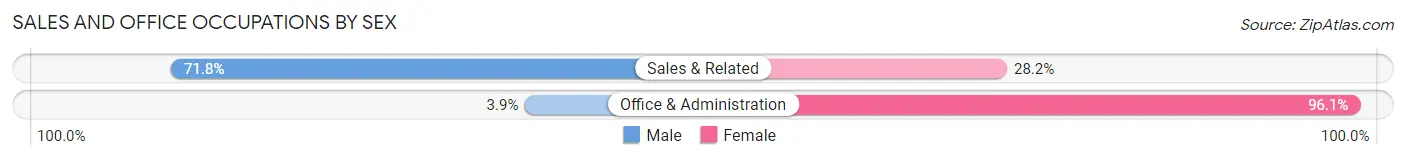
| Occupation | Male | Female |
| Sales & Related | 51 (71.8%) | 20 (28.2%) |
| Office & Administration | 4 (3.9%) | 98 (96.1%) |
| Total (Category) | 55 (31.8%) | 118 (68.2%) |
| Total (Overall) | 191 (34.7%) | 359 (65.3%) |
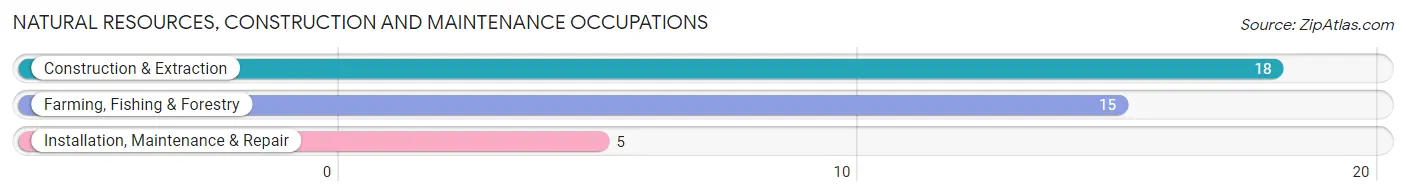
Natural Resources, Construction and Maintenance Occupations
The most common Natural Resources, Construction and Maintenance occupations in Sells are Construction & Extraction (18 | 3.3%), Farming, Fishing & Forestry (15 | 2.7%), and Installation, Maintenance & Repair (5 | 0.9%).
Natural Resources, Construction and Maintenance Occupations by Sex
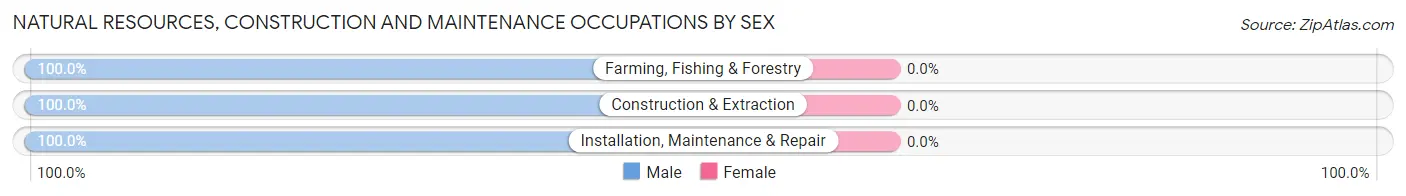
| Occupation | Male | Female |
| Farming, Fishing & Forestry | 15 (100.0%) | 0 (0.0%) |
| Construction & Extraction | 18 (100.0%) | 0 (0.0%) |
| Installation, Maintenance & Repair | 5 (100.0%) | 0 (0.0%) |
| Total (Category) | 38 (100.0%) | 0 (0.0%) |
| Total (Overall) | 191 (34.7%) | 359 (65.3%) |
Production, Transportation and Moving Occupations
The most common Production, Transportation and Moving occupations in Sells are , and Material Moving (23 | 4.2%).
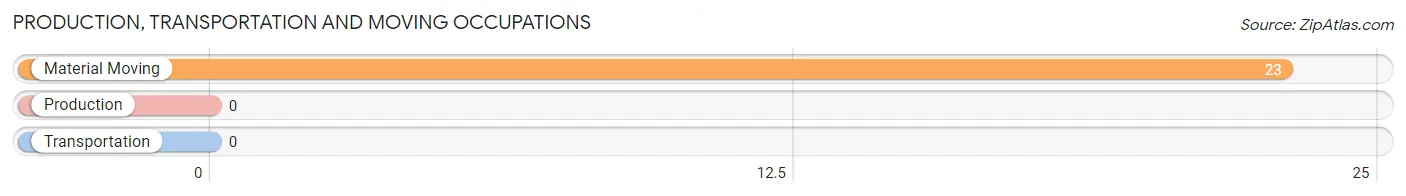
Production, Transportation and Moving Occupations by Sex
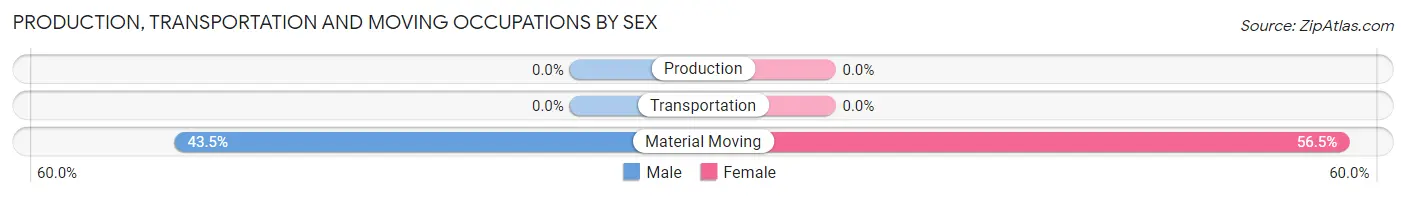
| Occupation | Male | Female |
| Production | 0 (0.0%) | 0 (0.0%) |
| Transportation | 0 (0.0%) | 0 (0.0%) |
| Material Moving | 10 (43.5%) | 13 (56.5%) |
| Total (Category) | 10 (43.5%) | 13 (56.5%) |
| Total (Overall) | 191 (34.7%) | 359 (65.3%) |
Employment Industries by Sex in Sells
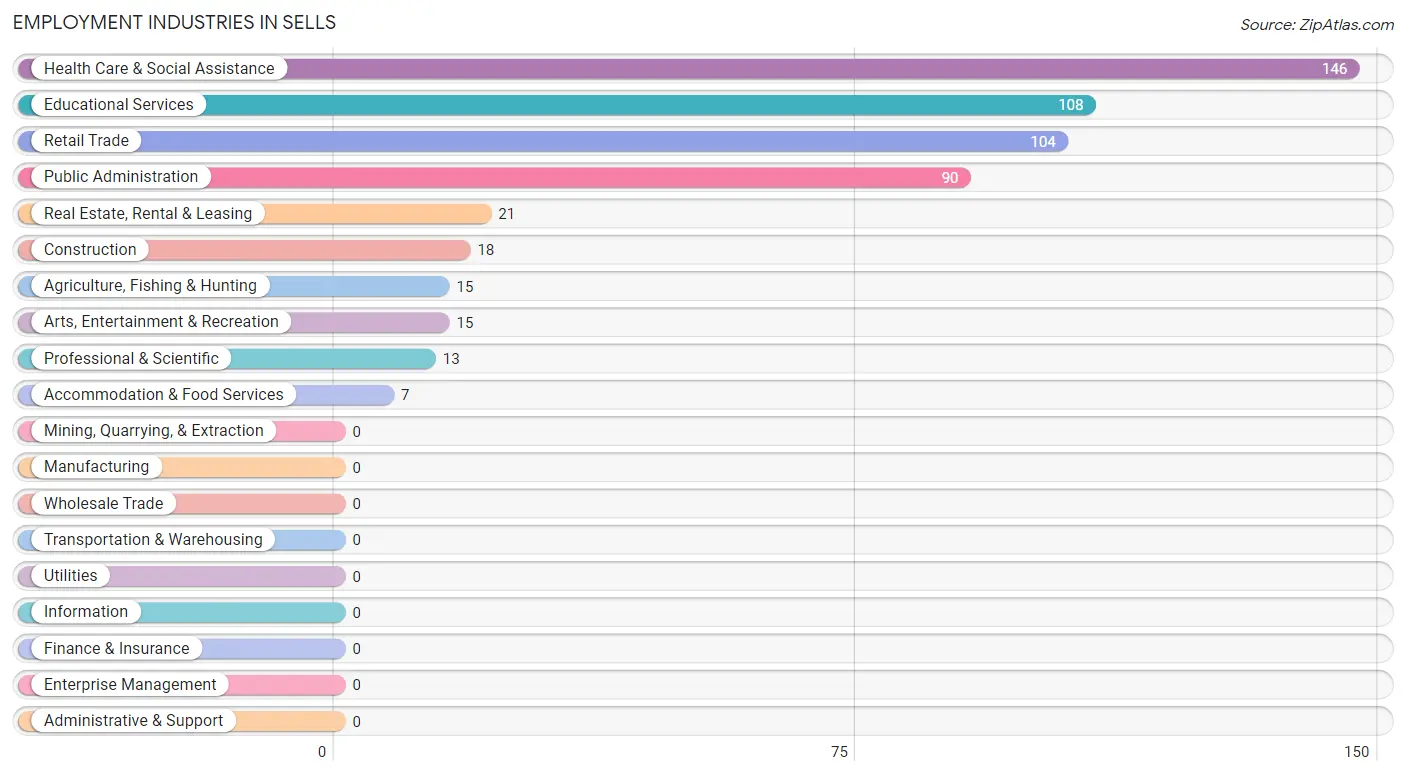
Employment Industries in Sells
The major employment industries in Sells include Health Care & Social Assistance (146 | 26.6%), Educational Services (108 | 19.6%), Retail Trade (104 | 18.9%), Public Administration (90 | 16.4%), and Real Estate, Rental & Leasing (21 | 3.8%).
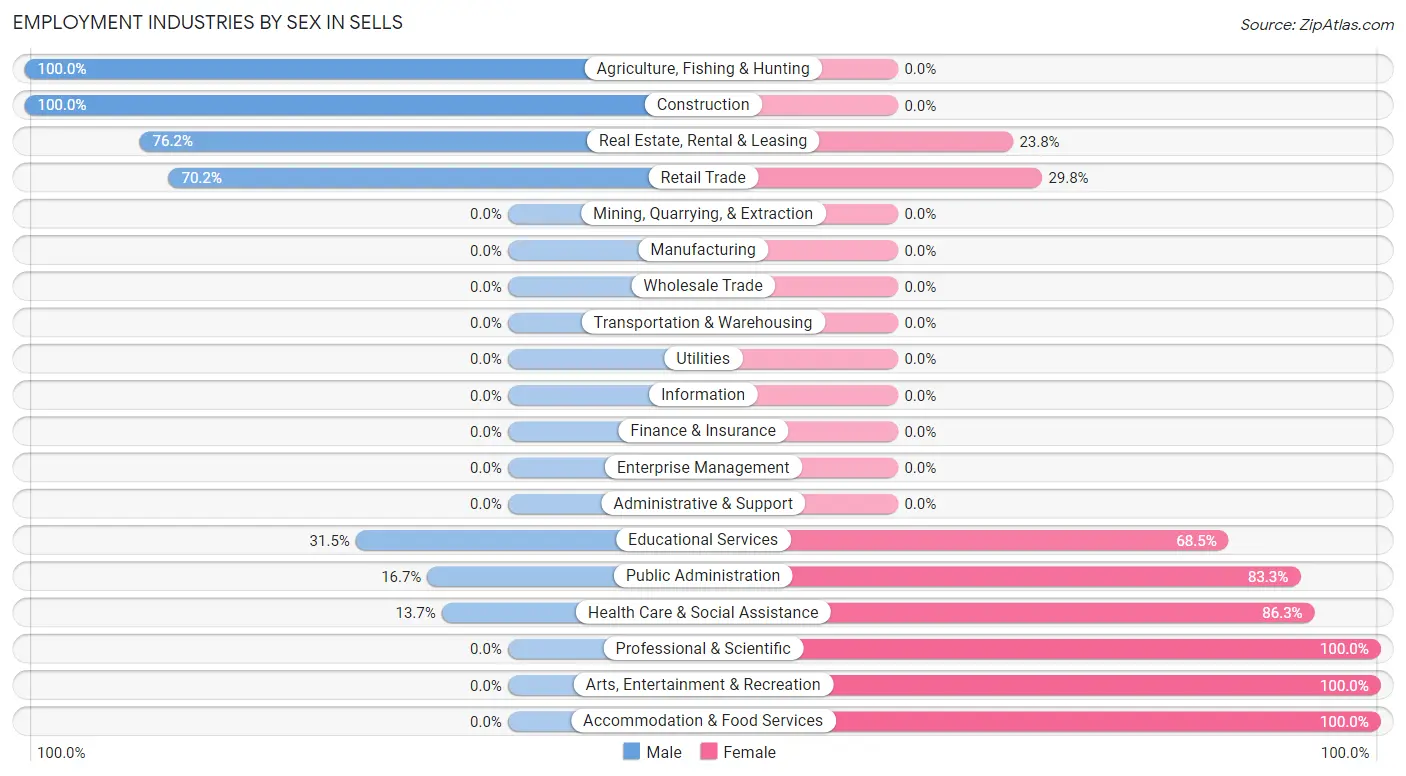
Employment Industries by Sex in Sells
The Sells industries that see more men than women are Agriculture, Fishing & Hunting (100.0%), Construction (100.0%), and Real Estate, Rental & Leasing (76.2%), whereas the industries that tend to have a higher number of women are Professional & Scientific (100.0%), Arts, Entertainment & Recreation (100.0%), and Accommodation & Food Services (100.0%).
| Industry | Male | Female |
| Agriculture, Fishing & Hunting | 15 (100.0%) | 0 (0.0%) |
| Mining, Quarrying, & Extraction | 0 (0.0%) | 0 (0.0%) |
| Construction | 18 (100.0%) | 0 (0.0%) |
| Manufacturing | 0 (0.0%) | 0 (0.0%) |
| Wholesale Trade | 0 (0.0%) | 0 (0.0%) |
| Retail Trade | 73 (70.2%) | 31 (29.8%) |
| Transportation & Warehousing | 0 (0.0%) | 0 (0.0%) |
| Utilities | 0 (0.0%) | 0 (0.0%) |
| Information | 0 (0.0%) | 0 (0.0%) |
| Finance & Insurance | 0 (0.0%) | 0 (0.0%) |
| Real Estate, Rental & Leasing | 16 (76.2%) | 5 (23.8%) |
| Professional & Scientific | 0 (0.0%) | 13 (100.0%) |
| Enterprise Management | 0 (0.0%) | 0 (0.0%) |
| Administrative & Support | 0 (0.0%) | 0 (0.0%) |
| Educational Services | 34 (31.5%) | 74 (68.5%) |
| Health Care & Social Assistance | 20 (13.7%) | 126 (86.3%) |
| Arts, Entertainment & Recreation | 0 (0.0%) | 15 (100.0%) |
| Accommodation & Food Services | 0 (0.0%) | 7 (100.0%) |
| Public Administration | 15 (16.7%) | 75 (83.3%) |
| Total | 191 (34.7%) | 359 (65.3%) |
Education in Sells
School Enrollment in Sells
The most common levels of schooling among the 731 students in Sells are elementary school (230 | 31.5%), high school (203 | 27.8%), and middle school (115 | 15.7%).
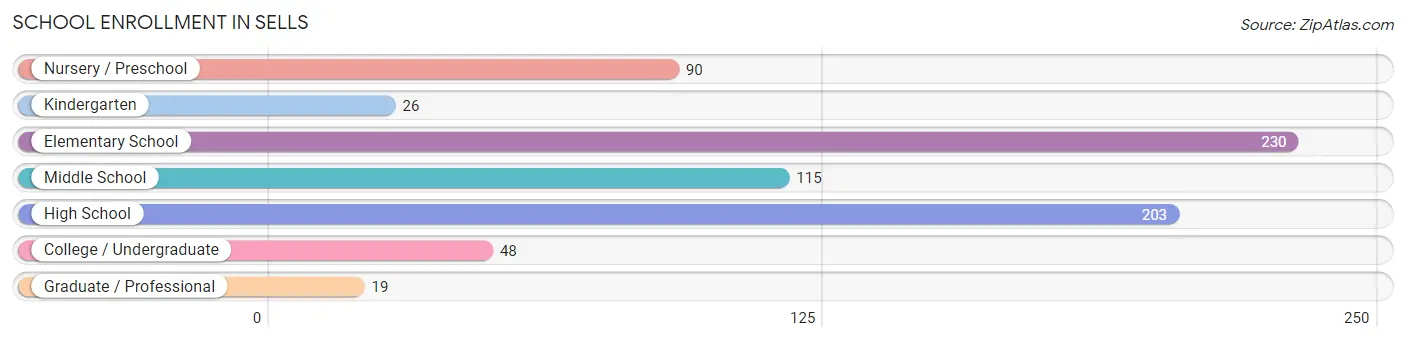
| School Level | # Students | % Students |
| Nursery / Preschool | 90 | 12.3% |
| Kindergarten | 26 | 3.6% |
| Elementary School | 230 | 31.5% |
| Middle School | 115 | 15.7% |
| High School | 203 | 27.8% |
| College / Undergraduate | 48 | 6.6% |
| Graduate / Professional | 19 | 2.6% |
| Total | 731 | 100.0% |
School Enrollment by Age by Funding Source in Sells
Out of a total of 731 students who are enrolled in schools in Sells, 17 (2.3%) attend a private institution, while the remaining 714 (97.7%) are enrolled in public schools. The age group of 15 to 17 year olds has the highest likelihood of being enrolled in private schools, with 17 (9.4% in the age bracket) enrolled. Conversely, the age group of 3 to 4 year olds has the lowest likelihood of being enrolled in a private school, with 61 (100.0% in the age bracket) attending a public institution.
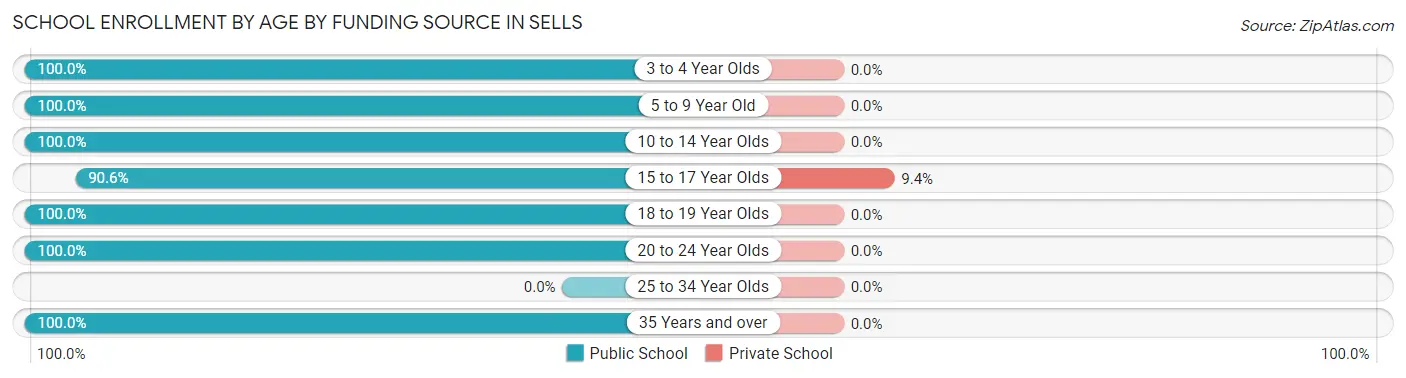
| Age Bracket | Public School | Private School |
| 3 to 4 Year Olds | 61 (100.0%) | 0 (0.0%) |
| 5 to 9 Year Old | 285 (100.0%) | 0 (0.0%) |
| 10 to 14 Year Olds | 113 (100.0%) | 0 (0.0%) |
| 15 to 17 Year Olds | 163 (90.6%) | 17 (9.4%) |
| 18 to 19 Year Olds | 19 (100.0%) | 0 (0.0%) |
| 20 to 24 Year Olds | 40 (100.0%) | 0 (0.0%) |
| 25 to 34 Year Olds | 0 (0.0%) | 0 (0.0%) |
| 35 Years and over | 33 (100.0%) | 0 (0.0%) |
| Total | 714 (97.7%) | 17 (2.3%) |
Educational Attainment by Field of Study in Sells
Education (16 | 36.4%), bio, nature & agricultural (11 | 25.0%), visual & performing arts (9 | 20.4%), arts & humanities (7 | 15.9%), and physical & health sciences (1 | 2.3%) are the most common fields of study among 44 individuals in Sells who have obtained a bachelor's degree or higher.
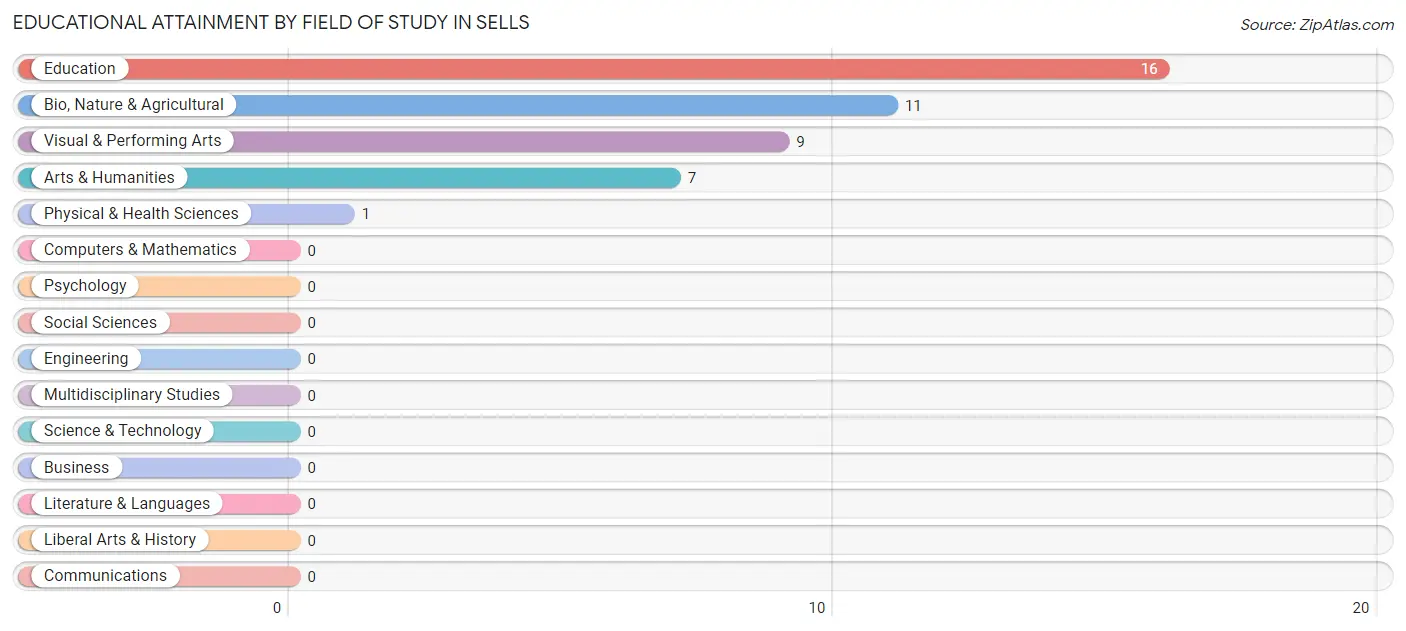
| Field of Study | # Graduates | % Graduates |
| Computers & Mathematics | 0 | 0.0% |
| Bio, Nature & Agricultural | 11 | 25.0% |
| Physical & Health Sciences | 1 | 2.3% |
| Psychology | 0 | 0.0% |
| Social Sciences | 0 | 0.0% |
| Engineering | 0 | 0.0% |
| Multidisciplinary Studies | 0 | 0.0% |
| Science & Technology | 0 | 0.0% |
| Business | 0 | 0.0% |
| Education | 16 | 36.4% |
| Literature & Languages | 0 | 0.0% |
| Liberal Arts & History | 0 | 0.0% |
| Visual & Performing Arts | 9 | 20.4% |
| Communications | 0 | 0.0% |
| Arts & Humanities | 7 | 15.9% |
| Total | 44 | 100.0% |
Transportation & Commute in Sells
Vehicle Availability by Sex in Sells
The most prevalent vehicle ownership categories in Sells are males with 2 vehicles (88, accounting for 46.1%) and females with 2 vehicles (152, making up 24.5%).
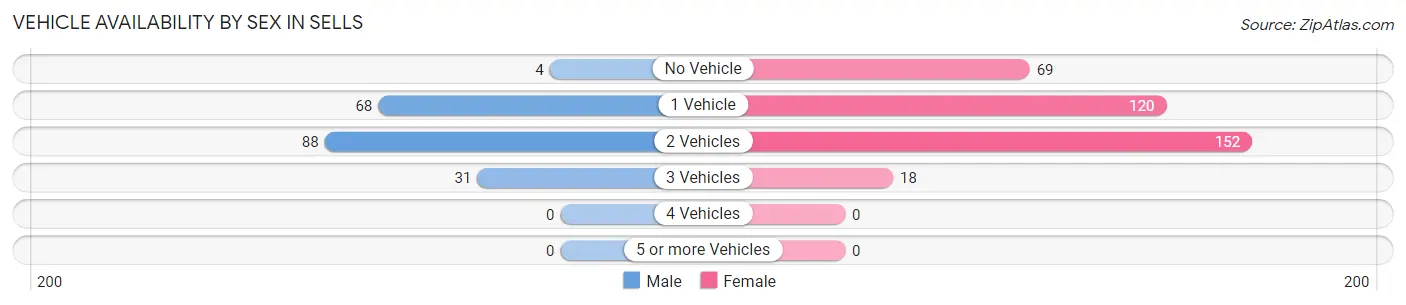
| Vehicles Available | Male | Female |
| No Vehicle | 4 (2.1%) | 69 (19.2%) |
| 1 Vehicle | 68 (35.6%) | 120 (33.4%) |
| 2 Vehicles | 88 (46.1%) | 152 (42.3%) |
| 3 Vehicles | 31 (16.2%) | 18 (5.0%) |
| 4 Vehicles | 0 (0.0%) | 0 (0.0%) |
| 5 or more Vehicles | 0 (0.0%) | 0 (0.0%) |
| Total | 191 (100.0%) | 359 (100.0%) |
Commute Time in Sells
The most frequently occuring commute durations in Sells are 5 to 9 minutes (303 commuters, 57.2%), 25 to 29 minutes (67 commuters, 12.6%), and 10 to 14 minutes (54 commuters, 10.2%).
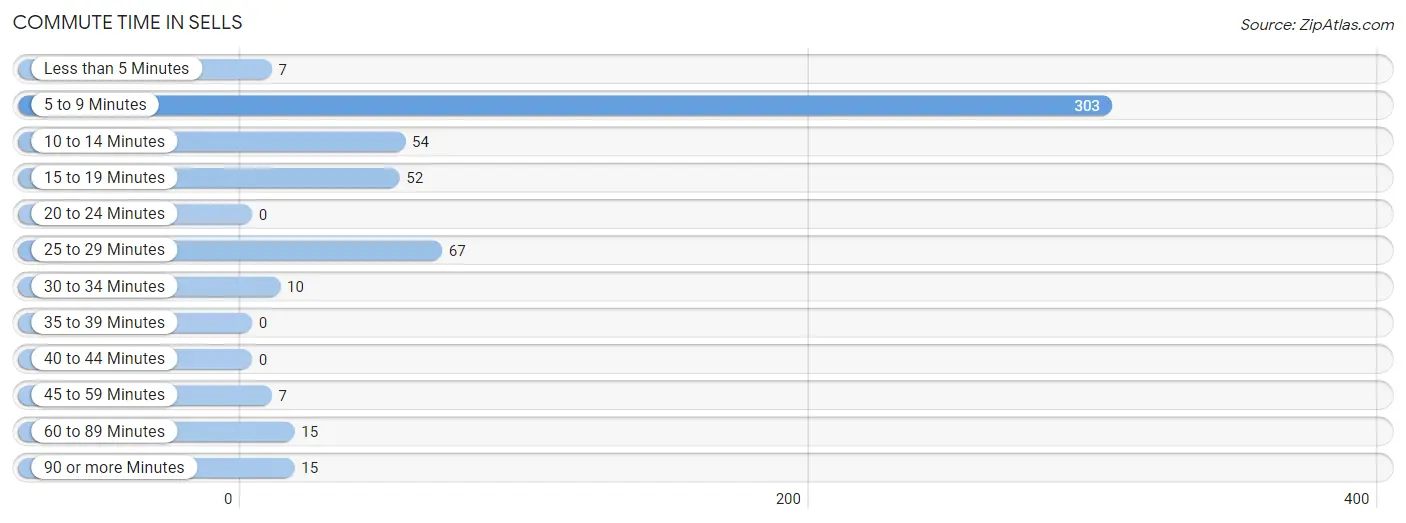
| Commute Time | # Commuters | % Commuters |
| Less than 5 Minutes | 7 | 1.3% |
| 5 to 9 Minutes | 303 | 57.2% |
| 10 to 14 Minutes | 54 | 10.2% |
| 15 to 19 Minutes | 52 | 9.8% |
| 20 to 24 Minutes | 0 | 0.0% |
| 25 to 29 Minutes | 67 | 12.6% |
| 30 to 34 Minutes | 10 | 1.9% |
| 35 to 39 Minutes | 0 | 0.0% |
| 40 to 44 Minutes | 0 | 0.0% |
| 45 to 59 Minutes | 7 | 1.3% |
| 60 to 89 Minutes | 15 | 2.8% |
| 90 or more Minutes | 15 | 2.8% |
Commute Time by Sex in Sells
The most common commute times in Sells are 5 to 9 minutes (88 commuters, 46.1%) for males and 5 to 9 minutes (215 commuters, 63.4%) for females.
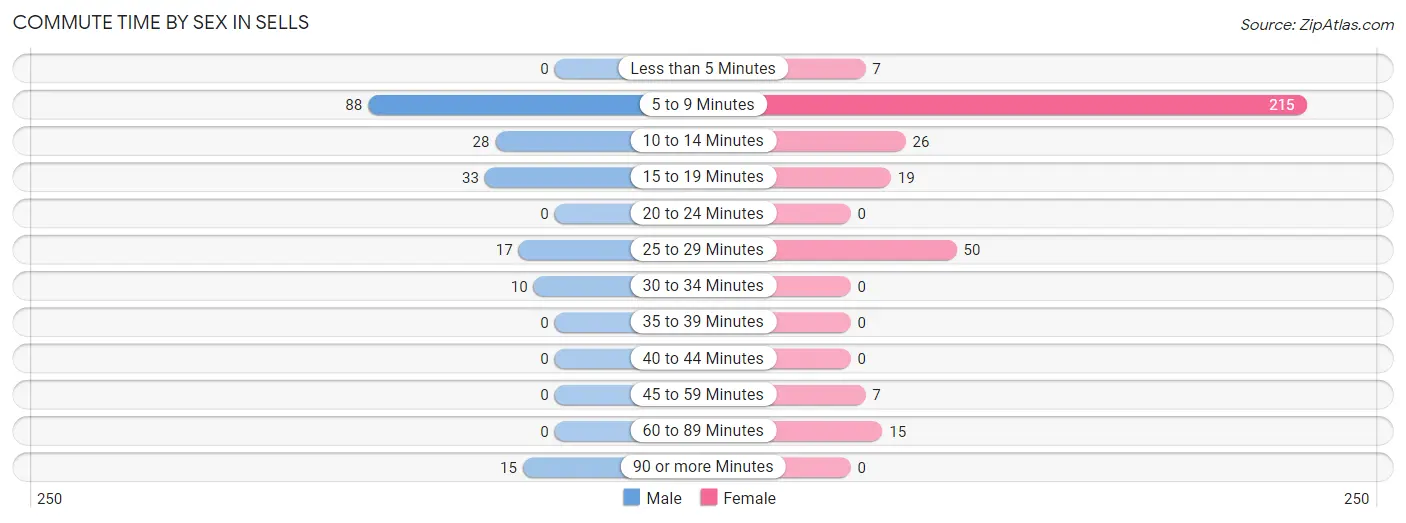
| Commute Time | Male | Female |
| Less than 5 Minutes | 0 (0.0%) | 7 (2.1%) |
| 5 to 9 Minutes | 88 (46.1%) | 215 (63.4%) |
| 10 to 14 Minutes | 28 (14.7%) | 26 (7.7%) |
| 15 to 19 Minutes | 33 (17.3%) | 19 (5.6%) |
| 20 to 24 Minutes | 0 (0.0%) | 0 (0.0%) |
| 25 to 29 Minutes | 17 (8.9%) | 50 (14.7%) |
| 30 to 34 Minutes | 10 (5.2%) | 0 (0.0%) |
| 35 to 39 Minutes | 0 (0.0%) | 0 (0.0%) |
| 40 to 44 Minutes | 0 (0.0%) | 0 (0.0%) |
| 45 to 59 Minutes | 0 (0.0%) | 7 (2.1%) |
| 60 to 89 Minutes | 0 (0.0%) | 15 (4.4%) |
| 90 or more Minutes | 15 (7.9%) | 0 (0.0%) |
Time of Departure to Work by Sex in Sells
The most frequent times of departure to work in Sells are 7:00 AM to 7:29 AM (66, 34.5%) for males and 8:00 AM to 8:29 AM (74, 21.8%) for females.
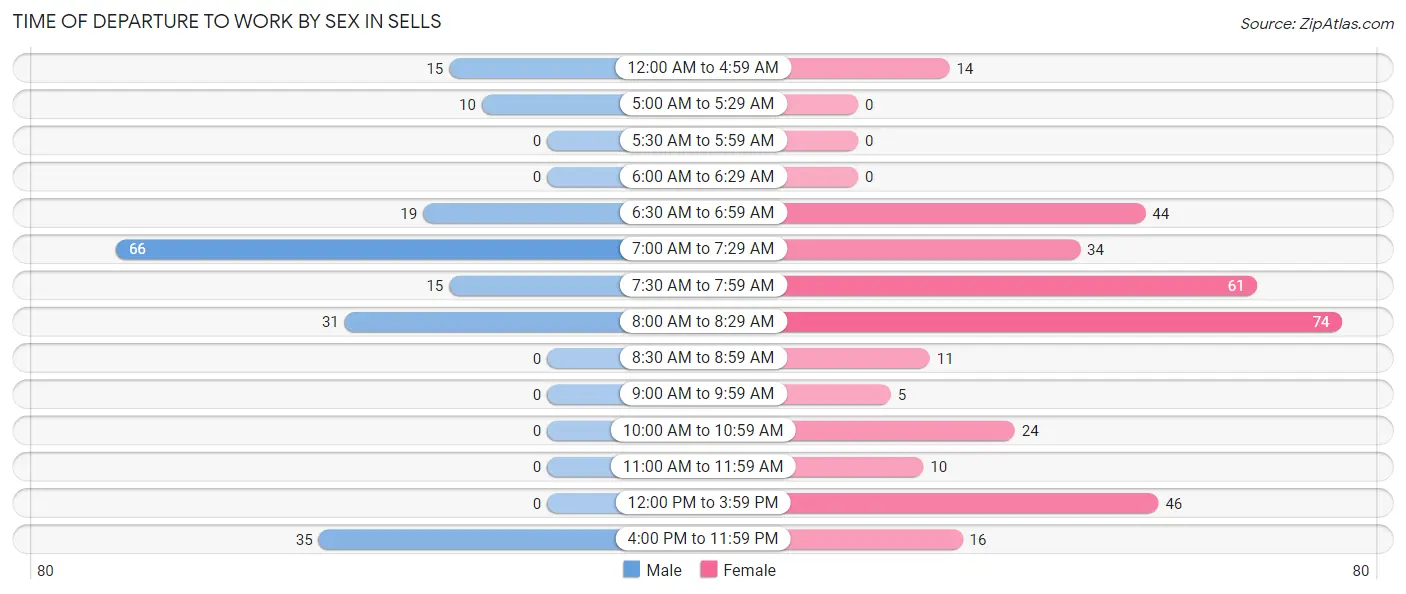
| Time of Departure | Male | Female |
| 12:00 AM to 4:59 AM | 15 (7.9%) | 14 (4.1%) |
| 5:00 AM to 5:29 AM | 10 (5.2%) | 0 (0.0%) |
| 5:30 AM to 5:59 AM | 0 (0.0%) | 0 (0.0%) |
| 6:00 AM to 6:29 AM | 0 (0.0%) | 0 (0.0%) |
| 6:30 AM to 6:59 AM | 19 (10.0%) | 44 (13.0%) |
| 7:00 AM to 7:29 AM | 66 (34.5%) | 34 (10.0%) |
| 7:30 AM to 7:59 AM | 15 (7.9%) | 61 (18.0%) |
| 8:00 AM to 8:29 AM | 31 (16.2%) | 74 (21.8%) |
| 8:30 AM to 8:59 AM | 0 (0.0%) | 11 (3.2%) |
| 9:00 AM to 9:59 AM | 0 (0.0%) | 5 (1.5%) |
| 10:00 AM to 10:59 AM | 0 (0.0%) | 24 (7.1%) |
| 11:00 AM to 11:59 AM | 0 (0.0%) | 10 (2.9%) |
| 12:00 PM to 3:59 PM | 0 (0.0%) | 46 (13.6%) |
| 4:00 PM to 11:59 PM | 35 (18.3%) | 16 (4.7%) |
| Total | 191 (100.0%) | 339 (100.0%) |
Housing Occupancy in Sells
Occupancy by Ownership in Sells
Of the total 586 dwellings in Sells, owner-occupied units account for 367 (62.6%), while renter-occupied units make up 219 (37.4%).
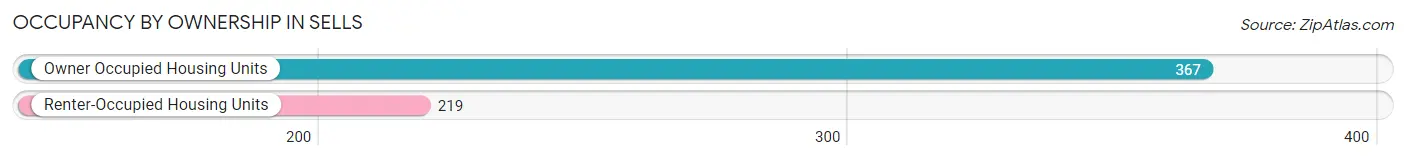
| Occupancy | # Housing Units | % Housing Units |
| Owner Occupied Housing Units | 367 | 62.6% |
| Renter-Occupied Housing Units | 219 | 37.4% |
| Total Occupied Housing Units | 586 | 100.0% |
Occupancy by Household Size in Sells
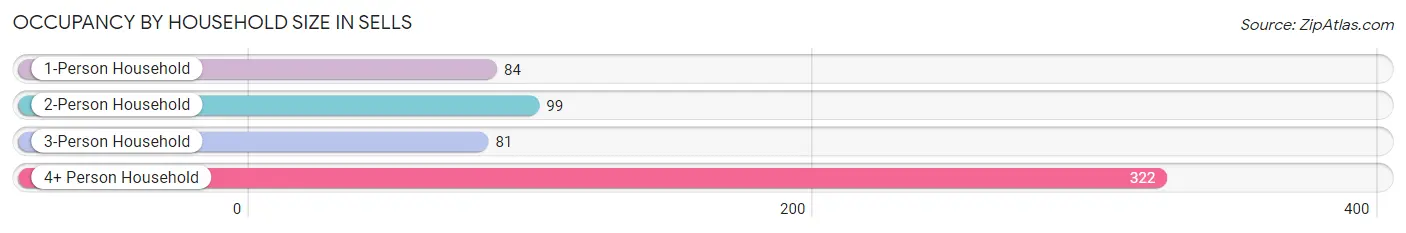
| Household Size | # Housing Units | % Housing Units |
| 1-Person Household | 84 | 14.3% |
| 2-Person Household | 99 | 16.9% |
| 3-Person Household | 81 | 13.8% |
| 4+ Person Household | 322 | 54.9% |
| Total Housing Units | 586 | 100.0% |
Occupancy by Ownership by Household Size in Sells
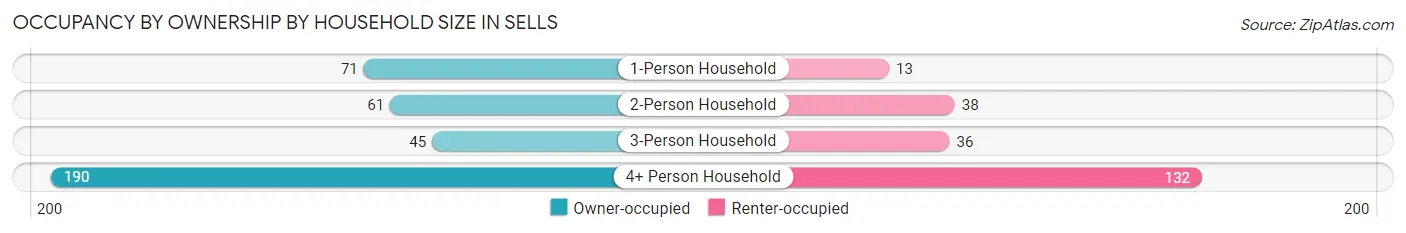
| Household Size | Owner-occupied | Renter-occupied |
| 1-Person Household | 71 (84.5%) | 13 (15.5%) |
| 2-Person Household | 61 (61.6%) | 38 (38.4%) |
| 3-Person Household | 45 (55.6%) | 36 (44.4%) |
| 4+ Person Household | 190 (59.0%) | 132 (41.0%) |
| Total Housing Units | 367 (62.6%) | 219 (37.4%) |
Occupancy by Educational Attainment in Sells
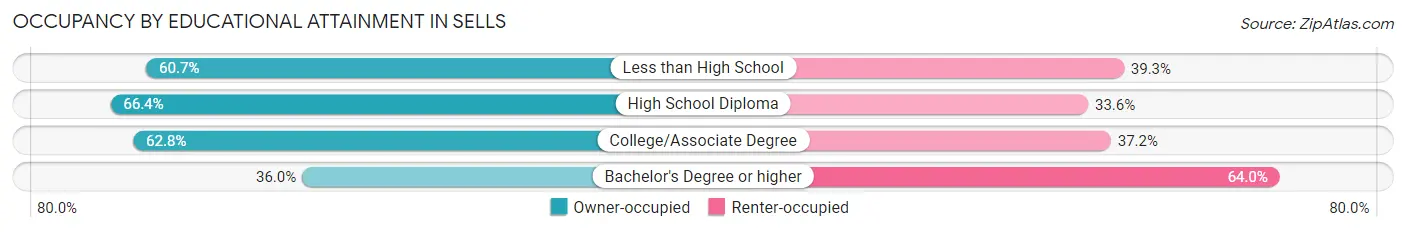
| Household Size | Owner-occupied | Renter-occupied |
| Less than High School | 85 (60.7%) | 55 (39.3%) |
| High School Diploma | 160 (66.4%) | 81 (33.6%) |
| College/Associate Degree | 113 (62.8%) | 67 (37.2%) |
| Bachelor's Degree or higher | 9 (36.0%) | 16 (64.0%) |
Occupancy by Age of Householder in Sells
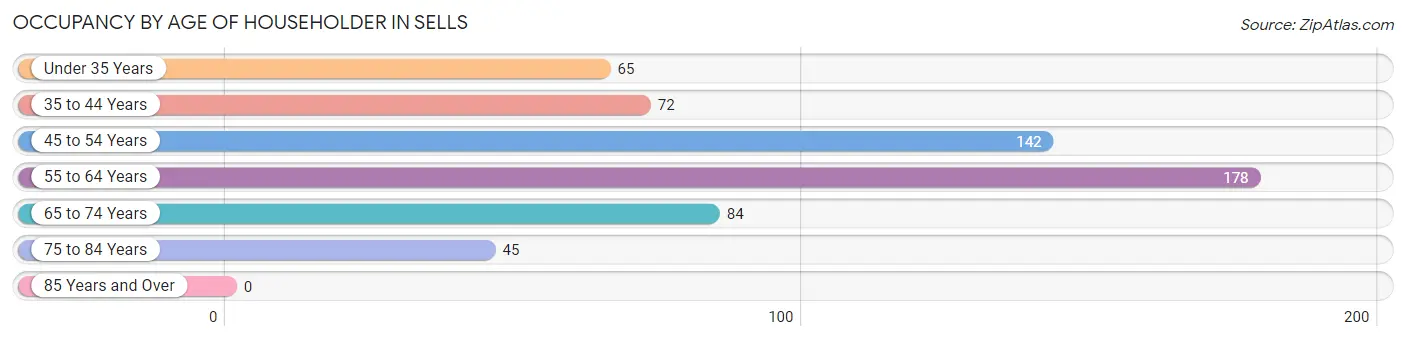
| Age Bracket | # Households | % Households |
| Under 35 Years | 65 | 11.1% |
| 35 to 44 Years | 72 | 12.3% |
| 45 to 54 Years | 142 | 24.2% |
| 55 to 64 Years | 178 | 30.4% |
| 65 to 74 Years | 84 | 14.3% |
| 75 to 84 Years | 45 | 7.7% |
| 85 Years and Over | 0 | 0.0% |
| Total | 586 | 100.0% |
Housing Finances in Sells
Median Income by Occupancy in Sells
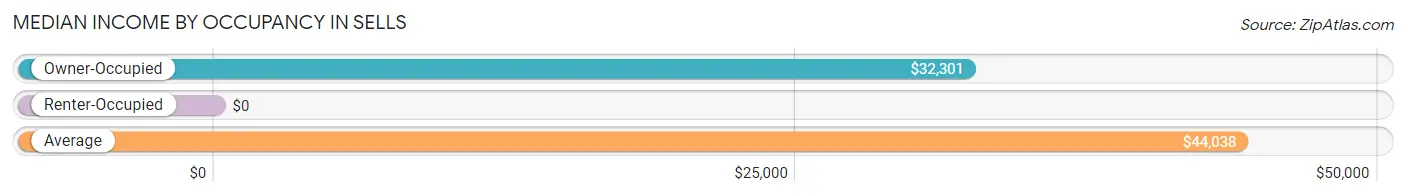
| Occupancy Type | # Households | Median Income |
| Owner-Occupied | 367 (62.6%) | $32,301 |
| Renter-Occupied | 219 (37.4%) | $0 |
| Average | 586 (100.0%) | $44,038 |
Occupancy by Householder Income Bracket in Sells
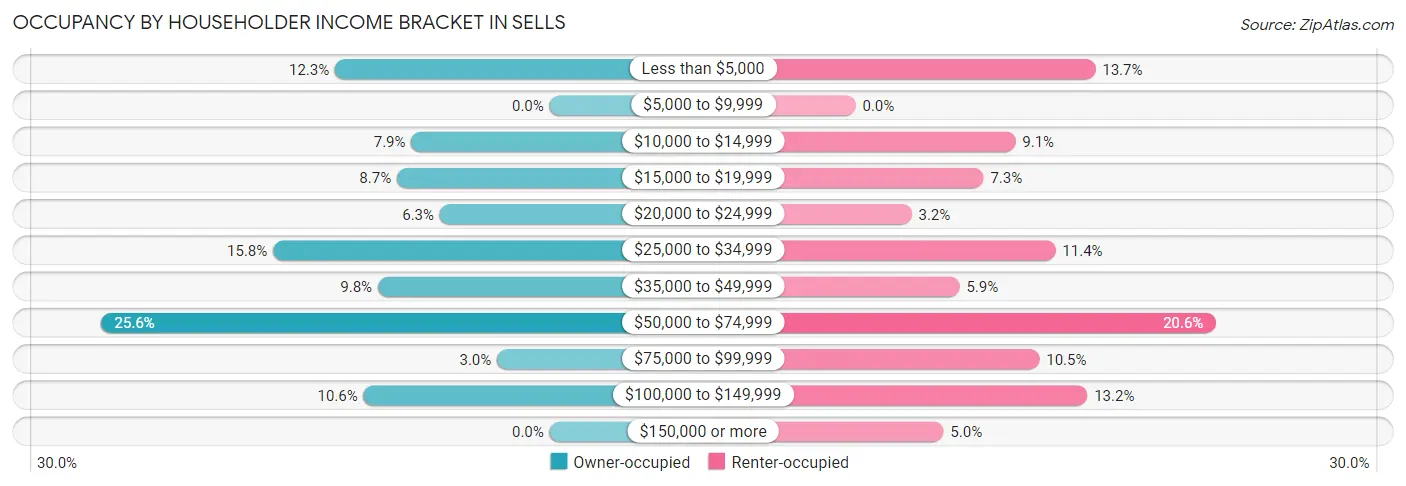
| Income Bracket | Owner-occupied | Renter-occupied |
| Less than $5,000 | 45 (12.3%) | 30 (13.7%) |
| $5,000 to $9,999 | 0 (0.0%) | 0 (0.0%) |
| $10,000 to $14,999 | 29 (7.9%) | 20 (9.1%) |
| $15,000 to $19,999 | 32 (8.7%) | 16 (7.3%) |
| $20,000 to $24,999 | 23 (6.3%) | 7 (3.2%) |
| $25,000 to $34,999 | 58 (15.8%) | 25 (11.4%) |
| $35,000 to $49,999 | 36 (9.8%) | 13 (5.9%) |
| $50,000 to $74,999 | 94 (25.6%) | 45 (20.5%) |
| $75,000 to $99,999 | 11 (3.0%) | 23 (10.5%) |
| $100,000 to $149,999 | 39 (10.6%) | 29 (13.2%) |
| $150,000 or more | 0 (0.0%) | 11 (5.0%) |
| Total | 367 (100.0%) | 219 (100.0%) |
Monthly Housing Cost Tiers in Sells
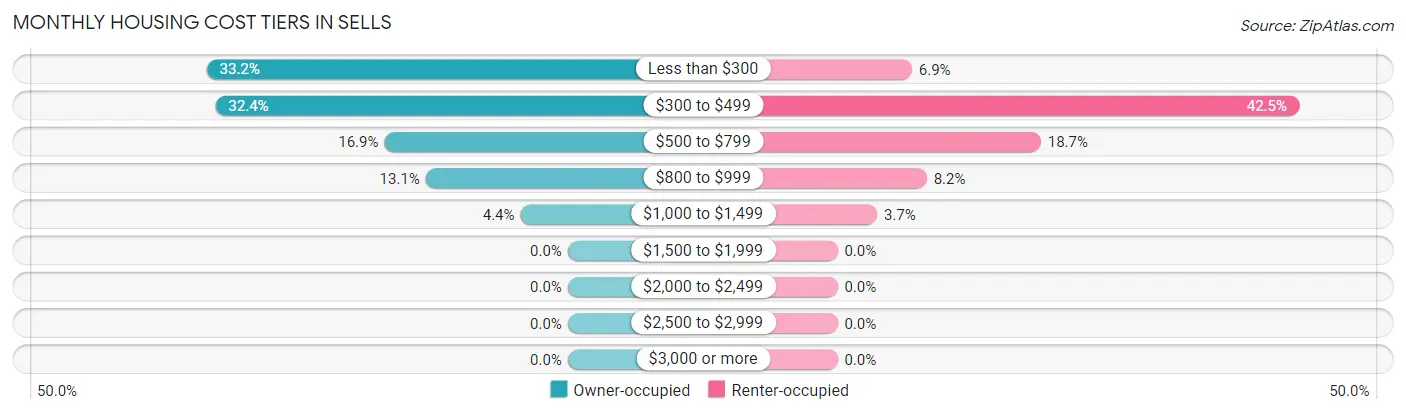
| Monthly Cost | Owner-occupied | Renter-occupied |
| Less than $300 | 122 (33.2%) | 15 (6.9%) |
| $300 to $499 | 119 (32.4%) | 93 (42.5%) |
| $500 to $799 | 62 (16.9%) | 41 (18.7%) |
| $800 to $999 | 48 (13.1%) | 18 (8.2%) |
| $1,000 to $1,499 | 16 (4.4%) | 8 (3.6%) |
| $1,500 to $1,999 | 0 (0.0%) | 0 (0.0%) |
| $2,000 to $2,499 | 0 (0.0%) | 0 (0.0%) |
| $2,500 to $2,999 | 0 (0.0%) | 0 (0.0%) |
| $3,000 or more | 0 (0.0%) | 0 (0.0%) |
| Total | 367 (100.0%) | 219 (100.0%) |
Physical Housing Characteristics in Sells
Housing Structures in Sells
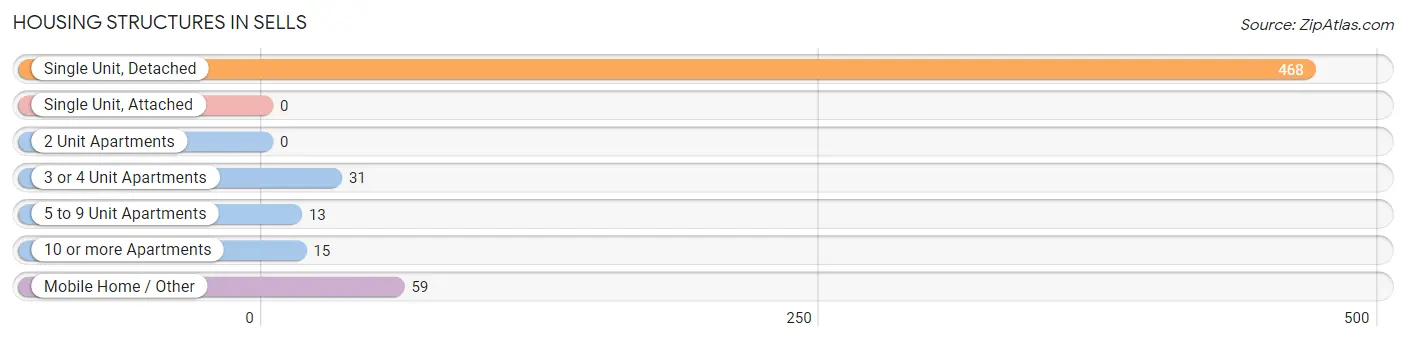
| Structure Type | # Housing Units | % Housing Units |
| Single Unit, Detached | 468 | 79.9% |
| Single Unit, Attached | 0 | 0.0% |
| 2 Unit Apartments | 0 | 0.0% |
| 3 or 4 Unit Apartments | 31 | 5.3% |
| 5 to 9 Unit Apartments | 13 | 2.2% |
| 10 or more Apartments | 15 | 2.6% |
| Mobile Home / Other | 59 | 10.1% |
| Total | 586 | 100.0% |
Housing Structures by Occupancy in Sells
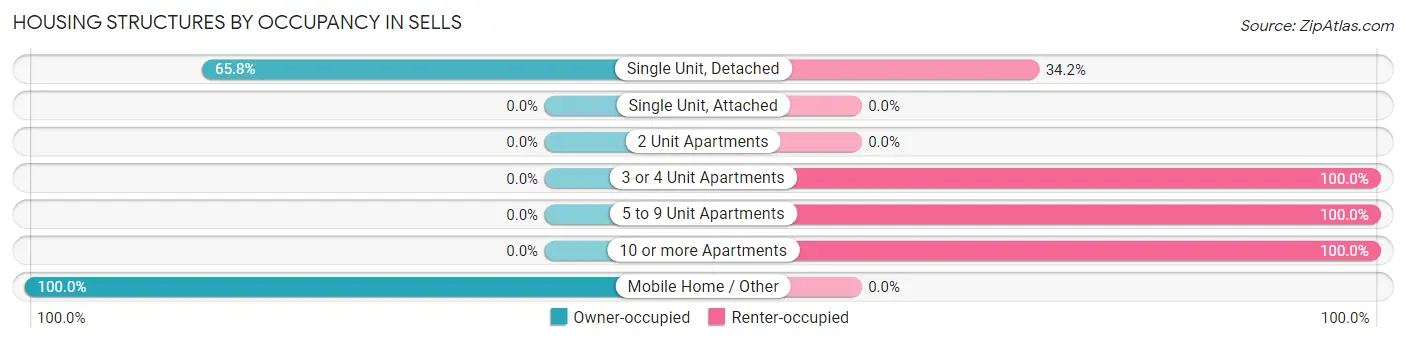
| Structure Type | Owner-occupied | Renter-occupied |
| Single Unit, Detached | 308 (65.8%) | 160 (34.2%) |
| Single Unit, Attached | 0 (0.0%) | 0 (0.0%) |
| 2 Unit Apartments | 0 (0.0%) | 0 (0.0%) |
| 3 or 4 Unit Apartments | 0 (0.0%) | 31 (100.0%) |
| 5 to 9 Unit Apartments | 0 (0.0%) | 13 (100.0%) |
| 10 or more Apartments | 0 (0.0%) | 15 (100.0%) |
| Mobile Home / Other | 59 (100.0%) | 0 (0.0%) |
| Total | 367 (62.6%) | 219 (37.4%) |
Housing Structures by Number of Rooms in Sells
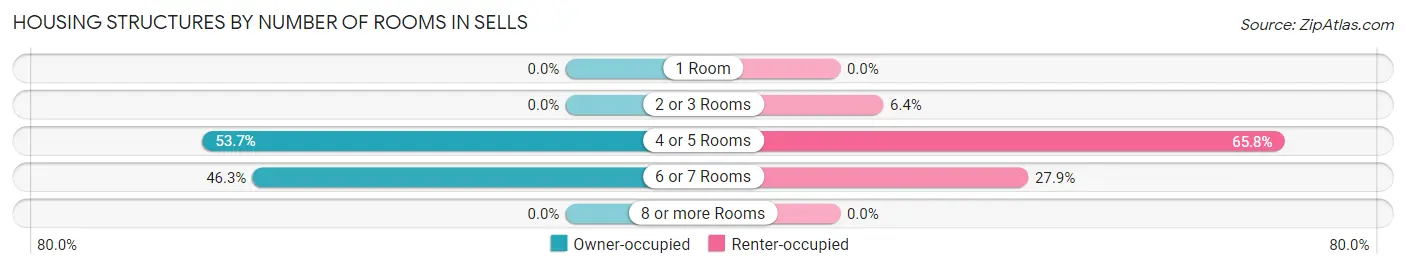
| Number of Rooms | Owner-occupied | Renter-occupied |
| 1 Room | 0 (0.0%) | 0 (0.0%) |
| 2 or 3 Rooms | 0 (0.0%) | 14 (6.4%) |
| 4 or 5 Rooms | 197 (53.7%) | 144 (65.7%) |
| 6 or 7 Rooms | 170 (46.3%) | 61 (27.9%) |
| 8 or more Rooms | 0 (0.0%) | 0 (0.0%) |
| Total | 367 (100.0%) | 219 (100.0%) |
Housing Structure by Heating Type in Sells
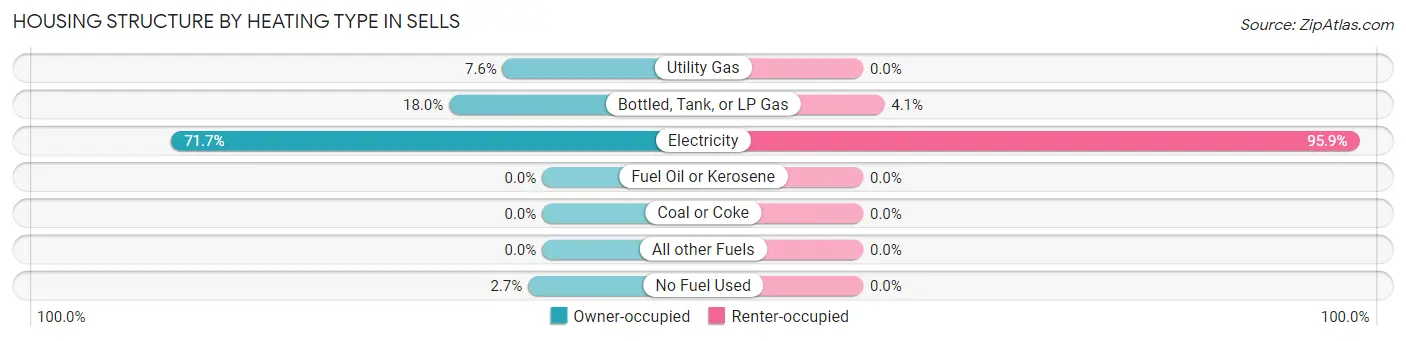
| Heating Type | Owner-occupied | Renter-occupied |
| Utility Gas | 28 (7.6%) | 0 (0.0%) |
| Bottled, Tank, or LP Gas | 66 (18.0%) | 9 (4.1%) |
| Electricity | 263 (71.7%) | 210 (95.9%) |
| Fuel Oil or Kerosene | 0 (0.0%) | 0 (0.0%) |
| Coal or Coke | 0 (0.0%) | 0 (0.0%) |
| All other Fuels | 0 (0.0%) | 0 (0.0%) |
| No Fuel Used | 10 (2.7%) | 0 (0.0%) |
| Total | 367 (100.0%) | 219 (100.0%) |
Household Vehicle Usage in Sells
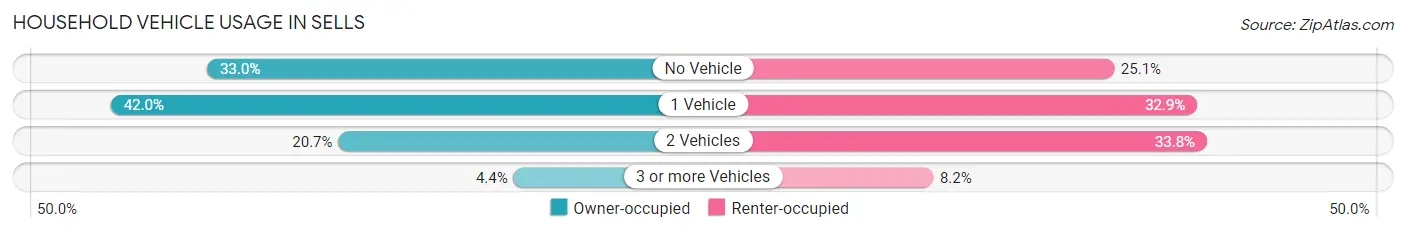
| Vehicles per Household | Owner-occupied | Renter-occupied |
| No Vehicle | 121 (33.0%) | 55 (25.1%) |
| 1 Vehicle | 154 (42.0%) | 72 (32.9%) |
| 2 Vehicles | 76 (20.7%) | 74 (33.8%) |
| 3 or more Vehicles | 16 (4.4%) | 18 (8.2%) |
| Total | 367 (100.0%) | 219 (100.0%) |
Real Estate & Mortgages in Sells
Real Estate and Mortgage Overview in Sells
| Characteristic | Without Mortgage | With Mortgage |
| Housing Units | 326 | 41 |
| Median Property Value | $37,900 | $179,500 |
| Median Household Income | $42,692 | $0 |
| Monthly Housing Costs | $351 | $0 |
| Real Estate Taxes | - | - |
Property Value by Mortgage Status in Sells
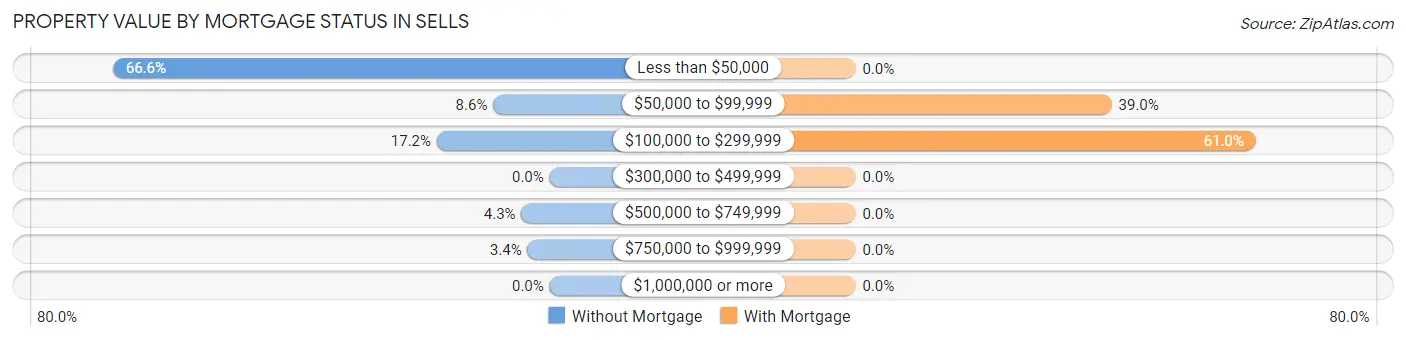
| Property Value | Without Mortgage | With Mortgage |
| Less than $50,000 | 217 (66.6%) | 0 (0.0%) |
| $50,000 to $99,999 | 28 (8.6%) | 16 (39.0%) |
| $100,000 to $299,999 | 56 (17.2%) | 25 (61.0%) |
| $300,000 to $499,999 | 0 (0.0%) | 0 (0.0%) |
| $500,000 to $749,999 | 14 (4.3%) | 0 (0.0%) |
| $750,000 to $999,999 | 11 (3.4%) | 0 (0.0%) |
| $1,000,000 or more | 0 (0.0%) | 0 (0.0%) |
| Total | 326 (100.0%) | 41 (100.0%) |
Household Income by Mortgage Status in Sells
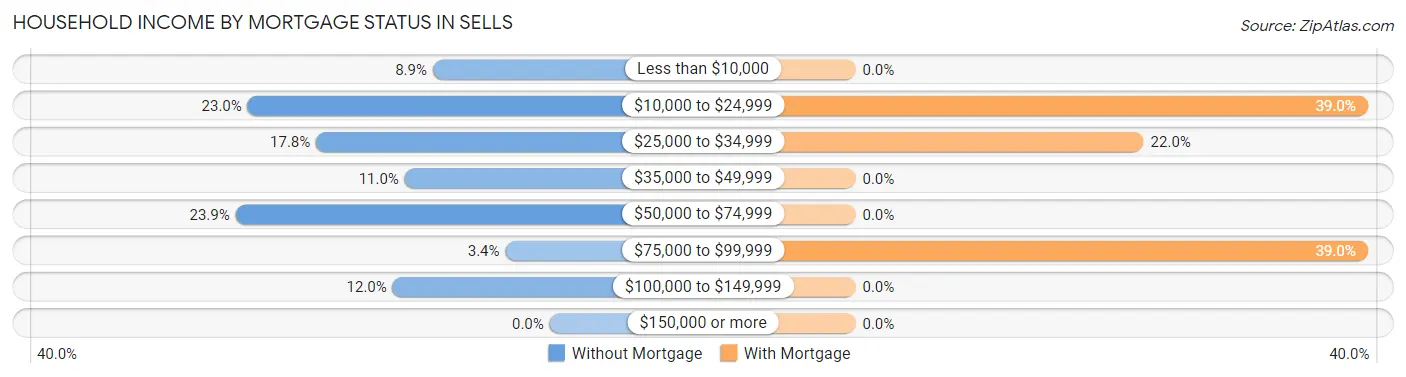
| Household Income | Without Mortgage | With Mortgage |
| Less than $10,000 | 29 (8.9%) | 0 (0.0%) |
| $10,000 to $24,999 | 75 (23.0%) | 16 (39.0%) |
| $25,000 to $34,999 | 58 (17.8%) | 9 (22.0%) |
| $35,000 to $49,999 | 36 (11.0%) | 0 (0.0%) |
| $50,000 to $74,999 | 78 (23.9%) | 0 (0.0%) |
| $75,000 to $99,999 | 11 (3.4%) | 16 (39.0%) |
| $100,000 to $149,999 | 39 (12.0%) | 0 (0.0%) |
| $150,000 or more | 0 (0.0%) | 0 (0.0%) |
| Total | 326 (100.0%) | 41 (100.0%) |
Property Value to Household Income Ratio in Sells
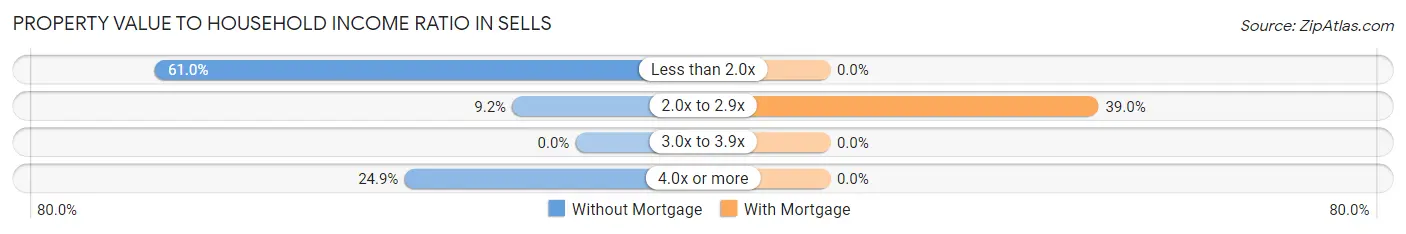
| Value-to-Income Ratio | Without Mortgage | With Mortgage |
| Less than 2.0x | 199 (61.0%) | 0 (0.0%) |
| 2.0x to 2.9x | 30 (9.2%) | 16 (39.0%) |
| 3.0x to 3.9x | 0 (0.0%) | 0 (0.0%) |
| 4.0x or more | 81 (24.8%) | 0 (0.0%) |
| Total | 326 (100.0%) | 41 (100.0%) |
Real Estate Taxes by Mortgage Status in Sells
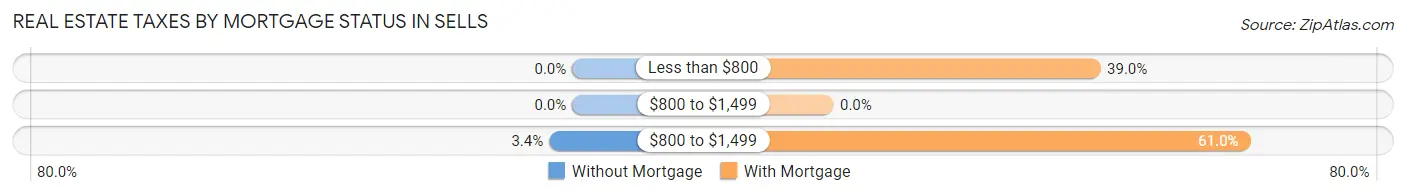
| Property Taxes | Without Mortgage | With Mortgage |
| Less than $800 | 0 (0.0%) | 16 (39.0%) |
| $800 to $1,499 | 0 (0.0%) | 0 (0.0%) |
| $800 to $1,499 | 11 (3.4%) | 25 (61.0%) |
| Total | 326 (100.0%) | 41 (100.0%) |
Health & Disability in Sells
Health Insurance Coverage by Age in Sells
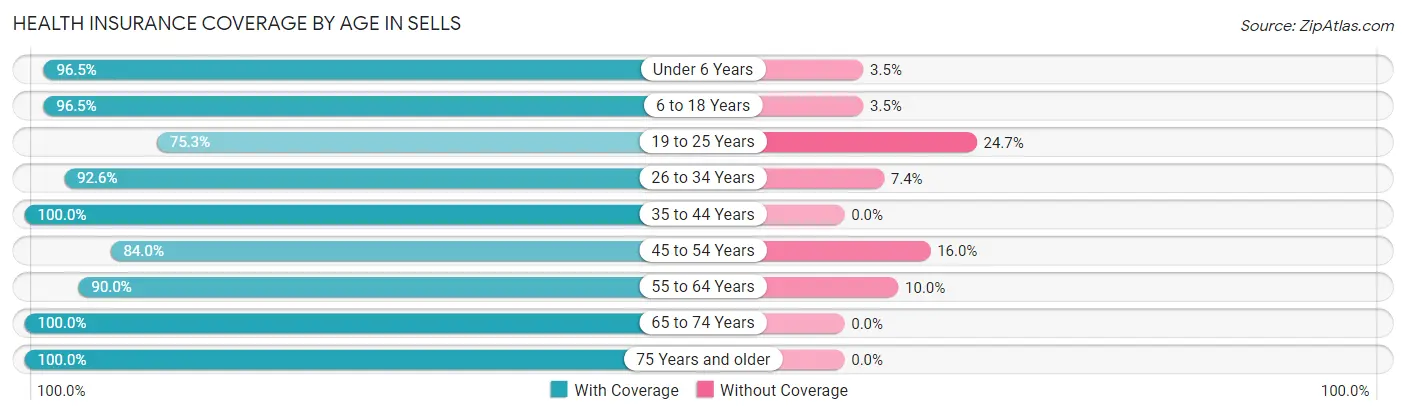
| Age Bracket | With Coverage | Without Coverage |
| Under 6 Years | 384 (96.5%) | 14 (3.5%) |
| 6 to 18 Years | 523 (96.5%) | 19 (3.5%) |
| 19 to 25 Years | 223 (75.3%) | 73 (24.7%) |
| 26 to 34 Years | 201 (92.6%) | 16 (7.4%) |
| 35 to 44 Years | 142 (100.0%) | 0 (0.0%) |
| 45 to 54 Years | 215 (84.0%) | 41 (16.0%) |
| 55 to 64 Years | 233 (90.0%) | 26 (10.0%) |
| 65 to 74 Years | 109 (100.0%) | 0 (0.0%) |
| 75 Years and older | 56 (100.0%) | 0 (0.0%) |
| Total | 2,086 (91.7%) | 189 (8.3%) |
Health Insurance Coverage by Citizenship Status in Sells
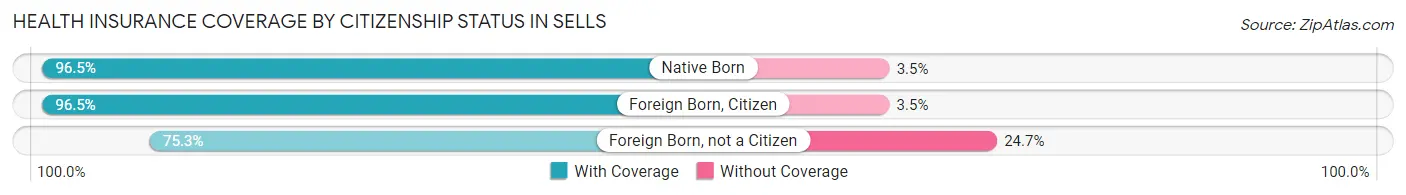
| Citizenship Status | With Coverage | Without Coverage |
| Native Born | 384 (96.5%) | 14 (3.5%) |
| Foreign Born, Citizen | 523 (96.5%) | 19 (3.5%) |
| Foreign Born, not a Citizen | 223 (75.3%) | 73 (24.7%) |
Health Insurance Coverage by Household Income in Sells
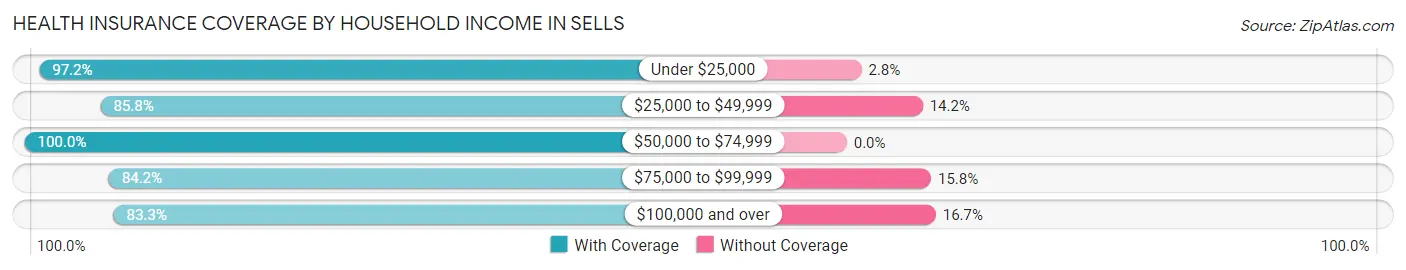
| Household Income | With Coverage | Without Coverage |
| Under $25,000 | 635 (97.2%) | 18 (2.8%) |
| $25,000 to $49,999 | 543 (85.8%) | 90 (14.2%) |
| $50,000 to $74,999 | 493 (100.0%) | 0 (0.0%) |
| $75,000 to $99,999 | 160 (84.2%) | 30 (15.8%) |
| $100,000 and over | 255 (83.3%) | 51 (16.7%) |
Public vs Private Health Insurance Coverage by Age in Sells
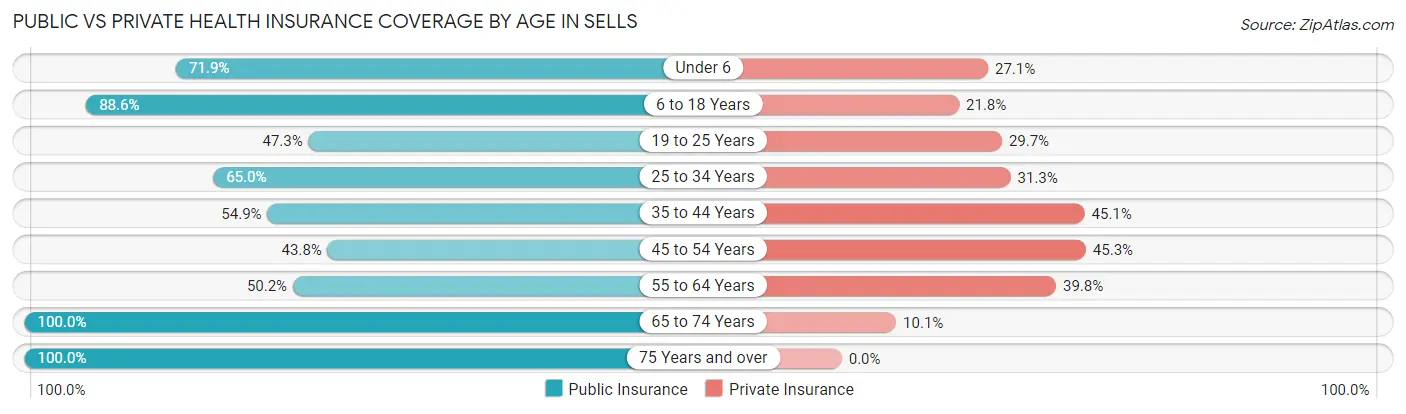
| Age Bracket | Public Insurance | Private Insurance |
| Under 6 | 286 (71.9%) | 108 (27.1%) |
| 6 to 18 Years | 480 (88.6%) | 118 (21.8%) |
| 19 to 25 Years | 140 (47.3%) | 88 (29.7%) |
| 25 to 34 Years | 141 (65.0%) | 68 (31.3%) |
| 35 to 44 Years | 78 (54.9%) | 64 (45.1%) |
| 45 to 54 Years | 112 (43.8%) | 116 (45.3%) |
| 55 to 64 Years | 130 (50.2%) | 103 (39.8%) |
| 65 to 74 Years | 109 (100.0%) | 11 (10.1%) |
| 75 Years and over | 56 (100.0%) | 0 (0.0%) |
| Total | 1,532 (67.3%) | 676 (29.7%) |
Disability Status by Sex by Age in Sells
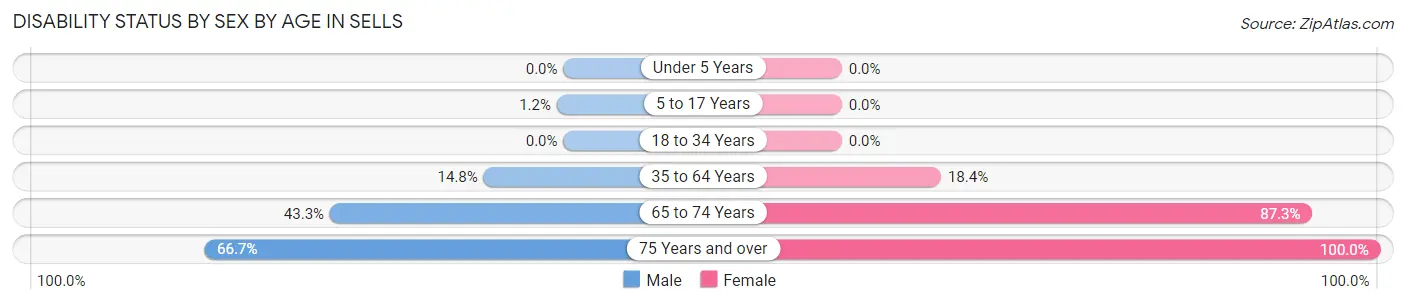
| Age Bracket | Male | Female |
| Under 5 Years | 0 (0.0%) | 0 (0.0%) |
| 5 to 17 Years | 4 (1.2%) | 0 (0.0%) |
| 18 to 34 Years | 0 (0.0%) | 0 (0.0%) |
| 35 to 64 Years | 45 (14.8%) | 65 (18.4%) |
| 65 to 74 Years | 13 (43.3%) | 69 (87.3%) |
| 75 Years and over | 22 (66.7%) | 23 (100.0%) |
Disability Class by Sex by Age in Sells
Disability Class: Hearing Difficulty
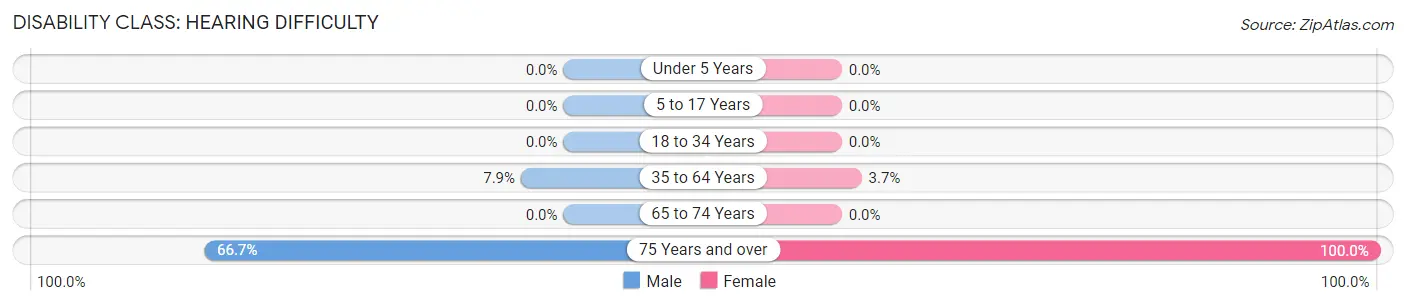
| Age Bracket | Male | Female |
| Under 5 Years | 0 (0.0%) | 0 (0.0%) |
| 5 to 17 Years | 0 (0.0%) | 0 (0.0%) |
| 18 to 34 Years | 0 (0.0%) | 0 (0.0%) |
| 35 to 64 Years | 24 (7.9%) | 13 (3.7%) |
| 65 to 74 Years | 0 (0.0%) | 0 (0.0%) |
| 75 Years and over | 22 (66.7%) | 23 (100.0%) |
Disability Class: Vision Difficulty
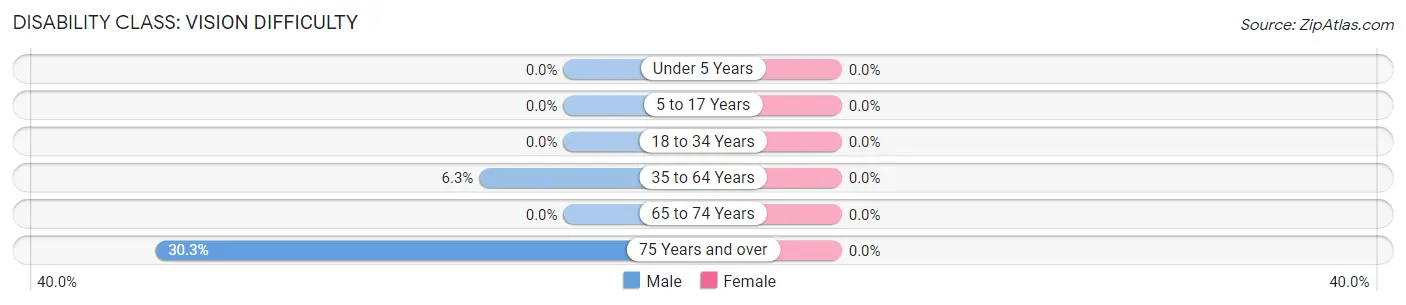
| Age Bracket | Male | Female |
| Under 5 Years | 0 (0.0%) | 0 (0.0%) |
| 5 to 17 Years | 0 (0.0%) | 0 (0.0%) |
| 18 to 34 Years | 0 (0.0%) | 0 (0.0%) |
| 35 to 64 Years | 19 (6.2%) | 0 (0.0%) |
| 65 to 74 Years | 0 (0.0%) | 0 (0.0%) |
| 75 Years and over | 10 (30.3%) | 0 (0.0%) |
Disability Class: Cognitive Difficulty
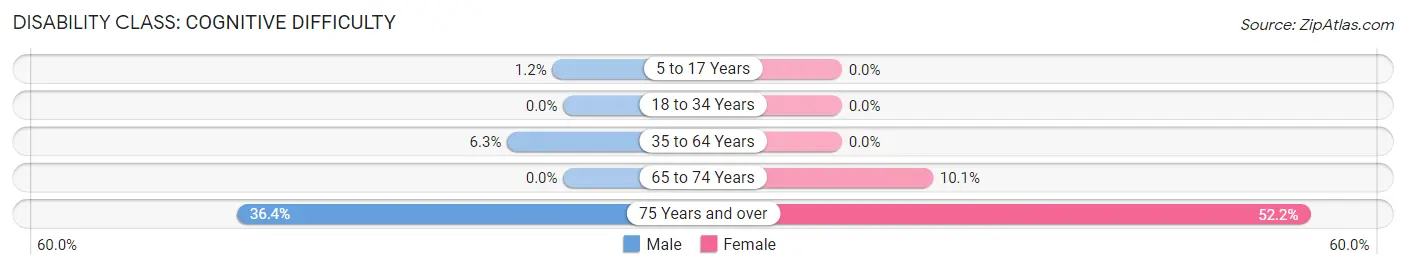
| Age Bracket | Male | Female |
| 5 to 17 Years | 4 (1.2%) | 0 (0.0%) |
| 18 to 34 Years | 0 (0.0%) | 0 (0.0%) |
| 35 to 64 Years | 19 (6.2%) | 0 (0.0%) |
| 65 to 74 Years | 0 (0.0%) | 8 (10.1%) |
| 75 Years and over | 12 (36.4%) | 12 (52.2%) |
Disability Class: Ambulatory Difficulty
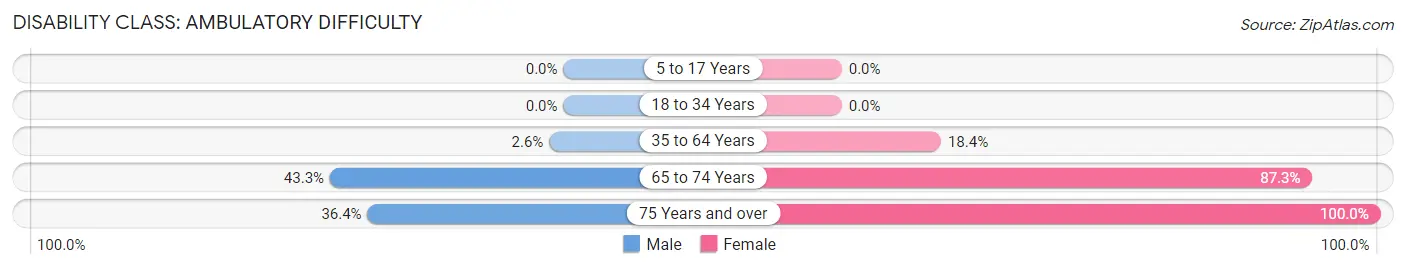
| Age Bracket | Male | Female |
| 5 to 17 Years | 0 (0.0%) | 0 (0.0%) |
| 18 to 34 Years | 0 (0.0%) | 0 (0.0%) |
| 35 to 64 Years | 8 (2.6%) | 65 (18.4%) |
| 65 to 74 Years | 13 (43.3%) | 69 (87.3%) |
| 75 Years and over | 12 (36.4%) | 23 (100.0%) |
Disability Class: Self-Care Difficulty
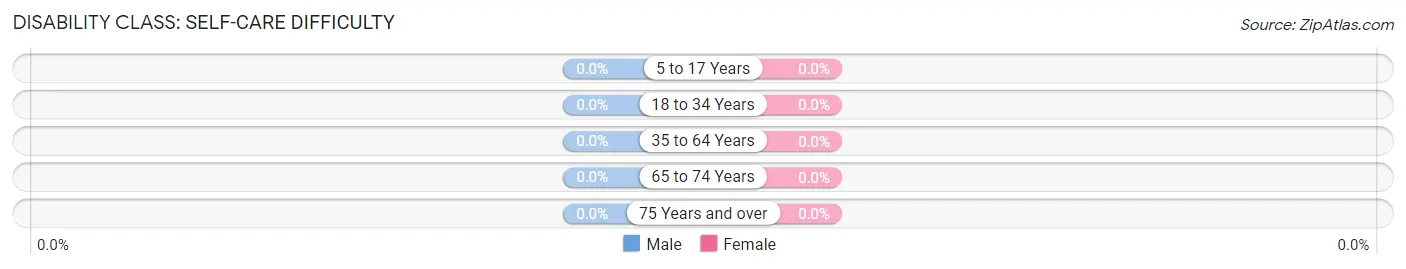
| Age Bracket | Male | Female |
| 5 to 17 Years | 0 (0.0%) | 0 (0.0%) |
| 18 to 34 Years | 0 (0.0%) | 0 (0.0%) |
| 35 to 64 Years | 0 (0.0%) | 0 (0.0%) |
| 65 to 74 Years | 0 (0.0%) | 0 (0.0%) |
| 75 Years and over | 0 (0.0%) | 0 (0.0%) |
Technology Access in Sells
Computing Device Access in Sells
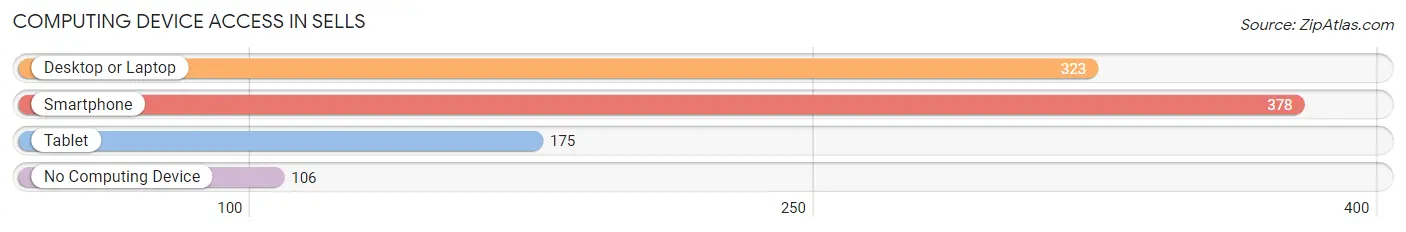
| Device Type | # Households | % Households |
| Desktop or Laptop | 323 | 55.1% |
| Smartphone | 378 | 64.5% |
| Tablet | 175 | 29.9% |
| No Computing Device | 106 | 18.1% |
| Total | 586 | 100.0% |
Internet Access in Sells
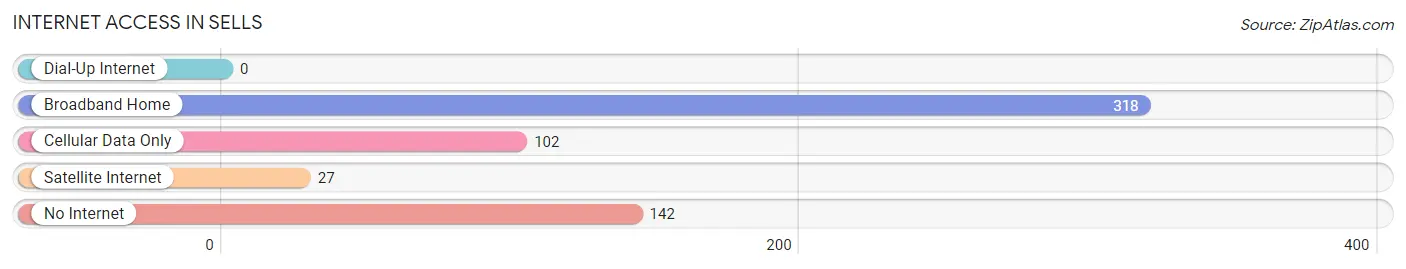
| Internet Type | # Households | % Households |
| Dial-Up Internet | 0 | 0.0% |
| Broadband Home | 318 | 54.3% |
| Cellular Data Only | 102 | 17.4% |
| Satellite Internet | 27 | 4.6% |
| No Internet | 142 | 24.2% |
| Total | 586 | 100.0% |
Sells Summary
Sells is a census-designated place (CDP) located in the Tohono O’odham Nation in Pima County, Arizona. It is the administrative center of the Tohono O’odham Nation and is located about 60 miles southwest of Tucson. The population of Sells was 1,890 at the 2010 census.
History
The area that is now Sells was originally inhabited by the Tohono O’odham people. The Tohono O’odham Nation is the second largest Native American tribe in the United States. The tribe has lived in the area for thousands of years and has a rich cultural history.
The town of Sells was established in the early 1900s by the Bureau of Indian Affairs. The town was named after Indian Commissioner Cato Sells, who was appointed by President Theodore Roosevelt in 1903. The town was originally intended to be a trading post for the Tohono O’odham people.
In the early 1900s, Sells was a small, isolated town with a population of only a few hundred people. The town was largely self-sufficient, with a few stores, a post office, and a school.
In the 1950s, the town began to grow as more people moved to the area. The population of Sells increased to over 1,000 by the 1970s.
Geography
Sells is located in the Sonoran Desert in southwestern Arizona. The town is situated in the foothills of the Baboquivari Mountains, which are part of the Sky Islands mountain range. The town is located about 60 miles southwest of Tucson and is bordered by the Tohono O’odham Nation to the east and the San Xavier Indian Reservation to the west.
The climate in Sells is hot and dry, with temperatures ranging from the mid-90s in the summer to the mid-50s in the winter. The area receives an average of 8 inches of rain per year.
Economy
The economy of Sells is largely based on tourism and agriculture. The town is home to several tourist attractions, including the Tohono O’odham Cultural Center and Museum, the Sells Indian Market, and the Sells Rodeo.
Agriculture is also an important part of the local economy. The area is known for its production of cotton, alfalfa, and other crops.
Demographics
As of the 2010 census, the population of Sells was 1,890. The population is largely Native American, with the Tohono O’odham people making up the majority of the population. The median age in Sells is 28.7 years, and the median household income is $25,000.
Common Questions
What is Per Capita Income in Sells?
Per Capita income in Sells is $12,560.
What is the Median Family Income in Sells?
Median Family Income in Sells is $43,452.
What is the Median Household income in Sells?
Median Household Income in Sells is $44,038.
What is Income or Wage Gap in Sells?
Income or Wage Gap in Sells is 33.1%.
Women in Sells earn 66.9 cents for every dollar earned by a man.
What is Inequality or Gini Index in Sells?
Inequality or Gini Index in Sells is 0.46.
What is the Total Population of Sells?
Total Population of Sells is 2,422.
What is the Total Male Population of Sells?
Total Male Population of Sells is 1,241.
What is the Total Female Population of Sells?
Total Female Population of Sells is 1,181.
What is the Ratio of Males per 100 Females in Sells?
There are 105.08 Males per 100 Females in Sells.
What is the Ratio of Females per 100 Males in Sells?
There are 95.17 Females per 100 Males in Sells.
What is the Median Population Age in Sells?
Median Population Age in Sells is 24.8 Years.
What is the Average Family Size in Sells
Average Family Size in Sells is 4.1 People.
What is the Average Household Size in Sells
Average Household Size in Sells is 3.9 People.
How Large is the Labor Force in Sells?
There are 652 People in the Labor Forcein in Sells.
What is the Percentage of People in the Labor Force in Sells?
39.5% of People are in the Labor Force in Sells.
What is the Unemployment Rate in Sells?
Unemployment Rate in Sells is 15.5%.