Zip Codes with the Highest Percentage of Population Employed in Food Preparation & Serving in Casa Grande, AZ
RELATED REPORTS & OPTIONS
Food Preparation & Serving
Casa Grande
Compare Zip Codes
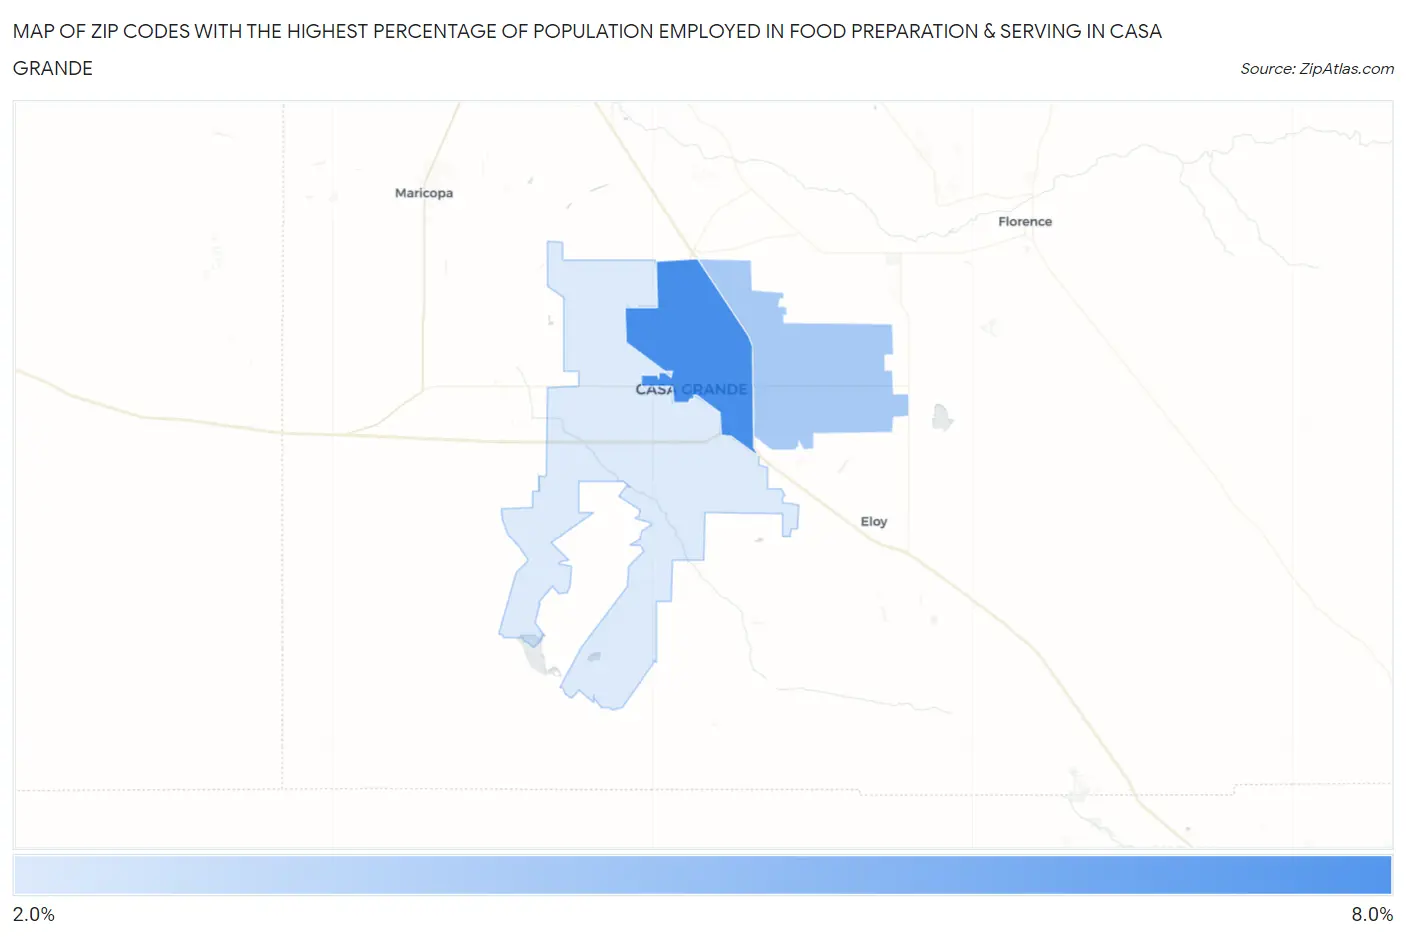
Map of Zip Codes with the Highest Percentage of Population Employed in Food Preparation & Serving in Casa Grande
2.8%
6.6%
Zip Codes with the Highest Percentage of Population Employed in Food Preparation & Serving in Casa Grande, AZ
| Zip Code | % Employed | vs State | vs National | |
| 1. | 85122 | 6.6% | 5.7%(+0.915)#122 | 5.3%(+1.30)#7,648 |
| 2. | 85194 | 4.1% | 5.7%(-1.55)#241 | 5.3%(-1.17)#16,625 |
| 3. | 85193 | 2.8% | 5.7%(-2.84)#306 | 5.3%(-2.46)#21,966 |
1
Common Questions
What are the Top Zip Codes with the Highest Percentage of Population Employed in Food Preparation & Serving in Casa Grande, AZ?
Top Zip Codes with the Highest Percentage of Population Employed in Food Preparation & Serving in Casa Grande, AZ are:
What zip code has the Highest Percentage of Population Employed in Food Preparation & Serving in Casa Grande, AZ?
85122 has the Highest Percentage of Population Employed in Food Preparation & Serving in Casa Grande, AZ with 6.6%.
What is the Percentage of Population Employed in Food Preparation & Serving in Casa Grande, AZ?
Percentage of Population Employed in Food Preparation & Serving in Casa Grande is 6.4%.
What is the Percentage of Population Employed in Food Preparation & Serving in Arizona?
Percentage of Population Employed in Food Preparation & Serving in Arizona is 5.7%.
What is the Percentage of Population Employed in Food Preparation & Serving in the United States?
Percentage of Population Employed in Food Preparation & Serving in the United States is 5.3%.