Beaver Valley, AZ Map & Demographics
Beaver Valley Map
Beaver Valley Overview
$27,485
PER CAPITA INCOME
$64,028
AVG FAMILY INCOME
$32,014
AVG HOUSEHOLD INCOME
0.28
INEQUALITY / GINI INDEX
133
TOTAL POPULATION
55
MALE POPULATION
78
FEMALE POPULATION
70.51
MALES / 100 FEMALES
141.82
FEMALES / 100 MALES
63.8
MEDIAN AGE
2.5
AVG FAMILY SIZE
1.6
AVG HOUSEHOLD SIZE
42
LABOR FORCE [ PEOPLE ]
33.9%
PERCENT IN LABOR FORCE
Income in Beaver Valley
Income Overview in Beaver Valley
Per Capita Income in Beaver Valley is $27,485, while median incomes of families and households are $64,028 and $32,014 respectively.
| Characteristic | Number | Measure |
| Per Capita Income | 133 | $27,485 |
| Median Family Income | 29 | $64,028 |
| Mean Family Income | 29 | $62,034 |
| Median Household Income | 86 | $32,014 |
| Mean Household Income | 86 | $43,901 |
| Income Deficit | 29 | $0 |
| Wage / Income Gap (%) | 133 | 0.00% |
| Wage / Income Gap ($) | 133 | 100.00¢ per $1 |
| Gini / Inequality Index | 133 | 0.28 |
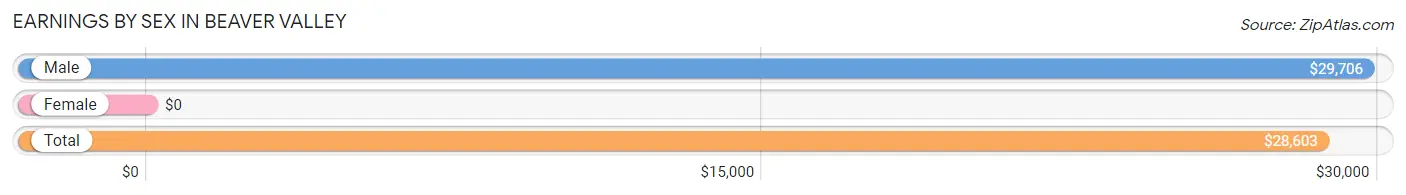
Earnings by Sex in Beaver Valley
| Sex | Number | Average Earnings |
| Male | 36 (70.6%) | $29,706 |
| Female | 15 (29.4%) | $0 |
| Total | 51 (100.0%) | $28,603 |
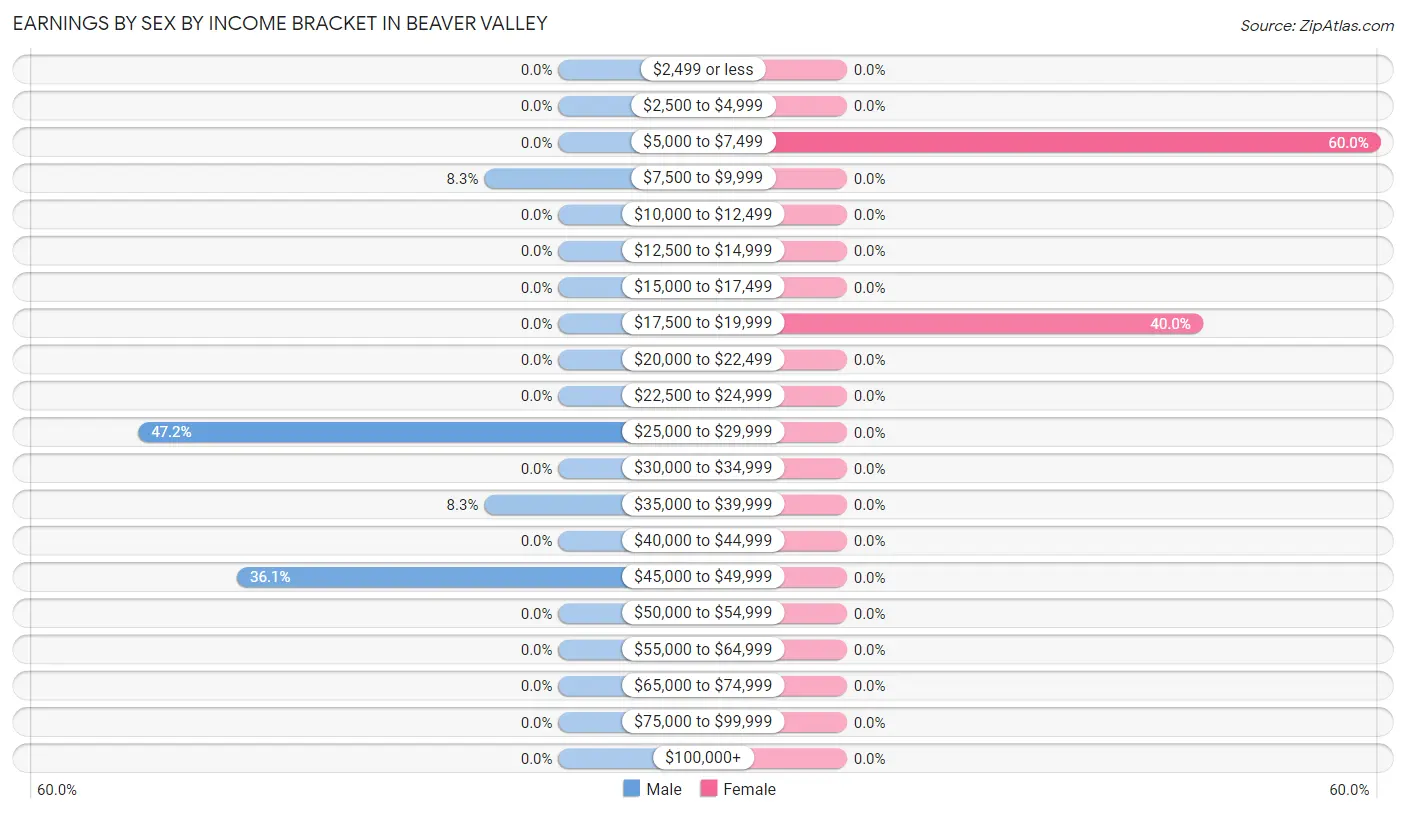
Earnings by Sex by Income Bracket in Beaver Valley
The most common earnings brackets in Beaver Valley are $25,000 to $29,999 for men (17 | 47.2%) and $5,000 to $7,499 for women (9 | 60.0%).
| Income | Male | Female |
| $2,499 or less | 0 (0.0%) | 0 (0.0%) |
| $2,500 to $4,999 | 0 (0.0%) | 0 (0.0%) |
| $5,000 to $7,499 | 0 (0.0%) | 9 (60.0%) |
| $7,500 to $9,999 | 3 (8.3%) | 0 (0.0%) |
| $10,000 to $12,499 | 0 (0.0%) | 0 (0.0%) |
| $12,500 to $14,999 | 0 (0.0%) | 0 (0.0%) |
| $15,000 to $17,499 | 0 (0.0%) | 0 (0.0%) |
| $17,500 to $19,999 | 0 (0.0%) | 6 (40.0%) |
| $20,000 to $22,499 | 0 (0.0%) | 0 (0.0%) |
| $22,500 to $24,999 | 0 (0.0%) | 0 (0.0%) |
| $25,000 to $29,999 | 17 (47.2%) | 0 (0.0%) |
| $30,000 to $34,999 | 0 (0.0%) | 0 (0.0%) |
| $35,000 to $39,999 | 3 (8.3%) | 0 (0.0%) |
| $40,000 to $44,999 | 0 (0.0%) | 0 (0.0%) |
| $45,000 to $49,999 | 13 (36.1%) | 0 (0.0%) |
| $50,000 to $54,999 | 0 (0.0%) | 0 (0.0%) |
| $55,000 to $64,999 | 0 (0.0%) | 0 (0.0%) |
| $65,000 to $74,999 | 0 (0.0%) | 0 (0.0%) |
| $75,000 to $99,999 | 0 (0.0%) | 0 (0.0%) |
| $100,000+ | 0 (0.0%) | 0 (0.0%) |
| Total | 36 (100.0%) | 15 (100.0%) |
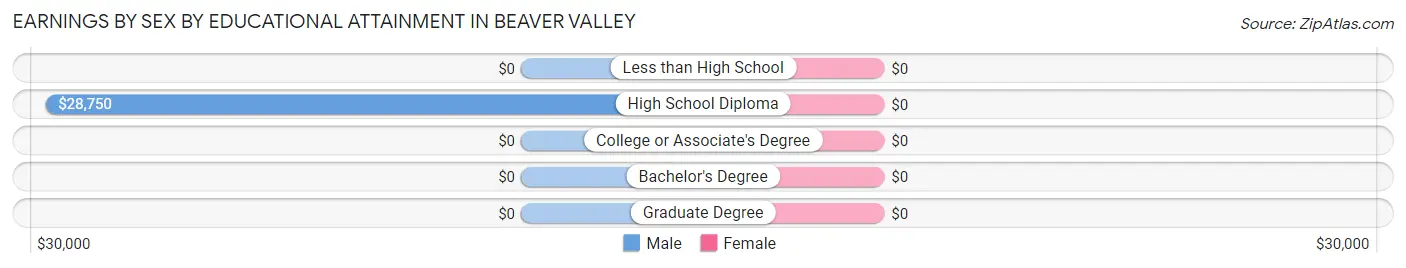
Earnings by Sex by Educational Attainment in Beaver Valley
| Educational Attainment | Male Income | Female Income |
| Less than High School | - | - |
| High School Diploma | $28,750 | $0 |
| College or Associate's Degree | - | - |
| Bachelor's Degree | - | - |
| Graduate Degree | - | - |
| Total | $29,706 | $0 |
Family Income in Beaver Valley
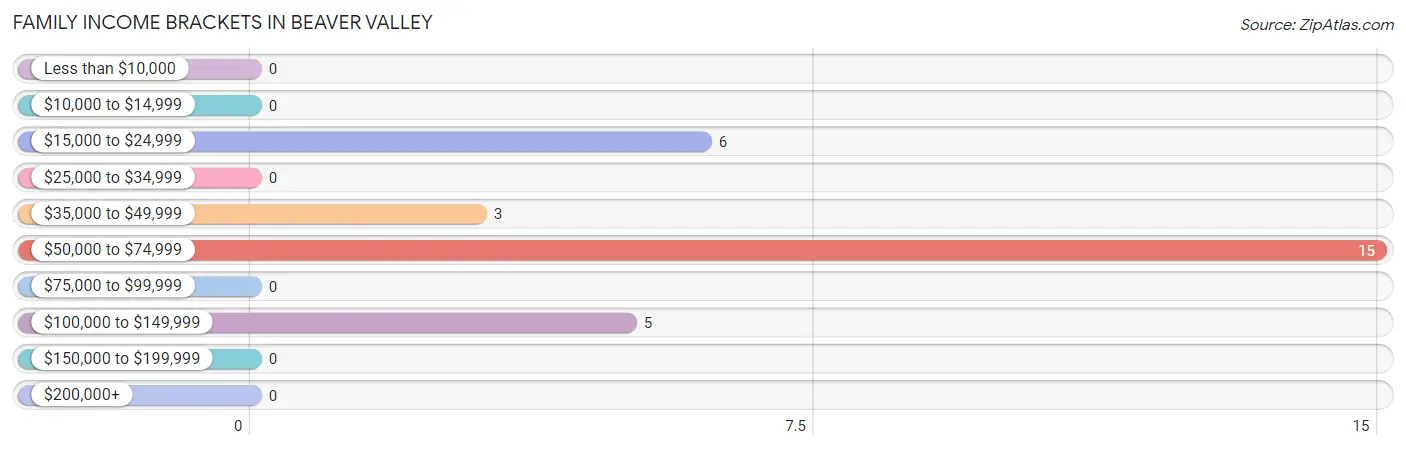
Family Income Brackets in Beaver Valley
According to the Beaver Valley family income data, there are 15 families falling into the $50,000 to $74,999 income range, which is the most common income bracket and makes up 51.7% of all families.
| Income Bracket | # Families | % Families |
| Less than $10,000 | 0 | 0.0% |
| $10,000 to $14,999 | 0 | 0.0% |
| $15,000 to $24,999 | 6 | 20.7% |
| $25,000 to $34,999 | 0 | 0.0% |
| $35,000 to $49,999 | 3 | 10.3% |
| $50,000 to $74,999 | 15 | 51.7% |
| $75,000 to $99,999 | 0 | 0.0% |
| $100,000 to $149,999 | 5 | 17.2% |
| $150,000 to $199,999 | 0 | 0.0% |
| $200,000+ | 0 | 0.0% |
Family Income by Famaliy Size in Beaver Valley
| Income Bracket | # Families | Median Income |
| 2-Person Families | 20 (69.0%) | $0 |
| 3-Person Families | 0 (0.0%) | $0 |
| 4-Person Families | 9 (31.0%) | $0 |
| 5-Person Families | 0 (0.0%) | $0 |
| 6-Person Families | 0 (0.0%) | $0 |
| 7+ Person Families | 0 (0.0%) | $0 |
| Total | 29 (100.0%) | $64,028 |
Family Income by Number of Earners in Beaver Valley
| Number of Earners | # Families | Median Income |
| No Earners | 11 (37.9%) | $0 |
| 1 Earner | 9 (31.0%) | $0 |
| 2 Earners | 0 (0.0%) | $0 |
| 3+ Earners | 9 (31.0%) | $0 |
| Total | 29 (100.0%) | $64,028 |
Household Income in Beaver Valley
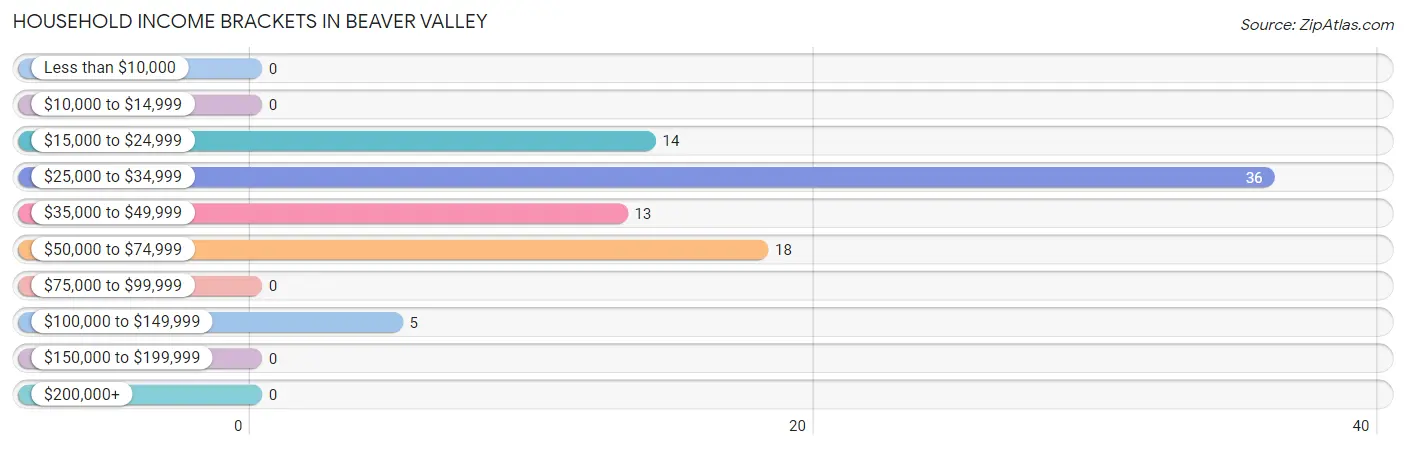
Household Income Brackets in Beaver Valley
With 36 households falling in the category, the $25,000 to $34,999 income range is the most frequent in Beaver Valley, accounting for 41.9% of all households.
| Income Bracket | # Households | % Households |
| Less than $10,000 | 0 | 0.0% |
| $10,000 to $14,999 | 0 | 0.0% |
| $15,000 to $24,999 | 14 | 16.3% |
| $25,000 to $34,999 | 36 | 41.9% |
| $35,000 to $49,999 | 13 | 15.1% |
| $50,000 to $74,999 | 18 | 20.9% |
| $75,000 to $99,999 | 0 | 0.0% |
| $100,000 to $149,999 | 5 | 5.8% |
| $150,000 to $199,999 | 0 | 0.0% |
| $200,000+ | 0 | 0.0% |
Household Income by Householder Age in Beaver Valley
The median household income in Beaver Valley is $32,014, with the highest median household income of $46,346 found in the 45 to 64 years age bracket for the primary householder. A total of 30 households (34.9%) fall into this category.
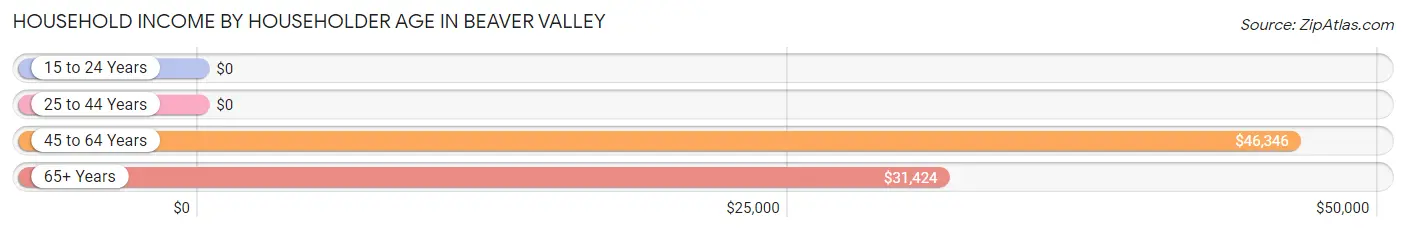
| Income Bracket | # Households | Median Income |
| 15 to 24 Years | 0 (0.0%) | $0 |
| 25 to 44 Years | 3 (3.5%) | $0 |
| 45 to 64 Years | 30 (34.9%) | $46,346 |
| 65+ Years | 53 (61.6%) | $31,424 |
| Total | 86 (100.0%) | $32,014 |
Poverty in Beaver Valley
Income Below Poverty by Sex and Age in Beaver Valley
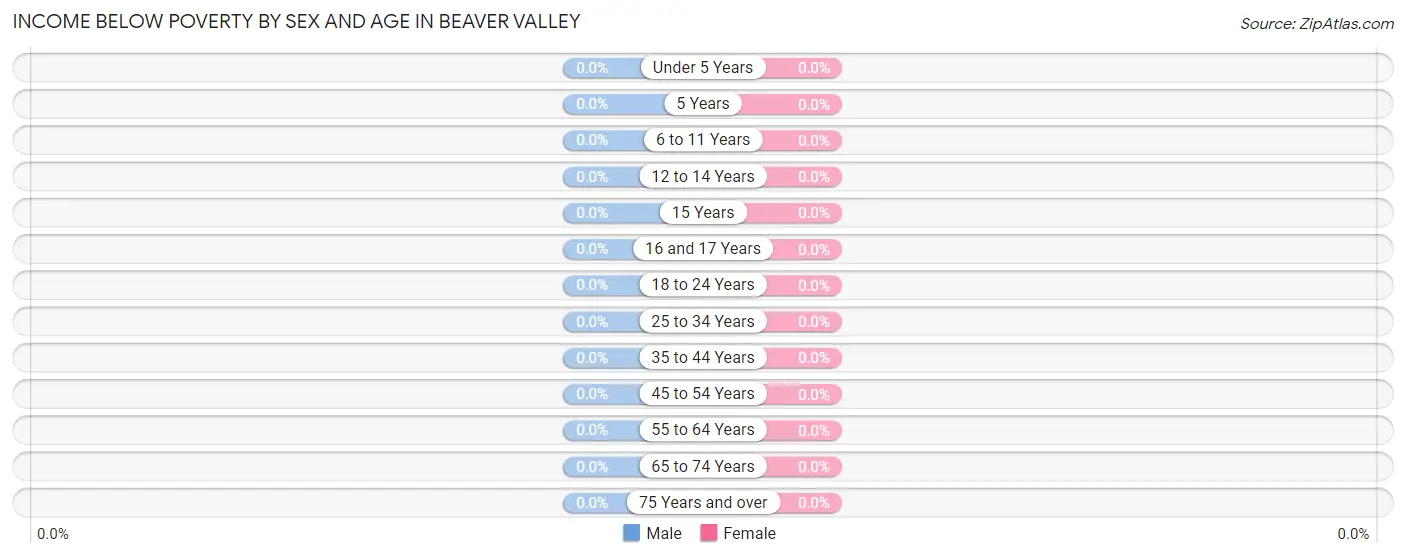
| Age Bracket | Male | Female |
| Under 5 Years | 0 (0.0%) | 0 (0.0%) |
| 5 Years | 0 (0.0%) | 0 (0.0%) |
| 6 to 11 Years | 0 (0.0%) | 0 (0.0%) |
| 12 to 14 Years | 0 (0.0%) | 0 (0.0%) |
| 15 Years | 0 (0.0%) | 0 (0.0%) |
| 16 and 17 Years | 0 (0.0%) | 0 (0.0%) |
| 18 to 24 Years | 0 (0.0%) | 0 (0.0%) |
| 25 to 34 Years | 0 (0.0%) | 0 (0.0%) |
| 35 to 44 Years | 0 (0.0%) | 0 (0.0%) |
| 45 to 54 Years | 0 (0.0%) | 0 (0.0%) |
| 55 to 64 Years | 0 (0.0%) | 0 (0.0%) |
| 65 to 74 Years | 0 (0.0%) | 0 (0.0%) |
| 75 Years and over | 0 (0.0%) | 0 (0.0%) |
| Total | 0 (0.0%) | 0 (0.0%) |
Income Above Poverty by Sex and Age in Beaver Valley
According to the poverty statistics in Beaver Valley, males aged 25 to 34 years and females aged under 5 years are the age groups that are most secure financially, with 100.0% of males and 100.0% of females in these age groups living above the poverty line.
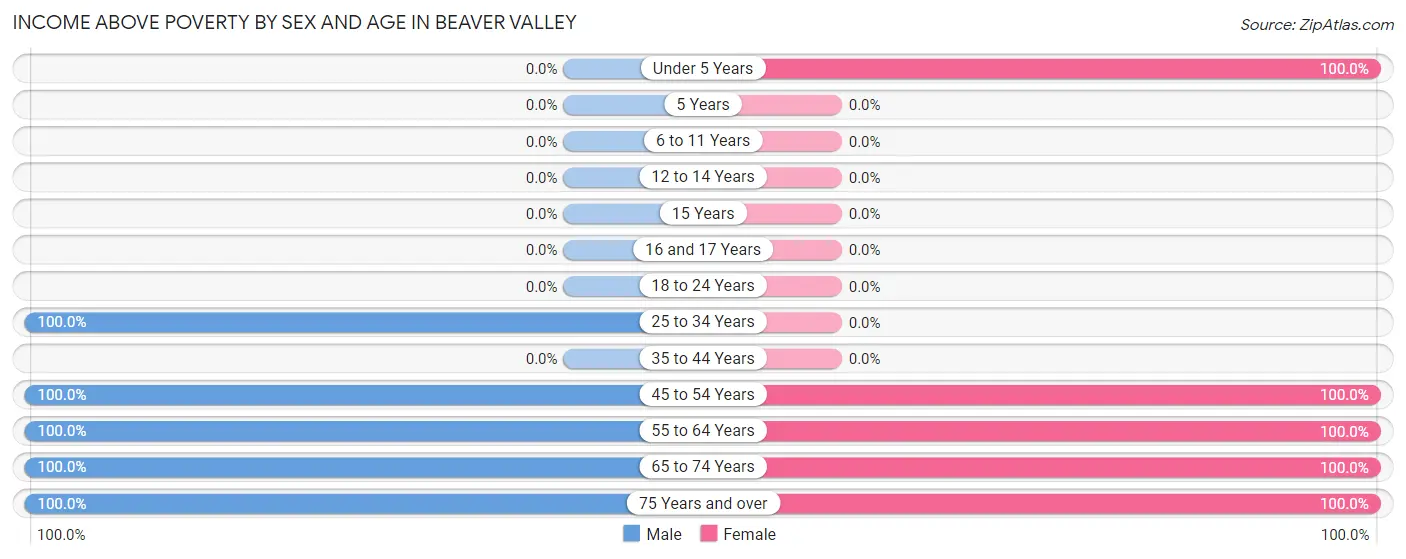
| Age Bracket | Male | Female |
| Under 5 Years | 0 (0.0%) | 9 (100.0%) |
| 5 Years | 0 (0.0%) | 0 (0.0%) |
| 6 to 11 Years | 0 (0.0%) | 0 (0.0%) |
| 12 to 14 Years | 0 (0.0%) | 0 (0.0%) |
| 15 Years | 0 (0.0%) | 0 (0.0%) |
| 16 and 17 Years | 0 (0.0%) | 0 (0.0%) |
| 18 to 24 Years | 0 (0.0%) | 0 (0.0%) |
| 25 to 34 Years | 15 (100.0%) | 0 (0.0%) |
| 35 to 44 Years | 0 (0.0%) | 0 (0.0%) |
| 45 to 54 Years | 13 (100.0%) | 9 (100.0%) |
| 55 to 64 Years | 8 (100.0%) | 14 (100.0%) |
| 65 to 74 Years | 12 (100.0%) | 42 (100.0%) |
| 75 Years and over | 7 (100.0%) | 4 (100.0%) |
| Total | 55 (100.0%) | 78 (100.0%) |
Income Below Poverty Among Married-Couple Families in Beaver Valley
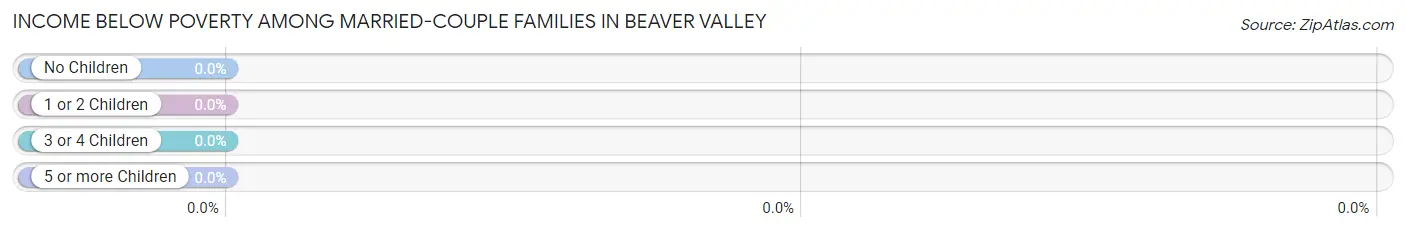
| Children | Above Poverty | Below Poverty |
| No Children | 17 (100.0%) | 0 (0.0%) |
| 1 or 2 Children | 9 (100.0%) | 0 (0.0%) |
| 3 or 4 Children | 0 (0.0%) | 0 (0.0%) |
| 5 or more Children | 0 (0.0%) | 0 (0.0%) |
| Total | 26 (100.0%) | 0 (0.0%) |
Income Below Poverty Among Single-Parent Households in Beaver Valley
| Children | Single Father | Single Mother |
| No Children | 0 (0.0%) | 0 (0.0%) |
| 1 or 2 Children | 0 (0.0%) | 0 (0.0%) |
| 3 or 4 Children | 0 (0.0%) | 0 (0.0%) |
| 5 or more Children | 0 (0.0%) | 0 (0.0%) |
| Total | 0 (0.0%) | 0 (0.0%) |
Income Below Poverty Among Married-Couple vs Single-Parent Households in Beaver Valley
| Children | Married-Couple Families | Single-Parent Households |
| No Children | 0 (0.0%) | 0 (0.0%) |
| 1 or 2 Children | 0 (0.0%) | 0 (0.0%) |
| 3 or 4 Children | 0 (0.0%) | 0 (0.0%) |
| 5 or more Children | 0 (0.0%) | 0 (0.0%) |
| Total | 0 (0.0%) | 0 (0.0%) |
Race in Beaver Valley
The most populous races in Beaver Valley are White / Caucasian (133 | 100.0%), and Hispanic or Latino (36 | 27.1%).
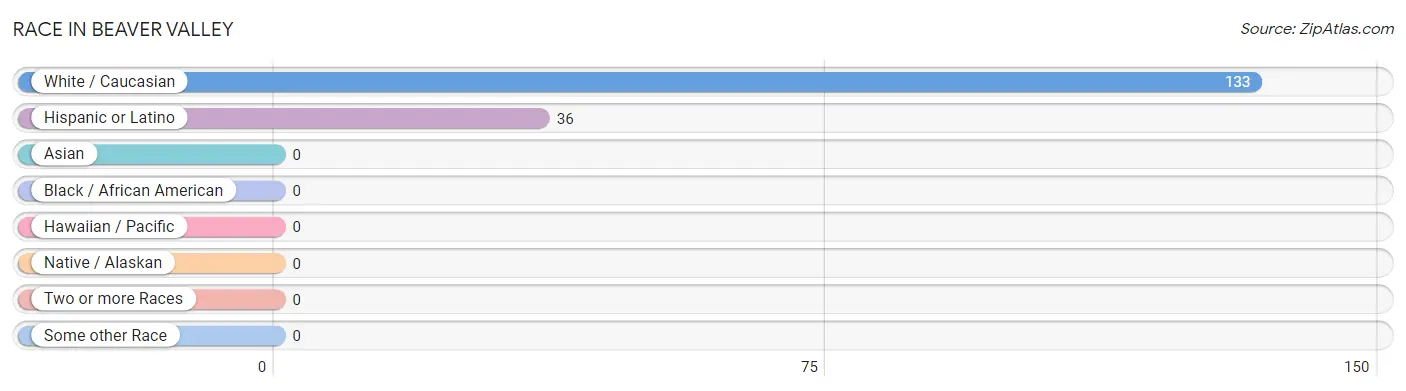
| Race | # Population | % Population |
| Asian | 0 | 0.0% |
| Black / African American | 0 | 0.0% |
| Hawaiian / Pacific | 0 | 0.0% |
| Hispanic or Latino | 36 | 27.1% |
| Native / Alaskan | 0 | 0.0% |
| White / Caucasian | 133 | 100.0% |
| Two or more Races | 0 | 0.0% |
| Some other Race | 0 | 0.0% |
| Total | 133 | 100.0% |
Ancestry in Beaver Valley
The most populous ancestries reported in Beaver Valley are Mexican (36 | 27.1%), Dutch (17 | 12.8%), German (17 | 12.8%), Irish (9 | 6.8%), and American (6 | 4.5%), together accounting for 63.9% of all Beaver Valley residents.
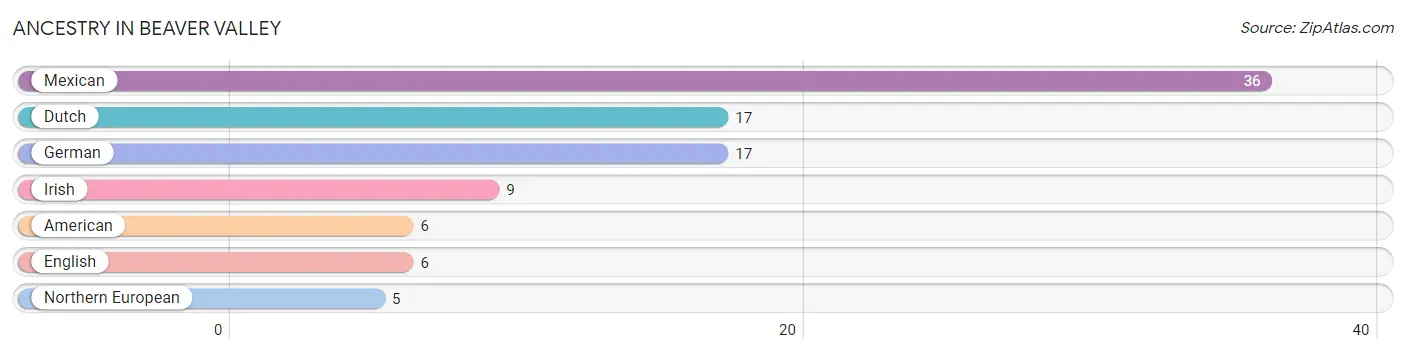
| Ancestry | # Population | % Population |
| American | 6 | 4.5% |
| Dutch | 17 | 12.8% |
| English | 6 | 4.5% |
| German | 17 | 12.8% |
| Irish | 9 | 6.8% |
| Mexican | 36 | 27.1% |
| Northern European | 5 | 3.8% | View All 7 Rows |
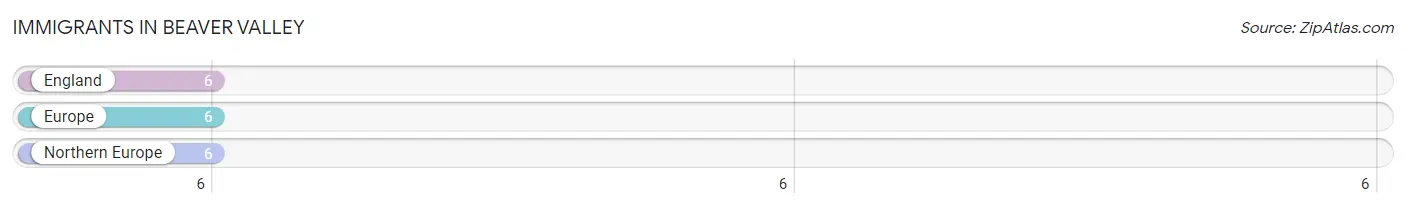
Immigrants in Beaver Valley
The most numerous immigrant groups reported in Beaver Valley came from England (6 | 4.5%), Europe (6 | 4.5%), and Northern Europe (6 | 4.5%), together accounting for 13.5% of all Beaver Valley residents.
| Immigration Origin | # Population | % Population |
| England | 6 | 4.5% |
| Europe | 6 | 4.5% |
| Northern Europe | 6 | 4.5% | View All 3 Rows |
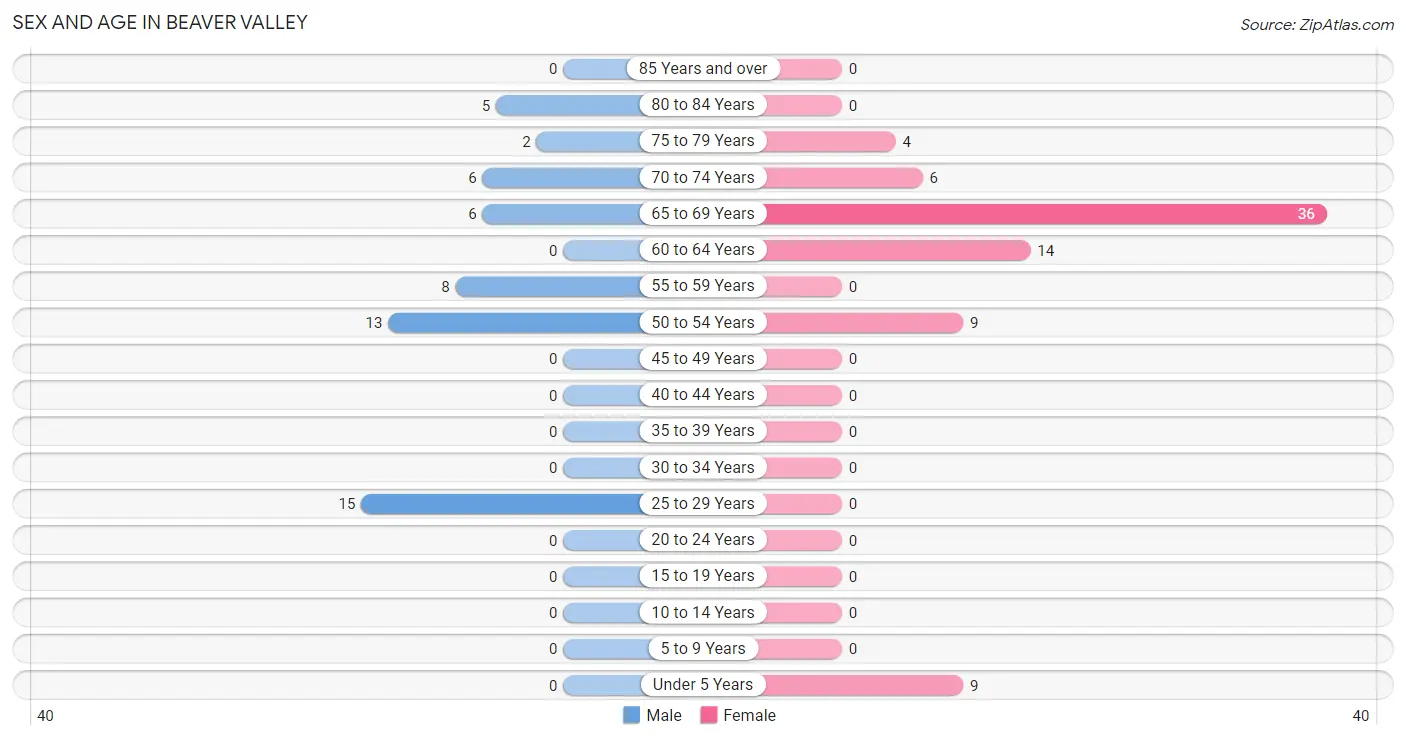
Sex and Age in Beaver Valley
Sex and Age in Beaver Valley
The most populous age groups in Beaver Valley are 25 to 29 Years (15 | 27.3%) for men and 65 to 69 Years (36 | 46.2%) for women.
| Age Bracket | Male | Female |
| Under 5 Years | 0 (0.0%) | 9 (11.5%) |
| 5 to 9 Years | 0 (0.0%) | 0 (0.0%) |
| 10 to 14 Years | 0 (0.0%) | 0 (0.0%) |
| 15 to 19 Years | 0 (0.0%) | 0 (0.0%) |
| 20 to 24 Years | 0 (0.0%) | 0 (0.0%) |
| 25 to 29 Years | 15 (27.3%) | 0 (0.0%) |
| 30 to 34 Years | 0 (0.0%) | 0 (0.0%) |
| 35 to 39 Years | 0 (0.0%) | 0 (0.0%) |
| 40 to 44 Years | 0 (0.0%) | 0 (0.0%) |
| 45 to 49 Years | 0 (0.0%) | 0 (0.0%) |
| 50 to 54 Years | 13 (23.6%) | 9 (11.5%) |
| 55 to 59 Years | 8 (14.5%) | 0 (0.0%) |
| 60 to 64 Years | 0 (0.0%) | 14 (17.9%) |
| 65 to 69 Years | 6 (10.9%) | 36 (46.2%) |
| 70 to 74 Years | 6 (10.9%) | 6 (7.7%) |
| 75 to 79 Years | 2 (3.6%) | 4 (5.1%) |
| 80 to 84 Years | 5 (9.1%) | 0 (0.0%) |
| 85 Years and over | 0 (0.0%) | 0 (0.0%) |
| Total | 55 (100.0%) | 78 (100.0%) |
Families and Households in Beaver Valley
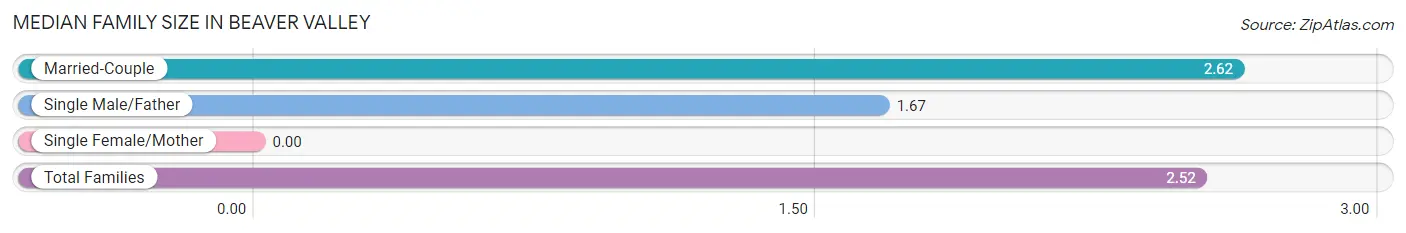
Median Family Size in Beaver Valley
| Family Type | # Families | Family Size |
| Married-Couple | 26 (89.7%) | 2.62 |
| Single Male/Father | 3 (10.3%) | 1.67 |
| Single Female/Mother | 0 (0.0%) | - |
| Total Families | 29 (100.0%) | 2.52 |
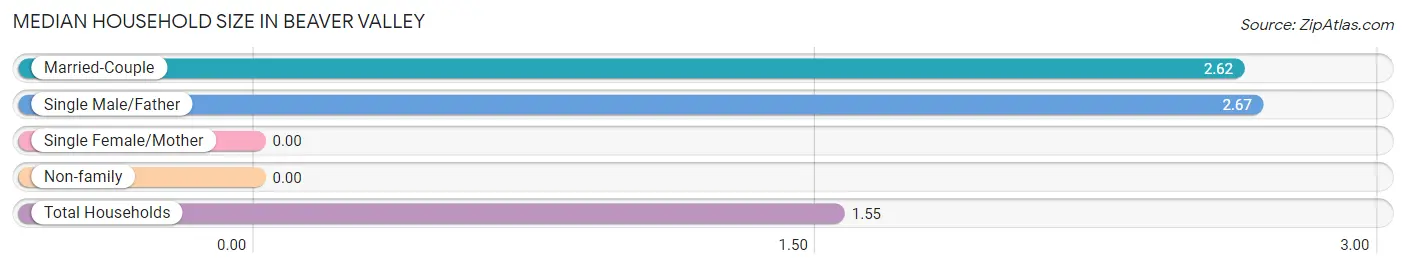
Median Household Size in Beaver Valley
| Household Type | # Households | Household Size |
| Married-Couple | 26 (30.2%) | 2.62 |
| Single Male/Father | 3 (3.5%) | 2.67 |
| Single Female/Mother | 0 (0.0%) | - |
| Non-family | 57 (66.3%) | - |
| Total Households | 86 (100.0%) | 1.55 |
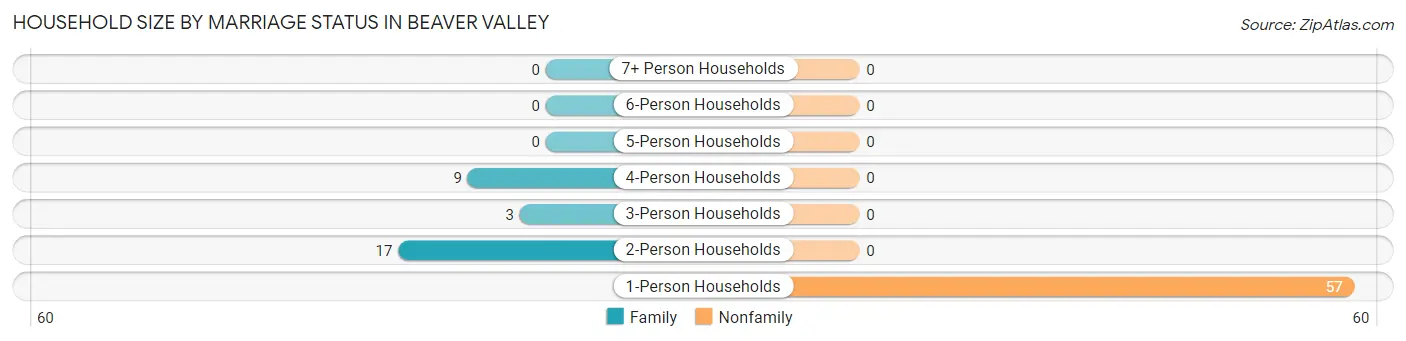
Household Size by Marriage Status in Beaver Valley
Out of a total of 86 households in Beaver Valley, 29 (33.7%) are family households, while 57 (66.3%) are nonfamily households. The most numerous type of family households are 2-person households, comprising 17, and the most common type of nonfamily households are 1-person households, comprising 57.
| Household Size | Family Households | Nonfamily Households |
| 1-Person Households | - | 57 (66.3%) |
| 2-Person Households | 17 (19.8%) | 0 (0.0%) |
| 3-Person Households | 3 (3.5%) | 0 (0.0%) |
| 4-Person Households | 9 (10.5%) | 0 (0.0%) |
| 5-Person Households | 0 (0.0%) | 0 (0.0%) |
| 6-Person Households | 0 (0.0%) | 0 (0.0%) |
| 7+ Person Households | 0 (0.0%) | 0 (0.0%) |
| Total | 29 (33.7%) | 57 (66.3%) |
Female Fertility in Beaver Valley
Fertility by Age in Beaver Valley
| Age Bracket | Women with Births | Births / 1,000 Women |
| 15 to 19 years | 0 (0.0%) | 0.0 |
| 20 to 34 years | 0 (0.0%) | 0.0 |
| 35 to 50 years | 0 (0.0%) | 0.0 |
| Total | 0 (0.0%) | 0.0 |
Fertility by Age by Marriage Status in Beaver Valley
| Age Bracket | Married | Unmarried |
| 15 to 19 years | 0 (0.0%) | 0 (0.0%) |
| 20 to 34 years | 0 (0.0%) | 0 (0.0%) |
| 35 to 50 years | 0 (0.0%) | 0 (0.0%) |
| Total | 0 (0.0%) | 0 (0.0%) |
Fertility by Education in Beaver Valley
| Educational Attainment | Women with Births | Births / 1,000 Women |
| Less than High School | 0 (0.0%) | 0.0 |
| High School Diploma | 0 (0.0%) | 0.0 |
| College or Associate's Degree | 0 (0.0%) | 0.0 |
| Bachelor's Degree | 0 (0.0%) | 0.0 |
| Graduate Degree | 0 (0.0%) | 0.0 |
| Total | 0 (0.0%) | 0.0 |
Fertility by Education by Marriage Status in Beaver Valley
| Educational Attainment | Married | Unmarried |
| Less than High School | 0 (0.0%) | 0 (0.0%) |
| High School Diploma | 0 (0.0%) | 0 (0.0%) |
| College or Associate's Degree | 0 (0.0%) | 0 (0.0%) |
| Bachelor's Degree | 0 (0.0%) | 0 (0.0%) |
| Graduate Degree | 0 (0.0%) | 0 (0.0%) |
| Total | 0 (0.0%) | 0 (0.0%) |
Employment Characteristics in Beaver Valley
Employment by Class of Employer in Beaver Valley
Among the 42 employed individuals in Beaver Valley, private company employees (36 | 85.7%), and not-for-profit organizations (6 | 14.3%) make up the most common classes of employment.
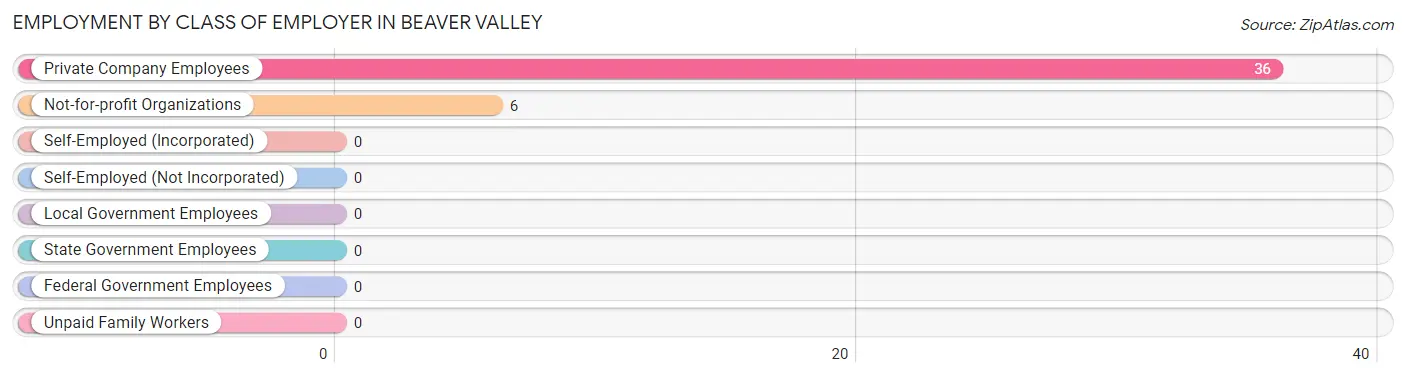
| Employer Class | # Employees | % Employees |
| Private Company Employees | 36 | 85.7% |
| Self-Employed (Incorporated) | 0 | 0.0% |
| Self-Employed (Not Incorporated) | 0 | 0.0% |
| Not-for-profit Organizations | 6 | 14.3% |
| Local Government Employees | 0 | 0.0% |
| State Government Employees | 0 | 0.0% |
| Federal Government Employees | 0 | 0.0% |
| Unpaid Family Workers | 0 | 0.0% |
| Total | 42 | 100.0% |
Employment Status by Age in Beaver Valley
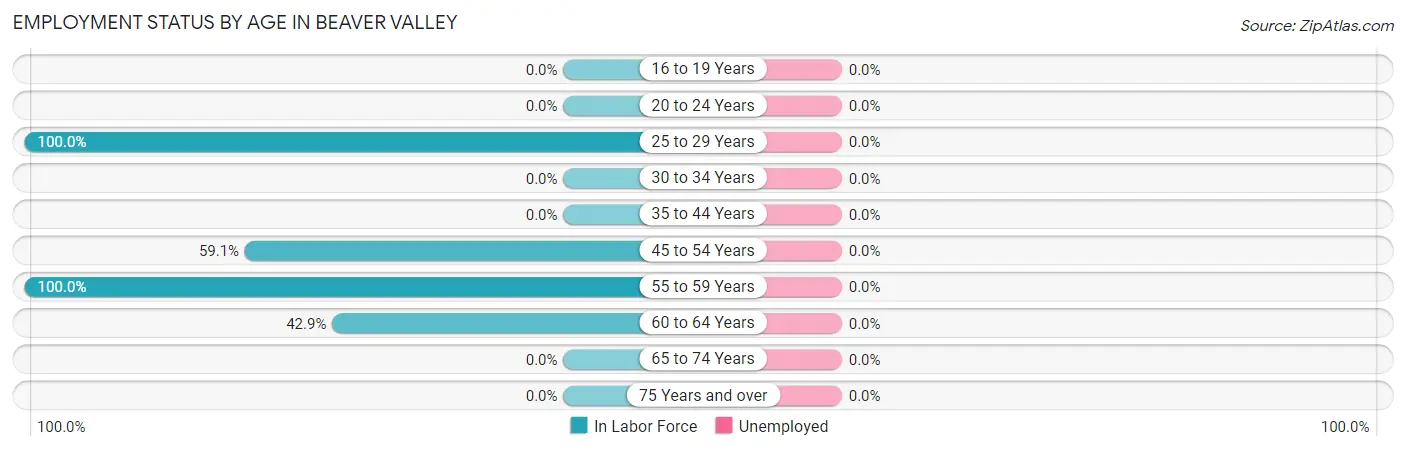
| Age Bracket | In Labor Force | Unemployed |
| 16 to 19 Years | 0 (0.0%) | 0 (0.0%) |
| 20 to 24 Years | 0 (0.0%) | 0 (0.0%) |
| 25 to 29 Years | 15 (100.0%) | 0 (0.0%) |
| 30 to 34 Years | 0 (0.0%) | 0 (0.0%) |
| 35 to 44 Years | 0 (0.0%) | 0 (0.0%) |
| 45 to 54 Years | 13 (59.1%) | 0 (0.0%) |
| 55 to 59 Years | 8 (100.0%) | 0 (0.0%) |
| 60 to 64 Years | 6 (42.9%) | 0 (0.0%) |
| 65 to 74 Years | 0 (0.0%) | 0 (0.0%) |
| 75 Years and over | 0 (0.0%) | 0 (0.0%) |
| Total | 42 (33.9%) | 0 (0.0%) |
Employment Status by Educational Attainment in Beaver Valley
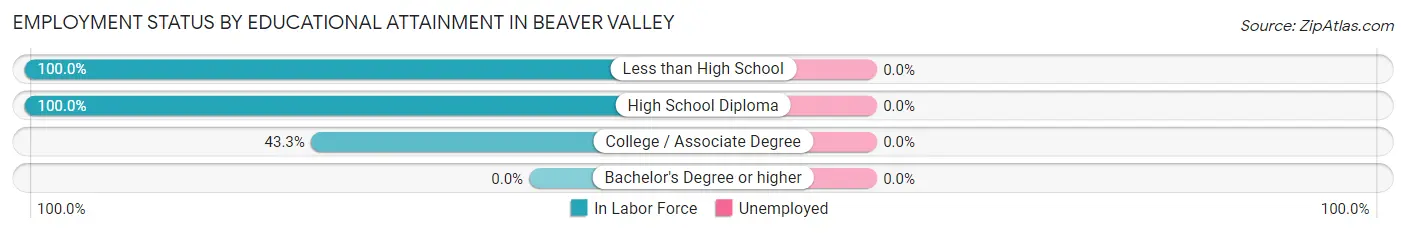
| Educational Attainment | In Labor Force | Unemployed |
| Less than High School | 8 (100.0%) | 0 (0.0%) |
| High School Diploma | 21 (100.0%) | 0 (0.0%) |
| College / Associate Degree | 13 (43.3%) | 0 (0.0%) |
| Bachelor's Degree or higher | 0 (0.0%) | 0 (0.0%) |
| Total | 42 (71.2%) | 0 (0.0%) |
Employment Occupations by Sex in Beaver Valley
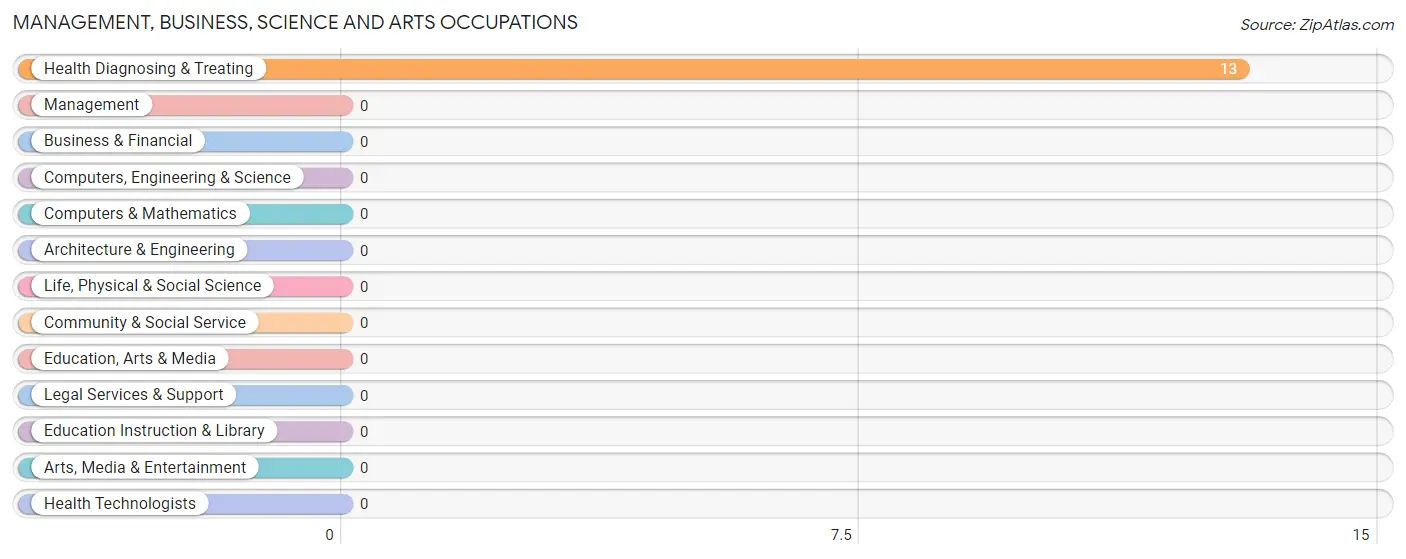
Management, Business, Science and Arts Occupations
The most common Management, Business, Science and Arts occupations in Beaver Valley are , and Health Diagnosing & Treating (13 | 30.9%).
Management, Business, Science and Arts Occupations by Sex
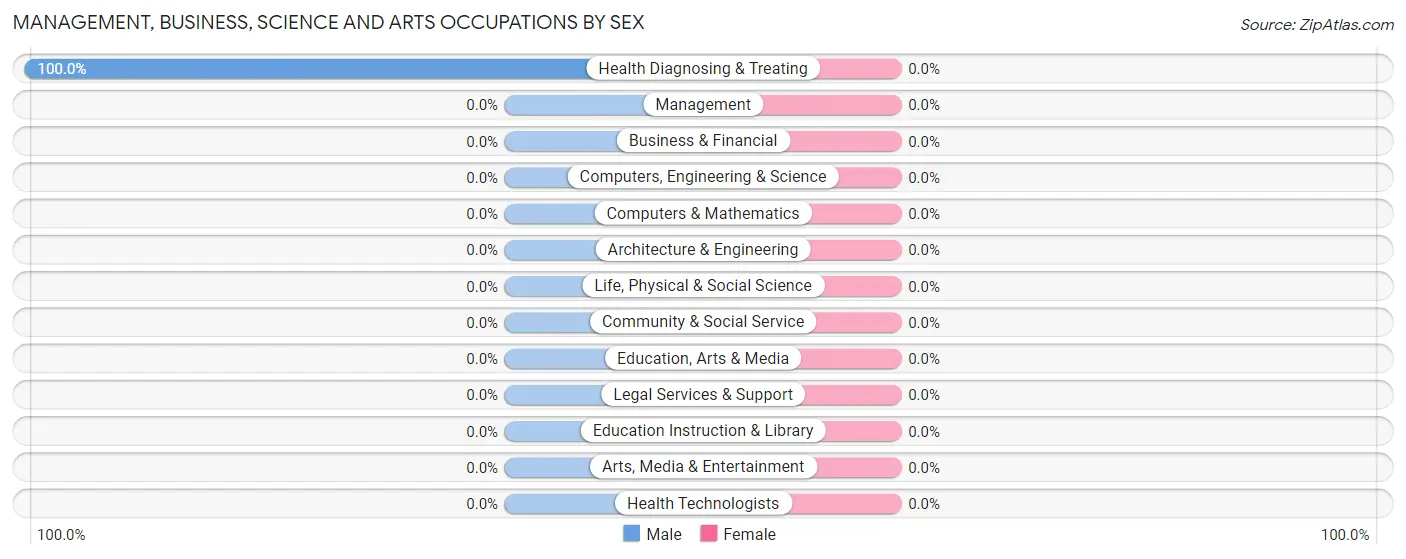
| Occupation | Male | Female |
| Management | 0 (0.0%) | 0 (0.0%) |
| Business & Financial | 0 (0.0%) | 0 (0.0%) |
| Computers, Engineering & Science | 0 (0.0%) | 0 (0.0%) |
| Computers & Mathematics | 0 (0.0%) | 0 (0.0%) |
| Architecture & Engineering | 0 (0.0%) | 0 (0.0%) |
| Life, Physical & Social Science | 0 (0.0%) | 0 (0.0%) |
| Community & Social Service | 0 (0.0%) | 0 (0.0%) |
| Education, Arts & Media | 0 (0.0%) | 0 (0.0%) |
| Legal Services & Support | 0 (0.0%) | 0 (0.0%) |
| Education Instruction & Library | 0 (0.0%) | 0 (0.0%) |
| Arts, Media & Entertainment | 0 (0.0%) | 0 (0.0%) |
| Health Diagnosing & Treating | 13 (100.0%) | 0 (0.0%) |
| Health Technologists | 0 (0.0%) | 0 (0.0%) |
| Total (Category) | 13 (100.0%) | 0 (0.0%) |
| Total (Overall) | 36 (85.7%) | 6 (14.3%) |
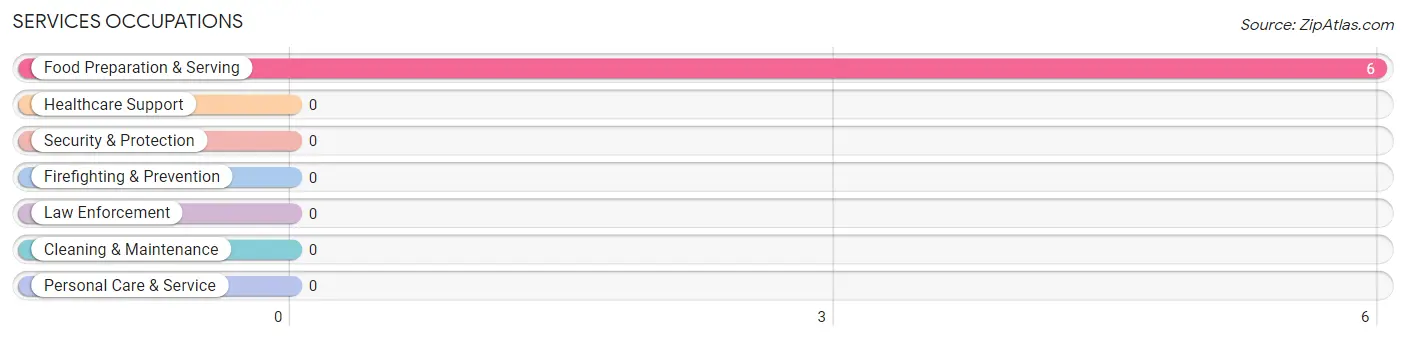
Services Occupations
The most common Services occupations in Beaver Valley are , and Food Preparation & Serving (6 | 14.3%).
Services Occupations by Sex
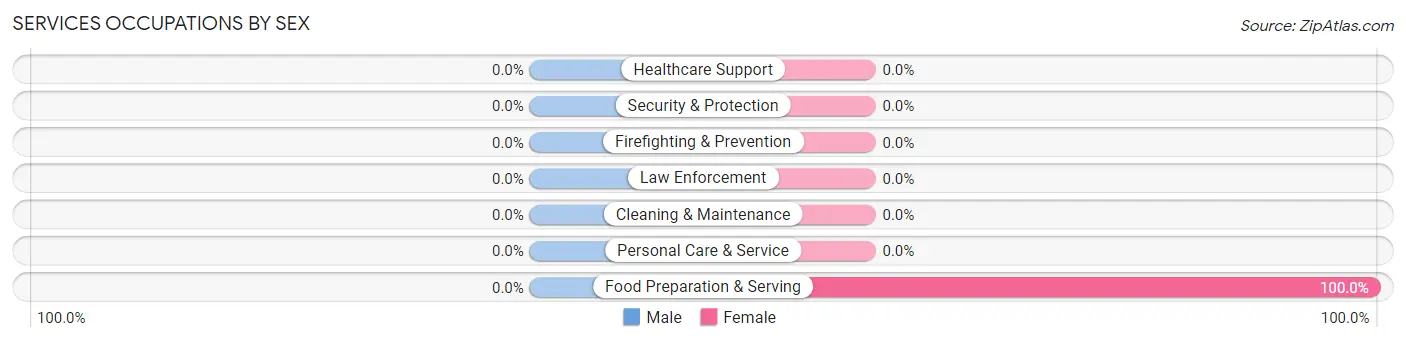
| Occupation | Male | Female |
| Healthcare Support | 0 (0.0%) | 0 (0.0%) |
| Security & Protection | 0 (0.0%) | 0 (0.0%) |
| Firefighting & Prevention | 0 (0.0%) | 0 (0.0%) |
| Law Enforcement | 0 (0.0%) | 0 (0.0%) |
| Food Preparation & Serving | 0 (0.0%) | 6 (100.0%) |
| Cleaning & Maintenance | 0 (0.0%) | 0 (0.0%) |
| Personal Care & Service | 0 (0.0%) | 0 (0.0%) |
| Total (Category) | 0 (0.0%) | 6 (100.0%) |
| Total (Overall) | 36 (85.7%) | 6 (14.3%) |
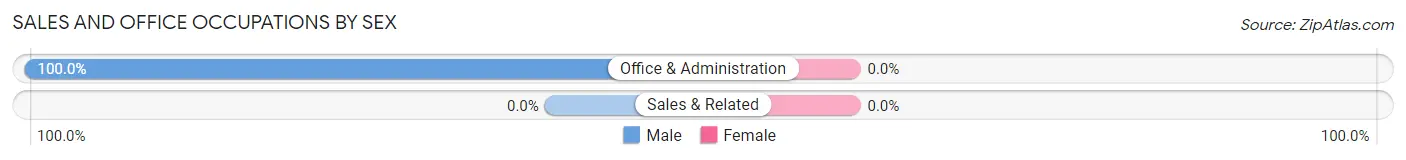
Sales and Office Occupations
The most common Sales and Office occupations in Beaver Valley are , and Office & Administration (3 | 7.1%).
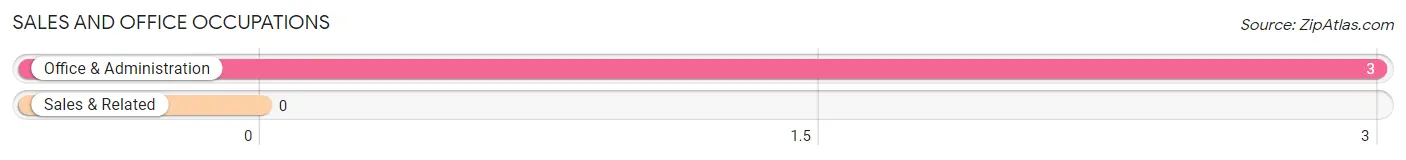
Sales and Office Occupations by Sex
| Occupation | Male | Female |
| Sales & Related | 0 (0.0%) | 0 (0.0%) |
| Office & Administration | 3 (100.0%) | 0 (0.0%) |
| Total (Category) | 3 (100.0%) | 0 (0.0%) |
| Total (Overall) | 36 (85.7%) | 6 (14.3%) |
Natural Resources, Construction and Maintenance Occupations
The most common Natural Resources, Construction and Maintenance occupations in Beaver Valley are , and Construction & Extraction (17 | 40.5%).
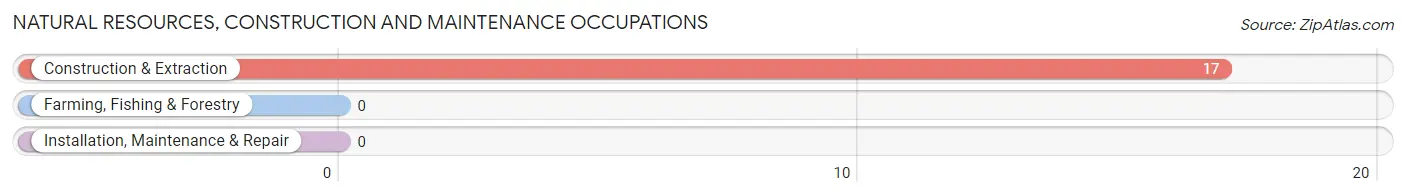
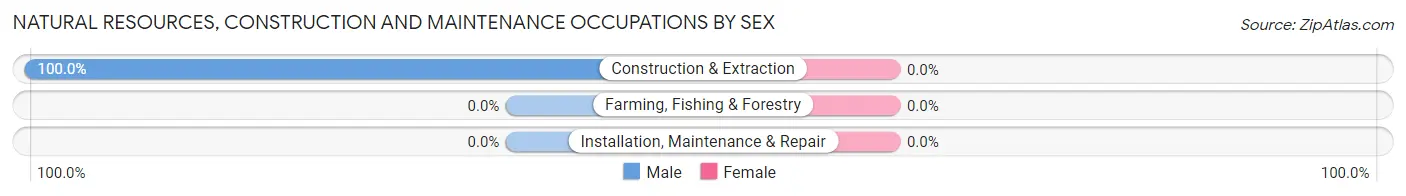
Natural Resources, Construction and Maintenance Occupations by Sex
| Occupation | Male | Female |
| Farming, Fishing & Forestry | 0 (0.0%) | 0 (0.0%) |
| Construction & Extraction | 17 (100.0%) | 0 (0.0%) |
| Installation, Maintenance & Repair | 0 (0.0%) | 0 (0.0%) |
| Total (Category) | 17 (100.0%) | 0 (0.0%) |
| Total (Overall) | 36 (85.7%) | 6 (14.3%) |
Production, Transportation and Moving Occupations
The most common Production, Transportation and Moving occupations in Beaver Valley are , and Transportation (3 | 7.1%).
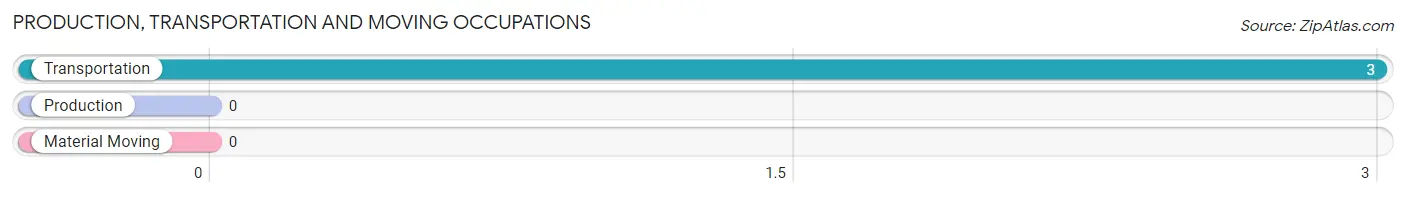
Production, Transportation and Moving Occupations by Sex
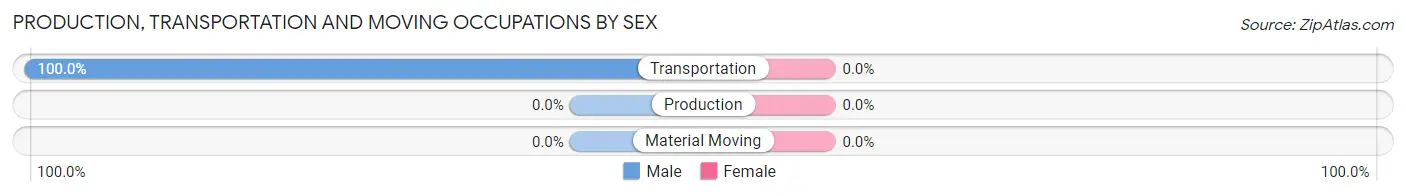
| Occupation | Male | Female |
| Production | 0 (0.0%) | 0 (0.0%) |
| Transportation | 3 (100.0%) | 0 (0.0%) |
| Material Moving | 0 (0.0%) | 0 (0.0%) |
| Total (Category) | 3 (100.0%) | 0 (0.0%) |
| Total (Overall) | 36 (85.7%) | 6 (14.3%) |
Employment Industries by Sex in Beaver Valley
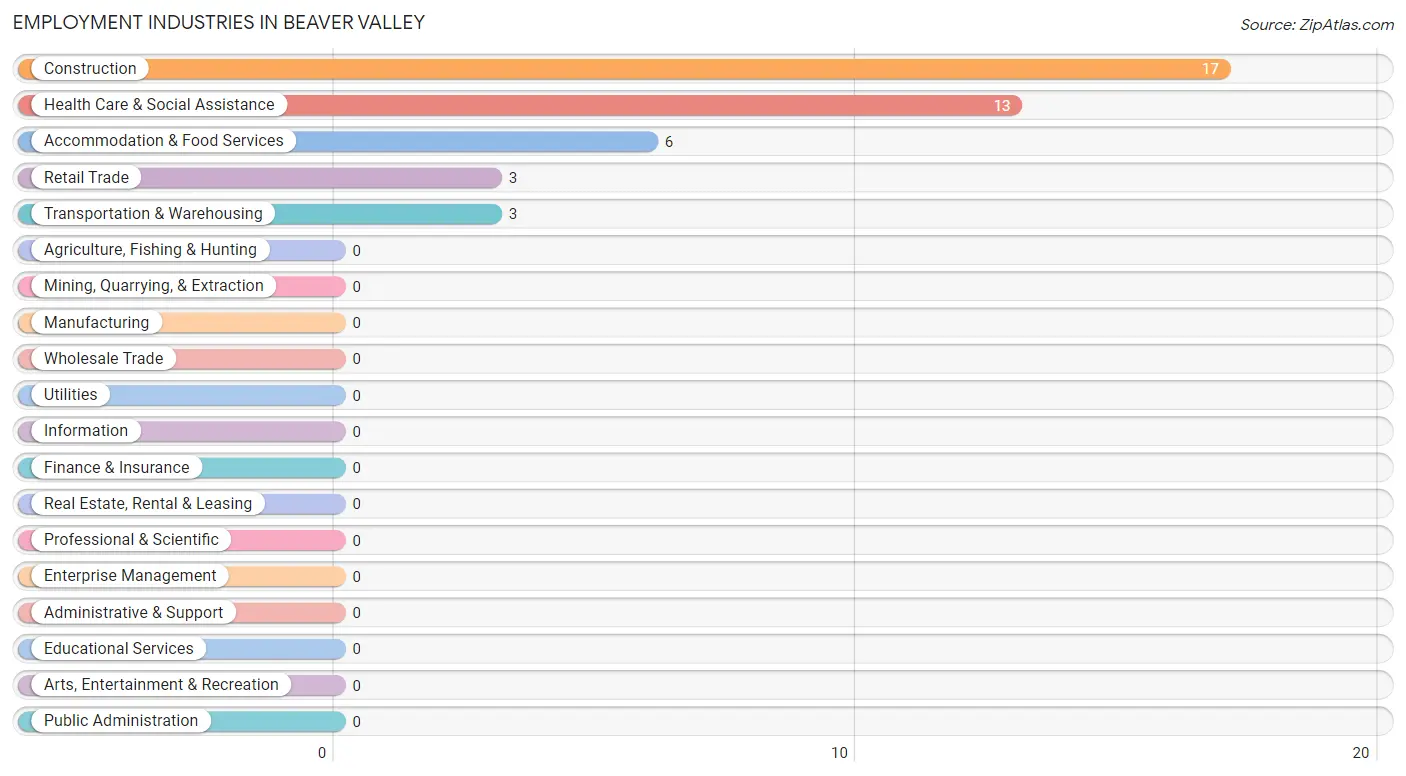
Employment Industries in Beaver Valley
The major employment industries in Beaver Valley include Construction (17 | 40.5%), Health Care & Social Assistance (13 | 30.9%), Accommodation & Food Services (6 | 14.3%), Retail Trade (3 | 7.1%), and Transportation & Warehousing (3 | 7.1%).
Employment Industries by Sex in Beaver Valley
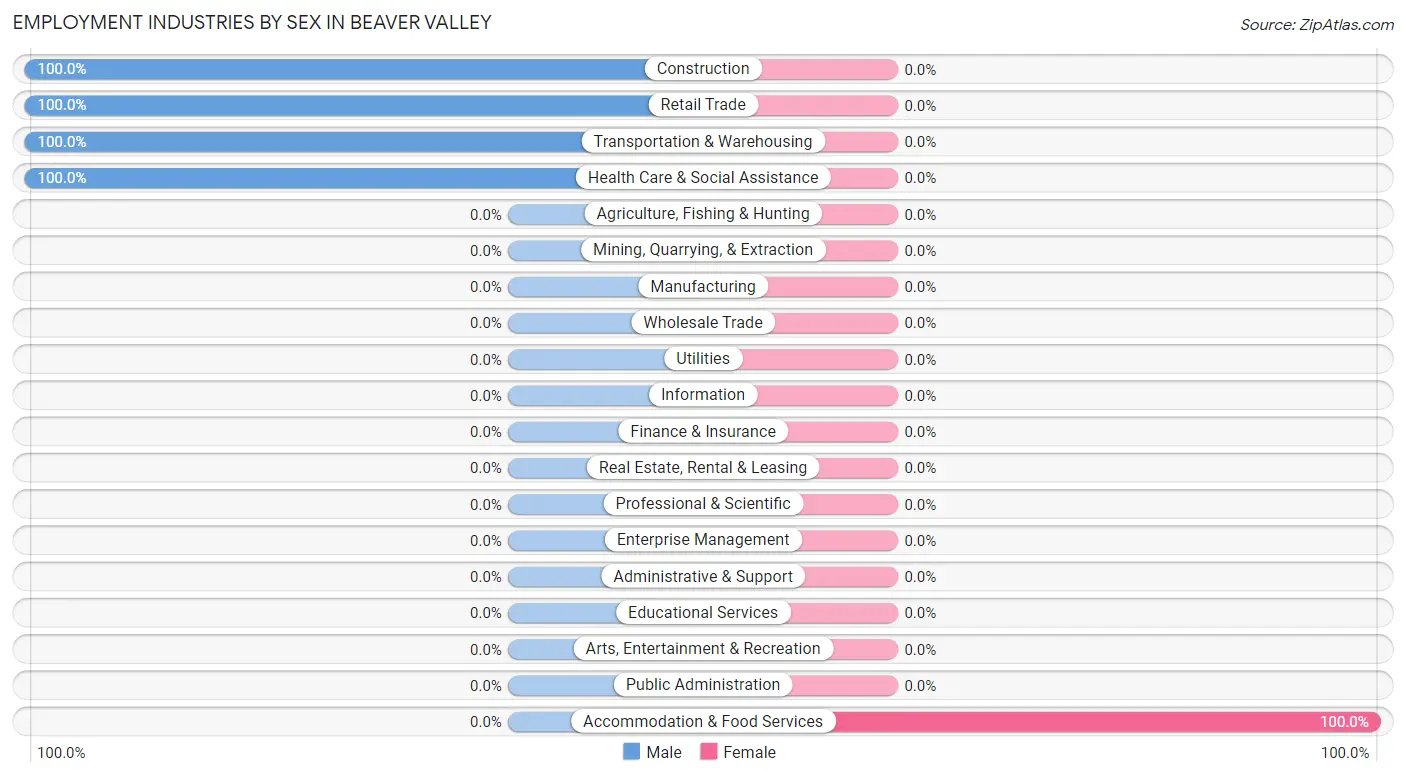
| Industry | Male | Female |
| Agriculture, Fishing & Hunting | 0 (0.0%) | 0 (0.0%) |
| Mining, Quarrying, & Extraction | 0 (0.0%) | 0 (0.0%) |
| Construction | 17 (100.0%) | 0 (0.0%) |
| Manufacturing | 0 (0.0%) | 0 (0.0%) |
| Wholesale Trade | 0 (0.0%) | 0 (0.0%) |
| Retail Trade | 3 (100.0%) | 0 (0.0%) |
| Transportation & Warehousing | 3 (100.0%) | 0 (0.0%) |
| Utilities | 0 (0.0%) | 0 (0.0%) |
| Information | 0 (0.0%) | 0 (0.0%) |
| Finance & Insurance | 0 (0.0%) | 0 (0.0%) |
| Real Estate, Rental & Leasing | 0 (0.0%) | 0 (0.0%) |
| Professional & Scientific | 0 (0.0%) | 0 (0.0%) |
| Enterprise Management | 0 (0.0%) | 0 (0.0%) |
| Administrative & Support | 0 (0.0%) | 0 (0.0%) |
| Educational Services | 0 (0.0%) | 0 (0.0%) |
| Health Care & Social Assistance | 13 (100.0%) | 0 (0.0%) |
| Arts, Entertainment & Recreation | 0 (0.0%) | 0 (0.0%) |
| Accommodation & Food Services | 0 (0.0%) | 6 (100.0%) |
| Public Administration | 0 (0.0%) | 0 (0.0%) |
| Total | 36 (85.7%) | 6 (14.3%) |
Education in Beaver Valley
School Enrollment in Beaver Valley
| School Level | # Students | % Students |
| Nursery / Preschool | 0 | 0.0% |
| Kindergarten | 0 | 0.0% |
| Elementary School | 0 | 0.0% |
| Middle School | 0 | 0.0% |
| High School | 0 | 0.0% |
| College / Undergraduate | 0 | 0.0% |
| Graduate / Professional | 0 | 0.0% |
| Total | 0 | 0.0% |
School Enrollment by Age by Funding Source in Beaver Valley
| Age Bracket | Public School | Private School |
| 3 to 4 Year Olds | 0 (0.0%) | 0 (0.0%) |
| 5 to 9 Year Old | 0 (0.0%) | 0 (0.0%) |
| 10 to 14 Year Olds | 0 (0.0%) | 0 (0.0%) |
| 15 to 17 Year Olds | 0 (0.0%) | 0 (0.0%) |
| 18 to 19 Year Olds | 0 (0.0%) | 0 (0.0%) |
| 20 to 24 Year Olds | 0 (0.0%) | 0 (0.0%) |
| 25 to 34 Year Olds | 0 (0.0%) | 0 (0.0%) |
| 35 Years and over | 0 (0.0%) | 0 (0.0%) |
| Total | 0 (0.0%) | 0 (0.0%) |
Educational Attainment by Field of Study in Beaver Valley
, and education (9 | 100.0%) are the most common fields of study among 9 individuals in Beaver Valley who have obtained a bachelor's degree or higher.
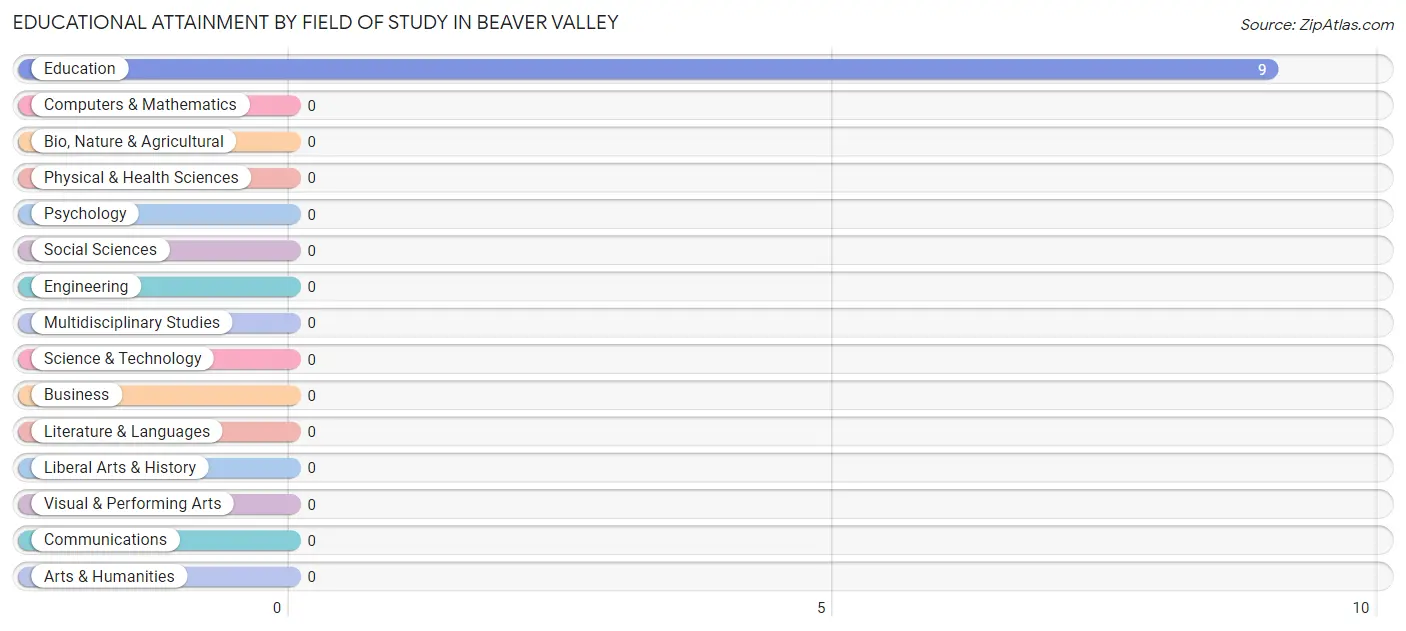
| Field of Study | # Graduates | % Graduates |
| Computers & Mathematics | 0 | 0.0% |
| Bio, Nature & Agricultural | 0 | 0.0% |
| Physical & Health Sciences | 0 | 0.0% |
| Psychology | 0 | 0.0% |
| Social Sciences | 0 | 0.0% |
| Engineering | 0 | 0.0% |
| Multidisciplinary Studies | 0 | 0.0% |
| Science & Technology | 0 | 0.0% |
| Business | 0 | 0.0% |
| Education | 9 | 100.0% |
| Literature & Languages | 0 | 0.0% |
| Liberal Arts & History | 0 | 0.0% |
| Visual & Performing Arts | 0 | 0.0% |
| Communications | 0 | 0.0% |
| Arts & Humanities | 0 | 0.0% |
| Total | 9 | 100.0% |
Transportation & Commute in Beaver Valley
Vehicle Availability by Sex in Beaver Valley
The most prevalent vehicle ownership categories in Beaver Valley are males with 3 vehicles (17, accounting for 47.2%) and females with 3 vehicles (0, making up 283.3%).
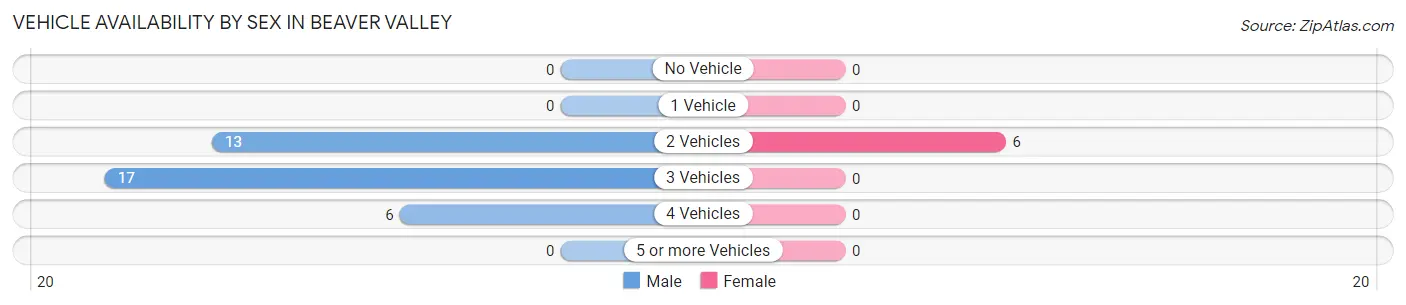
| Vehicles Available | Male | Female |
| No Vehicle | 0 (0.0%) | 0 (0.0%) |
| 1 Vehicle | 0 (0.0%) | 0 (0.0%) |
| 2 Vehicles | 13 (36.1%) | 6 (100.0%) |
| 3 Vehicles | 17 (47.2%) | 0 (0.0%) |
| 4 Vehicles | 6 (16.7%) | 0 (0.0%) |
| 5 or more Vehicles | 0 (0.0%) | 0 (0.0%) |
| Total | 36 (100.0%) | 6 (100.0%) |
Commute Time in Beaver Valley
The most frequently occuring commute durations in Beaver Valley are 90 or more minutes (25 commuters, 59.5%), 35 to 39 minutes (8 commuters, 19.1%), and 40 to 44 minutes (6 commuters, 14.3%).
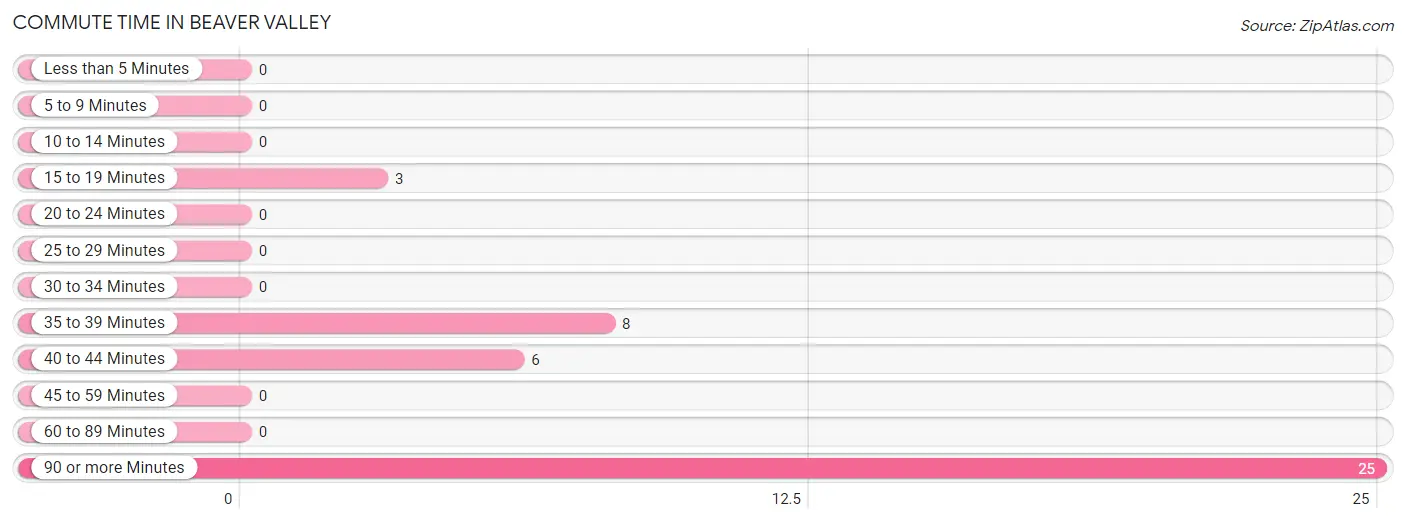
| Commute Time | # Commuters | % Commuters |
| Less than 5 Minutes | 0 | 0.0% |
| 5 to 9 Minutes | 0 | 0.0% |
| 10 to 14 Minutes | 0 | 0.0% |
| 15 to 19 Minutes | 3 | 7.1% |
| 20 to 24 Minutes | 0 | 0.0% |
| 25 to 29 Minutes | 0 | 0.0% |
| 30 to 34 Minutes | 0 | 0.0% |
| 35 to 39 Minutes | 8 | 19.1% |
| 40 to 44 Minutes | 6 | 14.3% |
| 45 to 59 Minutes | 0 | 0.0% |
| 60 to 89 Minutes | 0 | 0.0% |
| 90 or more Minutes | 25 | 59.5% |
Commute Time by Sex in Beaver Valley
The most common commute times in Beaver Valley are 90 or more minutes (25 commuters, 69.4%) for males and 40 to 44 minutes (6 commuters, 100.0%) for females.
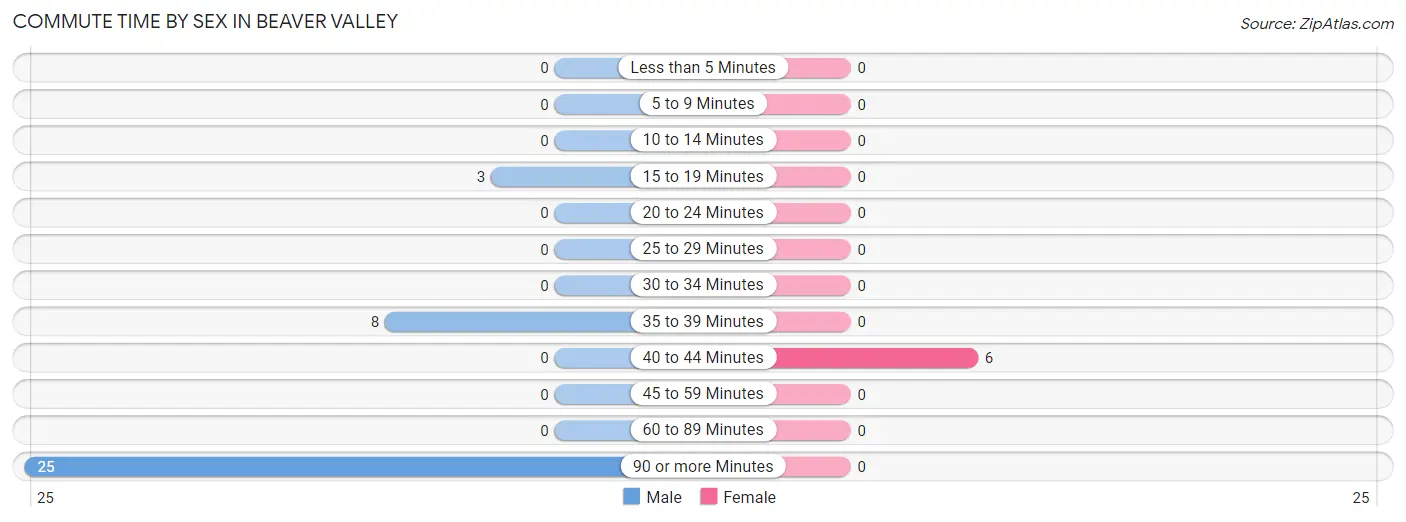
| Commute Time | Male | Female |
| Less than 5 Minutes | 0 (0.0%) | 0 (0.0%) |
| 5 to 9 Minutes | 0 (0.0%) | 0 (0.0%) |
| 10 to 14 Minutes | 0 (0.0%) | 0 (0.0%) |
| 15 to 19 Minutes | 3 (8.3%) | 0 (0.0%) |
| 20 to 24 Minutes | 0 (0.0%) | 0 (0.0%) |
| 25 to 29 Minutes | 0 (0.0%) | 0 (0.0%) |
| 30 to 34 Minutes | 0 (0.0%) | 0 (0.0%) |
| 35 to 39 Minutes | 8 (22.2%) | 0 (0.0%) |
| 40 to 44 Minutes | 0 (0.0%) | 6 (100.0%) |
| 45 to 59 Minutes | 0 (0.0%) | 0 (0.0%) |
| 60 to 89 Minutes | 0 (0.0%) | 0 (0.0%) |
| 90 or more Minutes | 25 (69.4%) | 0 (0.0%) |
Time of Departure to Work by Sex in Beaver Valley
The most frequent times of departure to work in Beaver Valley are 6:30 AM to 6:59 AM (13, 36.1%) for males and 5:30 AM to 5:59 AM (6, 100.0%) for females.
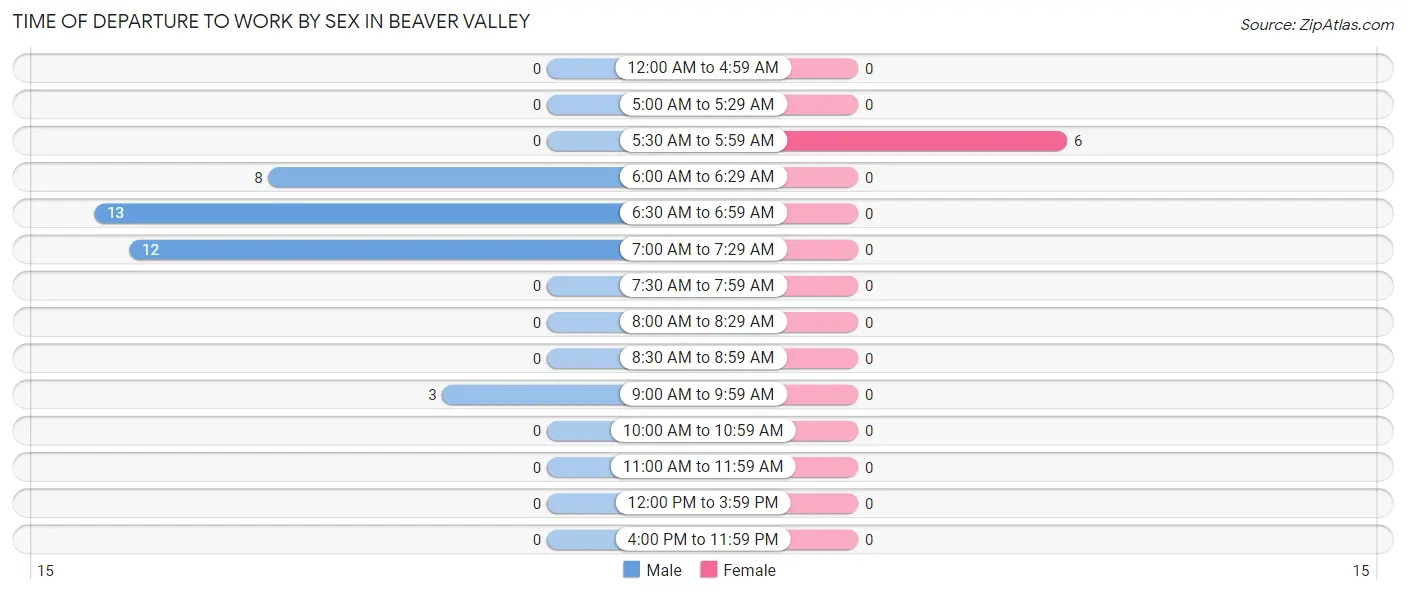
| Time of Departure | Male | Female |
| 12:00 AM to 4:59 AM | 0 (0.0%) | 0 (0.0%) |
| 5:00 AM to 5:29 AM | 0 (0.0%) | 0 (0.0%) |
| 5:30 AM to 5:59 AM | 0 (0.0%) | 6 (100.0%) |
| 6:00 AM to 6:29 AM | 8 (22.2%) | 0 (0.0%) |
| 6:30 AM to 6:59 AM | 13 (36.1%) | 0 (0.0%) |
| 7:00 AM to 7:29 AM | 12 (33.3%) | 0 (0.0%) |
| 7:30 AM to 7:59 AM | 0 (0.0%) | 0 (0.0%) |
| 8:00 AM to 8:29 AM | 0 (0.0%) | 0 (0.0%) |
| 8:30 AM to 8:59 AM | 0 (0.0%) | 0 (0.0%) |
| 9:00 AM to 9:59 AM | 3 (8.3%) | 0 (0.0%) |
| 10:00 AM to 10:59 AM | 0 (0.0%) | 0 (0.0%) |
| 11:00 AM to 11:59 AM | 0 (0.0%) | 0 (0.0%) |
| 12:00 PM to 3:59 PM | 0 (0.0%) | 0 (0.0%) |
| 4:00 PM to 11:59 PM | 0 (0.0%) | 0 (0.0%) |
| Total | 36 (100.0%) | 6 (100.0%) |
Housing Occupancy in Beaver Valley
Occupancy by Ownership in Beaver Valley
Of the total 86 dwellings in Beaver Valley, owner-occupied units account for 86 (100.0%), while renter-occupied units make up 0 (0.0%).
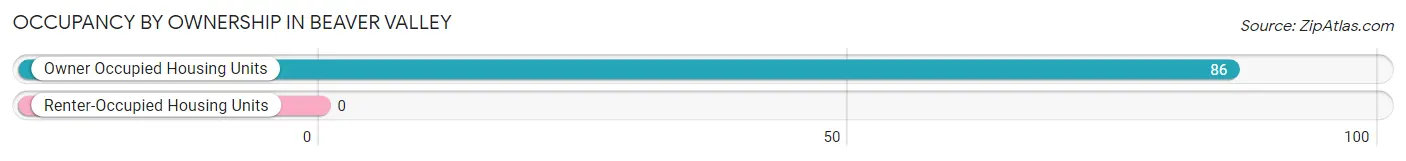
| Occupancy | # Housing Units | % Housing Units |
| Owner Occupied Housing Units | 86 | 100.0% |
| Renter-Occupied Housing Units | 0 | 0.0% |
| Total Occupied Housing Units | 86 | 100.0% |
Occupancy by Household Size in Beaver Valley
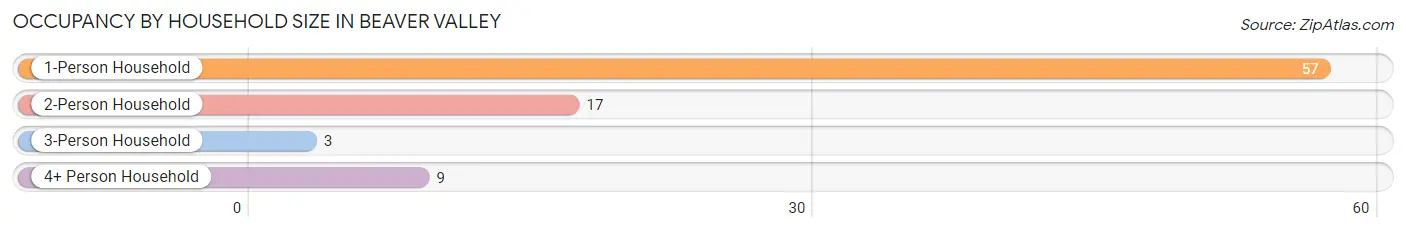
| Household Size | # Housing Units | % Housing Units |
| 1-Person Household | 57 | 66.3% |
| 2-Person Household | 17 | 19.8% |
| 3-Person Household | 3 | 3.5% |
| 4+ Person Household | 9 | 10.5% |
| Total Housing Units | 86 | 100.0% |
Occupancy by Ownership by Household Size in Beaver Valley
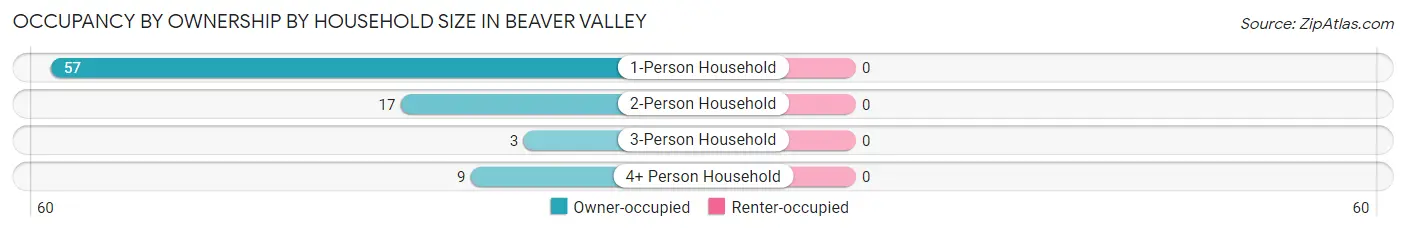
| Household Size | Owner-occupied | Renter-occupied |
| 1-Person Household | 57 (100.0%) | 0 (0.0%) |
| 2-Person Household | 17 (100.0%) | 0 (0.0%) |
| 3-Person Household | 3 (100.0%) | 0 (0.0%) |
| 4+ Person Household | 9 (100.0%) | 0 (0.0%) |
| Total Housing Units | 86 (100.0%) | 0 (0.0%) |
Occupancy by Educational Attainment in Beaver Valley
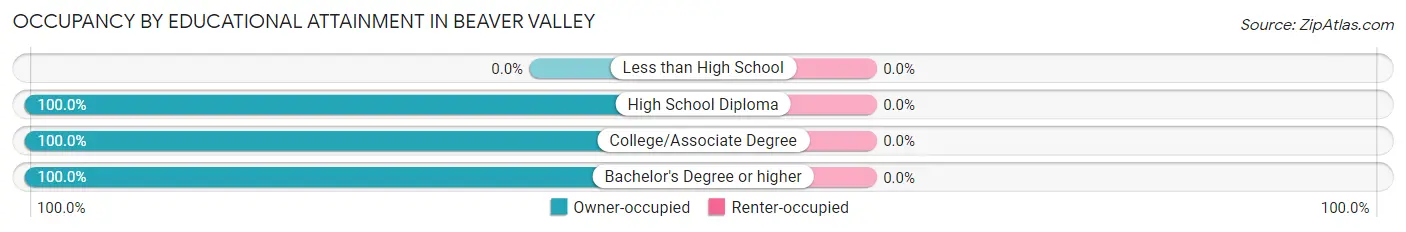
| Household Size | Owner-occupied | Renter-occupied |
| Less than High School | 0 (0.0%) | 0 (0.0%) |
| High School Diploma | 9 (100.0%) | 0 (0.0%) |
| College/Associate Degree | 72 (100.0%) | 0 (0.0%) |
| Bachelor's Degree or higher | 5 (100.0%) | 0 (0.0%) |
Occupancy by Age of Householder in Beaver Valley
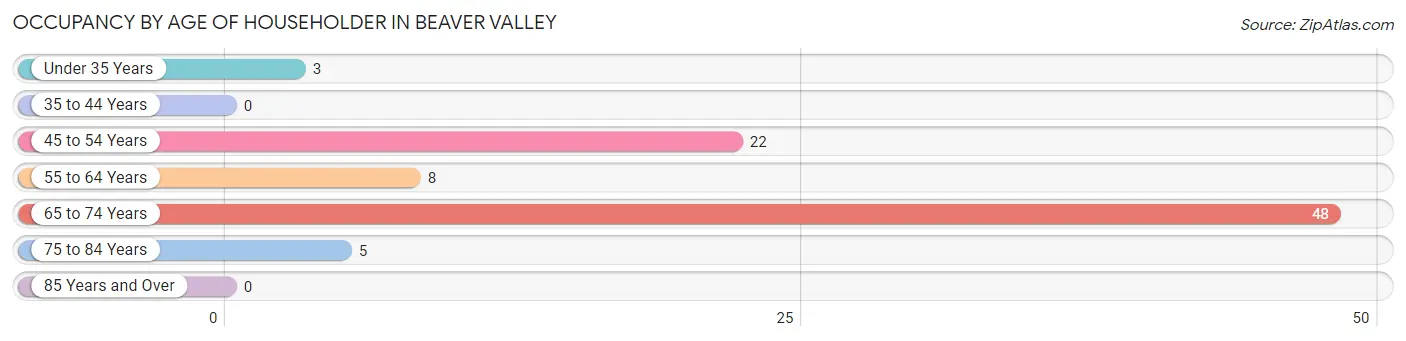
| Age Bracket | # Households | % Households |
| Under 35 Years | 3 | 3.5% |
| 35 to 44 Years | 0 | 0.0% |
| 45 to 54 Years | 22 | 25.6% |
| 55 to 64 Years | 8 | 9.3% |
| 65 to 74 Years | 48 | 55.8% |
| 75 to 84 Years | 5 | 5.8% |
| 85 Years and Over | 0 | 0.0% |
| Total | 86 | 100.0% |
Housing Finances in Beaver Valley
Median Income by Occupancy in Beaver Valley
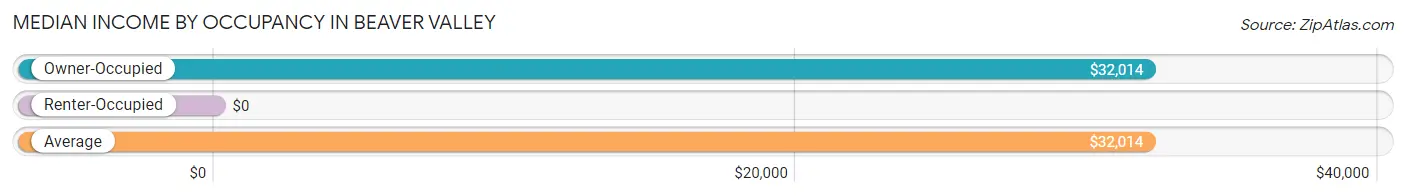
| Occupancy Type | # Households | Median Income |
| Owner-Occupied | 86 (100.0%) | $32,014 |
| Renter-Occupied | 0 (0.0%) | $0 |
| Average | 86 (100.0%) | $32,014 |
Occupancy by Householder Income Bracket in Beaver Valley
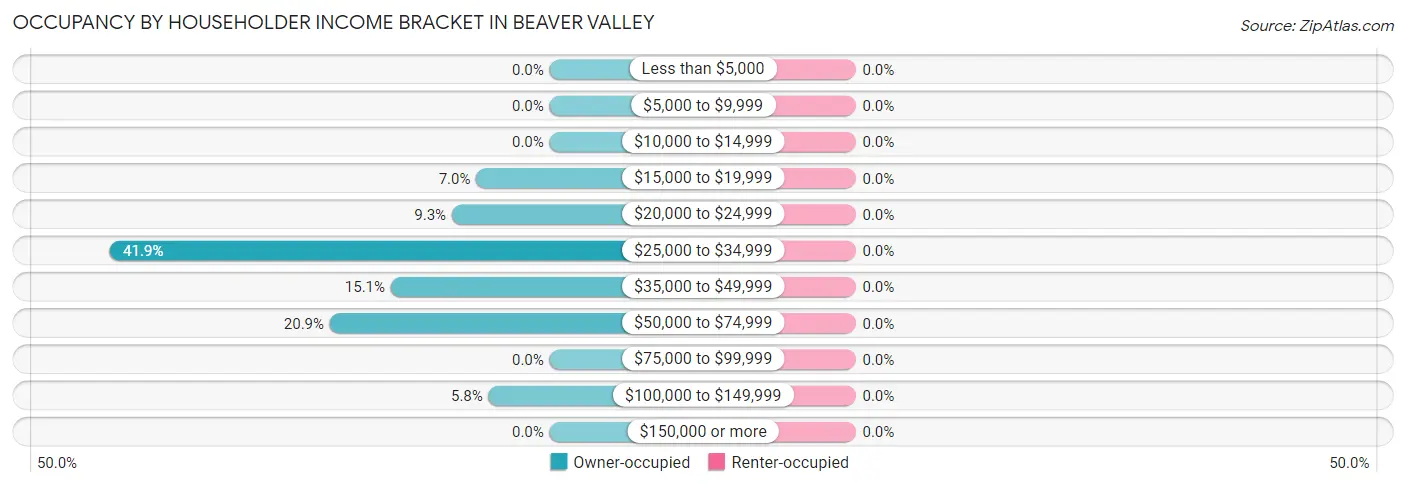
| Income Bracket | Owner-occupied | Renter-occupied |
| Less than $5,000 | 0 (0.0%) | 0 (0.0%) |
| $5,000 to $9,999 | 0 (0.0%) | 0 (0.0%) |
| $10,000 to $14,999 | 0 (0.0%) | 0 (0.0%) |
| $15,000 to $19,999 | 6 (7.0%) | 0 (0.0%) |
| $20,000 to $24,999 | 8 (9.3%) | 0 (0.0%) |
| $25,000 to $34,999 | 36 (41.9%) | 0 (0.0%) |
| $35,000 to $49,999 | 13 (15.1%) | 0 (0.0%) |
| $50,000 to $74,999 | 18 (20.9%) | 0 (0.0%) |
| $75,000 to $99,999 | 0 (0.0%) | 0 (0.0%) |
| $100,000 to $149,999 | 5 (5.8%) | 0 (0.0%) |
| $150,000 or more | 0 (0.0%) | 0 (0.0%) |
| Total | 86 (100.0%) | 0 (0.0%) |
Monthly Housing Cost Tiers in Beaver Valley
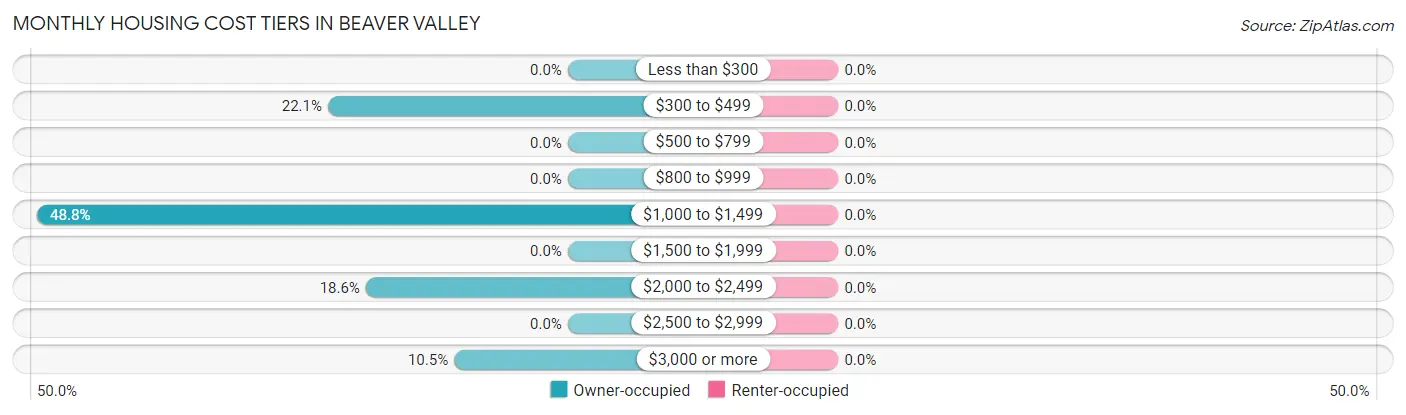
| Monthly Cost | Owner-occupied | Renter-occupied |
| Less than $300 | 0 (0.0%) | 0 (0.0%) |
| $300 to $499 | 19 (22.1%) | 0 (0.0%) |
| $500 to $799 | 0 (0.0%) | 0 (0.0%) |
| $800 to $999 | 0 (0.0%) | 0 (0.0%) |
| $1,000 to $1,499 | 42 (48.8%) | 0 (0.0%) |
| $1,500 to $1,999 | 0 (0.0%) | 0 (0.0%) |
| $2,000 to $2,499 | 16 (18.6%) | 0 (0.0%) |
| $2,500 to $2,999 | 0 (0.0%) | 0 (0.0%) |
| $3,000 or more | 9 (10.5%) | 0 (0.0%) |
| Total | 86 (100.0%) | 0 (0.0%) |
Physical Housing Characteristics in Beaver Valley
Housing Structures in Beaver Valley
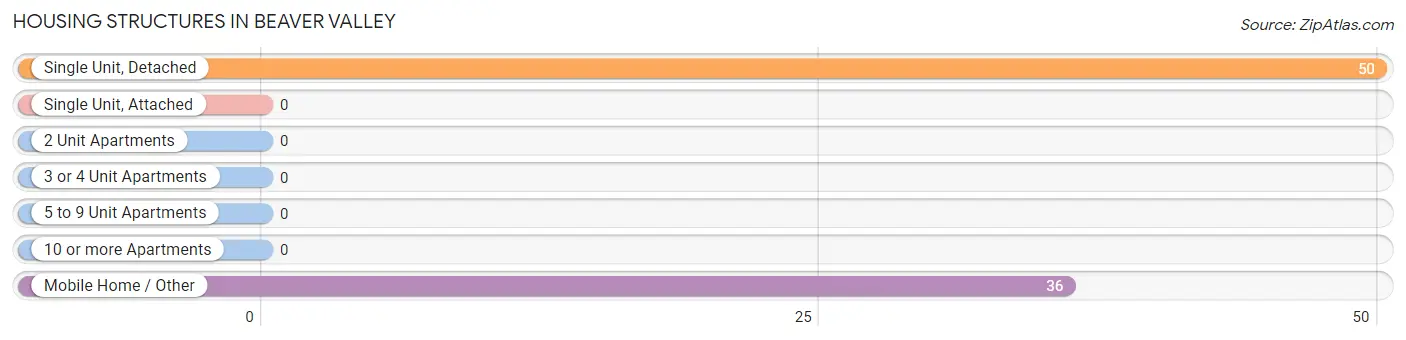
| Structure Type | # Housing Units | % Housing Units |
| Single Unit, Detached | 50 | 58.1% |
| Single Unit, Attached | 0 | 0.0% |
| 2 Unit Apartments | 0 | 0.0% |
| 3 or 4 Unit Apartments | 0 | 0.0% |
| 5 to 9 Unit Apartments | 0 | 0.0% |
| 10 or more Apartments | 0 | 0.0% |
| Mobile Home / Other | 36 | 41.9% |
| Total | 86 | 100.0% |
Housing Structures by Occupancy in Beaver Valley
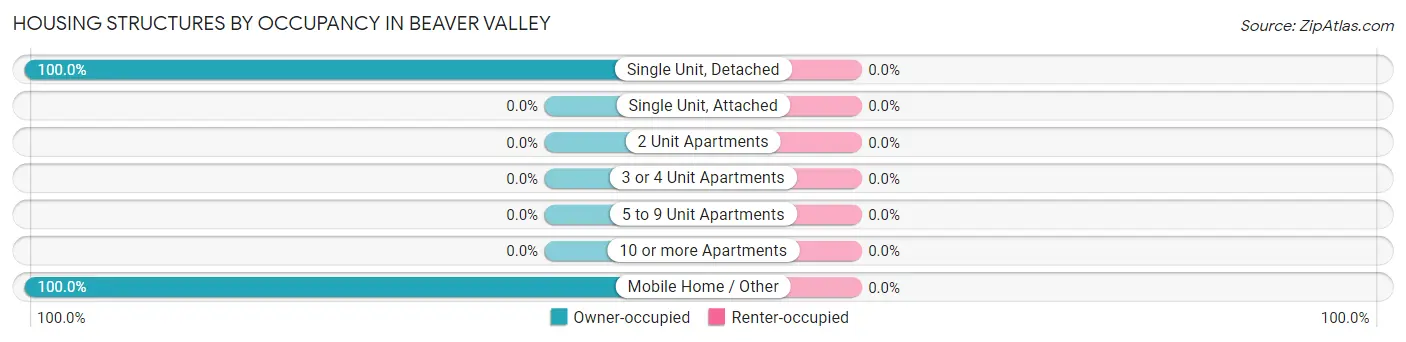
| Structure Type | Owner-occupied | Renter-occupied |
| Single Unit, Detached | 50 (100.0%) | 0 (0.0%) |
| Single Unit, Attached | 0 (0.0%) | 0 (0.0%) |
| 2 Unit Apartments | 0 (0.0%) | 0 (0.0%) |
| 3 or 4 Unit Apartments | 0 (0.0%) | 0 (0.0%) |
| 5 to 9 Unit Apartments | 0 (0.0%) | 0 (0.0%) |
| 10 or more Apartments | 0 (0.0%) | 0 (0.0%) |
| Mobile Home / Other | 36 (100.0%) | 0 (0.0%) |
| Total | 86 (100.0%) | 0 (0.0%) |
Housing Structures by Number of Rooms in Beaver Valley
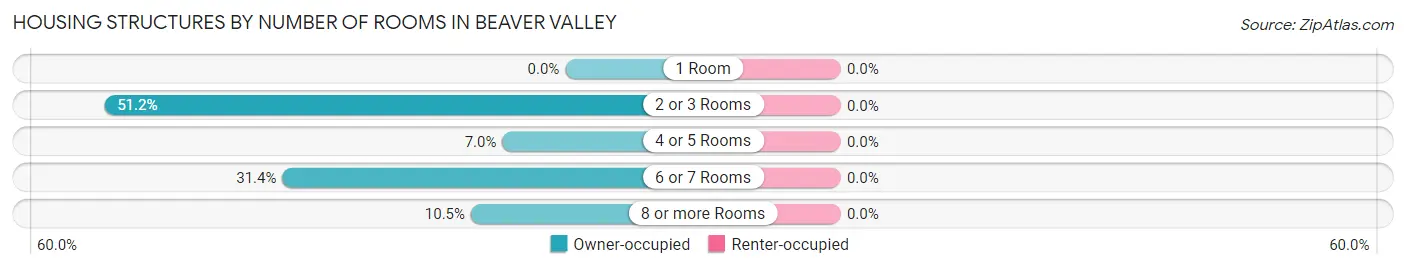
| Number of Rooms | Owner-occupied | Renter-occupied |
| 1 Room | 0 (0.0%) | 0 (0.0%) |
| 2 or 3 Rooms | 44 (51.2%) | 0 (0.0%) |
| 4 or 5 Rooms | 6 (7.0%) | 0 (0.0%) |
| 6 or 7 Rooms | 27 (31.4%) | 0 (0.0%) |
| 8 or more Rooms | 9 (10.5%) | 0 (0.0%) |
| Total | 86 (100.0%) | 0 (0.0%) |
Housing Structure by Heating Type in Beaver Valley
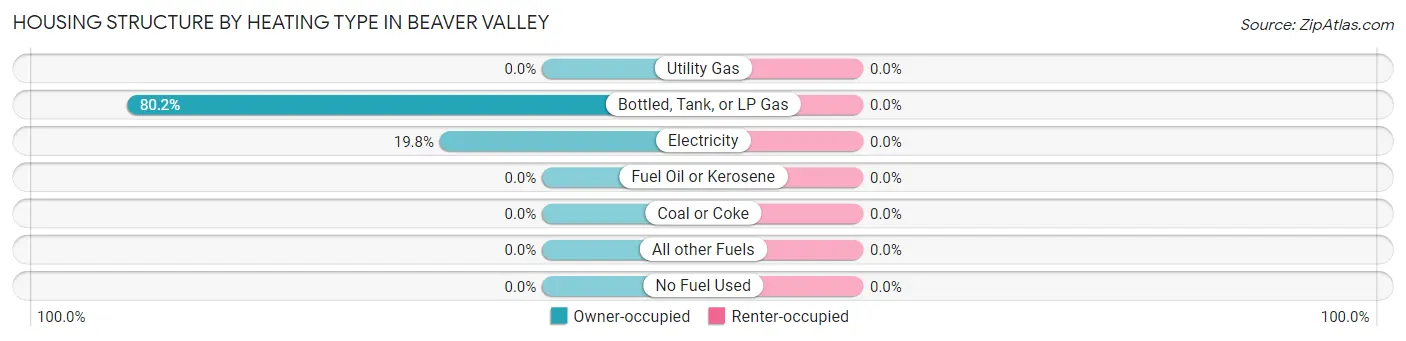
| Heating Type | Owner-occupied | Renter-occupied |
| Utility Gas | 0 (0.0%) | 0 (0.0%) |
| Bottled, Tank, or LP Gas | 69 (80.2%) | 0 (0.0%) |
| Electricity | 17 (19.8%) | 0 (0.0%) |
| Fuel Oil or Kerosene | 0 (0.0%) | 0 (0.0%) |
| Coal or Coke | 0 (0.0%) | 0 (0.0%) |
| All other Fuels | 0 (0.0%) | 0 (0.0%) |
| No Fuel Used | 0 (0.0%) | 0 (0.0%) |
| Total | 86 (100.0%) | 0 (0.0%) |
Household Vehicle Usage in Beaver Valley
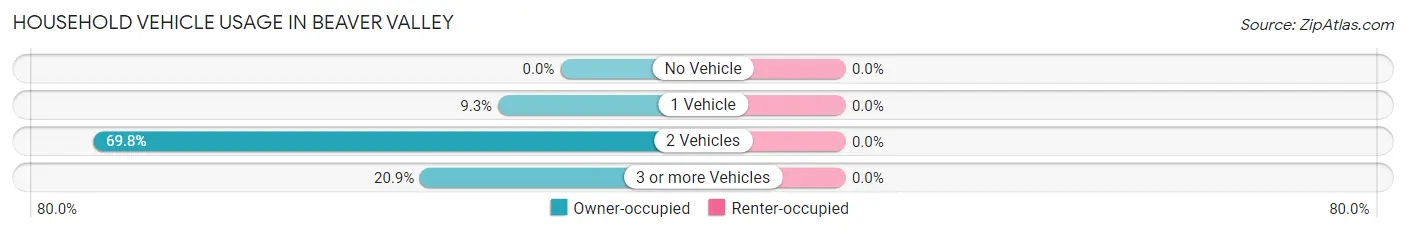
| Vehicles per Household | Owner-occupied | Renter-occupied |
| No Vehicle | 0 (0.0%) | 0 (0.0%) |
| 1 Vehicle | 8 (9.3%) | 0 (0.0%) |
| 2 Vehicles | 60 (69.8%) | 0 (0.0%) |
| 3 or more Vehicles | 18 (20.9%) | 0 (0.0%) |
| Total | 86 (100.0%) | 0 (0.0%) |
Real Estate & Mortgages in Beaver Valley
Real Estate and Mortgage Overview in Beaver Valley
| Characteristic | Without Mortgage | With Mortgage |
| Housing Units | 55 | 31 |
| Median Property Value | $238,200 | $327,800 |
| Median Household Income | $30,938 | $0 |
| Monthly Housing Costs | $1,024 | $9 |
| Real Estate Taxes | $2,136 | $0 |
Property Value by Mortgage Status in Beaver Valley
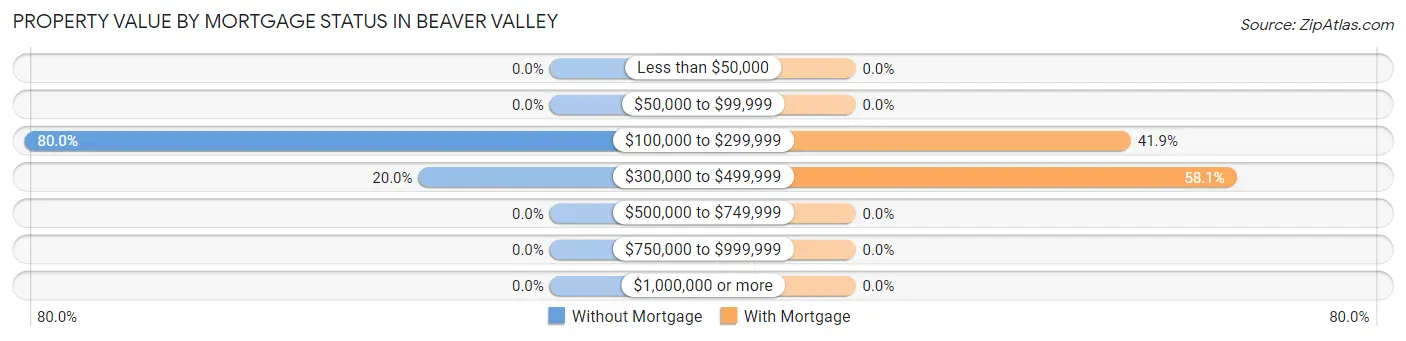
| Property Value | Without Mortgage | With Mortgage |
| Less than $50,000 | 0 (0.0%) | 0 (0.0%) |
| $50,000 to $99,999 | 0 (0.0%) | 0 (0.0%) |
| $100,000 to $299,999 | 44 (80.0%) | 13 (41.9%) |
| $300,000 to $499,999 | 11 (20.0%) | 18 (58.1%) |
| $500,000 to $749,999 | 0 (0.0%) | 0 (0.0%) |
| $750,000 to $999,999 | 0 (0.0%) | 0 (0.0%) |
| $1,000,000 or more | 0 (0.0%) | 0 (0.0%) |
| Total | 55 (100.0%) | 31 (100.0%) |
Household Income by Mortgage Status in Beaver Valley
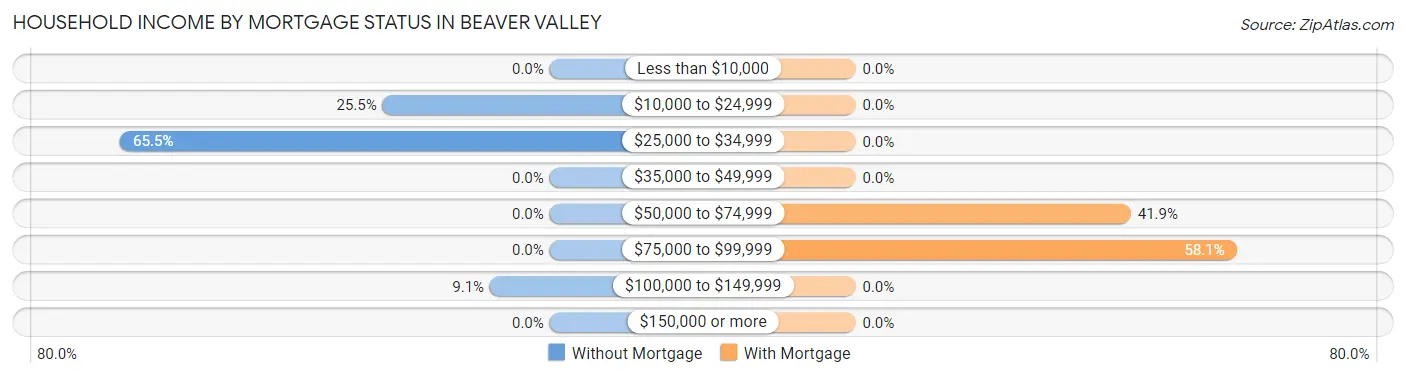
| Household Income | Without Mortgage | With Mortgage |
| Less than $10,000 | 0 (0.0%) | 0 (0.0%) |
| $10,000 to $24,999 | 14 (25.5%) | 0 (0.0%) |
| $25,000 to $34,999 | 36 (65.4%) | 0 (0.0%) |
| $35,000 to $49,999 | 0 (0.0%) | 0 (0.0%) |
| $50,000 to $74,999 | 0 (0.0%) | 13 (41.9%) |
| $75,000 to $99,999 | 0 (0.0%) | 18 (58.1%) |
| $100,000 to $149,999 | 5 (9.1%) | 0 (0.0%) |
| $150,000 or more | 0 (0.0%) | 0 (0.0%) |
| Total | 55 (100.0%) | 31 (100.0%) |
Property Value to Household Income Ratio in Beaver Valley
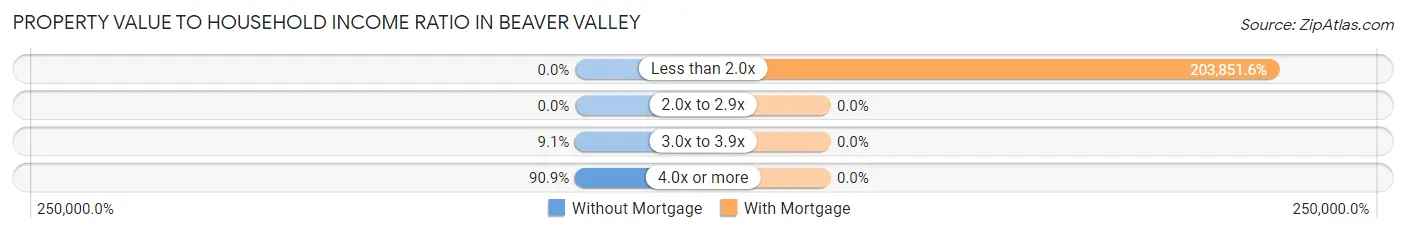
| Value-to-Income Ratio | Without Mortgage | With Mortgage |
| Less than 2.0x | 0 (0.0%) | 63,194 (203,851.6%) |
| 2.0x to 2.9x | 0 (0.0%) | 0 (0.0%) |
| 3.0x to 3.9x | 5 (9.1%) | 0 (0.0%) |
| 4.0x or more | 50 (90.9%) | 0 (0.0%) |
| Total | 55 (100.0%) | 31 (100.0%) |
Real Estate Taxes by Mortgage Status in Beaver Valley
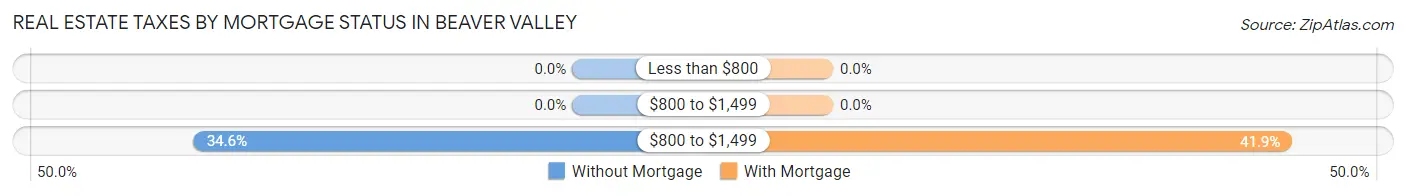
| Property Taxes | Without Mortgage | With Mortgage |
| Less than $800 | 0 (0.0%) | 0 (0.0%) |
| $800 to $1,499 | 0 (0.0%) | 0 (0.0%) |
| $800 to $1,499 | 19 (34.5%) | 13 (41.9%) |
| Total | 55 (100.0%) | 31 (100.0%) |
Health & Disability in Beaver Valley
Health Insurance Coverage by Age in Beaver Valley
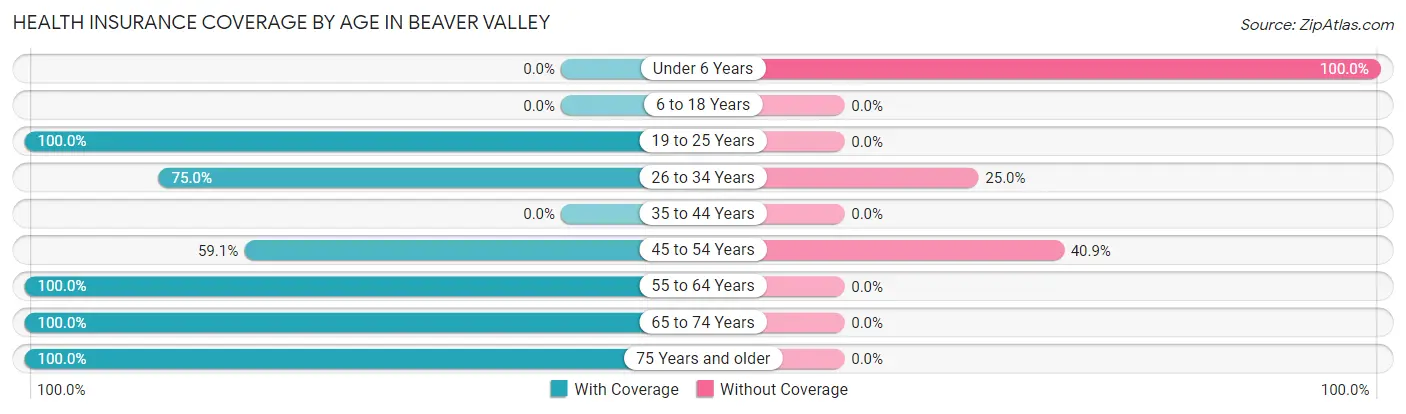
| Age Bracket | With Coverage | Without Coverage |
| Under 6 Years | 0 (0.0%) | 9 (100.0%) |
| 6 to 18 Years | 0 (0.0%) | 0 (0.0%) |
| 19 to 25 Years | 3 (100.0%) | 0 (0.0%) |
| 26 to 34 Years | 9 (75.0%) | 3 (25.0%) |
| 35 to 44 Years | 0 (0.0%) | 0 (0.0%) |
| 45 to 54 Years | 13 (59.1%) | 9 (40.9%) |
| 55 to 64 Years | 22 (100.0%) | 0 (0.0%) |
| 65 to 74 Years | 54 (100.0%) | 0 (0.0%) |
| 75 Years and older | 11 (100.0%) | 0 (0.0%) |
| Total | 112 (84.2%) | 21 (15.8%) |
Health Insurance Coverage by Citizenship Status in Beaver Valley
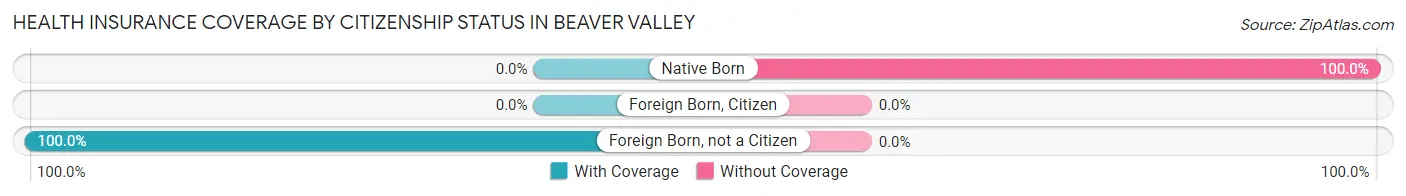
| Citizenship Status | With Coverage | Without Coverage |
| Native Born | 0 (0.0%) | 9 (100.0%) |
| Foreign Born, Citizen | 0 (0.0%) | 0 (0.0%) |
| Foreign Born, not a Citizen | 3 (100.0%) | 0 (0.0%) |
Health Insurance Coverage by Household Income in Beaver Valley
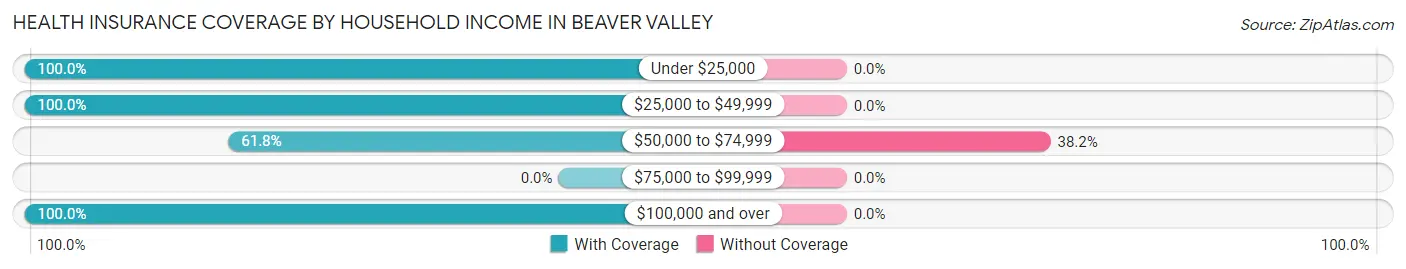
| Household Income | With Coverage | Without Coverage |
| Under $25,000 | 20 (100.0%) | 0 (0.0%) |
| $25,000 to $49,999 | 49 (100.0%) | 0 (0.0%) |
| $50,000 to $74,999 | 34 (61.8%) | 21 (38.2%) |
| $75,000 to $99,999 | 0 (0.0%) | 0 (0.0%) |
| $100,000 and over | 9 (100.0%) | 0 (0.0%) |
Public vs Private Health Insurance Coverage by Age in Beaver Valley
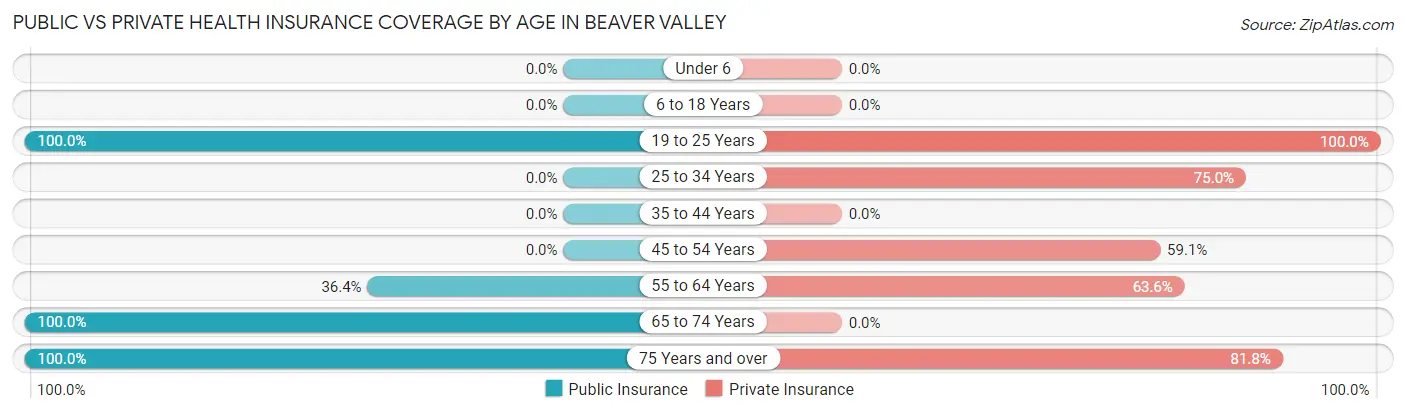
| Age Bracket | Public Insurance | Private Insurance |
| Under 6 | 0 (0.0%) | 0 (0.0%) |
| 6 to 18 Years | 0 (0.0%) | 0 (0.0%) |
| 19 to 25 Years | 3 (100.0%) | 3 (100.0%) |
| 25 to 34 Years | 0 (0.0%) | 9 (75.0%) |
| 35 to 44 Years | 0 (0.0%) | 0 (0.0%) |
| 45 to 54 Years | 0 (0.0%) | 13 (59.1%) |
| 55 to 64 Years | 8 (36.4%) | 14 (63.6%) |
| 65 to 74 Years | 54 (100.0%) | 0 (0.0%) |
| 75 Years and over | 11 (100.0%) | 9 (81.8%) |
| Total | 76 (57.1%) | 48 (36.1%) |
Disability Status by Sex by Age in Beaver Valley
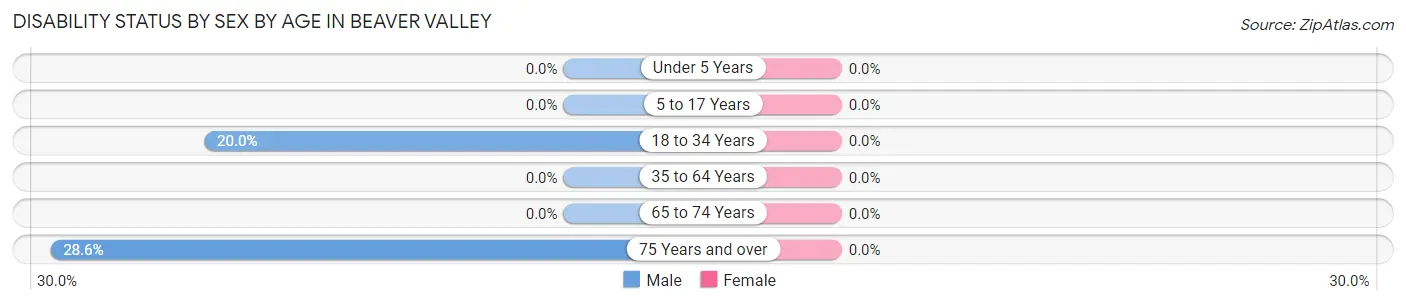
| Age Bracket | Male | Female |
| Under 5 Years | 0 (0.0%) | 0 (0.0%) |
| 5 to 17 Years | 0 (0.0%) | 0 (0.0%) |
| 18 to 34 Years | 3 (20.0%) | 0 (0.0%) |
| 35 to 64 Years | 0 (0.0%) | 0 (0.0%) |
| 65 to 74 Years | 0 (0.0%) | 0 (0.0%) |
| 75 Years and over | 2 (28.6%) | 0 (0.0%) |
Disability Class by Sex by Age in Beaver Valley
Disability Class: Hearing Difficulty
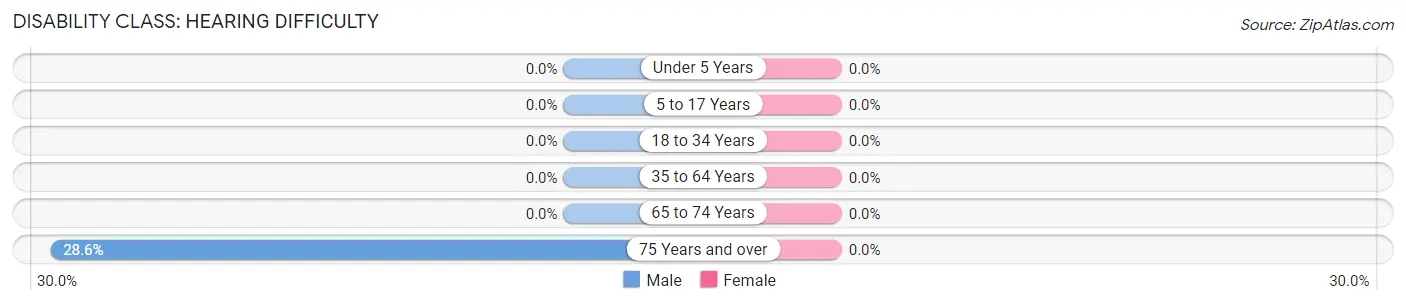
| Age Bracket | Male | Female |
| Under 5 Years | 0 (0.0%) | 0 (0.0%) |
| 5 to 17 Years | 0 (0.0%) | 0 (0.0%) |
| 18 to 34 Years | 0 (0.0%) | 0 (0.0%) |
| 35 to 64 Years | 0 (0.0%) | 0 (0.0%) |
| 65 to 74 Years | 0 (0.0%) | 0 (0.0%) |
| 75 Years and over | 2 (28.6%) | 0 (0.0%) |
Disability Class: Vision Difficulty
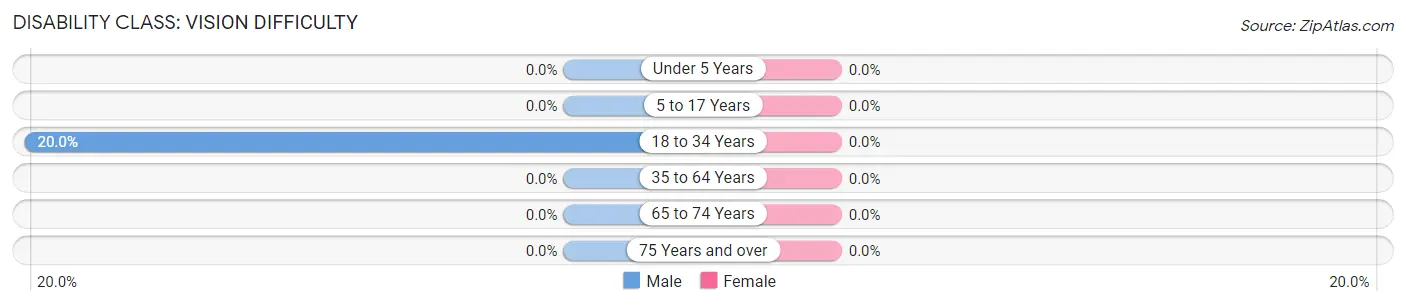
| Age Bracket | Male | Female |
| Under 5 Years | 0 (0.0%) | 0 (0.0%) |
| 5 to 17 Years | 0 (0.0%) | 0 (0.0%) |
| 18 to 34 Years | 3 (20.0%) | 0 (0.0%) |
| 35 to 64 Years | 0 (0.0%) | 0 (0.0%) |
| 65 to 74 Years | 0 (0.0%) | 0 (0.0%) |
| 75 Years and over | 0 (0.0%) | 0 (0.0%) |
Disability Class: Cognitive Difficulty
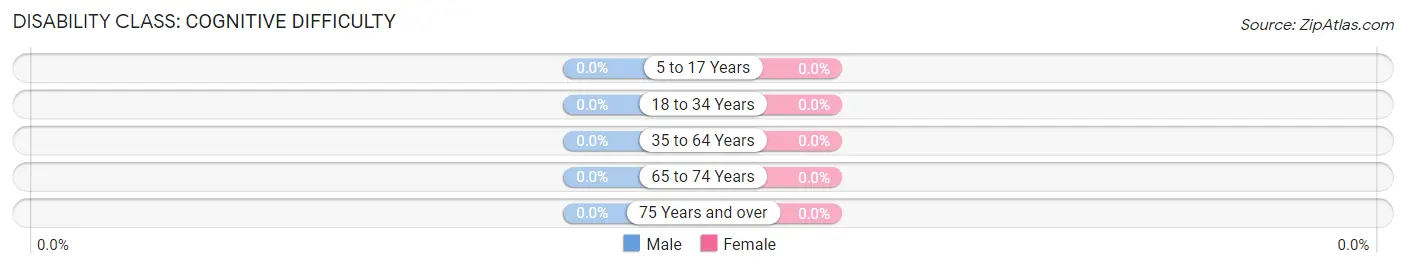
| Age Bracket | Male | Female |
| 5 to 17 Years | 0 (0.0%) | 0 (0.0%) |
| 18 to 34 Years | 0 (0.0%) | 0 (0.0%) |
| 35 to 64 Years | 0 (0.0%) | 0 (0.0%) |
| 65 to 74 Years | 0 (0.0%) | 0 (0.0%) |
| 75 Years and over | 0 (0.0%) | 0 (0.0%) |
Disability Class: Ambulatory Difficulty
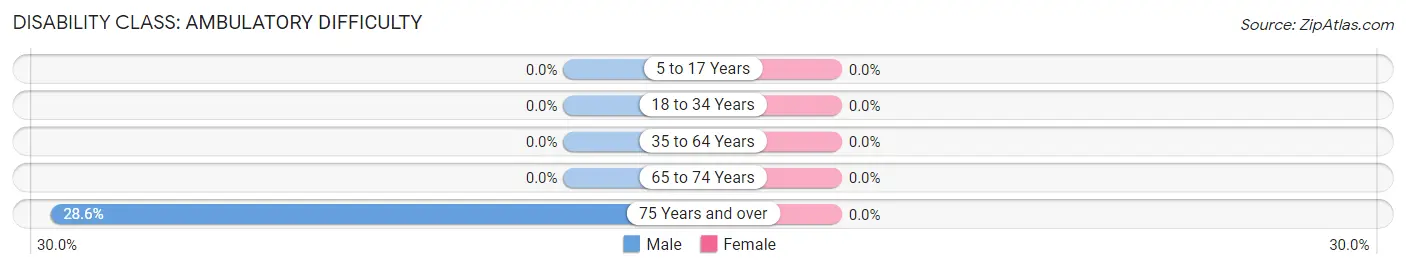
| Age Bracket | Male | Female |
| 5 to 17 Years | 0 (0.0%) | 0 (0.0%) |
| 18 to 34 Years | 0 (0.0%) | 0 (0.0%) |
| 35 to 64 Years | 0 (0.0%) | 0 (0.0%) |
| 65 to 74 Years | 0 (0.0%) | 0 (0.0%) |
| 75 Years and over | 2 (28.6%) | 0 (0.0%) |
Disability Class: Self-Care Difficulty
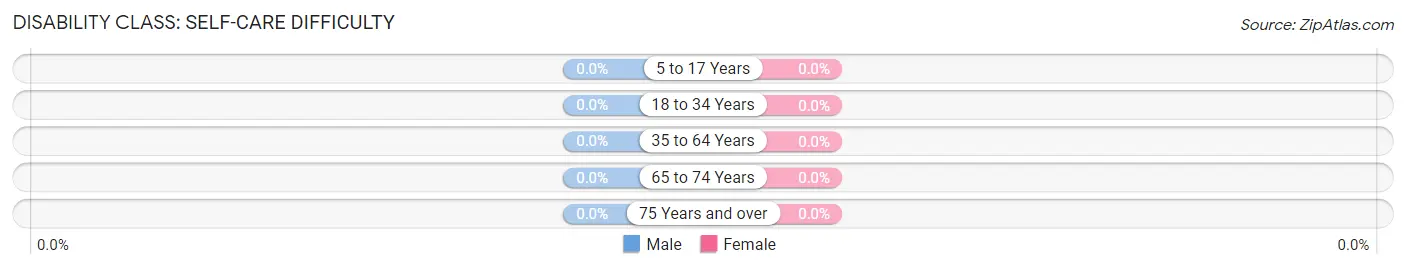
| Age Bracket | Male | Female |
| 5 to 17 Years | 0 (0.0%) | 0 (0.0%) |
| 18 to 34 Years | 0 (0.0%) | 0 (0.0%) |
| 35 to 64 Years | 0 (0.0%) | 0 (0.0%) |
| 65 to 74 Years | 0 (0.0%) | 0 (0.0%) |
| 75 Years and over | 0 (0.0%) | 0 (0.0%) |
Technology Access in Beaver Valley
Computing Device Access in Beaver Valley
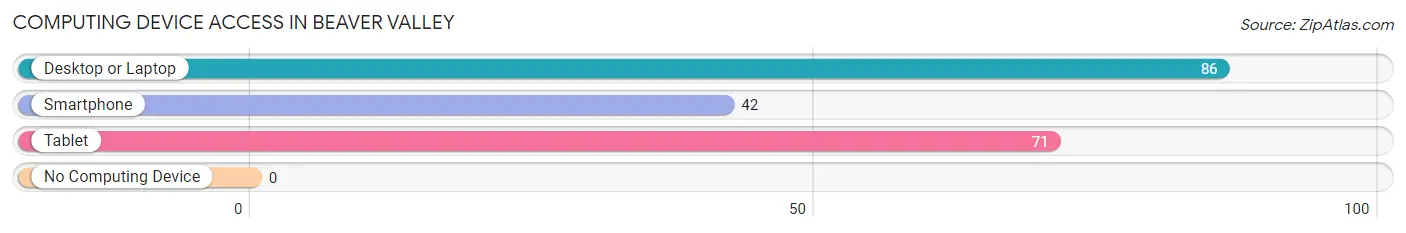
| Device Type | # Households | % Households |
| Desktop or Laptop | 86 | 100.0% |
| Smartphone | 42 | 48.8% |
| Tablet | 71 | 82.6% |
| No Computing Device | 0 | 0.0% |
| Total | 86 | 100.0% |
Internet Access in Beaver Valley
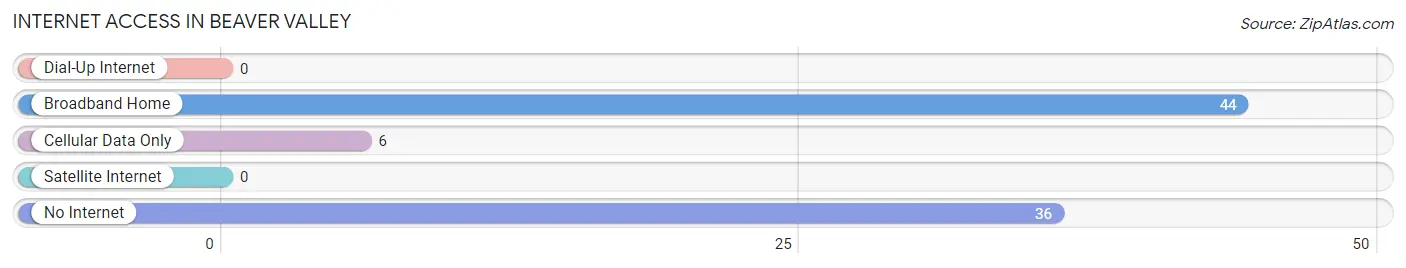
| Internet Type | # Households | % Households |
| Dial-Up Internet | 0 | 0.0% |
| Broadband Home | 44 | 51.2% |
| Cellular Data Only | 6 | 7.0% |
| Satellite Internet | 0 | 0.0% |
| No Internet | 36 | 41.9% |
| Total | 86 | 100.0% |
Beaver Valley Summary
Beaver Valley is a small unincorporated community located in the White Mountains of Arizona. It is situated in the Apache-Sitgreaves National Forest, approximately 20 miles east of Show Low. The area is known for its scenic beauty, with lush forests, meadows, and streams.
History
Beaver Valley was first settled in the late 1800s by ranchers and farmers. The area was originally known as “Beaver Valley Ranch” and was home to a number of homesteaders. The first post office was established in the area in 1891.
In the early 1900s, the area began to attract tourists and vacationers. The first hotel was built in the area in 1908, and the first store opened in 1910. The area was also home to a number of summer camps, including Camp Apache, which was established in 1912.
Geography
Beaver Valley is located in the White Mountains of Arizona, approximately 20 miles east of Show Low. The area is known for its scenic beauty, with lush forests, meadows, and streams. The area is also home to a number of lakes, including Big Lake, Little Lake, and Lake of the Woods.
The area is also home to a number of wildlife species, including elk, deer, and black bear. The area is also home to a variety of bird species, including bald eagles, hawks, and owls.
Economy
Beaver Valley is primarily a tourist destination, with a number of recreational activities available in the area. The area is home to a number of campgrounds, RV parks, and resorts. The area is also home to a number of restaurants, stores, and other businesses.
The area is also home to a number of logging and timber companies, as well as a number of small farms and ranches. The area is also home to a number of mining operations, including copper, gold, and silver.
Demographics
As of the 2010 census, the population of Beaver Valley was 1,093. The population is primarily white (94.3%), with a small percentage of Native American (2.2%) and Hispanic (2.1%) residents. The median household income in the area is $37,500, and the median age is 44.
Conclusion
Beaver Valley is a small unincorporated community located in the White Mountains of Arizona. It is known for its scenic beauty, with lush forests, meadows, and streams. The area is primarily a tourist destination, with a number of recreational activities available in the area. The area is also home to a number of logging and timber companies, as well as a number of small farms and ranches. As of the 2010 census, the population of Beaver Valley was 1,093. The population is primarily white, with a small percentage of Native American and Hispanic residents.
Common Questions
What is Per Capita Income in Beaver Valley?
Per Capita income in Beaver Valley is $27,485.
What is the Median Family Income in Beaver Valley?
Median Family Income in Beaver Valley is $64,028.
What is the Median Household income in Beaver Valley?
Median Household Income in Beaver Valley is $32,014.
What is Inequality or Gini Index in Beaver Valley?
Inequality or Gini Index in Beaver Valley is 0.28.
What is the Total Population of Beaver Valley?
Total Population of Beaver Valley is 133.
What is the Total Male Population of Beaver Valley?
Total Male Population of Beaver Valley is 55.
What is the Total Female Population of Beaver Valley?
Total Female Population of Beaver Valley is 78.
What is the Ratio of Males per 100 Females in Beaver Valley?
There are 70.51 Males per 100 Females in Beaver Valley.
What is the Ratio of Females per 100 Males in Beaver Valley?
There are 141.82 Females per 100 Males in Beaver Valley.
What is the Median Population Age in Beaver Valley?
Median Population Age in Beaver Valley is 63.8 Years.
What is the Average Family Size in Beaver Valley
Average Family Size in Beaver Valley is 2.5 People.
What is the Average Household Size in Beaver Valley
Average Household Size in Beaver Valley is 1.6 People.
How Large is the Labor Force in Beaver Valley?
There are 42 People in the Labor Forcein in Beaver Valley.
What is the Percentage of People in the Labor Force in Beaver Valley?
33.9% of People are in the Labor Force in Beaver Valley.