Zip Codes with the Highest Percentage of Population Employed in Food Preparation & Serving in Tucson, AZ
RELATED REPORTS & OPTIONS
Food Preparation & Serving
Tucson
Compare Zip Codes
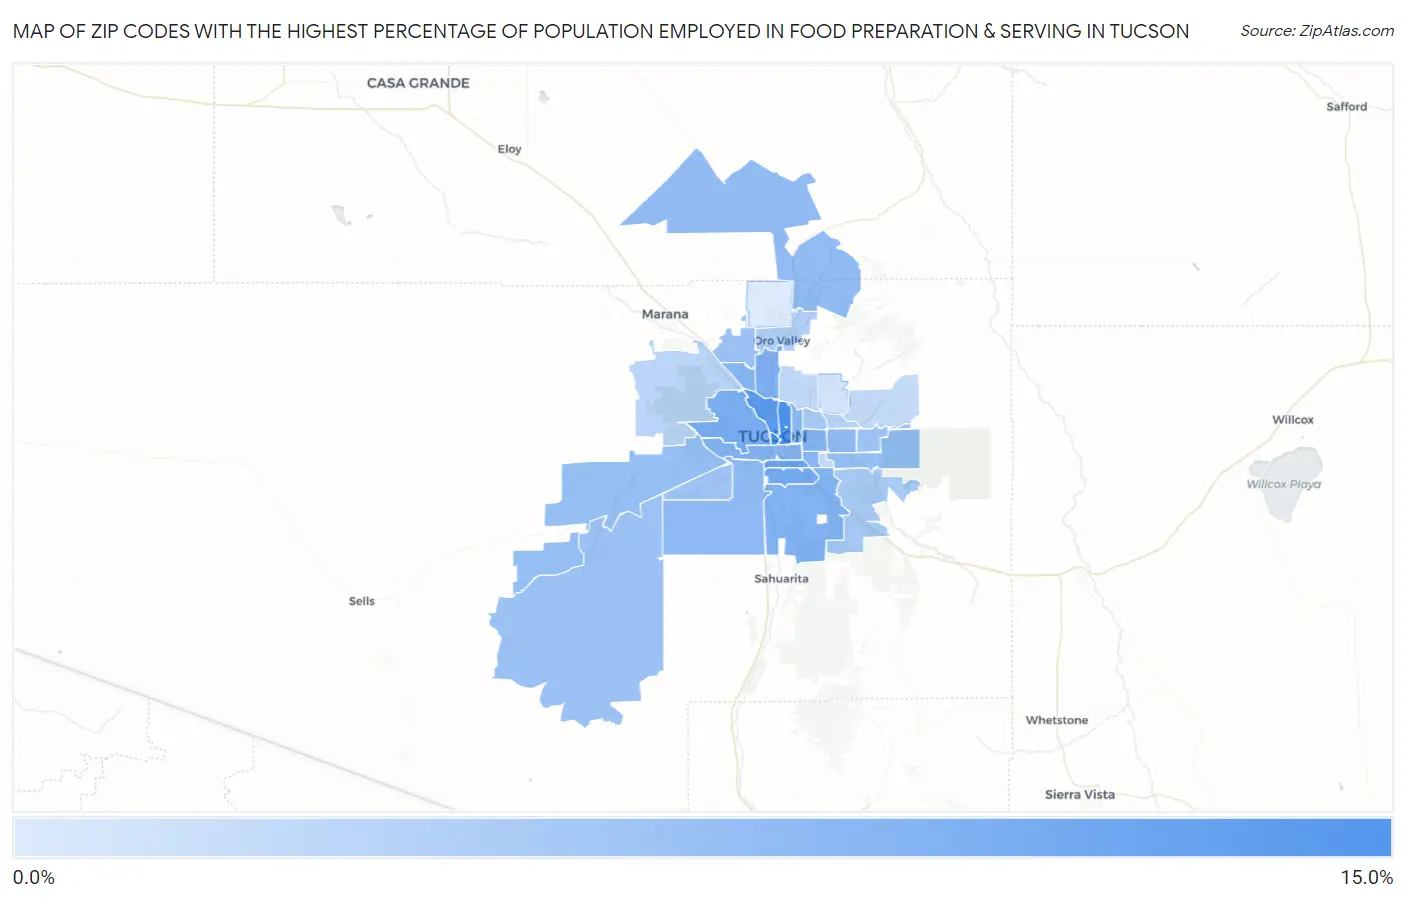
Map of Zip Codes with the Highest Percentage of Population Employed in Food Preparation & Serving in Tucson
0.93%
12.0%
Zip Codes with the Highest Percentage of Population Employed in Food Preparation & Serving in Tucson, AZ
| Zip Code | % Employed | vs State | vs National | |
| 1. | 85701 | 12.0% | 5.7%(+6.34)#32 | 5.3%(+6.72)#1,658 |
| 2. | 85719 | 11.6% | 5.7%(+5.95)#35 | 5.3%(+6.33)#1,812 |
| 3. | 85705 | 10.7% | 5.7%(+5.05)#40 | 5.3%(+5.43)#2,196 |
| 4. | 85714 | 9.3% | 5.7%(+3.64)#61 | 5.3%(+4.02)#3,228 |
| 5. | 85706 | 8.5% | 5.7%(+2.83)#74 | 5.3%(+3.22)#4,072 |
| 6. | 85745 | 8.1% | 5.7%(+2.46)#80 | 5.3%(+2.84)#4,548 |
| 7. | 85704 | 7.8% | 5.7%(+2.13)#84 | 5.3%(+2.51)#5,069 |
| 8. | 85756 | 7.6% | 5.7%(+1.90)#85 | 5.3%(+2.28)#5,442 |
| 9. | 85713 | 7.5% | 5.7%(+1.80)#88 | 5.3%(+2.18)#5,623 |
| 10. | 85711 | 7.4% | 5.7%(+1.72)#90 | 5.3%(+2.10)#5,768 |
| 11. | 85707 | 7.3% | 5.7%(+1.65)#92 | 5.3%(+2.03)#5,890 |
| 12. | 85741 | 7.2% | 5.7%(+1.57)#94 | 5.3%(+1.95)#6,048 |
| 13. | 85716 | 6.8% | 5.7%(+1.17)#110 | 5.3%(+1.55)#6,963 |
| 14. | 85710 | 6.6% | 5.7%(+0.972)#116 | 5.3%(+1.35)#7,510 |
| 15. | 85746 | 6.6% | 5.7%(+0.930)#121 | 5.3%(+1.31)#7,610 |
| 16. | 85739 | 6.5% | 5.7%(+0.790)#128 | 5.3%(+1.17)#7,978 |
| 17. | 85735 | 6.1% | 5.7%(+0.479)#144 | 5.3%(+0.860)#8,890 |
| 18. | 85730 | 6.1% | 5.7%(+0.388)#148 | 5.3%(+0.769)#9,160 |
| 19. | 85736 | 5.8% | 5.7%(+0.097)#167 | 5.3%(+0.478)#10,138 |
| 20. | 85742 | 5.7% | 5.7%(+0.080)#169 | 5.3%(+0.461)#10,186 |
| 21. | 85748 | 5.4% | 5.7%(-0.262)#183 | 5.3%(+0.119)#11,393 |
| 22. | 85757 | 5.2% | 5.7%(-0.477)#190 | 5.3%(-0.096)#12,188 |
| 23. | 85712 | 4.7% | 5.7%(-1.01)#215 | 5.3%(-0.627)#14,332 |
| 24. | 85747 | 4.6% | 5.7%(-1.02)#216 | 5.3%(-0.638)#14,380 |
| 25. | 85737 | 4.0% | 5.7%(-1.63)#246 | 5.3%(-1.24)#16,963 |
| 26. | 85715 | 3.6% | 5.7%(-2.06)#266 | 5.3%(-1.68)#18,753 |
| 27. | 85743 | 3.4% | 5.7%(-2.28)#281 | 5.3%(-1.90)#19,663 |
| 28. | 85718 | 3.0% | 5.7%(-2.66)#294 | 5.3%(-2.28)#21,228 |
| 29. | 85708 | 2.9% | 5.7%(-2.78)#302 | 5.3%(-2.40)#21,698 |
| 30. | 85749 | 2.7% | 5.7%(-2.92)#309 | 5.3%(-2.54)#22,265 |
| 31. | 85750 | 1.6% | 5.7%(-4.10)#340 | 5.3%(-3.72)#25,841 |
| 32. | 85755 | 0.93% | 5.7%(-4.73)#346 | 5.3%(-4.35)#27,093 |
1
Common Questions
What are the Top 10 Zip Codes with the Highest Percentage of Population Employed in Food Preparation & Serving in Tucson, AZ?
Top 10 Zip Codes with the Highest Percentage of Population Employed in Food Preparation & Serving in Tucson, AZ are:
What zip code has the Highest Percentage of Population Employed in Food Preparation & Serving in Tucson, AZ?
85701 has the Highest Percentage of Population Employed in Food Preparation & Serving in Tucson, AZ with 12.0%.
What is the Percentage of Population Employed in Food Preparation & Serving in Tucson, AZ?
Percentage of Population Employed in Food Preparation & Serving in Tucson is 7.9%.
What is the Percentage of Population Employed in Food Preparation & Serving in Arizona?
Percentage of Population Employed in Food Preparation & Serving in Arizona is 5.7%.
What is the Percentage of Population Employed in Food Preparation & Serving in the United States?
Percentage of Population Employed in Food Preparation & Serving in the United States is 5.3%.