Second Mesa, AZ Map & Demographics
Second Mesa Map
Second Mesa Overview
$10,705
PER CAPITA INCOME
$50,625
AVG FAMILY INCOME
$50,700
AVG HOUSEHOLD INCOME
0.33
INEQUALITY / GINI INDEX
1,372
TOTAL POPULATION
646
MALE POPULATION
726
FEMALE POPULATION
88.98
MALES / 100 FEMALES
112.38
FEMALES / 100 MALES
26.3
MEDIAN AGE
4.8
AVG FAMILY SIZE
4.7
AVG HOUSEHOLD SIZE
541
LABOR FORCE [ PEOPLE ]
56.1%
PERCENT IN LABOR FORCE
20.1%
UNEMPLOYMENT RATE
Second Mesa Zip Codes
Second Mesa Area Codes
Income in Second Mesa
Income Overview in Second Mesa
Per Capita Income in Second Mesa is $10,705, while median incomes of families and households are $50,625 and $50,700 respectively.
| Characteristic | Number | Measure |
| Per Capita Income | 1,372 | $10,705 |
| Median Family Income | 231 | $50,625 |
| Mean Family Income | 231 | $48,376 |
| Median Household Income | 290 | $50,700 |
| Mean Household Income | 290 | $44,869 |
| Income Deficit | 231 | $0 |
| Wage / Income Gap (%) | 1,372 | 0.00% |
| Wage / Income Gap ($) | 1,372 | 100.00¢ per $1 |
| Gini / Inequality Index | 1,372 | 0.33 |
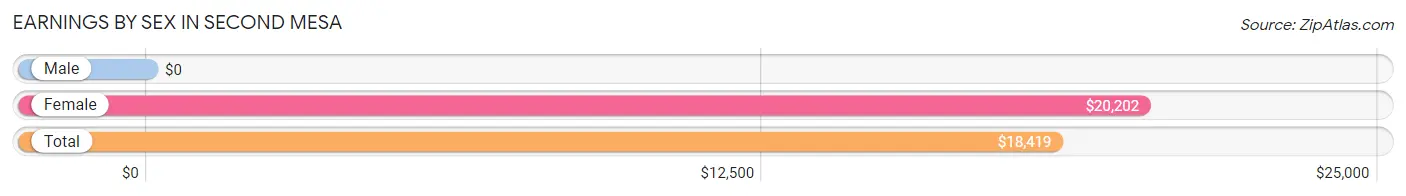
Earnings by Sex in Second Mesa
| Sex | Number | Average Earnings |
| Male | 170 (35.9%) | $0 |
| Female | 303 (64.1%) | $20,202 |
| Total | 473 (100.0%) | $18,419 |
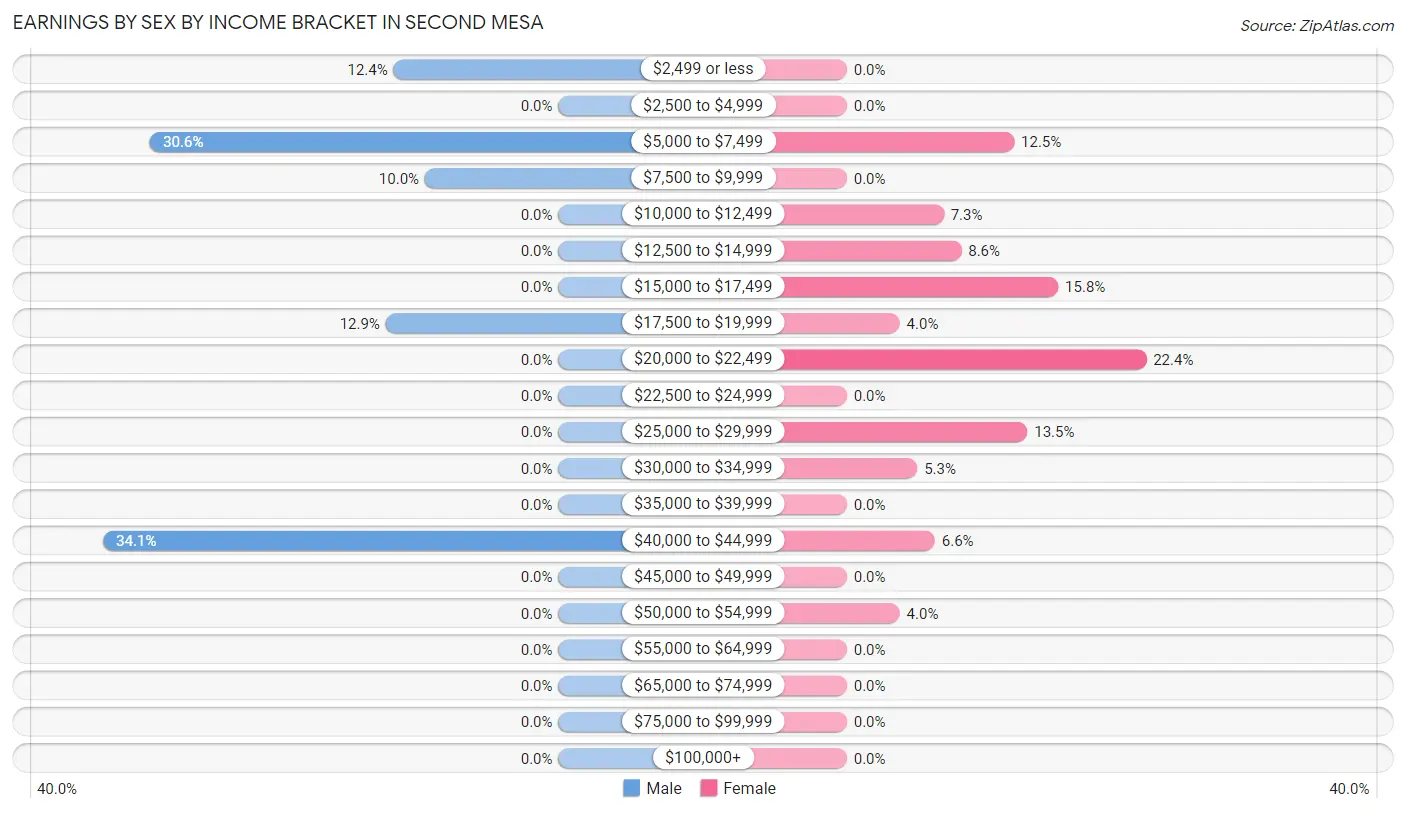
Earnings by Sex by Income Bracket in Second Mesa
The most common earnings brackets in Second Mesa are $40,000 to $44,999 for men (58 | 34.1%) and $20,000 to $22,499 for women (68 | 22.4%).
| Income | Male | Female |
| $2,499 or less | 21 (12.3%) | 0 (0.0%) |
| $2,500 to $4,999 | 0 (0.0%) | 0 (0.0%) |
| $5,000 to $7,499 | 52 (30.6%) | 38 (12.5%) |
| $7,500 to $9,999 | 17 (10.0%) | 0 (0.0%) |
| $10,000 to $12,499 | 0 (0.0%) | 22 (7.3%) |
| $12,500 to $14,999 | 0 (0.0%) | 26 (8.6%) |
| $15,000 to $17,499 | 0 (0.0%) | 48 (15.8%) |
| $17,500 to $19,999 | 22 (12.9%) | 12 (4.0%) |
| $20,000 to $22,499 | 0 (0.0%) | 68 (22.4%) |
| $22,500 to $24,999 | 0 (0.0%) | 0 (0.0%) |
| $25,000 to $29,999 | 0 (0.0%) | 41 (13.5%) |
| $30,000 to $34,999 | 0 (0.0%) | 16 (5.3%) |
| $35,000 to $39,999 | 0 (0.0%) | 0 (0.0%) |
| $40,000 to $44,999 | 58 (34.1%) | 20 (6.6%) |
| $45,000 to $49,999 | 0 (0.0%) | 0 (0.0%) |
| $50,000 to $54,999 | 0 (0.0%) | 12 (4.0%) |
| $55,000 to $64,999 | 0 (0.0%) | 0 (0.0%) |
| $65,000 to $74,999 | 0 (0.0%) | 0 (0.0%) |
| $75,000 to $99,999 | 0 (0.0%) | 0 (0.0%) |
| $100,000+ | 0 (0.0%) | 0 (0.0%) |
| Total | 170 (100.0%) | 303 (100.0%) |
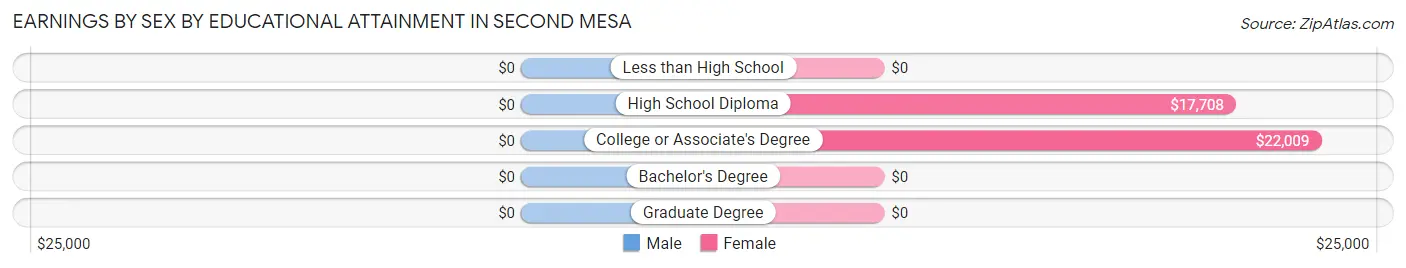
Earnings by Sex by Educational Attainment in Second Mesa
| Educational Attainment | Male Income | Female Income |
| Less than High School | - | - |
| High School Diploma | - | - |
| College or Associate's Degree | - | - |
| Bachelor's Degree | - | - |
| Graduate Degree | - | - |
| Total | - | - |
Family Income in Second Mesa
Family Income Brackets in Second Mesa
According to the Second Mesa family income data, there are 105 families falling into the $50,000 to $74,999 income range, which is the most common income bracket and makes up 45.5% of all families.
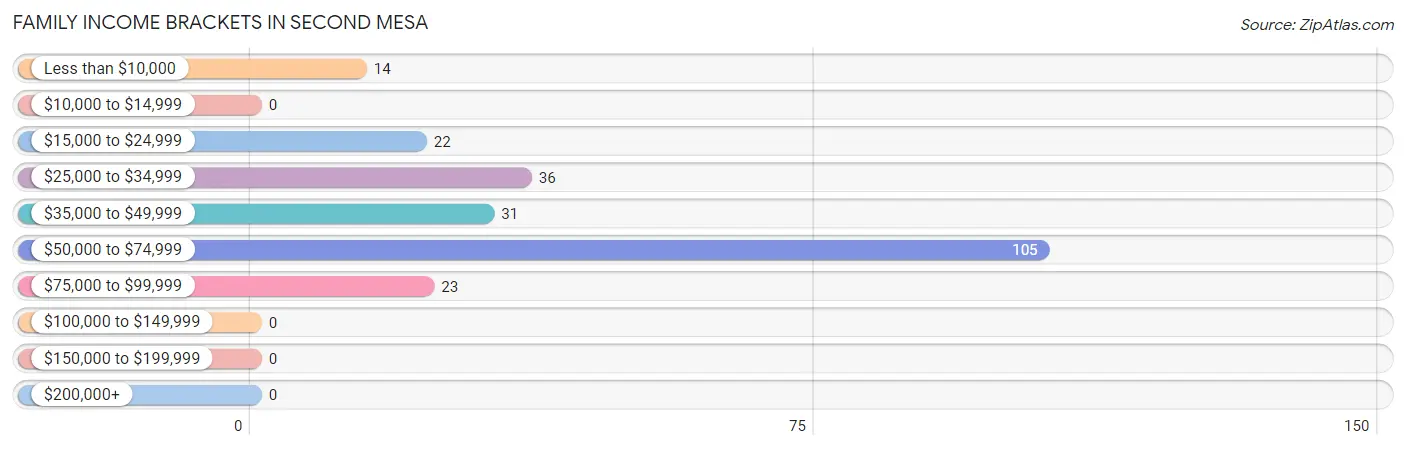
| Income Bracket | # Families | % Families |
| Less than $10,000 | 14 | 6.1% |
| $10,000 to $14,999 | 0 | 0.0% |
| $15,000 to $24,999 | 22 | 9.5% |
| $25,000 to $34,999 | 36 | 15.6% |
| $35,000 to $49,999 | 31 | 13.4% |
| $50,000 to $74,999 | 105 | 45.5% |
| $75,000 to $99,999 | 23 | 10.0% |
| $100,000 to $149,999 | 0 | 0.0% |
| $150,000 to $199,999 | 0 | 0.0% |
| $200,000+ | 0 | 0.0% |
Family Income by Famaliy Size in Second Mesa
5-person families (88 | 38.1%) account for the highest median family income in Second Mesa with $52,083 per family, while 5-person families (88 | 38.1%) have the highest median income of $10,417 per family member.
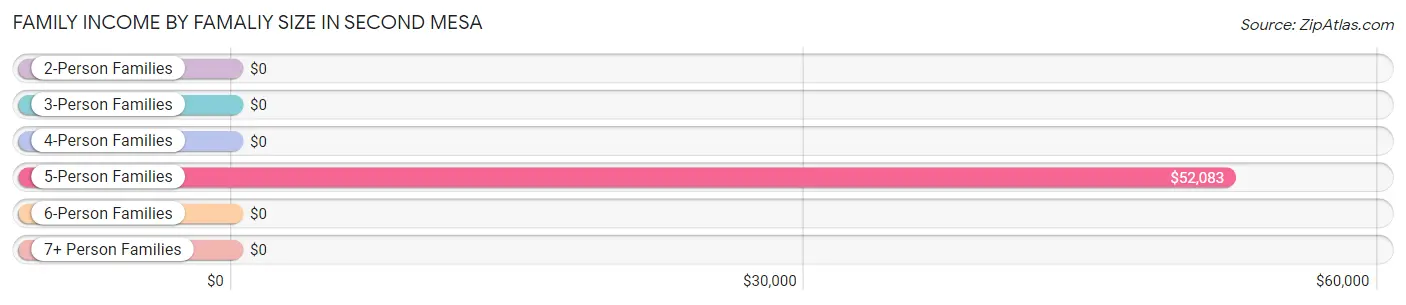
| Income Bracket | # Families | Median Income |
| 2-Person Families | 28 (12.1%) | $0 |
| 3-Person Families | 43 (18.6%) | $0 |
| 4-Person Families | 32 (13.9%) | $0 |
| 5-Person Families | 88 (38.1%) | $52,083 |
| 6-Person Families | 28 (12.1%) | $0 |
| 7+ Person Families | 12 (5.2%) | $0 |
| Total | 231 (100.0%) | $50,625 |
Family Income by Number of Earners in Second Mesa
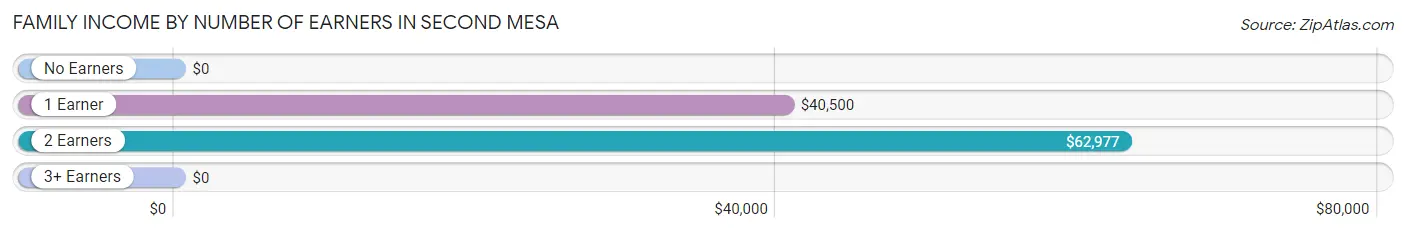
| Number of Earners | # Families | Median Income |
| No Earners | 0 (0.0%) | $0 |
| 1 Earner | 118 (51.1%) | $40,500 |
| 2 Earners | 113 (48.9%) | $62,977 |
| 3+ Earners | 0 (0.0%) | $0 |
| Total | 231 (100.0%) | $50,625 |
Household Income in Second Mesa
Household Income Brackets in Second Mesa
With 136 households falling in the category, the $50,000 to $74,999 income range is the most frequent in Second Mesa, accounting for 46.9% of all households.
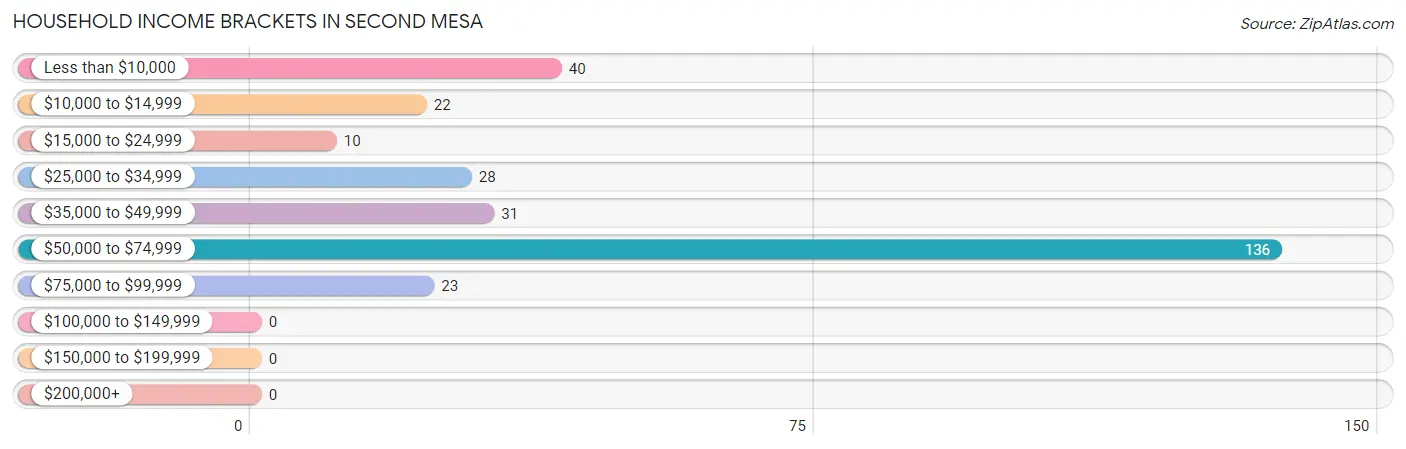
| Income Bracket | # Households | % Households |
| Less than $10,000 | 40 | 13.8% |
| $10,000 to $14,999 | 22 | 7.6% |
| $15,000 to $24,999 | 10 | 3.4% |
| $25,000 to $34,999 | 28 | 9.7% |
| $35,000 to $49,999 | 31 | 10.7% |
| $50,000 to $74,999 | 136 | 46.9% |
| $75,000 to $99,999 | 23 | 7.9% |
| $100,000 to $149,999 | 0 | 0.0% |
| $150,000 to $199,999 | 0 | 0.0% |
| $200,000+ | 0 | 0.0% |
Household Income by Householder Age in Second Mesa
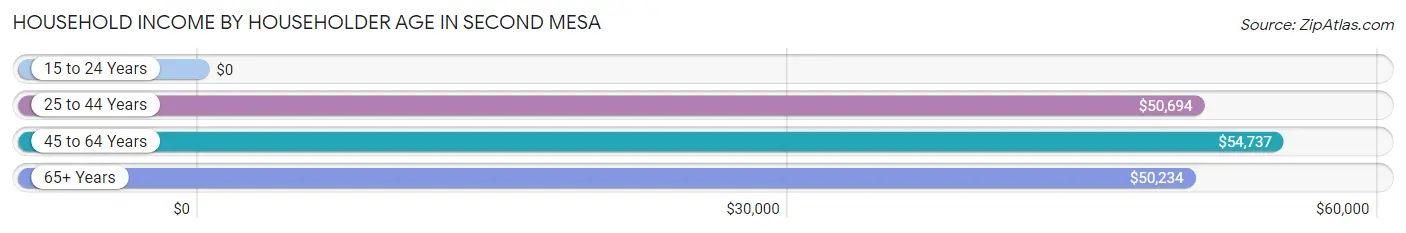
The median household income in Second Mesa is $50,700, with the highest median household income of $54,737 found in the 45 to 64 years age bracket for the primary householder. A total of 114 households (39.3%) fall into this category. Meanwhile, the 15 to 24 years age bracket for the primary householder has the lowest median household income of $0, with 22 households (7.6%) in this group.
| Income Bracket | # Households | Median Income |
| 15 to 24 Years | 22 (7.6%) | $0 |
| 25 to 44 Years | 50 (17.2%) | $50,694 |
| 45 to 64 Years | 114 (39.3%) | $54,737 |
| 65+ Years | 104 (35.9%) | $50,234 |
| Total | 290 (100.0%) | $50,700 |
Poverty in Second Mesa
Income Below Poverty by Sex and Age in Second Mesa
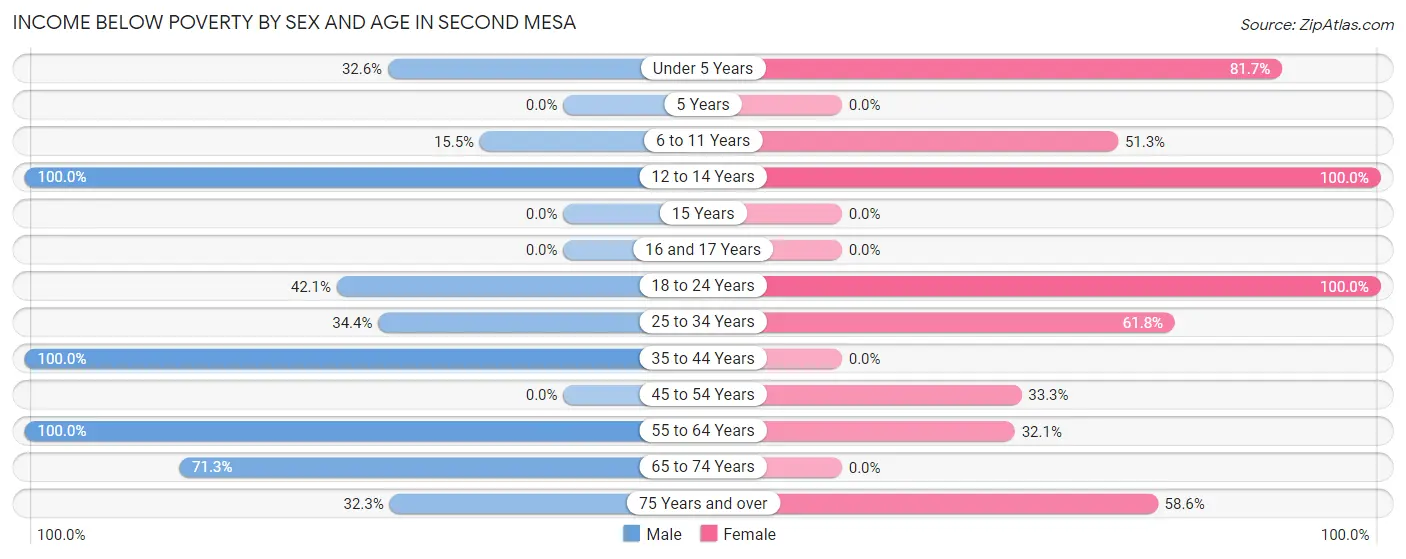
With 41.9% poverty level for males and 46.4% for females among the residents of Second Mesa, 12 to 14 year old males and 12 to 14 year old females are the most vulnerable to poverty, with 12 males (100.0%) and 15 females (100.0%) in their respective age groups living below the poverty level.
| Age Bracket | Male | Female |
| Under 5 Years | 14 (32.6%) | 67 (81.7%) |
| 5 Years | 0 (0.0%) | 0 (0.0%) |
| 6 to 11 Years | 13 (15.5%) | 61 (51.3%) |
| 12 to 14 Years | 12 (100.0%) | 15 (100.0%) |
| 15 Years | 0 (0.0%) | 0 (0.0%) |
| 16 and 17 Years | 0 (0.0%) | 0 (0.0%) |
| 18 to 24 Years | 37 (42.0%) | 45 (100.0%) |
| 25 to 34 Years | 45 (34.4%) | 68 (61.8%) |
| 35 to 44 Years | 23 (100.0%) | 0 (0.0%) |
| 45 to 54 Years | 0 (0.0%) | 19 (33.3%) |
| 55 to 64 Years | 14 (100.0%) | 26 (32.1%) |
| 65 to 74 Years | 97 (71.3%) | 0 (0.0%) |
| 75 Years and over | 10 (32.3%) | 17 (58.6%) |
| Total | 265 (41.9%) | 318 (46.4%) |
Income Above Poverty by Sex and Age in Second Mesa
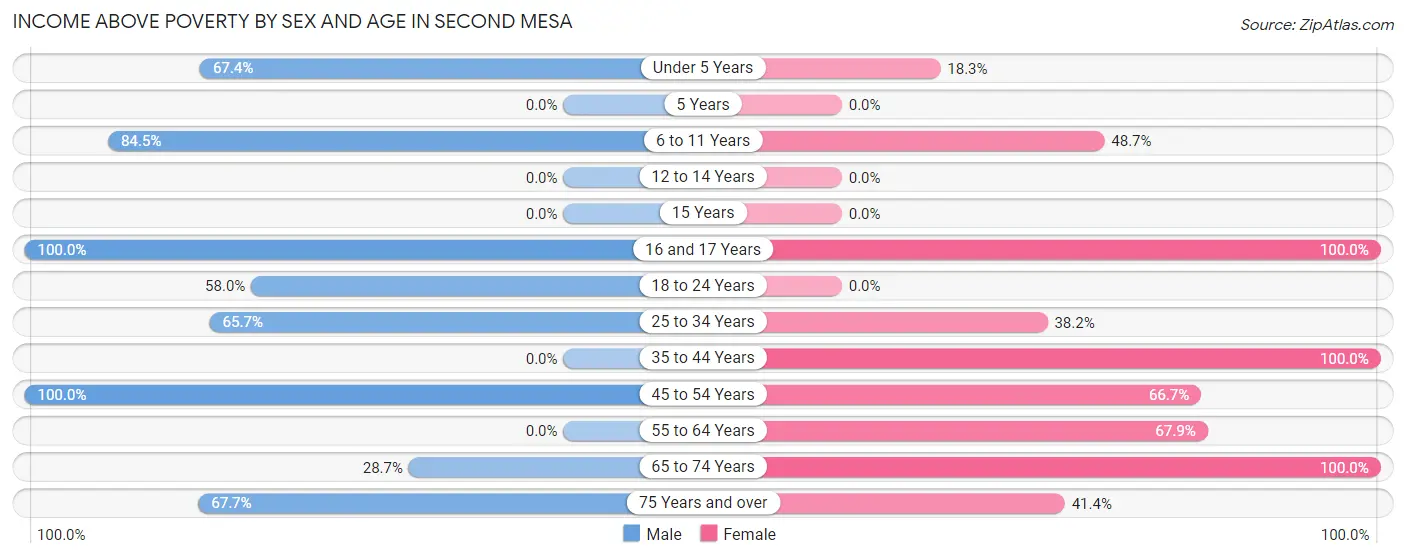
According to the poverty statistics in Second Mesa, males aged 16 and 17 years and females aged 16 and 17 years are the age groups that are most secure financially, with 100.0% of males and 100.0% of females in these age groups living above the poverty line.
| Age Bracket | Male | Female |
| Under 5 Years | 29 (67.4%) | 15 (18.3%) |
| 5 Years | 0 (0.0%) | 0 (0.0%) |
| 6 to 11 Years | 71 (84.5%) | 58 (48.7%) |
| 12 to 14 Years | 0 (0.0%) | 0 (0.0%) |
| 15 Years | 0 (0.0%) | 0 (0.0%) |
| 16 and 17 Years | 49 (100.0%) | 15 (100.0%) |
| 18 to 24 Years | 51 (58.0%) | 0 (0.0%) |
| 25 to 34 Years | 86 (65.6%) | 42 (38.2%) |
| 35 to 44 Years | 0 (0.0%) | 90 (100.0%) |
| 45 to 54 Years | 22 (100.0%) | 38 (66.7%) |
| 55 to 64 Years | 0 (0.0%) | 55 (67.9%) |
| 65 to 74 Years | 39 (28.7%) | 43 (100.0%) |
| 75 Years and over | 21 (67.7%) | 12 (41.4%) |
| Total | 368 (58.1%) | 368 (53.6%) |
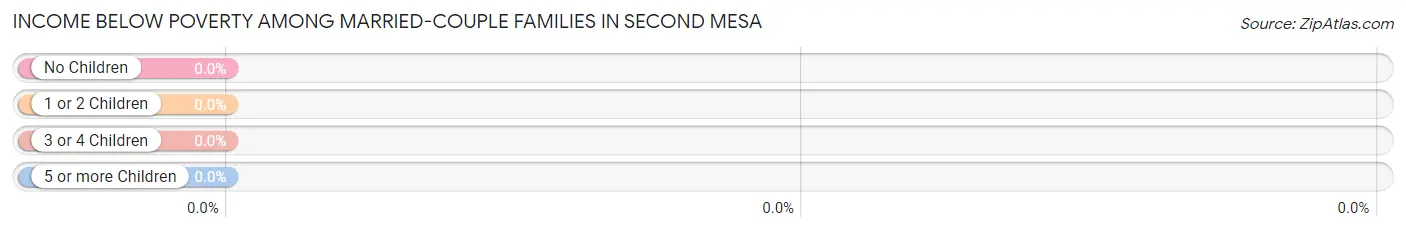
Income Below Poverty Among Married-Couple Families in Second Mesa
| Children | Above Poverty | Below Poverty |
| No Children | 44 (100.0%) | 0 (0.0%) |
| 1 or 2 Children | 20 (100.0%) | 0 (0.0%) |
| 3 or 4 Children | 0 (0.0%) | 0 (0.0%) |
| 5 or more Children | 0 (0.0%) | 0 (0.0%) |
| Total | 64 (100.0%) | 0 (0.0%) |
Income Below Poverty Among Single-Parent Households in Second Mesa
According to the poverty data in Second Mesa, 47.6% or 10 single-father households and 42.5% or 62 single-mother households are living below the poverty line. Among single-father households, those with 3 or 4 children have the highest poverty rate, with 10 households (100.0%) experiencing poverty. Likewise, among single-mother households, those with 5 or more children have the highest poverty rate, with 12 households (100.0%) falling below the poverty line.
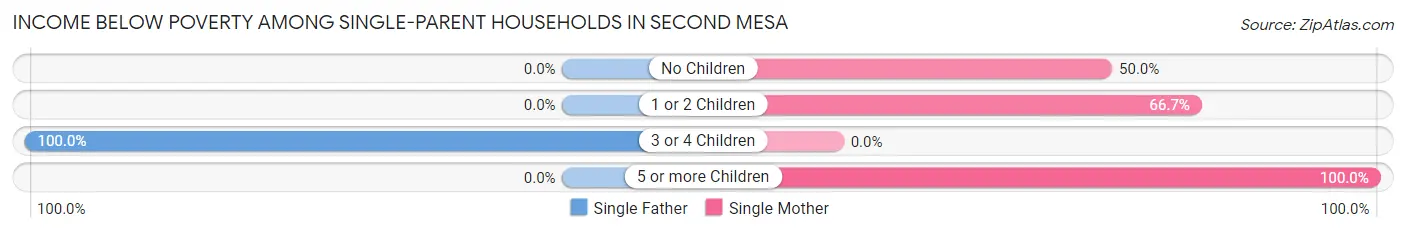
| Children | Single Father | Single Mother |
| No Children | 0 (0.0%) | 14 (50.0%) |
| 1 or 2 Children | 0 (0.0%) | 36 (66.7%) |
| 3 or 4 Children | 10 (100.0%) | 0 (0.0%) |
| 5 or more Children | 0 (0.0%) | 12 (100.0%) |
| Total | 10 (47.6%) | 62 (42.5%) |
Income Below Poverty Among Married-Couple vs Single-Parent Households in Second Mesa
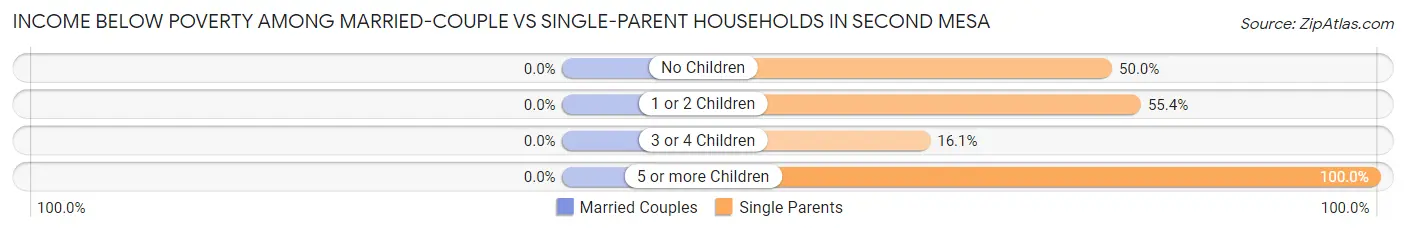
| Children | Married-Couple Families | Single-Parent Households |
| No Children | 0 (0.0%) | 14 (50.0%) |
| 1 or 2 Children | 0 (0.0%) | 36 (55.4%) |
| 3 or 4 Children | 0 (0.0%) | 10 (16.1%) |
| 5 or more Children | 0 (0.0%) | 12 (100.0%) |
| Total | 0 (0.0%) | 72 (43.1%) |
Race in Second Mesa
The most populous races in Second Mesa are , and Native / Alaskan (1,372 | 100.0%).
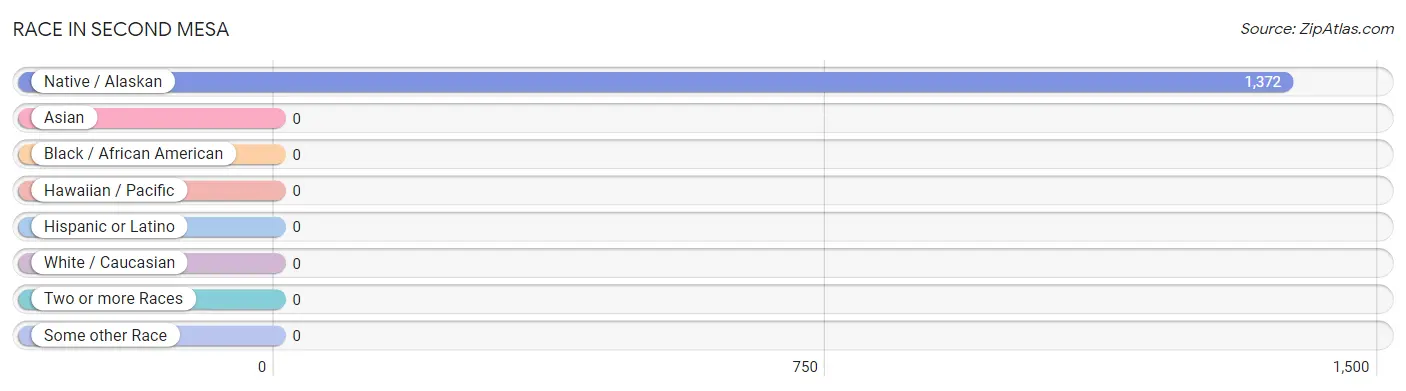
| Race | # Population | % Population |
| Asian | 0 | 0.0% |
| Black / African American | 0 | 0.0% |
| Hawaiian / Pacific | 0 | 0.0% |
| Hispanic or Latino | 0 | 0.0% |
| Native / Alaskan | 1,372 | 100.0% |
| White / Caucasian | 0 | 0.0% |
| Two or more Races | 0 | 0.0% |
| Some other Race | 0 | 0.0% |
| Total | 1,372 | 100.0% |
Ancestry in Second Mesa
The most populous ancestries reported in Second Mesa are Hopi (1,223 | 89.1%), Comanche (94 | 6.9%), Pima (44 | 3.2%), and Navajo (11 | 0.8%), together accounting for 100.0% of all Second Mesa residents.
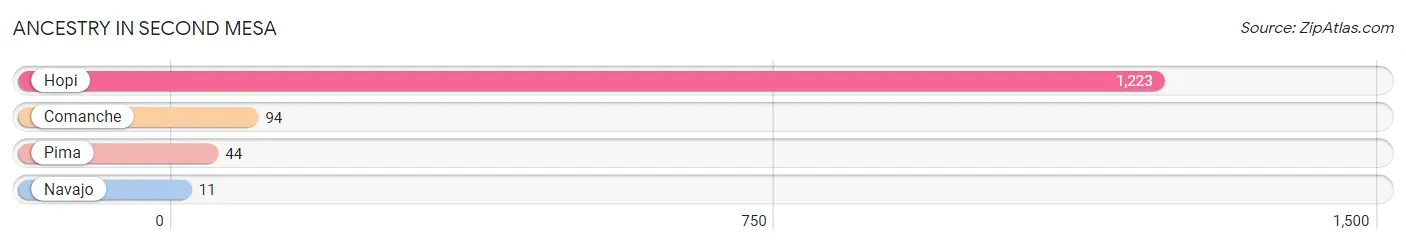
| Ancestry | # Population | % Population |
| Comanche | 94 | 6.9% |
| Hopi | 1,223 | 89.1% |
| Navajo | 11 | 0.8% |
| Pima | 44 | 3.2% | View All 4 Rows |
Immigrants in Second Mesa

| Immigration Origin | # Population | % Population | View All 0 Rows |
Sex and Age in Second Mesa
Sex and Age in Second Mesa
The most populous age groups in Second Mesa are 25 to 29 Years (131 | 20.3%) for men and 5 to 9 Years (126 | 17.4%) for women.
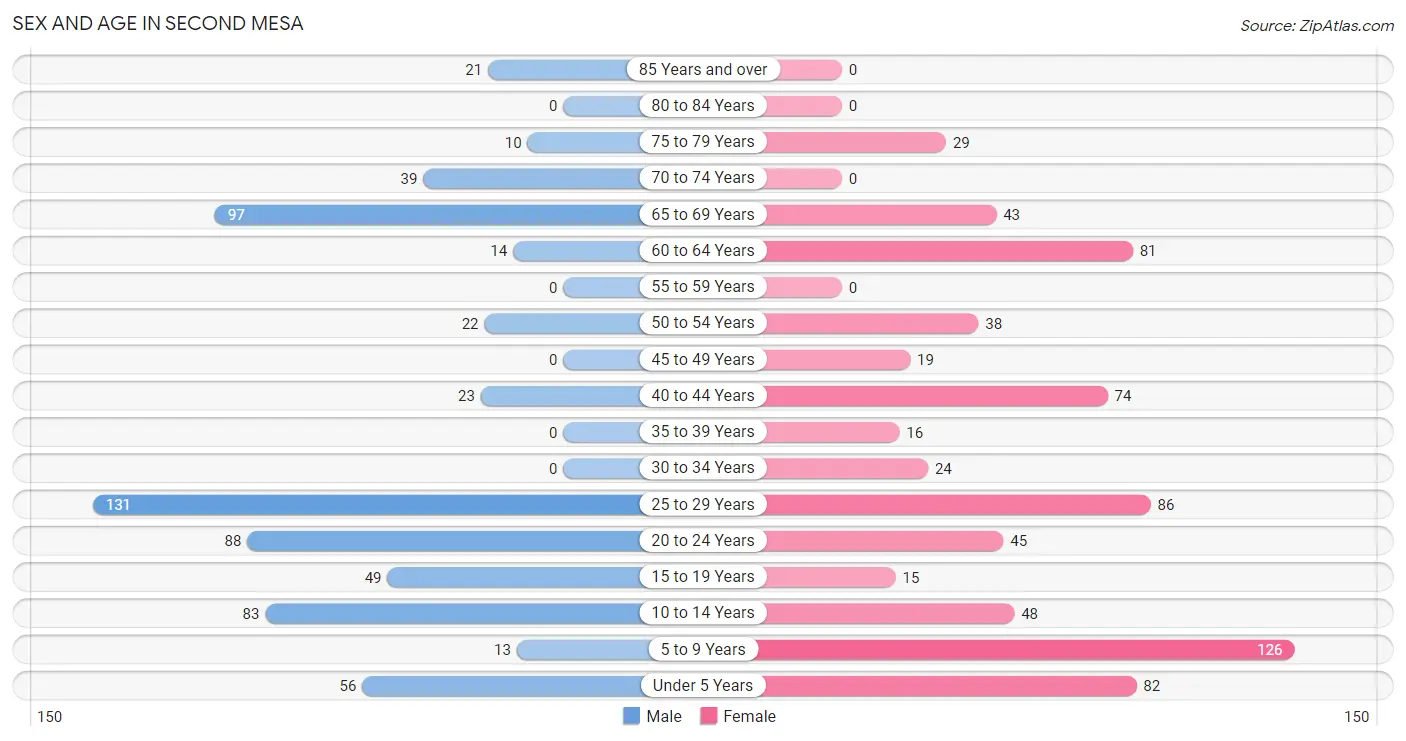
| Age Bracket | Male | Female |
| Under 5 Years | 56 (8.7%) | 82 (11.3%) |
| 5 to 9 Years | 13 (2.0%) | 126 (17.4%) |
| 10 to 14 Years | 83 (12.9%) | 48 (6.6%) |
| 15 to 19 Years | 49 (7.6%) | 15 (2.1%) |
| 20 to 24 Years | 88 (13.6%) | 45 (6.2%) |
| 25 to 29 Years | 131 (20.3%) | 86 (11.8%) |
| 30 to 34 Years | 0 (0.0%) | 24 (3.3%) |
| 35 to 39 Years | 0 (0.0%) | 16 (2.2%) |
| 40 to 44 Years | 23 (3.6%) | 74 (10.2%) |
| 45 to 49 Years | 0 (0.0%) | 19 (2.6%) |
| 50 to 54 Years | 22 (3.4%) | 38 (5.2%) |
| 55 to 59 Years | 0 (0.0%) | 0 (0.0%) |
| 60 to 64 Years | 14 (2.2%) | 81 (11.2%) |
| 65 to 69 Years | 97 (15.0%) | 43 (5.9%) |
| 70 to 74 Years | 39 (6.0%) | 0 (0.0%) |
| 75 to 79 Years | 10 (1.5%) | 29 (4.0%) |
| 80 to 84 Years | 0 (0.0%) | 0 (0.0%) |
| 85 Years and over | 21 (3.3%) | 0 (0.0%) |
| Total | 646 (100.0%) | 726 (100.0%) |
Families and Households in Second Mesa
Median Family Size in Second Mesa
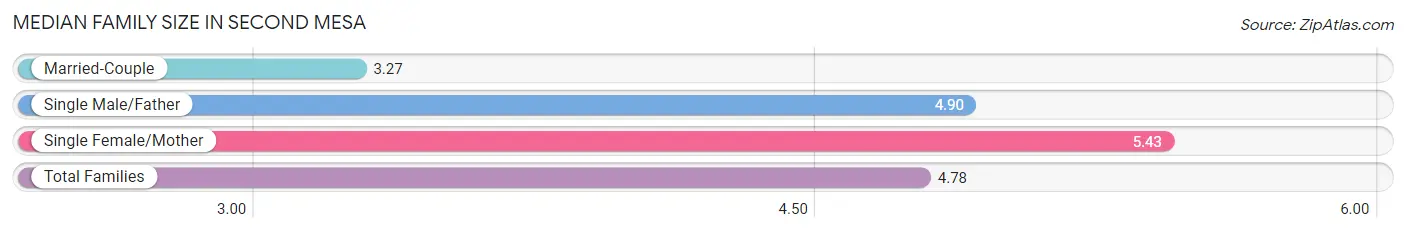
The median family size in Second Mesa is 4.78 persons per family, with single female/mother families (146 | 63.2%) accounting for the largest median family size of 5.43 persons per family. On the other hand, married-couple families (64 | 27.7%) represent the smallest median family size with 3.27 persons per family.
| Family Type | # Families | Family Size |
| Married-Couple | 64 (27.7%) | 3.27 |
| Single Male/Father | 21 (9.1%) | 4.90 |
| Single Female/Mother | 146 (63.2%) | 5.43 |
| Total Families | 231 (100.0%) | 4.78 |
Median Household Size in Second Mesa
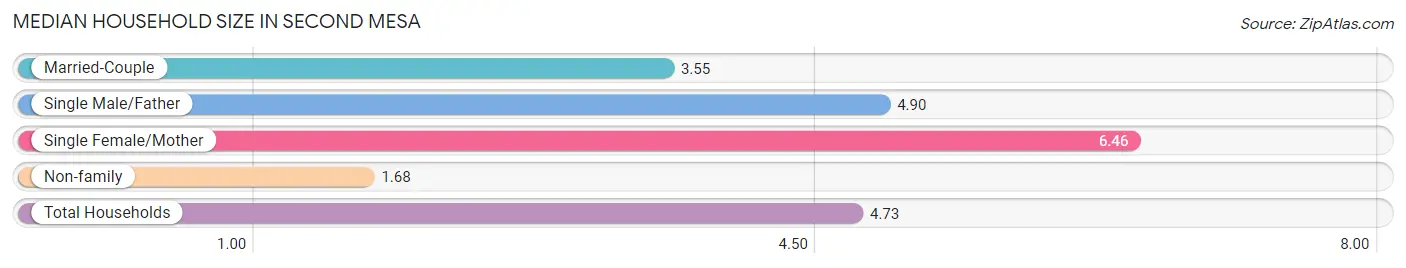
The median household size in Second Mesa is 4.73 persons per household, with single female/mother households (146 | 50.3%) accounting for the largest median household size of 6.46 persons per household. non-family households (59 | 20.3%) represent the smallest median household size with 1.68 persons per household.
| Household Type | # Households | Household Size |
| Married-Couple | 64 (22.1%) | 3.55 |
| Single Male/Father | 21 (7.2%) | 4.90 |
| Single Female/Mother | 146 (50.3%) | 6.46 |
| Non-family | 59 (20.3%) | 1.68 |
| Total Households | 290 (100.0%) | 4.73 |
Household Size by Marriage Status in Second Mesa
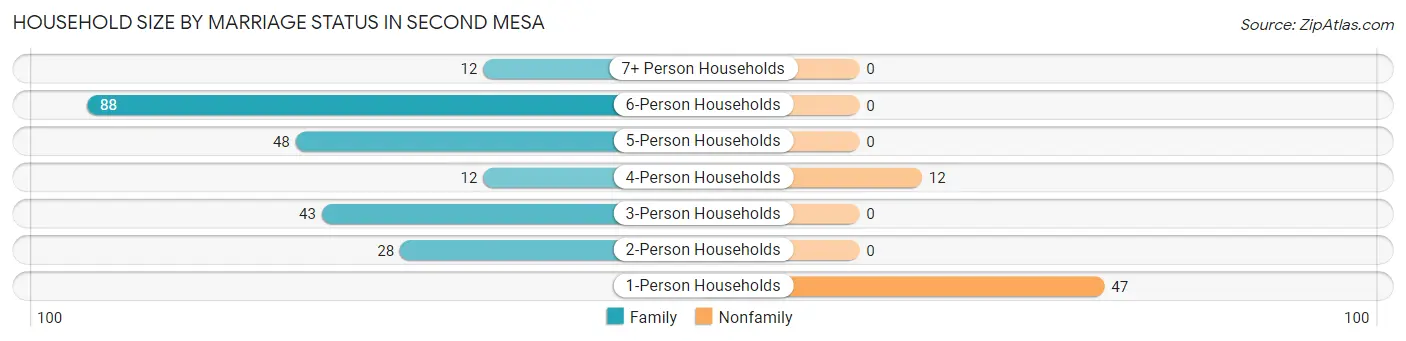
Out of a total of 290 households in Second Mesa, 231 (79.7%) are family households, while 59 (20.3%) are nonfamily households. The most numerous type of family households are 6-person households, comprising 88, and the most common type of nonfamily households are 1-person households, comprising 47.
| Household Size | Family Households | Nonfamily Households |
| 1-Person Households | - | 47 (16.2%) |
| 2-Person Households | 28 (9.7%) | 0 (0.0%) |
| 3-Person Households | 43 (14.8%) | 0 (0.0%) |
| 4-Person Households | 12 (4.1%) | 12 (4.1%) |
| 5-Person Households | 48 (16.6%) | 0 (0.0%) |
| 6-Person Households | 88 (30.3%) | 0 (0.0%) |
| 7+ Person Households | 12 (4.1%) | 0 (0.0%) |
| Total | 231 (79.7%) | 59 (20.3%) |
Female Fertility in Second Mesa
Fertility by Age in Second Mesa
Average fertility rate in Second Mesa is 75.0 births per 1,000 women. Women in the age bracket of 20 to 34 years have the highest fertility rate with 148.0 births per 1,000 women. Women in the age bracket of 20 to 34 years acount for 100.0% of all women with births.
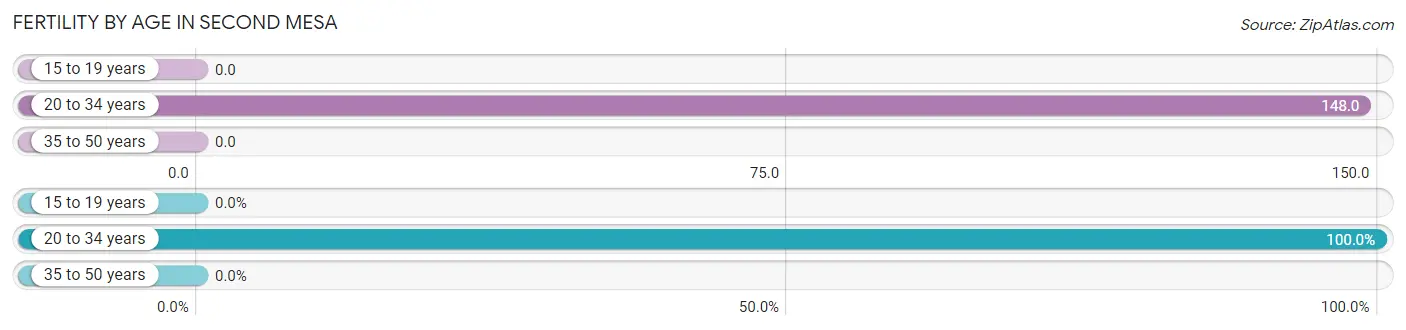
| Age Bracket | Women with Births | Births / 1,000 Women |
| 15 to 19 years | 0 (0.0%) | 0.0 |
| 20 to 34 years | 23 (100.0%) | 148.0 |
| 35 to 50 years | 0 (0.0%) | 0.0 |
| Total | 23 (100.0%) | 75.0 |
Fertility by Age by Marriage Status in Second Mesa
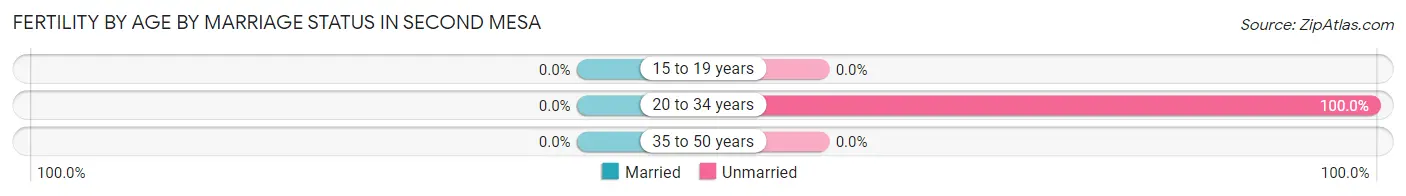
| Age Bracket | Married | Unmarried |
| 15 to 19 years | 0 (0.0%) | 0 (0.0%) |
| 20 to 34 years | 0 (0.0%) | 23 (100.0%) |
| 35 to 50 years | 0 (0.0%) | 0 (0.0%) |
| Total | 0 (0.0%) | 23 (100.0%) |
Fertility by Education in Second Mesa
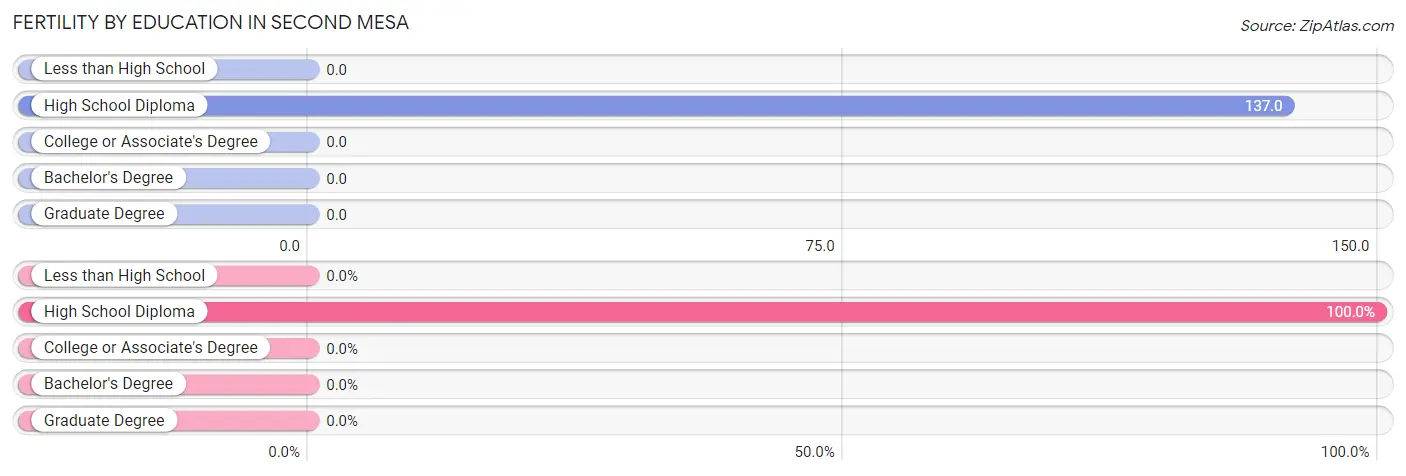
| Educational Attainment | Women with Births | Births / 1,000 Women |
| Less than High School | 0 (0.0%) | 0.0 |
| High School Diploma | 23 (100.0%) | 137.0 |
| College or Associate's Degree | 0 (0.0%) | 0.0 |
| Bachelor's Degree | 0 (0.0%) | 0.0 |
| Graduate Degree | 0 (0.0%) | 0.0 |
| Total | 23 (100.0%) | 75.0 |
Fertility by Education by Marriage Status in Second Mesa
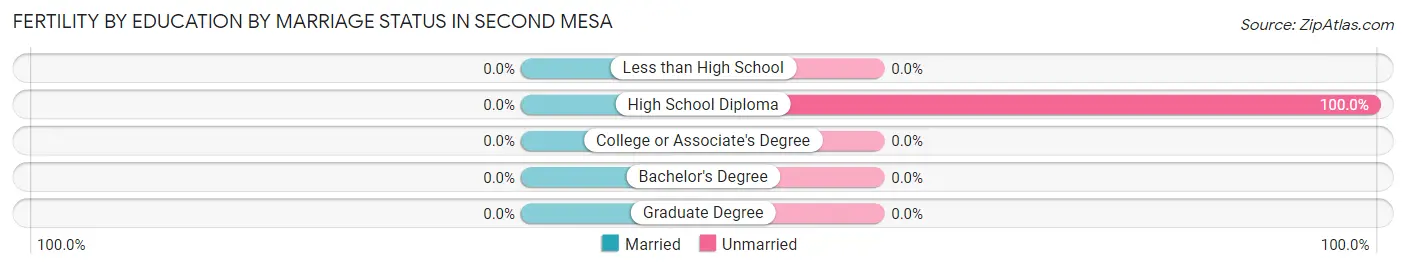
| Educational Attainment | Married | Unmarried |
| Less than High School | 0 (0.0%) | 0 (0.0%) |
| High School Diploma | 0 (0.0%) | 23 (100.0%) |
| College or Associate's Degree | 0 (0.0%) | 0 (0.0%) |
| Bachelor's Degree | 0 (0.0%) | 0 (0.0%) |
| Graduate Degree | 0 (0.0%) | 0 (0.0%) |
| Total | 0 (0.0%) | 23 (100.0%) |
Employment Characteristics in Second Mesa
Employment by Class of Employer in Second Mesa
Among the 412 employed individuals in Second Mesa, self-employed (not incorporated) (102 | 24.8%), not-for-profit organizations (97 | 23.5%), and local government employees (76 | 18.4%) make up the most common classes of employment.
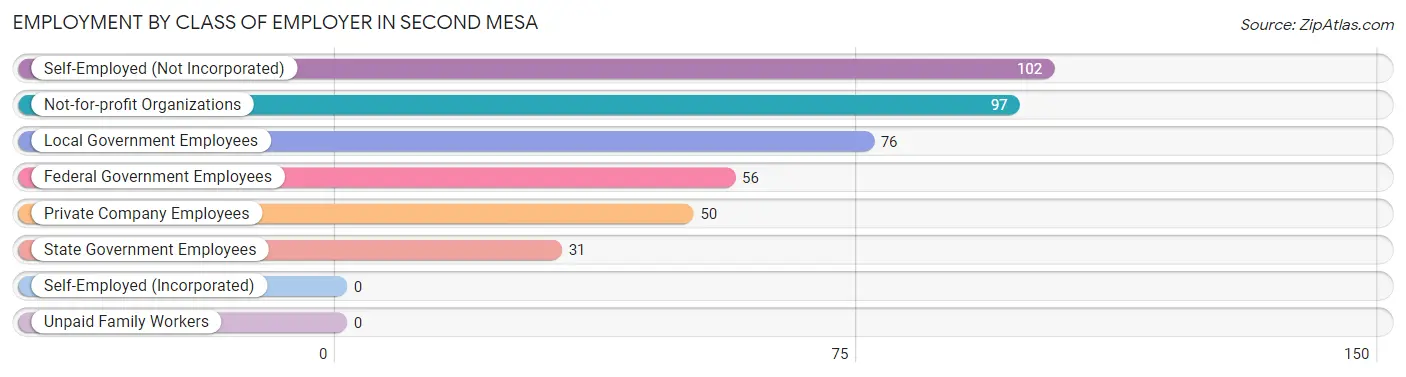
| Employer Class | # Employees | % Employees |
| Private Company Employees | 50 | 12.1% |
| Self-Employed (Incorporated) | 0 | 0.0% |
| Self-Employed (Not Incorporated) | 102 | 24.8% |
| Not-for-profit Organizations | 97 | 23.5% |
| Local Government Employees | 76 | 18.4% |
| State Government Employees | 31 | 7.5% |
| Federal Government Employees | 56 | 13.6% |
| Unpaid Family Workers | 0 | 0.0% |
| Total | 412 | 100.0% |
Employment Status by Age in Second Mesa
According to the labor force statistics for Second Mesa, out of the total population over 16 years of age (964), 56.1% or 541 individuals are in the labor force, with 20.1% or 109 of them unemployed. The age group with the highest labor force participation rate is 30 to 34 years, with 100.0% or 24 individuals in the labor force. Within the labor force, the 20 to 24 years age range has the highest percentage of unemployed individuals, with 60.5% or 69 of them being unemployed.
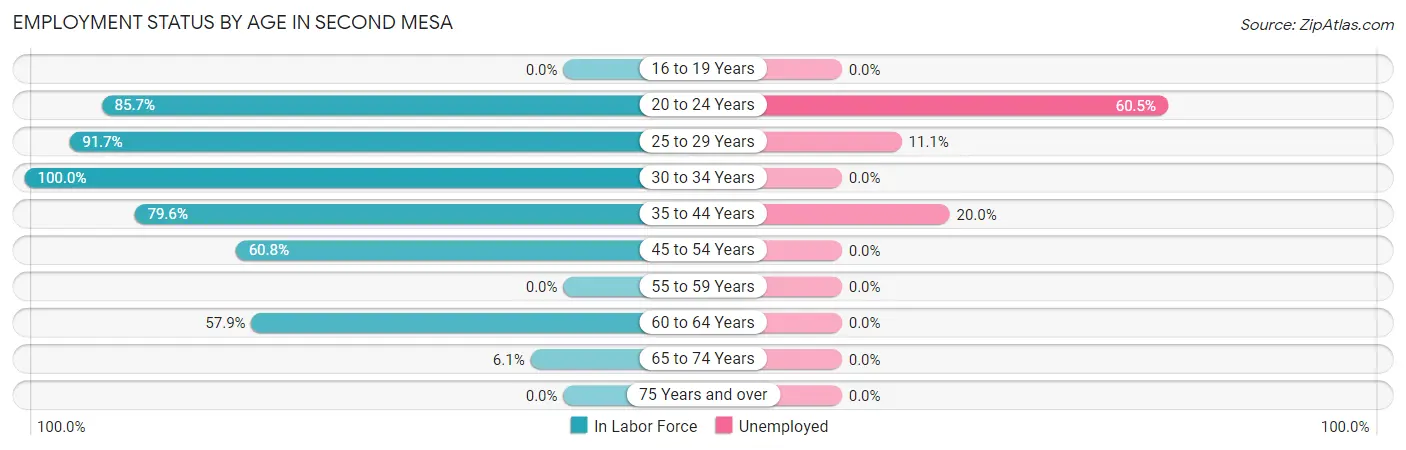
| Age Bracket | In Labor Force | Unemployed |
| 16 to 19 Years | 0 (0.0%) | 0 (0.0%) |
| 20 to 24 Years | 114 (85.7%) | 69 (60.5%) |
| 25 to 29 Years | 199 (91.7%) | 22 (11.1%) |
| 30 to 34 Years | 24 (100.0%) | 0 (0.0%) |
| 35 to 44 Years | 90 (79.6%) | 18 (20.0%) |
| 45 to 54 Years | 48 (60.8%) | 0 (0.0%) |
| 55 to 59 Years | 0 (0.0%) | 0 (0.0%) |
| 60 to 64 Years | 55 (57.9%) | 0 (0.0%) |
| 65 to 74 Years | 11 (6.1%) | 0 (0.0%) |
| 75 Years and over | 0 (0.0%) | 0 (0.0%) |
| Total | 541 (56.1%) | 109 (20.1%) |
Employment Status by Educational Attainment in Second Mesa
According to labor force statistics for Second Mesa, 78.8% of individuals (416) out of the total population between 25 and 64 years of age (528) are in the labor force, with 9.6% or 40 of them being unemployed. The group with the highest labor force participation rate are those with the educational attainment of college / associate degree, with 92.3% or 168 individuals in the labor force. Within the labor force, individuals with high school diploma education have the highest percentage of unemployment, with 16.1% or 40 of them being unemployed.
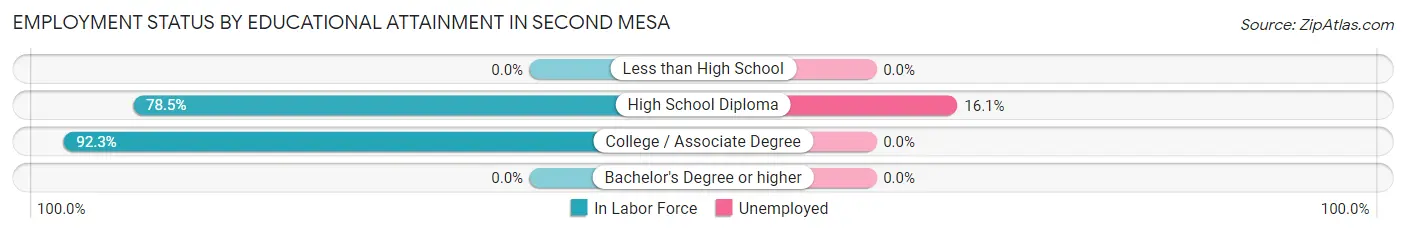
| Educational Attainment | In Labor Force | Unemployed |
| Less than High School | 0 (0.0%) | 0 (0.0%) |
| High School Diploma | 248 (78.5%) | 51 (16.1%) |
| College / Associate Degree | 168 (92.3%) | 0 (0.0%) |
| Bachelor's Degree or higher | 0 (0.0%) | 0 (0.0%) |
| Total | 416 (78.8%) | 51 (9.6%) |
Employment Occupations by Sex in Second Mesa
Management, Business, Science and Arts Occupations
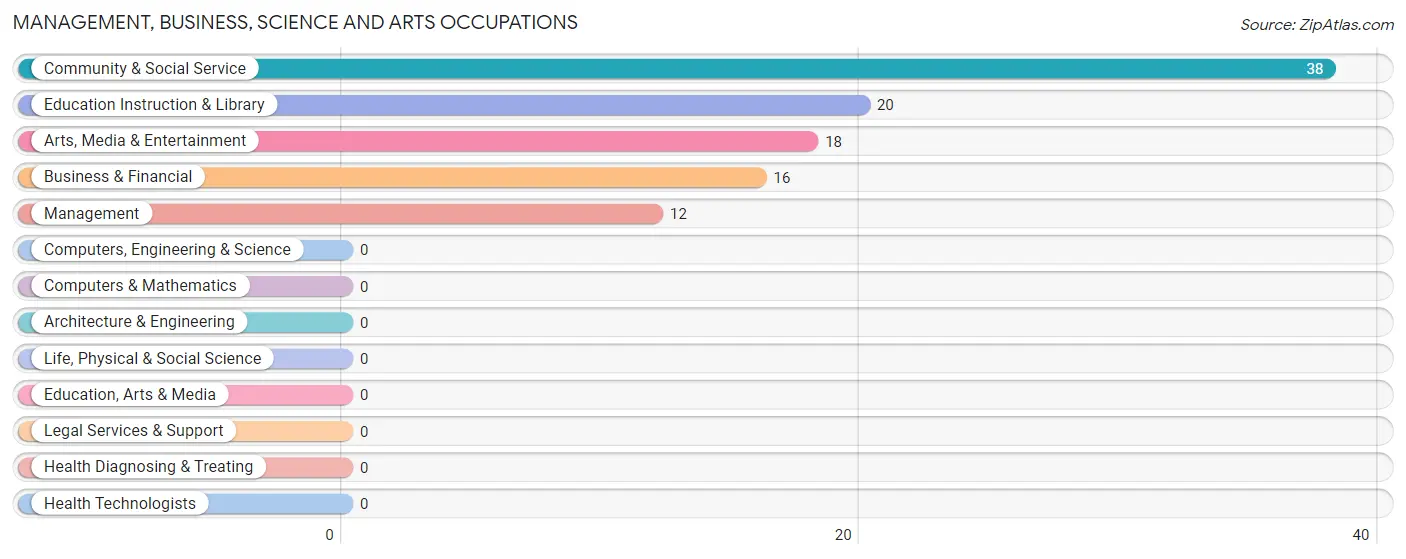
The most common Management, Business, Science and Arts occupations in Second Mesa are Community & Social Service (38 | 8.8%), Education Instruction & Library (20 | 4.6%), Arts, Media & Entertainment (18 | 4.2%), Business & Financial (16 | 3.7%), and Management (12 | 2.8%).
Management, Business, Science and Arts Occupations by Sex
Within the Management, Business, Science and Arts occupations in Second Mesa, the most male-oriented occupations are Arts, Media & Entertainment (100.0%), and Community & Social Service (47.4%), while the most female-oriented occupations are Management (100.0%), Business & Financial (100.0%), and Education Instruction & Library (100.0%).
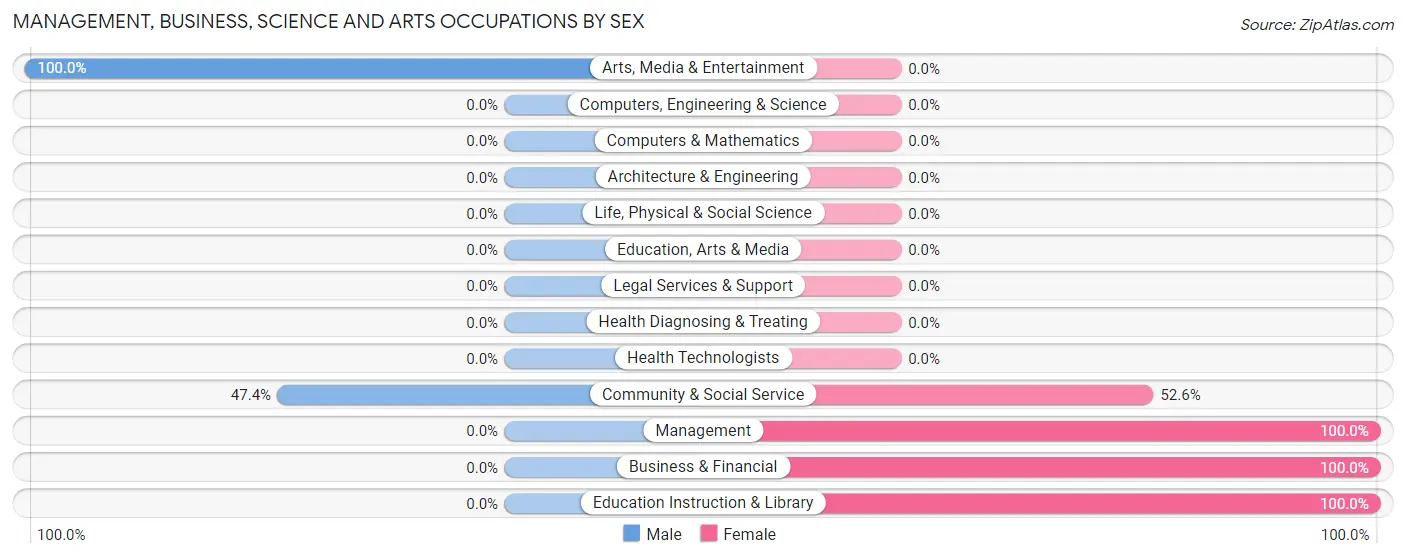
| Occupation | Male | Female |
| Management | 0 (0.0%) | 12 (100.0%) |
| Business & Financial | 0 (0.0%) | 16 (100.0%) |
| Computers, Engineering & Science | 0 (0.0%) | 0 (0.0%) |
| Computers & Mathematics | 0 (0.0%) | 0 (0.0%) |
| Architecture & Engineering | 0 (0.0%) | 0 (0.0%) |
| Life, Physical & Social Science | 0 (0.0%) | 0 (0.0%) |
| Community & Social Service | 18 (47.4%) | 20 (52.6%) |
| Education, Arts & Media | 0 (0.0%) | 0 (0.0%) |
| Legal Services & Support | 0 (0.0%) | 0 (0.0%) |
| Education Instruction & Library | 0 (0.0%) | 20 (100.0%) |
| Arts, Media & Entertainment | 18 (100.0%) | 0 (0.0%) |
| Health Diagnosing & Treating | 0 (0.0%) | 0 (0.0%) |
| Health Technologists | 0 (0.0%) | 0 (0.0%) |
| Total (Category) | 18 (27.3%) | 48 (72.7%) |
| Total (Overall) | 153 (35.4%) | 279 (64.6%) |
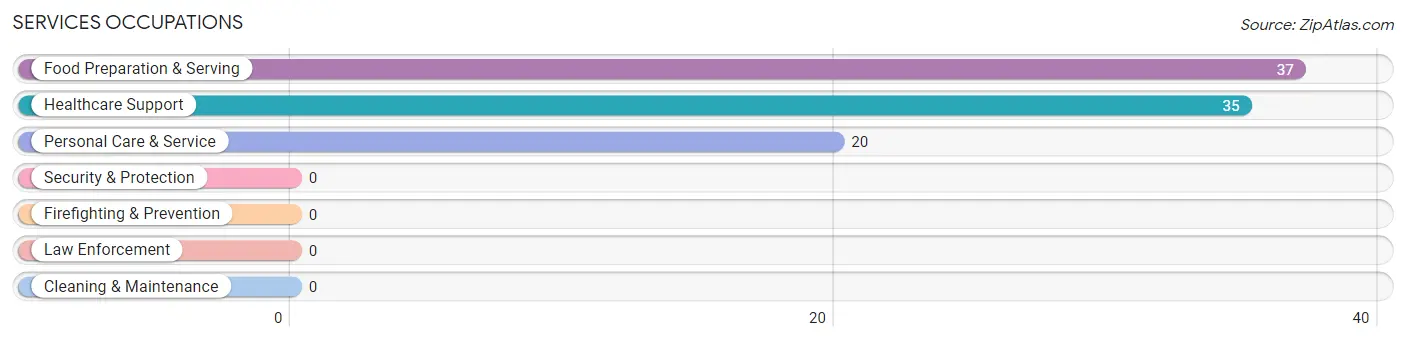
Services Occupations
The most common Services occupations in Second Mesa are Food Preparation & Serving (37 | 8.6%), Healthcare Support (35 | 8.1%), and Personal Care & Service (20 | 4.6%).
Services Occupations by Sex
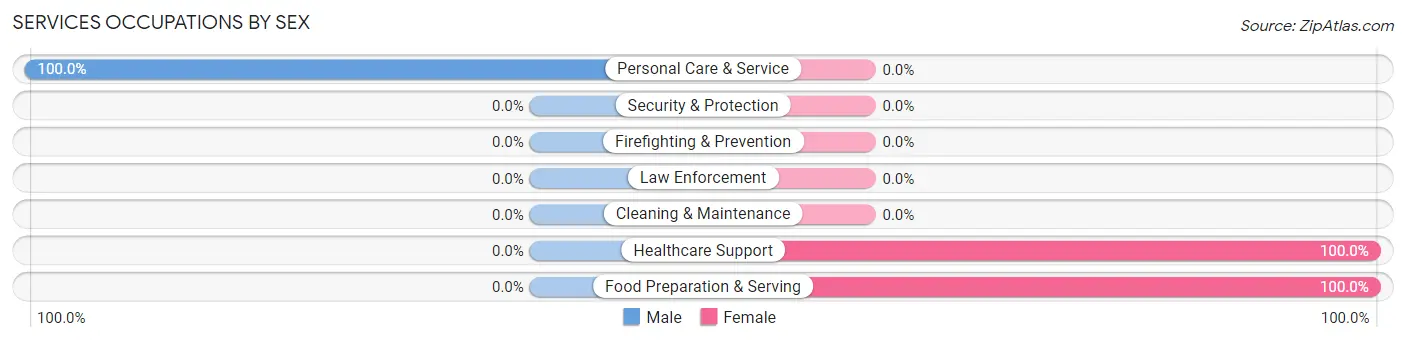
| Occupation | Male | Female |
| Healthcare Support | 0 (0.0%) | 35 (100.0%) |
| Security & Protection | 0 (0.0%) | 0 (0.0%) |
| Firefighting & Prevention | 0 (0.0%) | 0 (0.0%) |
| Law Enforcement | 0 (0.0%) | 0 (0.0%) |
| Food Preparation & Serving | 0 (0.0%) | 37 (100.0%) |
| Cleaning & Maintenance | 0 (0.0%) | 0 (0.0%) |
| Personal Care & Service | 20 (100.0%) | 0 (0.0%) |
| Total (Category) | 20 (21.7%) | 72 (78.3%) |
| Total (Overall) | 153 (35.4%) | 279 (64.6%) |
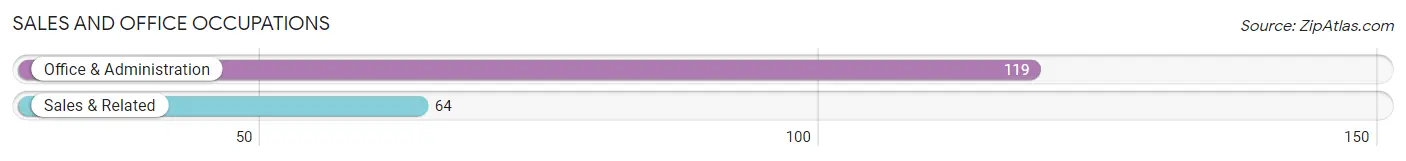
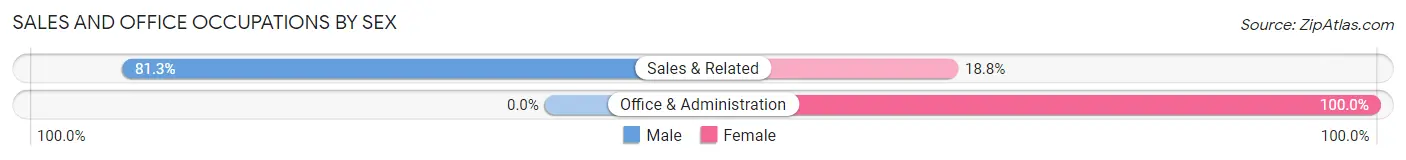
Sales and Office Occupations
The most common Sales and Office occupations in Second Mesa are Office & Administration (119 | 27.6%), and Sales & Related (64 | 14.8%).
Sales and Office Occupations by Sex
| Occupation | Male | Female |
| Sales & Related | 52 (81.2%) | 12 (18.8%) |
| Office & Administration | 0 (0.0%) | 119 (100.0%) |
| Total (Category) | 52 (28.4%) | 131 (71.6%) |
| Total (Overall) | 153 (35.4%) | 279 (64.6%) |
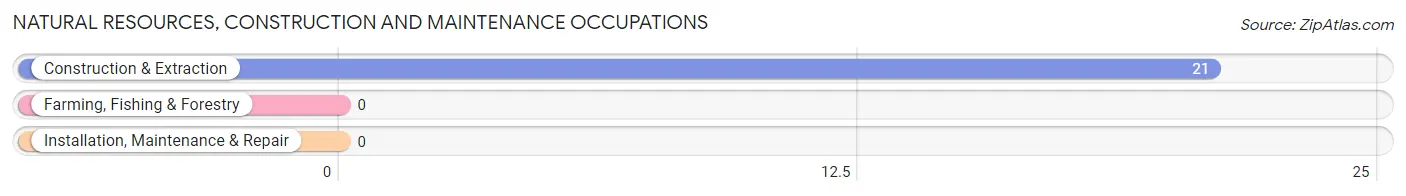
Natural Resources, Construction and Maintenance Occupations
The most common Natural Resources, Construction and Maintenance occupations in Second Mesa are , and Construction & Extraction (21 | 4.9%).
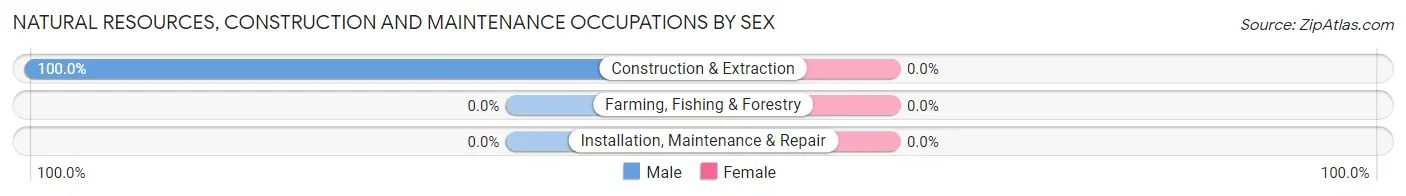
Natural Resources, Construction and Maintenance Occupations by Sex
| Occupation | Male | Female |
| Farming, Fishing & Forestry | 0 (0.0%) | 0 (0.0%) |
| Construction & Extraction | 21 (100.0%) | 0 (0.0%) |
| Installation, Maintenance & Repair | 0 (0.0%) | 0 (0.0%) |
| Total (Category) | 21 (100.0%) | 0 (0.0%) |
| Total (Overall) | 153 (35.4%) | 279 (64.6%) |
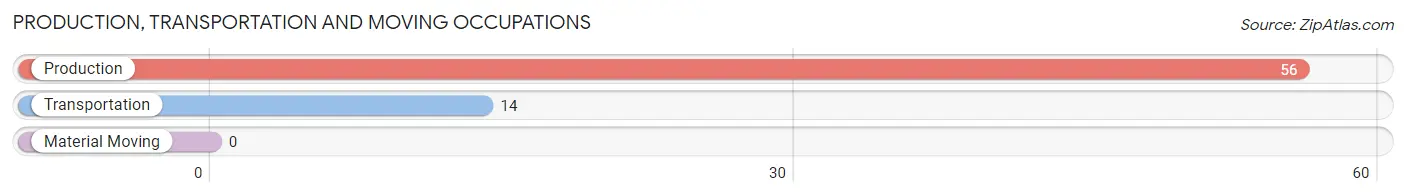
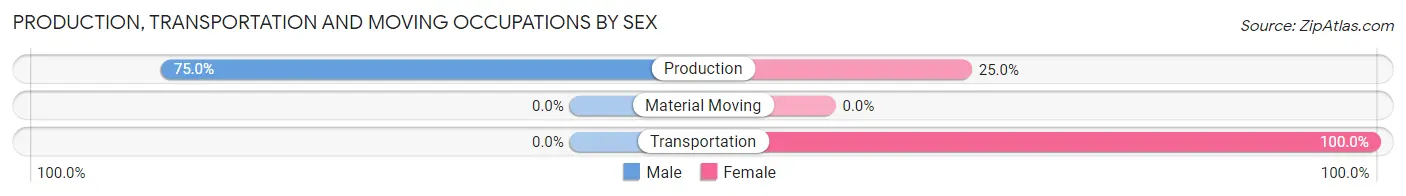
Production, Transportation and Moving Occupations
The most common Production, Transportation and Moving occupations in Second Mesa are Production (56 | 13.0%), and Transportation (14 | 3.2%).
Production, Transportation and Moving Occupations by Sex
| Occupation | Male | Female |
| Production | 42 (75.0%) | 14 (25.0%) |
| Transportation | 0 (0.0%) | 14 (100.0%) |
| Material Moving | 0 (0.0%) | 0 (0.0%) |
| Total (Category) | 42 (60.0%) | 28 (40.0%) |
| Total (Overall) | 153 (35.4%) | 279 (64.6%) |
Employment Industries by Sex in Second Mesa
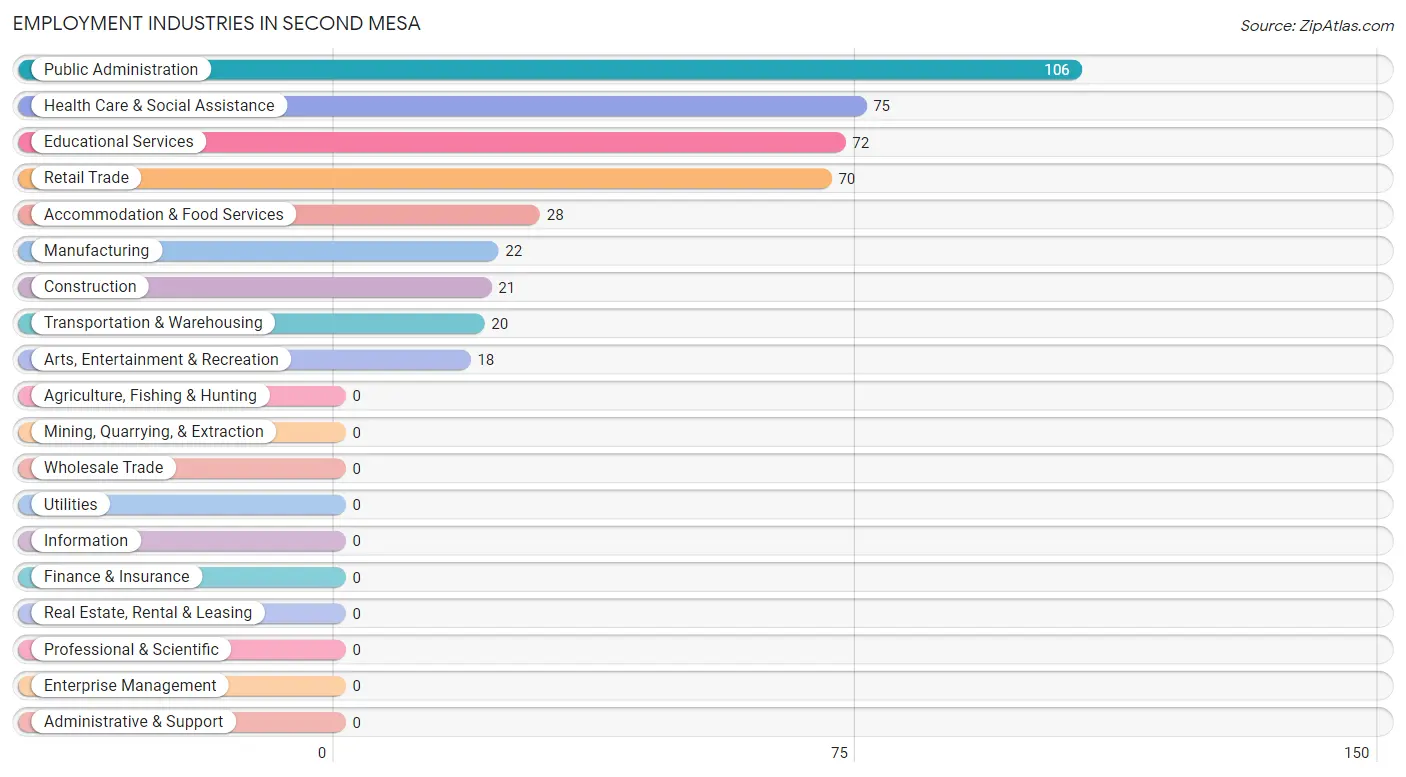
Employment Industries in Second Mesa
The major employment industries in Second Mesa include Public Administration (106 | 24.5%), Health Care & Social Assistance (75 | 17.4%), Educational Services (72 | 16.7%), Retail Trade (70 | 16.2%), and Accommodation & Food Services (28 | 6.5%).
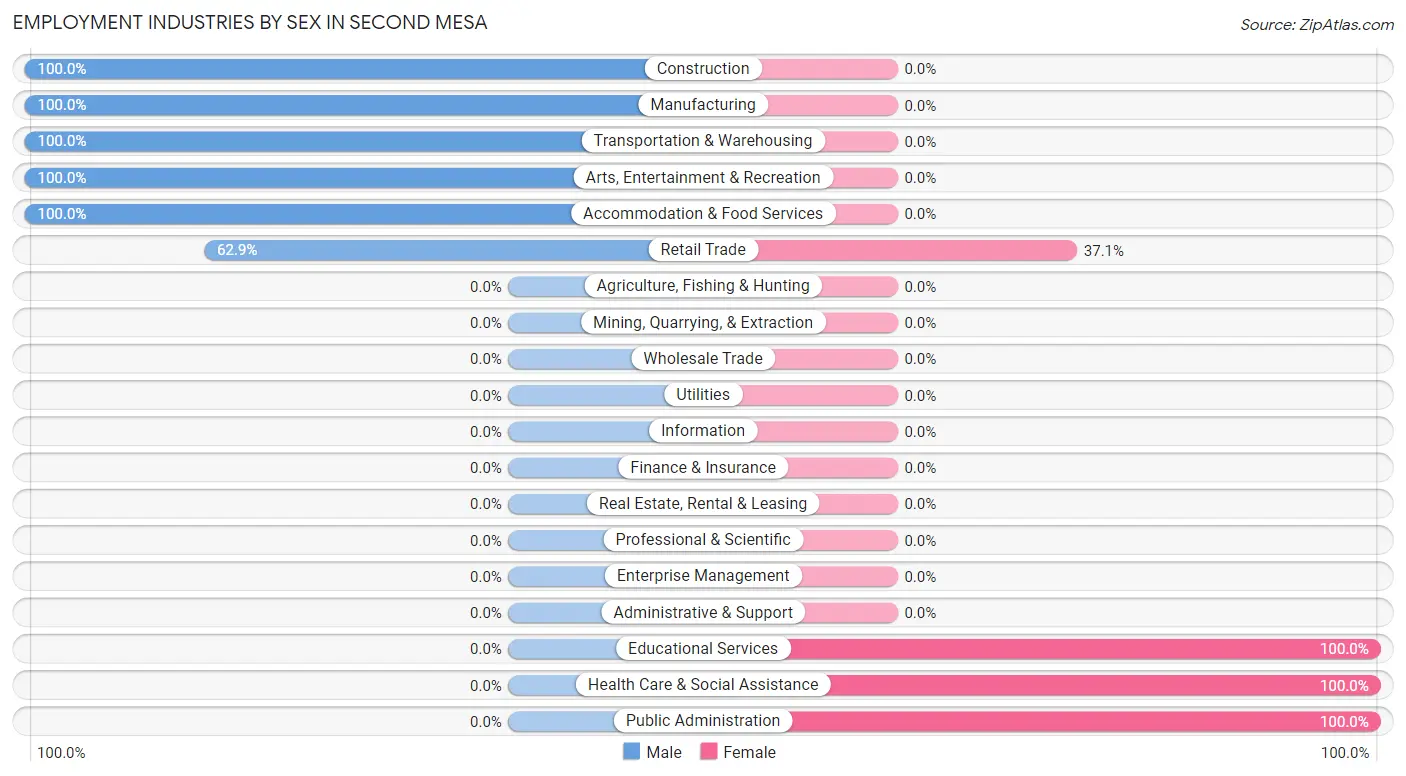
Employment Industries by Sex in Second Mesa
The Second Mesa industries that see more men than women are Construction (100.0%), Manufacturing (100.0%), and Transportation & Warehousing (100.0%), whereas the industries that tend to have a higher number of women are Educational Services (100.0%), Health Care & Social Assistance (100.0%), and Public Administration (100.0%).
| Industry | Male | Female |
| Agriculture, Fishing & Hunting | 0 (0.0%) | 0 (0.0%) |
| Mining, Quarrying, & Extraction | 0 (0.0%) | 0 (0.0%) |
| Construction | 21 (100.0%) | 0 (0.0%) |
| Manufacturing | 22 (100.0%) | 0 (0.0%) |
| Wholesale Trade | 0 (0.0%) | 0 (0.0%) |
| Retail Trade | 44 (62.9%) | 26 (37.1%) |
| Transportation & Warehousing | 20 (100.0%) | 0 (0.0%) |
| Utilities | 0 (0.0%) | 0 (0.0%) |
| Information | 0 (0.0%) | 0 (0.0%) |
| Finance & Insurance | 0 (0.0%) | 0 (0.0%) |
| Real Estate, Rental & Leasing | 0 (0.0%) | 0 (0.0%) |
| Professional & Scientific | 0 (0.0%) | 0 (0.0%) |
| Enterprise Management | 0 (0.0%) | 0 (0.0%) |
| Administrative & Support | 0 (0.0%) | 0 (0.0%) |
| Educational Services | 0 (0.0%) | 72 (100.0%) |
| Health Care & Social Assistance | 0 (0.0%) | 75 (100.0%) |
| Arts, Entertainment & Recreation | 18 (100.0%) | 0 (0.0%) |
| Accommodation & Food Services | 28 (100.0%) | 0 (0.0%) |
| Public Administration | 0 (0.0%) | 106 (100.0%) |
| Total | 153 (35.4%) | 279 (64.6%) |
Education in Second Mesa
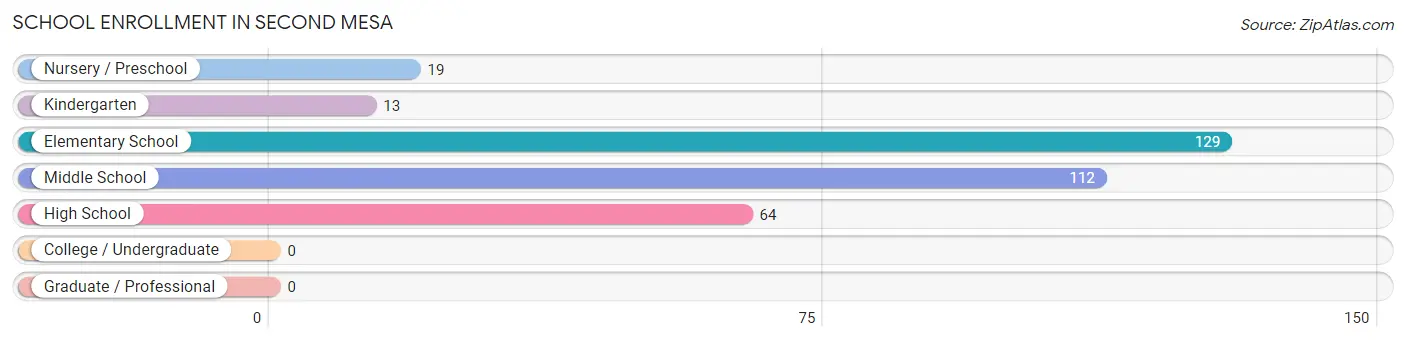
School Enrollment in Second Mesa
The most common levels of schooling among the 337 students in Second Mesa are elementary school (129 | 38.3%), middle school (112 | 33.2%), and high school (64 | 19.0%).
| School Level | # Students | % Students |
| Nursery / Preschool | 19 | 5.6% |
| Kindergarten | 13 | 3.9% |
| Elementary School | 129 | 38.3% |
| Middle School | 112 | 33.2% |
| High School | 64 | 19.0% |
| College / Undergraduate | 0 | 0.0% |
| Graduate / Professional | 0 | 0.0% |
| Total | 337 | 100.0% |
School Enrollment by Age by Funding Source in Second Mesa
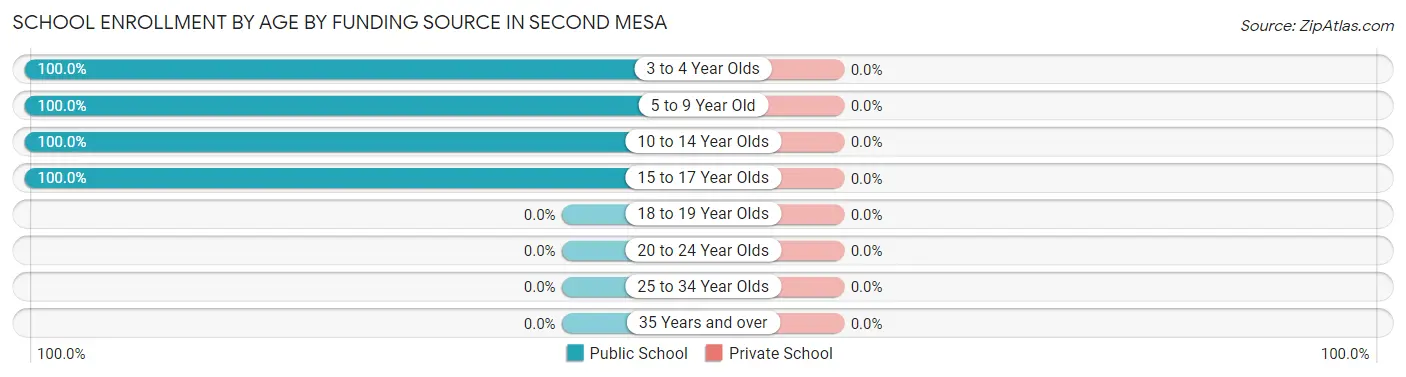
| Age Bracket | Public School | Private School |
| 3 to 4 Year Olds | 19 (100.0%) | 0 (0.0%) |
| 5 to 9 Year Old | 123 (100.0%) | 0 (0.0%) |
| 10 to 14 Year Olds | 131 (100.0%) | 0 (0.0%) |
| 15 to 17 Year Olds | 64 (100.0%) | 0 (0.0%) |
| 18 to 19 Year Olds | 0 (0.0%) | 0 (0.0%) |
| 20 to 24 Year Olds | 0 (0.0%) | 0 (0.0%) |
| 25 to 34 Year Olds | 0 (0.0%) | 0 (0.0%) |
| 35 Years and over | 0 (0.0%) | 0 (0.0%) |
| Total | 337 (100.0%) | 0 (0.0%) |
Educational Attainment by Field of Study in Second Mesa
, and arts & humanities (32 | 100.0%) are the most common fields of study among 32 individuals in Second Mesa who have obtained a bachelor's degree or higher.
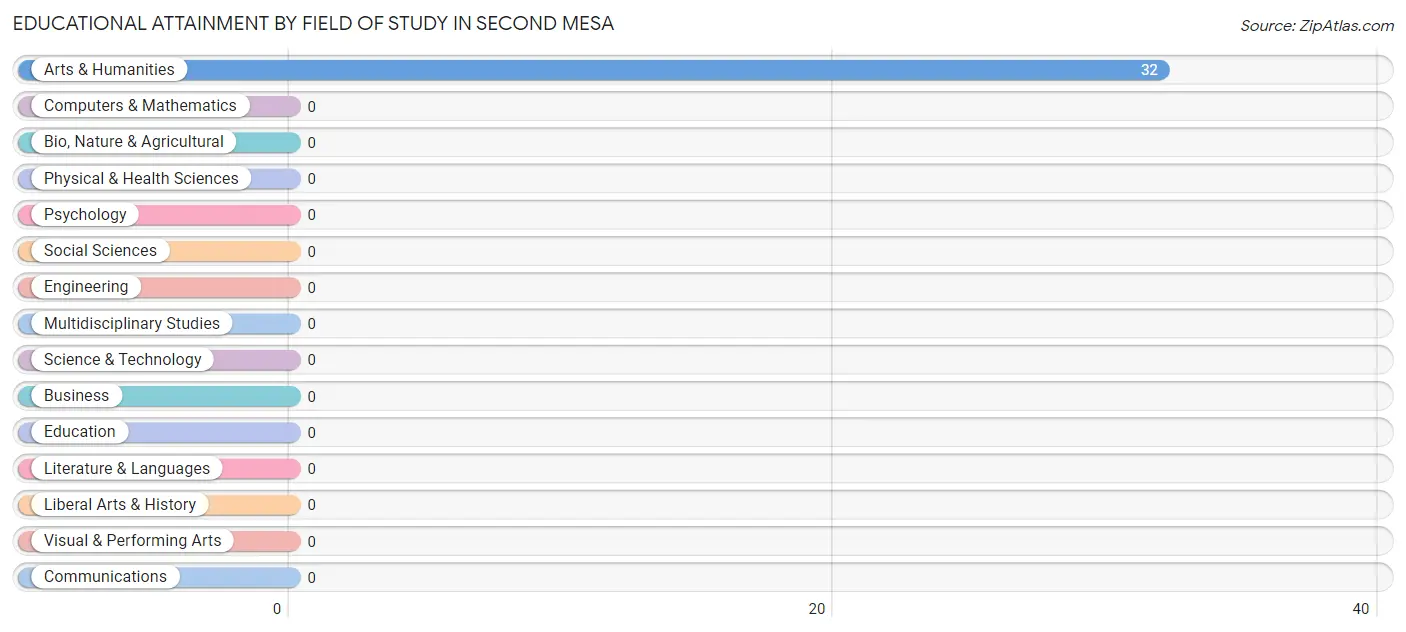
| Field of Study | # Graduates | % Graduates |
| Computers & Mathematics | 0 | 0.0% |
| Bio, Nature & Agricultural | 0 | 0.0% |
| Physical & Health Sciences | 0 | 0.0% |
| Psychology | 0 | 0.0% |
| Social Sciences | 0 | 0.0% |
| Engineering | 0 | 0.0% |
| Multidisciplinary Studies | 0 | 0.0% |
| Science & Technology | 0 | 0.0% |
| Business | 0 | 0.0% |
| Education | 0 | 0.0% |
| Literature & Languages | 0 | 0.0% |
| Liberal Arts & History | 0 | 0.0% |
| Visual & Performing Arts | 0 | 0.0% |
| Communications | 0 | 0.0% |
| Arts & Humanities | 32 | 100.0% |
| Total | 32 | 100.0% |
Transportation & Commute in Second Mesa
Vehicle Availability by Sex in Second Mesa
The most prevalent vehicle ownership categories in Second Mesa are males with 1 vehicle (64, accounting for 48.1%) and females with 1 vehicle (115, making up 22.9%).
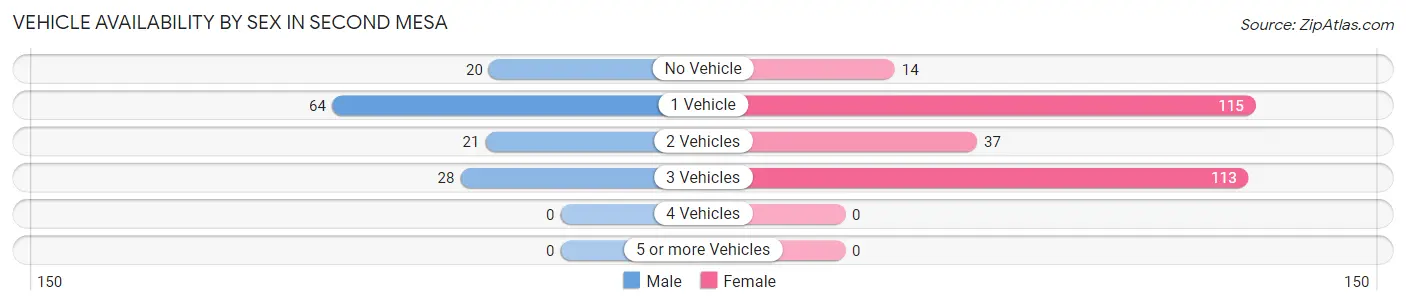
| Vehicles Available | Male | Female |
| No Vehicle | 20 (15.0%) | 14 (5.0%) |
| 1 Vehicle | 64 (48.1%) | 115 (41.2%) |
| 2 Vehicles | 21 (15.8%) | 37 (13.3%) |
| 3 Vehicles | 28 (21.0%) | 113 (40.5%) |
| 4 Vehicles | 0 (0.0%) | 0 (0.0%) |
| 5 or more Vehicles | 0 (0.0%) | 0 (0.0%) |
| Total | 133 (100.0%) | 279 (100.0%) |
Commute Time in Second Mesa
The most frequently occuring commute durations in Second Mesa are 15 to 19 minutes (109 commuters, 41.8%), 20 to 24 minutes (49 commuters, 18.8%), and 10 to 14 minutes (36 commuters, 13.8%).
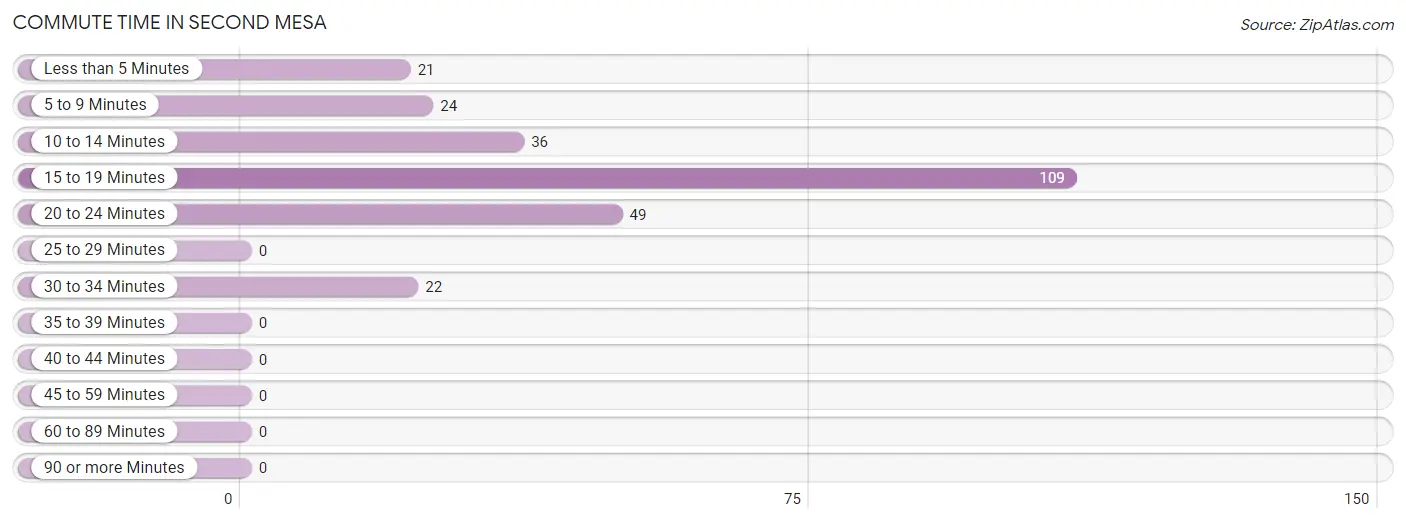
| Commute Time | # Commuters | % Commuters |
| Less than 5 Minutes | 21 | 8.1% |
| 5 to 9 Minutes | 24 | 9.2% |
| 10 to 14 Minutes | 36 | 13.8% |
| 15 to 19 Minutes | 109 | 41.8% |
| 20 to 24 Minutes | 49 | 18.8% |
| 25 to 29 Minutes | 0 | 0.0% |
| 30 to 34 Minutes | 22 | 8.4% |
| 35 to 39 Minutes | 0 | 0.0% |
| 40 to 44 Minutes | 0 | 0.0% |
| 45 to 59 Minutes | 0 | 0.0% |
| 60 to 89 Minutes | 0 | 0.0% |
| 90 or more Minutes | 0 | 0.0% |
Commute Time by Sex in Second Mesa
The most common commute times in Second Mesa are 5 to 9 minutes (24 commuters, 53.3%) for males and 15 to 19 minutes (109 commuters, 50.5%) for females.
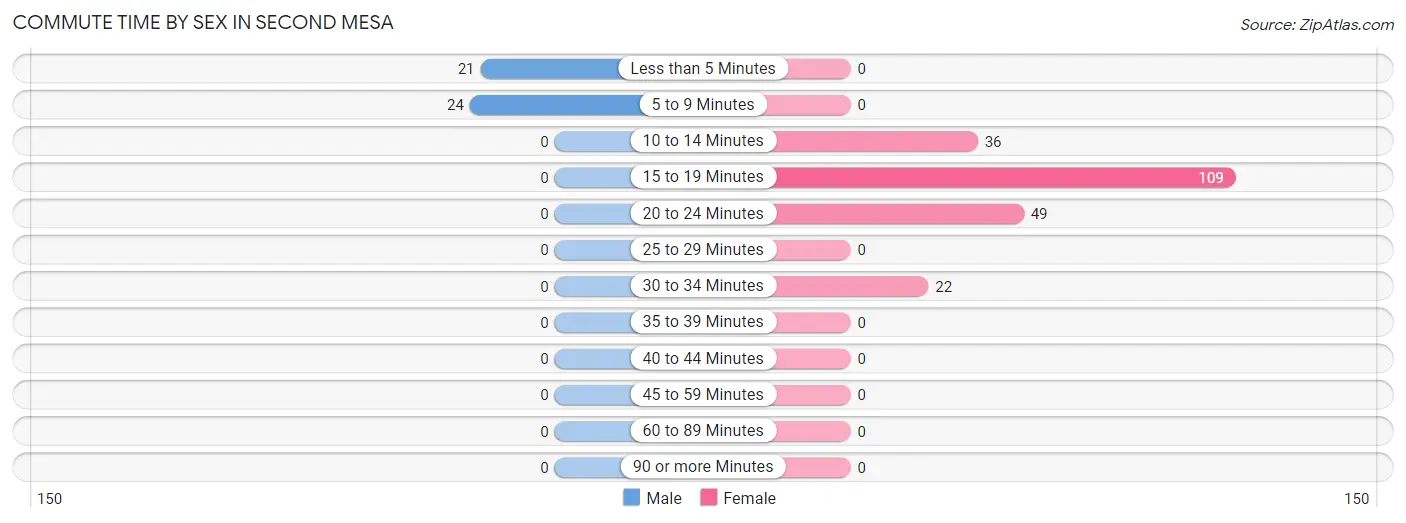
| Commute Time | Male | Female |
| Less than 5 Minutes | 21 (46.7%) | 0 (0.0%) |
| 5 to 9 Minutes | 24 (53.3%) | 0 (0.0%) |
| 10 to 14 Minutes | 0 (0.0%) | 36 (16.7%) |
| 15 to 19 Minutes | 0 (0.0%) | 109 (50.5%) |
| 20 to 24 Minutes | 0 (0.0%) | 49 (22.7%) |
| 25 to 29 Minutes | 0 (0.0%) | 0 (0.0%) |
| 30 to 34 Minutes | 0 (0.0%) | 22 (10.2%) |
| 35 to 39 Minutes | 0 (0.0%) | 0 (0.0%) |
| 40 to 44 Minutes | 0 (0.0%) | 0 (0.0%) |
| 45 to 59 Minutes | 0 (0.0%) | 0 (0.0%) |
| 60 to 89 Minutes | 0 (0.0%) | 0 (0.0%) |
| 90 or more Minutes | 0 (0.0%) | 0 (0.0%) |
Time of Departure to Work by Sex in Second Mesa
The most frequent times of departure to work in Second Mesa are 6:30 AM to 6:59 AM (24, 53.3%) for males and 7:30 AM to 7:59 AM (131, 60.7%) for females.
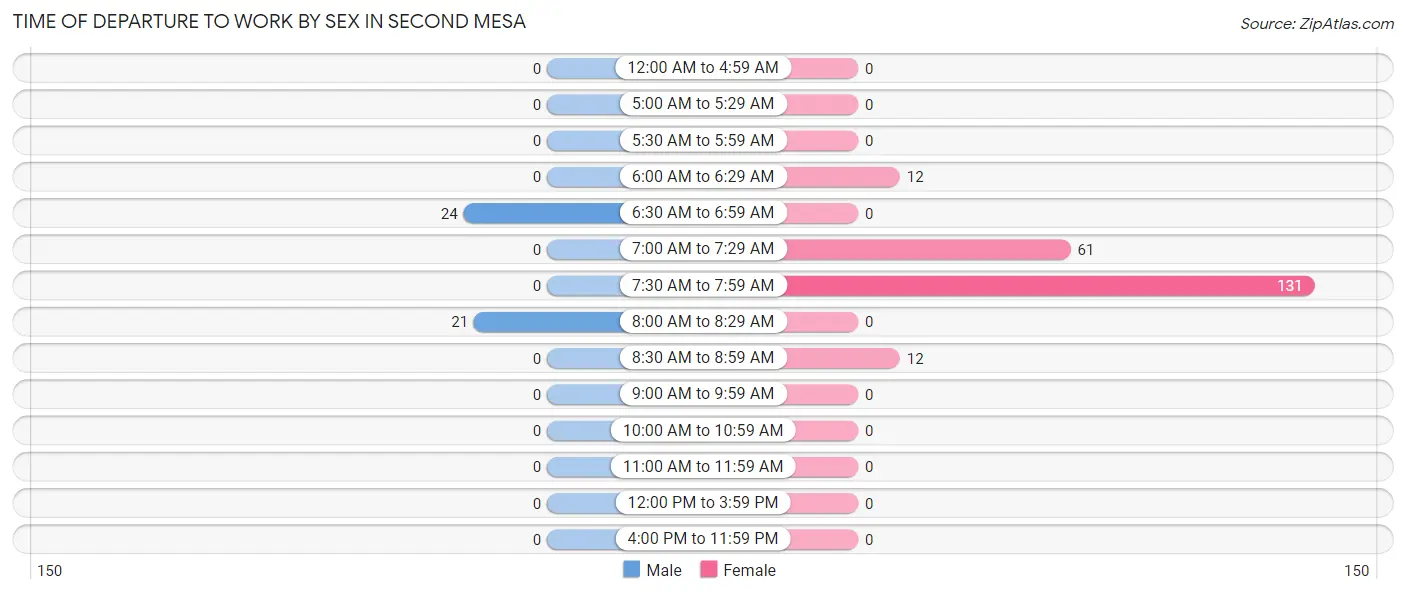
| Time of Departure | Male | Female |
| 12:00 AM to 4:59 AM | 0 (0.0%) | 0 (0.0%) |
| 5:00 AM to 5:29 AM | 0 (0.0%) | 0 (0.0%) |
| 5:30 AM to 5:59 AM | 0 (0.0%) | 0 (0.0%) |
| 6:00 AM to 6:29 AM | 0 (0.0%) | 12 (5.6%) |
| 6:30 AM to 6:59 AM | 24 (53.3%) | 0 (0.0%) |
| 7:00 AM to 7:29 AM | 0 (0.0%) | 61 (28.2%) |
| 7:30 AM to 7:59 AM | 0 (0.0%) | 131 (60.7%) |
| 8:00 AM to 8:29 AM | 21 (46.7%) | 0 (0.0%) |
| 8:30 AM to 8:59 AM | 0 (0.0%) | 12 (5.6%) |
| 9:00 AM to 9:59 AM | 0 (0.0%) | 0 (0.0%) |
| 10:00 AM to 10:59 AM | 0 (0.0%) | 0 (0.0%) |
| 11:00 AM to 11:59 AM | 0 (0.0%) | 0 (0.0%) |
| 12:00 PM to 3:59 PM | 0 (0.0%) | 0 (0.0%) |
| 4:00 PM to 11:59 PM | 0 (0.0%) | 0 (0.0%) |
| Total | 45 (100.0%) | 216 (100.0%) |
Housing Occupancy in Second Mesa
Occupancy by Ownership in Second Mesa
Of the total 290 dwellings in Second Mesa, owner-occupied units account for 248 (85.5%), while renter-occupied units make up 42 (14.5%).
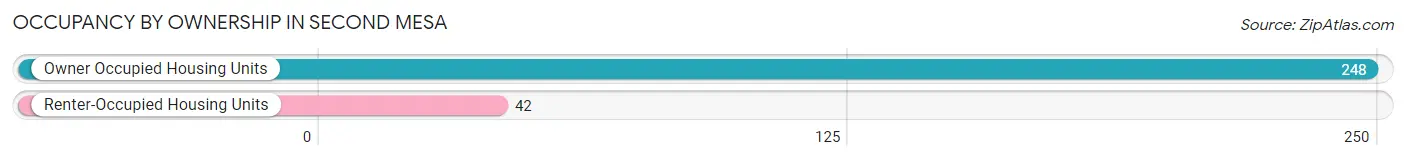
| Occupancy | # Housing Units | % Housing Units |
| Owner Occupied Housing Units | 248 | 85.5% |
| Renter-Occupied Housing Units | 42 | 14.5% |
| Total Occupied Housing Units | 290 | 100.0% |
Occupancy by Household Size in Second Mesa
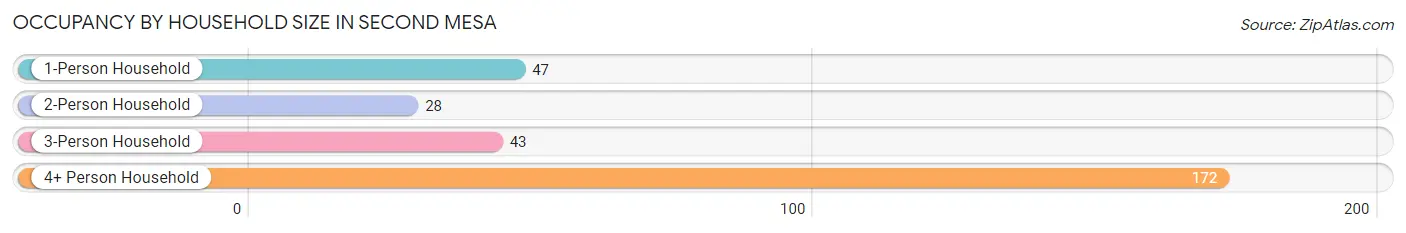
| Household Size | # Housing Units | % Housing Units |
| 1-Person Household | 47 | 16.2% |
| 2-Person Household | 28 | 9.7% |
| 3-Person Household | 43 | 14.8% |
| 4+ Person Household | 172 | 59.3% |
| Total Housing Units | 290 | 100.0% |
Occupancy by Ownership by Household Size in Second Mesa
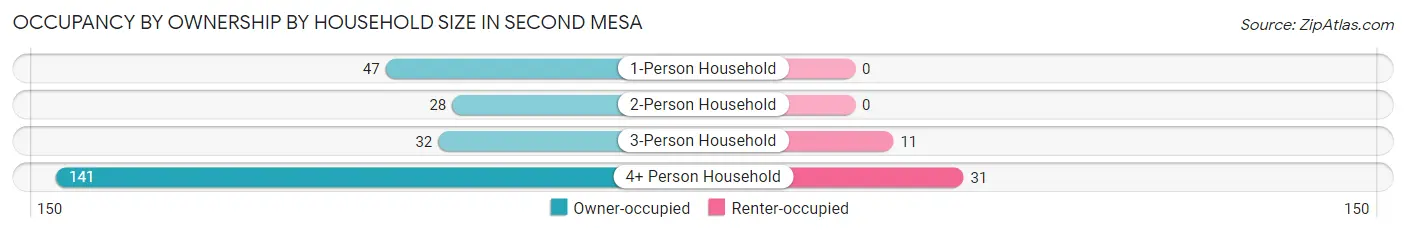
| Household Size | Owner-occupied | Renter-occupied |
| 1-Person Household | 47 (100.0%) | 0 (0.0%) |
| 2-Person Household | 28 (100.0%) | 0 (0.0%) |
| 3-Person Household | 32 (74.4%) | 11 (25.6%) |
| 4+ Person Household | 141 (82.0%) | 31 (18.0%) |
| Total Housing Units | 248 (85.5%) | 42 (14.5%) |
Occupancy by Educational Attainment in Second Mesa
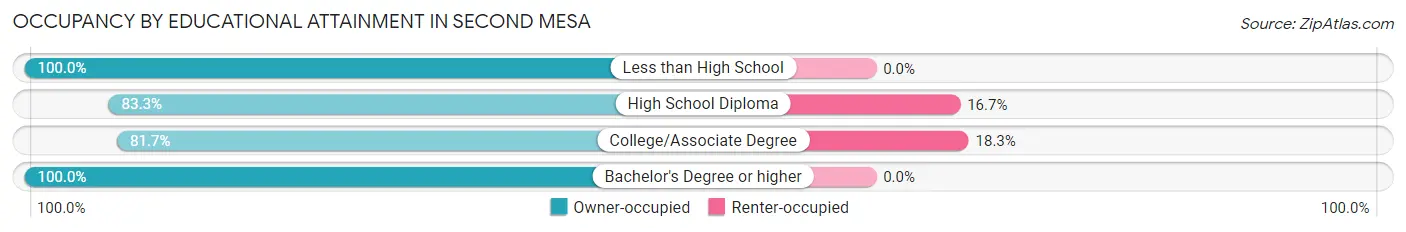
| Household Size | Owner-occupied | Renter-occupied |
| Less than High School | 12 (100.0%) | 0 (0.0%) |
| High School Diploma | 155 (83.3%) | 31 (16.7%) |
| College/Associate Degree | 49 (81.7%) | 11 (18.3%) |
| Bachelor's Degree or higher | 32 (100.0%) | 0 (0.0%) |
Occupancy by Age of Householder in Second Mesa
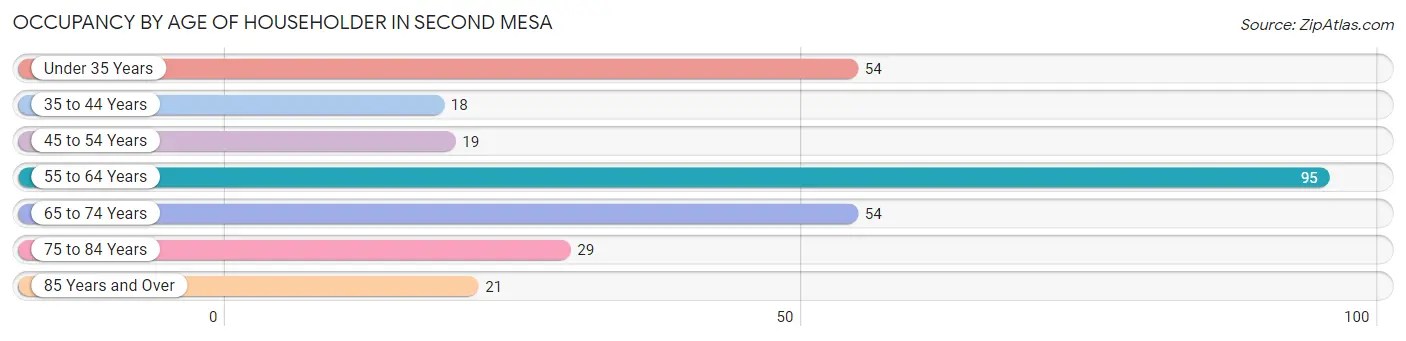
| Age Bracket | # Households | % Households |
| Under 35 Years | 54 | 18.6% |
| 35 to 44 Years | 18 | 6.2% |
| 45 to 54 Years | 19 | 6.6% |
| 55 to 64 Years | 95 | 32.8% |
| 65 to 74 Years | 54 | 18.6% |
| 75 to 84 Years | 29 | 10.0% |
| 85 Years and Over | 21 | 7.2% |
| Total | 290 | 100.0% |
Housing Finances in Second Mesa
Median Income by Occupancy in Second Mesa
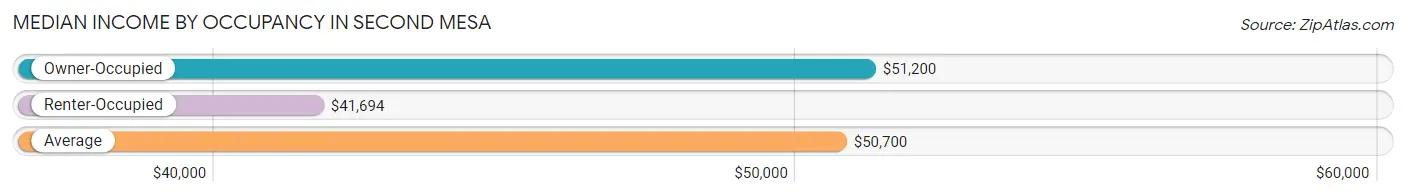
| Occupancy Type | # Households | Median Income |
| Owner-Occupied | 248 (85.5%) | $51,200 |
| Renter-Occupied | 42 (14.5%) | $41,694 |
| Average | 290 (100.0%) | $50,700 |
Occupancy by Householder Income Bracket in Second Mesa
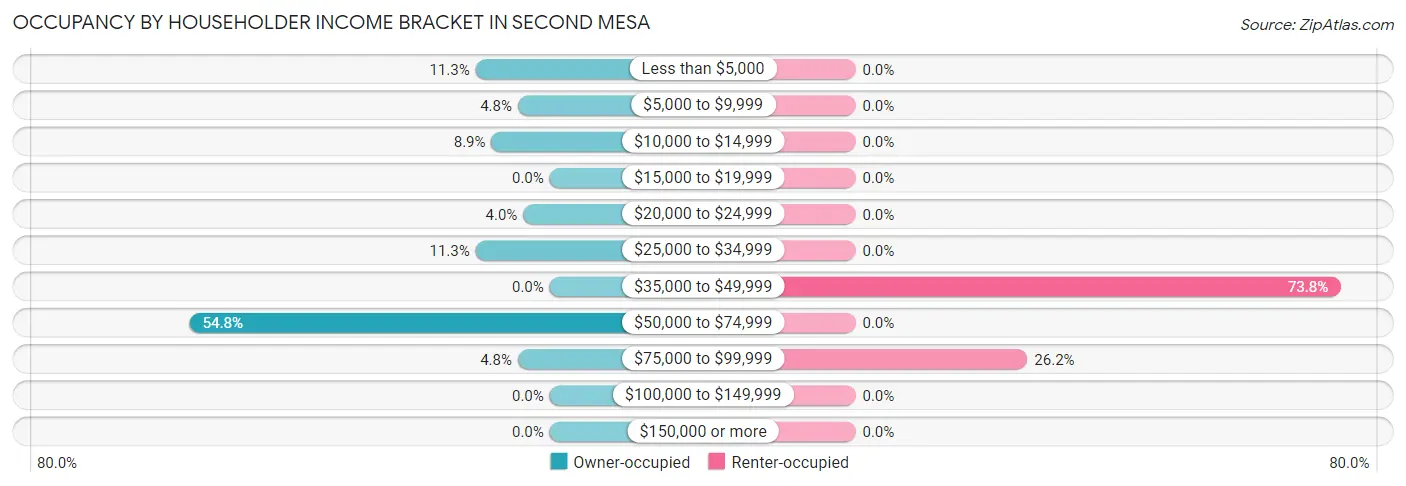
| Income Bracket | Owner-occupied | Renter-occupied |
| Less than $5,000 | 28 (11.3%) | 0 (0.0%) |
| $5,000 to $9,999 | 12 (4.8%) | 0 (0.0%) |
| $10,000 to $14,999 | 22 (8.9%) | 0 (0.0%) |
| $15,000 to $19,999 | 0 (0.0%) | 0 (0.0%) |
| $20,000 to $24,999 | 10 (4.0%) | 0 (0.0%) |
| $25,000 to $34,999 | 28 (11.3%) | 0 (0.0%) |
| $35,000 to $49,999 | 0 (0.0%) | 31 (73.8%) |
| $50,000 to $74,999 | 136 (54.8%) | 0 (0.0%) |
| $75,000 to $99,999 | 12 (4.8%) | 11 (26.2%) |
| $100,000 to $149,999 | 0 (0.0%) | 0 (0.0%) |
| $150,000 or more | 0 (0.0%) | 0 (0.0%) |
| Total | 248 (100.0%) | 42 (100.0%) |
Monthly Housing Cost Tiers in Second Mesa
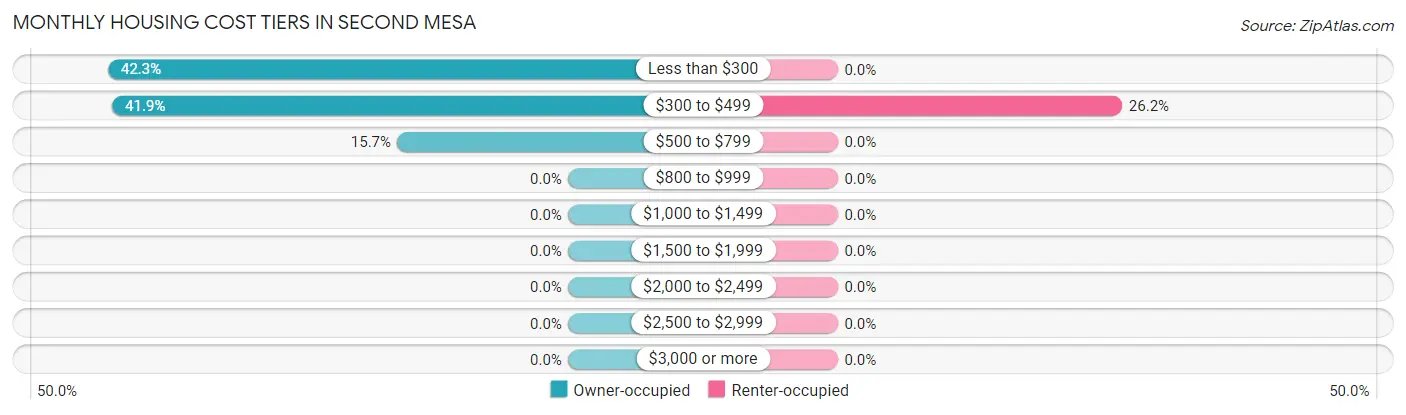
| Monthly Cost | Owner-occupied | Renter-occupied |
| Less than $300 | 105 (42.3%) | 0 (0.0%) |
| $300 to $499 | 104 (41.9%) | 11 (26.2%) |
| $500 to $799 | 39 (15.7%) | 0 (0.0%) |
| $800 to $999 | 0 (0.0%) | 0 (0.0%) |
| $1,000 to $1,499 | 0 (0.0%) | 0 (0.0%) |
| $1,500 to $1,999 | 0 (0.0%) | 0 (0.0%) |
| $2,000 to $2,499 | 0 (0.0%) | 0 (0.0%) |
| $2,500 to $2,999 | 0 (0.0%) | 0 (0.0%) |
| $3,000 or more | 0 (0.0%) | 0 (0.0%) |
| Total | 248 (100.0%) | 42 (100.0%) |
Physical Housing Characteristics in Second Mesa
Housing Structures in Second Mesa
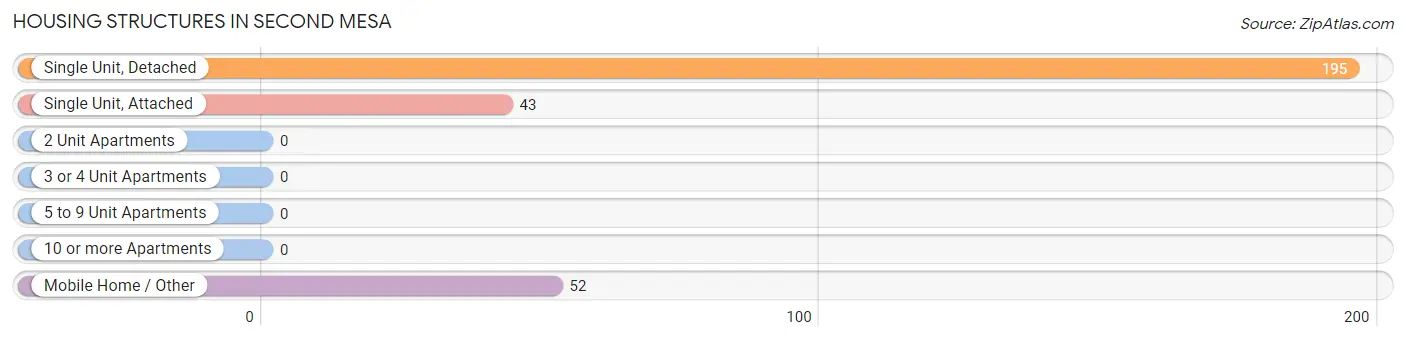
| Structure Type | # Housing Units | % Housing Units |
| Single Unit, Detached | 195 | 67.2% |
| Single Unit, Attached | 43 | 14.8% |
| 2 Unit Apartments | 0 | 0.0% |
| 3 or 4 Unit Apartments | 0 | 0.0% |
| 5 to 9 Unit Apartments | 0 | 0.0% |
| 10 or more Apartments | 0 | 0.0% |
| Mobile Home / Other | 52 | 17.9% |
| Total | 290 | 100.0% |
Housing Structures by Occupancy in Second Mesa
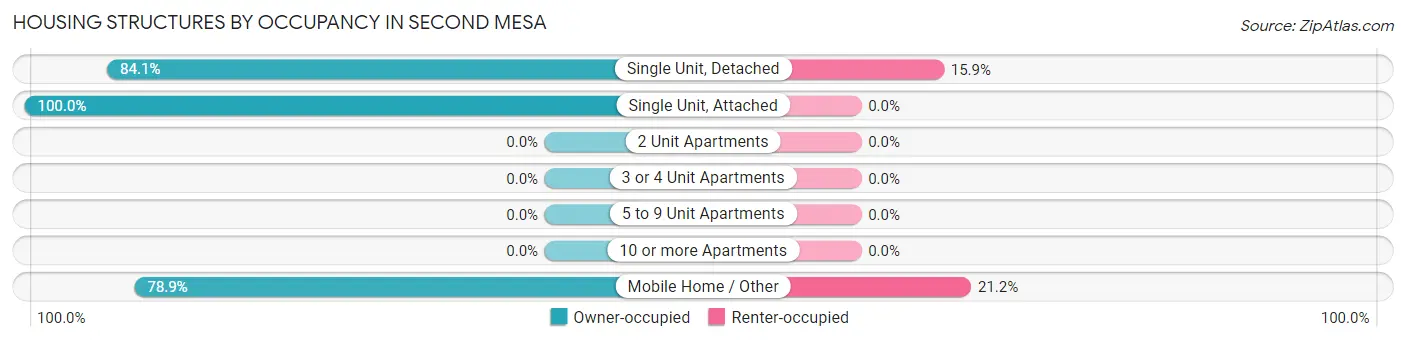
| Structure Type | Owner-occupied | Renter-occupied |
| Single Unit, Detached | 164 (84.1%) | 31 (15.9%) |
| Single Unit, Attached | 43 (100.0%) | 0 (0.0%) |
| 2 Unit Apartments | 0 (0.0%) | 0 (0.0%) |
| 3 or 4 Unit Apartments | 0 (0.0%) | 0 (0.0%) |
| 5 to 9 Unit Apartments | 0 (0.0%) | 0 (0.0%) |
| 10 or more Apartments | 0 (0.0%) | 0 (0.0%) |
| Mobile Home / Other | 41 (78.8%) | 11 (21.1%) |
| Total | 248 (85.5%) | 42 (14.5%) |
Housing Structures by Number of Rooms in Second Mesa
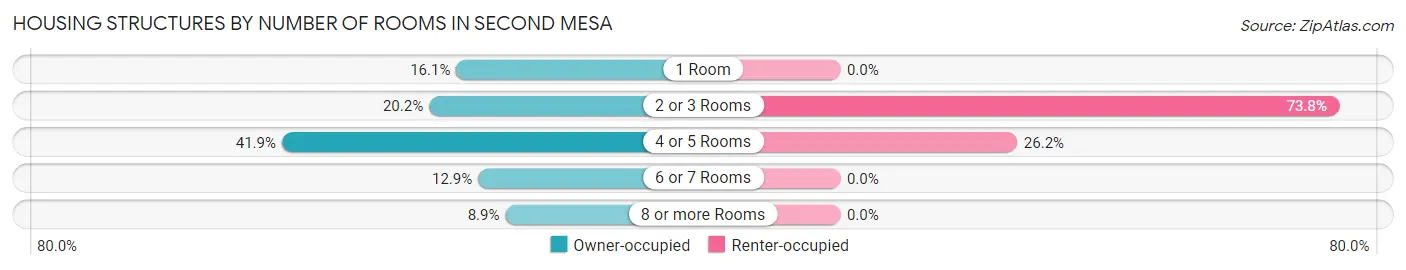
| Number of Rooms | Owner-occupied | Renter-occupied |
| 1 Room | 40 (16.1%) | 0 (0.0%) |
| 2 or 3 Rooms | 50 (20.2%) | 31 (73.8%) |
| 4 or 5 Rooms | 104 (41.9%) | 11 (26.2%) |
| 6 or 7 Rooms | 32 (12.9%) | 0 (0.0%) |
| 8 or more Rooms | 22 (8.9%) | 0 (0.0%) |
| Total | 248 (100.0%) | 42 (100.0%) |
Housing Structure by Heating Type in Second Mesa
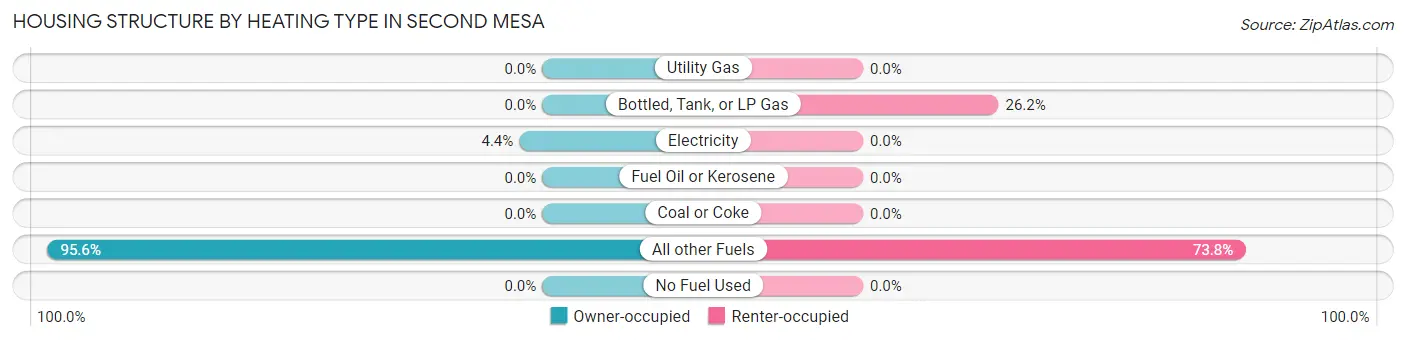
| Heating Type | Owner-occupied | Renter-occupied |
| Utility Gas | 0 (0.0%) | 0 (0.0%) |
| Bottled, Tank, or LP Gas | 0 (0.0%) | 11 (26.2%) |
| Electricity | 11 (4.4%) | 0 (0.0%) |
| Fuel Oil or Kerosene | 0 (0.0%) | 0 (0.0%) |
| Coal or Coke | 0 (0.0%) | 0 (0.0%) |
| All other Fuels | 237 (95.6%) | 31 (73.8%) |
| No Fuel Used | 0 (0.0%) | 0 (0.0%) |
| Total | 248 (100.0%) | 42 (100.0%) |
Household Vehicle Usage in Second Mesa
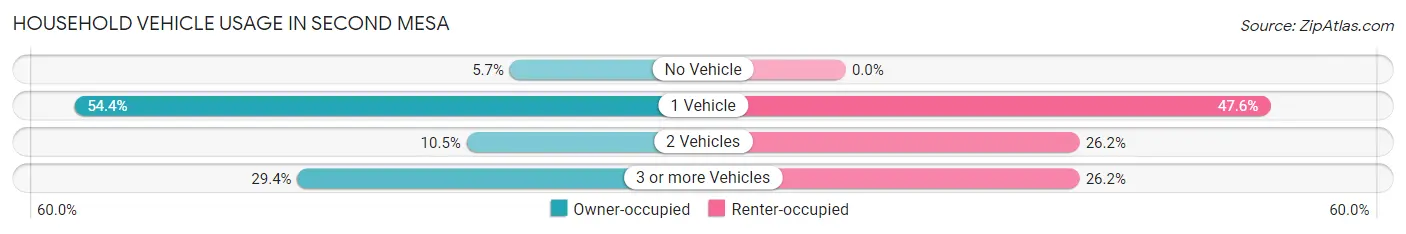
| Vehicles per Household | Owner-occupied | Renter-occupied |
| No Vehicle | 14 (5.7%) | 0 (0.0%) |
| 1 Vehicle | 135 (54.4%) | 20 (47.6%) |
| 2 Vehicles | 26 (10.5%) | 11 (26.2%) |
| 3 or more Vehicles | 73 (29.4%) | 11 (26.2%) |
| Total | 248 (100.0%) | 42 (100.0%) |
Real Estate & Mortgages in Second Mesa
Real Estate and Mortgage Overview in Second Mesa
| Characteristic | Without Mortgage | With Mortgage |
| Housing Units | 248 | 0 |
| Median Property Value | $101,900 | $0 |
| Median Household Income | $51,200 | $0 |
| Monthly Housing Costs | $357 | $0 |
| Real Estate Taxes | - | - |
Property Value by Mortgage Status in Second Mesa
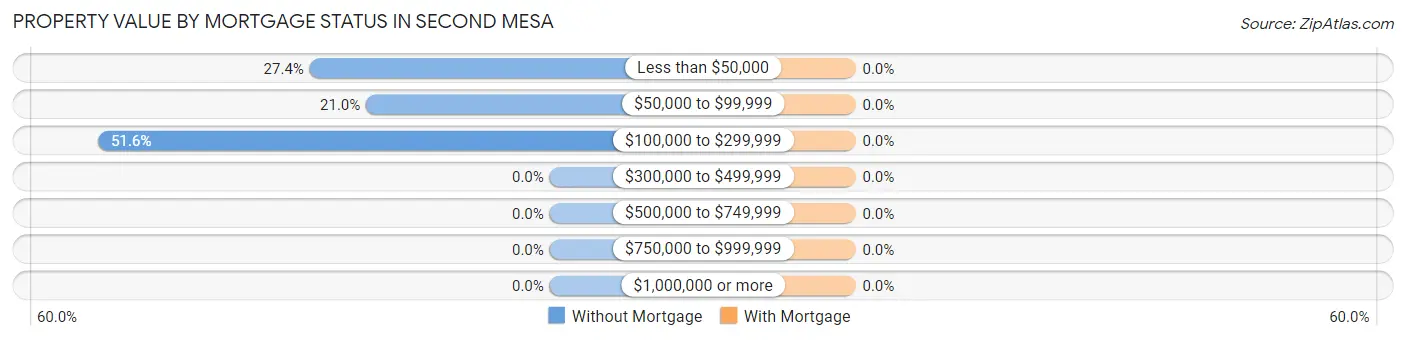
| Property Value | Without Mortgage | With Mortgage |
| Less than $50,000 | 68 (27.4%) | 0 (0.0%) |
| $50,000 to $99,999 | 52 (21.0%) | 0 (0.0%) |
| $100,000 to $299,999 | 128 (51.6%) | 0 (0.0%) |
| $300,000 to $499,999 | 0 (0.0%) | 0 (0.0%) |
| $500,000 to $749,999 | 0 (0.0%) | 0 (0.0%) |
| $750,000 to $999,999 | 0 (0.0%) | 0 (0.0%) |
| $1,000,000 or more | 0 (0.0%) | 0 (0.0%) |
| Total | 248 (100.0%) | 0 (0.0%) |
Household Income by Mortgage Status in Second Mesa
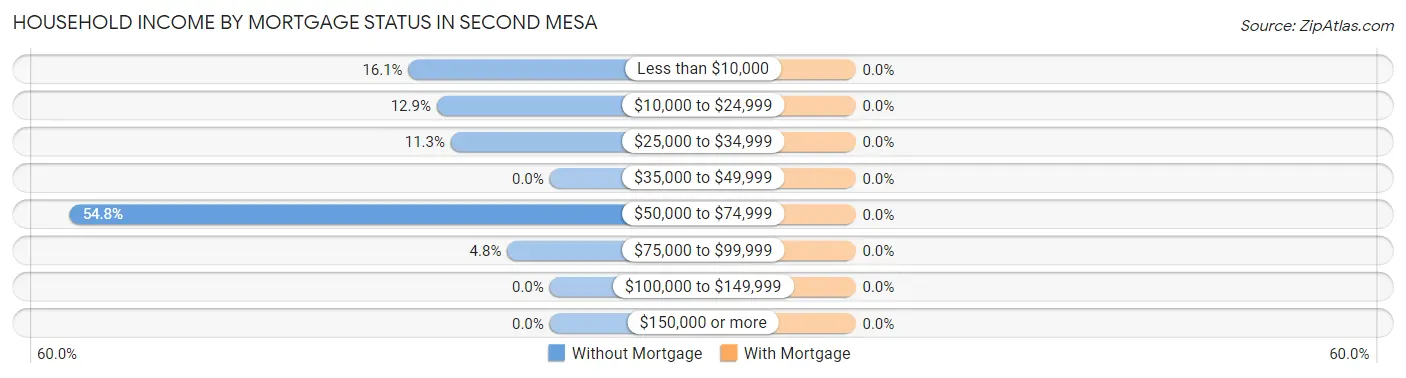
| Household Income | Without Mortgage | With Mortgage |
| Less than $10,000 | 40 (16.1%) | 0 (0.0%) |
| $10,000 to $24,999 | 32 (12.9%) | 0 (0.0%) |
| $25,000 to $34,999 | 28 (11.3%) | 0 (0.0%) |
| $35,000 to $49,999 | 0 (0.0%) | 0 (0.0%) |
| $50,000 to $74,999 | 136 (54.8%) | 0 (0.0%) |
| $75,000 to $99,999 | 12 (4.8%) | 0 (0.0%) |
| $100,000 to $149,999 | 0 (0.0%) | 0 (0.0%) |
| $150,000 or more | 0 (0.0%) | 0 (0.0%) |
| Total | 248 (100.0%) | 0 (0.0%) |
Property Value to Household Income Ratio in Second Mesa
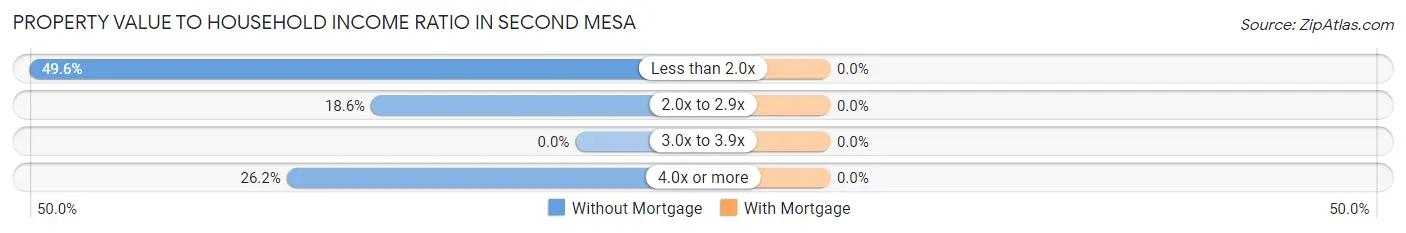
| Value-to-Income Ratio | Without Mortgage | With Mortgage |
| Less than 2.0x | 123 (49.6%) | 0 (0.0%) |
| 2.0x to 2.9x | 46 (18.5%) | 0 (0.0%) |
| 3.0x to 3.9x | 0 (0.0%) | 0 (0.0%) |
| 4.0x or more | 65 (26.2%) | 0 (0.0%) |
| Total | 248 (100.0%) | 0 (0.0%) |
Real Estate Taxes by Mortgage Status in Second Mesa
| Property Taxes | Without Mortgage | With Mortgage |
| Less than $800 | 0 (0.0%) | 0 (0.0%) |
| $800 to $1,499 | 0 (0.0%) | 0 (0.0%) |
| $800 to $1,499 | 0 (0.0%) | 0 (0.0%) |
| Total | 248 (100.0%) | 0 (0.0%) |
Health & Disability in Second Mesa
Health Insurance Coverage by Age in Second Mesa
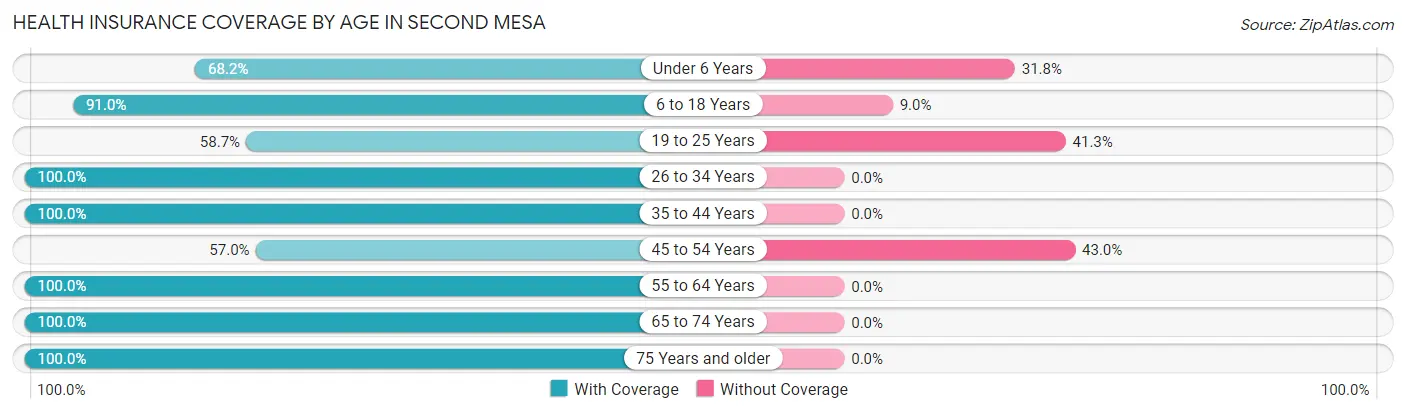
| Age Bracket | With Coverage | Without Coverage |
| Under 6 Years | 103 (68.2%) | 48 (31.8%) |
| 6 to 18 Years | 292 (91.0%) | 29 (9.0%) |
| 19 to 25 Years | 111 (58.7%) | 78 (41.3%) |
| 26 to 34 Years | 185 (100.0%) | 0 (0.0%) |
| 35 to 44 Years | 113 (100.0%) | 0 (0.0%) |
| 45 to 54 Years | 45 (57.0%) | 34 (43.0%) |
| 55 to 64 Years | 95 (100.0%) | 0 (0.0%) |
| 65 to 74 Years | 179 (100.0%) | 0 (0.0%) |
| 75 Years and older | 60 (100.0%) | 0 (0.0%) |
| Total | 1,183 (86.2%) | 189 (13.8%) |
Health Insurance Coverage by Citizenship Status in Second Mesa
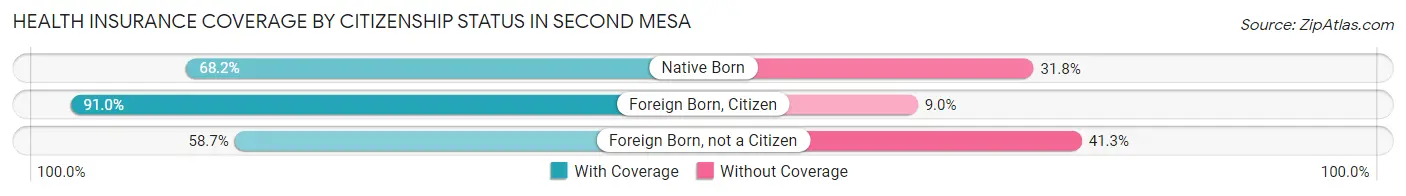
| Citizenship Status | With Coverage | Without Coverage |
| Native Born | 103 (68.2%) | 48 (31.8%) |
| Foreign Born, Citizen | 292 (91.0%) | 29 (9.0%) |
| Foreign Born, not a Citizen | 111 (58.7%) | 78 (41.3%) |
Health Insurance Coverage by Household Income in Second Mesa
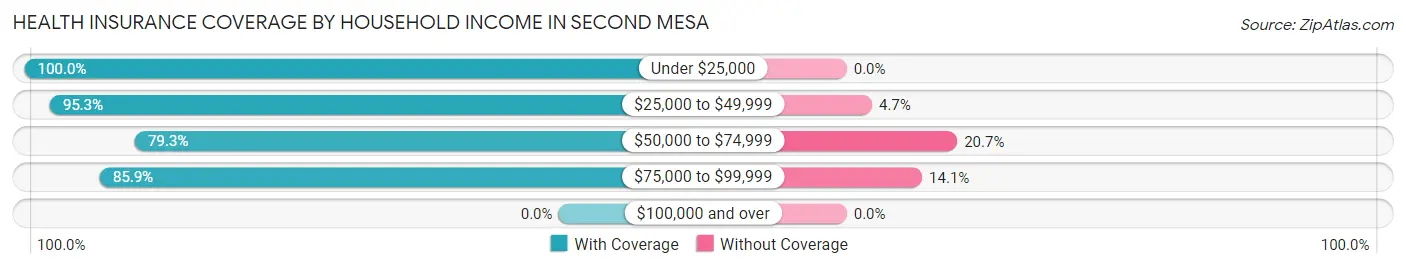
| Household Income | With Coverage | Without Coverage |
| Under $25,000 | 187 (100.0%) | 0 (0.0%) |
| $25,000 to $49,999 | 302 (95.3%) | 15 (4.7%) |
| $50,000 to $74,999 | 621 (79.3%) | 162 (20.7%) |
| $75,000 to $99,999 | 73 (85.9%) | 12 (14.1%) |
| $100,000 and over | 0 (0.0%) | 0 (0.0%) |
Public vs Private Health Insurance Coverage by Age in Second Mesa
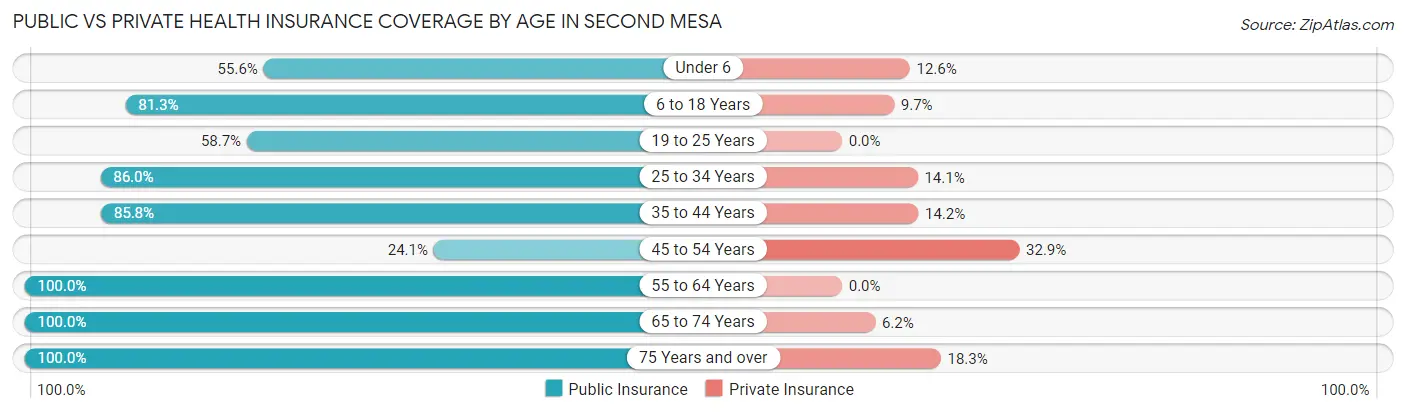
| Age Bracket | Public Insurance | Private Insurance |
| Under 6 | 84 (55.6%) | 19 (12.6%) |
| 6 to 18 Years | 261 (81.3%) | 31 (9.7%) |
| 19 to 25 Years | 111 (58.7%) | 0 (0.0%) |
| 25 to 34 Years | 159 (86.0%) | 26 (14.1%) |
| 35 to 44 Years | 97 (85.8%) | 16 (14.2%) |
| 45 to 54 Years | 19 (24.0%) | 26 (32.9%) |
| 55 to 64 Years | 95 (100.0%) | 0 (0.0%) |
| 65 to 74 Years | 179 (100.0%) | 11 (6.1%) |
| 75 Years and over | 60 (100.0%) | 11 (18.3%) |
| Total | 1,065 (77.6%) | 140 (10.2%) |
Disability Status by Sex by Age in Second Mesa
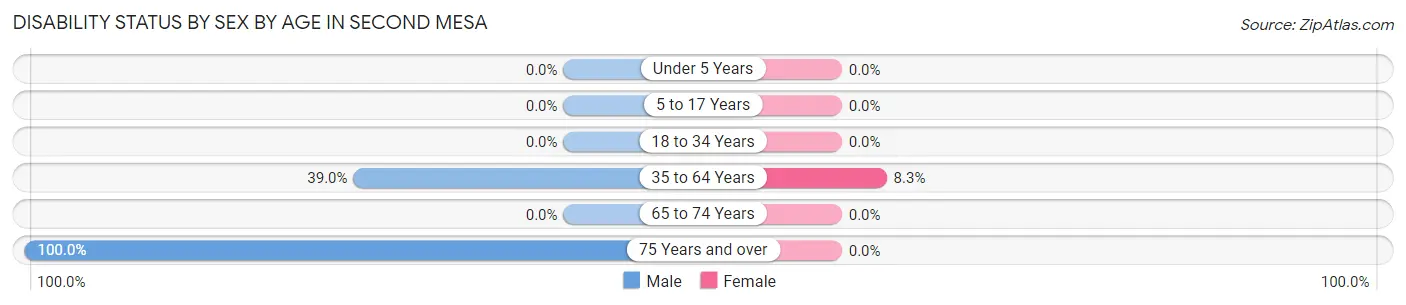
| Age Bracket | Male | Female |
| Under 5 Years | 0 (0.0%) | 0 (0.0%) |
| 5 to 17 Years | 0 (0.0%) | 0 (0.0%) |
| 18 to 34 Years | 0 (0.0%) | 0 (0.0%) |
| 35 to 64 Years | 23 (39.0%) | 19 (8.3%) |
| 65 to 74 Years | 0 (0.0%) | 0 (0.0%) |
| 75 Years and over | 31 (100.0%) | 0 (0.0%) |
Disability Class by Sex by Age in Second Mesa
Disability Class: Hearing Difficulty
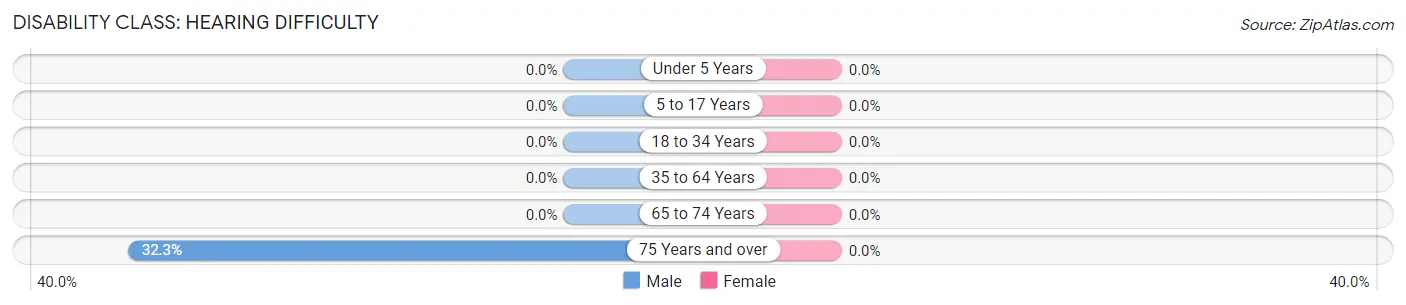
| Age Bracket | Male | Female |
| Under 5 Years | 0 (0.0%) | 0 (0.0%) |
| 5 to 17 Years | 0 (0.0%) | 0 (0.0%) |
| 18 to 34 Years | 0 (0.0%) | 0 (0.0%) |
| 35 to 64 Years | 0 (0.0%) | 0 (0.0%) |
| 65 to 74 Years | 0 (0.0%) | 0 (0.0%) |
| 75 Years and over | 10 (32.3%) | 0 (0.0%) |
Disability Class: Vision Difficulty
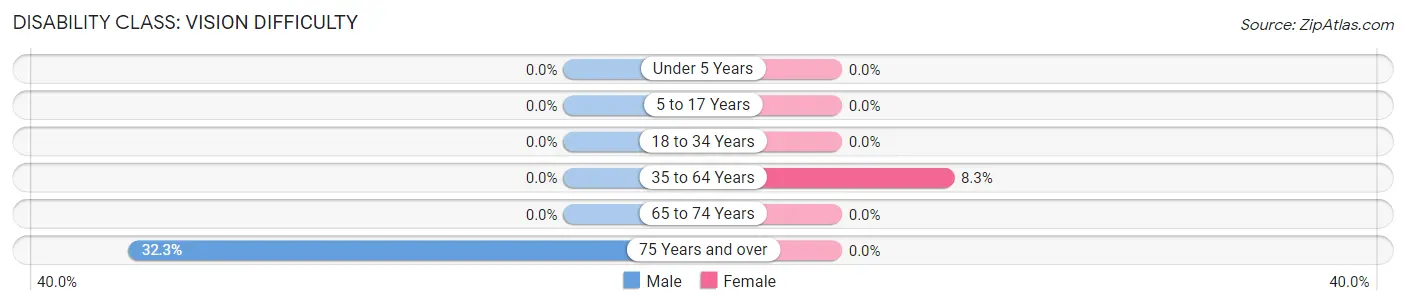
| Age Bracket | Male | Female |
| Under 5 Years | 0 (0.0%) | 0 (0.0%) |
| 5 to 17 Years | 0 (0.0%) | 0 (0.0%) |
| 18 to 34 Years | 0 (0.0%) | 0 (0.0%) |
| 35 to 64 Years | 0 (0.0%) | 19 (8.3%) |
| 65 to 74 Years | 0 (0.0%) | 0 (0.0%) |
| 75 Years and over | 10 (32.3%) | 0 (0.0%) |
Disability Class: Cognitive Difficulty
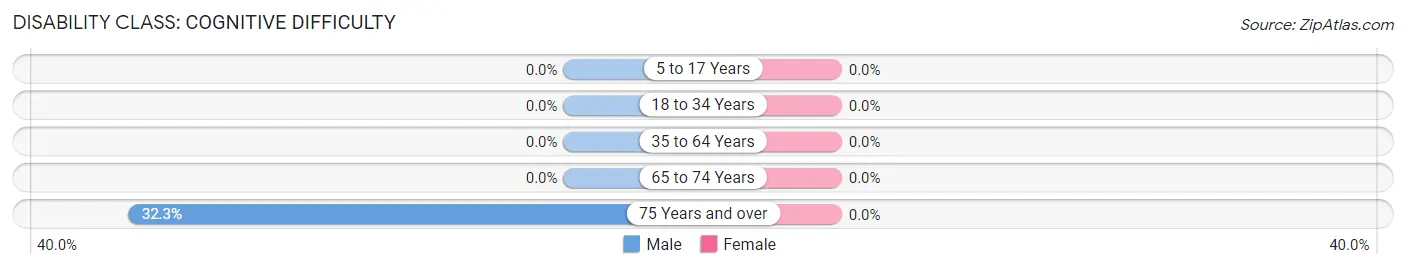
| Age Bracket | Male | Female |
| 5 to 17 Years | 0 (0.0%) | 0 (0.0%) |
| 18 to 34 Years | 0 (0.0%) | 0 (0.0%) |
| 35 to 64 Years | 0 (0.0%) | 0 (0.0%) |
| 65 to 74 Years | 0 (0.0%) | 0 (0.0%) |
| 75 Years and over | 10 (32.3%) | 0 (0.0%) |
Disability Class: Ambulatory Difficulty
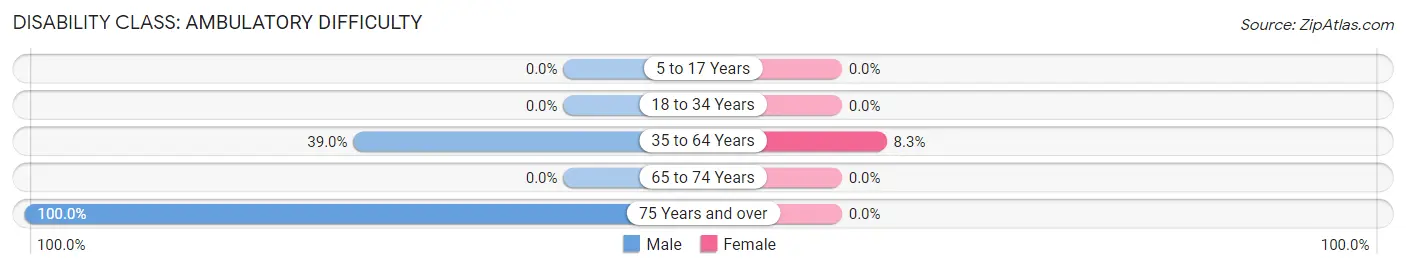
| Age Bracket | Male | Female |
| 5 to 17 Years | 0 (0.0%) | 0 (0.0%) |
| 18 to 34 Years | 0 (0.0%) | 0 (0.0%) |
| 35 to 64 Years | 23 (39.0%) | 19 (8.3%) |
| 65 to 74 Years | 0 (0.0%) | 0 (0.0%) |
| 75 Years and over | 31 (100.0%) | 0 (0.0%) |
Disability Class: Self-Care Difficulty
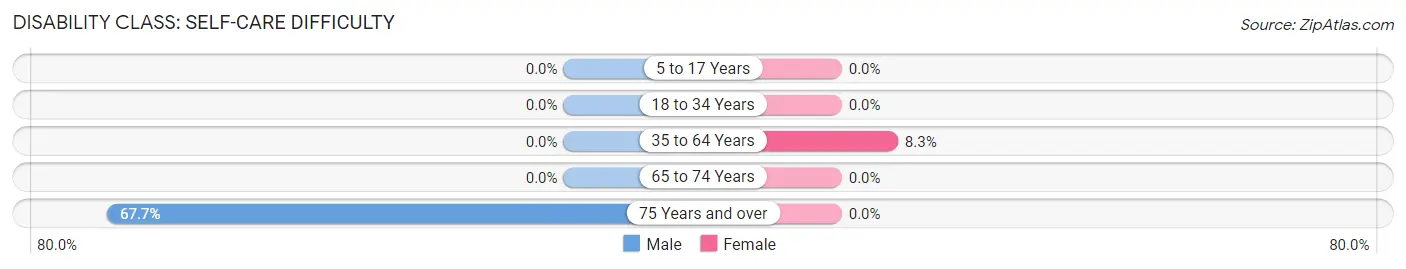
| Age Bracket | Male | Female |
| 5 to 17 Years | 0 (0.0%) | 0 (0.0%) |
| 18 to 34 Years | 0 (0.0%) | 0 (0.0%) |
| 35 to 64 Years | 0 (0.0%) | 19 (8.3%) |
| 65 to 74 Years | 0 (0.0%) | 0 (0.0%) |
| 75 Years and over | 21 (67.7%) | 0 (0.0%) |
Technology Access in Second Mesa
Computing Device Access in Second Mesa
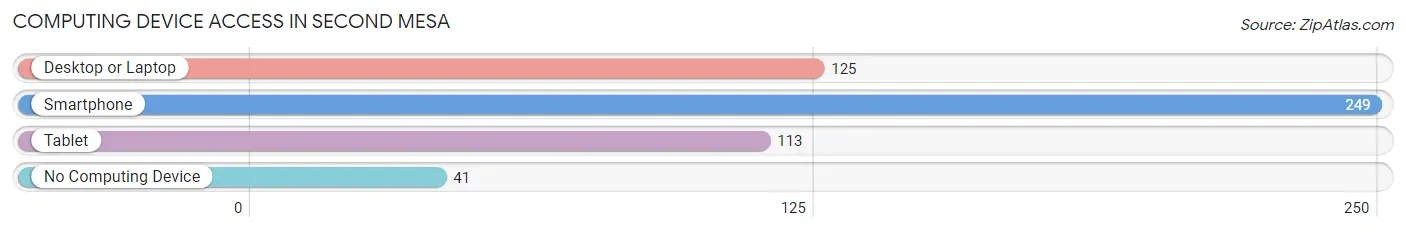
| Device Type | # Households | % Households |
| Desktop or Laptop | 125 | 43.1% |
| Smartphone | 249 | 85.9% |
| Tablet | 113 | 39.0% |
| No Computing Device | 41 | 14.1% |
| Total | 290 | 100.0% |
Internet Access in Second Mesa
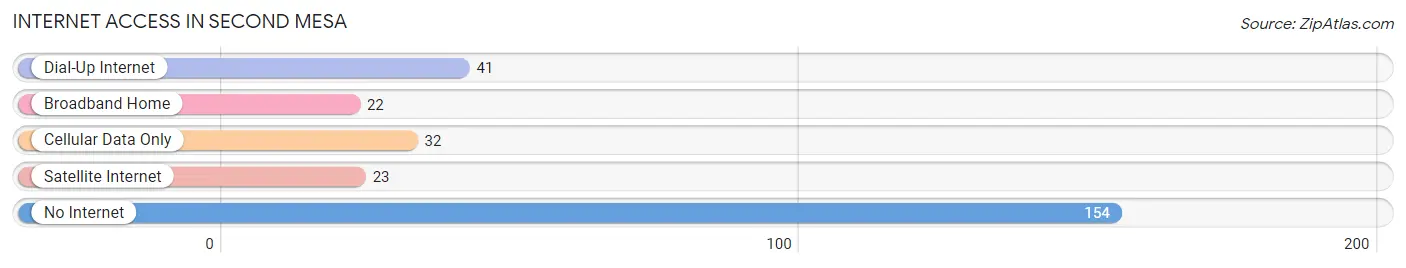
| Internet Type | # Households | % Households |
| Dial-Up Internet | 41 | 14.1% |
| Broadband Home | 22 | 7.6% |
| Cellular Data Only | 32 | 11.0% |
| Satellite Internet | 23 | 7.9% |
| No Internet | 154 | 53.1% |
| Total | 290 | 100.0% |
Second Mesa Summary
Mesa, Arizona is a city located in Maricopa County, Arizona, United States. It is a suburb of Phoenix and is the third-largest city in Arizona. Mesa is located about 20 miles east of Phoenix and is the largest suburb of the Phoenix metropolitan area. The city is home to a population of over 500,000 people, making it the 38th most populous city in the United States.
Geography
Mesa is located in the Sonoran Desert, at an elevation of 1,167 feet (356 m). The city is located in the Salt River Valley, which is part of the larger Phoenix metropolitan area. The city is bordered by Tempe to the west, Gilbert to the south, Apache Junction to the east, and the Superstition Mountains to the northeast. The city is located in the Salt River Valley, which is part of the larger Phoenix metropolitan area.
Climate
Mesa has a hot desert climate, with hot summers and mild winters. The average high temperature in the summer is around 100°F (38°C), and the average low temperature in the winter is around 50°F (10°C). The city receives an average of 8.5 inches (21.6 cm) of precipitation per year.
Economy
Mesa is a major economic center in the Phoenix metropolitan area. The city is home to a number of large employers, including Boeing, Intel, and Banner Health. The city is also home to a number of smaller businesses, including restaurants, retail stores, and service providers. The city is also home to a number of educational institutions, including Arizona State University, Mesa Community College, and the University of Phoenix.
Demographics
As of the 2010 census, the population of Mesa was 439,041, making it the 38th most populous city in the United States. The city has a population density of 2,845 people per square mile (1,098/km2). The racial makeup of the city was 73.3% White, 4.2% African American, 1.2% Native American, 2.3% Asian, 0.2% Pacific Islander, 16.2% from other races, and 2.7% from two or more races. Hispanic or Latino of any race were 33.2% of the population.
The median income for a household in the city was $50,945, and the median income for a family was $58,945. The per capita income for the city was $24,945. About 11.2% of families and 14.7% of the population were below the poverty line, including 19.2% of those under age 18 and 8.2% of those age 65 or over.
Conclusion
Mesa, Arizona is a city located in Maricopa County, Arizona, United States. It is a suburb of Phoenix and is the third-largest city in Arizona. The city is home to a population of over 500,000 people, making it the 38th most populous city in the United States. Mesa is located in the Sonoran Desert, at an elevation of 1,167 feet (356 m). The city is located in the Salt River Valley, which is part of the larger Phoenix metropolitan area. The city has a hot desert climate, with hot summers and mild winters. Mesa is a major economic center in the Phoenix metropolitan area, with a number of large employers, including Boeing, Intel, and Banner Health. The city also has a number of smaller businesses, educational institutions, and a diverse population.
Common Questions
What is Per Capita Income in Second Mesa?
Per Capita income in Second Mesa is $10,705.
What is the Median Family Income in Second Mesa?
Median Family Income in Second Mesa is $50,625.
What is the Median Household income in Second Mesa?
Median Household Income in Second Mesa is $50,700.
What is Inequality or Gini Index in Second Mesa?
Inequality or Gini Index in Second Mesa is 0.33.
What is the Total Population of Second Mesa?
Total Population of Second Mesa is 1,372.
What is the Total Male Population of Second Mesa?
Total Male Population of Second Mesa is 646.
What is the Total Female Population of Second Mesa?
Total Female Population of Second Mesa is 726.
What is the Ratio of Males per 100 Females in Second Mesa?
There are 88.98 Males per 100 Females in Second Mesa.
What is the Ratio of Females per 100 Males in Second Mesa?
There are 112.38 Females per 100 Males in Second Mesa.
What is the Median Population Age in Second Mesa?
Median Population Age in Second Mesa is 26.3 Years.
What is the Average Family Size in Second Mesa
Average Family Size in Second Mesa is 4.8 People.
What is the Average Household Size in Second Mesa
Average Household Size in Second Mesa is 4.7 People.
How Large is the Labor Force in Second Mesa?
There are 541 People in the Labor Forcein in Second Mesa.
What is the Percentage of People in the Labor Force in Second Mesa?
56.1% of People are in the Labor Force in Second Mesa.
What is the Unemployment Rate in Second Mesa?
Unemployment Rate in Second Mesa is 20.1%.