Fort Defiance, AZ Map & Demographics
Fort Defiance Map
Fort Defiance Overview
$21,793
PER CAPITA INCOME
$55,938
AVG FAMILY INCOME
$50,320
AVG HOUSEHOLD INCOME
9.0%
WAGE / INCOME GAP [ % ]
91.0¢/ $1
WAGE / INCOME GAP [ $ ]
0.49
INEQUALITY / GINI INDEX
3,528
TOTAL POPULATION
1,660
MALE POPULATION
1,868
FEMALE POPULATION
88.87
MALES / 100 FEMALES
112.53
FEMALES / 100 MALES
32.5
MEDIAN AGE
5.0
AVG FAMILY SIZE
3.6
AVG HOUSEHOLD SIZE
1,453
LABOR FORCE [ PEOPLE ]
52.3%
PERCENT IN LABOR FORCE
9.2%
UNEMPLOYMENT RATE
Fort Defiance Zip Codes
Fort Defiance Area Codes
Income in Fort Defiance
Income Overview in Fort Defiance
Per Capita Income in Fort Defiance is $21,793, while median incomes of families and households are $55,938 and $50,320 respectively.
| Characteristic | Number | Measure |
| Per Capita Income | 3,528 | $21,793 |
| Median Family Income | 619 | $55,938 |
| Mean Family Income | 619 | $73,591 |
| Median Household Income | 971 | $50,320 |
| Mean Household Income | 971 | $63,357 |
| Income Deficit | 619 | $0 |
| Wage / Income Gap (%) | 3,528 | 8.98% |
| Wage / Income Gap ($) | 3,528 | 91.02¢ per $1 |
| Gini / Inequality Index | 3,528 | 0.49 |
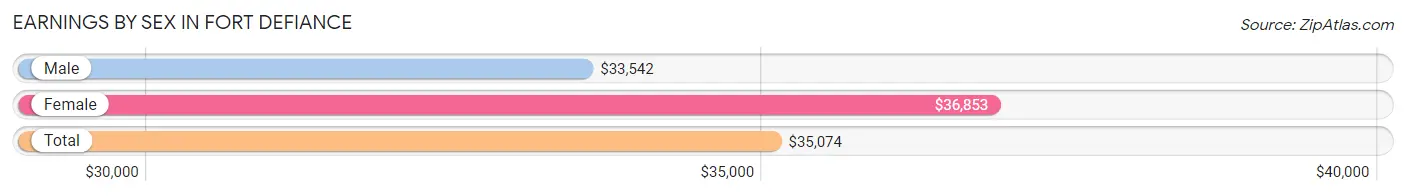
Earnings by Sex in Fort Defiance
Average Earnings in Fort Defiance are $35,074, $33,542 for men and $36,853 for women, a difference of 9.0%.
| Sex | Number | Average Earnings |
| Male | 697 (48.4%) | $33,542 |
| Female | 743 (51.6%) | $36,853 |
| Total | 1,440 (100.0%) | $35,074 |
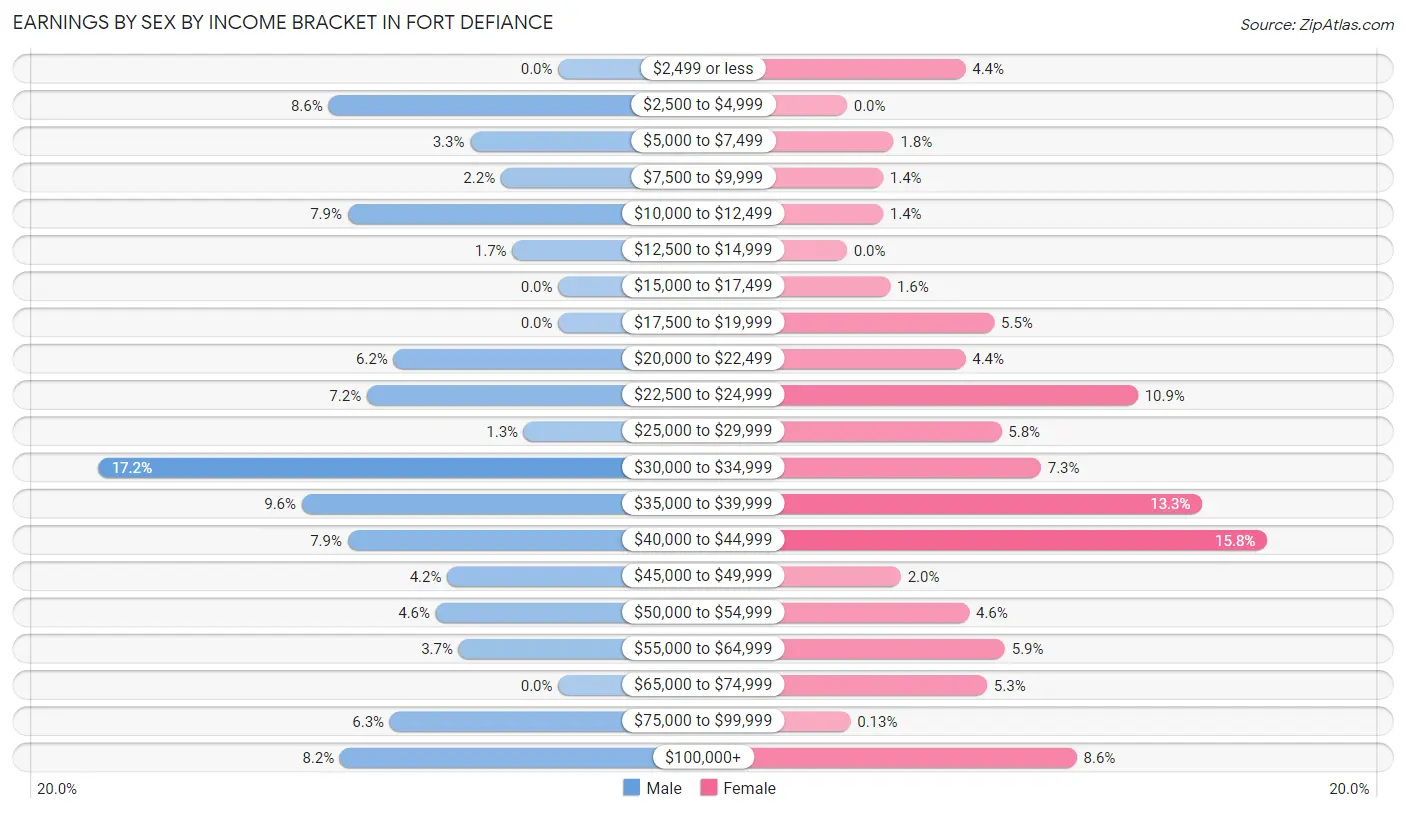
Earnings by Sex by Income Bracket in Fort Defiance
The most common earnings brackets in Fort Defiance are $30,000 to $34,999 for men (120 | 17.2%) and $40,000 to $44,999 for women (117 | 15.8%).
| Income | Male | Female |
| $2,499 or less | 0 (0.0%) | 33 (4.4%) |
| $2,500 to $4,999 | 60 (8.6%) | 0 (0.0%) |
| $5,000 to $7,499 | 23 (3.3%) | 13 (1.8%) |
| $7,500 to $9,999 | 15 (2.1%) | 10 (1.3%) |
| $10,000 to $12,499 | 55 (7.9%) | 10 (1.3%) |
| $12,500 to $14,999 | 12 (1.7%) | 0 (0.0%) |
| $15,000 to $17,499 | 0 (0.0%) | 12 (1.6%) |
| $17,500 to $19,999 | 0 (0.0%) | 41 (5.5%) |
| $20,000 to $22,499 | 43 (6.2%) | 33 (4.4%) |
| $22,500 to $24,999 | 50 (7.2%) | 81 (10.9%) |
| $25,000 to $29,999 | 9 (1.3%) | 43 (5.8%) |
| $30,000 to $34,999 | 120 (17.2%) | 54 (7.3%) |
| $35,000 to $39,999 | 67 (9.6%) | 99 (13.3%) |
| $40,000 to $44,999 | 55 (7.9%) | 117 (15.8%) |
| $45,000 to $49,999 | 29 (4.2%) | 15 (2.0%) |
| $50,000 to $54,999 | 32 (4.6%) | 34 (4.6%) |
| $55,000 to $64,999 | 26 (3.7%) | 44 (5.9%) |
| $65,000 to $74,999 | 0 (0.0%) | 39 (5.2%) |
| $75,000 to $99,999 | 44 (6.3%) | 1 (0.1%) |
| $100,000+ | 57 (8.2%) | 64 (8.6%) |
| Total | 697 (100.0%) | 743 (100.0%) |
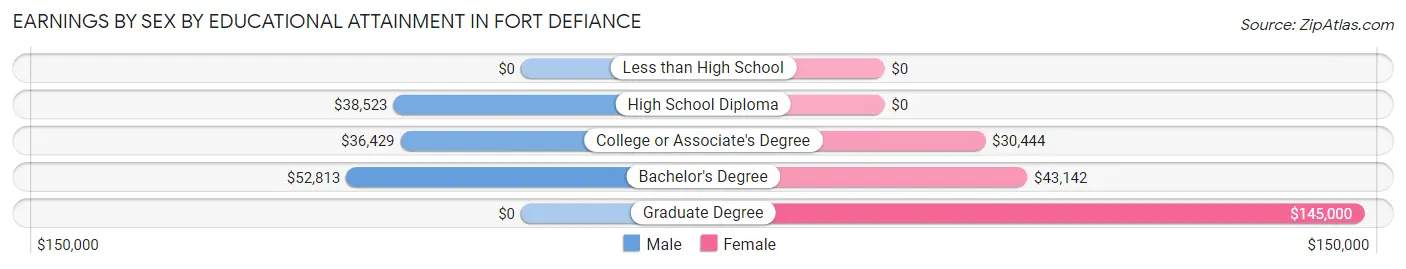
Earnings by Sex by Educational Attainment in Fort Defiance
Average earnings in Fort Defiance are $37,500 for men and $38,023 for women, a difference of 1.4%. Men with an educational attainment of bachelor's degree enjoy the highest average annual earnings of $52,813, while those with college or associate's degree education earn the least with $36,429. Women with an educational attainment of graduate degree earn the most with the average annual earnings of $145,000, while those with college or associate's degree education have the smallest earnings of $30,444.
| Educational Attainment | Male Income | Female Income |
| Less than High School | - | - |
| High School Diploma | $38,523 | $0 |
| College or Associate's Degree | $36,429 | $30,444 |
| Bachelor's Degree | $52,813 | $43,142 |
| Graduate Degree | - | - |
| Total | $37,500 | $38,023 |
Family Income in Fort Defiance
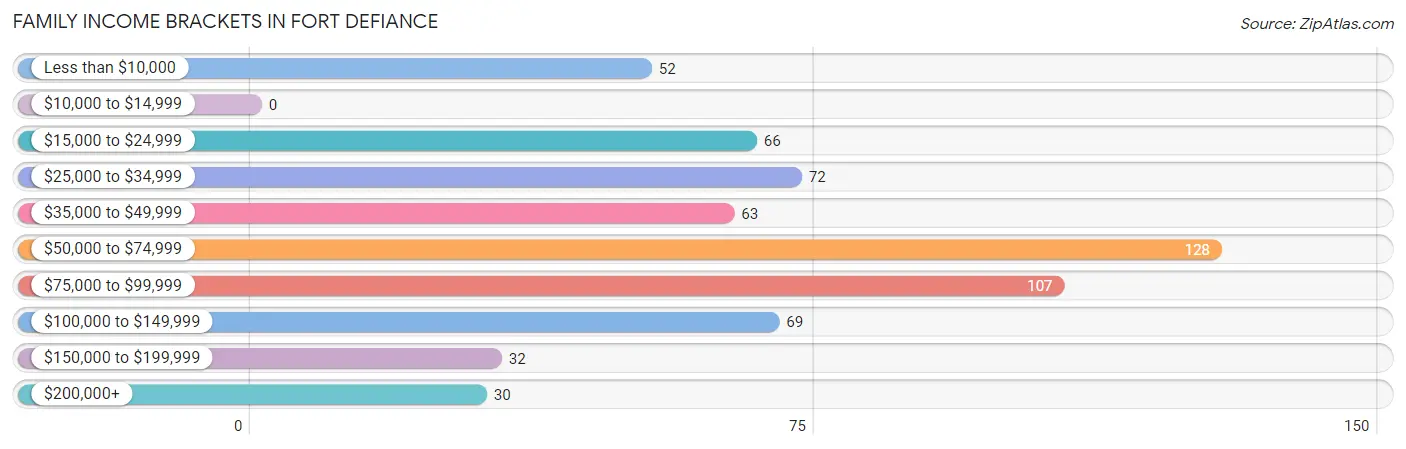
Family Income Brackets in Fort Defiance
According to the Fort Defiance family income data, there are 128 families falling into the $50,000 to $74,999 income range, which is the most common income bracket and makes up 20.7% of all families.
| Income Bracket | # Families | % Families |
| Less than $10,000 | 52 | 8.4% |
| $10,000 to $14,999 | 0 | 0.0% |
| $15,000 to $24,999 | 66 | 10.7% |
| $25,000 to $34,999 | 72 | 11.6% |
| $35,000 to $49,999 | 63 | 10.2% |
| $50,000 to $74,999 | 128 | 20.7% |
| $75,000 to $99,999 | 107 | 17.3% |
| $100,000 to $149,999 | 69 | 11.1% |
| $150,000 to $199,999 | 32 | 5.2% |
| $200,000+ | 30 | 4.8% |
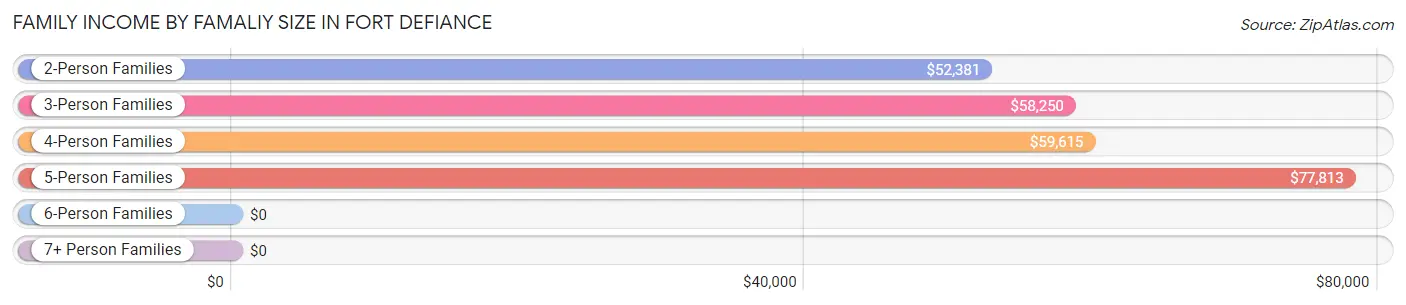
Family Income by Famaliy Size in Fort Defiance
5-person families (48 | 7.7%) account for the highest median family income in Fort Defiance with $77,813 per family, while 2-person families (218 | 35.2%) have the highest median income of $26,190 per family member.
| Income Bracket | # Families | Median Income |
| 2-Person Families | 218 (35.2%) | $52,381 |
| 3-Person Families | 178 (28.8%) | $58,250 |
| 4-Person Families | 90 (14.5%) | $59,615 |
| 5-Person Families | 48 (7.7%) | $77,813 |
| 6-Person Families | 54 (8.7%) | $0 |
| 7+ Person Families | 31 (5.0%) | $0 |
| Total | 619 (100.0%) | $55,938 |
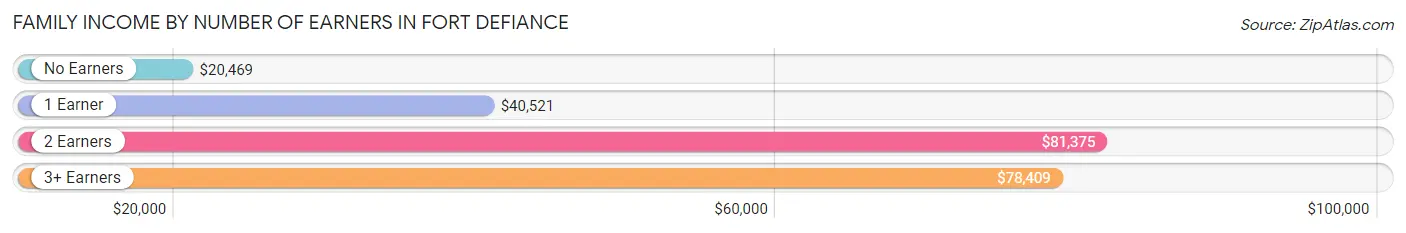
Family Income by Number of Earners in Fort Defiance
The median family income in Fort Defiance is $55,938, with families comprising 2 earners (167) having the highest median family income of $81,375, while families with no earners (92) have the lowest median family income of $20,469, accounting for 27.0% and 14.9% of families, respectively.
| Number of Earners | # Families | Median Income |
| No Earners | 92 (14.9%) | $20,469 |
| 1 Earner | 308 (49.8%) | $40,521 |
| 2 Earners | 167 (27.0%) | $81,375 |
| 3+ Earners | 52 (8.4%) | $78,409 |
| Total | 619 (100.0%) | $55,938 |
Household Income in Fort Defiance
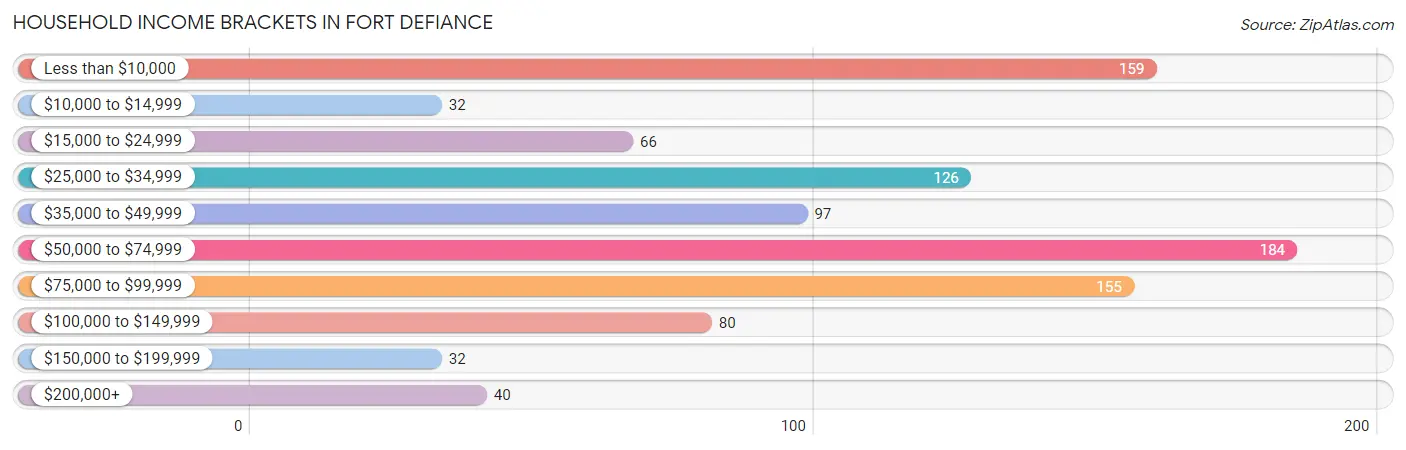
Household Income Brackets in Fort Defiance
With 184 households falling in the category, the $50,000 to $74,999 income range is the most frequent in Fort Defiance, accounting for 19.0% of all households. In contrast, only 32 households (3.3%) fall into the $10,000 to $14,999 income bracket, making it the least populous group.
| Income Bracket | # Households | % Households |
| Less than $10,000 | 159 | 16.4% |
| $10,000 to $14,999 | 32 | 3.3% |
| $15,000 to $24,999 | 66 | 6.8% |
| $25,000 to $34,999 | 126 | 13.0% |
| $35,000 to $49,999 | 97 | 10.0% |
| $50,000 to $74,999 | 184 | 18.9% |
| $75,000 to $99,999 | 155 | 16.0% |
| $100,000 to $149,999 | 80 | 8.2% |
| $150,000 to $199,999 | 32 | 3.3% |
| $200,000+ | 40 | 4.1% |
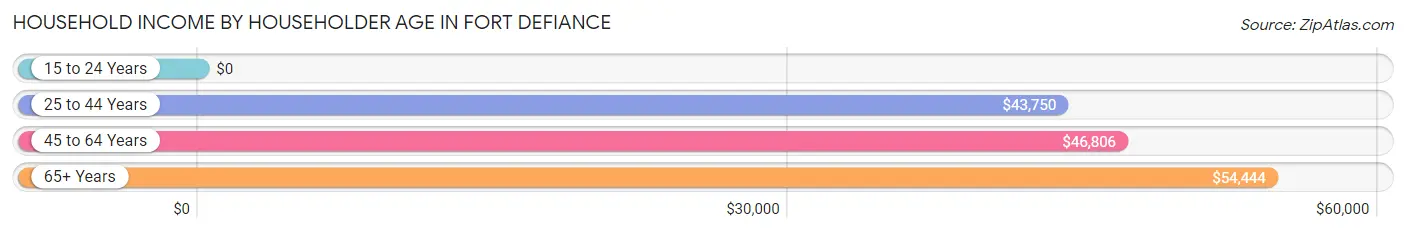
Household Income by Householder Age in Fort Defiance
The median household income in Fort Defiance is $50,320, with the highest median household income of $54,444 found in the 65+ years age bracket for the primary householder. A total of 252 households (26.0%) fall into this category. Meanwhile, the 15 to 24 years age bracket for the primary householder has the lowest median household income of $0, with 30 households (3.1%) in this group.
| Income Bracket | # Households | Median Income |
| 15 to 24 Years | 30 (3.1%) | $0 |
| 25 to 44 Years | 168 (17.3%) | $43,750 |
| 45 to 64 Years | 521 (53.7%) | $46,806 |
| 65+ Years | 252 (26.0%) | $54,444 |
| Total | 971 (100.0%) | $50,320 |
Poverty in Fort Defiance
Income Below Poverty by Sex and Age in Fort Defiance
With 24.8% poverty level for males and 29.0% for females among the residents of Fort Defiance, 6 to 11 year old males and 5 year old females are the most vulnerable to poverty, with 63 males (49.2%) and 18 females (100.0%) in their respective age groups living below the poverty level.
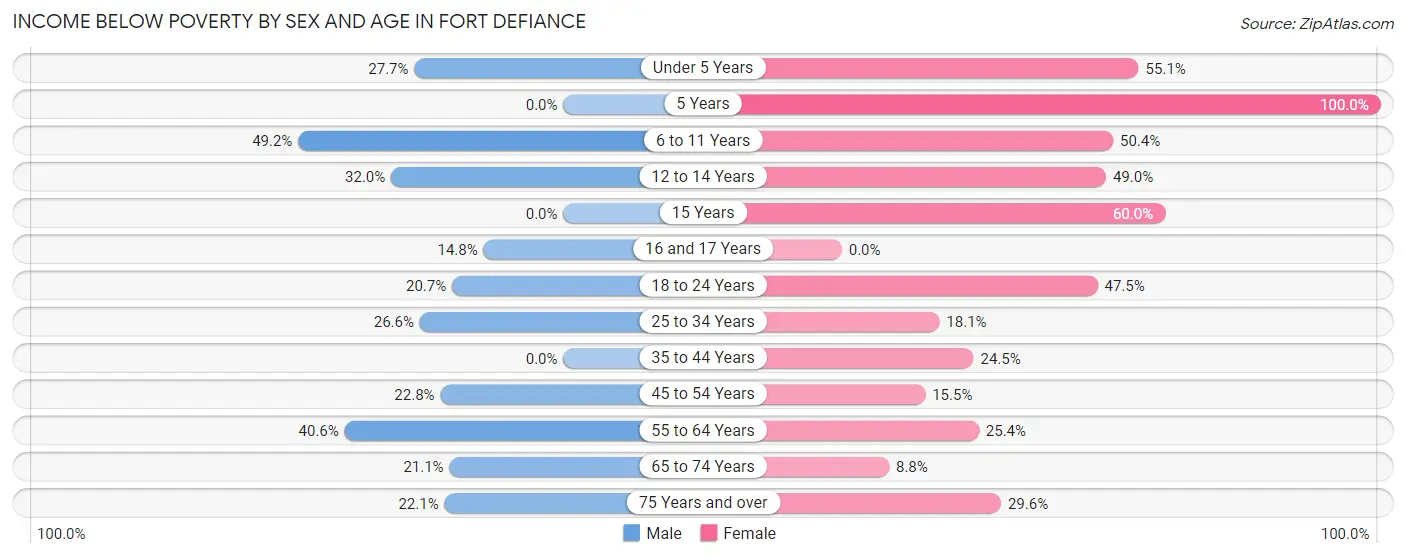
| Age Bracket | Male | Female |
| Under 5 Years | 26 (27.7%) | 27 (55.1%) |
| 5 Years | 0 (0.0%) | 18 (100.0%) |
| 6 to 11 Years | 63 (49.2%) | 72 (50.3%) |
| 12 to 14 Years | 47 (32.0%) | 51 (49.0%) |
| 15 Years | 0 (0.0%) | 15 (60.0%) |
| 16 and 17 Years | 12 (14.8%) | 0 (0.0%) |
| 18 to 24 Years | 56 (20.7%) | 103 (47.5%) |
| 25 to 34 Years | 65 (26.6%) | 58 (18.1%) |
| 35 to 44 Years | 0 (0.0%) | 57 (24.5%) |
| 45 to 54 Years | 34 (22.8%) | 33 (15.5%) |
| 55 to 64 Years | 67 (40.6%) | 72 (25.4%) |
| 65 to 74 Years | 26 (21.1%) | 10 (8.8%) |
| 75 Years and over | 15 (22.1%) | 26 (29.5%) |
| Total | 411 (24.8%) | 542 (29.0%) |
Income Above Poverty by Sex and Age in Fort Defiance
According to the poverty statistics in Fort Defiance, males aged 15 years and females aged 16 and 17 years are the age groups that are most secure financially, with 100.0% of males and 100.0% of females in these age groups living above the poverty line.
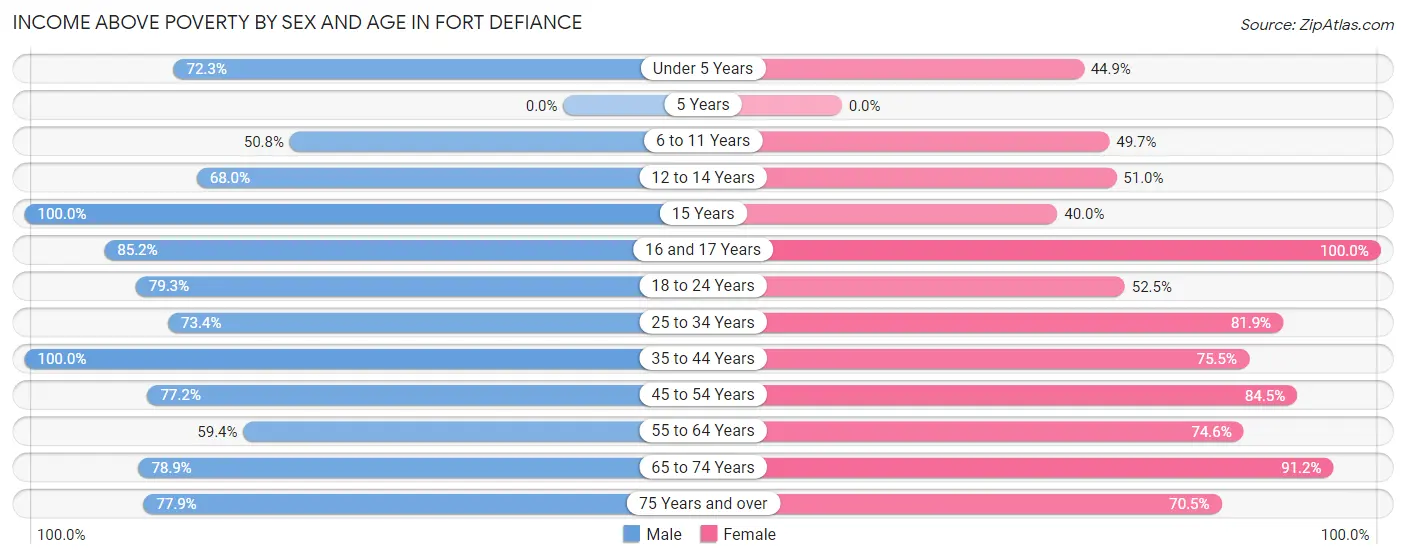
| Age Bracket | Male | Female |
| Under 5 Years | 68 (72.3%) | 22 (44.9%) |
| 5 Years | 0 (0.0%) | 0 (0.0%) |
| 6 to 11 Years | 65 (50.8%) | 71 (49.6%) |
| 12 to 14 Years | 100 (68.0%) | 53 (51.0%) |
| 15 Years | 42 (100.0%) | 10 (40.0%) |
| 16 and 17 Years | 69 (85.2%) | 61 (100.0%) |
| 18 to 24 Years | 215 (79.3%) | 114 (52.5%) |
| 25 to 34 Years | 179 (73.4%) | 262 (81.9%) |
| 35 to 44 Years | 145 (100.0%) | 176 (75.5%) |
| 45 to 54 Years | 115 (77.2%) | 180 (84.5%) |
| 55 to 64 Years | 98 (59.4%) | 211 (74.6%) |
| 65 to 74 Years | 97 (78.9%) | 104 (91.2%) |
| 75 Years and over | 53 (77.9%) | 62 (70.5%) |
| Total | 1,246 (75.2%) | 1,326 (71.0%) |
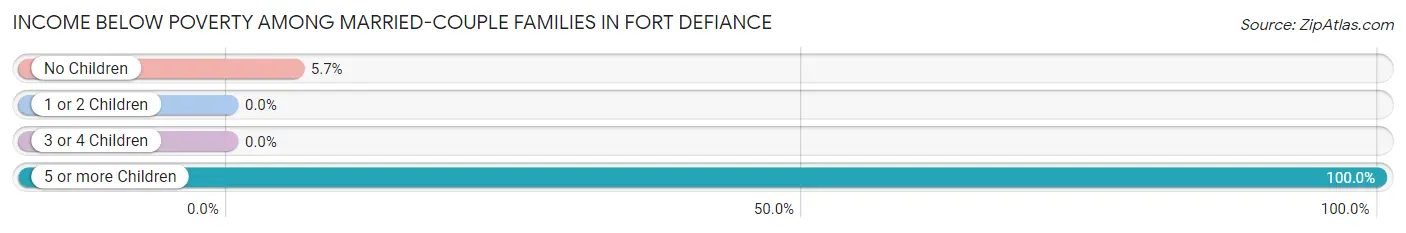
Income Below Poverty Among Married-Couple Families in Fort Defiance
The poverty statistics for married-couple families in Fort Defiance show that 9.0% or 19 of the total 212 families live below the poverty line. Families with 5 or more children have the highest poverty rate of 100.0%, comprising of 10 families. On the other hand, families with 1 or 2 children have the lowest poverty rate of 0.0%, which includes 0 families.
| Children | Above Poverty | Below Poverty |
| No Children | 148 (94.3%) | 9 (5.7%) |
| 1 or 2 Children | 34 (100.0%) | 0 (0.0%) |
| 3 or 4 Children | 11 (100.0%) | 0 (0.0%) |
| 5 or more Children | 0 (0.0%) | 10 (100.0%) |
| Total | 193 (91.0%) | 19 (9.0%) |
Income Below Poverty Among Single-Parent Households in Fort Defiance
According to the poverty data in Fort Defiance, 15.1% or 11 single-father households and 21.6% or 72 single-mother households are living below the poverty line. Among single-father households, those with no children have the highest poverty rate, with 11 households (20.7%) experiencing poverty. Likewise, among single-mother households, those with 5 or more children have the highest poverty rate, with 23 households (100.0%) falling below the poverty line.
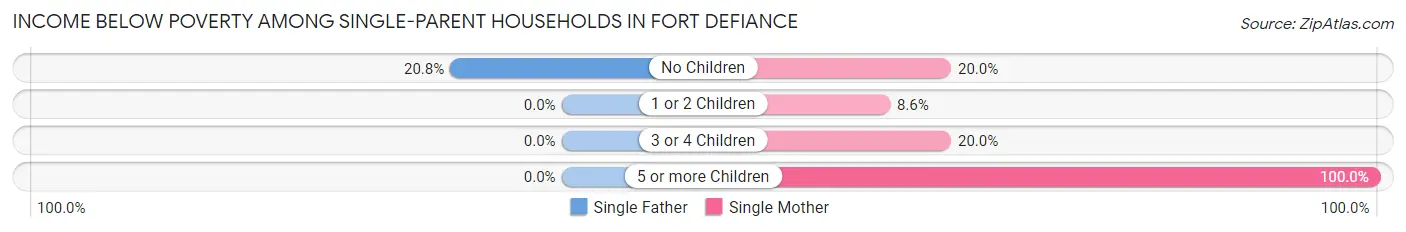
| Children | Single Father | Single Mother |
| No Children | 11 (20.7%) | 28 (20.0%) |
| 1 or 2 Children | 0 (0.0%) | 10 (8.6%) |
| 3 or 4 Children | 0 (0.0%) | 11 (20.0%) |
| 5 or more Children | 0 (0.0%) | 23 (100.0%) |
| Total | 11 (15.1%) | 72 (21.6%) |
Income Below Poverty Among Married-Couple vs Single-Parent Households in Fort Defiance
The poverty data for Fort Defiance shows that 19 of the married-couple family households (9.0%) and 83 of the single-parent households (20.4%) are living below the poverty level. Within the married-couple family households, those with 5 or more children have the highest poverty rate, with 10 households (100.0%) falling below the poverty line. Among the single-parent households, those with 5 or more children have the highest poverty rate, with 23 household (100.0%) living below poverty.
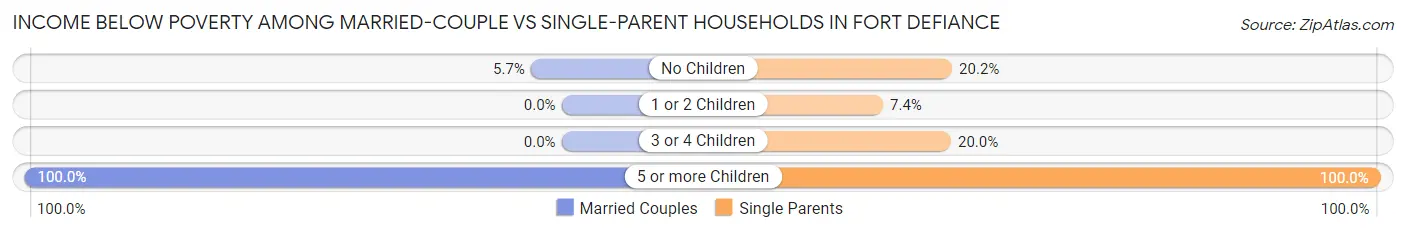
| Children | Married-Couple Families | Single-Parent Households |
| No Children | 9 (5.7%) | 39 (20.2%) |
| 1 or 2 Children | 0 (0.0%) | 10 (7.3%) |
| 3 or 4 Children | 0 (0.0%) | 11 (20.0%) |
| 5 or more Children | 10 (100.0%) | 23 (100.0%) |
| Total | 19 (9.0%) | 83 (20.4%) |
Race in Fort Defiance
The most populous races in Fort Defiance are Native / Alaskan (3,214 | 91.1%), Hispanic or Latino (130 | 3.7%), and Two or more Races (109 | 3.1%).
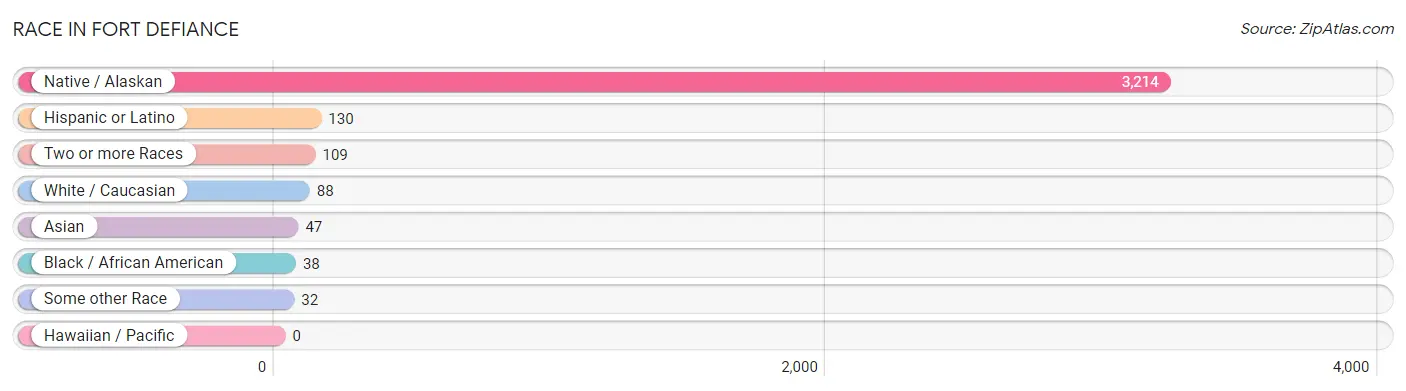
| Race | # Population | % Population |
| Asian | 47 | 1.3% |
| Black / African American | 38 | 1.1% |
| Hawaiian / Pacific | 0 | 0.0% |
| Hispanic or Latino | 130 | 3.7% |
| Native / Alaskan | 3,214 | 91.1% |
| White / Caucasian | 88 | 2.5% |
| Two or more Races | 109 | 3.1% |
| Some other Race | 32 | 0.9% |
| Total | 3,528 | 100.0% |
Ancestry in Fort Defiance
The most populous ancestries reported in Fort Defiance are Navajo (3,205 | 90.8%), Pueblo (83 | 2.4%), Mexican (81 | 2.3%), Hopi (55 | 1.6%), and Sri Lankan (37 | 1.1%), together accounting for 98.1% of all Fort Defiance residents.
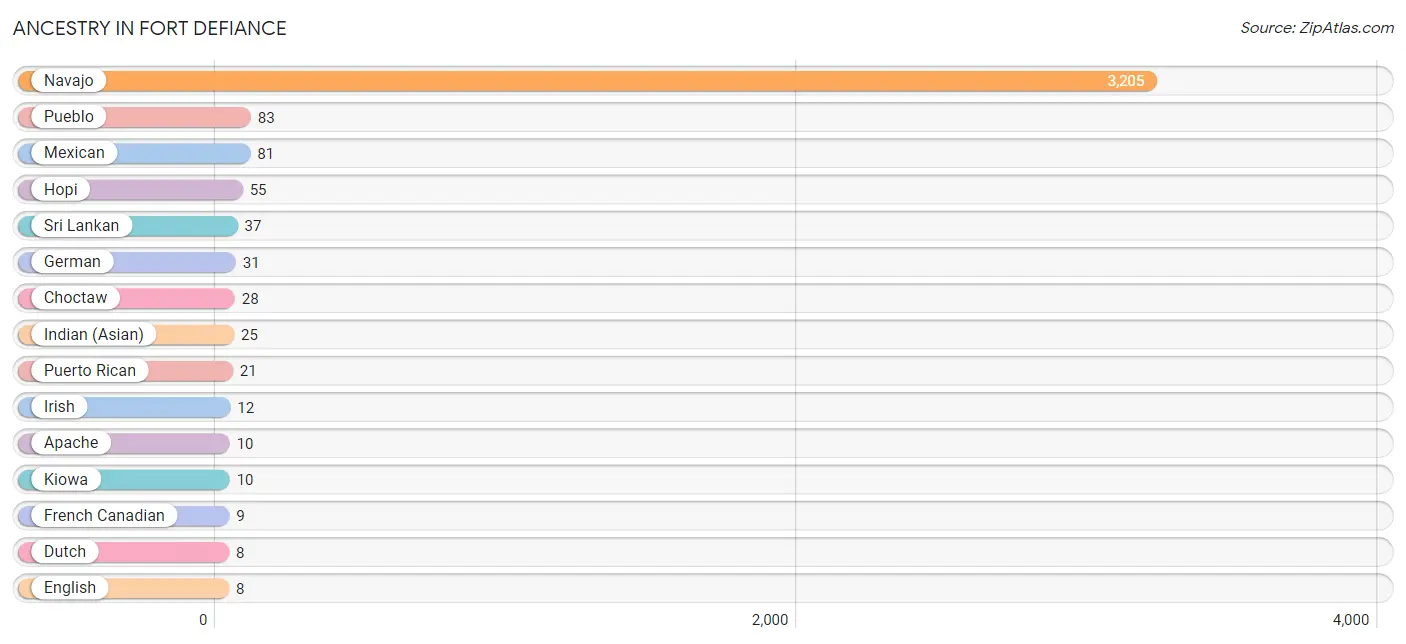
| Ancestry | # Population | % Population |
| Apache | 10 | 0.3% |
| Choctaw | 28 | 0.8% |
| Dutch | 8 | 0.2% |
| English | 8 | 0.2% |
| French Canadian | 9 | 0.3% |
| German | 31 | 0.9% |
| Hopi | 55 | 1.6% |
| Indian (Asian) | 25 | 0.7% |
| Irish | 12 | 0.3% |
| Kiowa | 10 | 0.3% |
| Mexican | 81 | 2.3% |
| Navajo | 3,205 | 90.8% |
| Pueblo | 83 | 2.4% |
| Puerto Rican | 21 | 0.6% |
| Scotch-Irish | 8 | 0.2% |
| Sri Lankan | 37 | 1.1% | View All 16 Rows |
Immigrants in Fort Defiance
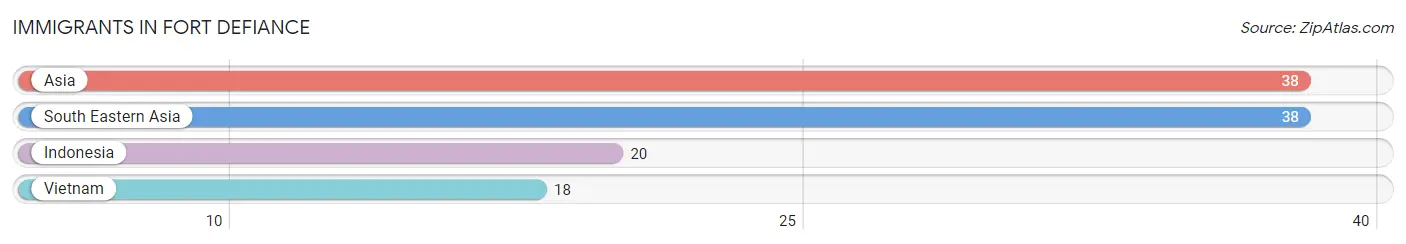
The most numerous immigrant groups reported in Fort Defiance came from Asia (38 | 1.1%), South Eastern Asia (38 | 1.1%), Indonesia (20 | 0.6%), and Vietnam (18 | 0.5%), together accounting for 3.2% of all Fort Defiance residents.
| Immigration Origin | # Population | % Population |
| Asia | 38 | 1.1% |
| Indonesia | 20 | 0.6% |
| South Eastern Asia | 38 | 1.1% |
| Vietnam | 18 | 0.5% | View All 4 Rows |
Sex and Age in Fort Defiance
Sex and Age in Fort Defiance
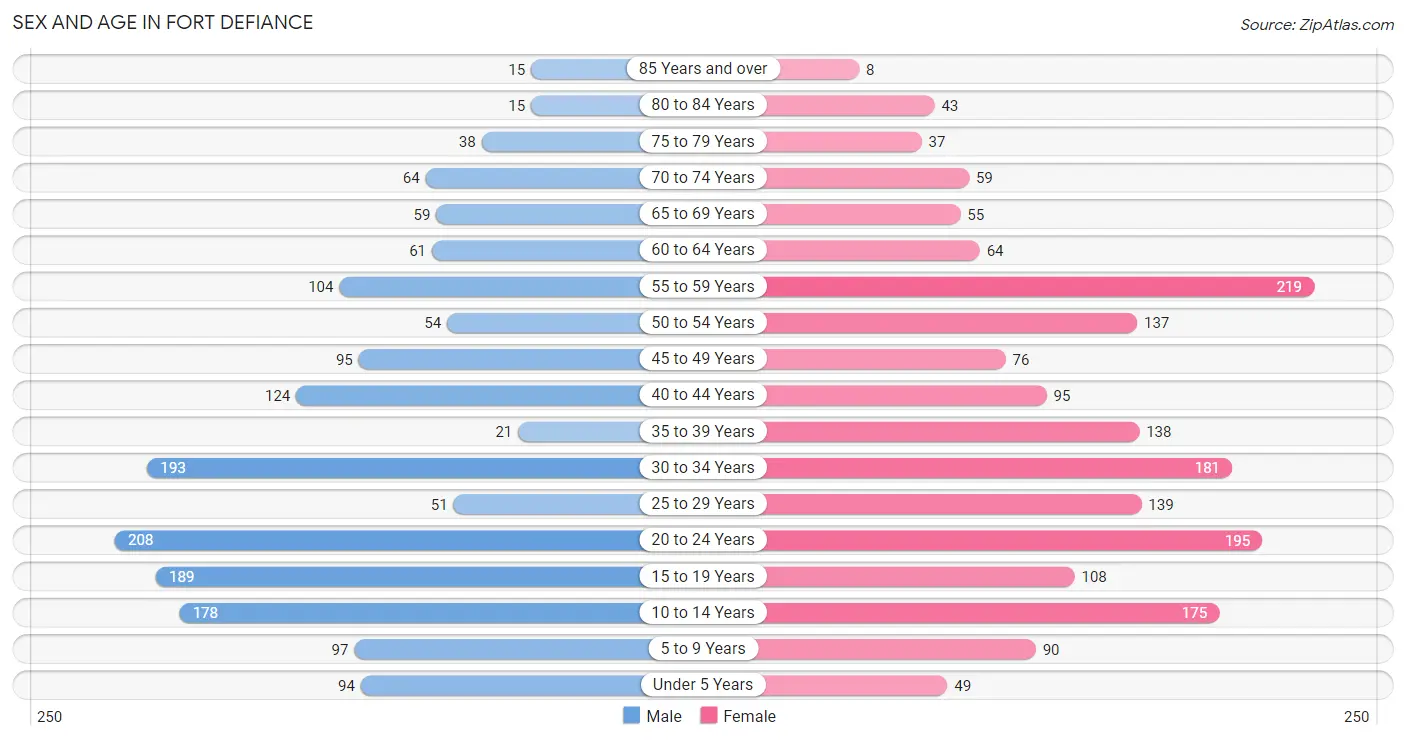
The most populous age groups in Fort Defiance are 20 to 24 Years (208 | 12.5%) for men and 55 to 59 Years (219 | 11.7%) for women.
| Age Bracket | Male | Female |
| Under 5 Years | 94 (5.7%) | 49 (2.6%) |
| 5 to 9 Years | 97 (5.8%) | 90 (4.8%) |
| 10 to 14 Years | 178 (10.7%) | 175 (9.4%) |
| 15 to 19 Years | 189 (11.4%) | 108 (5.8%) |
| 20 to 24 Years | 208 (12.5%) | 195 (10.4%) |
| 25 to 29 Years | 51 (3.1%) | 139 (7.4%) |
| 30 to 34 Years | 193 (11.6%) | 181 (9.7%) |
| 35 to 39 Years | 21 (1.3%) | 138 (7.4%) |
| 40 to 44 Years | 124 (7.5%) | 95 (5.1%) |
| 45 to 49 Years | 95 (5.7%) | 76 (4.1%) |
| 50 to 54 Years | 54 (3.3%) | 137 (7.3%) |
| 55 to 59 Years | 104 (6.3%) | 219 (11.7%) |
| 60 to 64 Years | 61 (3.7%) | 64 (3.4%) |
| 65 to 69 Years | 59 (3.5%) | 55 (2.9%) |
| 70 to 74 Years | 64 (3.9%) | 59 (3.2%) |
| 75 to 79 Years | 38 (2.3%) | 37 (2.0%) |
| 80 to 84 Years | 15 (0.9%) | 43 (2.3%) |
| 85 Years and over | 15 (0.9%) | 8 (0.4%) |
| Total | 1,660 (100.0%) | 1,868 (100.0%) |
Families and Households in Fort Defiance
Median Family Size in Fort Defiance
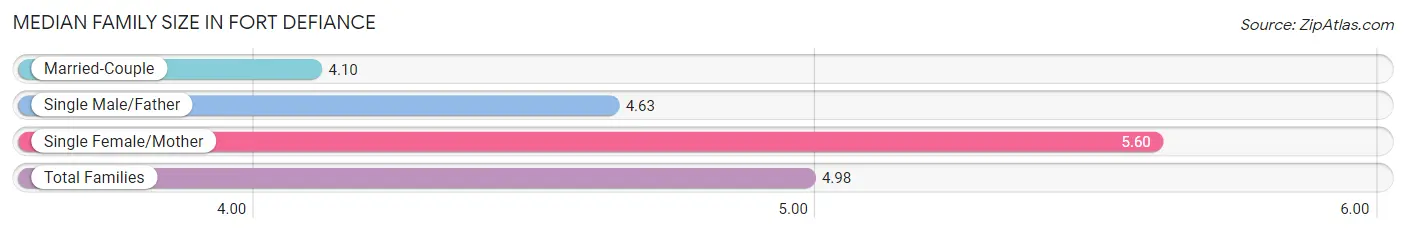
The median family size in Fort Defiance is 4.98 persons per family, with single female/mother families (334 | 54.0%) accounting for the largest median family size of 5.6 persons per family. On the other hand, married-couple families (212 | 34.3%) represent the smallest median family size with 4.10 persons per family.
| Family Type | # Families | Family Size |
| Married-Couple | 212 (34.3%) | 4.10 |
| Single Male/Father | 73 (11.8%) | 4.63 |
| Single Female/Mother | 334 (54.0%) | 5.60 |
| Total Families | 619 (100.0%) | 4.98 |
Median Household Size in Fort Defiance
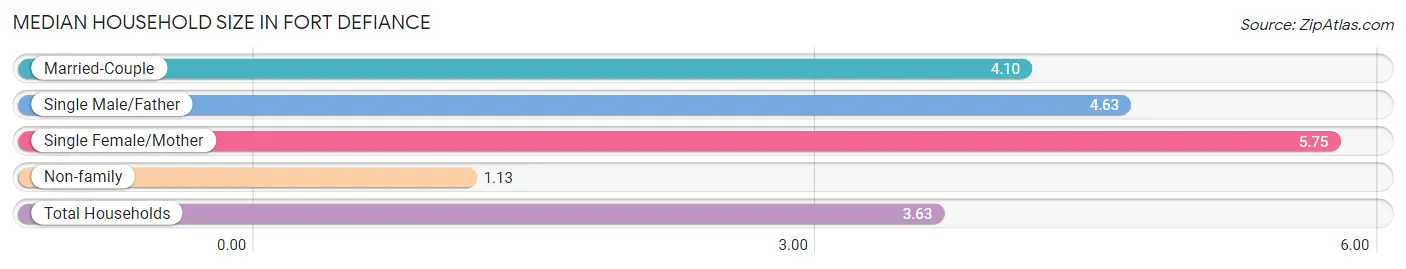
The median household size in Fort Defiance is 3.63 persons per household, with single female/mother households (334 | 34.4%) accounting for the largest median household size of 5.75 persons per household. non-family households (352 | 36.2%) represent the smallest median household size with 1.13 persons per household.
| Household Type | # Households | Household Size |
| Married-Couple | 212 (21.8%) | 4.10 |
| Single Male/Father | 73 (7.5%) | 4.63 |
| Single Female/Mother | 334 (34.4%) | 5.75 |
| Non-family | 352 (36.2%) | 1.13 |
| Total Households | 971 (100.0%) | 3.63 |
Household Size by Marriage Status in Fort Defiance
Out of a total of 971 households in Fort Defiance, 619 (63.7%) are family households, while 352 (36.2%) are nonfamily households. The most numerous type of family households are 2-person households, comprising 214, and the most common type of nonfamily households are 1-person households, comprising 318.
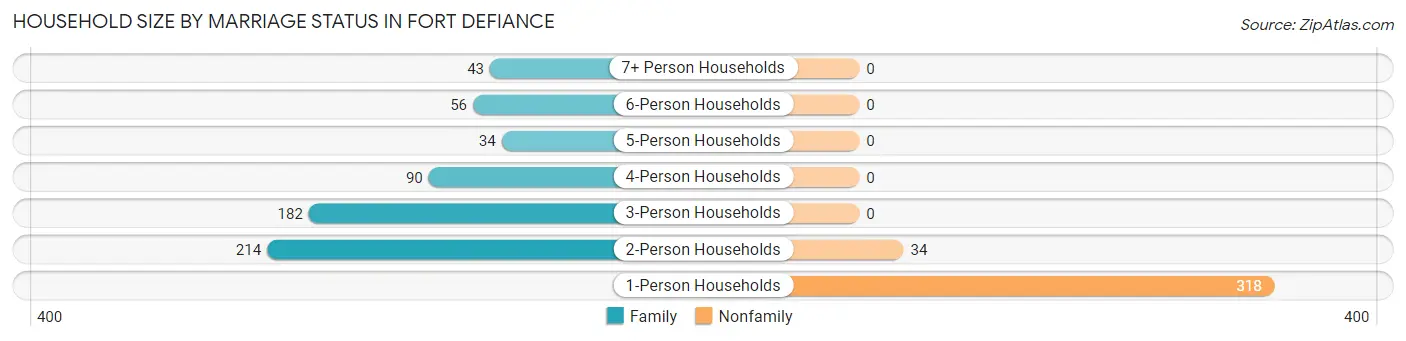
| Household Size | Family Households | Nonfamily Households |
| 1-Person Households | - | 318 (32.8%) |
| 2-Person Households | 214 (22.0%) | 34 (3.5%) |
| 3-Person Households | 182 (18.7%) | 0 (0.0%) |
| 4-Person Households | 90 (9.3%) | 0 (0.0%) |
| 5-Person Households | 34 (3.5%) | 0 (0.0%) |
| 6-Person Households | 56 (5.8%) | 0 (0.0%) |
| 7+ Person Households | 43 (4.4%) | 0 (0.0%) |
| Total | 619 (63.7%) | 352 (36.2%) |
Female Fertility in Fort Defiance
Fertility by Age in Fort Defiance
Average fertility rate in Fort Defiance is 112.0 births per 1,000 women. Women in the age bracket of 20 to 34 years have the highest fertility rate with 208.0 births per 1,000 women. Women in the age bracket of 20 to 34 years acount for 100.0% of all women with births.
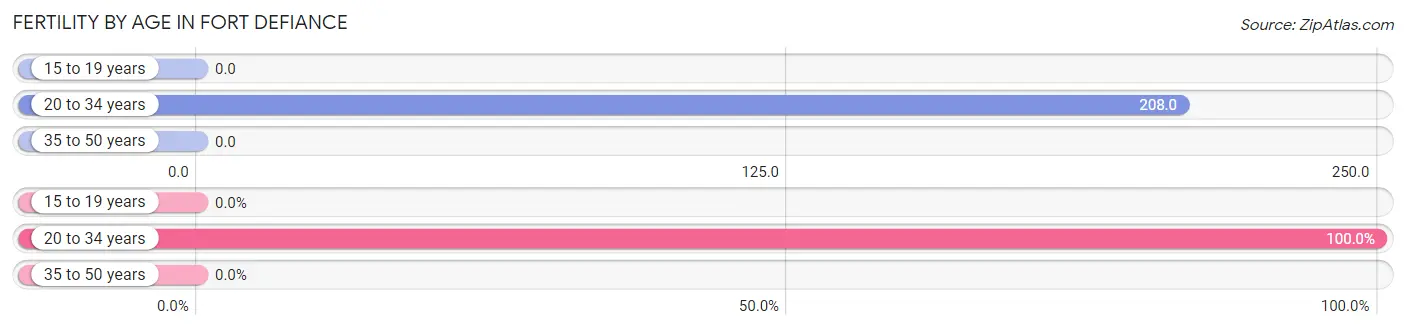
| Age Bracket | Women with Births | Births / 1,000 Women |
| 15 to 19 years | 0 (0.0%) | 0.0 |
| 20 to 34 years | 107 (100.0%) | 208.0 |
| 35 to 50 years | 0 (0.0%) | 0.0 |
| Total | 107 (100.0%) | 112.0 |
Fertility by Age by Marriage Status in Fort Defiance
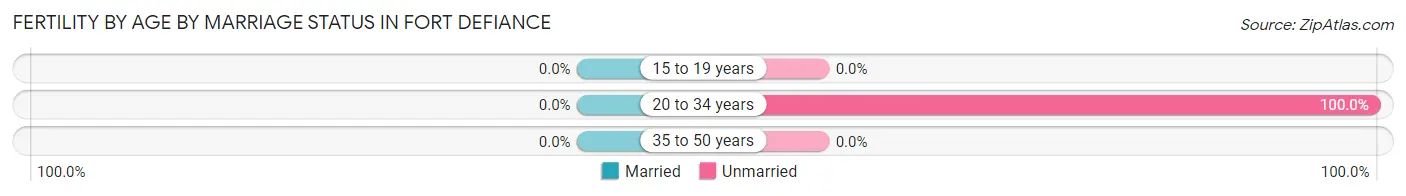
| Age Bracket | Married | Unmarried |
| 15 to 19 years | 0 (0.0%) | 0 (0.0%) |
| 20 to 34 years | 0 (0.0%) | 107 (100.0%) |
| 35 to 50 years | 0 (0.0%) | 0 (0.0%) |
| Total | 0 (0.0%) | 107 (100.0%) |
Fertility by Education in Fort Defiance
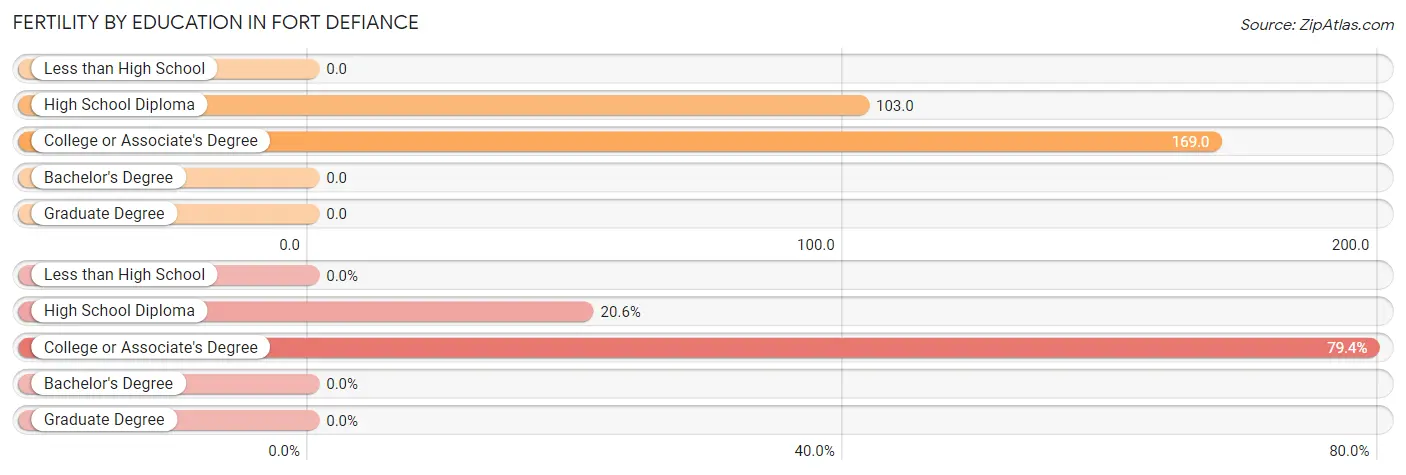
| Educational Attainment | Women with Births | Births / 1,000 Women |
| Less than High School | 0 (0.0%) | 0.0 |
| High School Diploma | 22 (20.6%) | 103.0 |
| College or Associate's Degree | 85 (79.4%) | 169.0 |
| Bachelor's Degree | 0 (0.0%) | 0.0 |
| Graduate Degree | 0 (0.0%) | 0.0 |
| Total | 107 (100.0%) | 112.0 |
Fertility by Education by Marriage Status in Fort Defiance
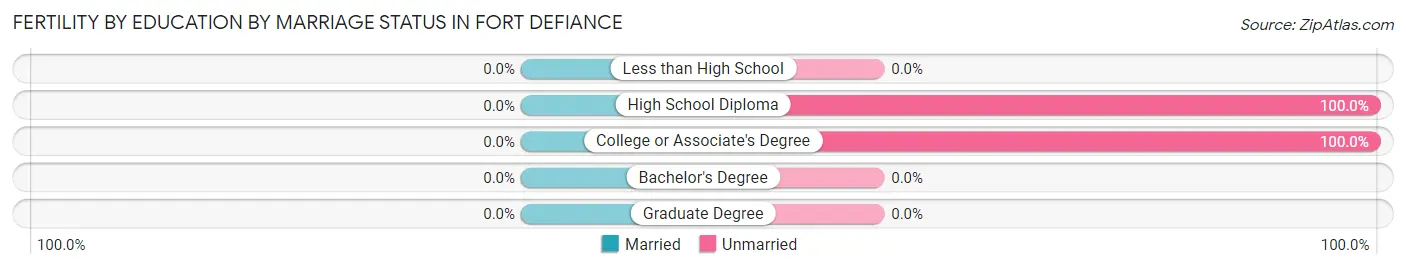
| Educational Attainment | Married | Unmarried |
| Less than High School | 0 (0.0%) | 0 (0.0%) |
| High School Diploma | 0 (0.0%) | 22 (100.0%) |
| College or Associate's Degree | 0 (0.0%) | 85 (100.0%) |
| Bachelor's Degree | 0 (0.0%) | 0 (0.0%) |
| Graduate Degree | 0 (0.0%) | 0 (0.0%) |
| Total | 0 (0.0%) | 107 (100.0%) |
Employment Characteristics in Fort Defiance
Employment by Class of Employer in Fort Defiance
Among the 1,317 employed individuals in Fort Defiance, private company employees (585 | 44.4%), federal government employees (248 | 18.8%), and state government employees (232 | 17.6%) make up the most common classes of employment.
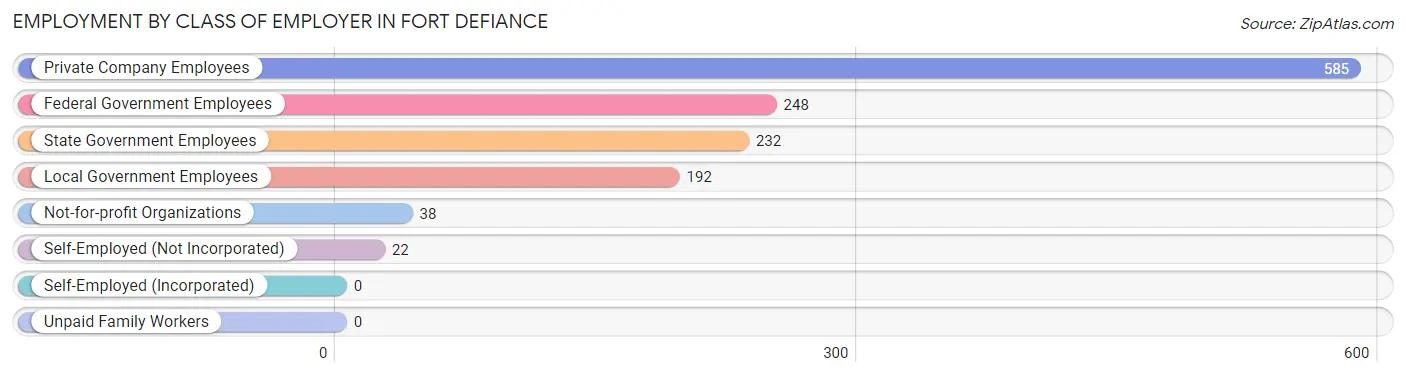
| Employer Class | # Employees | % Employees |
| Private Company Employees | 585 | 44.4% |
| Self-Employed (Incorporated) | 0 | 0.0% |
| Self-Employed (Not Incorporated) | 22 | 1.7% |
| Not-for-profit Organizations | 38 | 2.9% |
| Local Government Employees | 192 | 14.6% |
| State Government Employees | 232 | 17.6% |
| Federal Government Employees | 248 | 18.8% |
| Unpaid Family Workers | 0 | 0.0% |
| Total | 1,317 | 100.0% |
Employment Status by Age in Fort Defiance
According to the labor force statistics for Fort Defiance, out of the total population over 16 years of age (2,778), 52.3% or 1,453 individuals are in the labor force, with 9.2% or 134 of them unemployed. The age group with the highest labor force participation rate is 25 to 29 years, with 83.7% or 159 individuals in the labor force. Within the labor force, the 16 to 19 years age range has the highest percentage of unemployed individuals, with 100.0% or 16 of them being unemployed.
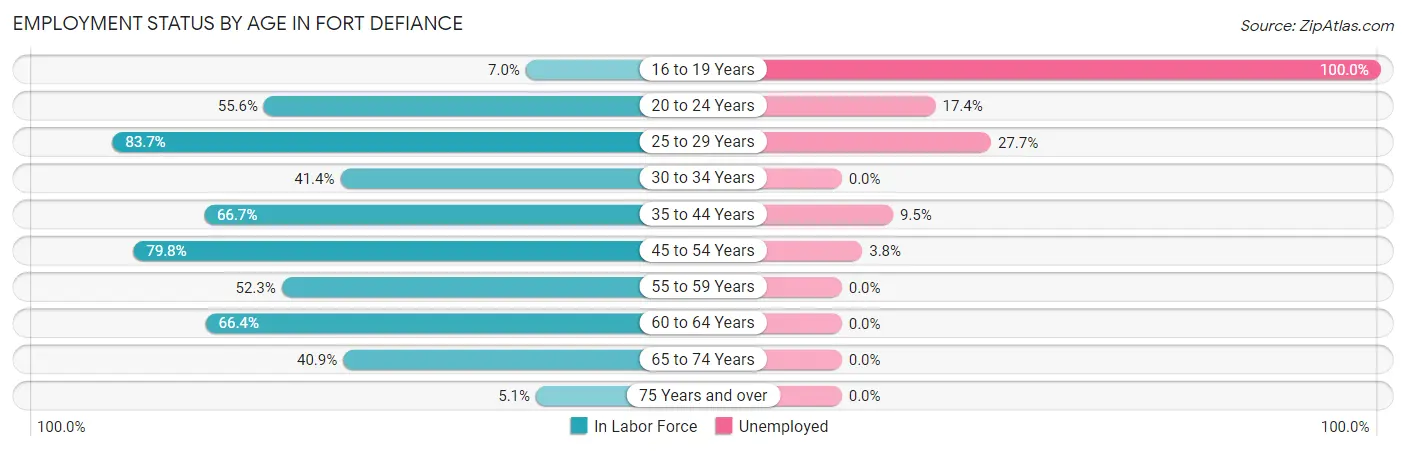
| Age Bracket | In Labor Force | Unemployed |
| 16 to 19 Years | 16 (7.0%) | 16 (100.0%) |
| 20 to 24 Years | 224 (55.6%) | 39 (17.4%) |
| 25 to 29 Years | 159 (83.7%) | 44 (27.7%) |
| 30 to 34 Years | 155 (41.4%) | 0 (0.0%) |
| 35 to 44 Years | 252 (66.7%) | 24 (9.5%) |
| 45 to 54 Years | 289 (79.8%) | 11 (3.8%) |
| 55 to 59 Years | 169 (52.3%) | 0 (0.0%) |
| 60 to 64 Years | 83 (66.4%) | 0 (0.0%) |
| 65 to 74 Years | 97 (40.9%) | 0 (0.0%) |
| 75 Years and over | 8 (5.1%) | 0 (0.0%) |
| Total | 1,453 (52.3%) | 134 (9.2%) |
Employment Status by Educational Attainment in Fort Defiance
According to labor force statistics for Fort Defiance, 63.2% of individuals (1,107) out of the total population between 25 and 64 years of age (1,752) are in the labor force, with 7.1% or 79 of them being unemployed. The group with the highest labor force participation rate are those with the educational attainment of bachelor's degree or higher, with 100.0% or 276 individuals in the labor force. Within the labor force, individuals with high school diploma education have the highest percentage of unemployment, with 17.1% or 55 of them being unemployed.
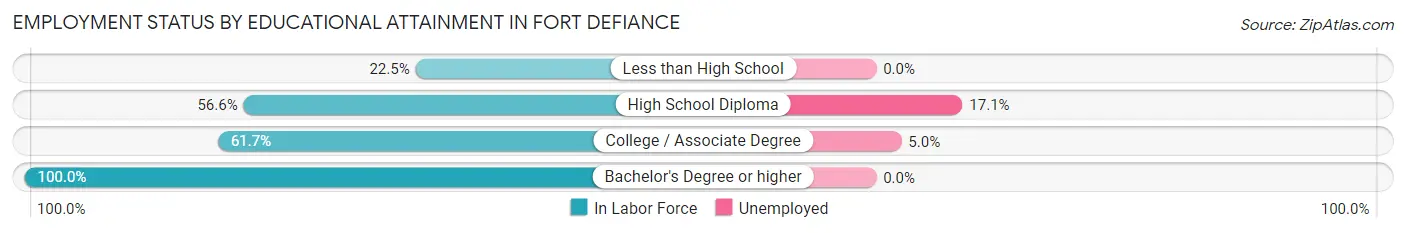
| Educational Attainment | In Labor Force | Unemployed |
| Less than High School | 29 (22.5%) | 0 (0.0%) |
| High School Diploma | 321 (56.6%) | 97 (17.1%) |
| College / Associate Degree | 481 (61.7%) | 39 (5.0%) |
| Bachelor's Degree or higher | 276 (100.0%) | 0 (0.0%) |
| Total | 1,107 (63.2%) | 124 (7.1%) |
Employment Occupations by Sex in Fort Defiance
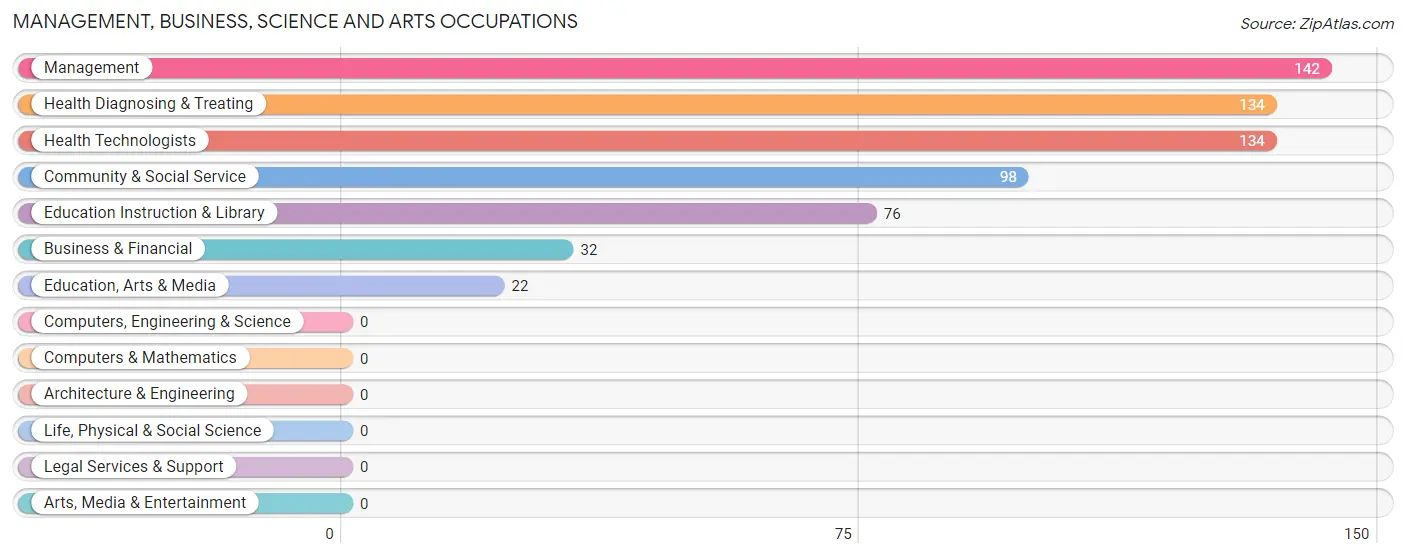
Management, Business, Science and Arts Occupations
The most common Management, Business, Science and Arts occupations in Fort Defiance are Management (142 | 10.8%), Health Diagnosing & Treating (134 | 10.2%), Health Technologists (134 | 10.2%), Community & Social Service (98 | 7.4%), and Education Instruction & Library (76 | 5.8%).
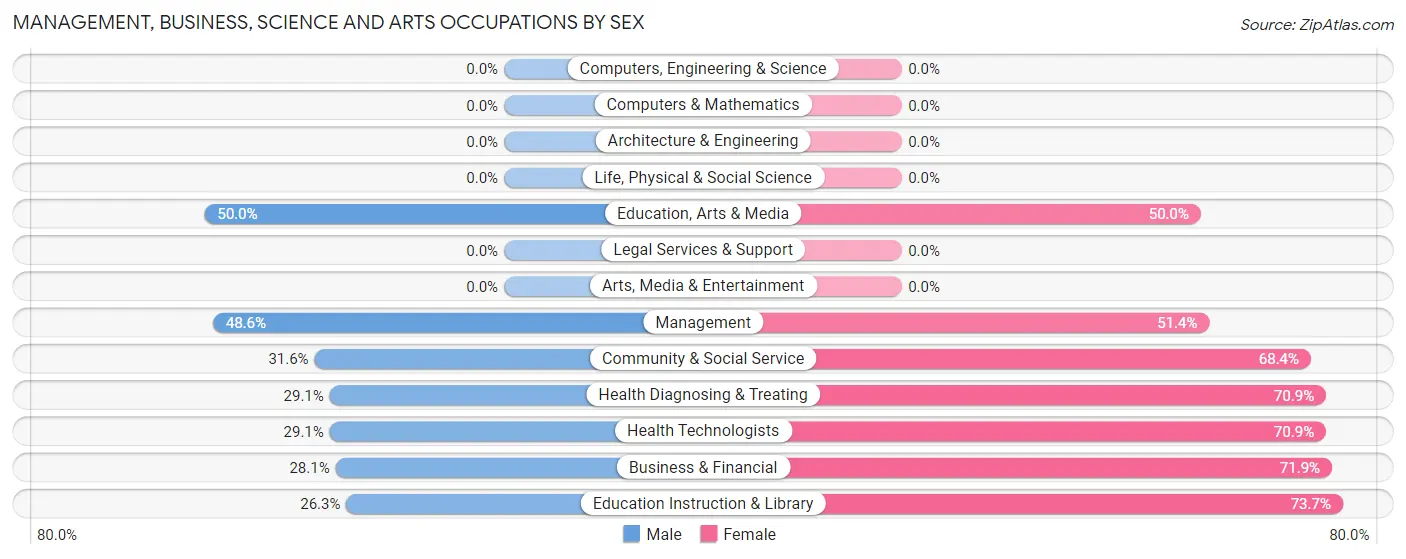
Management, Business, Science and Arts Occupations by Sex
Within the Management, Business, Science and Arts occupations in Fort Defiance, the most male-oriented occupations are Education, Arts & Media (50.0%), Management (48.6%), and Community & Social Service (31.6%), while the most female-oriented occupations are Education Instruction & Library (73.7%), Business & Financial (71.9%), and Health Diagnosing & Treating (70.9%).
| Occupation | Male | Female |
| Management | 69 (48.6%) | 73 (51.4%) |
| Business & Financial | 9 (28.1%) | 23 (71.9%) |
| Computers, Engineering & Science | 0 (0.0%) | 0 (0.0%) |
| Computers & Mathematics | 0 (0.0%) | 0 (0.0%) |
| Architecture & Engineering | 0 (0.0%) | 0 (0.0%) |
| Life, Physical & Social Science | 0 (0.0%) | 0 (0.0%) |
| Community & Social Service | 31 (31.6%) | 67 (68.4%) |
| Education, Arts & Media | 11 (50.0%) | 11 (50.0%) |
| Legal Services & Support | 0 (0.0%) | 0 (0.0%) |
| Education Instruction & Library | 20 (26.3%) | 56 (73.7%) |
| Arts, Media & Entertainment | 0 (0.0%) | 0 (0.0%) |
| Health Diagnosing & Treating | 39 (29.1%) | 95 (70.9%) |
| Health Technologists | 39 (29.1%) | 95 (70.9%) |
| Total (Category) | 148 (36.4%) | 258 (63.5%) |
| Total (Overall) | 642 (48.7%) | 676 (51.3%) |
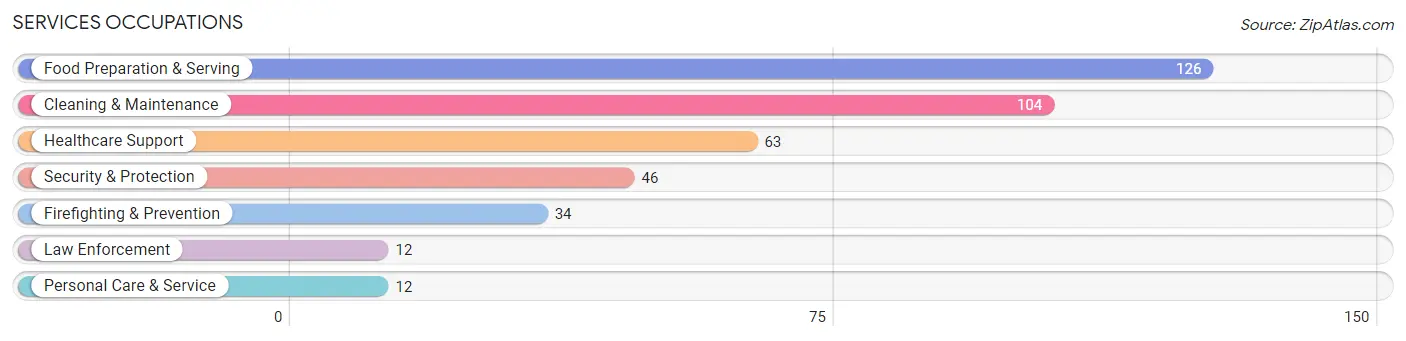
Services Occupations
The most common Services occupations in Fort Defiance are Food Preparation & Serving (126 | 9.6%), Cleaning & Maintenance (104 | 7.9%), Healthcare Support (63 | 4.8%), Security & Protection (46 | 3.5%), and Firefighting & Prevention (34 | 2.6%).
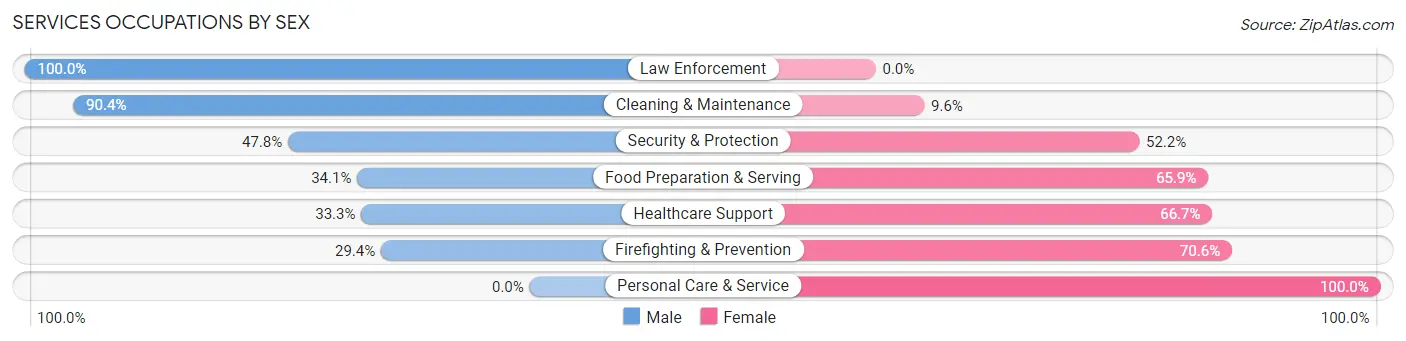
Services Occupations by Sex
Within the Services occupations in Fort Defiance, the most male-oriented occupations are Law Enforcement (100.0%), Cleaning & Maintenance (90.4%), and Security & Protection (47.8%), while the most female-oriented occupations are Personal Care & Service (100.0%), Firefighting & Prevention (70.6%), and Healthcare Support (66.7%).
| Occupation | Male | Female |
| Healthcare Support | 21 (33.3%) | 42 (66.7%) |
| Security & Protection | 22 (47.8%) | 24 (52.2%) |
| Firefighting & Prevention | 10 (29.4%) | 24 (70.6%) |
| Law Enforcement | 12 (100.0%) | 0 (0.0%) |
| Food Preparation & Serving | 43 (34.1%) | 83 (65.9%) |
| Cleaning & Maintenance | 94 (90.4%) | 10 (9.6%) |
| Personal Care & Service | 0 (0.0%) | 12 (100.0%) |
| Total (Category) | 180 (51.3%) | 171 (48.7%) |
| Total (Overall) | 642 (48.7%) | 676 (51.3%) |
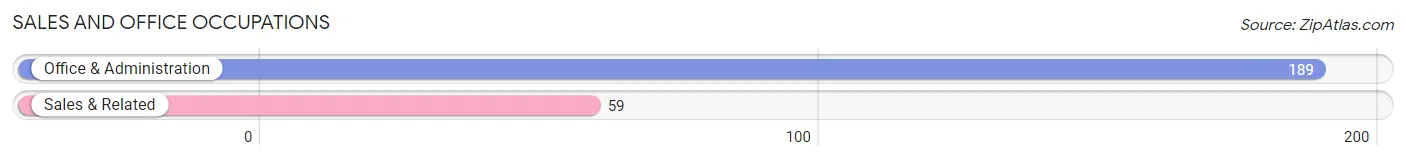
Sales and Office Occupations
The most common Sales and Office occupations in Fort Defiance are Office & Administration (189 | 14.3%), and Sales & Related (59 | 4.5%).
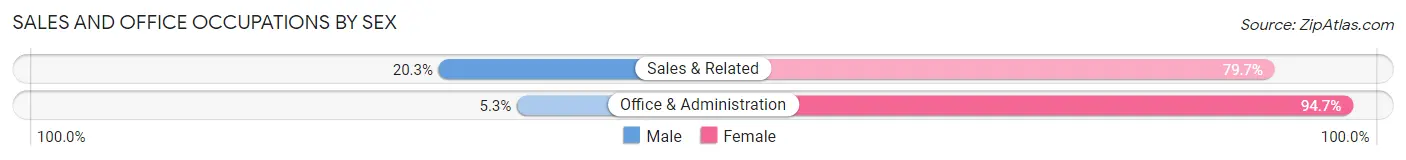
Sales and Office Occupations by Sex
| Occupation | Male | Female |
| Sales & Related | 12 (20.3%) | 47 (79.7%) |
| Office & Administration | 10 (5.3%) | 179 (94.7%) |
| Total (Category) | 22 (8.9%) | 226 (91.1%) |
| Total (Overall) | 642 (48.7%) | 676 (51.3%) |
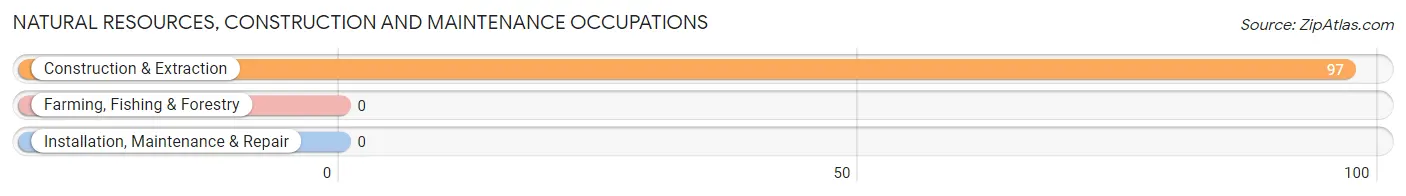
Natural Resources, Construction and Maintenance Occupations
The most common Natural Resources, Construction and Maintenance occupations in Fort Defiance are , and Construction & Extraction (97 | 7.4%).
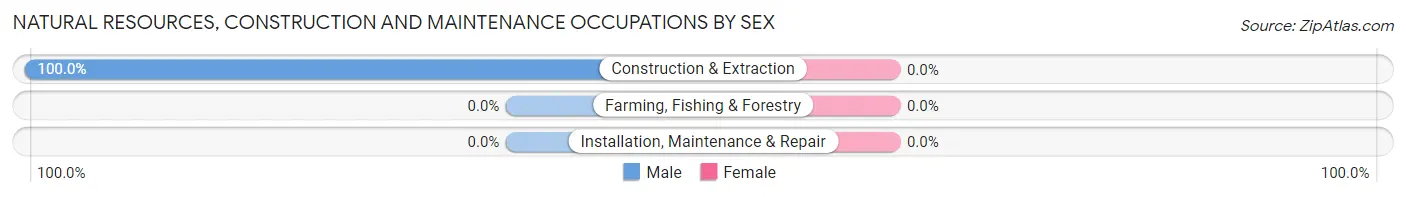
Natural Resources, Construction and Maintenance Occupations by Sex
| Occupation | Male | Female |
| Farming, Fishing & Forestry | 0 (0.0%) | 0 (0.0%) |
| Construction & Extraction | 97 (100.0%) | 0 (0.0%) |
| Installation, Maintenance & Repair | 0 (0.0%) | 0 (0.0%) |
| Total (Category) | 97 (100.0%) | 0 (0.0%) |
| Total (Overall) | 642 (48.7%) | 676 (51.3%) |
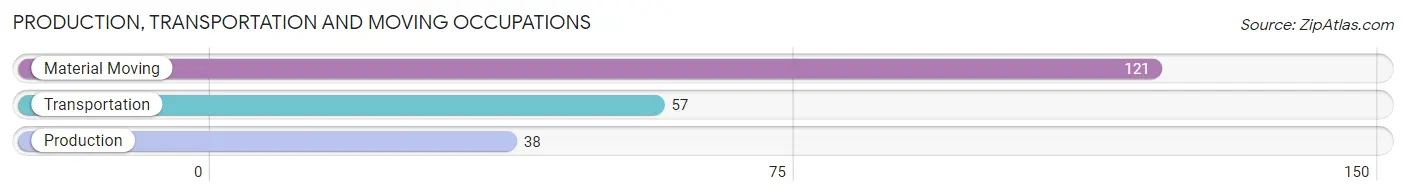
Production, Transportation and Moving Occupations
The most common Production, Transportation and Moving occupations in Fort Defiance are Material Moving (121 | 9.2%), Transportation (57 | 4.3%), and Production (38 | 2.9%).
Production, Transportation and Moving Occupations by Sex
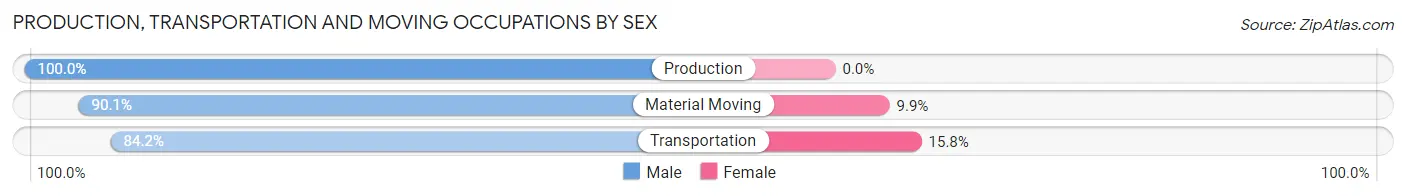
| Occupation | Male | Female |
| Production | 38 (100.0%) | 0 (0.0%) |
| Transportation | 48 (84.2%) | 9 (15.8%) |
| Material Moving | 109 (90.1%) | 12 (9.9%) |
| Total (Category) | 195 (90.3%) | 21 (9.7%) |
| Total (Overall) | 642 (48.7%) | 676 (51.3%) |
Employment Industries by Sex in Fort Defiance
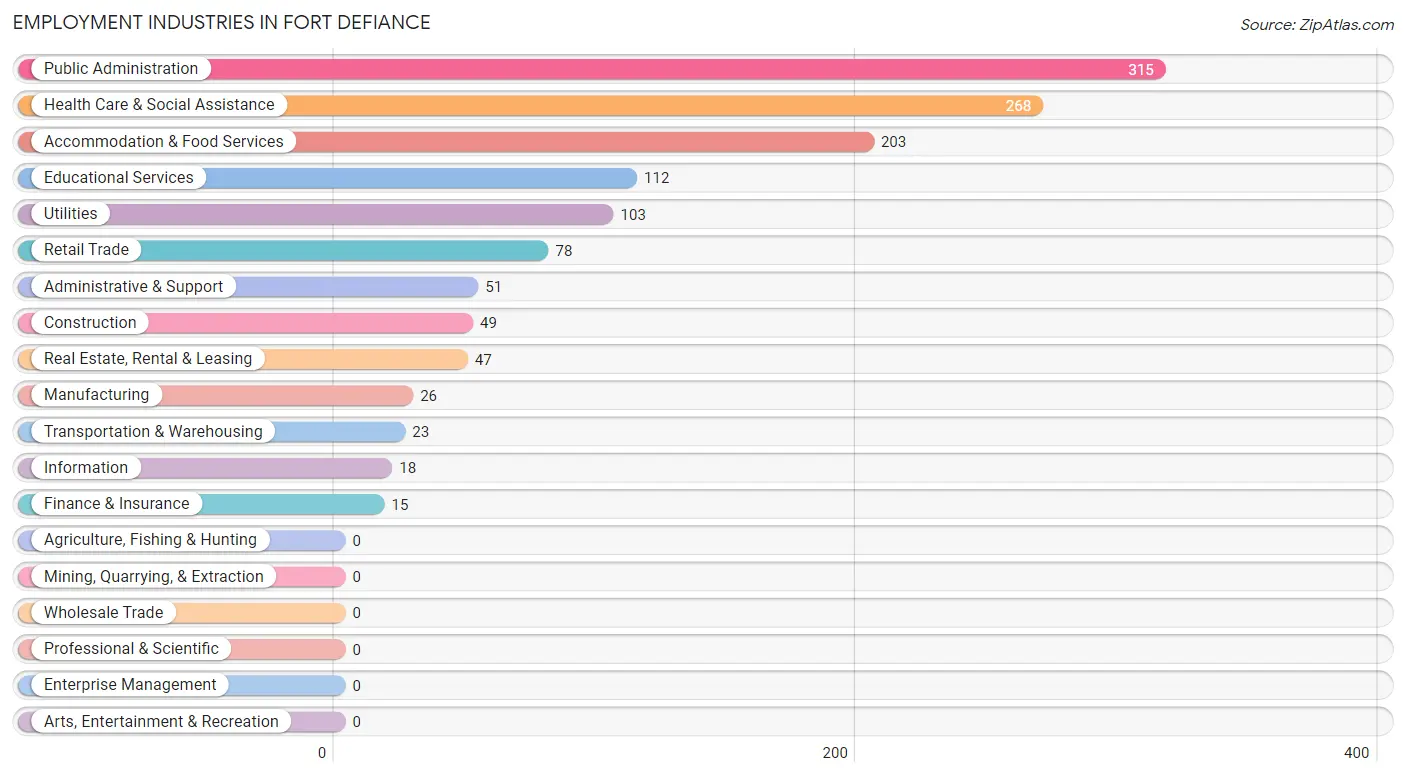
Employment Industries in Fort Defiance
The major employment industries in Fort Defiance include Public Administration (315 | 23.9%), Health Care & Social Assistance (268 | 20.3%), Accommodation & Food Services (203 | 15.4%), Educational Services (112 | 8.5%), and Utilities (103 | 7.8%).
Employment Industries by Sex in Fort Defiance
The Fort Defiance industries that see more men than women are Construction (100.0%), Manufacturing (100.0%), and Transportation & Warehousing (100.0%), whereas the industries that tend to have a higher number of women are Finance & Insurance (100.0%), Public Administration (71.1%), and Health Care & Social Assistance (69.8%).
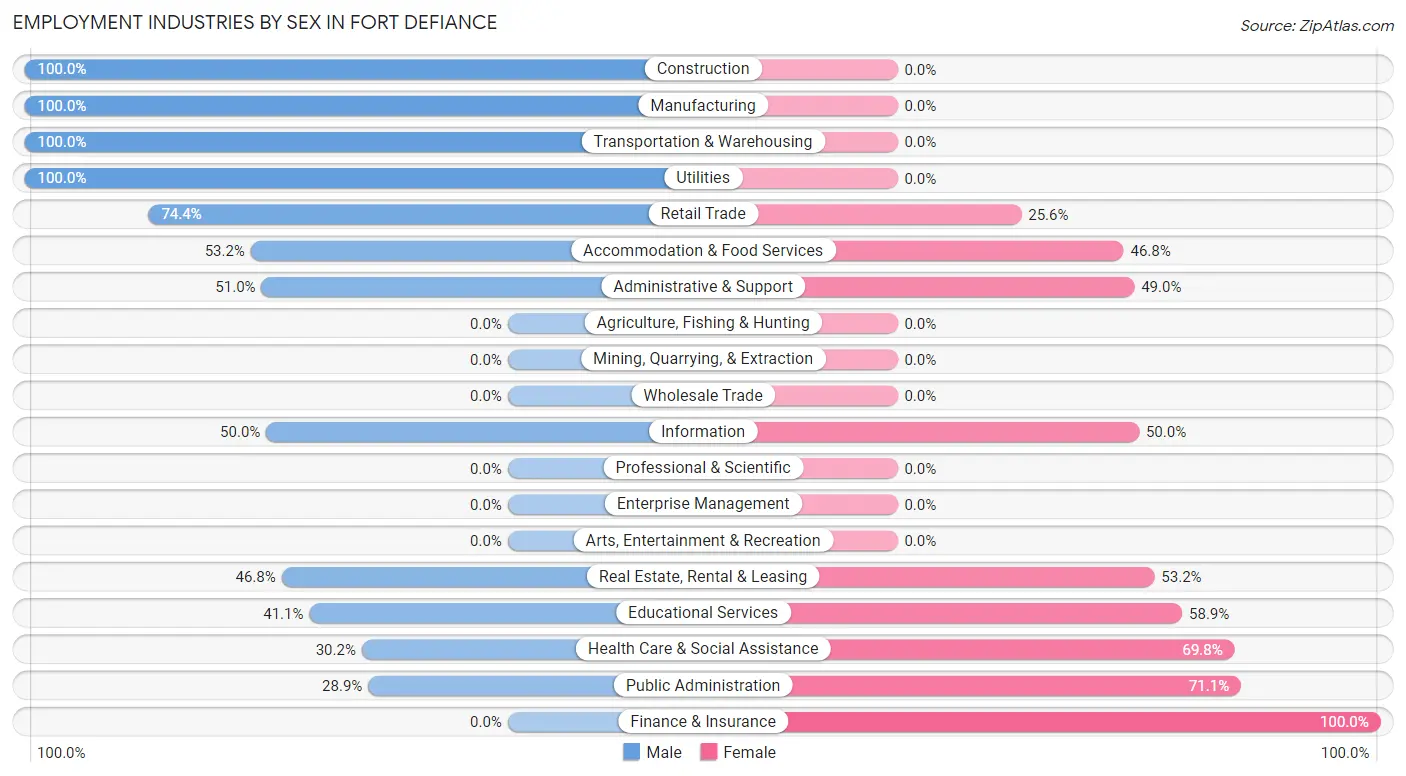
| Industry | Male | Female |
| Agriculture, Fishing & Hunting | 0 (0.0%) | 0 (0.0%) |
| Mining, Quarrying, & Extraction | 0 (0.0%) | 0 (0.0%) |
| Construction | 49 (100.0%) | 0 (0.0%) |
| Manufacturing | 26 (100.0%) | 0 (0.0%) |
| Wholesale Trade | 0 (0.0%) | 0 (0.0%) |
| Retail Trade | 58 (74.4%) | 20 (25.6%) |
| Transportation & Warehousing | 23 (100.0%) | 0 (0.0%) |
| Utilities | 103 (100.0%) | 0 (0.0%) |
| Information | 9 (50.0%) | 9 (50.0%) |
| Finance & Insurance | 0 (0.0%) | 15 (100.0%) |
| Real Estate, Rental & Leasing | 22 (46.8%) | 25 (53.2%) |
| Professional & Scientific | 0 (0.0%) | 0 (0.0%) |
| Enterprise Management | 0 (0.0%) | 0 (0.0%) |
| Administrative & Support | 26 (51.0%) | 25 (49.0%) |
| Educational Services | 46 (41.1%) | 66 (58.9%) |
| Health Care & Social Assistance | 81 (30.2%) | 187 (69.8%) |
| Arts, Entertainment & Recreation | 0 (0.0%) | 0 (0.0%) |
| Accommodation & Food Services | 108 (53.2%) | 95 (46.8%) |
| Public Administration | 91 (28.9%) | 224 (71.1%) |
| Total | 642 (48.7%) | 676 (51.3%) |
Education in Fort Defiance
School Enrollment in Fort Defiance
The most common levels of schooling among the 917 students in Fort Defiance are high school (278 | 30.3%), middle school (267 | 29.1%), and elementary school (157 | 17.1%).
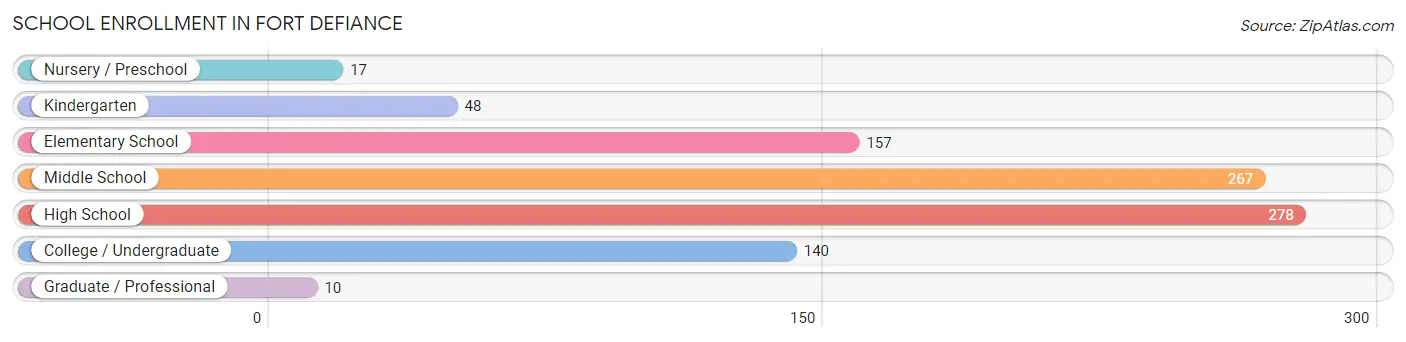
| School Level | # Students | % Students |
| Nursery / Preschool | 17 | 1.8% |
| Kindergarten | 48 | 5.2% |
| Elementary School | 157 | 17.1% |
| Middle School | 267 | 29.1% |
| High School | 278 | 30.3% |
| College / Undergraduate | 140 | 15.3% |
| Graduate / Professional | 10 | 1.1% |
| Total | 917 | 100.0% |
School Enrollment by Age by Funding Source in Fort Defiance
Out of a total of 917 students who are enrolled in schools in Fort Defiance, 63 (6.9%) attend a private institution, while the remaining 854 (93.1%) are enrolled in public schools. The age group of 35 years and over has the highest likelihood of being enrolled in private schools, with 44 (64.7% in the age bracket) enrolled. Conversely, the age group of 3 to 4 year olds has the lowest likelihood of being enrolled in a private school, with 17 (100.0% in the age bracket) attending a public institution.
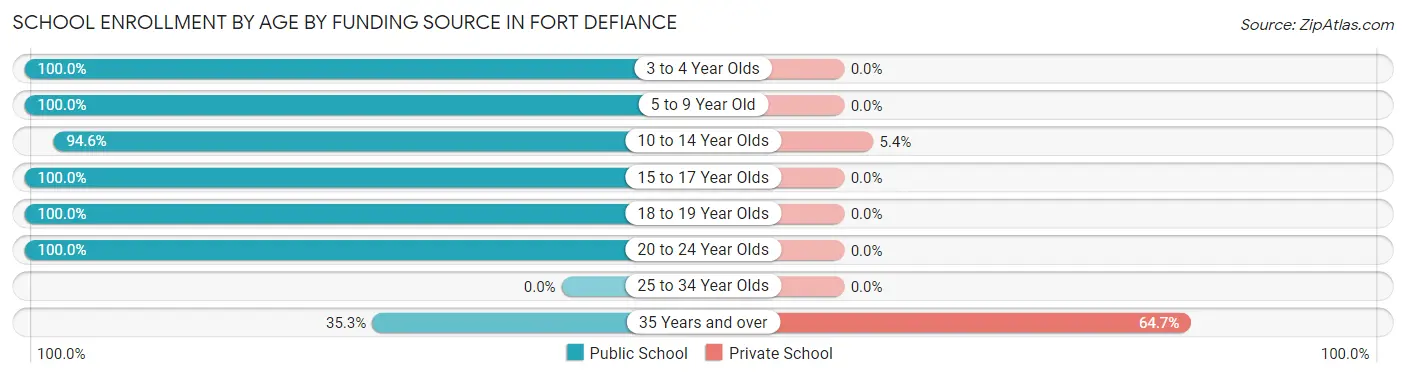
| Age Bracket | Public School | Private School |
| 3 to 4 Year Olds | 17 (100.0%) | 0 (0.0%) |
| 5 to 9 Year Old | 187 (100.0%) | 0 (0.0%) |
| 10 to 14 Year Olds | 334 (94.6%) | 19 (5.4%) |
| 15 to 17 Year Olds | 163 (100.0%) | 0 (0.0%) |
| 18 to 19 Year Olds | 47 (100.0%) | 0 (0.0%) |
| 20 to 24 Year Olds | 82 (100.0%) | 0 (0.0%) |
| 25 to 34 Year Olds | 0 (0.0%) | 0 (0.0%) |
| 35 Years and over | 24 (35.3%) | 44 (64.7%) |
| Total | 854 (93.1%) | 63 (6.9%) |
Educational Attainment by Field of Study in Fort Defiance
Science & technology (94 | 25.9%), business (67 | 18.5%), education (54 | 14.9%), arts & humanities (44 | 12.1%), and computers & mathematics (30 | 8.3%) are the most common fields of study among 363 individuals in Fort Defiance who have obtained a bachelor's degree or higher.
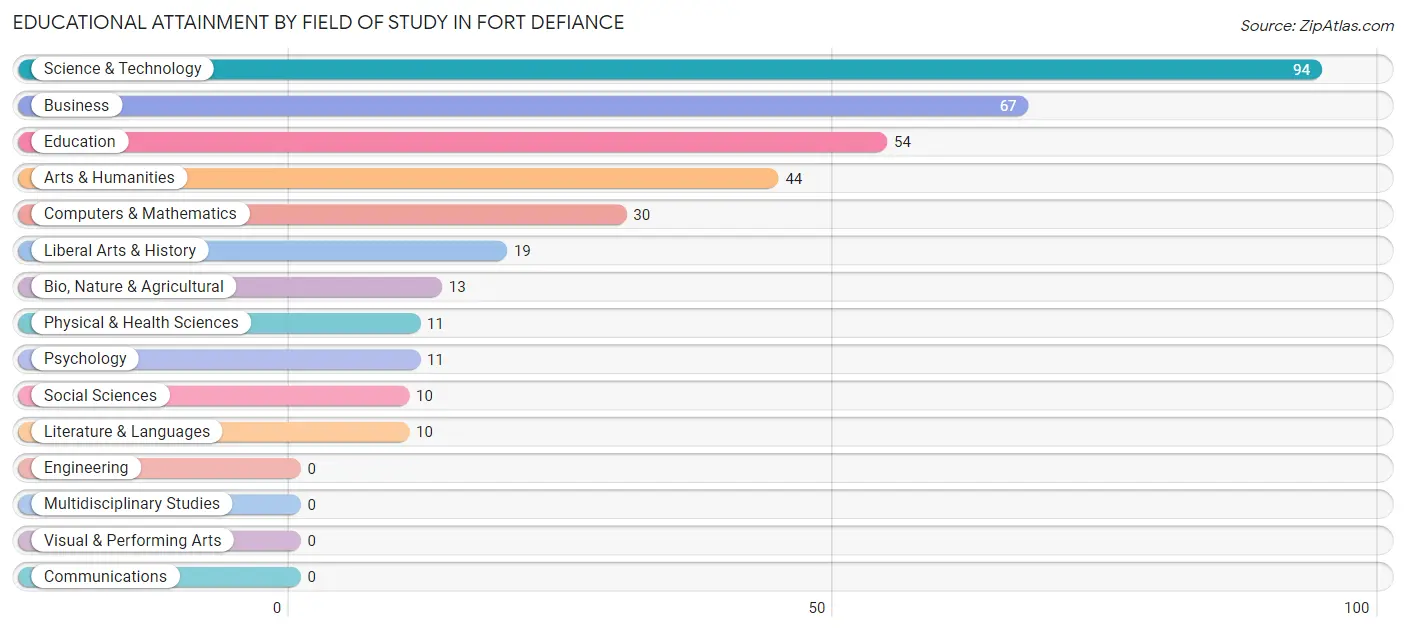
| Field of Study | # Graduates | % Graduates |
| Computers & Mathematics | 30 | 8.3% |
| Bio, Nature & Agricultural | 13 | 3.6% |
| Physical & Health Sciences | 11 | 3.0% |
| Psychology | 11 | 3.0% |
| Social Sciences | 10 | 2.8% |
| Engineering | 0 | 0.0% |
| Multidisciplinary Studies | 0 | 0.0% |
| Science & Technology | 94 | 25.9% |
| Business | 67 | 18.5% |
| Education | 54 | 14.9% |
| Literature & Languages | 10 | 2.8% |
| Liberal Arts & History | 19 | 5.2% |
| Visual & Performing Arts | 0 | 0.0% |
| Communications | 0 | 0.0% |
| Arts & Humanities | 44 | 12.1% |
| Total | 363 | 100.0% |
Transportation & Commute in Fort Defiance
Vehicle Availability by Sex in Fort Defiance
The most prevalent vehicle ownership categories in Fort Defiance are males with 2 vehicles (328, accounting for 51.1%) and females with 2 vehicles (248, making up 48.6%).
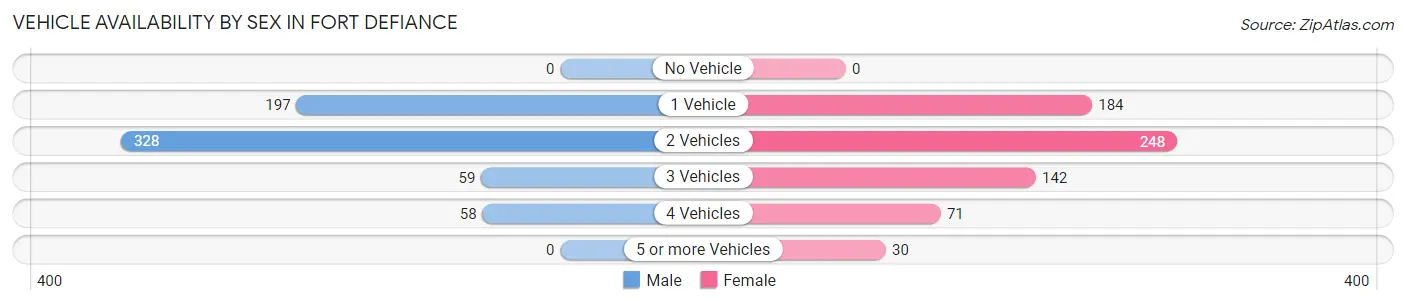
| Vehicles Available | Male | Female |
| No Vehicle | 0 (0.0%) | 0 (0.0%) |
| 1 Vehicle | 197 (30.7%) | 184 (27.3%) |
| 2 Vehicles | 328 (51.1%) | 248 (36.7%) |
| 3 Vehicles | 59 (9.2%) | 142 (21.0%) |
| 4 Vehicles | 58 (9.0%) | 71 (10.5%) |
| 5 or more Vehicles | 0 (0.0%) | 30 (4.4%) |
| Total | 642 (100.0%) | 675 (100.0%) |
Commute Time in Fort Defiance
The most frequently occuring commute durations in Fort Defiance are 10 to 14 minutes (393 commuters, 31.9%), 5 to 9 minutes (287 commuters, 23.3%), and 15 to 19 minutes (247 commuters, 20.0%).
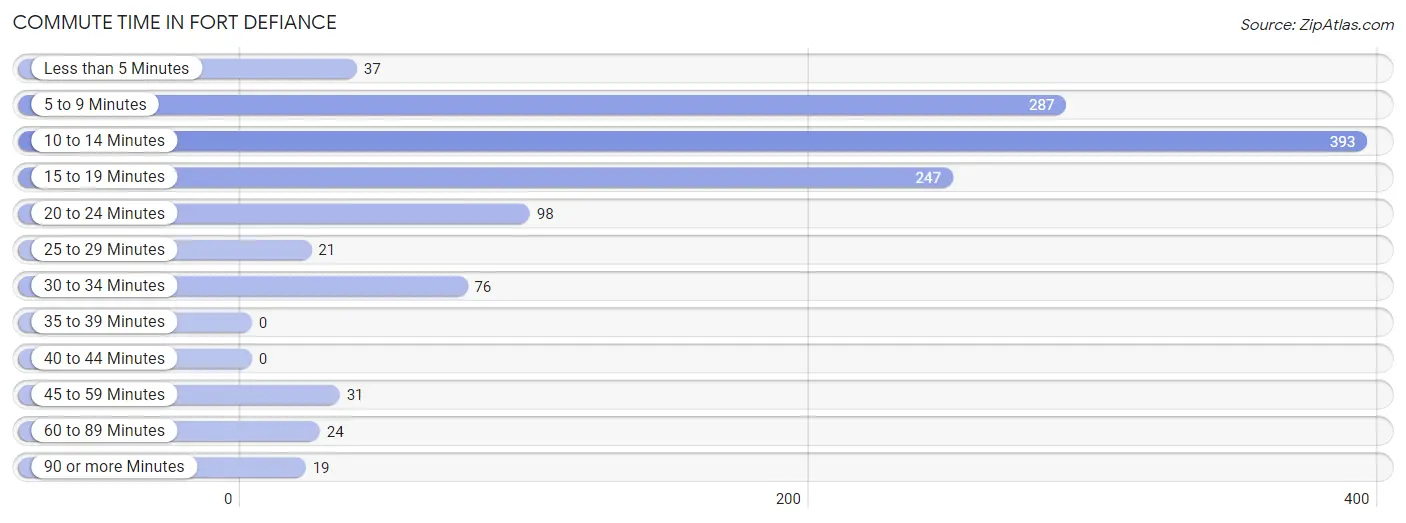
| Commute Time | # Commuters | % Commuters |
| Less than 5 Minutes | 37 | 3.0% |
| 5 to 9 Minutes | 287 | 23.3% |
| 10 to 14 Minutes | 393 | 31.9% |
| 15 to 19 Minutes | 247 | 20.0% |
| 20 to 24 Minutes | 98 | 8.0% |
| 25 to 29 Minutes | 21 | 1.7% |
| 30 to 34 Minutes | 76 | 6.2% |
| 35 to 39 Minutes | 0 | 0.0% |
| 40 to 44 Minutes | 0 | 0.0% |
| 45 to 59 Minutes | 31 | 2.5% |
| 60 to 89 Minutes | 24 | 1.9% |
| 90 or more Minutes | 19 | 1.5% |
Commute Time by Sex in Fort Defiance
The most common commute times in Fort Defiance are 10 to 14 minutes (233 commuters, 39.8%) for males and 5 to 9 minutes (207 commuters, 32.0%) for females.
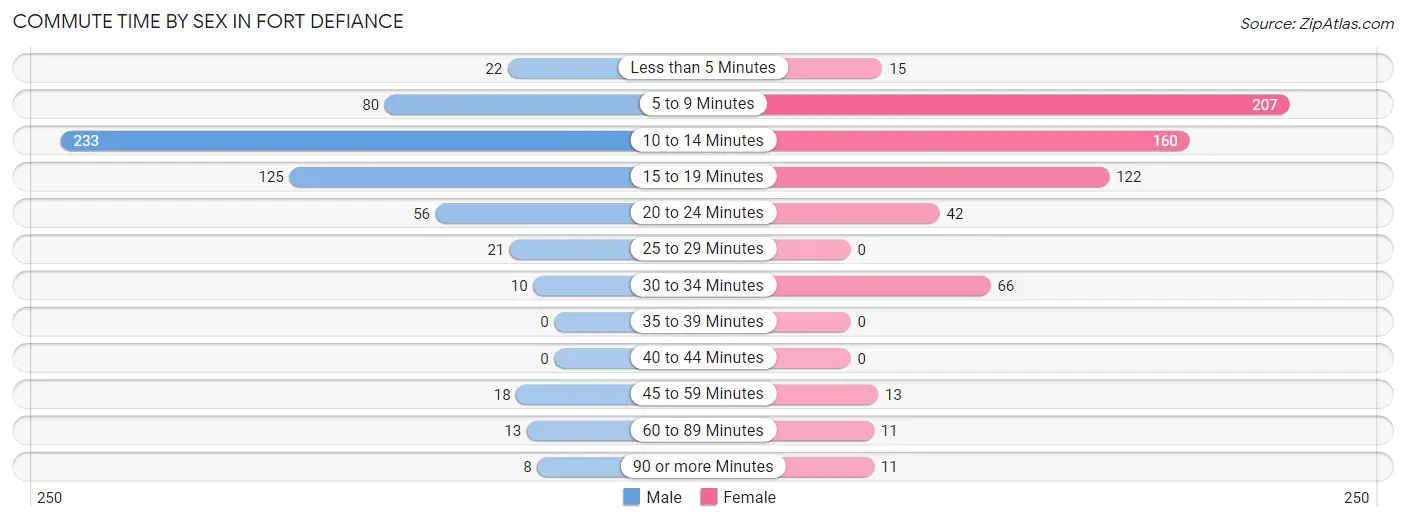
| Commute Time | Male | Female |
| Less than 5 Minutes | 22 (3.7%) | 15 (2.3%) |
| 5 to 9 Minutes | 80 (13.7%) | 207 (32.0%) |
| 10 to 14 Minutes | 233 (39.8%) | 160 (24.7%) |
| 15 to 19 Minutes | 125 (21.3%) | 122 (18.9%) |
| 20 to 24 Minutes | 56 (9.6%) | 42 (6.5%) |
| 25 to 29 Minutes | 21 (3.6%) | 0 (0.0%) |
| 30 to 34 Minutes | 10 (1.7%) | 66 (10.2%) |
| 35 to 39 Minutes | 0 (0.0%) | 0 (0.0%) |
| 40 to 44 Minutes | 0 (0.0%) | 0 (0.0%) |
| 45 to 59 Minutes | 18 (3.1%) | 13 (2.0%) |
| 60 to 89 Minutes | 13 (2.2%) | 11 (1.7%) |
| 90 or more Minutes | 8 (1.4%) | 11 (1.7%) |
Time of Departure to Work by Sex in Fort Defiance
The most frequent times of departure to work in Fort Defiance are 7:30 AM to 7:59 AM (253, 43.2%) for males and 7:30 AM to 7:59 AM (197, 30.4%) for females.
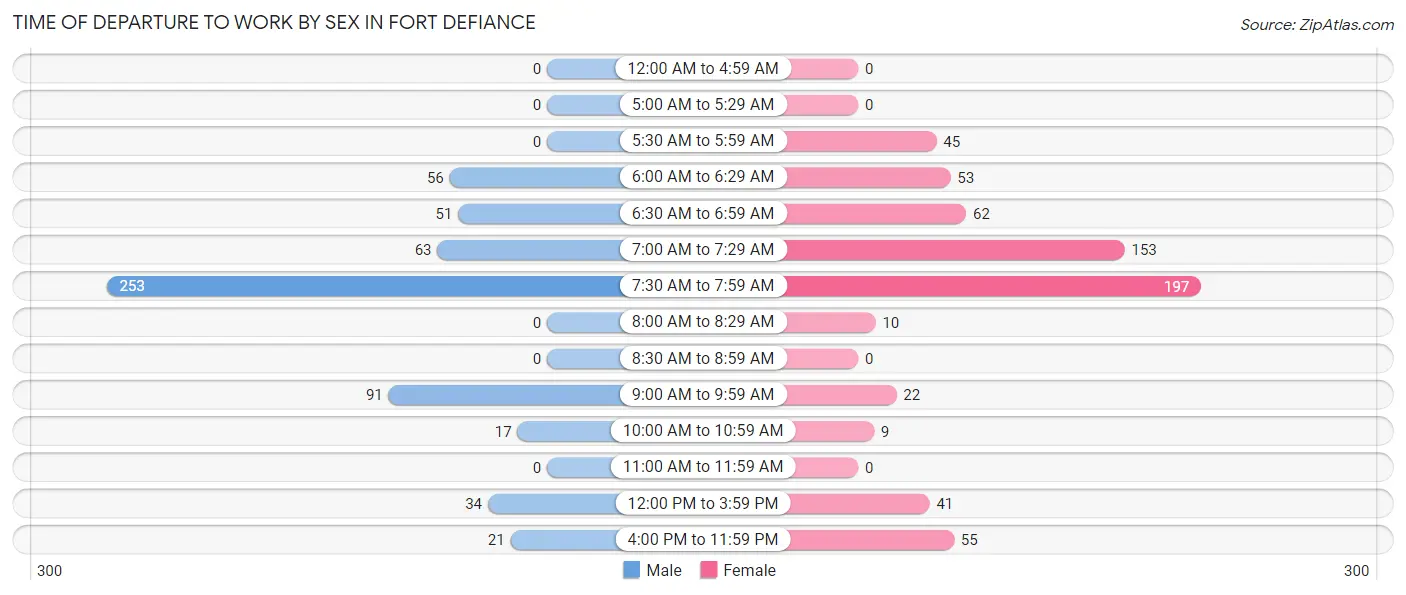
| Time of Departure | Male | Female |
| 12:00 AM to 4:59 AM | 0 (0.0%) | 0 (0.0%) |
| 5:00 AM to 5:29 AM | 0 (0.0%) | 0 (0.0%) |
| 5:30 AM to 5:59 AM | 0 (0.0%) | 45 (7.0%) |
| 6:00 AM to 6:29 AM | 56 (9.6%) | 53 (8.2%) |
| 6:30 AM to 6:59 AM | 51 (8.7%) | 62 (9.6%) |
| 7:00 AM to 7:29 AM | 63 (10.7%) | 153 (23.6%) |
| 7:30 AM to 7:59 AM | 253 (43.2%) | 197 (30.4%) |
| 8:00 AM to 8:29 AM | 0 (0.0%) | 10 (1.5%) |
| 8:30 AM to 8:59 AM | 0 (0.0%) | 0 (0.0%) |
| 9:00 AM to 9:59 AM | 91 (15.5%) | 22 (3.4%) |
| 10:00 AM to 10:59 AM | 17 (2.9%) | 9 (1.4%) |
| 11:00 AM to 11:59 AM | 0 (0.0%) | 0 (0.0%) |
| 12:00 PM to 3:59 PM | 34 (5.8%) | 41 (6.3%) |
| 4:00 PM to 11:59 PM | 21 (3.6%) | 55 (8.5%) |
| Total | 586 (100.0%) | 647 (100.0%) |
Housing Occupancy in Fort Defiance
Occupancy by Ownership in Fort Defiance
Of the total 971 dwellings in Fort Defiance, owner-occupied units account for 548 (56.4%), while renter-occupied units make up 423 (43.6%).
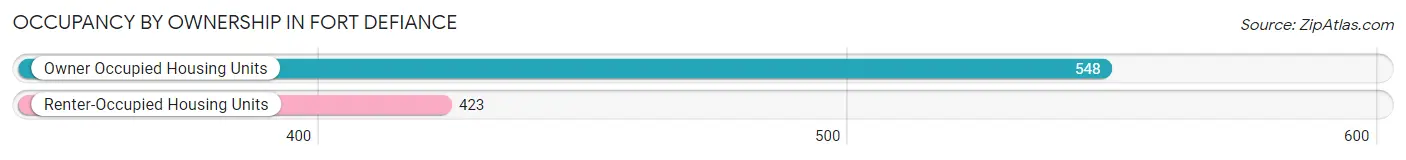
| Occupancy | # Housing Units | % Housing Units |
| Owner Occupied Housing Units | 548 | 56.4% |
| Renter-Occupied Housing Units | 423 | 43.6% |
| Total Occupied Housing Units | 971 | 100.0% |
Occupancy by Household Size in Fort Defiance
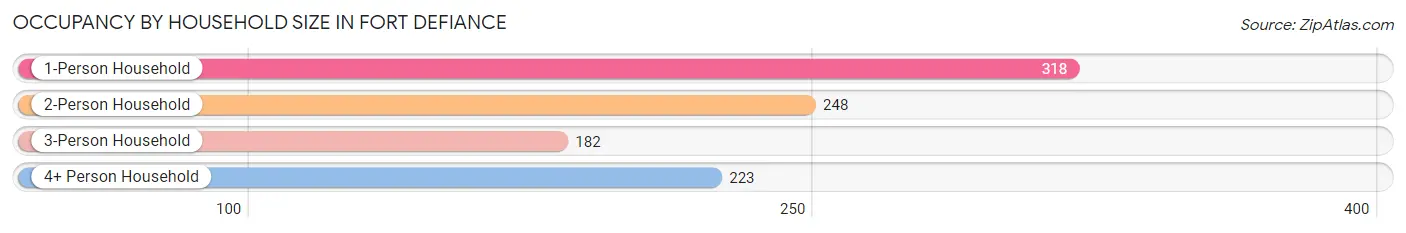
| Household Size | # Housing Units | % Housing Units |
| 1-Person Household | 318 | 32.8% |
| 2-Person Household | 248 | 25.5% |
| 3-Person Household | 182 | 18.7% |
| 4+ Person Household | 223 | 23.0% |
| Total Housing Units | 971 | 100.0% |
Occupancy by Ownership by Household Size in Fort Defiance
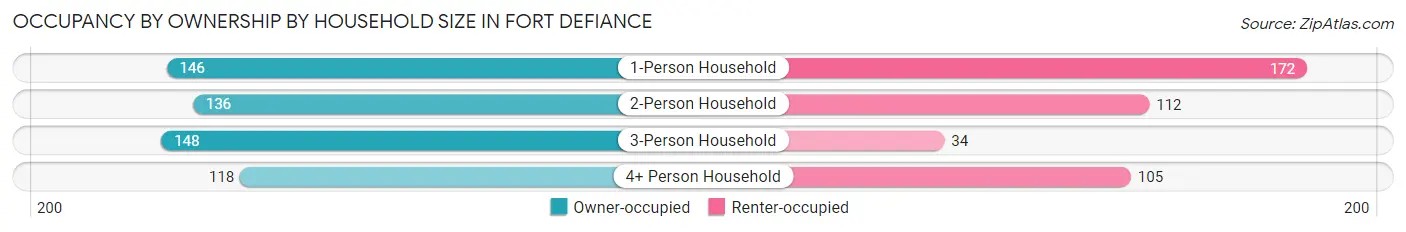
| Household Size | Owner-occupied | Renter-occupied |
| 1-Person Household | 146 (45.9%) | 172 (54.1%) |
| 2-Person Household | 136 (54.8%) | 112 (45.2%) |
| 3-Person Household | 148 (81.3%) | 34 (18.7%) |
| 4+ Person Household | 118 (52.9%) | 105 (47.1%) |
| Total Housing Units | 548 (56.4%) | 423 (43.6%) |
Occupancy by Educational Attainment in Fort Defiance
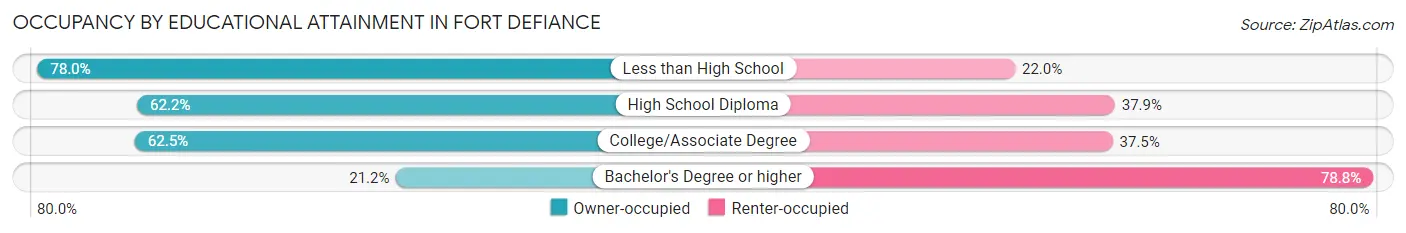
| Household Size | Owner-occupied | Renter-occupied |
| Less than High School | 92 (78.0%) | 26 (22.0%) |
| High School Diploma | 197 (62.2%) | 120 (37.9%) |
| College/Associate Degree | 220 (62.5%) | 132 (37.5%) |
| Bachelor's Degree or higher | 39 (21.2%) | 145 (78.8%) |
Occupancy by Age of Householder in Fort Defiance
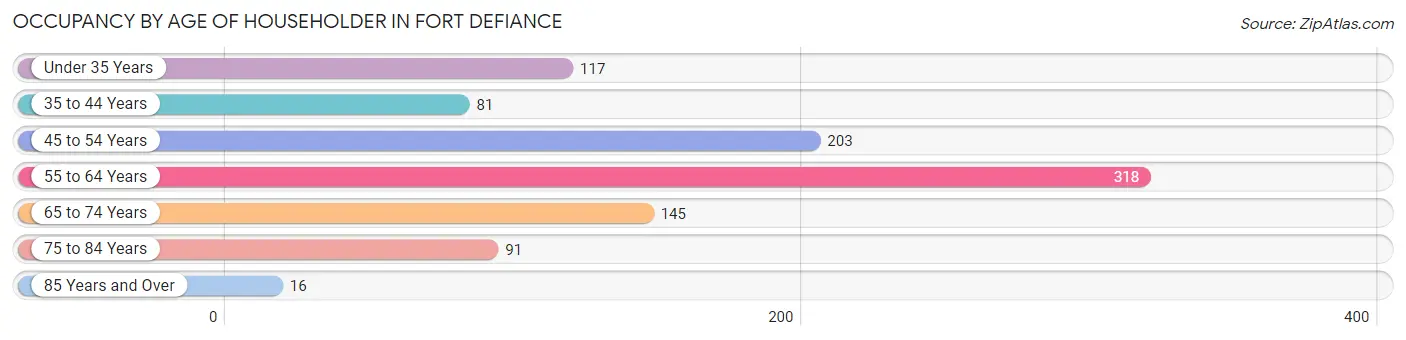
| Age Bracket | # Households | % Households |
| Under 35 Years | 117 | 12.0% |
| 35 to 44 Years | 81 | 8.3% |
| 45 to 54 Years | 203 | 20.9% |
| 55 to 64 Years | 318 | 32.8% |
| 65 to 74 Years | 145 | 14.9% |
| 75 to 84 Years | 91 | 9.4% |
| 85 Years and Over | 16 | 1.7% |
| Total | 971 | 100.0% |
Housing Finances in Fort Defiance
Median Income by Occupancy in Fort Defiance
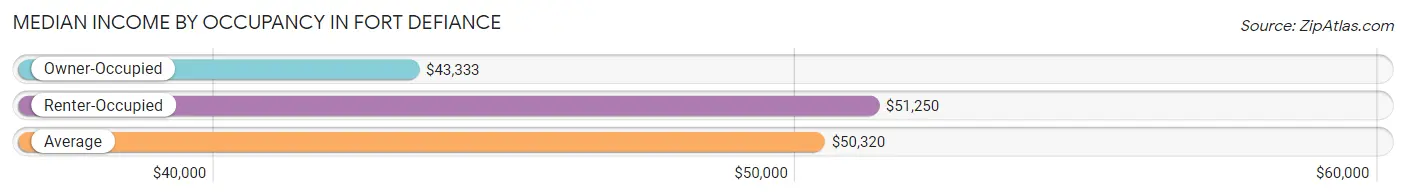
| Occupancy Type | # Households | Median Income |
| Owner-Occupied | 548 (56.4%) | $43,333 |
| Renter-Occupied | 423 (43.6%) | $51,250 |
| Average | 971 (100.0%) | $50,320 |
Occupancy by Householder Income Bracket in Fort Defiance
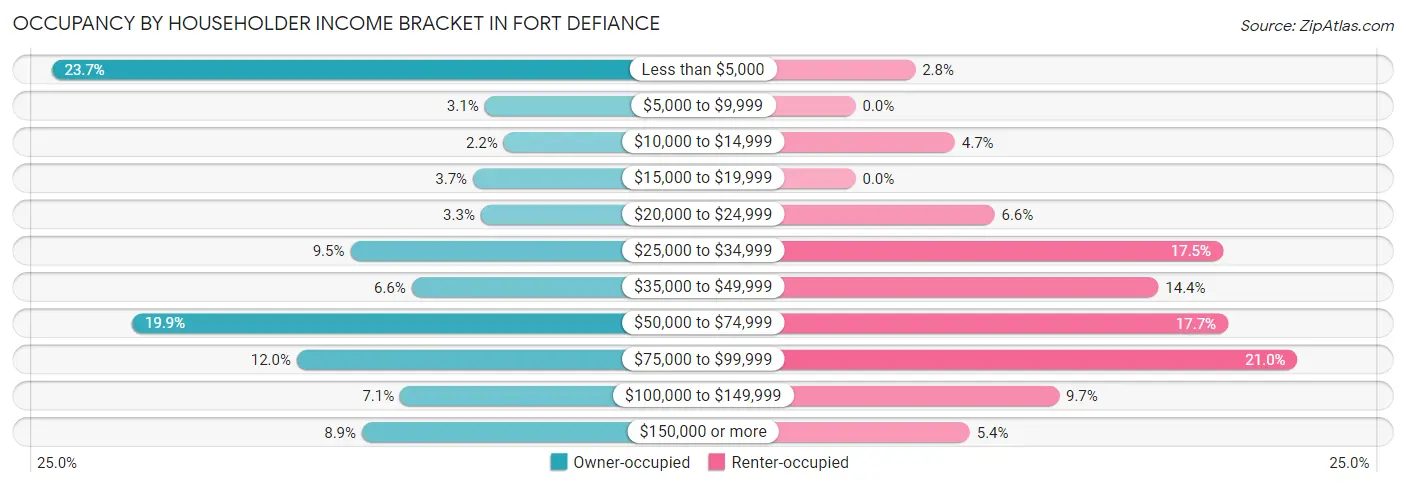
| Income Bracket | Owner-occupied | Renter-occupied |
| Less than $5,000 | 130 (23.7%) | 12 (2.8%) |
| $5,000 to $9,999 | 17 (3.1%) | 0 (0.0%) |
| $10,000 to $14,999 | 12 (2.2%) | 20 (4.7%) |
| $15,000 to $19,999 | 20 (3.6%) | 0 (0.0%) |
| $20,000 to $24,999 | 18 (3.3%) | 28 (6.6%) |
| $25,000 to $34,999 | 52 (9.5%) | 74 (17.5%) |
| $35,000 to $49,999 | 36 (6.6%) | 61 (14.4%) |
| $50,000 to $74,999 | 109 (19.9%) | 75 (17.7%) |
| $75,000 to $99,999 | 66 (12.0%) | 89 (21.0%) |
| $100,000 to $149,999 | 39 (7.1%) | 41 (9.7%) |
| $150,000 or more | 49 (8.9%) | 23 (5.4%) |
| Total | 548 (100.0%) | 423 (100.0%) |
Monthly Housing Cost Tiers in Fort Defiance
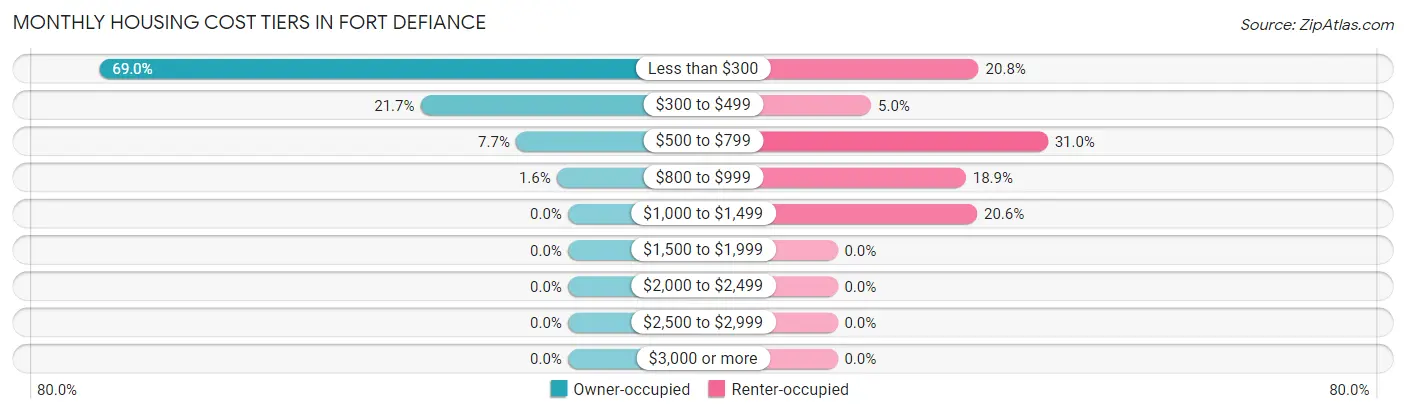
| Monthly Cost | Owner-occupied | Renter-occupied |
| Less than $300 | 378 (69.0%) | 88 (20.8%) |
| $300 to $499 | 119 (21.7%) | 21 (5.0%) |
| $500 to $799 | 42 (7.7%) | 131 (31.0%) |
| $800 to $999 | 9 (1.6%) | 80 (18.9%) |
| $1,000 to $1,499 | 0 (0.0%) | 87 (20.6%) |
| $1,500 to $1,999 | 0 (0.0%) | 0 (0.0%) |
| $2,000 to $2,499 | 0 (0.0%) | 0 (0.0%) |
| $2,500 to $2,999 | 0 (0.0%) | 0 (0.0%) |
| $3,000 or more | 0 (0.0%) | 0 (0.0%) |
| Total | 548 (100.0%) | 423 (100.0%) |
Physical Housing Characteristics in Fort Defiance
Housing Structures in Fort Defiance
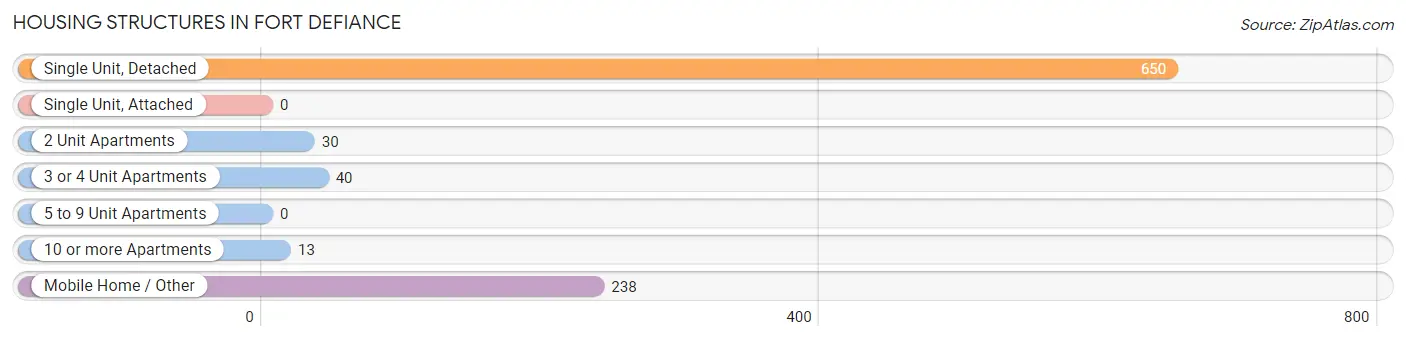
| Structure Type | # Housing Units | % Housing Units |
| Single Unit, Detached | 650 | 66.9% |
| Single Unit, Attached | 0 | 0.0% |
| 2 Unit Apartments | 30 | 3.1% |
| 3 or 4 Unit Apartments | 40 | 4.1% |
| 5 to 9 Unit Apartments | 0 | 0.0% |
| 10 or more Apartments | 13 | 1.3% |
| Mobile Home / Other | 238 | 24.5% |
| Total | 971 | 100.0% |
Housing Structures by Occupancy in Fort Defiance
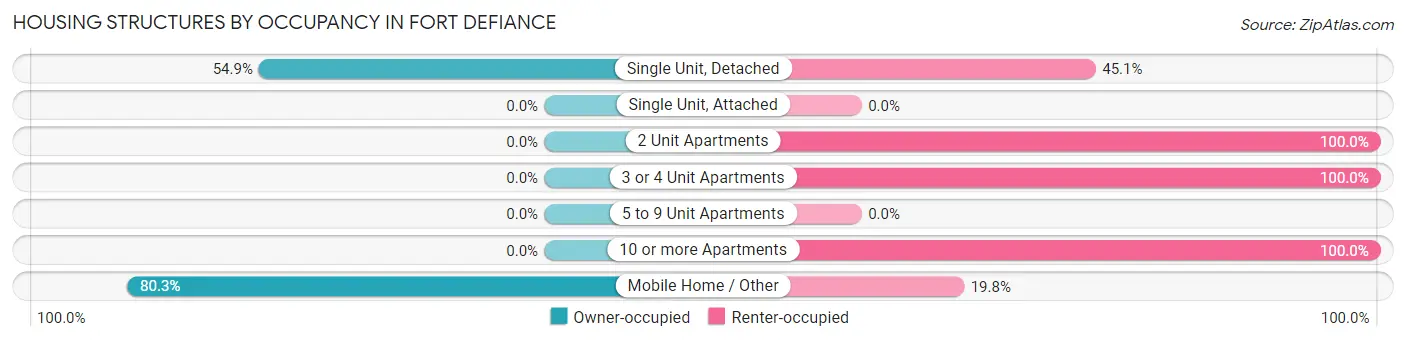
| Structure Type | Owner-occupied | Renter-occupied |
| Single Unit, Detached | 357 (54.9%) | 293 (45.1%) |
| Single Unit, Attached | 0 (0.0%) | 0 (0.0%) |
| 2 Unit Apartments | 0 (0.0%) | 30 (100.0%) |
| 3 or 4 Unit Apartments | 0 (0.0%) | 40 (100.0%) |
| 5 to 9 Unit Apartments | 0 (0.0%) | 0 (0.0%) |
| 10 or more Apartments | 0 (0.0%) | 13 (100.0%) |
| Mobile Home / Other | 191 (80.2%) | 47 (19.8%) |
| Total | 548 (56.4%) | 423 (43.6%) |
Housing Structures by Number of Rooms in Fort Defiance
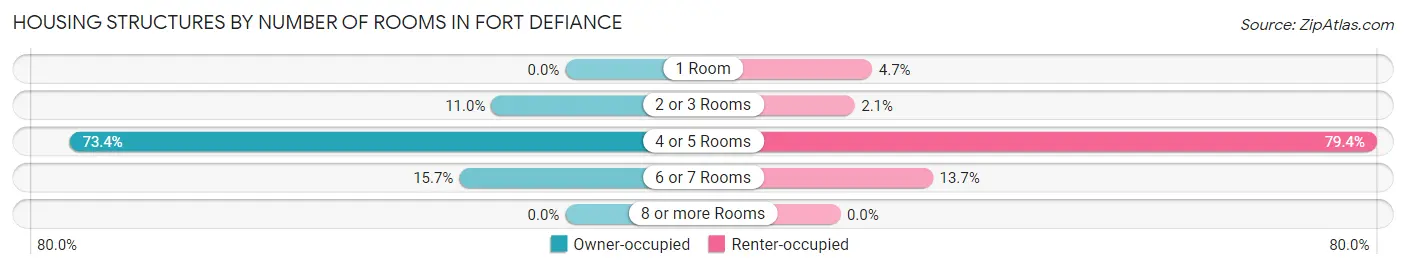
| Number of Rooms | Owner-occupied | Renter-occupied |
| 1 Room | 0 (0.0%) | 20 (4.7%) |
| 2 or 3 Rooms | 60 (11.0%) | 9 (2.1%) |
| 4 or 5 Rooms | 402 (73.4%) | 336 (79.4%) |
| 6 or 7 Rooms | 86 (15.7%) | 58 (13.7%) |
| 8 or more Rooms | 0 (0.0%) | 0 (0.0%) |
| Total | 548 (100.0%) | 423 (100.0%) |
Housing Structure by Heating Type in Fort Defiance
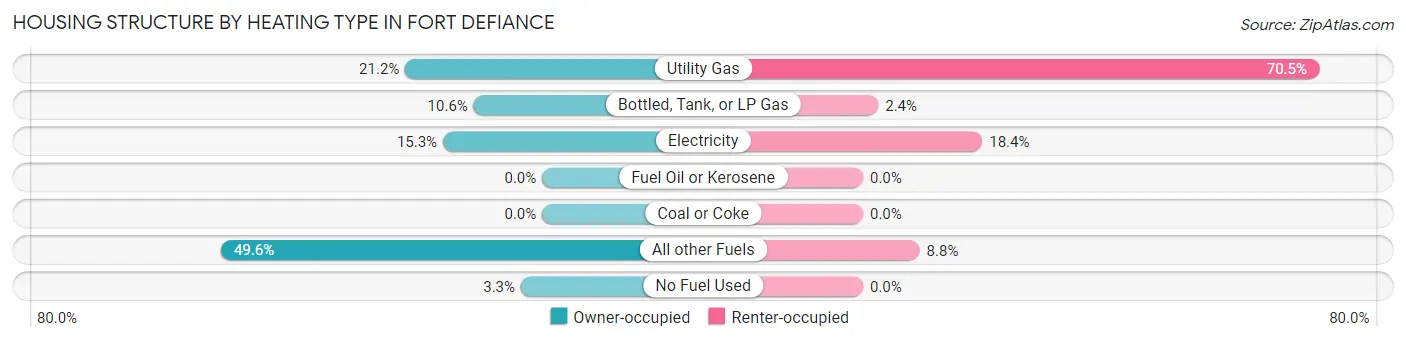
| Heating Type | Owner-occupied | Renter-occupied |
| Utility Gas | 116 (21.2%) | 298 (70.5%) |
| Bottled, Tank, or LP Gas | 58 (10.6%) | 10 (2.4%) |
| Electricity | 84 (15.3%) | 78 (18.4%) |
| Fuel Oil or Kerosene | 0 (0.0%) | 0 (0.0%) |
| Coal or Coke | 0 (0.0%) | 0 (0.0%) |
| All other Fuels | 272 (49.6%) | 37 (8.7%) |
| No Fuel Used | 18 (3.3%) | 0 (0.0%) |
| Total | 548 (100.0%) | 423 (100.0%) |
Household Vehicle Usage in Fort Defiance
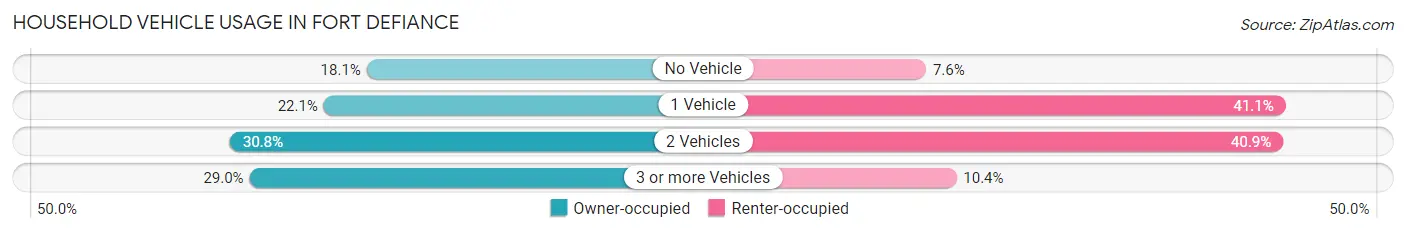
| Vehicles per Household | Owner-occupied | Renter-occupied |
| No Vehicle | 99 (18.1%) | 32 (7.6%) |
| 1 Vehicle | 121 (22.1%) | 174 (41.1%) |
| 2 Vehicles | 169 (30.8%) | 173 (40.9%) |
| 3 or more Vehicles | 159 (29.0%) | 44 (10.4%) |
| Total | 548 (100.0%) | 423 (100.0%) |
Real Estate & Mortgages in Fort Defiance
Real Estate and Mortgage Overview in Fort Defiance
| Characteristic | Without Mortgage | With Mortgage |
| Housing Units | 507 | 41 |
| Median Property Value | $32,000 | $60,400 |
| Median Household Income | $44,375 | $0 |
| Monthly Housing Costs | $222 | $0 |
| Real Estate Taxes | - | - |
Property Value by Mortgage Status in Fort Defiance
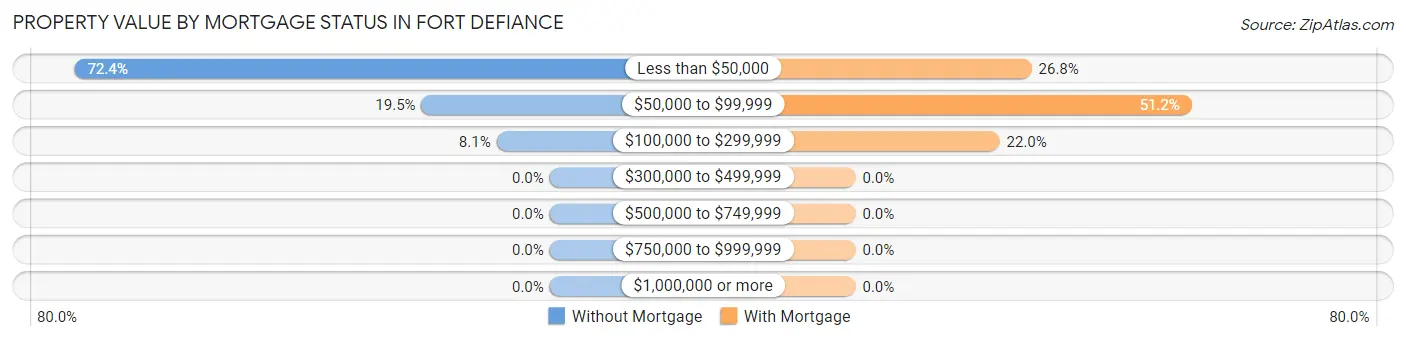
| Property Value | Without Mortgage | With Mortgage |
| Less than $50,000 | 367 (72.4%) | 11 (26.8%) |
| $50,000 to $99,999 | 99 (19.5%) | 21 (51.2%) |
| $100,000 to $299,999 | 41 (8.1%) | 9 (22.0%) |
| $300,000 to $499,999 | 0 (0.0%) | 0 (0.0%) |
| $500,000 to $749,999 | 0 (0.0%) | 0 (0.0%) |
| $750,000 to $999,999 | 0 (0.0%) | 0 (0.0%) |
| $1,000,000 or more | 0 (0.0%) | 0 (0.0%) |
| Total | 507 (100.0%) | 41 (100.0%) |
Household Income by Mortgage Status in Fort Defiance
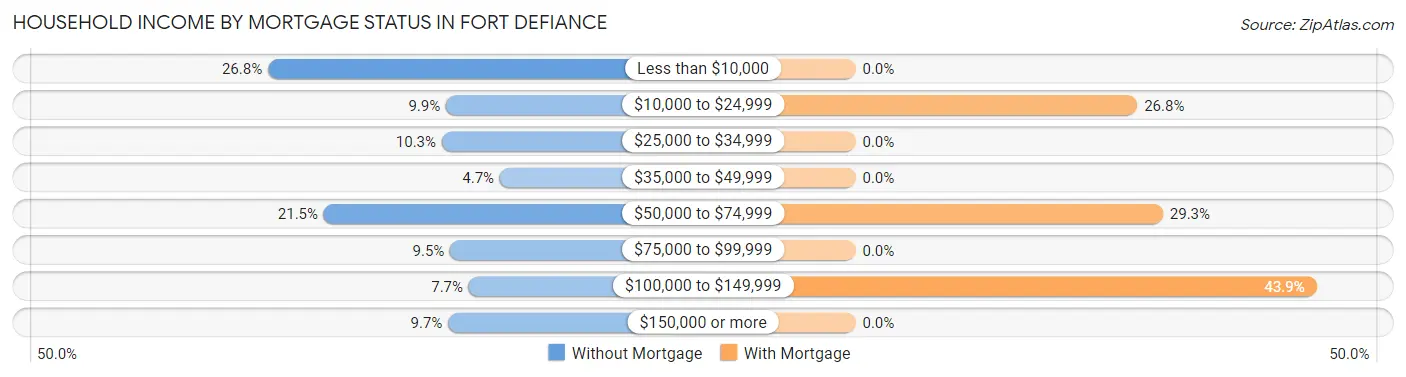
| Household Income | Without Mortgage | With Mortgage |
| Less than $10,000 | 136 (26.8%) | 0 (0.0%) |
| $10,000 to $24,999 | 50 (9.9%) | 11 (26.8%) |
| $25,000 to $34,999 | 52 (10.3%) | 0 (0.0%) |
| $35,000 to $49,999 | 24 (4.7%) | 0 (0.0%) |
| $50,000 to $74,999 | 109 (21.5%) | 12 (29.3%) |
| $75,000 to $99,999 | 48 (9.5%) | 0 (0.0%) |
| $100,000 to $149,999 | 39 (7.7%) | 18 (43.9%) |
| $150,000 or more | 49 (9.7%) | 0 (0.0%) |
| Total | 507 (100.0%) | 41 (100.0%) |
Property Value to Household Income Ratio in Fort Defiance
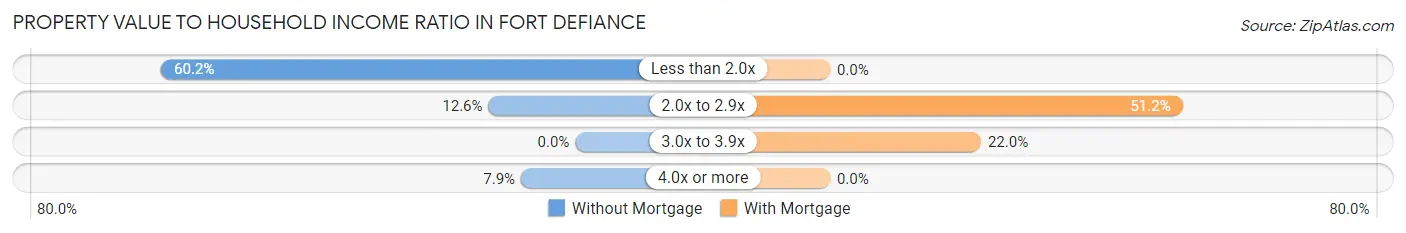
| Value-to-Income Ratio | Without Mortgage | With Mortgage |
| Less than 2.0x | 305 (60.2%) | 0 (0.0%) |
| 2.0x to 2.9x | 64 (12.6%) | 21 (51.2%) |
| 3.0x to 3.9x | 0 (0.0%) | 9 (22.0%) |
| 4.0x or more | 40 (7.9%) | 0 (0.0%) |
| Total | 507 (100.0%) | 41 (100.0%) |
Real Estate Taxes by Mortgage Status in Fort Defiance
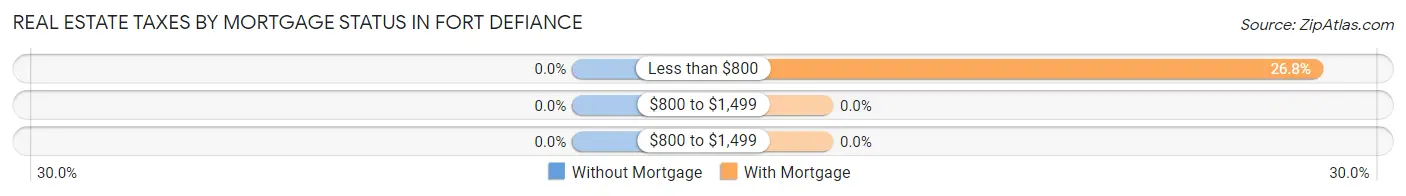
| Property Taxes | Without Mortgage | With Mortgage |
| Less than $800 | 0 (0.0%) | 11 (26.8%) |
| $800 to $1,499 | 0 (0.0%) | 0 (0.0%) |
| $800 to $1,499 | 0 (0.0%) | 0 (0.0%) |
| Total | 507 (100.0%) | 41 (100.0%) |
Health & Disability in Fort Defiance
Health Insurance Coverage by Age in Fort Defiance
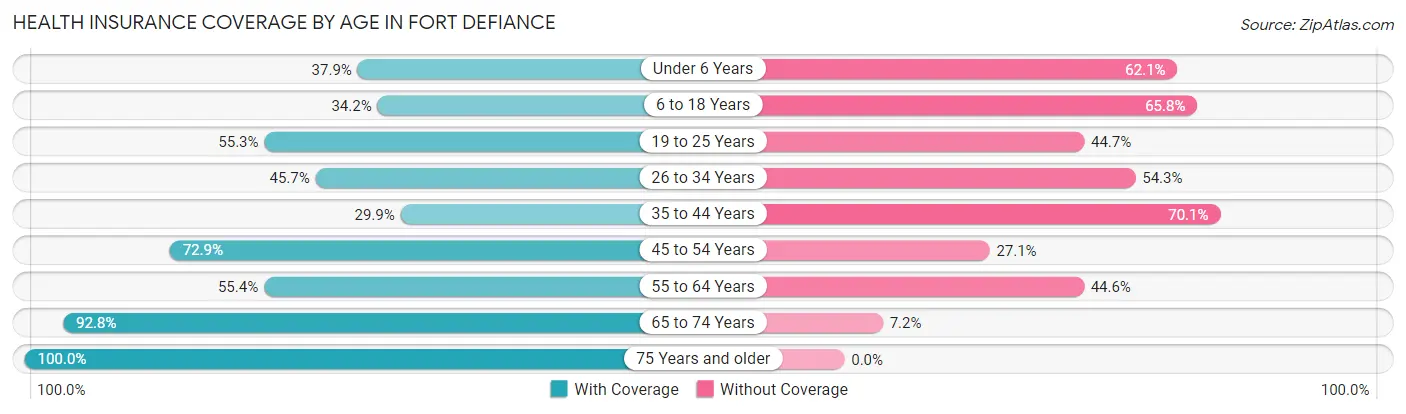
| Age Bracket | With Coverage | Without Coverage |
| Under 6 Years | 61 (37.9%) | 100 (62.1%) |
| 6 to 18 Years | 266 (34.2%) | 512 (65.8%) |
| 19 to 25 Years | 251 (55.3%) | 203 (44.7%) |
| 26 to 34 Years | 252 (45.7%) | 299 (54.3%) |
| 35 to 44 Years | 113 (29.9%) | 265 (70.1%) |
| 45 to 54 Years | 264 (72.9%) | 98 (27.1%) |
| 55 to 64 Years | 248 (55.4%) | 200 (44.6%) |
| 65 to 74 Years | 220 (92.8%) | 17 (7.2%) |
| 75 Years and older | 156 (100.0%) | 0 (0.0%) |
| Total | 1,831 (51.9%) | 1,694 (48.1%) |
Health Insurance Coverage by Citizenship Status in Fort Defiance
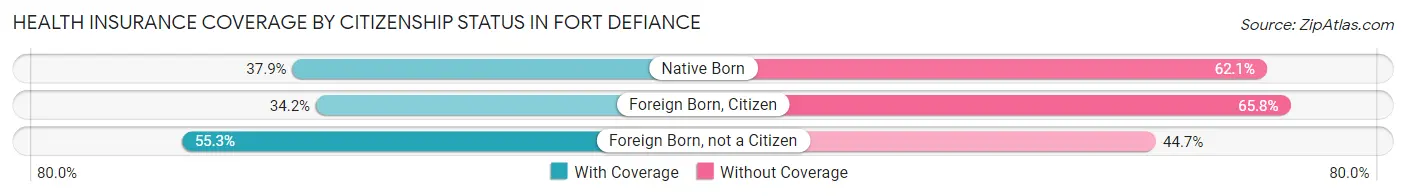
| Citizenship Status | With Coverage | Without Coverage |
| Native Born | 61 (37.9%) | 100 (62.1%) |
| Foreign Born, Citizen | 266 (34.2%) | 512 (65.8%) |
| Foreign Born, not a Citizen | 251 (55.3%) | 203 (44.7%) |
Health Insurance Coverage by Household Income in Fort Defiance
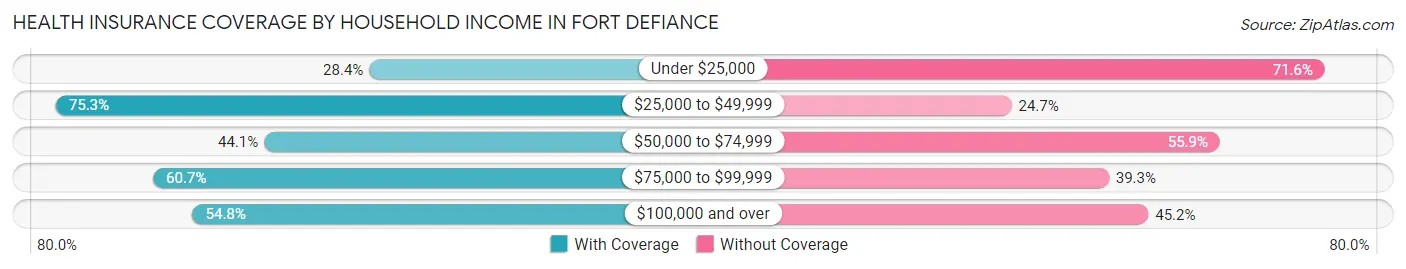
| Household Income | With Coverage | Without Coverage |
| Under $25,000 | 215 (28.4%) | 543 (71.6%) |
| $25,000 to $49,999 | 488 (75.3%) | 160 (24.7%) |
| $50,000 to $74,999 | 325 (44.1%) | 412 (55.9%) |
| $75,000 to $99,999 | 467 (60.7%) | 302 (39.3%) |
| $100,000 and over | 336 (54.8%) | 277 (45.2%) |
Public vs Private Health Insurance Coverage by Age in Fort Defiance
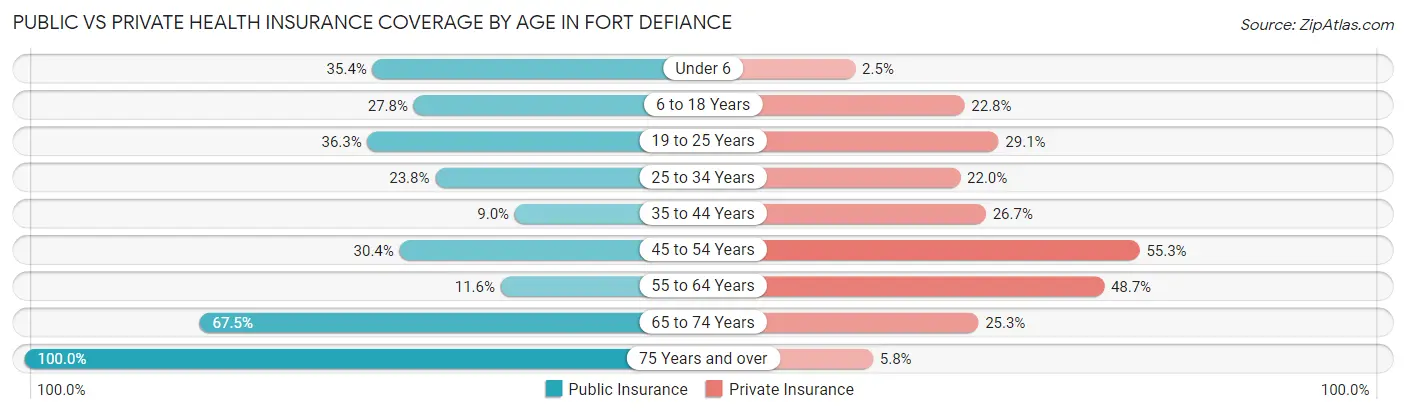
| Age Bracket | Public Insurance | Private Insurance |
| Under 6 | 57 (35.4%) | 4 (2.5%) |
| 6 to 18 Years | 216 (27.8%) | 177 (22.8%) |
| 19 to 25 Years | 165 (36.3%) | 132 (29.1%) |
| 25 to 34 Years | 131 (23.8%) | 121 (22.0%) |
| 35 to 44 Years | 34 (9.0%) | 101 (26.7%) |
| 45 to 54 Years | 110 (30.4%) | 200 (55.2%) |
| 55 to 64 Years | 52 (11.6%) | 218 (48.7%) |
| 65 to 74 Years | 160 (67.5%) | 60 (25.3%) |
| 75 Years and over | 156 (100.0%) | 9 (5.8%) |
| Total | 1,081 (30.7%) | 1,022 (29.0%) |
Disability Status by Sex by Age in Fort Defiance
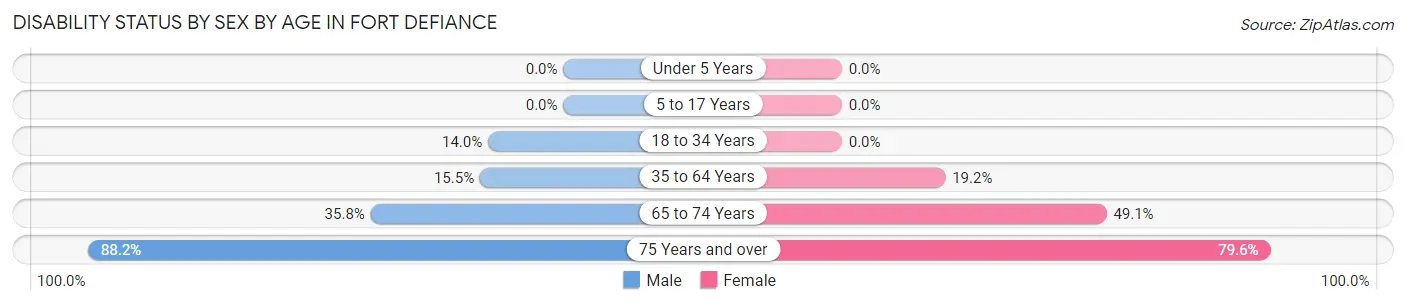
| Age Bracket | Male | Female |
| Under 5 Years | 0 (0.0%) | 0 (0.0%) |
| 5 to 17 Years | 0 (0.0%) | 0 (0.0%) |
| 18 to 34 Years | 72 (14.0%) | 0 (0.0%) |
| 35 to 64 Years | 71 (15.5%) | 140 (19.2%) |
| 65 to 74 Years | 44 (35.8%) | 56 (49.1%) |
| 75 Years and over | 60 (88.2%) | 70 (79.5%) |
Disability Class by Sex by Age in Fort Defiance
Disability Class: Hearing Difficulty
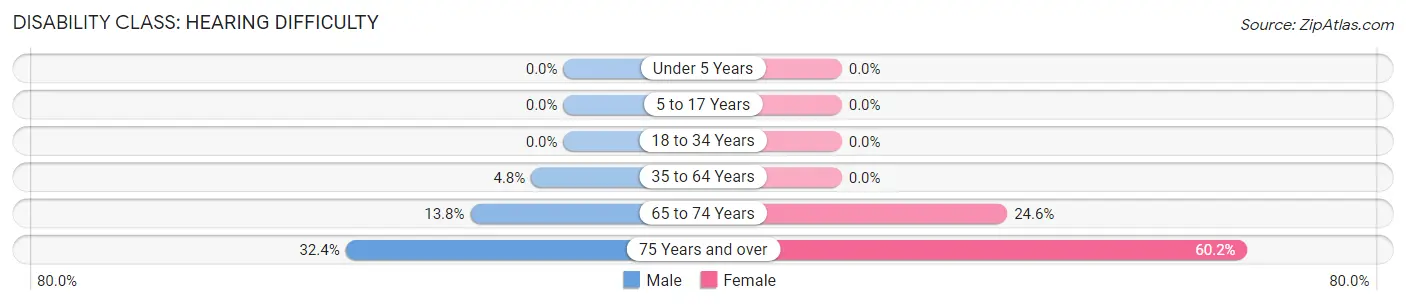
| Age Bracket | Male | Female |
| Under 5 Years | 0 (0.0%) | 0 (0.0%) |
| 5 to 17 Years | 0 (0.0%) | 0 (0.0%) |
| 18 to 34 Years | 0 (0.0%) | 0 (0.0%) |
| 35 to 64 Years | 22 (4.8%) | 0 (0.0%) |
| 65 to 74 Years | 17 (13.8%) | 28 (24.6%) |
| 75 Years and over | 22 (32.4%) | 53 (60.2%) |
Disability Class: Vision Difficulty
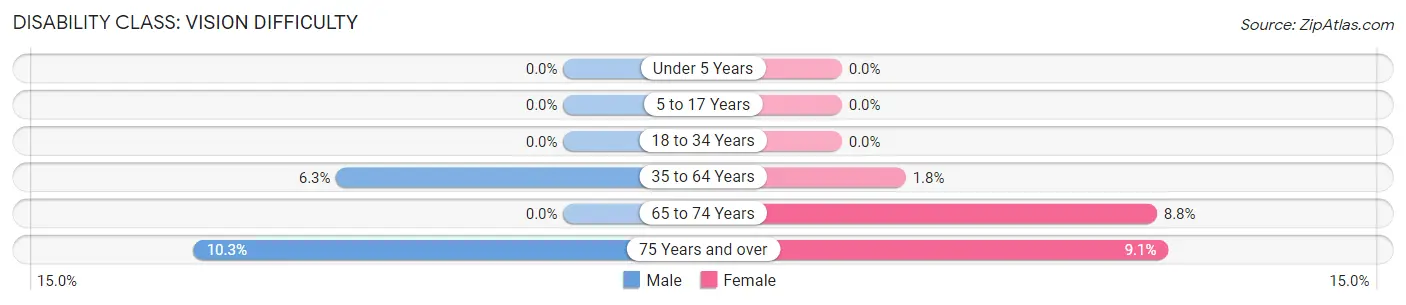
| Age Bracket | Male | Female |
| Under 5 Years | 0 (0.0%) | 0 (0.0%) |
| 5 to 17 Years | 0 (0.0%) | 0 (0.0%) |
| 18 to 34 Years | 0 (0.0%) | 0 (0.0%) |
| 35 to 64 Years | 29 (6.3%) | 13 (1.8%) |
| 65 to 74 Years | 0 (0.0%) | 10 (8.8%) |
| 75 Years and over | 7 (10.3%) | 8 (9.1%) |
Disability Class: Cognitive Difficulty
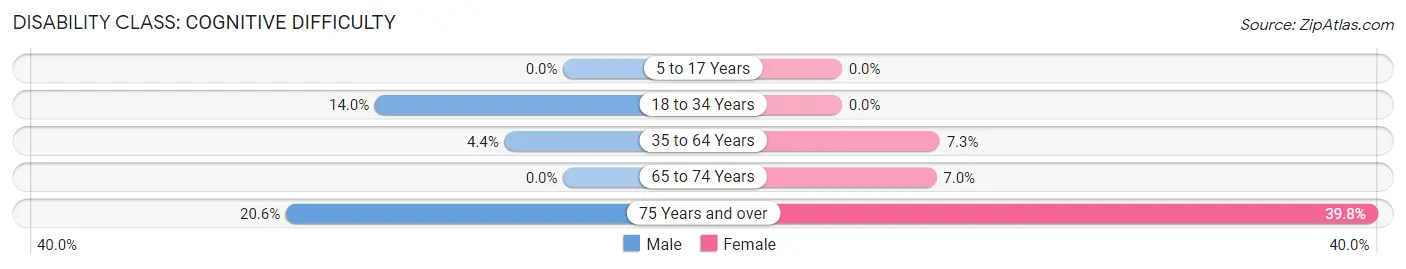
| Age Bracket | Male | Female |
| 5 to 17 Years | 0 (0.0%) | 0 (0.0%) |
| 18 to 34 Years | 72 (14.0%) | 0 (0.0%) |
| 35 to 64 Years | 20 (4.4%) | 53 (7.3%) |
| 65 to 74 Years | 0 (0.0%) | 8 (7.0%) |
| 75 Years and over | 14 (20.6%) | 35 (39.8%) |
Disability Class: Ambulatory Difficulty
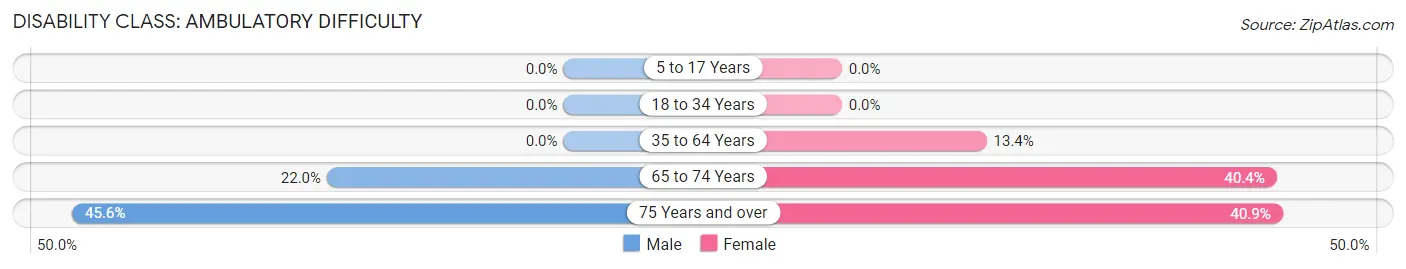
| Age Bracket | Male | Female |
| 5 to 17 Years | 0 (0.0%) | 0 (0.0%) |
| 18 to 34 Years | 0 (0.0%) | 0 (0.0%) |
| 35 to 64 Years | 0 (0.0%) | 98 (13.4%) |
| 65 to 74 Years | 27 (22.0%) | 46 (40.4%) |
| 75 Years and over | 31 (45.6%) | 36 (40.9%) |
Disability Class: Self-Care Difficulty
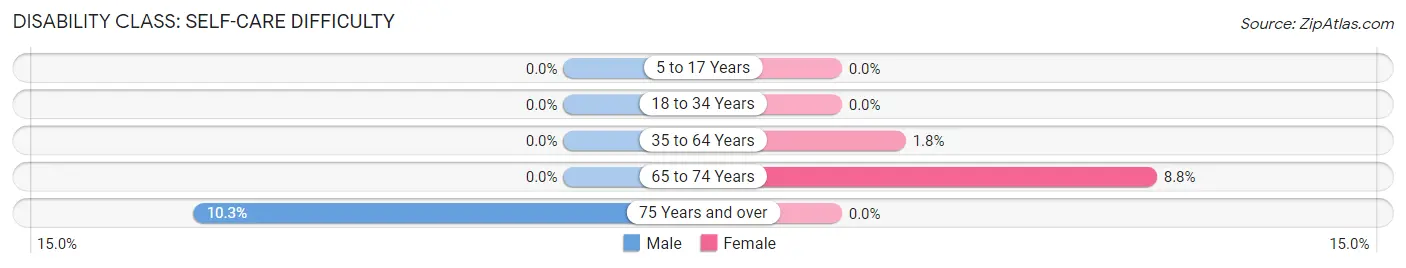
| Age Bracket | Male | Female |
| 5 to 17 Years | 0 (0.0%) | 0 (0.0%) |
| 18 to 34 Years | 0 (0.0%) | 0 (0.0%) |
| 35 to 64 Years | 0 (0.0%) | 13 (1.8%) |
| 65 to 74 Years | 0 (0.0%) | 10 (8.8%) |
| 75 Years and over | 7 (10.3%) | 0 (0.0%) |
Technology Access in Fort Defiance
Computing Device Access in Fort Defiance
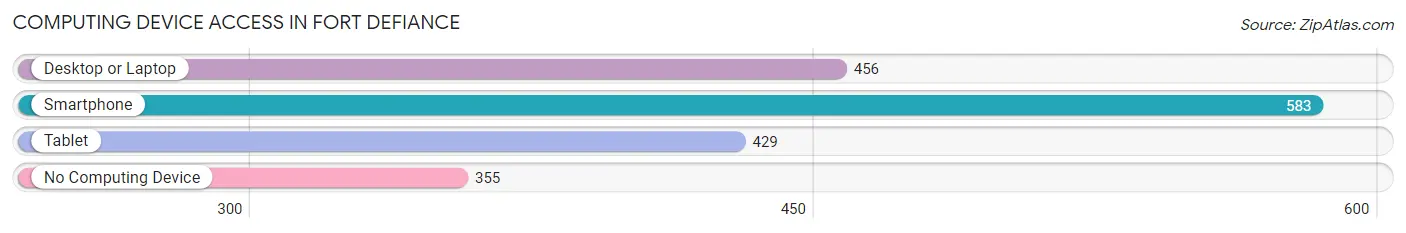
| Device Type | # Households | % Households |
| Desktop or Laptop | 456 | 47.0% |
| Smartphone | 583 | 60.0% |
| Tablet | 429 | 44.2% |
| No Computing Device | 355 | 36.6% |
| Total | 971 | 100.0% |
Internet Access in Fort Defiance
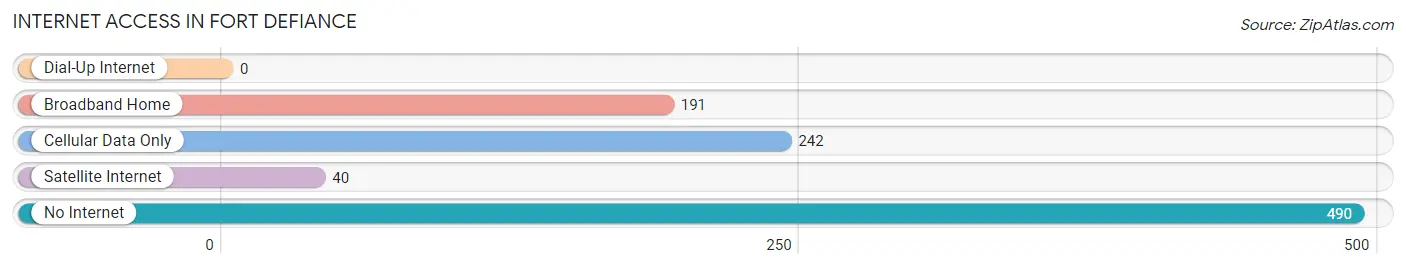
| Internet Type | # Households | % Households |
| Dial-Up Internet | 0 | 0.0% |
| Broadband Home | 191 | 19.7% |
| Cellular Data Only | 242 | 24.9% |
| Satellite Internet | 40 | 4.1% |
| No Internet | 490 | 50.5% |
| Total | 971 | 100.0% |
Fort Defiance Summary
Fort Defiance, Arizona is a small town located in Apache County, Arizona. It is situated on the Navajo Nation Reservation, and is the county seat of Apache County. The town was established in 1868 by the United States Army as a military post to protect the Navajo people from raids by the Apache and other Native American tribes. The town was named after a nearby fortification built by the Navajo people to protect their land from the U.S. Army.
Geography
Fort Defiance is located in the northeastern corner of Arizona, near the Four Corners region. It is situated at an elevation of 5,945 feet, and is surrounded by the Chuska Mountains to the east, the Carrizo Mountains to the west, and the Defiance Plateau to the south. The town is located on the Navajo Nation Reservation, and is the county seat of Apache County. The town is located approximately 30 miles east of Window Rock, the capital of the Navajo Nation.
The climate in Fort Defiance is semi-arid, with hot summers and cold winters. The average annual temperature is 57°F, with an average high of 79°F in the summer and an average low of 35°F in the winter. The average annual precipitation is 11.5 inches, with most of the precipitation occurring in the summer months.
Economy
The economy of Fort Defiance is largely based on agriculture and tourism. The town is home to a number of farms and ranches, which produce a variety of crops, including corn, wheat, and hay. The town is also home to a number of tourist attractions, including the Navajo Nation Museum, the Navajo Nation Zoo, and the Navajo Nation Cultural Center.
The town is also home to a number of businesses, including a grocery store, a hardware store, a gas station, and a number of restaurants. The town is also home to a number of government offices, including the Apache County Courthouse, the Navajo Nation Tribal Council, and the Navajo Nation Police Department.
Demographics
As of the 2010 census, the population of Fort Defiance was 3,624. The population is predominantly Native American, with the majority of the population being Navajo. The median age of the population is 28.7 years, and the median household income is $30,938.
Conclusion
Fort Defiance, Arizona is a small town located in Apache County, Arizona. It is situated on the Navajo Nation Reservation, and is the county seat of Apache County. The town was established in 1868 by the United States Army as a military post to protect the Navajo people from raids by the Apache and other Native American tribes. The town is home to a number of farms and ranches, as well as a number of tourist attractions. The economy of the town is largely based on agriculture and tourism, and the population is predominantly Native American, with the majority of the population being Navajo.
Common Questions
What is Per Capita Income in Fort Defiance?
Per Capita income in Fort Defiance is $21,793.
What is the Median Family Income in Fort Defiance?
Median Family Income in Fort Defiance is $55,938.
What is the Median Household income in Fort Defiance?
Median Household Income in Fort Defiance is $50,320.
What is Income or Wage Gap in Fort Defiance?
Income or Wage Gap in Fort Defiance is 9.0%.
Women in Fort Defiance earn 91.0 cents for every dollar earned by a man.
What is Inequality or Gini Index in Fort Defiance?
Inequality or Gini Index in Fort Defiance is 0.49.
What is the Total Population of Fort Defiance?
Total Population of Fort Defiance is 3,528.
What is the Total Male Population of Fort Defiance?
Total Male Population of Fort Defiance is 1,660.
What is the Total Female Population of Fort Defiance?
Total Female Population of Fort Defiance is 1,868.
What is the Ratio of Males per 100 Females in Fort Defiance?
There are 88.87 Males per 100 Females in Fort Defiance.
What is the Ratio of Females per 100 Males in Fort Defiance?
There are 112.53 Females per 100 Males in Fort Defiance.
What is the Median Population Age in Fort Defiance?
Median Population Age in Fort Defiance is 32.5 Years.
What is the Average Family Size in Fort Defiance
Average Family Size in Fort Defiance is 5.0 People.
What is the Average Household Size in Fort Defiance
Average Household Size in Fort Defiance is 3.6 People.
How Large is the Labor Force in Fort Defiance?
There are 1,453 People in the Labor Forcein in Fort Defiance.
What is the Percentage of People in the Labor Force in Fort Defiance?
52.3% of People are in the Labor Force in Fort Defiance.
What is the Unemployment Rate in Fort Defiance?
Unemployment Rate in Fort Defiance is 9.2%.