Cedar Creek, AZ Map & Demographics
Cedar Creek Map
Cedar Creek Overview
$13,880
PER CAPITA INCOME
$50,417
AVG FAMILY INCOME
$48,393
AVG HOUSEHOLD INCOME
45.3%
WAGE / INCOME GAP [ % ]
54.7¢/ $1
WAGE / INCOME GAP [ $ ]
0.38
INEQUALITY / GINI INDEX
396
TOTAL POPULATION
163
MALE POPULATION
233
FEMALE POPULATION
69.96
MALES / 100 FEMALES
142.94
FEMALES / 100 MALES
27.2
MEDIAN AGE
4.8
AVG FAMILY SIZE
4.3
AVG HOUSEHOLD SIZE
209
LABOR FORCE [ PEOPLE ]
76.3%
PERCENT IN LABOR FORCE
8.1%
UNEMPLOYMENT RATE
Income in Cedar Creek
Income Overview in Cedar Creek
Per Capita Income in Cedar Creek is $13,880, while median incomes of families and households are $50,417 and $48,393 respectively.
| Characteristic | Number | Measure |
| Per Capita Income | 396 | $13,880 |
| Median Family Income | 80 | $50,417 |
| Mean Family Income | 80 | $58,269 |
| Median Household Income | 91 | $48,393 |
| Mean Household Income | 91 | $52,722 |
| Income Deficit | 80 | $0 |
| Wage / Income Gap (%) | 396 | 45.26% |
| Wage / Income Gap ($) | 396 | 54.74¢ per $1 |
| Gini / Inequality Index | 396 | 0.38 |
Earnings by Sex in Cedar Creek
Average Earnings in Cedar Creek are $18,889, $12,727 for men and $23,250 for women, a difference of 45.3%.
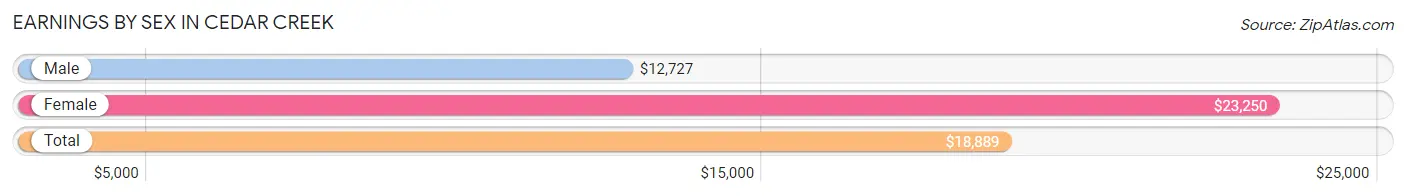
| Sex | Number | Average Earnings |
| Male | 100 (52.1%) | $12,727 |
| Female | 92 (47.9%) | $23,250 |
| Total | 192 (100.0%) | $18,889 |
Earnings by Sex by Income Bracket in Cedar Creek
The most common earnings brackets in Cedar Creek are $2,499 or less for men (21 | 21.0%) and $17,500 to $19,999 for women (27 | 29.3%).
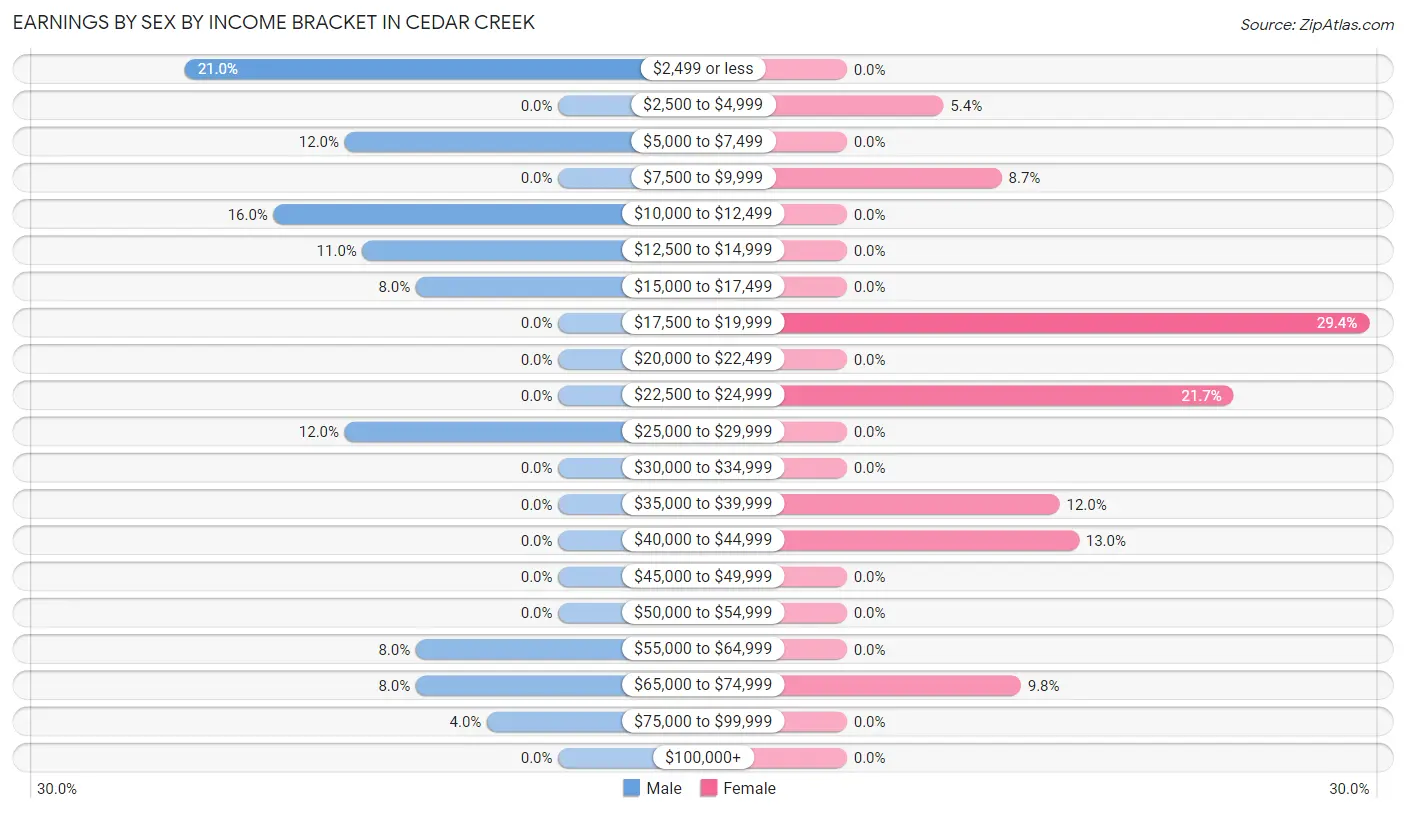
| Income | Male | Female |
| $2,499 or less | 21 (21.0%) | 0 (0.0%) |
| $2,500 to $4,999 | 0 (0.0%) | 5 (5.4%) |
| $5,000 to $7,499 | 12 (12.0%) | 0 (0.0%) |
| $7,500 to $9,999 | 0 (0.0%) | 8 (8.7%) |
| $10,000 to $12,499 | 16 (16.0%) | 0 (0.0%) |
| $12,500 to $14,999 | 11 (11.0%) | 0 (0.0%) |
| $15,000 to $17,499 | 8 (8.0%) | 0 (0.0%) |
| $17,500 to $19,999 | 0 (0.0%) | 27 (29.3%) |
| $20,000 to $22,499 | 0 (0.0%) | 0 (0.0%) |
| $22,500 to $24,999 | 0 (0.0%) | 20 (21.7%) |
| $25,000 to $29,999 | 12 (12.0%) | 0 (0.0%) |
| $30,000 to $34,999 | 0 (0.0%) | 0 (0.0%) |
| $35,000 to $39,999 | 0 (0.0%) | 11 (12.0%) |
| $40,000 to $44,999 | 0 (0.0%) | 12 (13.0%) |
| $45,000 to $49,999 | 0 (0.0%) | 0 (0.0%) |
| $50,000 to $54,999 | 0 (0.0%) | 0 (0.0%) |
| $55,000 to $64,999 | 8 (8.0%) | 0 (0.0%) |
| $65,000 to $74,999 | 8 (8.0%) | 9 (9.8%) |
| $75,000 to $99,999 | 4 (4.0%) | 0 (0.0%) |
| $100,000+ | 0 (0.0%) | 0 (0.0%) |
| Total | 100 (100.0%) | 92 (100.0%) |
Earnings by Sex by Educational Attainment in Cedar Creek
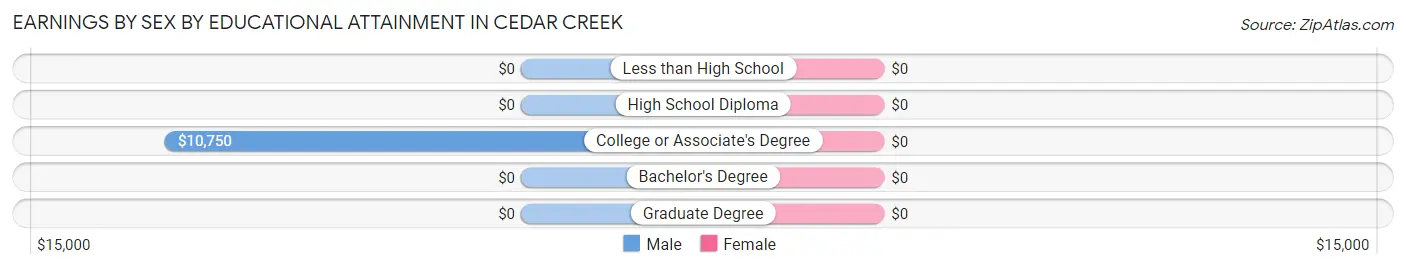
| Educational Attainment | Male Income | Female Income |
| Less than High School | - | - |
| High School Diploma | - | - |
| College or Associate's Degree | $10,750 | $0 |
| Bachelor's Degree | - | - |
| Graduate Degree | - | - |
| Total | $14,205 | $24,500 |
Family Income in Cedar Creek
Family Income Brackets in Cedar Creek
According to the Cedar Creek family income data, there are 22 families falling into the $50,000 to $74,999 income range, which is the most common income bracket and makes up 27.5% of all families.
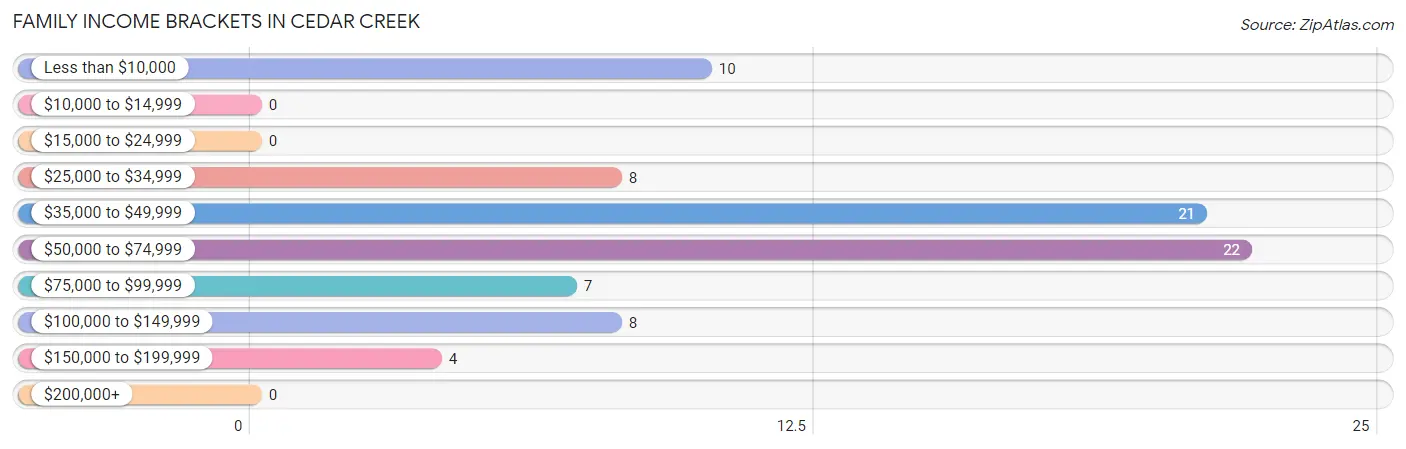
| Income Bracket | # Families | % Families |
| Less than $10,000 | 10 | 12.5% |
| $10,000 to $14,999 | 0 | 0.0% |
| $15,000 to $24,999 | 0 | 0.0% |
| $25,000 to $34,999 | 8 | 10.0% |
| $35,000 to $49,999 | 21 | 26.3% |
| $50,000 to $74,999 | 22 | 27.5% |
| $75,000 to $99,999 | 7 | 8.8% |
| $100,000 to $149,999 | 8 | 10.0% |
| $150,000 to $199,999 | 4 | 5.0% |
| $200,000+ | 0 | 0.0% |
Family Income by Famaliy Size in Cedar Creek
| Income Bracket | # Families | Median Income |
| 2-Person Families | 17 (21.2%) | $0 |
| 3-Person Families | 21 (26.3%) | $0 |
| 4-Person Families | 8 (10.0%) | $0 |
| 5-Person Families | 18 (22.5%) | $0 |
| 6-Person Families | 10 (12.5%) | $0 |
| 7+ Person Families | 6 (7.5%) | $0 |
| Total | 80 (100.0%) | $50,417 |
Family Income by Number of Earners in Cedar Creek

| Number of Earners | # Families | Median Income |
| No Earners | 10 (12.5%) | $0 |
| 1 Earner | 14 (17.5%) | $0 |
| 2 Earners | 28 (35.0%) | $0 |
| 3+ Earners | 28 (35.0%) | $55,000 |
| Total | 80 (100.0%) | $50,417 |
Household Income in Cedar Creek
Household Income Brackets in Cedar Creek
With 22 households falling in the category, the $50,000 to $74,999 income range is the most frequent in Cedar Creek, accounting for 24.2% of all households.
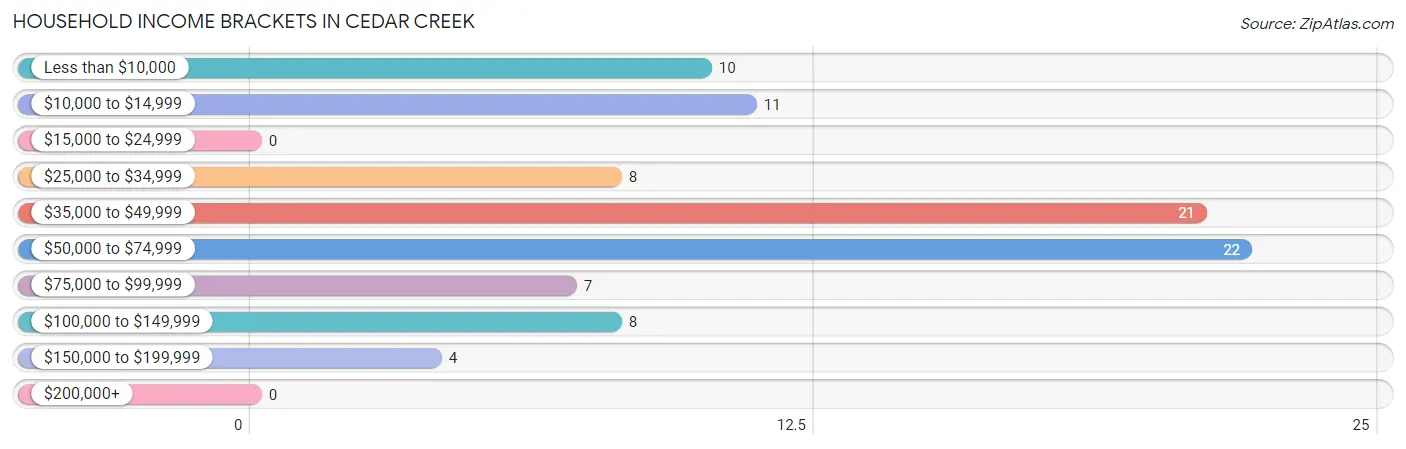
| Income Bracket | # Households | % Households |
| Less than $10,000 | 10 | 11.0% |
| $10,000 to $14,999 | 11 | 12.1% |
| $15,000 to $24,999 | 0 | 0.0% |
| $25,000 to $34,999 | 8 | 8.8% |
| $35,000 to $49,999 | 21 | 23.1% |
| $50,000 to $74,999 | 22 | 24.2% |
| $75,000 to $99,999 | 7 | 7.7% |
| $100,000 to $149,999 | 8 | 8.8% |
| $150,000 to $199,999 | 4 | 4.4% |
| $200,000+ | 0 | 0.0% |
Household Income by Householder Age in Cedar Creek
| Income Bracket | # Households | Median Income |
| 15 to 24 Years | 0 (0.0%) | $0 |
| 25 to 44 Years | 22 (24.2%) | $0 |
| 45 to 64 Years | 55 (60.4%) | $0 |
| 65+ Years | 14 (15.4%) | $0 |
| Total | 91 (100.0%) | $48,393 |
Poverty in Cedar Creek
Income Below Poverty by Sex and Age in Cedar Creek
With 39.9% poverty level for males and 33.1% for females among the residents of Cedar Creek, 16 and 17 year old males and 55 to 64 year old females are the most vulnerable to poverty, with 8 males (100.0%) and 27 females (100.0%) in their respective age groups living below the poverty level.
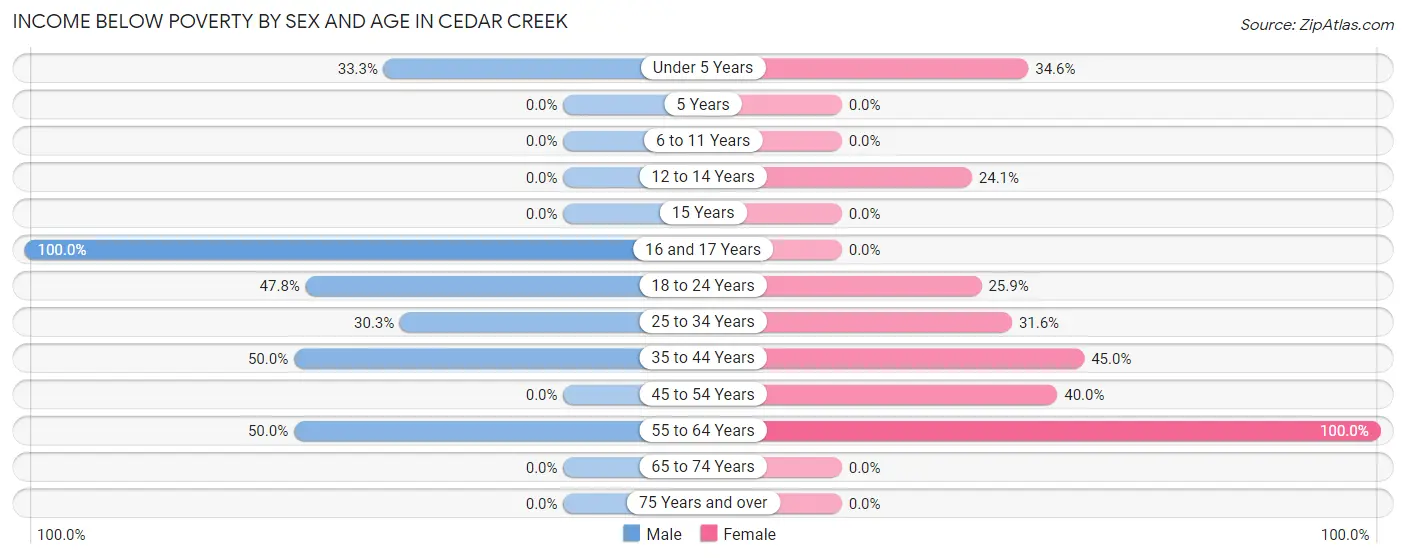
| Age Bracket | Male | Female |
| Under 5 Years | 10 (33.3%) | 9 (34.6%) |
| 5 Years | 0 (0.0%) | 0 (0.0%) |
| 6 to 11 Years | 0 (0.0%) | 0 (0.0%) |
| 12 to 14 Years | 0 (0.0%) | 7 (24.1%) |
| 15 Years | 0 (0.0%) | 0 (0.0%) |
| 16 and 17 Years | 8 (100.0%) | 0 (0.0%) |
| 18 to 24 Years | 11 (47.8%) | 7 (25.9%) |
| 25 to 34 Years | 10 (30.3%) | 12 (31.6%) |
| 35 to 44 Years | 16 (50.0%) | 9 (45.0%) |
| 45 to 54 Years | 0 (0.0%) | 6 (40.0%) |
| 55 to 64 Years | 10 (50.0%) | 27 (100.0%) |
| 65 to 74 Years | 0 (0.0%) | 0 (0.0%) |
| 75 Years and over | 0 (0.0%) | 0 (0.0%) |
| Total | 65 (39.9%) | 77 (33.1%) |
Income Above Poverty by Sex and Age in Cedar Creek
According to the poverty statistics in Cedar Creek, males aged 45 to 54 years and females aged 5 years are the age groups that are most secure financially, with 100.0% of males and 100.0% of females in these age groups living above the poverty line.
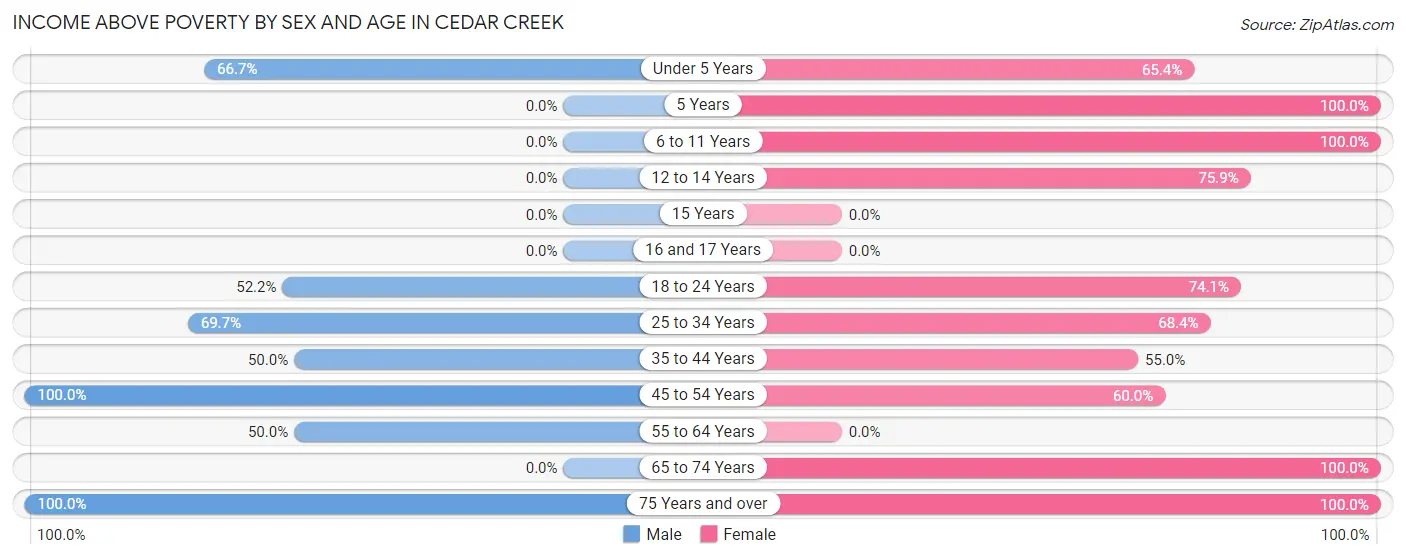
| Age Bracket | Male | Female |
| Under 5 Years | 20 (66.7%) | 17 (65.4%) |
| 5 Years | 0 (0.0%) | 7 (100.0%) |
| 6 to 11 Years | 0 (0.0%) | 30 (100.0%) |
| 12 to 14 Years | 0 (0.0%) | 22 (75.9%) |
| 15 Years | 0 (0.0%) | 0 (0.0%) |
| 16 and 17 Years | 0 (0.0%) | 0 (0.0%) |
| 18 to 24 Years | 12 (52.2%) | 20 (74.1%) |
| 25 to 34 Years | 23 (69.7%) | 26 (68.4%) |
| 35 to 44 Years | 16 (50.0%) | 11 (55.0%) |
| 45 to 54 Years | 10 (100.0%) | 9 (60.0%) |
| 55 to 64 Years | 10 (50.0%) | 0 (0.0%) |
| 65 to 74 Years | 0 (0.0%) | 7 (100.0%) |
| 75 Years and over | 7 (100.0%) | 7 (100.0%) |
| Total | 98 (60.1%) | 156 (66.9%) |
Income Below Poverty Among Married-Couple Families in Cedar Creek
The poverty statistics for married-couple families in Cedar Creek show that 29.1% or 16 of the total 55 families live below the poverty line. Families with no children have the highest poverty rate of 58.8%, comprising of 10 families. On the other hand, families with 3 or 4 children have the lowest poverty rate of 0.0%, which includes 0 families.
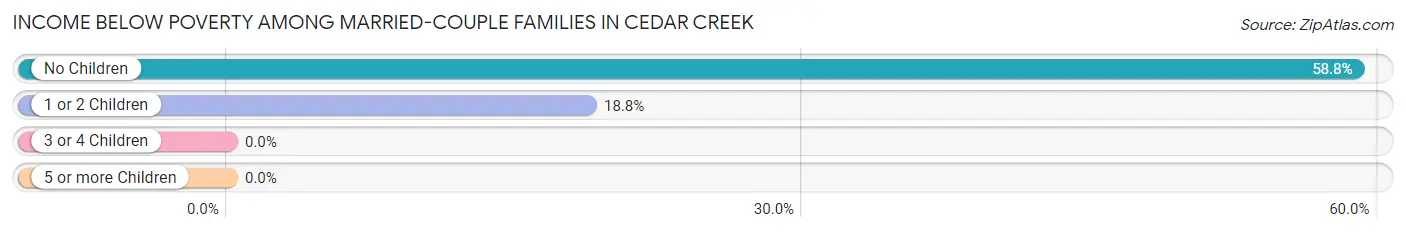
| Children | Above Poverty | Below Poverty |
| No Children | 7 (41.2%) | 10 (58.8%) |
| 1 or 2 Children | 26 (81.2%) | 6 (18.8%) |
| 3 or 4 Children | 6 (100.0%) | 0 (0.0%) |
| 5 or more Children | 0 (0.0%) | 0 (0.0%) |
| Total | 39 (70.9%) | 16 (29.1%) |
Income Below Poverty Among Single-Parent Households in Cedar Creek
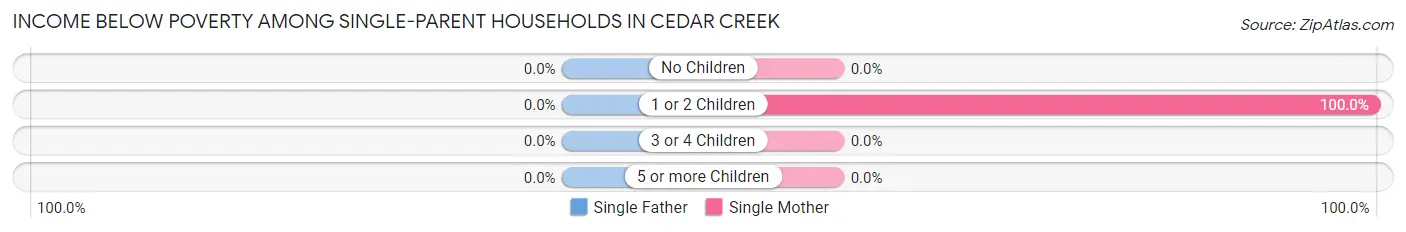
| Children | Single Father | Single Mother |
| No Children | 0 (0.0%) | 0 (0.0%) |
| 1 or 2 Children | 0 (0.0%) | 8 (100.0%) |
| 3 or 4 Children | 0 (0.0%) | 0 (0.0%) |
| 5 or more Children | 0 (0.0%) | 0 (0.0%) |
| Total | 0 (0.0%) | 8 (53.3%) |
Income Below Poverty Among Married-Couple vs Single-Parent Households in Cedar Creek
The poverty data for Cedar Creek shows that 16 of the married-couple family households (29.1%) and 8 of the single-parent households (32.0%) are living below the poverty level. Within the married-couple family households, those with no children have the highest poverty rate, with 10 households (58.8%) falling below the poverty line. Among the single-parent households, those with 1 or 2 children have the highest poverty rate, with 8 household (44.4%) living below poverty.
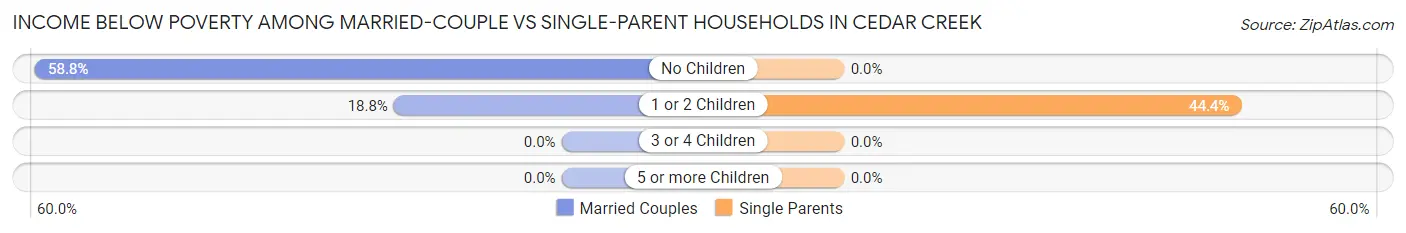
| Children | Married-Couple Families | Single-Parent Households |
| No Children | 10 (58.8%) | 0 (0.0%) |
| 1 or 2 Children | 6 (18.8%) | 8 (44.4%) |
| 3 or 4 Children | 0 (0.0%) | 0 (0.0%) |
| 5 or more Children | 0 (0.0%) | 0 (0.0%) |
| Total | 16 (29.1%) | 8 (32.0%) |
Race in Cedar Creek
The most populous races in Cedar Creek are , and Native / Alaskan (396 | 100.0%).
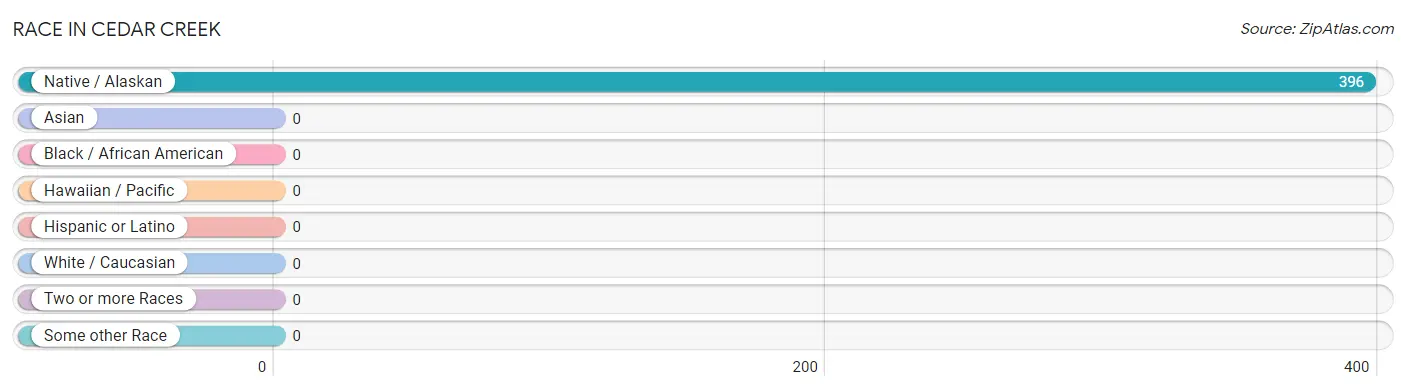
| Race | # Population | % Population |
| Asian | 0 | 0.0% |
| Black / African American | 0 | 0.0% |
| Hawaiian / Pacific | 0 | 0.0% |
| Hispanic or Latino | 0 | 0.0% |
| Native / Alaskan | 396 | 100.0% |
| White / Caucasian | 0 | 0.0% |
| Two or more Races | 0 | 0.0% |
| Some other Race | 0 | 0.0% |
| Total | 396 | 100.0% |
Ancestry in Cedar Creek
The most populous ancestries reported in Cedar Creek are Apache (370 | 93.4%), Tohono O'Odham (23 | 5.8%), and Navajo (18 | 4.5%), together accounting for 103.8% of all Cedar Creek residents.
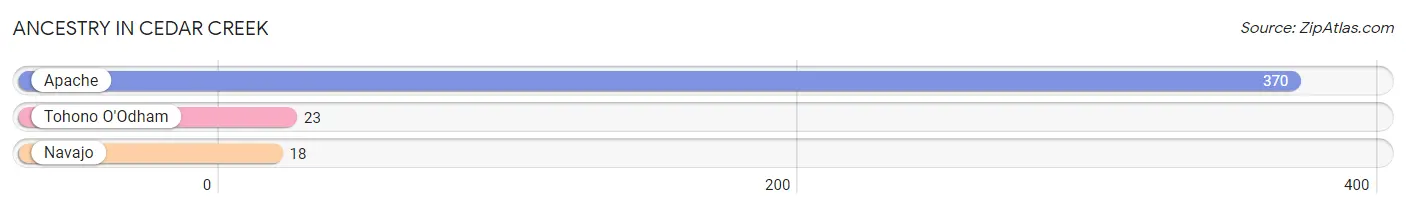
| Ancestry | # Population | % Population |
| Apache | 370 | 93.4% |
| Navajo | 18 | 4.5% |
| Tohono O'Odham | 23 | 5.8% | View All 3 Rows |
Immigrants in Cedar Creek

| Immigration Origin | # Population | % Population | View All 0 Rows |
Sex and Age in Cedar Creek
Sex and Age in Cedar Creek
The most populous age groups in Cedar Creek are 25 to 29 Years (33 | 20.3%) for men and 5 to 9 Years (37 | 15.9%) for women.
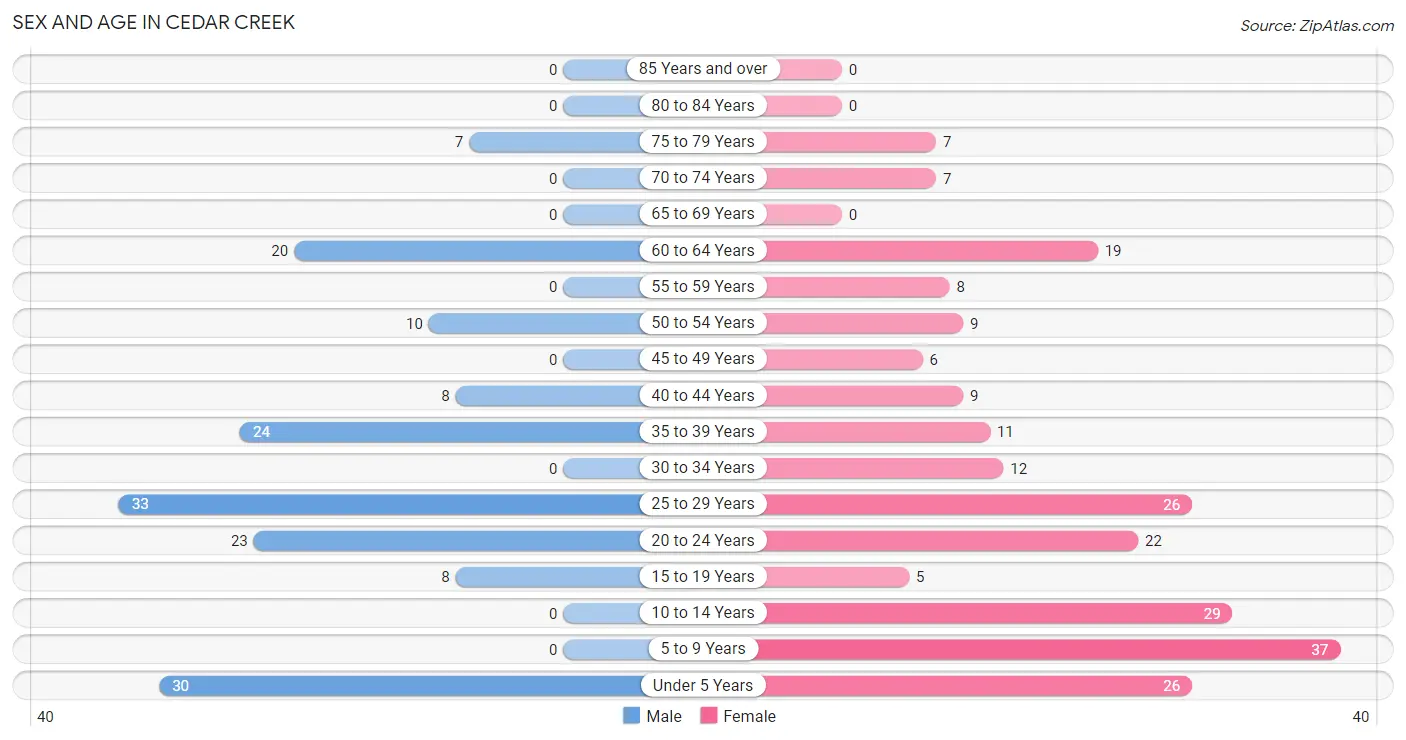
| Age Bracket | Male | Female |
| Under 5 Years | 30 (18.4%) | 26 (11.2%) |
| 5 to 9 Years | 0 (0.0%) | 37 (15.9%) |
| 10 to 14 Years | 0 (0.0%) | 29 (12.4%) |
| 15 to 19 Years | 8 (4.9%) | 5 (2.1%) |
| 20 to 24 Years | 23 (14.1%) | 22 (9.4%) |
| 25 to 29 Years | 33 (20.3%) | 26 (11.2%) |
| 30 to 34 Years | 0 (0.0%) | 12 (5.1%) |
| 35 to 39 Years | 24 (14.7%) | 11 (4.7%) |
| 40 to 44 Years | 8 (4.9%) | 9 (3.9%) |
| 45 to 49 Years | 0 (0.0%) | 6 (2.6%) |
| 50 to 54 Years | 10 (6.1%) | 9 (3.9%) |
| 55 to 59 Years | 0 (0.0%) | 8 (3.4%) |
| 60 to 64 Years | 20 (12.3%) | 19 (8.2%) |
| 65 to 69 Years | 0 (0.0%) | 0 (0.0%) |
| 70 to 74 Years | 0 (0.0%) | 7 (3.0%) |
| 75 to 79 Years | 7 (4.3%) | 7 (3.0%) |
| 80 to 84 Years | 0 (0.0%) | 0 (0.0%) |
| 85 Years and over | 0 (0.0%) | 0 (0.0%) |
| Total | 163 (100.0%) | 233 (100.0%) |
Families and Households in Cedar Creek
Median Family Size in Cedar Creek
The median family size in Cedar Creek is 4.75 persons per family, with married-couple families (55 | 68.8%) accounting for the largest median family size of 5.11 persons per family. On the other hand, single female/mother families (15 | 18.8%) represent the smallest median family size with 3.80 persons per family.
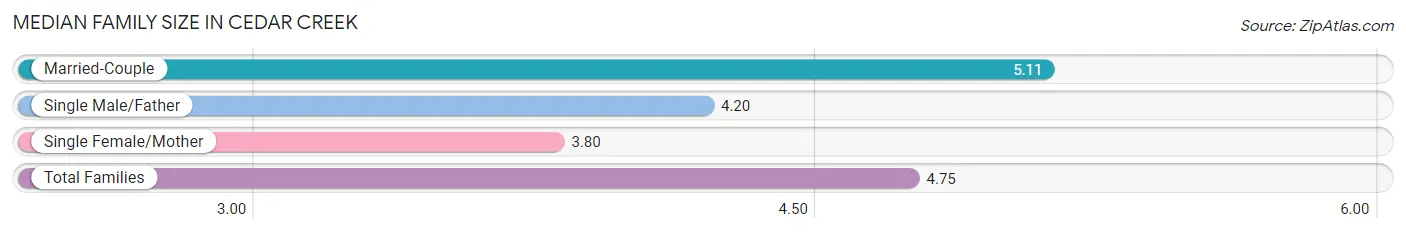
| Family Type | # Families | Family Size |
| Married-Couple | 55 (68.8%) | 5.11 |
| Single Male/Father | 10 (12.5%) | 4.20 |
| Single Female/Mother | 15 (18.8%) | 3.80 |
| Total Families | 80 (100.0%) | 4.75 |
Median Household Size in Cedar Creek
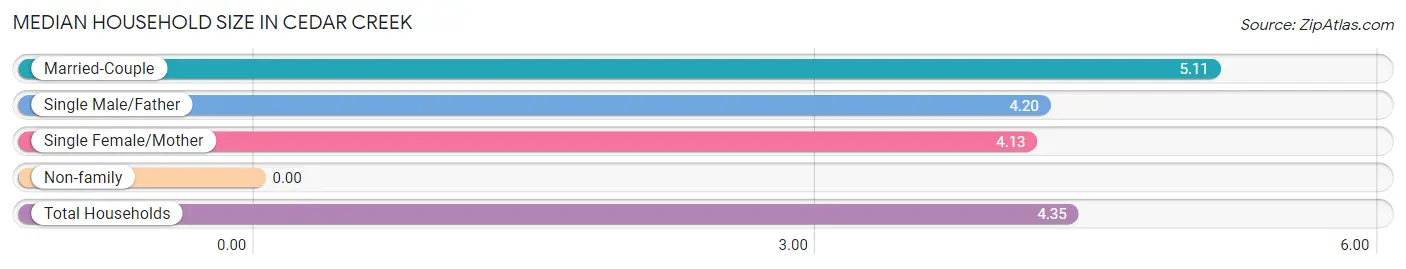
| Household Type | # Households | Household Size |
| Married-Couple | 55 (60.4%) | 5.11 |
| Single Male/Father | 10 (11.0%) | 4.20 |
| Single Female/Mother | 15 (16.5%) | 4.13 |
| Non-family | 11 (12.1%) | - |
| Total Households | 91 (100.0%) | 4.35 |
Household Size by Marriage Status in Cedar Creek
Out of a total of 91 households in Cedar Creek, 80 (87.9%) are family households, while 11 (12.1%) are nonfamily households. The most numerous type of family households are 3-person households, comprising 28, and the most common type of nonfamily households are 1-person households, comprising 11.
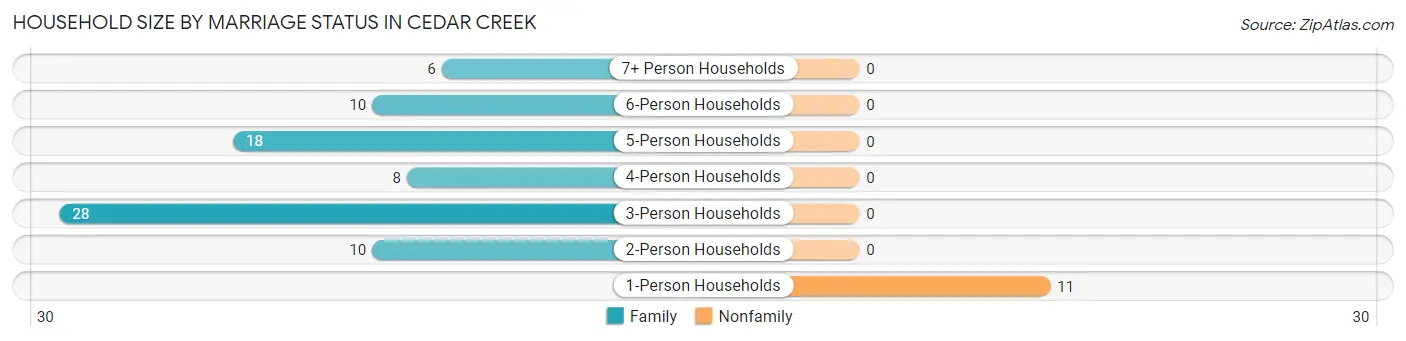
| Household Size | Family Households | Nonfamily Households |
| 1-Person Households | - | 11 (12.1%) |
| 2-Person Households | 10 (11.0%) | 0 (0.0%) |
| 3-Person Households | 28 (30.8%) | 0 (0.0%) |
| 4-Person Households | 8 (8.8%) | 0 (0.0%) |
| 5-Person Households | 18 (19.8%) | 0 (0.0%) |
| 6-Person Households | 10 (11.0%) | 0 (0.0%) |
| 7+ Person Households | 6 (6.6%) | 0 (0.0%) |
| Total | 80 (87.9%) | 11 (12.1%) |
Female Fertility in Cedar Creek
Fertility by Age in Cedar Creek
| Age Bracket | Women with Births | Births / 1,000 Women |
| 15 to 19 years | 0 (0.0%) | 0.0 |
| 20 to 34 years | 0 (0.0%) | 0.0 |
| 35 to 50 years | 0 (0.0%) | 0.0 |
| Total | 0 (0.0%) | 0.0 |
Fertility by Age by Marriage Status in Cedar Creek
| Age Bracket | Married | Unmarried |
| 15 to 19 years | 0 (0.0%) | 0 (0.0%) |
| 20 to 34 years | 0 (0.0%) | 0 (0.0%) |
| 35 to 50 years | 0 (0.0%) | 0 (0.0%) |
| Total | 0 (0.0%) | 0 (0.0%) |
Fertility by Education in Cedar Creek
| Educational Attainment | Women with Births | Births / 1,000 Women |
| Less than High School | 0 (0.0%) | 0.0 |
| High School Diploma | 0 (0.0%) | 0.0 |
| College or Associate's Degree | 0 (0.0%) | 0.0 |
| Bachelor's Degree | 0 (0.0%) | 0.0 |
| Graduate Degree | 0 (0.0%) | 0.0 |
| Total | 0 (0.0%) | 0.0 |
Fertility by Education by Marriage Status in Cedar Creek
| Educational Attainment | Married | Unmarried |
| Less than High School | 0 (0.0%) | 0 (0.0%) |
| High School Diploma | 0 (0.0%) | 0 (0.0%) |
| College or Associate's Degree | 0 (0.0%) | 0 (0.0%) |
| Bachelor's Degree | 0 (0.0%) | 0 (0.0%) |
| Graduate Degree | 0 (0.0%) | 0 (0.0%) |
| Total | 0 (0.0%) | 0 (0.0%) |
Employment Characteristics in Cedar Creek
Employment by Class of Employer in Cedar Creek
Among the 186 employed individuals in Cedar Creek, private company employees (82 | 44.1%), local government employees (60 | 32.3%), and state government employees (22 | 11.8%) make up the most common classes of employment.
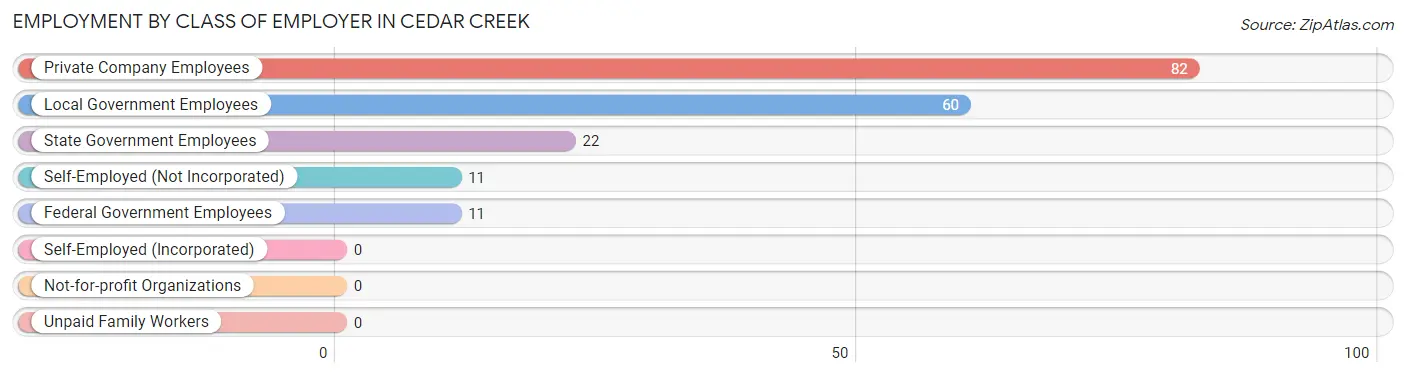
| Employer Class | # Employees | % Employees |
| Private Company Employees | 82 | 44.1% |
| Self-Employed (Incorporated) | 0 | 0.0% |
| Self-Employed (Not Incorporated) | 11 | 5.9% |
| Not-for-profit Organizations | 0 | 0.0% |
| Local Government Employees | 60 | 32.3% |
| State Government Employees | 22 | 11.8% |
| Federal Government Employees | 11 | 5.9% |
| Unpaid Family Workers | 0 | 0.0% |
| Total | 186 | 100.0% |
Employment Status by Age in Cedar Creek
According to the labor force statistics for Cedar Creek, out of the total population over 16 years of age (274), 76.3% or 209 individuals are in the labor force, with 8.1% or 17 of them unemployed. The age group with the highest labor force participation rate is 16 to 19 years, with 100.0% or 13 individuals in the labor force. Within the labor force, the 20 to 24 years age range has the highest percentage of unemployed individuals, with 17.9% or 7 of them being unemployed.
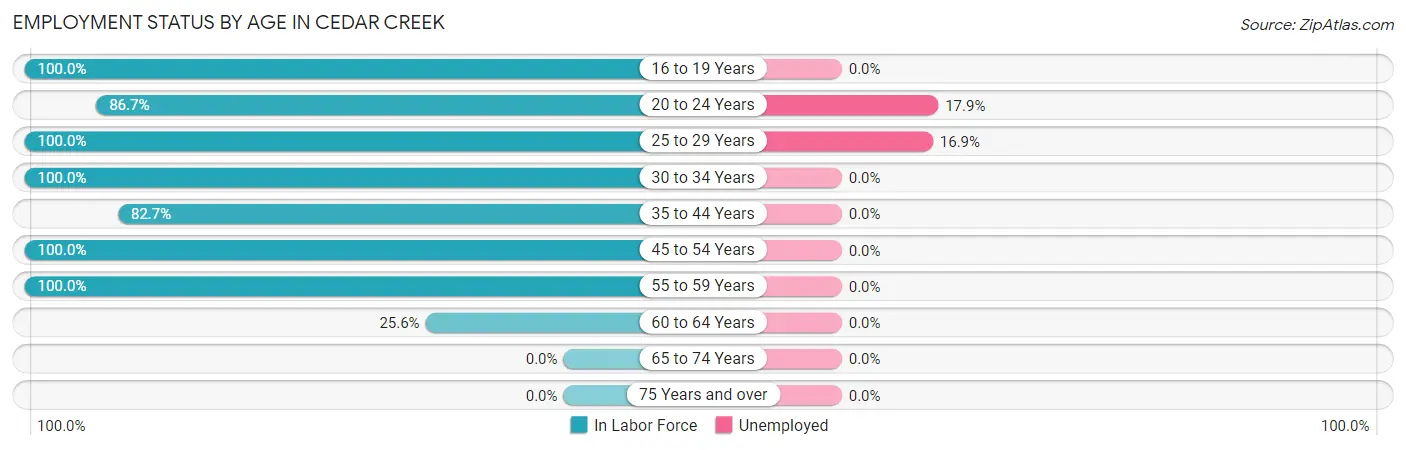
| Age Bracket | In Labor Force | Unemployed |
| 16 to 19 Years | 13 (100.0%) | 0 (0.0%) |
| 20 to 24 Years | 39 (86.7%) | 7 (17.9%) |
| 25 to 29 Years | 59 (100.0%) | 10 (16.9%) |
| 30 to 34 Years | 12 (100.0%) | 0 (0.0%) |
| 35 to 44 Years | 43 (82.7%) | 0 (0.0%) |
| 45 to 54 Years | 25 (100.0%) | 0 (0.0%) |
| 55 to 59 Years | 8 (100.0%) | 0 (0.0%) |
| 60 to 64 Years | 10 (25.6%) | 0 (0.0%) |
| 65 to 74 Years | 0 (0.0%) | 0 (0.0%) |
| 75 Years and over | 0 (0.0%) | 0 (0.0%) |
| Total | 209 (76.3%) | 17 (8.1%) |
Employment Status by Educational Attainment in Cedar Creek
According to labor force statistics for Cedar Creek, 80.5% of individuals (157) out of the total population between 25 and 64 years of age (195) are in the labor force, with 6.4% or 10 of them being unemployed. The group with the highest labor force participation rate are those with the educational attainment of college / associate degree, with 89.6% or 95 individuals in the labor force. Within the labor force, individuals with less than high school education have the highest percentage of unemployment, with 45.5% or 10 of them being unemployed.
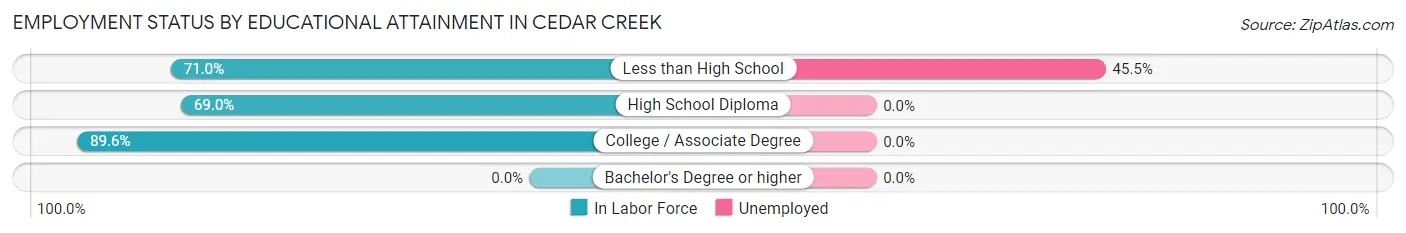
| Educational Attainment | In Labor Force | Unemployed |
| Less than High School | 22 (71.0%) | 14 (45.5%) |
| High School Diploma | 40 (69.0%) | 0 (0.0%) |
| College / Associate Degree | 95 (89.6%) | 0 (0.0%) |
| Bachelor's Degree or higher | 0 (0.0%) | 0 (0.0%) |
| Total | 157 (80.5%) | 12 (6.4%) |
Employment Occupations by Sex in Cedar Creek
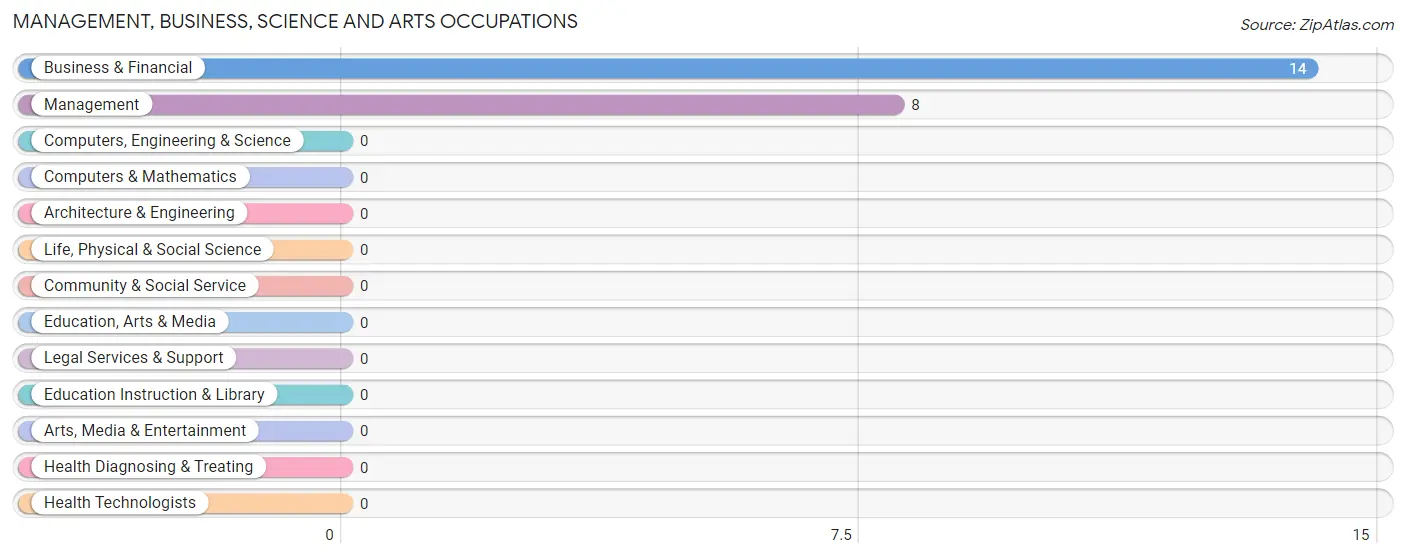
Management, Business, Science and Arts Occupations
The most common Management, Business, Science and Arts occupations in Cedar Creek are Business & Financial (14 | 7.3%), and Management (8 | 4.2%).
Management, Business, Science and Arts Occupations by Sex
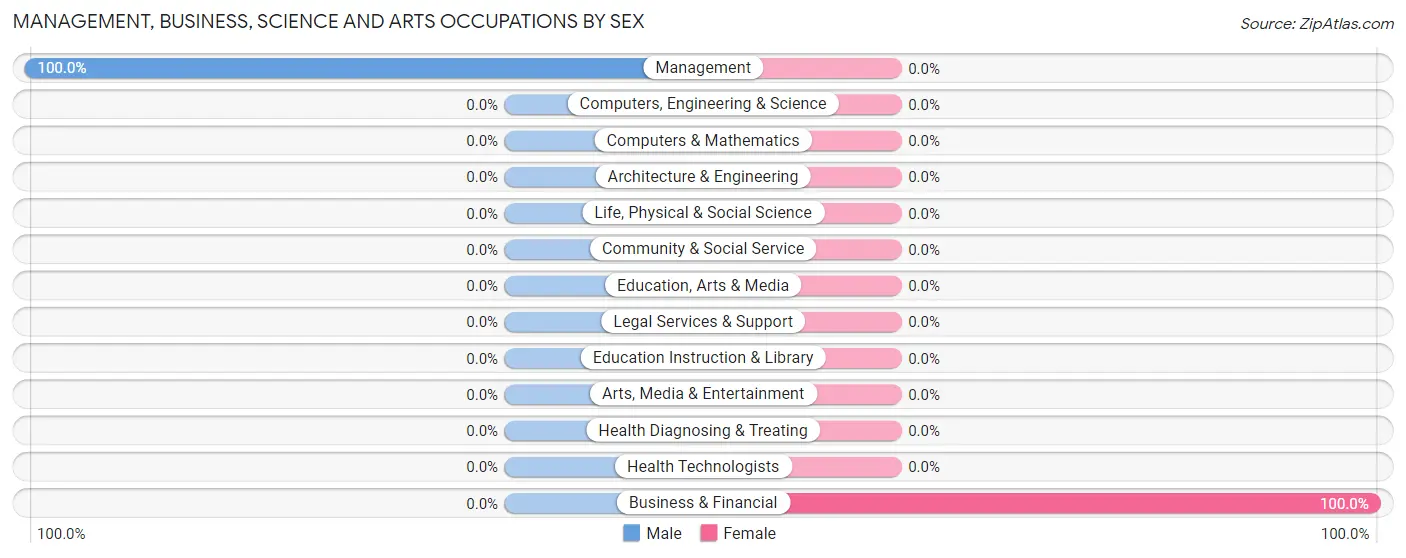
| Occupation | Male | Female |
| Management | 8 (100.0%) | 0 (0.0%) |
| Business & Financial | 0 (0.0%) | 14 (100.0%) |
| Computers, Engineering & Science | 0 (0.0%) | 0 (0.0%) |
| Computers & Mathematics | 0 (0.0%) | 0 (0.0%) |
| Architecture & Engineering | 0 (0.0%) | 0 (0.0%) |
| Life, Physical & Social Science | 0 (0.0%) | 0 (0.0%) |
| Community & Social Service | 0 (0.0%) | 0 (0.0%) |
| Education, Arts & Media | 0 (0.0%) | 0 (0.0%) |
| Legal Services & Support | 0 (0.0%) | 0 (0.0%) |
| Education Instruction & Library | 0 (0.0%) | 0 (0.0%) |
| Arts, Media & Entertainment | 0 (0.0%) | 0 (0.0%) |
| Health Diagnosing & Treating | 0 (0.0%) | 0 (0.0%) |
| Health Technologists | 0 (0.0%) | 0 (0.0%) |
| Total (Category) | 8 (36.4%) | 14 (63.6%) |
| Total (Overall) | 100 (52.1%) | 92 (47.9%) |
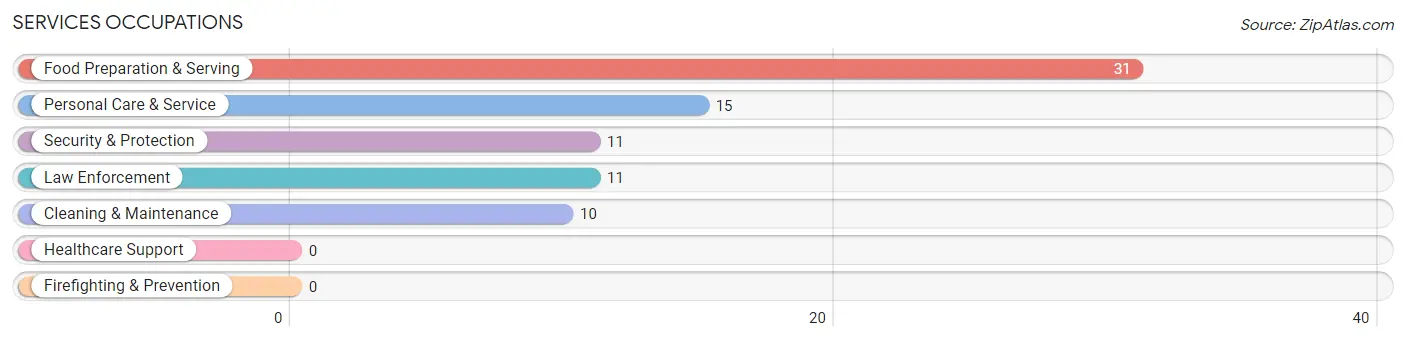
Services Occupations
The most common Services occupations in Cedar Creek are Food Preparation & Serving (31 | 16.2%), Personal Care & Service (15 | 7.8%), Security & Protection (11 | 5.7%), Law Enforcement (11 | 5.7%), and Cleaning & Maintenance (10 | 5.2%).
Services Occupations by Sex
Within the Services occupations in Cedar Creek, the most male-oriented occupations are Security & Protection (100.0%), Law Enforcement (100.0%), and Cleaning & Maintenance (100.0%), while the most female-oriented occupations are Personal Care & Service (100.0%), and Food Preparation & Serving (35.5%).
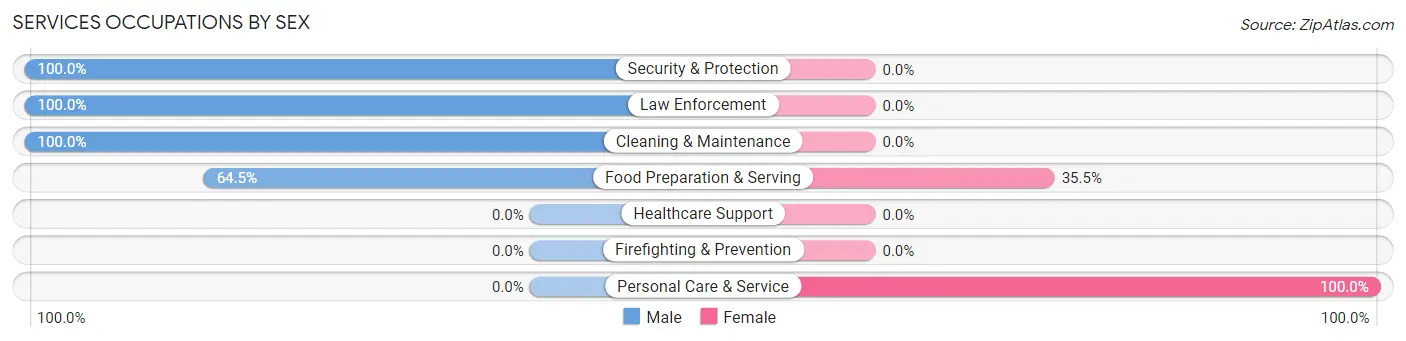
| Occupation | Male | Female |
| Healthcare Support | 0 (0.0%) | 0 (0.0%) |
| Security & Protection | 11 (100.0%) | 0 (0.0%) |
| Firefighting & Prevention | 0 (0.0%) | 0 (0.0%) |
| Law Enforcement | 11 (100.0%) | 0 (0.0%) |
| Food Preparation & Serving | 20 (64.5%) | 11 (35.5%) |
| Cleaning & Maintenance | 10 (100.0%) | 0 (0.0%) |
| Personal Care & Service | 0 (0.0%) | 15 (100.0%) |
| Total (Category) | 41 (61.2%) | 26 (38.8%) |
| Total (Overall) | 100 (52.1%) | 92 (47.9%) |
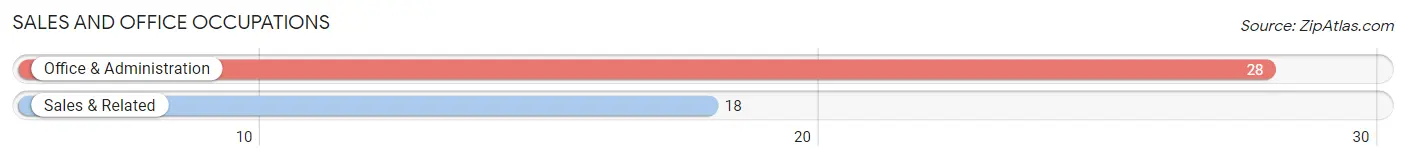
Sales and Office Occupations
The most common Sales and Office occupations in Cedar Creek are Office & Administration (28 | 14.6%), and Sales & Related (18 | 9.4%).
Sales and Office Occupations by Sex
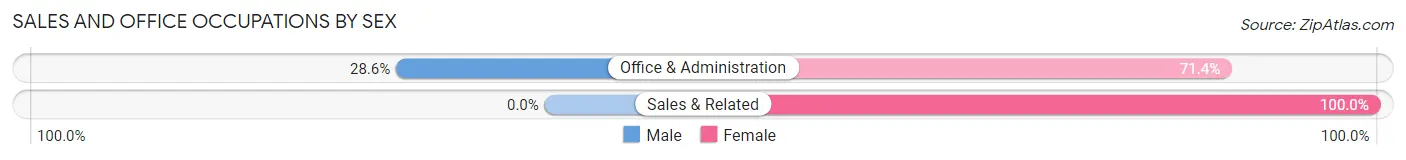
| Occupation | Male | Female |
| Sales & Related | 0 (0.0%) | 18 (100.0%) |
| Office & Administration | 8 (28.6%) | 20 (71.4%) |
| Total (Category) | 8 (17.4%) | 38 (82.6%) |
| Total (Overall) | 100 (52.1%) | 92 (47.9%) |
Natural Resources, Construction and Maintenance Occupations
The most common Natural Resources, Construction and Maintenance occupations in Cedar Creek are Construction & Extraction (25 | 13.0%), and Farming, Fishing & Forestry (6 | 3.1%).
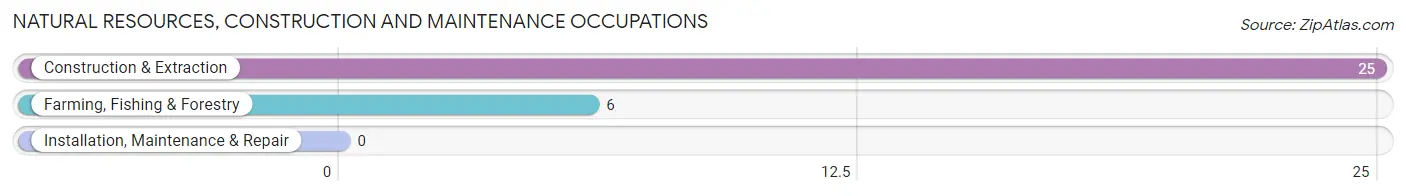
Natural Resources, Construction and Maintenance Occupations by Sex
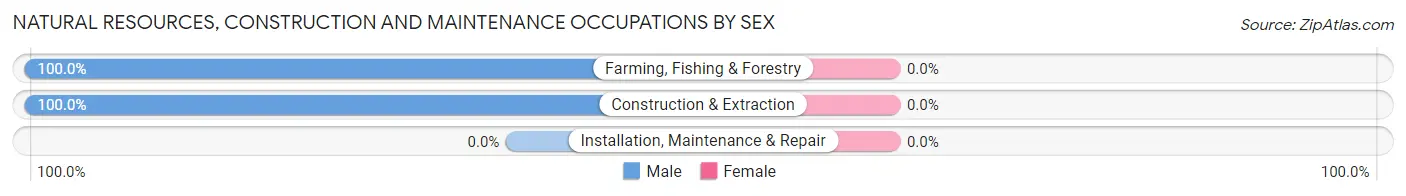
| Occupation | Male | Female |
| Farming, Fishing & Forestry | 6 (100.0%) | 0 (0.0%) |
| Construction & Extraction | 25 (100.0%) | 0 (0.0%) |
| Installation, Maintenance & Repair | 0 (0.0%) | 0 (0.0%) |
| Total (Category) | 31 (100.0%) | 0 (0.0%) |
| Total (Overall) | 100 (52.1%) | 92 (47.9%) |
Production, Transportation and Moving Occupations
The most common Production, Transportation and Moving occupations in Cedar Creek are Production (13 | 6.8%), Transportation (8 | 4.2%), and Material Moving (5 | 2.6%).
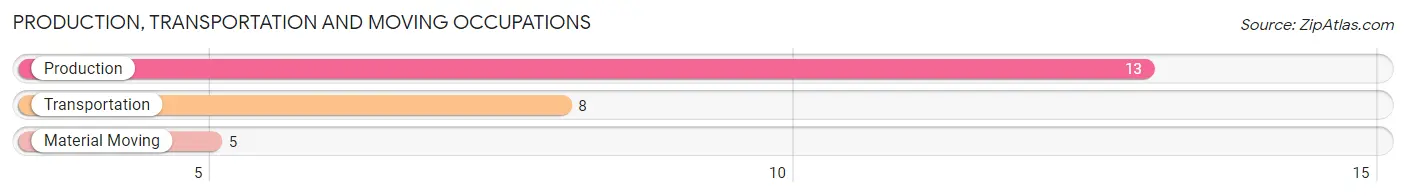
Production, Transportation and Moving Occupations by Sex
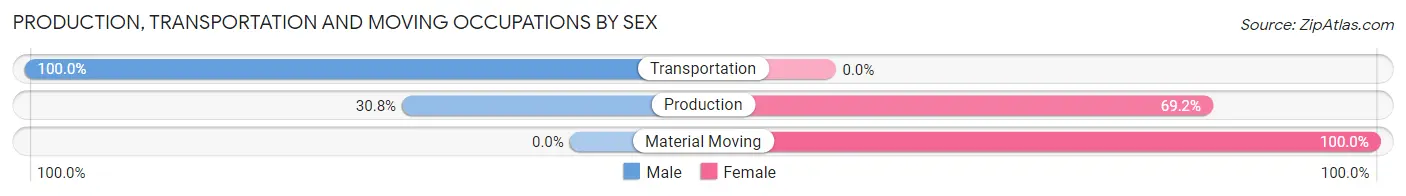
| Occupation | Male | Female |
| Production | 4 (30.8%) | 9 (69.2%) |
| Transportation | 8 (100.0%) | 0 (0.0%) |
| Material Moving | 0 (0.0%) | 5 (100.0%) |
| Total (Category) | 12 (46.2%) | 14 (53.8%) |
| Total (Overall) | 100 (52.1%) | 92 (47.9%) |
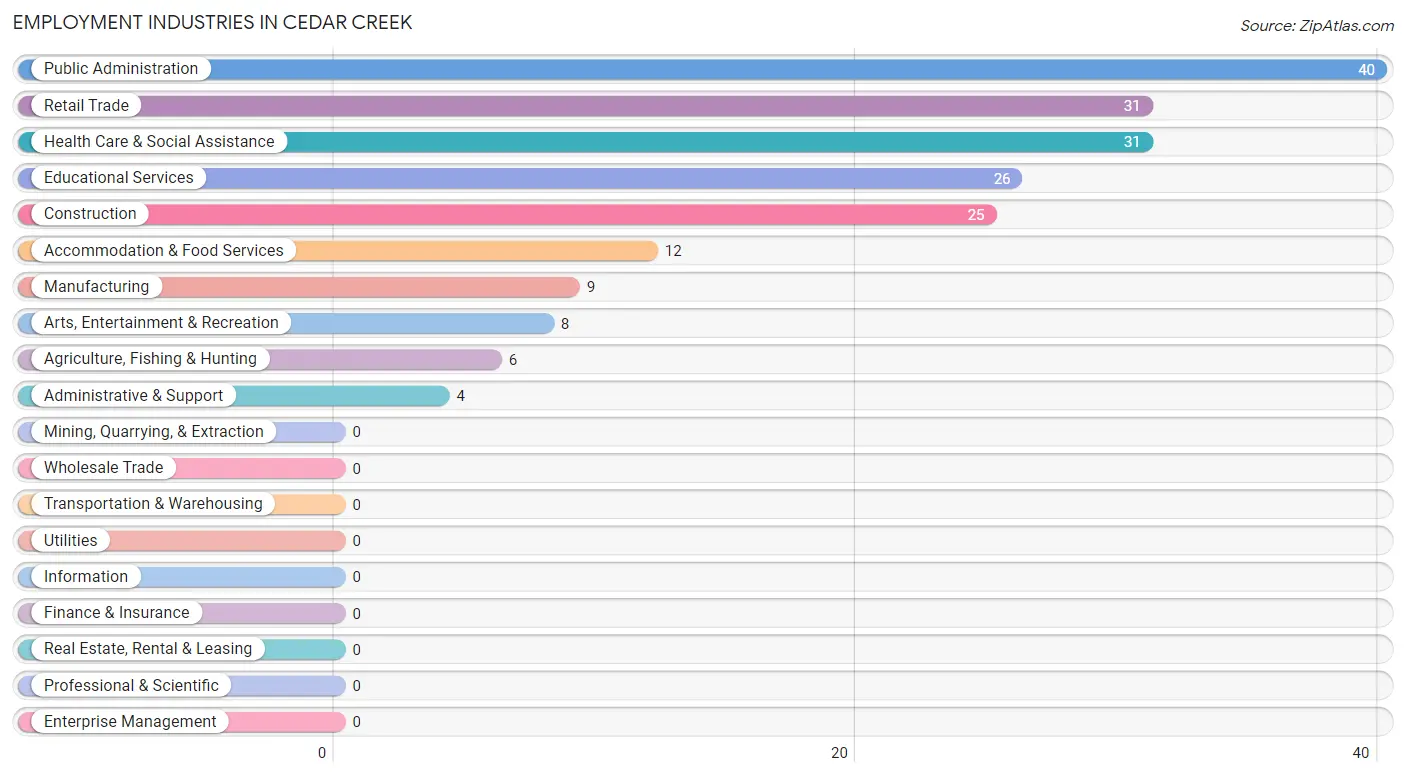
Employment Industries by Sex in Cedar Creek
Employment Industries in Cedar Creek
The major employment industries in Cedar Creek include Public Administration (40 | 20.8%), Retail Trade (31 | 16.2%), Health Care & Social Assistance (31 | 16.2%), Educational Services (26 | 13.5%), and Construction (25 | 13.0%).
Employment Industries by Sex in Cedar Creek
The Cedar Creek industries that see more men than women are Agriculture, Fishing & Hunting (100.0%), Construction (100.0%), and Administrative & Support (100.0%), whereas the industries that tend to have a higher number of women are Manufacturing (100.0%), Retail Trade (100.0%), and Health Care & Social Assistance (74.2%).
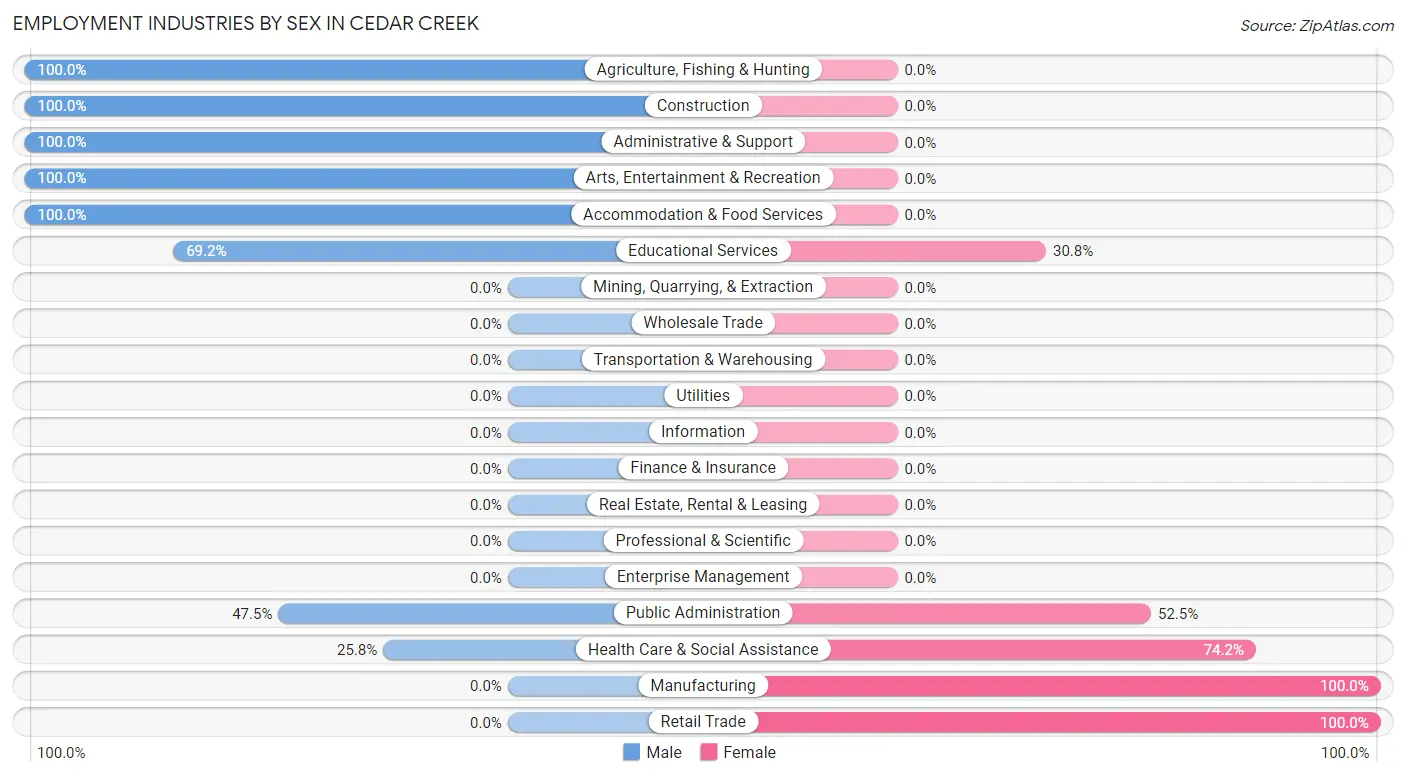
| Industry | Male | Female |
| Agriculture, Fishing & Hunting | 6 (100.0%) | 0 (0.0%) |
| Mining, Quarrying, & Extraction | 0 (0.0%) | 0 (0.0%) |
| Construction | 25 (100.0%) | 0 (0.0%) |
| Manufacturing | 0 (0.0%) | 9 (100.0%) |
| Wholesale Trade | 0 (0.0%) | 0 (0.0%) |
| Retail Trade | 0 (0.0%) | 31 (100.0%) |
| Transportation & Warehousing | 0 (0.0%) | 0 (0.0%) |
| Utilities | 0 (0.0%) | 0 (0.0%) |
| Information | 0 (0.0%) | 0 (0.0%) |
| Finance & Insurance | 0 (0.0%) | 0 (0.0%) |
| Real Estate, Rental & Leasing | 0 (0.0%) | 0 (0.0%) |
| Professional & Scientific | 0 (0.0%) | 0 (0.0%) |
| Enterprise Management | 0 (0.0%) | 0 (0.0%) |
| Administrative & Support | 4 (100.0%) | 0 (0.0%) |
| Educational Services | 18 (69.2%) | 8 (30.8%) |
| Health Care & Social Assistance | 8 (25.8%) | 23 (74.2%) |
| Arts, Entertainment & Recreation | 8 (100.0%) | 0 (0.0%) |
| Accommodation & Food Services | 12 (100.0%) | 0 (0.0%) |
| Public Administration | 19 (47.5%) | 21 (52.5%) |
| Total | 100 (52.1%) | 92 (47.9%) |
Education in Cedar Creek
School Enrollment in Cedar Creek
The most common levels of schooling among the 94 students in Cedar Creek are elementary school (30 | 31.9%), middle school (29 | 30.8%), and college / undergraduate (20 | 21.3%).
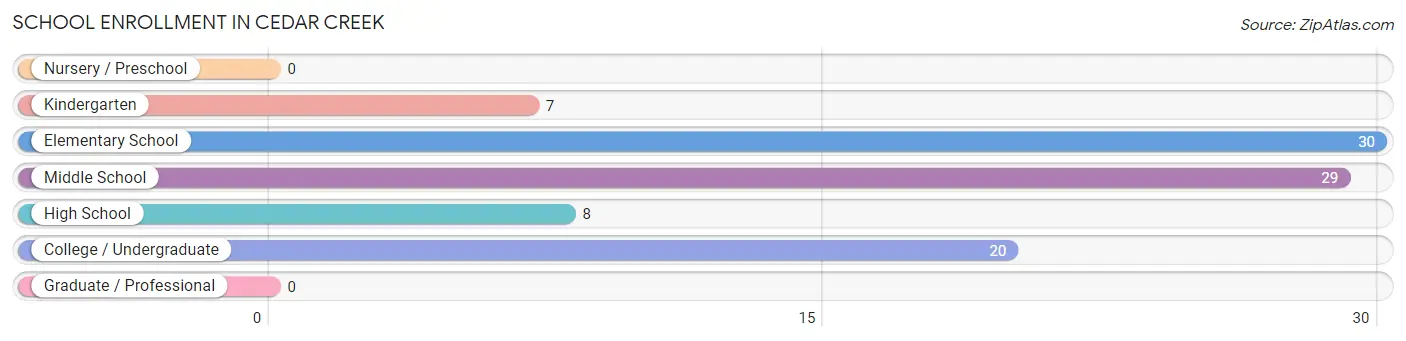
| School Level | # Students | % Students |
| Nursery / Preschool | 0 | 0.0% |
| Kindergarten | 7 | 7.4% |
| Elementary School | 30 | 31.9% |
| Middle School | 29 | 30.8% |
| High School | 8 | 8.5% |
| College / Undergraduate | 20 | 21.3% |
| Graduate / Professional | 0 | 0.0% |
| Total | 94 | 100.0% |
School Enrollment by Age by Funding Source in Cedar Creek
Out of a total of 94 students who are enrolled in schools in Cedar Creek, 14 (14.9%) attend a private institution, while the remaining 80 (85.1%) are enrolled in public schools. The age group of 25 to 34 year olds has the highest likelihood of being enrolled in private schools, with 14 (100.0% in the age bracket) enrolled. Conversely, the age group of 5 to 9 year old has the lowest likelihood of being enrolled in a private school, with 37 (100.0% in the age bracket) attending a public institution.
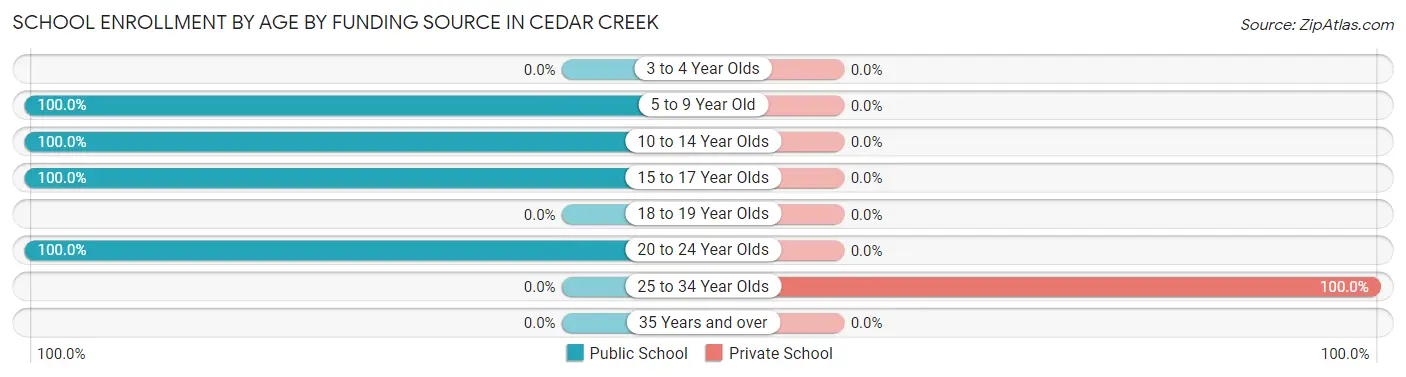
| Age Bracket | Public School | Private School |
| 3 to 4 Year Olds | 0 (0.0%) | 0 (0.0%) |
| 5 to 9 Year Old | 37 (100.0%) | 0 (0.0%) |
| 10 to 14 Year Olds | 29 (100.0%) | 0 (0.0%) |
| 15 to 17 Year Olds | 8 (100.0%) | 0 (0.0%) |
| 18 to 19 Year Olds | 0 (0.0%) | 0 (0.0%) |
| 20 to 24 Year Olds | 6 (100.0%) | 0 (0.0%) |
| 25 to 34 Year Olds | 0 (0.0%) | 14 (100.0%) |
| 35 Years and over | 0 (0.0%) | 0 (0.0%) |
| Total | 80 (85.1%) | 14 (14.9%) |
Educational Attainment by Field of Study in Cedar Creek
| Field of Study | # Graduates | % Graduates |
| Computers & Mathematics | 0 | 0.0% |
| Bio, Nature & Agricultural | 0 | 0.0% |
| Physical & Health Sciences | 0 | 0.0% |
| Psychology | 0 | 0.0% |
| Social Sciences | 0 | 0.0% |
| Engineering | 0 | 0.0% |
| Multidisciplinary Studies | 0 | 0.0% |
| Science & Technology | 0 | 0.0% |
| Business | 0 | 0.0% |
| Education | 0 | 0.0% |
| Literature & Languages | 0 | 0.0% |
| Liberal Arts & History | 0 | 0.0% |
| Visual & Performing Arts | 0 | 0.0% |
| Communications | 0 | 0.0% |
| Arts & Humanities | 0 | 0.0% |
| Total | 0 | 0.0% |
Transportation & Commute in Cedar Creek
Vehicle Availability by Sex in Cedar Creek
The most prevalent vehicle ownership categories in Cedar Creek are males with 2 vehicles (55, accounting for 55.0%) and females with 2 vehicles (51, making up 63.9%).
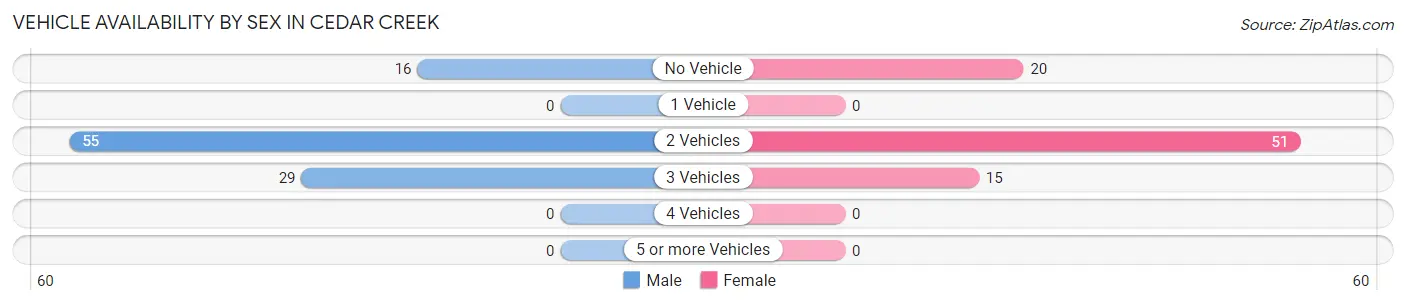
| Vehicles Available | Male | Female |
| No Vehicle | 16 (16.0%) | 20 (23.3%) |
| 1 Vehicle | 0 (0.0%) | 0 (0.0%) |
| 2 Vehicles | 55 (55.0%) | 51 (59.3%) |
| 3 Vehicles | 29 (29.0%) | 15 (17.4%) |
| 4 Vehicles | 0 (0.0%) | 0 (0.0%) |
| 5 or more Vehicles | 0 (0.0%) | 0 (0.0%) |
| Total | 100 (100.0%) | 86 (100.0%) |
Commute Time in Cedar Creek
The most frequently occuring commute durations in Cedar Creek are 30 to 34 minutes (48 commuters, 26.4%), 20 to 24 minutes (42 commuters, 23.1%), and 45 to 59 minutes (33 commuters, 18.1%).
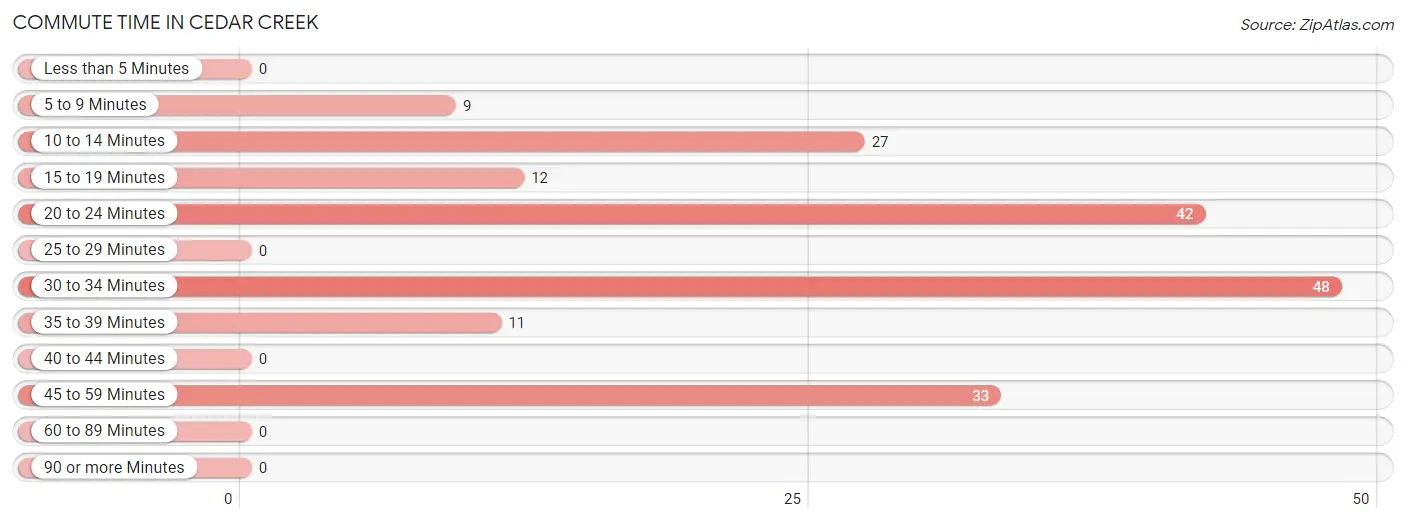
| Commute Time | # Commuters | % Commuters |
| Less than 5 Minutes | 0 | 0.0% |
| 5 to 9 Minutes | 9 | 5.0% |
| 10 to 14 Minutes | 27 | 14.8% |
| 15 to 19 Minutes | 12 | 6.6% |
| 20 to 24 Minutes | 42 | 23.1% |
| 25 to 29 Minutes | 0 | 0.0% |
| 30 to 34 Minutes | 48 | 26.4% |
| 35 to 39 Minutes | 11 | 6.0% |
| 40 to 44 Minutes | 0 | 0.0% |
| 45 to 59 Minutes | 33 | 18.1% |
| 60 to 89 Minutes | 0 | 0.0% |
| 90 or more Minutes | 0 | 0.0% |
Commute Time by Sex in Cedar Creek
The most common commute times in Cedar Creek are 30 to 34 minutes (28 commuters, 29.2%) for males and 30 to 34 minutes (20 commuters, 23.3%) for females.
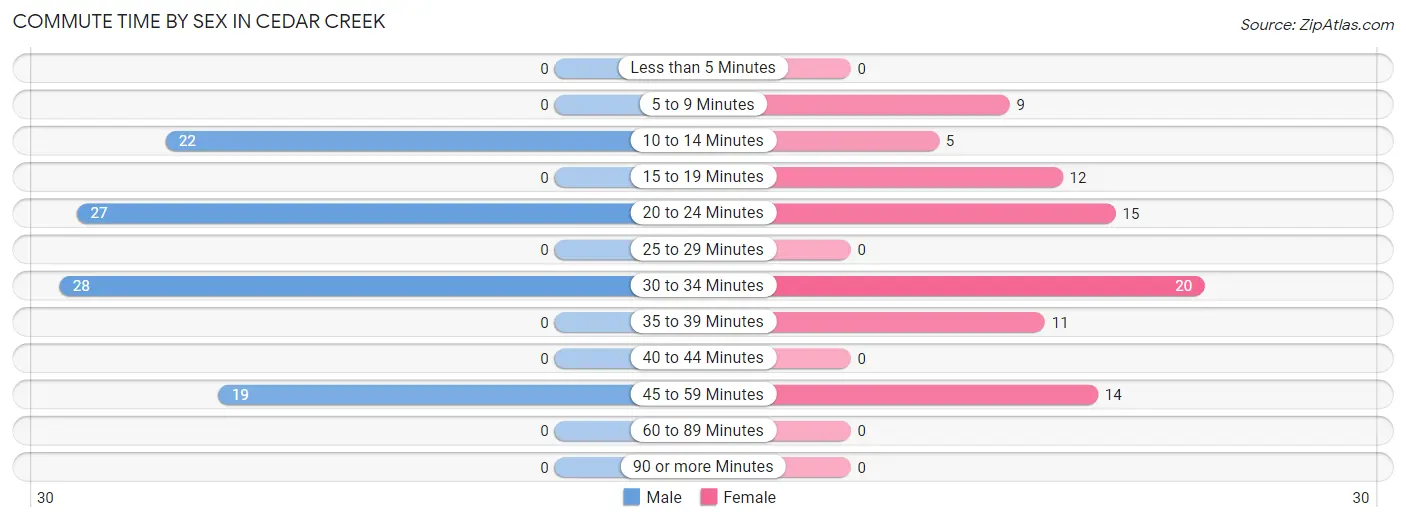
| Commute Time | Male | Female |
| Less than 5 Minutes | 0 (0.0%) | 0 (0.0%) |
| 5 to 9 Minutes | 0 (0.0%) | 9 (10.5%) |
| 10 to 14 Minutes | 22 (22.9%) | 5 (5.8%) |
| 15 to 19 Minutes | 0 (0.0%) | 12 (14.0%) |
| 20 to 24 Minutes | 27 (28.1%) | 15 (17.4%) |
| 25 to 29 Minutes | 0 (0.0%) | 0 (0.0%) |
| 30 to 34 Minutes | 28 (29.2%) | 20 (23.3%) |
| 35 to 39 Minutes | 0 (0.0%) | 11 (12.8%) |
| 40 to 44 Minutes | 0 (0.0%) | 0 (0.0%) |
| 45 to 59 Minutes | 19 (19.8%) | 14 (16.3%) |
| 60 to 89 Minutes | 0 (0.0%) | 0 (0.0%) |
| 90 or more Minutes | 0 (0.0%) | 0 (0.0%) |
Time of Departure to Work by Sex in Cedar Creek
The most frequent times of departure to work in Cedar Creek are 8:00 AM to 8:29 AM (27, 28.1%) for males and 7:00 AM to 7:29 AM (34, 39.5%) for females.
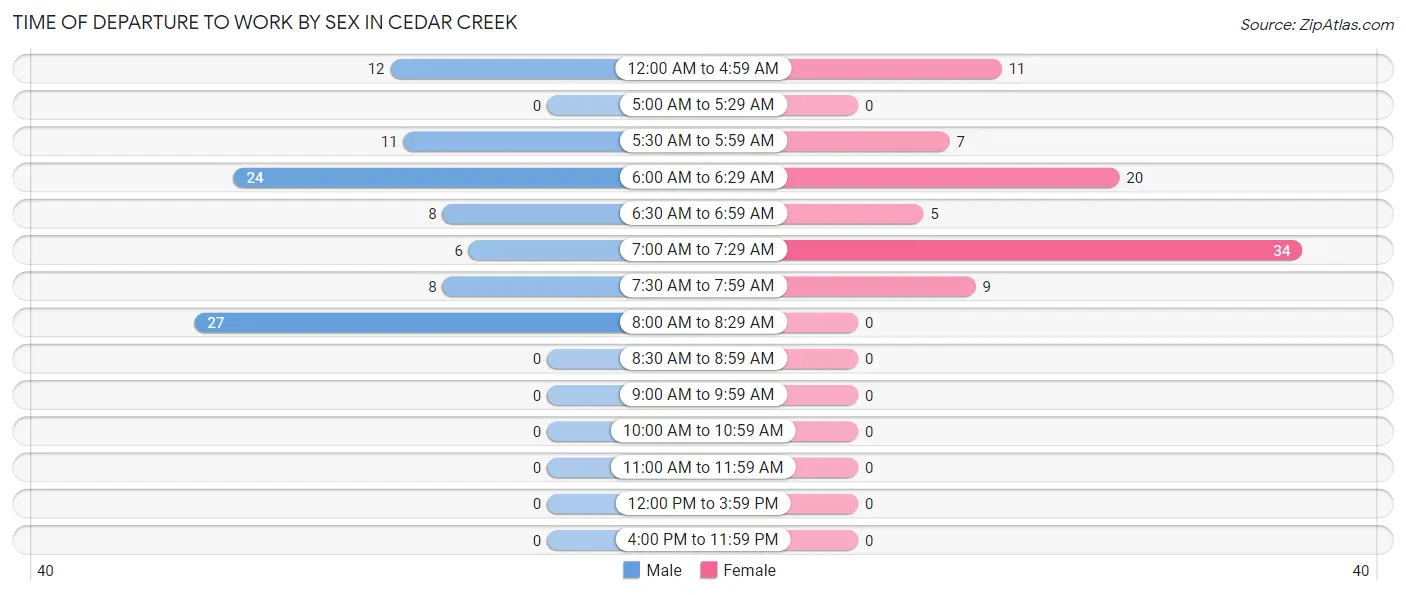
| Time of Departure | Male | Female |
| 12:00 AM to 4:59 AM | 12 (12.5%) | 11 (12.8%) |
| 5:00 AM to 5:29 AM | 0 (0.0%) | 0 (0.0%) |
| 5:30 AM to 5:59 AM | 11 (11.5%) | 7 (8.1%) |
| 6:00 AM to 6:29 AM | 24 (25.0%) | 20 (23.3%) |
| 6:30 AM to 6:59 AM | 8 (8.3%) | 5 (5.8%) |
| 7:00 AM to 7:29 AM | 6 (6.2%) | 34 (39.5%) |
| 7:30 AM to 7:59 AM | 8 (8.3%) | 9 (10.5%) |
| 8:00 AM to 8:29 AM | 27 (28.1%) | 0 (0.0%) |
| 8:30 AM to 8:59 AM | 0 (0.0%) | 0 (0.0%) |
| 9:00 AM to 9:59 AM | 0 (0.0%) | 0 (0.0%) |
| 10:00 AM to 10:59 AM | 0 (0.0%) | 0 (0.0%) |
| 11:00 AM to 11:59 AM | 0 (0.0%) | 0 (0.0%) |
| 12:00 PM to 3:59 PM | 0 (0.0%) | 0 (0.0%) |
| 4:00 PM to 11:59 PM | 0 (0.0%) | 0 (0.0%) |
| Total | 96 (100.0%) | 86 (100.0%) |
Housing Occupancy in Cedar Creek
Occupancy by Ownership in Cedar Creek
Of the total 91 dwellings in Cedar Creek, owner-occupied units account for 91 (100.0%), while renter-occupied units make up 0 (0.0%).
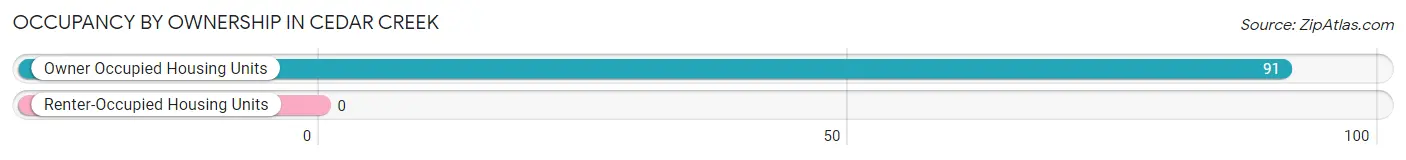
| Occupancy | # Housing Units | % Housing Units |
| Owner Occupied Housing Units | 91 | 100.0% |
| Renter-Occupied Housing Units | 0 | 0.0% |
| Total Occupied Housing Units | 91 | 100.0% |
Occupancy by Household Size in Cedar Creek
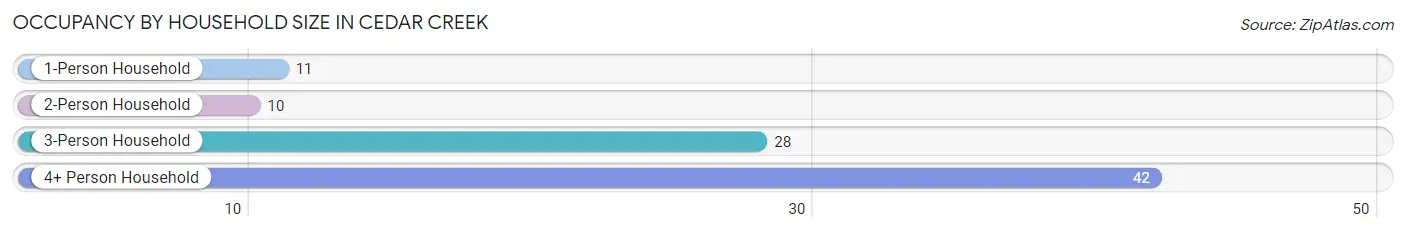
| Household Size | # Housing Units | % Housing Units |
| 1-Person Household | 11 | 12.1% |
| 2-Person Household | 10 | 11.0% |
| 3-Person Household | 28 | 30.8% |
| 4+ Person Household | 42 | 46.2% |
| Total Housing Units | 91 | 100.0% |
Occupancy by Ownership by Household Size in Cedar Creek
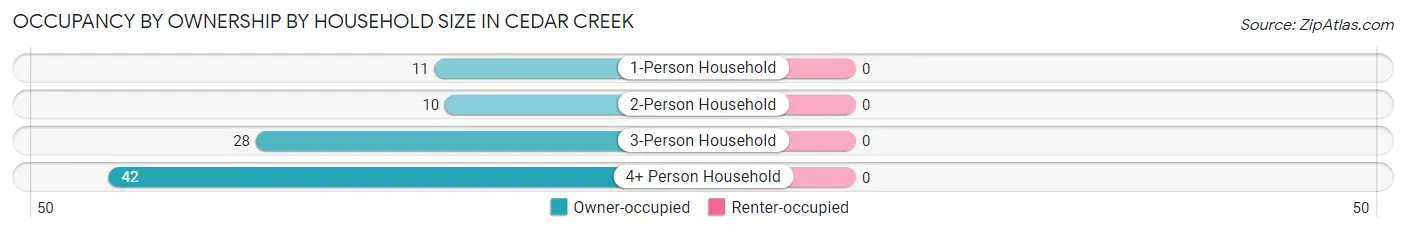
| Household Size | Owner-occupied | Renter-occupied |
| 1-Person Household | 11 (100.0%) | 0 (0.0%) |
| 2-Person Household | 10 (100.0%) | 0 (0.0%) |
| 3-Person Household | 28 (100.0%) | 0 (0.0%) |
| 4+ Person Household | 42 (100.0%) | 0 (0.0%) |
| Total Housing Units | 91 (100.0%) | 0 (0.0%) |
Occupancy by Educational Attainment in Cedar Creek
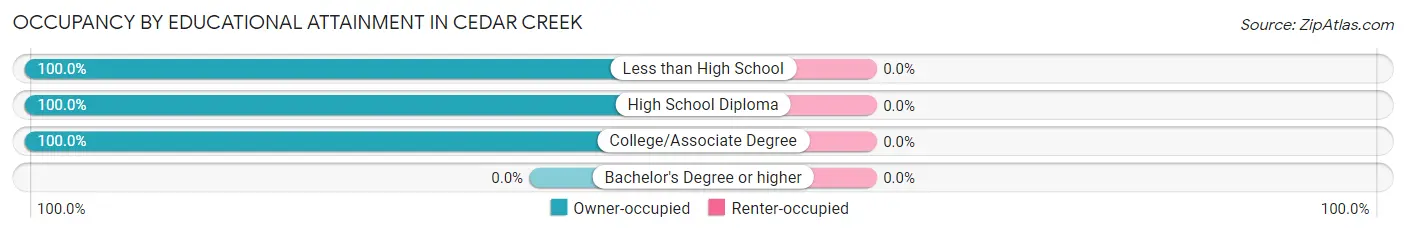
| Household Size | Owner-occupied | Renter-occupied |
| Less than High School | 19 (100.0%) | 0 (0.0%) |
| High School Diploma | 30 (100.0%) | 0 (0.0%) |
| College/Associate Degree | 42 (100.0%) | 0 (0.0%) |
| Bachelor's Degree or higher | 0 (0.0%) | 0 (0.0%) |
Occupancy by Age of Householder in Cedar Creek
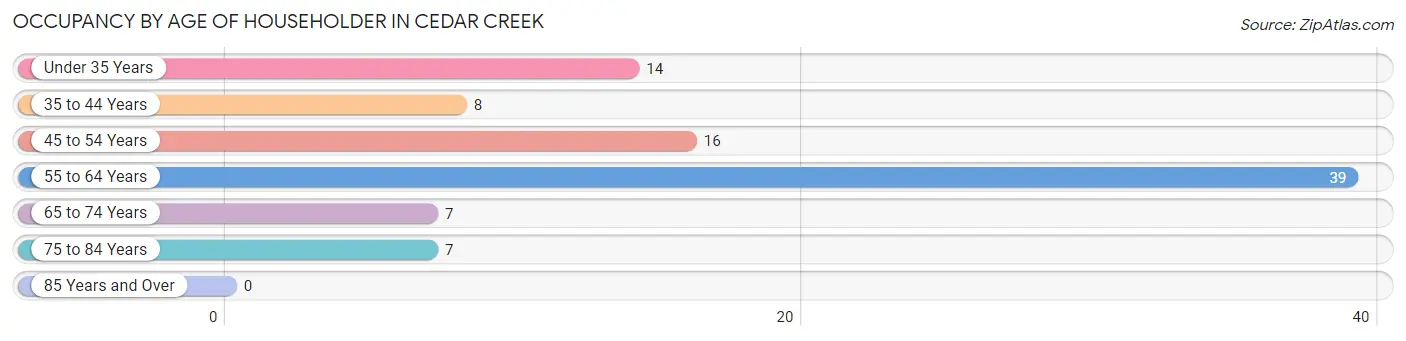
| Age Bracket | # Households | % Households |
| Under 35 Years | 14 | 15.4% |
| 35 to 44 Years | 8 | 8.8% |
| 45 to 54 Years | 16 | 17.6% |
| 55 to 64 Years | 39 | 42.9% |
| 65 to 74 Years | 7 | 7.7% |
| 75 to 84 Years | 7 | 7.7% |
| 85 Years and Over | 0 | 0.0% |
| Total | 91 | 100.0% |
Housing Finances in Cedar Creek
Median Income by Occupancy in Cedar Creek
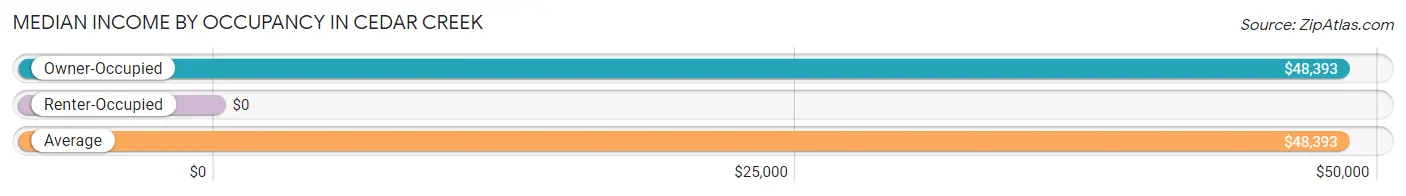
| Occupancy Type | # Households | Median Income |
| Owner-Occupied | 91 (100.0%) | $48,393 |
| Renter-Occupied | 0 (0.0%) | $0 |
| Average | 91 (100.0%) | $48,393 |
Occupancy by Householder Income Bracket in Cedar Creek
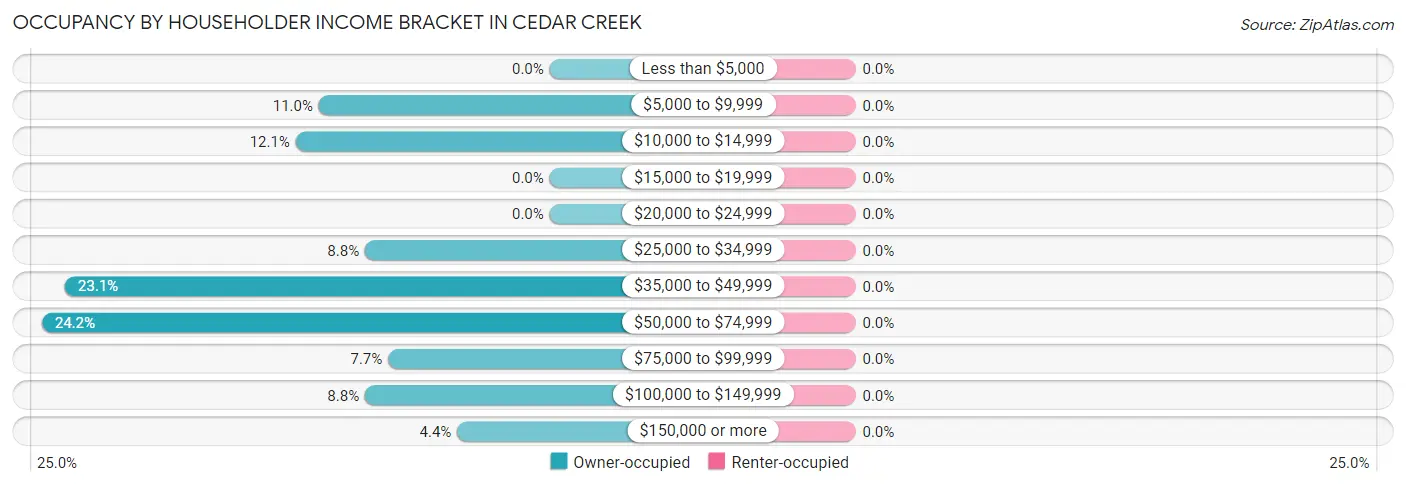
| Income Bracket | Owner-occupied | Renter-occupied |
| Less than $5,000 | 0 (0.0%) | 0 (0.0%) |
| $5,000 to $9,999 | 10 (11.0%) | 0 (0.0%) |
| $10,000 to $14,999 | 11 (12.1%) | 0 (0.0%) |
| $15,000 to $19,999 | 0 (0.0%) | 0 (0.0%) |
| $20,000 to $24,999 | 0 (0.0%) | 0 (0.0%) |
| $25,000 to $34,999 | 8 (8.8%) | 0 (0.0%) |
| $35,000 to $49,999 | 21 (23.1%) | 0 (0.0%) |
| $50,000 to $74,999 | 22 (24.2%) | 0 (0.0%) |
| $75,000 to $99,999 | 7 (7.7%) | 0 (0.0%) |
| $100,000 to $149,999 | 8 (8.8%) | 0 (0.0%) |
| $150,000 or more | 4 (4.4%) | 0 (0.0%) |
| Total | 91 (100.0%) | 0 (0.0%) |
Monthly Housing Cost Tiers in Cedar Creek
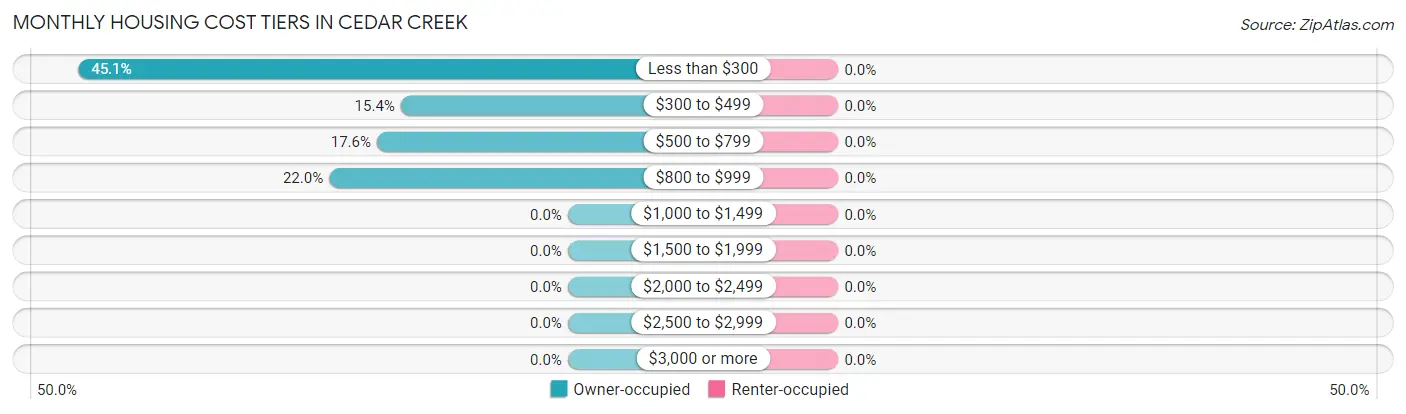
| Monthly Cost | Owner-occupied | Renter-occupied |
| Less than $300 | 41 (45.1%) | 0 (0.0%) |
| $300 to $499 | 14 (15.4%) | 0 (0.0%) |
| $500 to $799 | 16 (17.6%) | 0 (0.0%) |
| $800 to $999 | 20 (22.0%) | 0 (0.0%) |
| $1,000 to $1,499 | 0 (0.0%) | 0 (0.0%) |
| $1,500 to $1,999 | 0 (0.0%) | 0 (0.0%) |
| $2,000 to $2,499 | 0 (0.0%) | 0 (0.0%) |
| $2,500 to $2,999 | 0 (0.0%) | 0 (0.0%) |
| $3,000 or more | 0 (0.0%) | 0 (0.0%) |
| Total | 91 (100.0%) | 0 (0.0%) |
Physical Housing Characteristics in Cedar Creek
Housing Structures in Cedar Creek
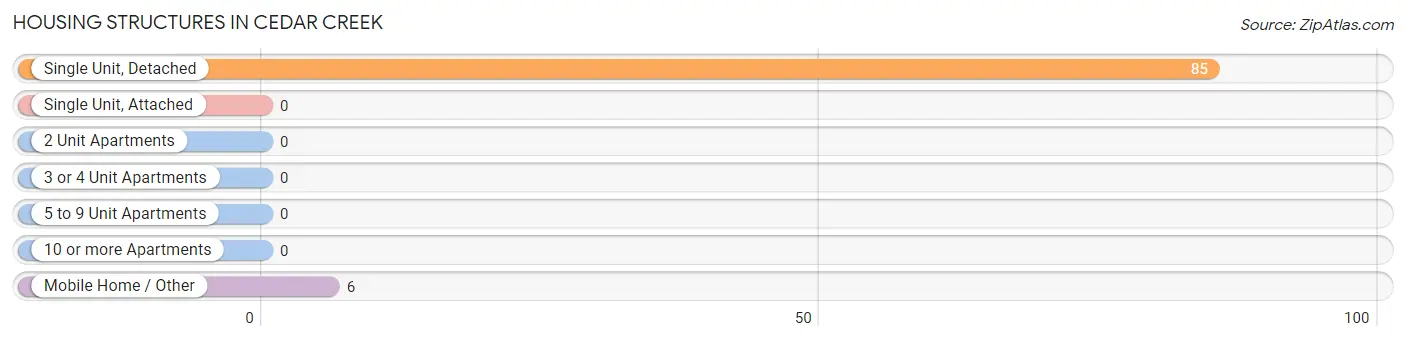
| Structure Type | # Housing Units | % Housing Units |
| Single Unit, Detached | 85 | 93.4% |
| Single Unit, Attached | 0 | 0.0% |
| 2 Unit Apartments | 0 | 0.0% |
| 3 or 4 Unit Apartments | 0 | 0.0% |
| 5 to 9 Unit Apartments | 0 | 0.0% |
| 10 or more Apartments | 0 | 0.0% |
| Mobile Home / Other | 6 | 6.6% |
| Total | 91 | 100.0% |
Housing Structures by Occupancy in Cedar Creek
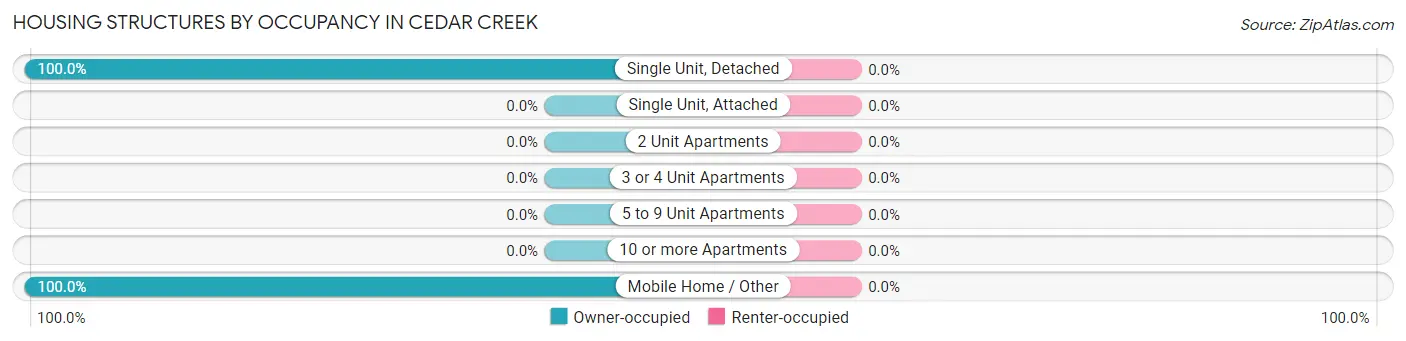
| Structure Type | Owner-occupied | Renter-occupied |
| Single Unit, Detached | 85 (100.0%) | 0 (0.0%) |
| Single Unit, Attached | 0 (0.0%) | 0 (0.0%) |
| 2 Unit Apartments | 0 (0.0%) | 0 (0.0%) |
| 3 or 4 Unit Apartments | 0 (0.0%) | 0 (0.0%) |
| 5 to 9 Unit Apartments | 0 (0.0%) | 0 (0.0%) |
| 10 or more Apartments | 0 (0.0%) | 0 (0.0%) |
| Mobile Home / Other | 6 (100.0%) | 0 (0.0%) |
| Total | 91 (100.0%) | 0 (0.0%) |
Housing Structures by Number of Rooms in Cedar Creek
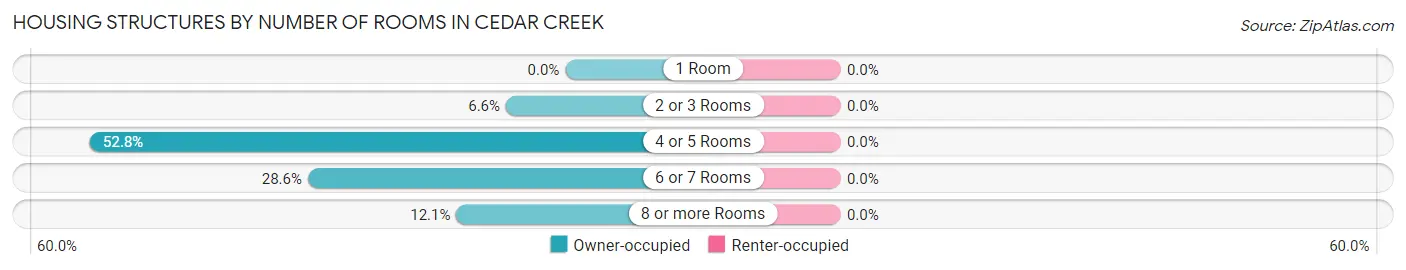
| Number of Rooms | Owner-occupied | Renter-occupied |
| 1 Room | 0 (0.0%) | 0 (0.0%) |
| 2 or 3 Rooms | 6 (6.6%) | 0 (0.0%) |
| 4 or 5 Rooms | 48 (52.7%) | 0 (0.0%) |
| 6 or 7 Rooms | 26 (28.6%) | 0 (0.0%) |
| 8 or more Rooms | 11 (12.1%) | 0 (0.0%) |
| Total | 91 (100.0%) | 0 (0.0%) |
Housing Structure by Heating Type in Cedar Creek
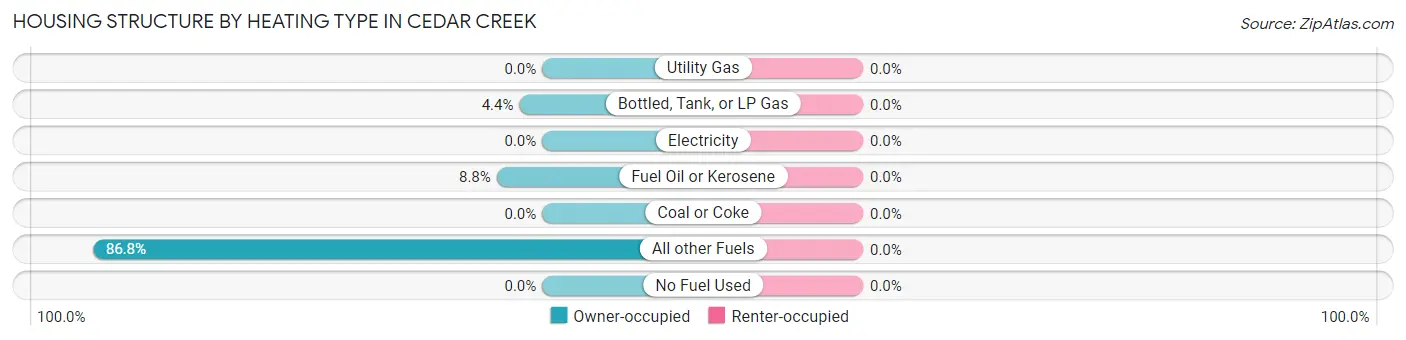
| Heating Type | Owner-occupied | Renter-occupied |
| Utility Gas | 0 (0.0%) | 0 (0.0%) |
| Bottled, Tank, or LP Gas | 4 (4.4%) | 0 (0.0%) |
| Electricity | 0 (0.0%) | 0 (0.0%) |
| Fuel Oil or Kerosene | 8 (8.8%) | 0 (0.0%) |
| Coal or Coke | 0 (0.0%) | 0 (0.0%) |
| All other Fuels | 79 (86.8%) | 0 (0.0%) |
| No Fuel Used | 0 (0.0%) | 0 (0.0%) |
| Total | 91 (100.0%) | 0 (0.0%) |
Household Vehicle Usage in Cedar Creek
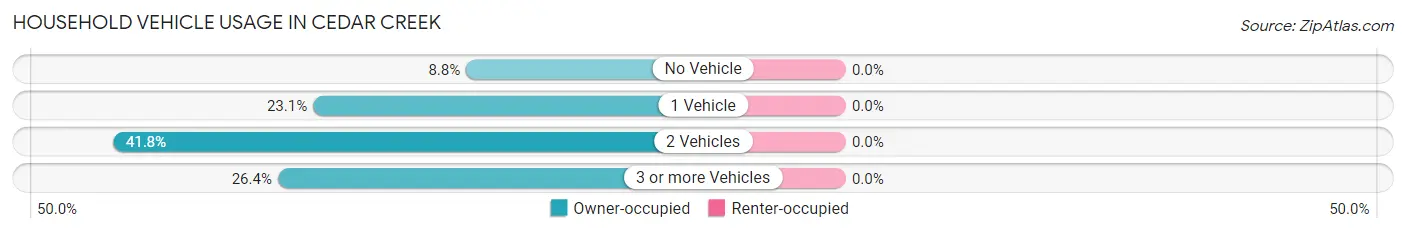
| Vehicles per Household | Owner-occupied | Renter-occupied |
| No Vehicle | 8 (8.8%) | 0 (0.0%) |
| 1 Vehicle | 21 (23.1%) | 0 (0.0%) |
| 2 Vehicles | 38 (41.8%) | 0 (0.0%) |
| 3 or more Vehicles | 24 (26.4%) | 0 (0.0%) |
| Total | 91 (100.0%) | 0 (0.0%) |
Real Estate & Mortgages in Cedar Creek
Real Estate and Mortgage Overview in Cedar Creek
| Characteristic | Without Mortgage | With Mortgage |
| Housing Units | 77 | 14 |
| Median Property Value | $83,500 | $0 |
| Median Household Income | $48,750 | $0 |
| Monthly Housing Costs | $243 | $0 |
| Real Estate Taxes | - | - |
Property Value by Mortgage Status in Cedar Creek
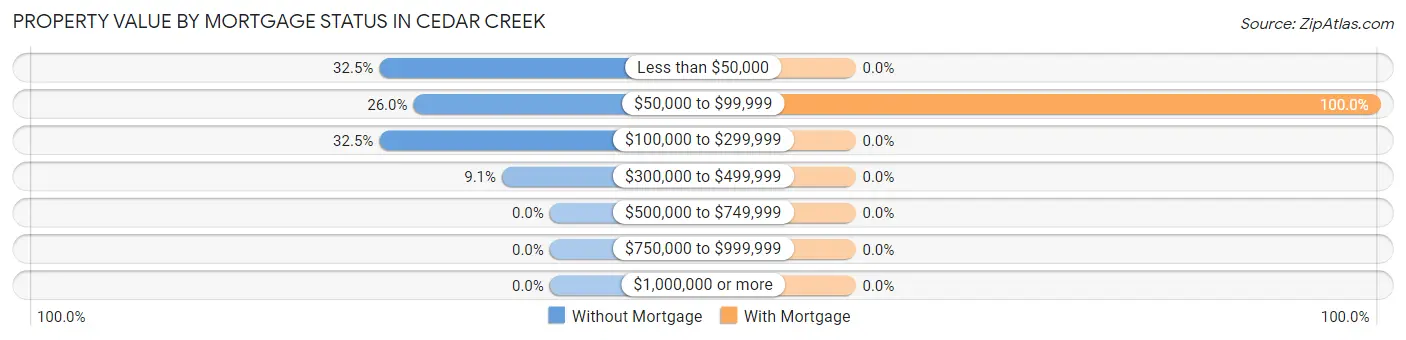
| Property Value | Without Mortgage | With Mortgage |
| Less than $50,000 | 25 (32.5%) | 0 (0.0%) |
| $50,000 to $99,999 | 20 (26.0%) | 14 (100.0%) |
| $100,000 to $299,999 | 25 (32.5%) | 0 (0.0%) |
| $300,000 to $499,999 | 7 (9.1%) | 0 (0.0%) |
| $500,000 to $749,999 | 0 (0.0%) | 0 (0.0%) |
| $750,000 to $999,999 | 0 (0.0%) | 0 (0.0%) |
| $1,000,000 or more | 0 (0.0%) | 0 (0.0%) |
| Total | 77 (100.0%) | 14 (100.0%) |
Household Income by Mortgage Status in Cedar Creek
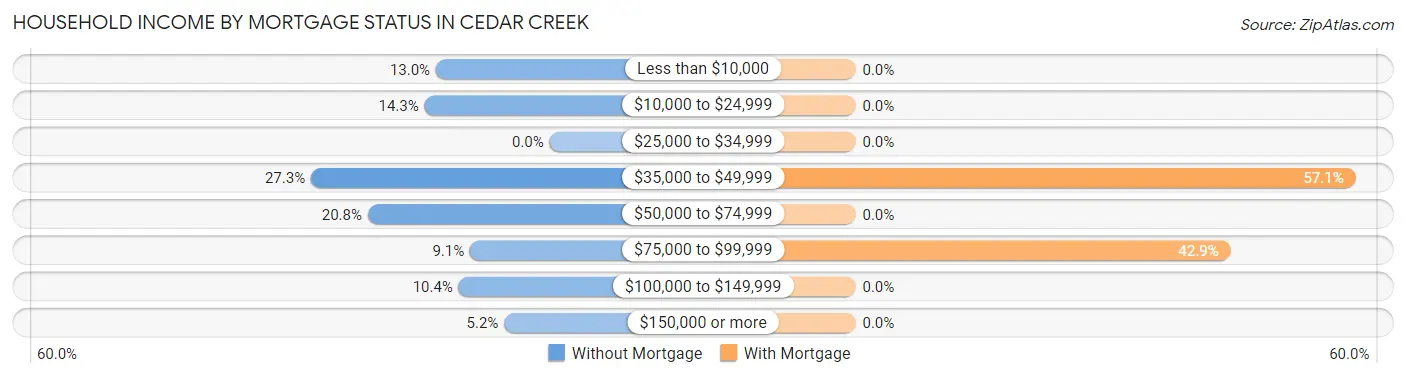
| Household Income | Without Mortgage | With Mortgage |
| Less than $10,000 | 10 (13.0%) | 0 (0.0%) |
| $10,000 to $24,999 | 11 (14.3%) | 0 (0.0%) |
| $25,000 to $34,999 | 0 (0.0%) | 0 (0.0%) |
| $35,000 to $49,999 | 21 (27.3%) | 8 (57.1%) |
| $50,000 to $74,999 | 16 (20.8%) | 0 (0.0%) |
| $75,000 to $99,999 | 7 (9.1%) | 6 (42.9%) |
| $100,000 to $149,999 | 8 (10.4%) | 0 (0.0%) |
| $150,000 or more | 4 (5.2%) | 0 (0.0%) |
| Total | 77 (100.0%) | 14 (100.0%) |
Property Value to Household Income Ratio in Cedar Creek
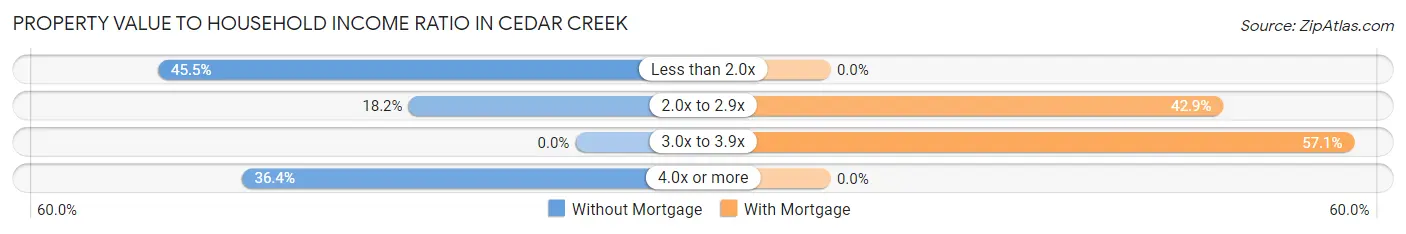
| Value-to-Income Ratio | Without Mortgage | With Mortgage |
| Less than 2.0x | 35 (45.5%) | 0 (0.0%) |
| 2.0x to 2.9x | 14 (18.2%) | 6 (42.9%) |
| 3.0x to 3.9x | 0 (0.0%) | 8 (57.1%) |
| 4.0x or more | 28 (36.4%) | 0 (0.0%) |
| Total | 77 (100.0%) | 14 (100.0%) |
Real Estate Taxes by Mortgage Status in Cedar Creek
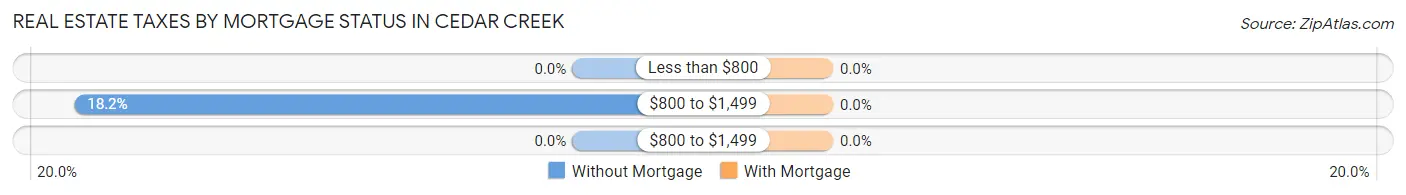
| Property Taxes | Without Mortgage | With Mortgage |
| Less than $800 | 0 (0.0%) | 0 (0.0%) |
| $800 to $1,499 | 14 (18.2%) | 0 (0.0%) |
| $800 to $1,499 | 0 (0.0%) | 0 (0.0%) |
| Total | 77 (100.0%) | 14 (100.0%) |
Health & Disability in Cedar Creek
Health Insurance Coverage by Age in Cedar Creek
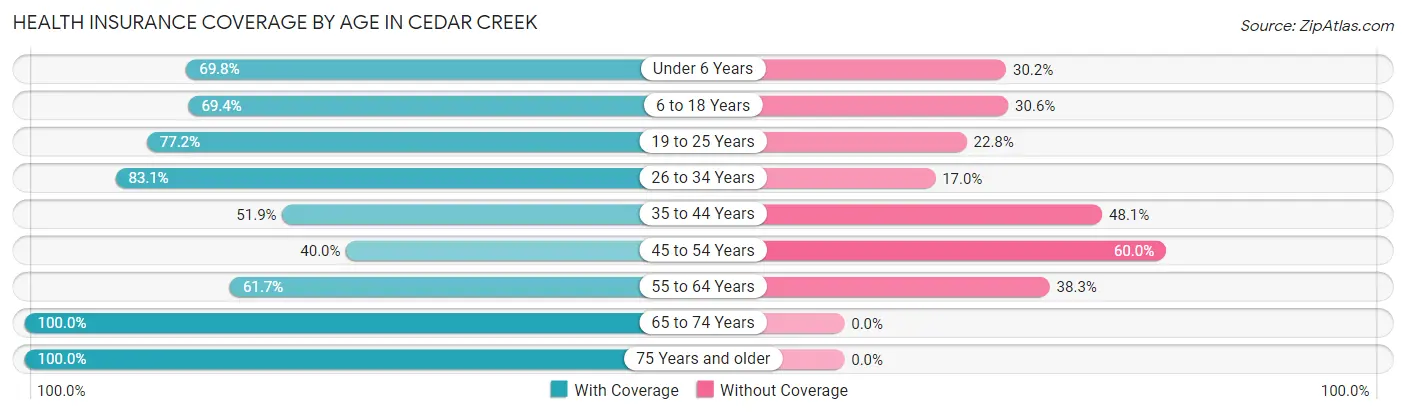
| Age Bracket | With Coverage | Without Coverage |
| Under 6 Years | 44 (69.8%) | 19 (30.2%) |
| 6 to 18 Years | 50 (69.4%) | 22 (30.6%) |
| 19 to 25 Years | 44 (77.2%) | 13 (22.8%) |
| 26 to 34 Years | 49 (83.1%) | 10 (17.0%) |
| 35 to 44 Years | 27 (51.9%) | 25 (48.1%) |
| 45 to 54 Years | 10 (40.0%) | 15 (60.0%) |
| 55 to 64 Years | 29 (61.7%) | 18 (38.3%) |
| 65 to 74 Years | 7 (100.0%) | 0 (0.0%) |
| 75 Years and older | 14 (100.0%) | 0 (0.0%) |
| Total | 274 (69.2%) | 122 (30.8%) |
Health Insurance Coverage by Citizenship Status in Cedar Creek
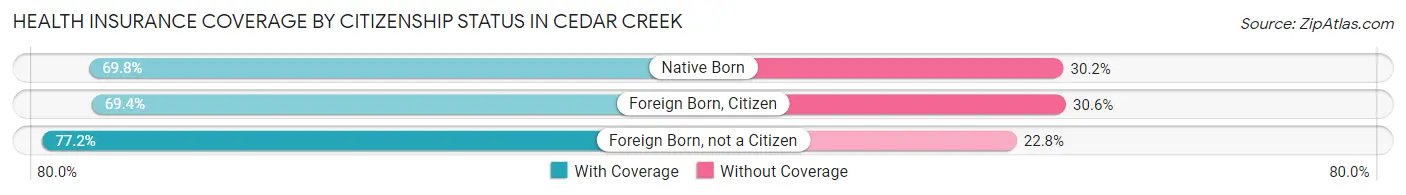
| Citizenship Status | With Coverage | Without Coverage |
| Native Born | 44 (69.8%) | 19 (30.2%) |
| Foreign Born, Citizen | 50 (69.4%) | 22 (30.6%) |
| Foreign Born, not a Citizen | 44 (77.2%) | 13 (22.8%) |
Health Insurance Coverage by Household Income in Cedar Creek
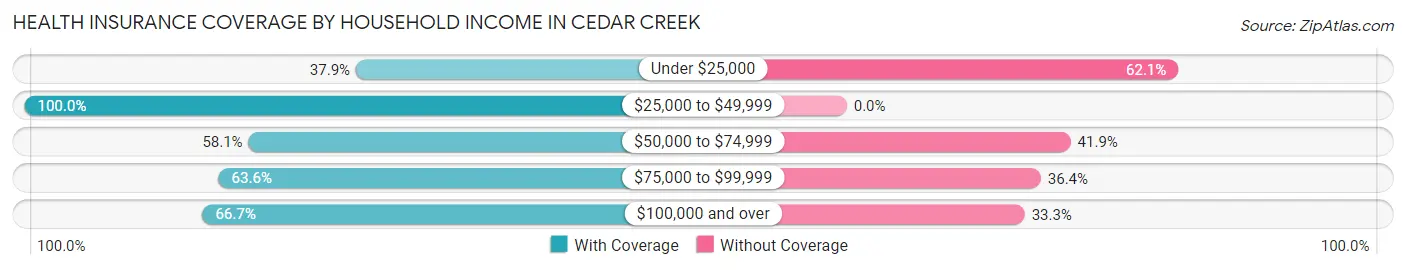
| Household Income | With Coverage | Without Coverage |
| Under $25,000 | 11 (37.9%) | 18 (62.1%) |
| $25,000 to $49,999 | 97 (100.0%) | 0 (0.0%) |
| $50,000 to $74,999 | 90 (58.1%) | 65 (41.9%) |
| $75,000 to $99,999 | 14 (63.6%) | 8 (36.4%) |
| $100,000 and over | 62 (66.7%) | 31 (33.3%) |
Public vs Private Health Insurance Coverage by Age in Cedar Creek
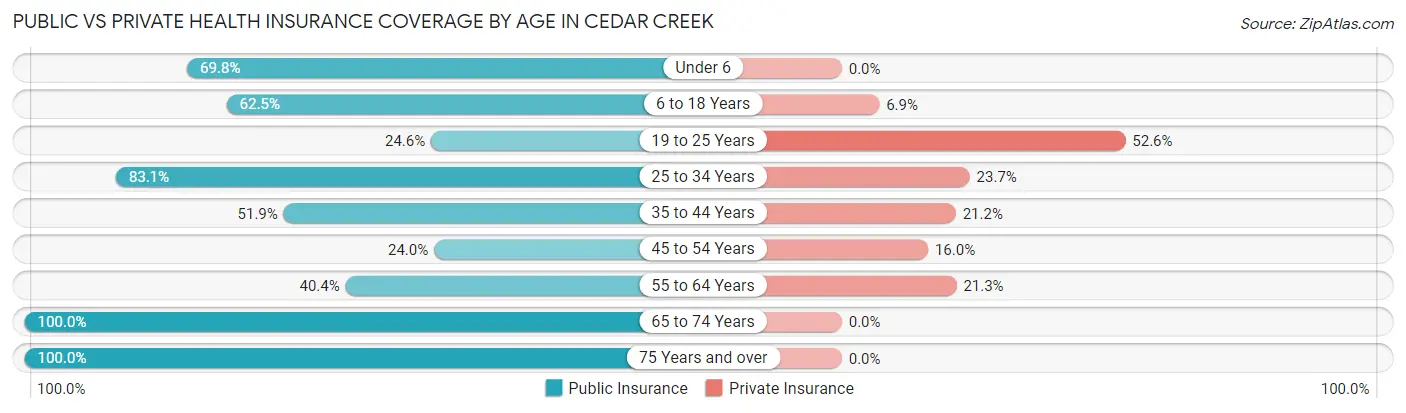
| Age Bracket | Public Insurance | Private Insurance |
| Under 6 | 44 (69.8%) | 0 (0.0%) |
| 6 to 18 Years | 45 (62.5%) | 5 (6.9%) |
| 19 to 25 Years | 14 (24.6%) | 30 (52.6%) |
| 25 to 34 Years | 49 (83.1%) | 14 (23.7%) |
| 35 to 44 Years | 27 (51.9%) | 11 (21.1%) |
| 45 to 54 Years | 6 (24.0%) | 4 (16.0%) |
| 55 to 64 Years | 19 (40.4%) | 10 (21.3%) |
| 65 to 74 Years | 7 (100.0%) | 0 (0.0%) |
| 75 Years and over | 14 (100.0%) | 0 (0.0%) |
| Total | 225 (56.8%) | 74 (18.7%) |
Disability Status by Sex by Age in Cedar Creek
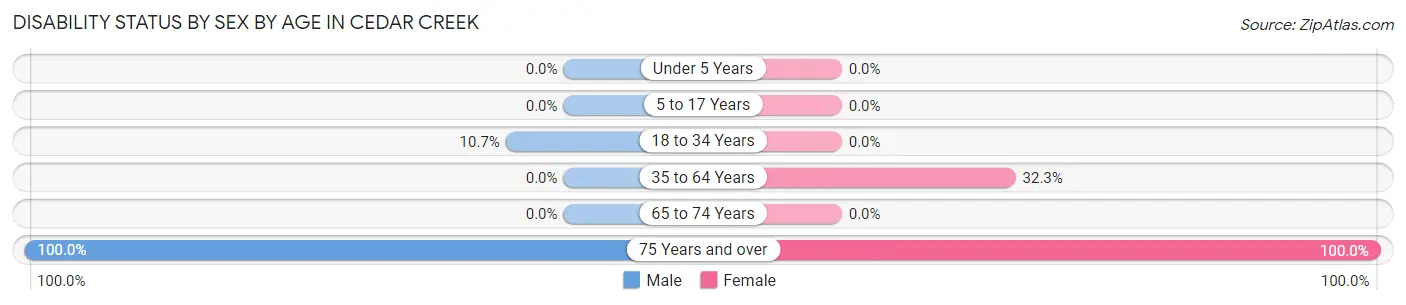
| Age Bracket | Male | Female |
| Under 5 Years | 0 (0.0%) | 0 (0.0%) |
| 5 to 17 Years | 0 (0.0%) | 0 (0.0%) |
| 18 to 34 Years | 6 (10.7%) | 0 (0.0%) |
| 35 to 64 Years | 0 (0.0%) | 20 (32.3%) |
| 65 to 74 Years | 0 (0.0%) | 0 (0.0%) |
| 75 Years and over | 7 (100.0%) | 7 (100.0%) |
Disability Class by Sex by Age in Cedar Creek
Disability Class: Hearing Difficulty
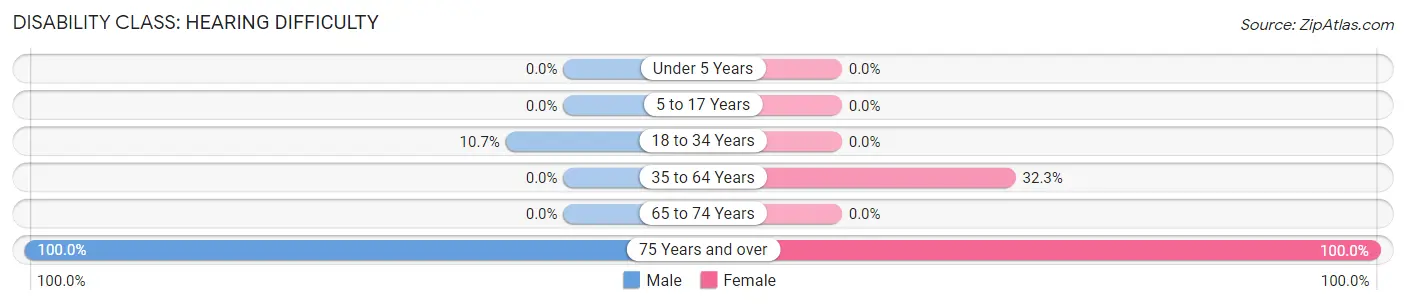
| Age Bracket | Male | Female |
| Under 5 Years | 0 (0.0%) | 0 (0.0%) |
| 5 to 17 Years | 0 (0.0%) | 0 (0.0%) |
| 18 to 34 Years | 6 (10.7%) | 0 (0.0%) |
| 35 to 64 Years | 0 (0.0%) | 20 (32.3%) |
| 65 to 74 Years | 0 (0.0%) | 0 (0.0%) |
| 75 Years and over | 7 (100.0%) | 7 (100.0%) |
Disability Class: Vision Difficulty
| Age Bracket | Male | Female |
| Under 5 Years | 0 (0.0%) | 0 (0.0%) |
| 5 to 17 Years | 0 (0.0%) | 0 (0.0%) |
| 18 to 34 Years | 0 (0.0%) | 0 (0.0%) |
| 35 to 64 Years | 0 (0.0%) | 9 (14.5%) |
| 65 to 74 Years | 0 (0.0%) | 0 (0.0%) |
| 75 Years and over | 0 (0.0%) | 7 (100.0%) |
Disability Class: Cognitive Difficulty
| Age Bracket | Male | Female |
| 5 to 17 Years | 0 (0.0%) | 0 (0.0%) |
| 18 to 34 Years | 6 (10.7%) | 0 (0.0%) |
| 35 to 64 Years | 0 (0.0%) | 0 (0.0%) |
| 65 to 74 Years | 0 (0.0%) | 0 (0.0%) |
| 75 Years and over | 7 (100.0%) | 7 (100.0%) |
Disability Class: Ambulatory Difficulty
| Age Bracket | Male | Female |
| 5 to 17 Years | 0 (0.0%) | 0 (0.0%) |
| 18 to 34 Years | 0 (0.0%) | 0 (0.0%) |
| 35 to 64 Years | 0 (0.0%) | 0 (0.0%) |
| 65 to 74 Years | 0 (0.0%) | 0 (0.0%) |
| 75 Years and over | 0 (0.0%) | 0 (0.0%) |
Disability Class: Self-Care Difficulty
| Age Bracket | Male | Female |
| 5 to 17 Years | 0 (0.0%) | 0 (0.0%) |
| 18 to 34 Years | 0 (0.0%) | 0 (0.0%) |
| 35 to 64 Years | 0 (0.0%) | 0 (0.0%) |
| 65 to 74 Years | 0 (0.0%) | 0 (0.0%) |
| 75 Years and over | 0 (0.0%) | 0 (0.0%) |
Technology Access in Cedar Creek
Computing Device Access in Cedar Creek
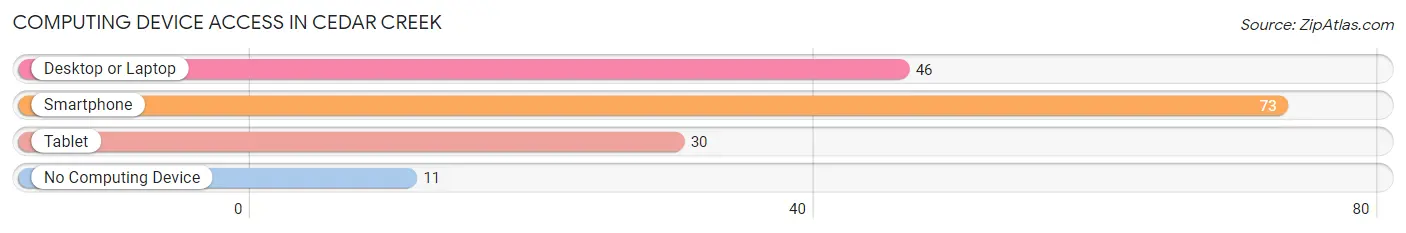
| Device Type | # Households | % Households |
| Desktop or Laptop | 46 | 50.5% |
| Smartphone | 73 | 80.2% |
| Tablet | 30 | 33.0% |
| No Computing Device | 11 | 12.1% |
| Total | 91 | 100.0% |
Internet Access in Cedar Creek
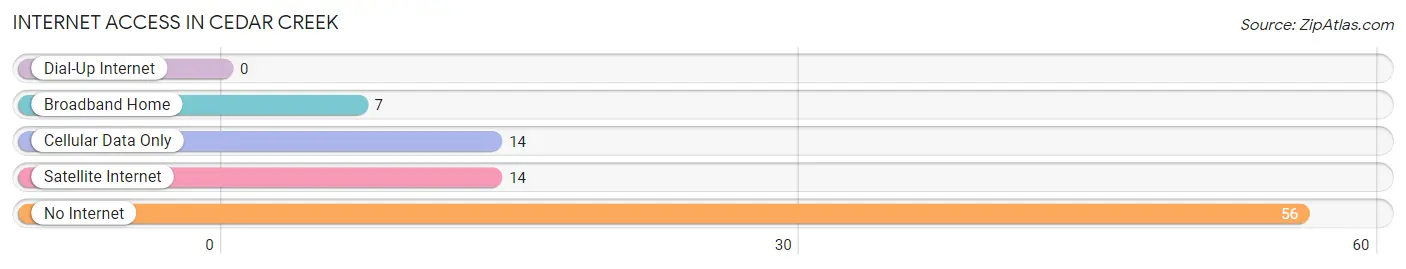
| Internet Type | # Households | % Households |
| Dial-Up Internet | 0 | 0.0% |
| Broadband Home | 7 | 7.7% |
| Cellular Data Only | 14 | 15.4% |
| Satellite Internet | 14 | 15.4% |
| No Internet | 56 | 61.5% |
| Total | 91 | 100.0% |
Cedar Creek Summary
Cedar Creek, Arizona is a small unincorporated community located in the Coconino County of Arizona. It is situated in the northern part of the state, approximately 25 miles south of Flagstaff. The community is located in a rural area, surrounded by the Coconino National Forest and the San Francisco Peaks. The area is known for its scenic beauty and outdoor recreation opportunities.
History
Cedar Creek was first settled in the late 1800s by homesteaders who were attracted to the area by its abundant natural resources. The community was originally known as Cedar Creek Ranch, and the first post office was established in 1891. The town was officially incorporated in 1912, and the name was changed to Cedar Creek.
The town was a popular destination for tourists in the early 1900s, and it was home to several resorts and lodges. The town was also home to a sawmill, which provided lumber for the local area.
Geography
Cedar Creek is located in the northern part of Arizona, approximately 25 miles south of Flagstaff. The town is situated in a rural area, surrounded by the Coconino National Forest and the San Francisco Peaks. The area is known for its scenic beauty and outdoor recreation opportunities.
The town is located at an elevation of 6,000 feet, and the climate is generally mild and dry. The average annual temperature is around 50 degrees Fahrenheit, and the average annual precipitation is around 12 inches.
Economy
Cedar Creek is a small, rural community with a limited economy. The town is home to several small businesses, including a general store, a gas station, and a few restaurants. The town is also home to a sawmill, which provides lumber for the local area.
The town is also home to several tourist attractions, including the Cedar Creek Falls, the Cedar Creek Observatory, and the Cedar Creek Wildlife Refuge. These attractions draw visitors from all over the state and beyond.
Demographics
As of the 2010 census, the population of Cedar Creek was 1,093. The racial makeup of the town was 95.3% White, 0.7% Native American, 0.3% Asian, 0.2% African American, and 3.5% from other races. The median household income was $37,500, and the median age was 44.
Conclusion
Cedar Creek, Arizona is a small, rural community located in the Coconino County of Arizona. The town is known for its scenic beauty and outdoor recreation opportunities, and it is home to several tourist attractions. The town has a limited economy, and the population is mostly White. The median household income is around $37,500, and the median age is 44.
Common Questions
What is Per Capita Income in Cedar Creek?
Per Capita income in Cedar Creek is $13,880.
What is the Median Family Income in Cedar Creek?
Median Family Income in Cedar Creek is $50,417.
What is the Median Household income in Cedar Creek?
Median Household Income in Cedar Creek is $48,393.
What is Income or Wage Gap in Cedar Creek?
Income or Wage Gap in Cedar Creek is 45.3%.
Women in Cedar Creek earn 54.7 cents for every dollar earned by a man.
What is Inequality or Gini Index in Cedar Creek?
Inequality or Gini Index in Cedar Creek is 0.38.
What is the Total Population of Cedar Creek?
Total Population of Cedar Creek is 396.
What is the Total Male Population of Cedar Creek?
Total Male Population of Cedar Creek is 163.
What is the Total Female Population of Cedar Creek?
Total Female Population of Cedar Creek is 233.
What is the Ratio of Males per 100 Females in Cedar Creek?
There are 69.96 Males per 100 Females in Cedar Creek.
What is the Ratio of Females per 100 Males in Cedar Creek?
There are 142.94 Females per 100 Males in Cedar Creek.
What is the Median Population Age in Cedar Creek?
Median Population Age in Cedar Creek is 27.2 Years.
What is the Average Family Size in Cedar Creek
Average Family Size in Cedar Creek is 4.8 People.
What is the Average Household Size in Cedar Creek
Average Household Size in Cedar Creek is 4.3 People.
How Large is the Labor Force in Cedar Creek?
There are 209 People in the Labor Forcein in Cedar Creek.
What is the Percentage of People in the Labor Force in Cedar Creek?
76.3% of People are in the Labor Force in Cedar Creek.
What is the Unemployment Rate in Cedar Creek?
Unemployment Rate in Cedar Creek is 8.1%.