Cities with the Highest Male Poverty Level in Delaware
RELATED REPORTS & OPTIONS
Highest Poverty | Male
Delaware
Compare Cities
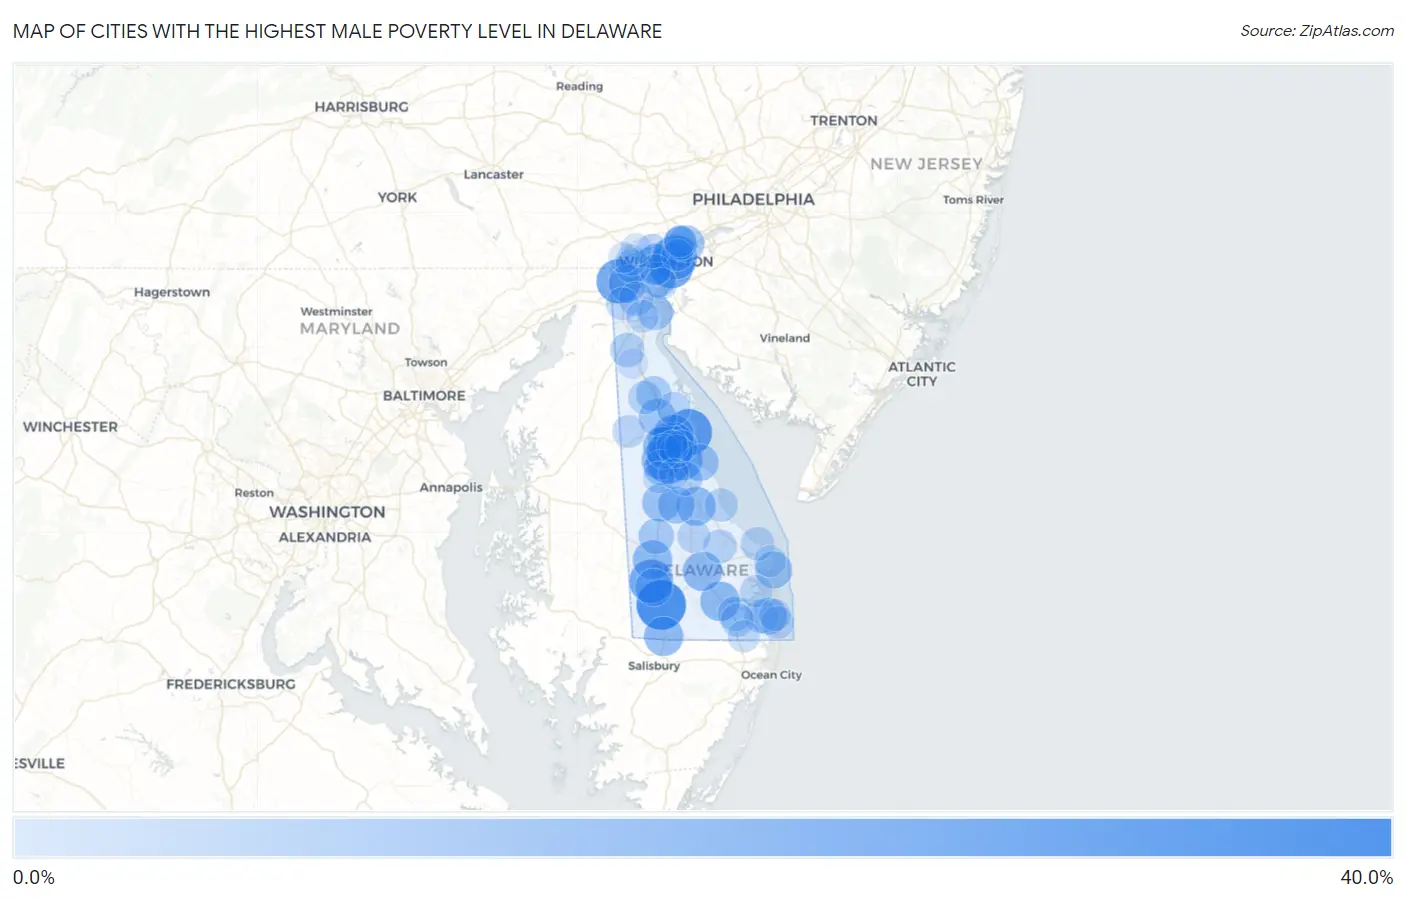
Map of Cities with the Highest Male Poverty Level in Delaware
0.0%
40.0%
Cities with the Highest Male Poverty Level in Delaware
| City | Male Poverty | vs State | vs National | |
| 1. | Laurel | 31.9% | 10.0%(+21.9)#1 | 11.3%(+20.6)#2,621 |
| 2. | Little Creek | 27.3% | 10.0%(+17.4)#2 | 11.3%(+16.0)#3,610 |
| 3. | Woodside East | 23.7% | 10.0%(+13.8)#3 | 11.3%(+12.4)#4,802 |
| 4. | Newark | 23.5% | 10.0%(+13.5)#4 | 11.3%(+12.1)#4,893 |
| 5. | Wilmington | 23.3% | 10.0%(+13.3)#5 | 11.3%(+12.0)#4,976 |
| 6. | Edgemoor | 22.9% | 10.0%(+12.9)#6 | 11.3%(+11.6)#5,119 |
| 7. | Seaford | 22.0% | 10.0%(+12.1)#7 | 11.3%(+10.7)#5,536 |
| 8. | Dover | 16.8% | 10.0%(+6.85)#8 | 11.3%(+5.49)#8,525 |
| 9. | Kent Acres | 16.4% | 10.0%(+6.46)#9 | 11.3%(+5.10)#8,803 |
| 10. | Magnolia | 16.4% | 10.0%(+6.43)#10 | 11.3%(+5.06)#8,830 |
| 11. | Elsmere | 16.2% | 10.0%(+6.24)#11 | 11.3%(+4.87)#8,966 |
| 12. | Millsboro | 15.3% | 10.0%(+5.33)#12 | 11.3%(+3.96)#9,676 |
| 13. | Bridgeville | 15.2% | 10.0%(+5.17)#13 | 11.3%(+3.81)#9,786 |
| 14. | Georgetown | 15.0% | 10.0%(+5.04)#14 | 11.3%(+3.68)#9,881 |
| 15. | Woodside | 15.0% | 10.0%(+5.02)#15 | 11.3%(+3.66)#9,894 |
| 16. | Delmar | 14.8% | 10.0%(+4.78)#16 | 11.3%(+3.41)#10,096 |
| 17. | Rodney Village | 14.7% | 10.0%(+4.71)#17 | 11.3%(+3.34)#10,159 |
| 18. | Milford | 14.3% | 10.0%(+4.35)#18 | 11.3%(+2.98)#10,465 |
| 19. | Wyoming | 14.2% | 10.0%(+4.22)#19 | 11.3%(+2.85)#10,592 |
| 20. | Harrington | 12.8% | 10.0%(+2.79)#20 | 11.3%(+1.43)#11,937 |
| 21. | Brookside | 12.0% | 10.0%(+2.03)#21 | 11.3%(+0.662)#12,721 |
| 22. | Cheswold | 11.9% | 10.0%(+1.95)#22 | 11.3%(+0.585)#12,819 |
| 23. | Blades | 11.8% | 10.0%(+1.80)#23 | 11.3%(+0.436)#12,961 |
| 24. | Dewey Beach | 11.2% | 10.0%(+1.27)#24 | 11.3%(-0.099)#13,574 |
| 25. | Houston | 11.2% | 10.0%(+1.18)#25 | 11.3%(-0.181)#13,661 |
| 26. | Ocean View | 11.1% | 10.0%(+1.15)#26 | 11.3%(-0.211)#13,706 |
| 27. | Bowers | 11.0% | 10.0%(+1.05)#27 | 11.3%(-0.312)#13,826 |
| 28. | Claymont | 10.6% | 10.0%(+0.613)#28 | 11.3%(-0.752)#14,309 |
| 29. | Greenwood | 9.1% | 10.0%(-0.911)#29 | 11.3%(-2.28)#16,163 |
| 30. | Viola | 8.6% | 10.0%(-1.41)#30 | 11.3%(-2.77)#16,752 |
| 31. | Delaware City | 8.5% | 10.0%(-1.49)#31 | 11.3%(-2.85)#16,863 |
| 32. | Wilmington Manor | 8.4% | 10.0%(-1.55)#32 | 11.3%(-2.91)#16,934 |
| 33. | Smyrna | 8.2% | 10.0%(-1.76)#33 | 11.3%(-3.12)#17,190 |
| 34. | Camden | 7.7% | 10.0%(-2.24)#34 | 11.3%(-3.61)#17,829 |
| 35. | Dagsboro | 7.2% | 10.0%(-2.80)#35 | 11.3%(-4.16)#18,603 |
| 36. | Middletown | 7.0% | 10.0%(-3.01)#36 | 11.3%(-4.38)#18,910 |
| 37. | Frederica | 6.9% | 10.0%(-3.04)#37 | 11.3%(-4.40)#18,952 |
| 38. | Pike Creek Valley | 6.8% | 10.0%(-3.22)#38 | 11.3%(-4.58)#19,218 |
| 39. | Bear | 6.6% | 10.0%(-3.37)#39 | 11.3%(-4.74)#19,482 |
| 40. | Millville | 6.3% | 10.0%(-3.67)#40 | 11.3%(-5.03)#19,888 |
| 41. | Greenville | 6.3% | 10.0%(-3.70)#41 | 11.3%(-5.07)#19,933 |
| 42. | Ardencroft | 5.7% | 10.0%(-4.23)#42 | 11.3%(-5.59)#20,673 |
| 43. | Ardentown | 5.7% | 10.0%(-4.26)#43 | 11.3%(-5.63)#20,735 |
| 44. | Lewes | 5.7% | 10.0%(-4.32)#44 | 11.3%(-5.69)#20,834 |
| 45. | Leipsic | 5.6% | 10.0%(-4.36)#45 | 11.3%(-5.72)#20,878 |
| 46. | Clayton | 5.6% | 10.0%(-4.36)#46 | 11.3%(-5.73)#20,881 |
| 47. | Milton | 5.5% | 10.0%(-4.51)#47 | 11.3%(-5.88)#21,114 |
| 48. | Frankford | 5.4% | 10.0%(-4.58)#48 | 11.3%(-5.95)#21,232 |
| 49. | Slaughter Beach | 5.1% | 10.0%(-4.84)#49 | 11.3%(-6.20)#21,606 |
| 50. | Ellendale | 5.1% | 10.0%(-4.92)#50 | 11.3%(-6.29)#21,730 |
| 51. | Rising Sun Lebanon | 4.9% | 10.0%(-5.05)#51 | 11.3%(-6.42)#21,919 |
| 52. | South Bethany | 4.6% | 10.0%(-5.35)#52 | 11.3%(-6.72)#22,357 |
| 53. | Glasgow | 4.4% | 10.0%(-5.56)#53 | 11.3%(-6.92)#22,691 |
| 54. | Hartly | 4.2% | 10.0%(-5.74)#54 | 11.3%(-7.10)#22,967 |
| 55. | Long Neck | 4.1% | 10.0%(-5.92)#55 | 11.3%(-7.29)#23,246 |
| 56. | St Georges | 3.8% | 10.0%(-6.14)#56 | 11.3%(-7.51)#23,596 |
| 57. | Selbyville | 3.3% | 10.0%(-6.63)#57 | 11.3%(-8.00)#24,309 |
| 58. | Bethany Beach | 3.3% | 10.0%(-6.64)#58 | 11.3%(-8.01)#24,323 |
| 59. | Rehoboth Beach | 3.1% | 10.0%(-6.90)#59 | 11.3%(-8.26)#24,702 |
| 60. | Dover Base Housing | 3.0% | 10.0%(-6.95)#60 | 11.3%(-8.31)#24,778 |
| 61. | Bellefonte | 2.8% | 10.0%(-7.15)#61 | 11.3%(-8.52)#25,069 |
| 62. | Felton | 2.7% | 10.0%(-7.30)#62 | 11.3%(-8.67)#25,247 |
| 63. | New Castle | 2.6% | 10.0%(-7.40)#63 | 11.3%(-8.76)#25,374 |
| 64. | Highland Acres | 2.5% | 10.0%(-7.50)#64 | 11.3%(-8.87)#25,523 |
| 65. | Arden | 2.4% | 10.0%(-7.55)#65 | 11.3%(-8.91)#25,580 |
| 66. | Newport | 2.1% | 10.0%(-7.85)#66 | 11.3%(-9.21)#25,977 |
| 67. | Pike Creek | 2.0% | 10.0%(-7.99)#67 | 11.3%(-9.35)#26,149 |
| 68. | Hockessin | 1.8% | 10.0%(-8.15)#68 | 11.3%(-9.51)#26,323 |
| 69. | Lincoln | 1.8% | 10.0%(-8.16)#69 | 11.3%(-9.53)#26,345 |
| 70. | North Star | 1.3% | 10.0%(-8.67)#70 | 11.3%(-10.0)#26,849 |
| 71. | Townsend | 0.84% | 10.0%(-9.13)#71 | 11.3%(-10.5)#27,247 |
| 72. | Riverview | 0.090% | 10.0%(-9.89)#72 | 11.3%(-11.3)#27,607 |
1
Common Questions
What are the Top 10 Cities with the Highest Male Poverty Level in Delaware?
Top 10 Cities with the Highest Male Poverty Level in Delaware are:
#1
31.9%
#2
27.3%
#3
23.7%
#4
23.5%
#5
23.3%
#6
22.9%
#7
22.0%
#8
16.8%
#9
16.4%
#10
16.4%
What city has the Highest Male Poverty Level in Delaware?
Laurel has the Highest Male Poverty Level in Delaware with 31.9%.
What is the Poverty Level Among Males in the State of Delaware?
Poverty Level Among Males in Delaware is 10.0%.
What is the Poverty Level Among Males in the United States?
Poverty Level Among Males in the United States is 11.3%.