Zip Codes with the Highest Percentage of Population with a Degree in Computers and Mathematics in Vermont
RELATED REPORTS & OPTIONS
Computers and Mathematics
Vermont
Compare Zip Codes
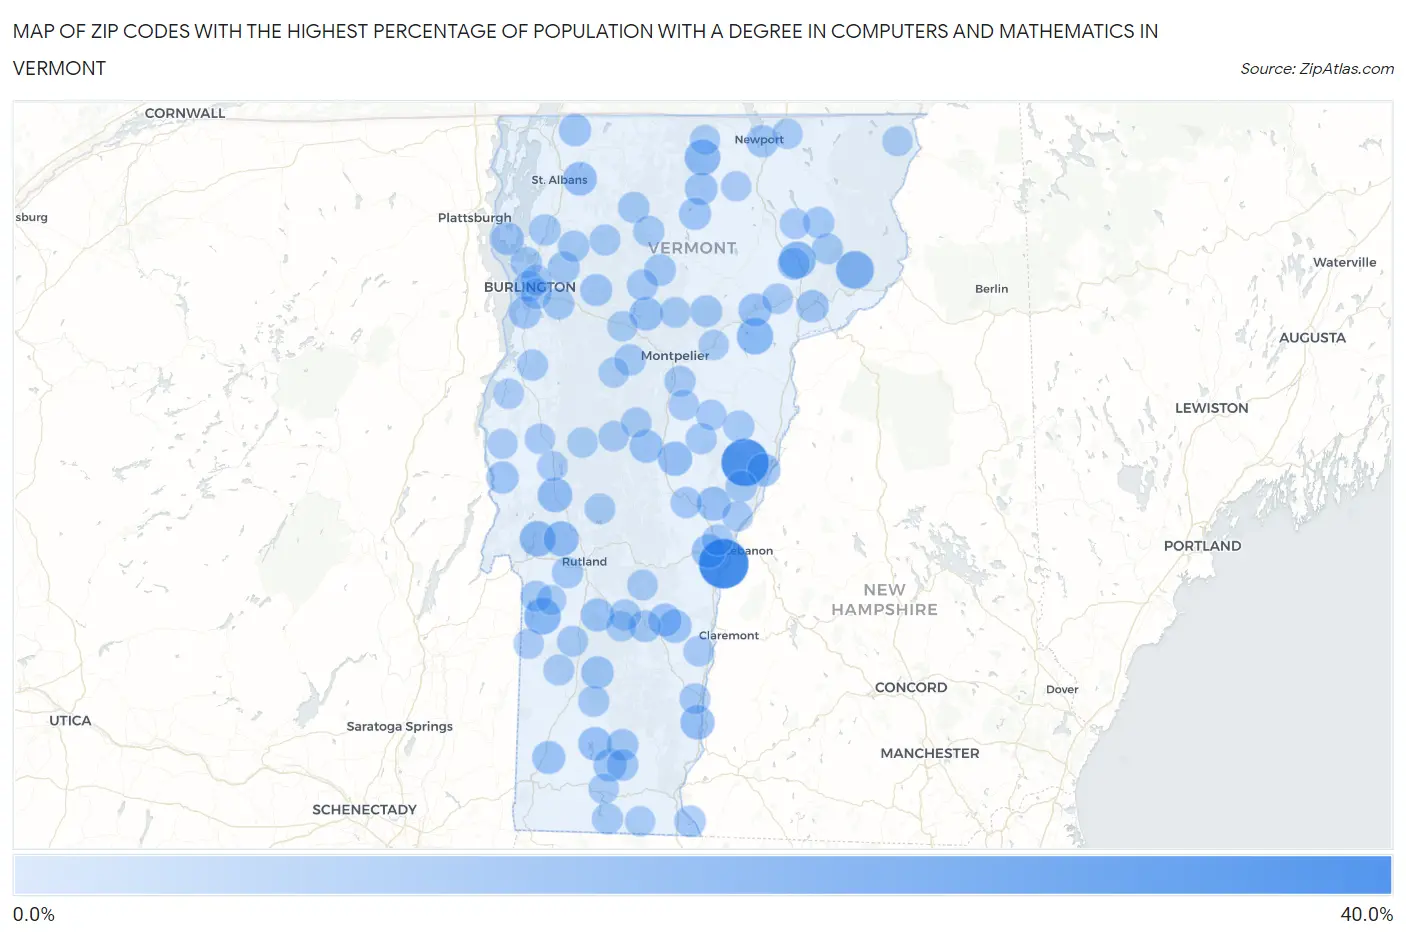
Map of Zip Codes with the Highest Percentage of Population with a Degree in Computers and Mathematics in Vermont
0.0%
40.0%
Zip Codes with the Highest Percentage of Population with a Degree in Computers and Mathematics in Vermont
| Zip Code | % Graduates | vs State | vs National | |
| 1. | 05052 | 35.0% | 3.5%(+31.5)#1 | 4.9%(+30.1)#169 |
| 2. | 05083 | 31.0% | 3.5%(+27.6)#2 | 4.9%(+26.1)#212 |
| 3. | 05858 | 15.4% | 3.5%(+11.9)#3 | 4.9%(+10.5)#757 |
| 4. | 05850 | 13.3% | 3.5%(+9.79)#4 | 4.9%(+8.36)#1,014 |
| 5. | 05774 | 13.1% | 3.5%(+9.60)#5 | 4.9%(+8.17)#1,044 |
| 6. | 05862 | 12.8% | 3.5%(+9.29)#6 | 4.9%(+7.86)#1,084 |
| 7. | 05874 | 11.7% | 3.5%(+8.22)#7 | 4.9%(+6.78)#1,285 |
| 8. | 05732 | 11.5% | 3.5%(+8.03)#8 | 4.9%(+6.59)#1,330 |
| 9. | 05744 | 10.5% | 3.5%(+7.02)#9 | 4.9%(+5.59)#1,591 |
| 10. | 05733 | 9.9% | 3.5%(+6.48)#10 | 4.9%(+5.04)#1,781 |
| 11. | 05158 | 9.3% | 3.5%(+5.84)#11 | 4.9%(+4.41)#2,064 |
| 12. | 05061 | 9.2% | 3.5%(+5.72)#12 | 4.9%(+4.28)#2,130 |
| 13. | 05059 | 9.0% | 3.5%(+5.50)#13 | 4.9%(+4.06)#2,286 |
| 14. | 05065 | 8.7% | 3.5%(+5.28)#14 | 4.9%(+3.84)#2,405 |
| 15. | 05455 | 8.4% | 3.5%(+4.96)#15 | 4.9%(+3.52)#2,587 |
| 16. | 05677 | 8.0% | 3.5%(+4.51)#16 | 4.9%(+3.07)#2,930 |
| 17. | 05360 | 7.9% | 3.5%(+4.41)#17 | 4.9%(+2.97)#3,011 |
| 18. | 05045 | 7.8% | 3.5%(+4.37)#18 | 4.9%(+2.94)#3,035 |
| 19. | 05142 | 7.7% | 3.5%(+4.23)#19 | 4.9%(+2.80)#3,157 |
| 20. | 05742 | 7.7% | 3.5%(+4.19)#20 | 4.9%(+2.76)#3,196 |
| 21. | 05060 | 7.6% | 3.5%(+4.17)#21 | 4.9%(+2.74)#3,213 |
| 22. | 05873 | 7.6% | 3.5%(+4.16)#22 | 4.9%(+2.73)#3,225 |
| 23. | 05153 | 7.5% | 3.5%(+4.07)#23 | 4.9%(+2.63)#3,313 |
| 24. | 05356 | 7.3% | 3.5%(+3.88)#24 | 4.9%(+2.45)#3,478 |
| 25. | 05262 | 7.3% | 3.5%(+3.88)#25 | 4.9%(+2.45)#3,480 |
| 26. | 05486 | 6.9% | 3.5%(+3.46)#26 | 4.9%(+2.02)#3,926 |
| 27. | 05847 | 6.7% | 3.5%(+3.21)#27 | 4.9%(+1.77)#4,242 |
| 28. | 05152 | 6.6% | 3.5%(+3.18)#28 | 4.9%(+1.75)#4,279 |
| 29. | 05819 | 6.6% | 3.5%(+3.11)#29 | 4.9%(+1.67)#4,365 |
| 30. | 05770 | 6.4% | 3.5%(+2.94)#30 | 4.9%(+1.50)#4,615 |
| 31. | 05459 | 6.3% | 3.5%(+2.83)#31 | 4.9%(+1.40)#4,781 |
| 32. | 05482 | 6.2% | 3.5%(+2.73)#32 | 4.9%(+1.30)#4,958 |
| 33. | 05855 | 6.1% | 3.5%(+2.68)#33 | 4.9%(+1.25)#5,045 |
| 34. | 05653 | 6.1% | 3.5%(+2.60)#34 | 4.9%(+1.17)#5,196 |
| 35. | 05465 | 5.9% | 3.5%(+2.49)#35 | 4.9%(+1.05)#5,382 |
| 36. | 05851 | 5.9% | 3.5%(+2.47)#36 | 4.9%(+1.04)#5,415 |
| 37. | 05452 | 5.6% | 3.5%(+2.15)#37 | 4.9%(+0.718)#6,043 |
| 38. | 05355 | 5.6% | 3.5%(+2.15)#38 | 4.9%(+0.714)#6,054 |
| 39. | 05661 | 5.6% | 3.5%(+2.13)#39 | 4.9%(+0.697)#6,083 |
| 40. | 05149 | 5.6% | 3.5%(+2.10)#40 | 4.9%(+0.669)#6,155 |
| 41. | 05650 | 5.5% | 3.5%(+2.00)#41 | 4.9%(+0.561)#6,389 |
| 42. | 05341 | 5.3% | 3.5%(+1.83)#42 | 4.9%(+0.397)#6,779 |
| 43. | 05354 | 5.0% | 3.5%(+1.57)#43 | 4.9%(+0.139)#7,373 |
| 44. | 05468 | 5.0% | 3.5%(+1.55)#44 | 4.9%(+0.115)#7,429 |
| 45. | 05660 | 4.8% | 3.5%(+1.31)#45 | 4.9%(-0.121)#8,066 |
| 46. | 05495 | 4.7% | 3.5%(+1.27)#46 | 4.9%(-0.164)#8,184 |
| 47. | 05075 | 4.7% | 3.5%(+1.22)#47 | 4.9%(-0.218)#8,345 |
| 48. | 05777 | 4.7% | 3.5%(+1.19)#48 | 4.9%(-0.241)#8,414 |
| 49. | 05492 | 4.6% | 3.5%(+1.16)#49 | 4.9%(-0.270)#8,501 |
| 50. | 05446 | 4.6% | 3.5%(+1.12)#50 | 4.9%(-0.312)#8,611 |
| 51. | 05068 | 4.6% | 3.5%(+1.11)#51 | 4.9%(-0.324)#8,651 |
| 52. | 05494 | 4.5% | 3.5%(+1.08)#52 | 4.9%(-0.356)#8,746 |
| 53. | 05871 | 4.5% | 3.5%(+1.04)#53 | 4.9%(-0.397)#8,881 |
| 54. | 05039 | 4.5% | 3.5%(+1.02)#54 | 4.9%(-0.412)#8,935 |
| 55. | 05361 | 4.5% | 3.5%(+1.01)#55 | 4.9%(-0.422)#8,963 |
| 56. | 05340 | 4.5% | 3.5%(+1.00)#56 | 4.9%(-0.430)#8,984 |
| 57. | 05758 | 4.5% | 3.5%(+0.996)#57 | 4.9%(-0.439)#9,014 |
| 58. | 05641 | 4.4% | 3.5%(+0.945)#58 | 4.9%(-0.489)#9,188 |
| 59. | 05672 | 4.4% | 3.5%(+0.939)#59 | 4.9%(-0.495)#9,204 |
| 60. | 05764 | 4.4% | 3.5%(+0.915)#60 | 4.9%(-0.520)#9,279 |
| 61. | 05001 | 4.4% | 3.5%(+0.908)#61 | 4.9%(-0.526)#9,295 |
| 62. | 05656 | 4.4% | 3.5%(+0.901)#62 | 4.9%(-0.534)#9,316 |
| 63. | 05038 | 4.3% | 3.5%(+0.823)#63 | 4.9%(-0.612)#9,587 |
| 64. | 05401 | 4.3% | 3.5%(+0.810)#64 | 4.9%(-0.625)#9,623 |
| 65. | 05473 | 4.2% | 3.5%(+0.761)#65 | 4.9%(-0.673)#9,766 |
| 66. | 05444 | 4.2% | 3.5%(+0.761)#66 | 4.9%(-0.674)#9,768 |
| 67. | 05403 | 4.2% | 3.5%(+0.759)#67 | 4.9%(-0.676)#9,777 |
| 68. | 05101 | 4.2% | 3.5%(+0.732)#68 | 4.9%(-0.703)#9,868 |
| 69. | 05739 | 4.0% | 3.5%(+0.512)#69 | 4.9%(-0.923)#10,551 |
| 70. | 05404 | 4.0% | 3.5%(+0.503)#70 | 4.9%(-0.932)#10,579 |
| 71. | 05832 | 3.9% | 3.5%(+0.475)#71 | 4.9%(-0.960)#10,673 |
| 72. | 05737 | 3.8% | 3.5%(+0.338)#72 | 4.9%(-1.10)#11,197 |
| 73. | 05251 | 3.8% | 3.5%(+0.336)#73 | 4.9%(-1.10)#11,202 |
| 74. | 05867 | 3.7% | 3.5%(+0.272)#74 | 4.9%(-1.16)#11,431 |
| 75. | 05828 | 3.7% | 3.5%(+0.234)#75 | 4.9%(-1.20)#11,569 |
| 76. | 05682 | 3.7% | 3.5%(+0.220)#76 | 4.9%(-1.21)#11,614 |
| 77. | 05679 | 3.6% | 3.5%(+0.177)#77 | 4.9%(-1.26)#11,756 |
| 78. | 05675 | 3.6% | 3.5%(+0.149)#78 | 4.9%(-1.29)#11,861 |
| 79. | 05156 | 3.5% | 3.5%(+0.089)#79 | 4.9%(-1.35)#12,101 |
| 80. | 05056 | 3.5% | 3.5%(+0.058)#80 | 4.9%(-1.38)#12,221 |
| 81. | 05753 | 3.5% | 3.5%(+0.012)#81 | 4.9%(-1.42)#12,395 |
| 82. | 05766 | 3.4% | 3.5%(-0.031)#82 | 4.9%(-1.47)#12,560 |
| 83. | 05055 | 3.4% | 3.5%(-0.038)#83 | 4.9%(-1.47)#12,586 |
| 84. | 05769 | 3.4% | 3.5%(-0.078)#84 | 4.9%(-1.51)#12,724 |
| 85. | 05747 | 3.3% | 3.5%(-0.126)#85 | 4.9%(-1.56)#12,903 |
| 86. | 05669 | 3.3% | 3.5%(-0.142)#86 | 4.9%(-1.58)#12,959 |
| 87. | 05730 | 3.3% | 3.5%(-0.170)#87 | 4.9%(-1.60)#13,052 |
| 88. | 05363 | 3.3% | 3.5%(-0.194)#88 | 4.9%(-1.63)#13,135 |
| 89. | 05676 | 3.3% | 3.5%(-0.208)#89 | 4.9%(-1.64)#13,185 |
| 90. | 05829 | 3.2% | 3.5%(-0.234)#90 | 4.9%(-1.67)#13,277 |
| 91. | 05775 | 3.2% | 3.5%(-0.285)#91 | 4.9%(-1.72)#13,482 |
| 92. | 05491 | 3.1% | 3.5%(-0.348)#92 | 4.9%(-1.78)#13,688 |
| 93. | 05673 | 3.1% | 3.5%(-0.408)#93 | 4.9%(-1.84)#13,905 |
| 94. | 05845 | 3.0% | 3.5%(-0.419)#94 | 4.9%(-1.85)#13,939 |
| 95. | 05859 | 3.0% | 3.5%(-0.436)#95 | 4.9%(-1.87)#14,021 |
| 96. | 05734 | 3.0% | 3.5%(-0.449)#96 | 4.9%(-1.88)#14,066 |
| 97. | 05903 | 2.9% | 3.5%(-0.518)#97 | 4.9%(-1.95)#14,290 |
| 98. | 05757 | 2.9% | 3.5%(-0.555)#98 | 4.9%(-1.99)#14,407 |
| 99. | 05667 | 2.9% | 3.5%(-0.568)#99 | 4.9%(-2.00)#14,454 |
| 100. | 05358 | 2.9% | 3.5%(-0.575)#100 | 4.9%(-2.01)#14,483 |
Common Questions
What are the Top 10 Zip Codes with the Highest Percentage of Population with a Degree in Computers and Mathematics in Vermont?
Top 10 Zip Codes with the Highest Percentage of Population with a Degree in Computers and Mathematics in Vermont are:
What zip code has the Highest Percentage of Population with a Degree in Computers and Mathematics in Vermont?
05052 has the Highest Percentage of Population with a Degree in Computers and Mathematics in Vermont with 35.0%.
What is the Percentage of Population with a Degree in Computers and Mathematics in the State of Vermont?
Percentage of Population with a Degree in Computers and Mathematics in Vermont is 3.5%.
What is the Percentage of Population with a Degree in Computers and Mathematics in the United States?
Percentage of Population with a Degree in Computers and Mathematics in the United States is 4.9%.