North San Pedro, TX Map & Demographics
North San Pedro Map
North San Pedro Overview
$23,453
PER CAPITA INCOME
$68,059
AVG HOUSEHOLD INCOME
52.3%
WAGE / INCOME GAP [ % ]
47.7¢/ $1
WAGE / INCOME GAP [ $ ]
0.40
INEQUALITY / GINI INDEX
824
TOTAL POPULATION
423
MALE POPULATION
401
FEMALE POPULATION
105.49
MALES / 100 FEMALES
94.80
FEMALES / 100 MALES
45.2
MEDIAN AGE
3.9
AVG FAMILY SIZE
3.5
AVG HOUSEHOLD SIZE
378
LABOR FORCE [ PEOPLE ]
59.9%
PERCENT IN LABOR FORCE
14.3%
UNEMPLOYMENT RATE
Income in North San Pedro
Income Overview in North San Pedro
| Characteristic | Number | Measure |
| Per Capita Income | 824 | $23,453 |
| Median Family Income | 186 | $0 |
| Mean Family Income | 186 | $80,890 |
| Median Household Income | 233 | $68,059 |
| Mean Household Income | 233 | $83,046 |
| Income Deficit | 186 | $0 |
| Wage / Income Gap (%) | 824 | 52.34% |
| Wage / Income Gap ($) | 824 | 47.66¢ per $1 |
| Gini / Inequality Index | 824 | 0.40 |
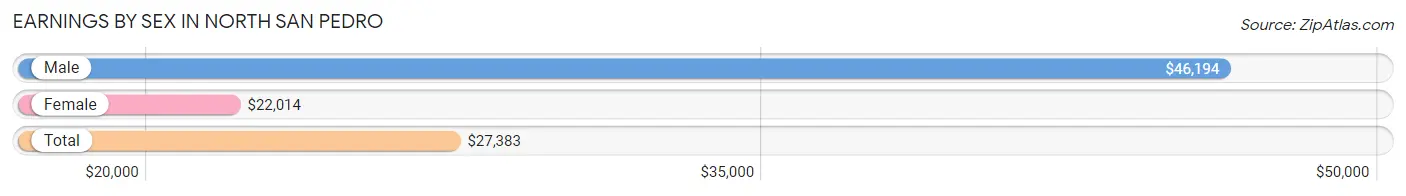
Earnings by Sex in North San Pedro
Average Earnings in North San Pedro are $27,383, $46,194 for men and $22,014 for women, a difference of 52.3%.
| Sex | Number | Average Earnings |
| Male | 189 (50.0%) | $46,194 |
| Female | 189 (50.0%) | $22,014 |
| Total | 378 (100.0%) | $27,383 |
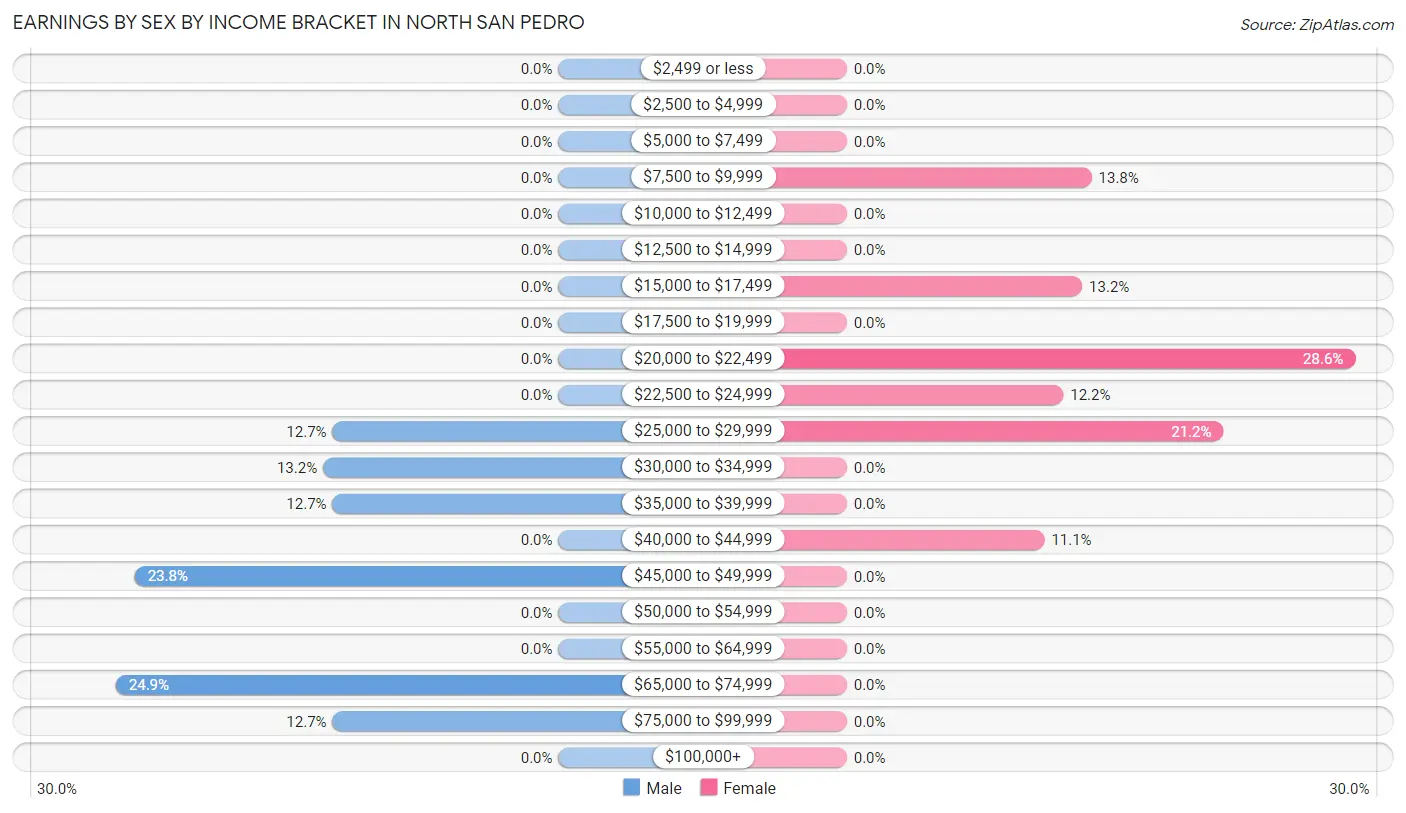
Earnings by Sex by Income Bracket in North San Pedro
The most common earnings brackets in North San Pedro are $65,000 to $74,999 for men (47 | 24.9%) and $20,000 to $22,499 for women (54 | 28.6%).
| Income | Male | Female |
| $2,499 or less | 0 (0.0%) | 0 (0.0%) |
| $2,500 to $4,999 | 0 (0.0%) | 0 (0.0%) |
| $5,000 to $7,499 | 0 (0.0%) | 0 (0.0%) |
| $7,500 to $9,999 | 0 (0.0%) | 26 (13.8%) |
| $10,000 to $12,499 | 0 (0.0%) | 0 (0.0%) |
| $12,500 to $14,999 | 0 (0.0%) | 0 (0.0%) |
| $15,000 to $17,499 | 0 (0.0%) | 25 (13.2%) |
| $17,500 to $19,999 | 0 (0.0%) | 0 (0.0%) |
| $20,000 to $22,499 | 0 (0.0%) | 54 (28.6%) |
| $22,500 to $24,999 | 0 (0.0%) | 23 (12.2%) |
| $25,000 to $29,999 | 24 (12.7%) | 40 (21.2%) |
| $30,000 to $34,999 | 25 (13.2%) | 0 (0.0%) |
| $35,000 to $39,999 | 24 (12.7%) | 0 (0.0%) |
| $40,000 to $44,999 | 0 (0.0%) | 21 (11.1%) |
| $45,000 to $49,999 | 45 (23.8%) | 0 (0.0%) |
| $50,000 to $54,999 | 0 (0.0%) | 0 (0.0%) |
| $55,000 to $64,999 | 0 (0.0%) | 0 (0.0%) |
| $65,000 to $74,999 | 47 (24.9%) | 0 (0.0%) |
| $75,000 to $99,999 | 24 (12.7%) | 0 (0.0%) |
| $100,000+ | 0 (0.0%) | 0 (0.0%) |
| Total | 189 (100.0%) | 189 (100.0%) |
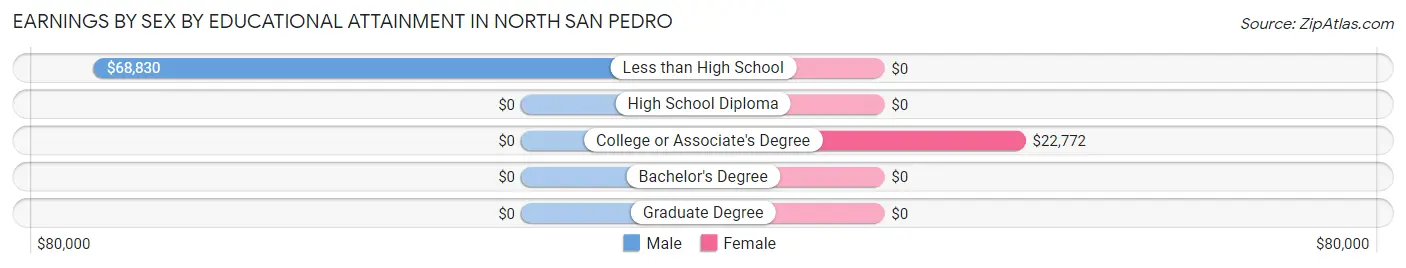
Earnings by Sex by Educational Attainment in North San Pedro
Average earnings in North San Pedro are $68,830 for men and $22,014 for women, a difference of 68.0%. Men with an educational attainment of less than high school enjoy the highest average annual earnings of $68,830, while those with less than high school education earn the least with $68,830. Women with an educational attainment of college or associate's degree earn the most with the average annual earnings of $22,772, while those with college or associate's degree education have the smallest earnings of $22,772.
| Educational Attainment | Male Income | Female Income |
| Less than High School | $68,830 | $0 |
| High School Diploma | - | - |
| College or Associate's Degree | - | - |
| Bachelor's Degree | - | - |
| Graduate Degree | - | - |
| Total | $68,830 | $22,014 |
Family Income in North San Pedro
Family Income Brackets in North San Pedro
According to the North San Pedro family income data, there are 61 families falling into the $100,000 to $149,999 income range, which is the most common income bracket and makes up 32.8% of all families.
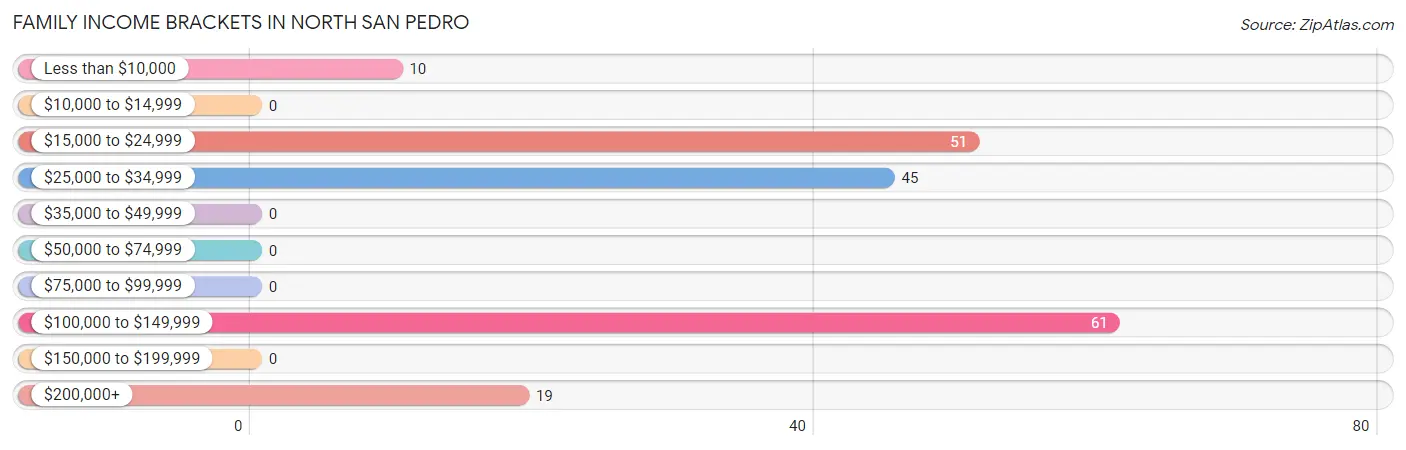
| Income Bracket | # Families | % Families |
| Less than $10,000 | 10 | 5.4% |
| $10,000 to $14,999 | 0 | 0.0% |
| $15,000 to $24,999 | 51 | 27.4% |
| $25,000 to $34,999 | 45 | 24.2% |
| $35,000 to $49,999 | 0 | 0.0% |
| $50,000 to $74,999 | 0 | 0.0% |
| $75,000 to $99,999 | 0 | 0.0% |
| $100,000 to $149,999 | 61 | 32.8% |
| $150,000 to $199,999 | 0 | 0.0% |
| $200,000+ | 19 | 10.2% |
Family Income by Famaliy Size in North San Pedro
| Income Bracket | # Families | Median Income |
| 2-Person Families | 106 (57.0%) | $0 |
| 3-Person Families | 0 (0.0%) | $0 |
| 4-Person Families | 40 (21.5%) | $0 |
| 5-Person Families | 21 (11.3%) | $0 |
| 6-Person Families | 0 (0.0%) | $0 |
| 7+ Person Families | 19 (10.2%) | $0 |
| Total | 186 (100.0%) | $0 |
Family Income by Number of Earners in North San Pedro
| Number of Earners | # Families | Median Income |
| No Earners | 106 (57.0%) | $0 |
| 1 Earner | 0 (0.0%) | $0 |
| 2 Earners | 40 (21.5%) | $0 |
| 3+ Earners | 40 (21.5%) | $0 |
| Total | 186 (100.0%) | $0 |
Household Income in North San Pedro
Household Income Brackets in North San Pedro
With 61 households falling in the category, the $100,000 to $149,999 income range is the most frequent in North San Pedro, accounting for 26.2% of all households.
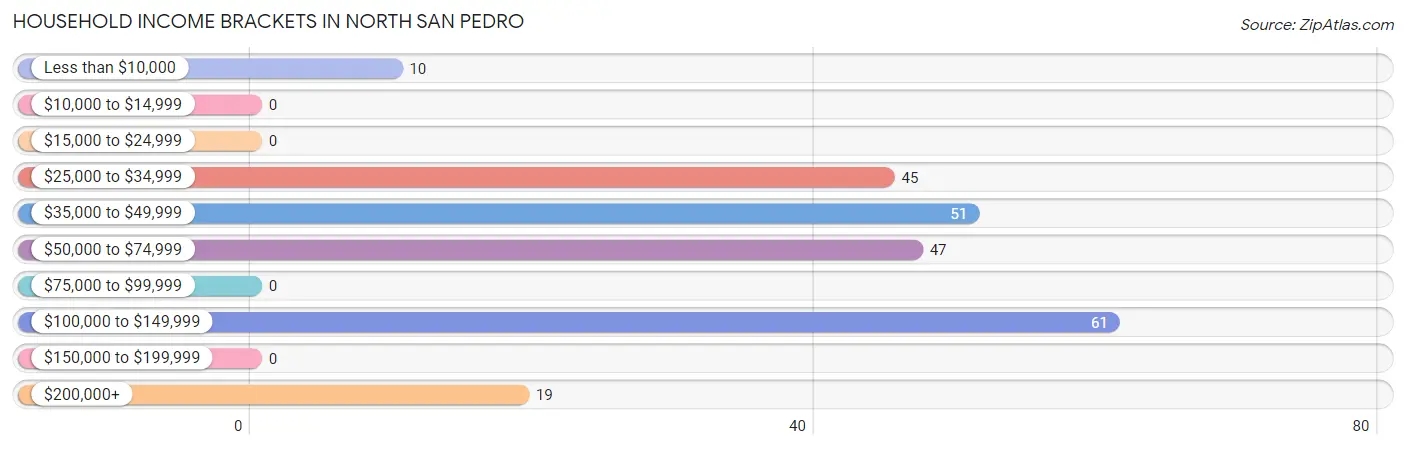
| Income Bracket | # Households | % Households |
| Less than $10,000 | 10 | 4.3% |
| $10,000 to $14,999 | 0 | 0.0% |
| $15,000 to $24,999 | 0 | 0.0% |
| $25,000 to $34,999 | 45 | 19.3% |
| $35,000 to $49,999 | 51 | 21.9% |
| $50,000 to $74,999 | 47 | 20.2% |
| $75,000 to $99,999 | 0 | 0.0% |
| $100,000 to $149,999 | 61 | 26.2% |
| $150,000 to $199,999 | 0 | 0.0% |
| $200,000+ | 19 | 8.2% |
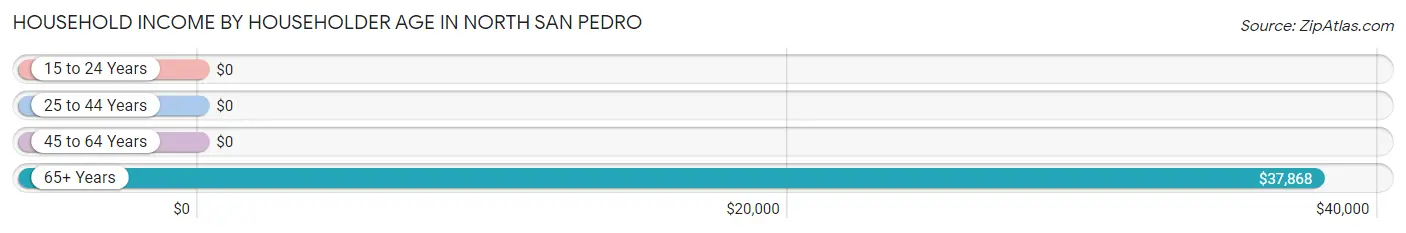
Household Income by Householder Age in North San Pedro
The median household income in North San Pedro is $68,059, with the highest median household income of $37,868 found in the 65+ years age bracket for the primary householder. A total of 125 households (53.6%) fall into this category.
| Income Bracket | # Households | Median Income |
| 15 to 24 Years | 0 (0.0%) | $0 |
| 25 to 44 Years | 40 (17.2%) | $0 |
| 45 to 64 Years | 68 (29.2%) | $0 |
| 65+ Years | 125 (53.6%) | $37,868 |
| Total | 233 (100.0%) | $68,059 |
Poverty in North San Pedro
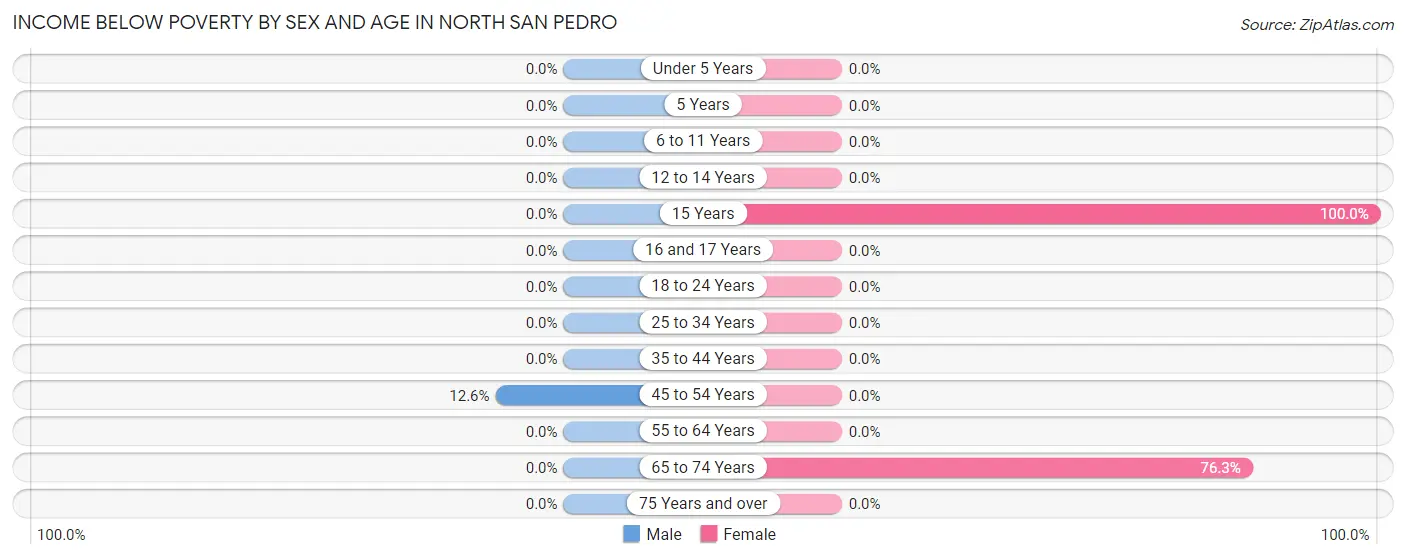
Income Below Poverty by Sex and Age in North San Pedro
With 3.1% poverty level for males and 31.7% for females among the residents of North San Pedro, 45 to 54 year old males and 15 year old females are the most vulnerable to poverty, with 13 males (12.6%) and 66 females (100.0%) in their respective age groups living below the poverty level.
| Age Bracket | Male | Female |
| Under 5 Years | 0 (0.0%) | 0 (0.0%) |
| 5 Years | 0 (0.0%) | 0 (0.0%) |
| 6 to 11 Years | 0 (0.0%) | 0 (0.0%) |
| 12 to 14 Years | 0 (0.0%) | 0 (0.0%) |
| 15 Years | 0 (0.0%) | 66 (100.0%) |
| 16 and 17 Years | 0 (0.0%) | 0 (0.0%) |
| 18 to 24 Years | 0 (0.0%) | 0 (0.0%) |
| 25 to 34 Years | 0 (0.0%) | 0 (0.0%) |
| 35 to 44 Years | 0 (0.0%) | 0 (0.0%) |
| 45 to 54 Years | 13 (12.6%) | 0 (0.0%) |
| 55 to 64 Years | 0 (0.0%) | 0 (0.0%) |
| 65 to 74 Years | 0 (0.0%) | 61 (76.2%) |
| 75 Years and over | 0 (0.0%) | 0 (0.0%) |
| Total | 13 (3.1%) | 127 (31.7%) |
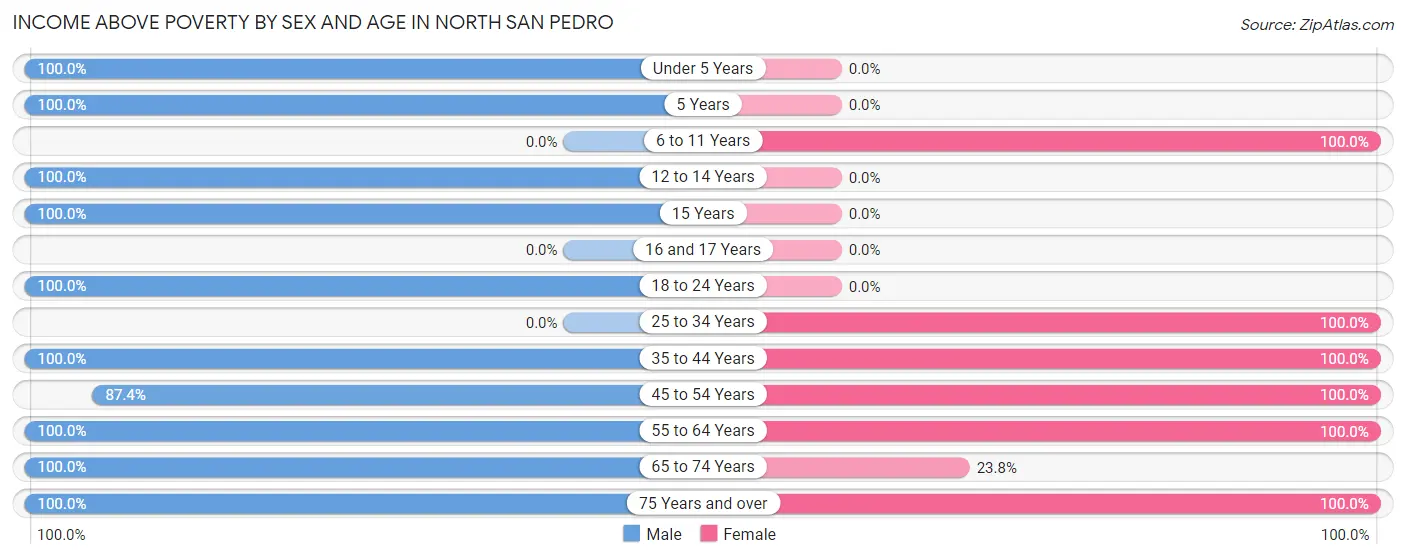
Income Above Poverty by Sex and Age in North San Pedro
According to the poverty statistics in North San Pedro, males aged under 5 years and females aged 6 to 11 years are the age groups that are most secure financially, with 100.0% of males and 100.0% of females in these age groups living above the poverty line.
| Age Bracket | Male | Female |
| Under 5 Years | 19 (100.0%) | 0 (0.0%) |
| 5 Years | 41 (100.0%) | 0 (0.0%) |
| 6 to 11 Years | 0 (0.0%) | 21 (100.0%) |
| 12 to 14 Years | 21 (100.0%) | 0 (0.0%) |
| 15 Years | 25 (100.0%) | 0 (0.0%) |
| 16 and 17 Years | 0 (0.0%) | 0 (0.0%) |
| 18 to 24 Years | 97 (100.0%) | 0 (0.0%) |
| 25 to 34 Years | 0 (0.0%) | 40 (100.0%) |
| 35 to 44 Years | 24 (100.0%) | 51 (100.0%) |
| 45 to 54 Years | 90 (87.4%) | 44 (100.0%) |
| 55 to 64 Years | 24 (100.0%) | 54 (100.0%) |
| 65 to 74 Years | 19 (100.0%) | 19 (23.7%) |
| 75 Years and over | 50 (100.0%) | 45 (100.0%) |
| Total | 410 (96.9%) | 274 (68.3%) |
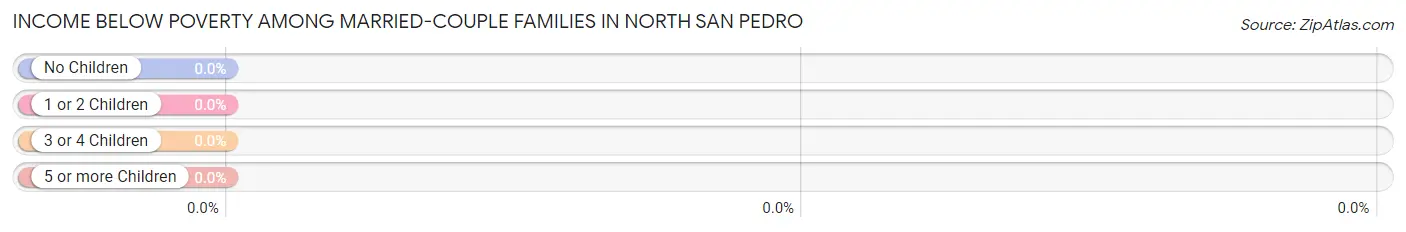
Income Below Poverty Among Married-Couple Families in North San Pedro
| Children | Above Poverty | Below Poverty |
| No Children | 66 (100.0%) | 0 (0.0%) |
| 1 or 2 Children | 40 (100.0%) | 0 (0.0%) |
| 3 or 4 Children | 19 (100.0%) | 0 (0.0%) |
| 5 or more Children | 0 (0.0%) | 0 (0.0%) |
| Total | 125 (100.0%) | 0 (0.0%) |
Income Below Poverty Among Single-Parent Households in North San Pedro
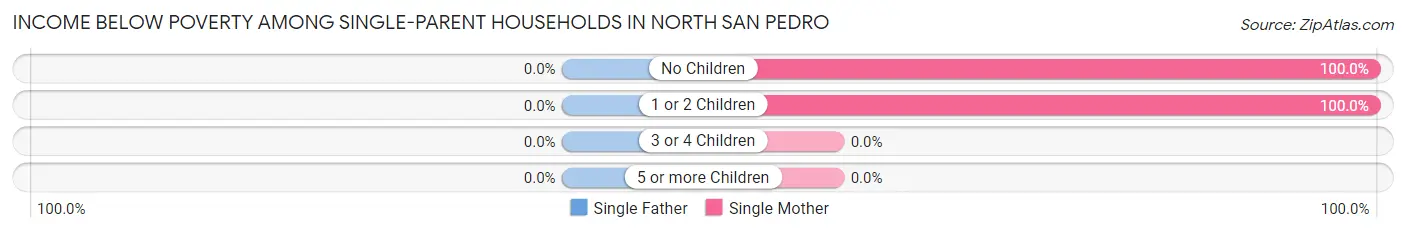
| Children | Single Father | Single Mother |
| No Children | 0 (0.0%) | 10 (100.0%) |
| 1 or 2 Children | 0 (0.0%) | 51 (100.0%) |
| 3 or 4 Children | 0 (0.0%) | 0 (0.0%) |
| 5 or more Children | 0 (0.0%) | 0 (0.0%) |
| Total | 0 (0.0%) | 61 (100.0%) |
Income Below Poverty Among Married-Couple vs Single-Parent Households in North San Pedro
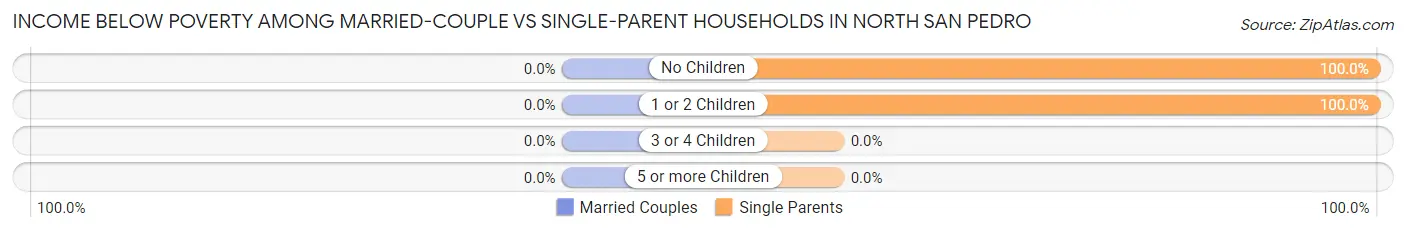
| Children | Married-Couple Families | Single-Parent Households |
| No Children | 0 (0.0%) | 10 (100.0%) |
| 1 or 2 Children | 0 (0.0%) | 51 (100.0%) |
| 3 or 4 Children | 0 (0.0%) | 0 (0.0%) |
| 5 or more Children | 0 (0.0%) | 0 (0.0%) |
| Total | 0 (0.0%) | 61 (100.0%) |
Race in North San Pedro
The most populous races in North San Pedro are White / Caucasian (706 | 85.7%), Hispanic or Latino (704 | 85.4%), and Two or more Races (95 | 11.5%).
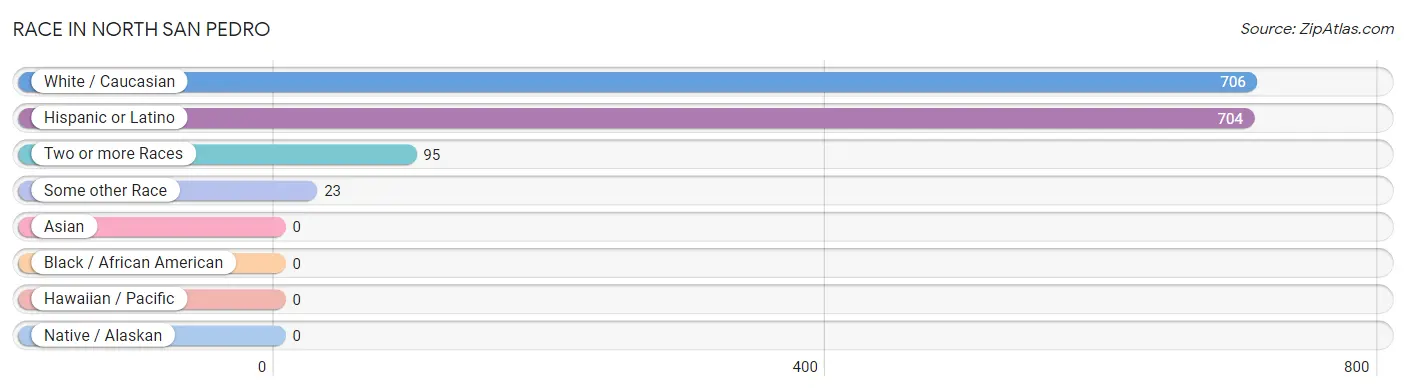
| Race | # Population | % Population |
| Asian | 0 | 0.0% |
| Black / African American | 0 | 0.0% |
| Hawaiian / Pacific | 0 | 0.0% |
| Hispanic or Latino | 704 | 85.4% |
| Native / Alaskan | 0 | 0.0% |
| White / Caucasian | 706 | 85.7% |
| Two or more Races | 95 | 11.5% |
| Some other Race | 23 | 2.8% |
| Total | 824 | 100.0% |
Ancestry in North San Pedro
The most populous ancestries reported in North San Pedro are Mexican (269 | 32.7%), Irish (171 | 20.7%), and Spaniard (51 | 6.2%), together accounting for 59.6% of all North San Pedro residents.
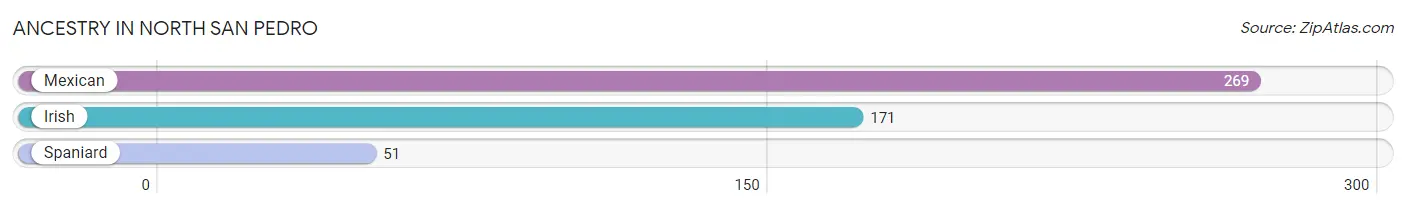
| Ancestry | # Population | % Population |
| Irish | 171 | 20.7% |
| Mexican | 269 | 32.7% |
| Spaniard | 51 | 6.2% | View All 3 Rows |
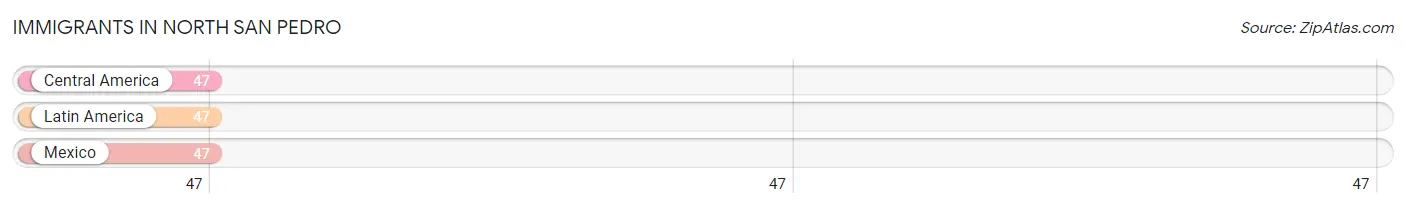
Immigrants in North San Pedro
The most numerous immigrant groups reported in North San Pedro came from Central America (47 | 5.7%), Latin America (47 | 5.7%), and Mexico (47 | 5.7%), together accounting for 17.1% of all North San Pedro residents.
| Immigration Origin | # Population | % Population |
| Central America | 47 | 5.7% |
| Latin America | 47 | 5.7% |
| Mexico | 47 | 5.7% | View All 3 Rows |
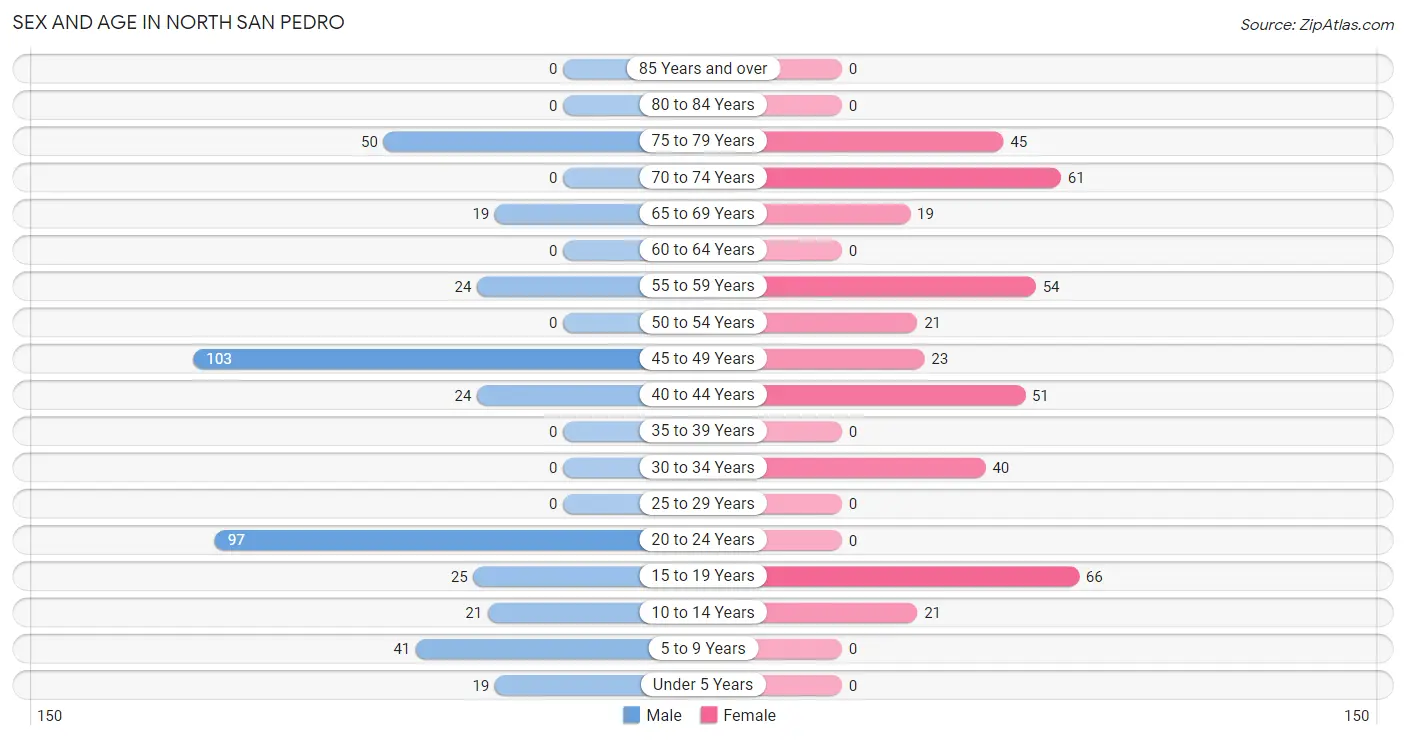
Sex and Age in North San Pedro
Sex and Age in North San Pedro
The most populous age groups in North San Pedro are 45 to 49 Years (103 | 24.3%) for men and 15 to 19 Years (66 | 16.5%) for women.
| Age Bracket | Male | Female |
| Under 5 Years | 19 (4.5%) | 0 (0.0%) |
| 5 to 9 Years | 41 (9.7%) | 0 (0.0%) |
| 10 to 14 Years | 21 (5.0%) | 21 (5.2%) |
| 15 to 19 Years | 25 (5.9%) | 66 (16.5%) |
| 20 to 24 Years | 97 (22.9%) | 0 (0.0%) |
| 25 to 29 Years | 0 (0.0%) | 0 (0.0%) |
| 30 to 34 Years | 0 (0.0%) | 40 (10.0%) |
| 35 to 39 Years | 0 (0.0%) | 0 (0.0%) |
| 40 to 44 Years | 24 (5.7%) | 51 (12.7%) |
| 45 to 49 Years | 103 (24.3%) | 23 (5.7%) |
| 50 to 54 Years | 0 (0.0%) | 21 (5.2%) |
| 55 to 59 Years | 24 (5.7%) | 54 (13.5%) |
| 60 to 64 Years | 0 (0.0%) | 0 (0.0%) |
| 65 to 69 Years | 19 (4.5%) | 19 (4.7%) |
| 70 to 74 Years | 0 (0.0%) | 61 (15.2%) |
| 75 to 79 Years | 50 (11.8%) | 45 (11.2%) |
| 80 to 84 Years | 0 (0.0%) | 0 (0.0%) |
| 85 Years and over | 0 (0.0%) | 0 (0.0%) |
| Total | 423 (100.0%) | 401 (100.0%) |
Families and Households in North San Pedro
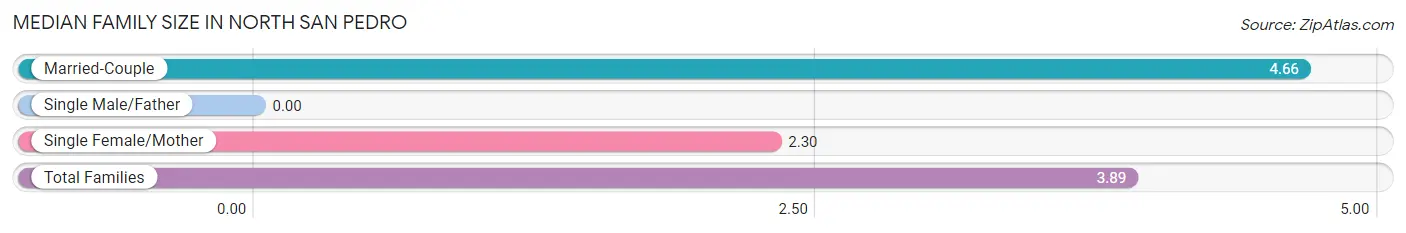
Median Family Size in North San Pedro
| Family Type | # Families | Family Size |
| Married-Couple | 125 (67.2%) | 4.66 |
| Single Male/Father | 0 (0.0%) | - |
| Single Female/Mother | 61 (32.8%) | 2.30 |
| Total Families | 186 (100.0%) | 3.89 |
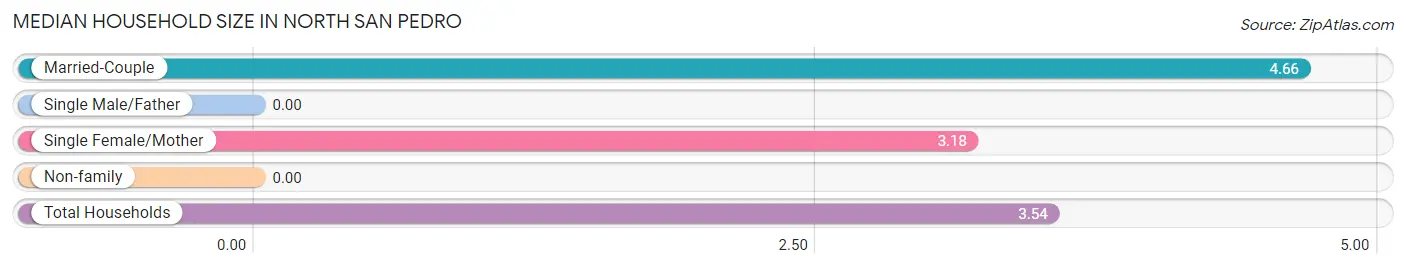
Median Household Size in North San Pedro
| Household Type | # Households | Household Size |
| Married-Couple | 125 (53.6%) | 4.66 |
| Single Male/Father | 0 (0.0%) | - |
| Single Female/Mother | 61 (26.2%) | 3.18 |
| Non-family | 47 (20.2%) | - |
| Total Households | 233 (100.0%) | 3.54 |
Household Size by Marriage Status in North San Pedro
Out of a total of 233 households in North San Pedro, 186 (79.8%) are family households, while 47 (20.2%) are nonfamily households. The most numerous type of family households are 2-person households, comprising 55, and the most common type of nonfamily households are 1-person households, comprising 47.
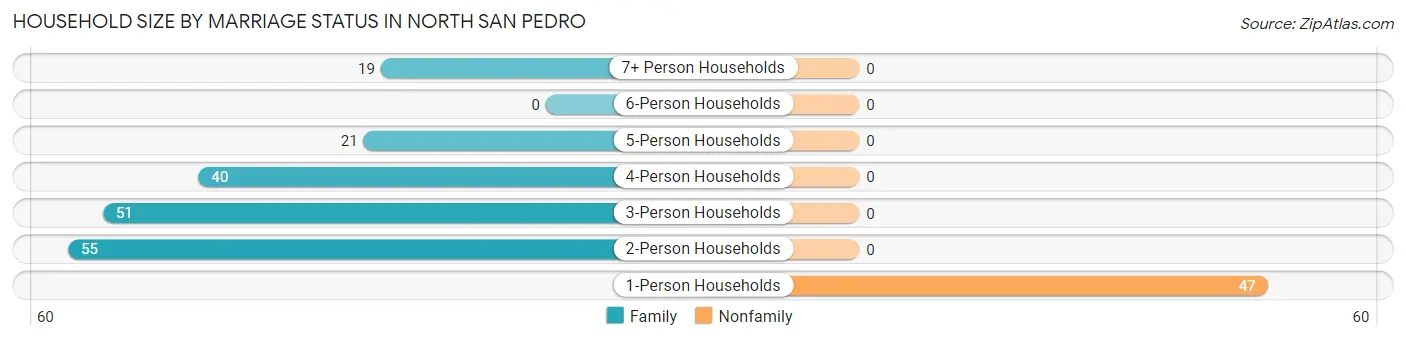
| Household Size | Family Households | Nonfamily Households |
| 1-Person Households | - | 47 (20.2%) |
| 2-Person Households | 55 (23.6%) | 0 (0.0%) |
| 3-Person Households | 51 (21.9%) | 0 (0.0%) |
| 4-Person Households | 40 (17.2%) | 0 (0.0%) |
| 5-Person Households | 21 (9.0%) | 0 (0.0%) |
| 6-Person Households | 0 (0.0%) | 0 (0.0%) |
| 7+ Person Households | 19 (8.2%) | 0 (0.0%) |
| Total | 186 (79.8%) | 47 (20.2%) |
Female Fertility in North San Pedro
Fertility by Age in North San Pedro
| Age Bracket | Women with Births | Births / 1,000 Women |
| 15 to 19 years | 0 (0.0%) | 0.0 |
| 20 to 34 years | 0 (0.0%) | 0.0 |
| 35 to 50 years | 0 (0.0%) | 0.0 |
| Total | 0 (0.0%) | 0.0 |
Fertility by Age by Marriage Status in North San Pedro
| Age Bracket | Married | Unmarried |
| 15 to 19 years | 0 (0.0%) | 0 (0.0%) |
| 20 to 34 years | 0 (0.0%) | 0 (0.0%) |
| 35 to 50 years | 0 (0.0%) | 0 (0.0%) |
| Total | 0 (0.0%) | 0 (0.0%) |
Fertility by Education in North San Pedro
| Educational Attainment | Women with Births | Births / 1,000 Women |
| Less than High School | 0 (0.0%) | 0.0 |
| High School Diploma | 0 (0.0%) | 0.0 |
| College or Associate's Degree | 0 (0.0%) | 0.0 |
| Bachelor's Degree | 0 (0.0%) | 0.0 |
| Graduate Degree | 0 (0.0%) | 0.0 |
| Total | 0 (0.0%) | 0.0 |
Fertility by Education by Marriage Status in North San Pedro
| Educational Attainment | Married | Unmarried |
| Less than High School | 0 (0.0%) | 0 (0.0%) |
| High School Diploma | 0 (0.0%) | 0 (0.0%) |
| College or Associate's Degree | 0 (0.0%) | 0 (0.0%) |
| Bachelor's Degree | 0 (0.0%) | 0 (0.0%) |
| Graduate Degree | 0 (0.0%) | 0 (0.0%) |
| Total | 0 (0.0%) | 0 (0.0%) |
Employment Characteristics in North San Pedro
Employment by Class of Employer in North San Pedro
Among the 324 employed individuals in North San Pedro, , and private company employees (324 | 100.0%) make up the most common classes of employment.
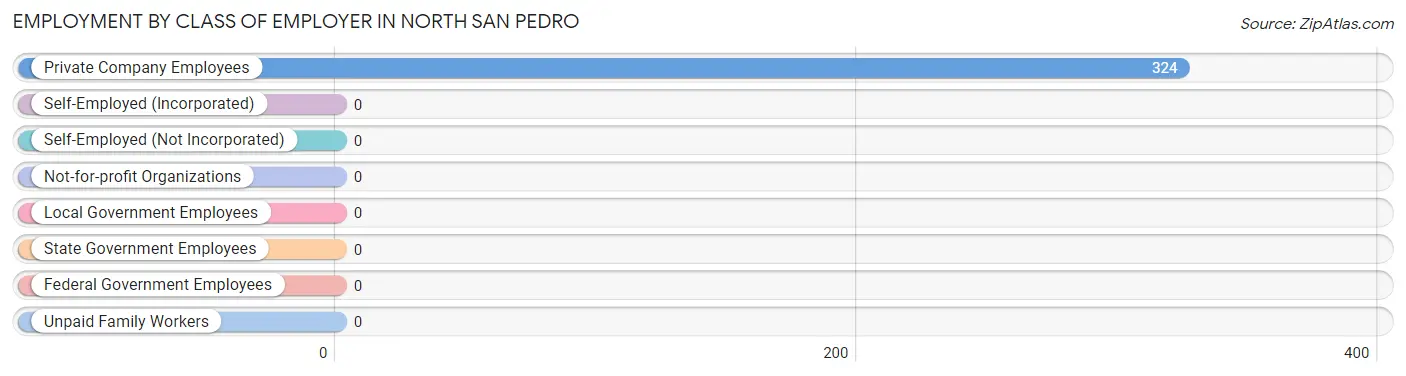
| Employer Class | # Employees | % Employees |
| Private Company Employees | 324 | 100.0% |
| Self-Employed (Incorporated) | 0 | 0.0% |
| Self-Employed (Not Incorporated) | 0 | 0.0% |
| Not-for-profit Organizations | 0 | 0.0% |
| Local Government Employees | 0 | 0.0% |
| State Government Employees | 0 | 0.0% |
| Federal Government Employees | 0 | 0.0% |
| Unpaid Family Workers | 0 | 0.0% |
| Total | 324 | 100.0% |
Employment Status by Age in North San Pedro
According to the labor force statistics for North San Pedro, out of the total population over 16 years of age (631), 59.9% or 378 individuals are in the labor force, with 14.3% or 54 of them unemployed. The age group with the highest labor force participation rate is 20 to 24 years, with 100.0% or 97 individuals in the labor force. Within the labor force, the 55 to 59 years age range has the highest percentage of unemployed individuals, with 100.0% or 54 of them being unemployed.
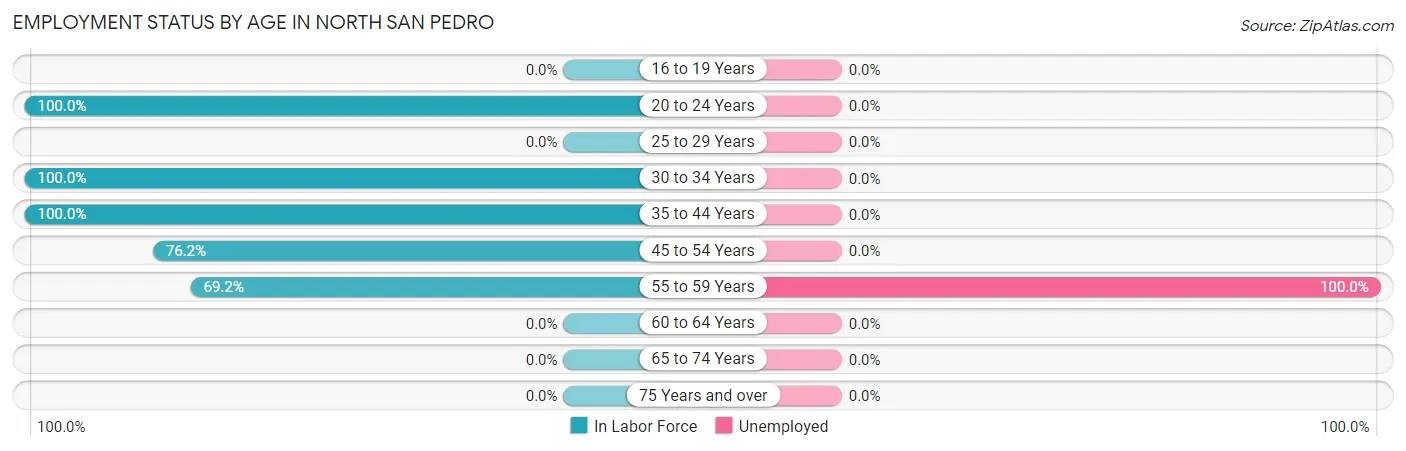
| Age Bracket | In Labor Force | Unemployed |
| 16 to 19 Years | 0 (0.0%) | 0 (0.0%) |
| 20 to 24 Years | 97 (100.0%) | 0 (0.0%) |
| 25 to 29 Years | 0 (0.0%) | 0 (0.0%) |
| 30 to 34 Years | 40 (100.0%) | 0 (0.0%) |
| 35 to 44 Years | 75 (100.0%) | 0 (0.0%) |
| 45 to 54 Years | 112 (76.2%) | 0 (0.0%) |
| 55 to 59 Years | 54 (69.2%) | 54 (100.0%) |
| 60 to 64 Years | 0 (0.0%) | 0 (0.0%) |
| 65 to 74 Years | 0 (0.0%) | 0 (0.0%) |
| 75 Years and over | 0 (0.0%) | 0 (0.0%) |
| Total | 378 (59.9%) | 54 (14.3%) |
Employment Status by Educational Attainment in North San Pedro
According to labor force statistics for North San Pedro, 82.6% of individuals (281) out of the total population between 25 and 64 years of age (340) are in the labor force, with 19.2% or 54 of them being unemployed. The group with the highest labor force participation rate are those with the educational attainment of college / associate degree, with 100.0% or 163 individuals in the labor force. Within the labor force, individuals with college / associate degree education have the highest percentage of unemployment, with 33.1% or 54 of them being unemployed.
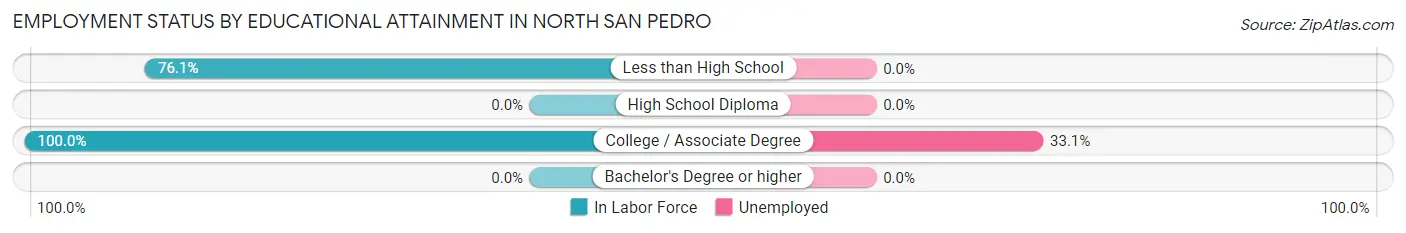
| Educational Attainment | In Labor Force | Unemployed |
| Less than High School | 118 (76.1%) | 0 (0.0%) |
| High School Diploma | 0 (0.0%) | 0 (0.0%) |
| College / Associate Degree | 163 (100.0%) | 54 (33.1%) |
| Bachelor's Degree or higher | 0 (0.0%) | 0 (0.0%) |
| Total | 281 (82.6%) | 65 (19.2%) |
Employment Occupations by Sex in North San Pedro
Management, Business, Science and Arts Occupations
The most common Management, Business, Science and Arts occupations in North San Pedro are , and Management (21 | 6.5%).
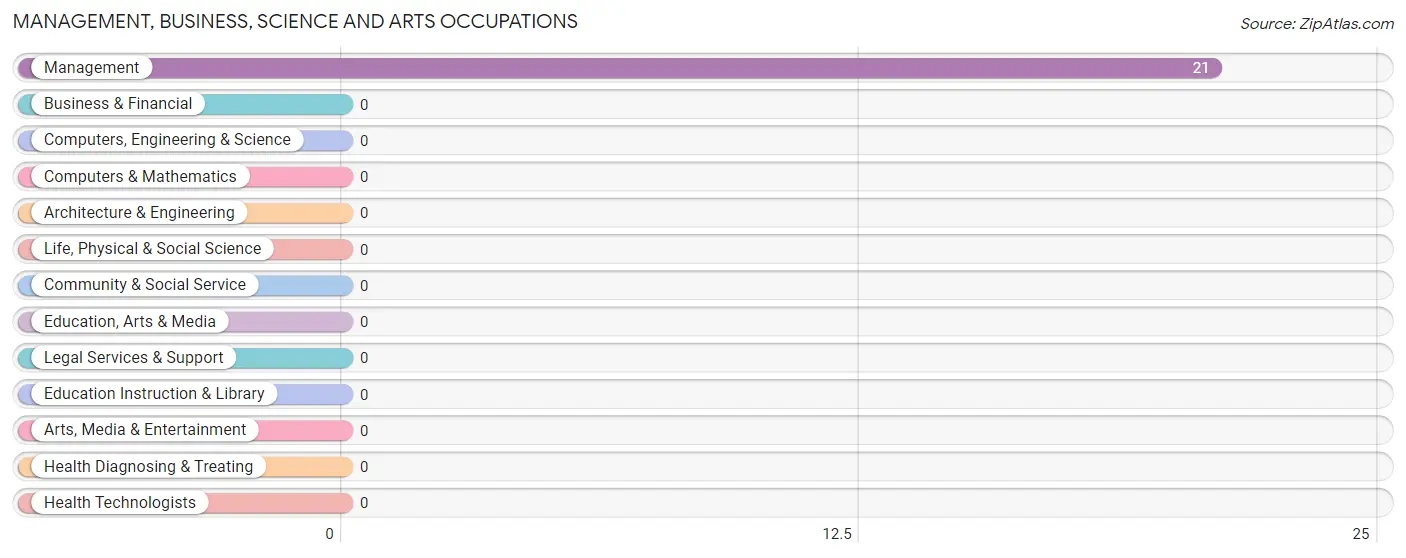
Management, Business, Science and Arts Occupations by Sex
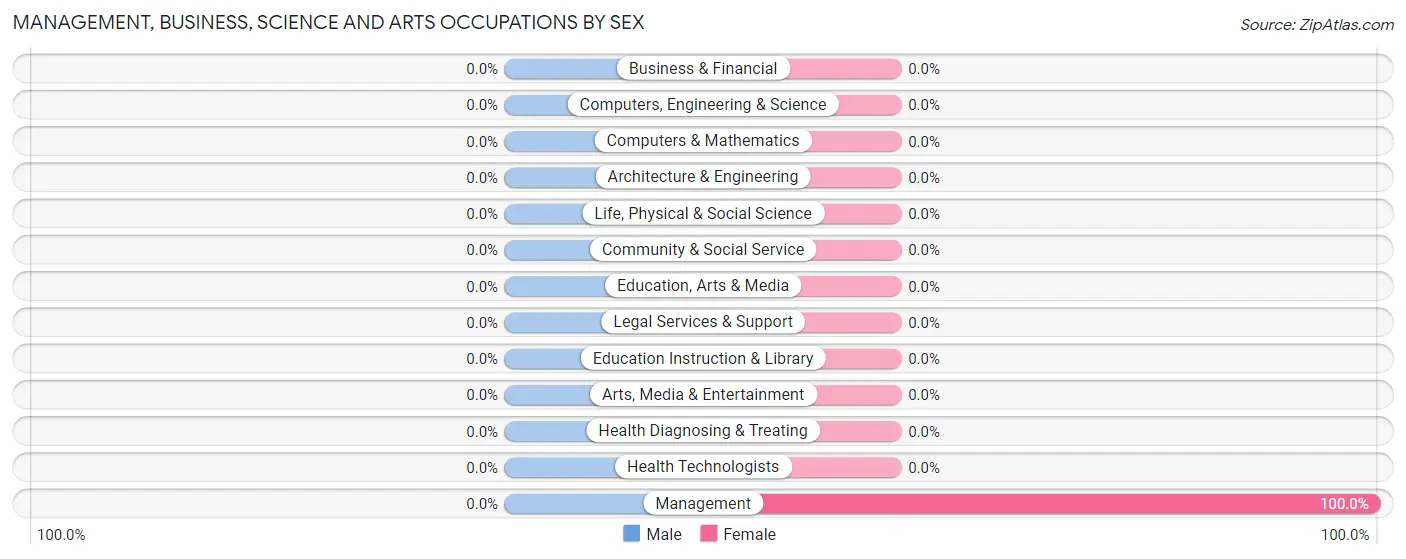
| Occupation | Male | Female |
| Management | 0 (0.0%) | 21 (100.0%) |
| Business & Financial | 0 (0.0%) | 0 (0.0%) |
| Computers, Engineering & Science | 0 (0.0%) | 0 (0.0%) |
| Computers & Mathematics | 0 (0.0%) | 0 (0.0%) |
| Architecture & Engineering | 0 (0.0%) | 0 (0.0%) |
| Life, Physical & Social Science | 0 (0.0%) | 0 (0.0%) |
| Community & Social Service | 0 (0.0%) | 0 (0.0%) |
| Education, Arts & Media | 0 (0.0%) | 0 (0.0%) |
| Legal Services & Support | 0 (0.0%) | 0 (0.0%) |
| Education Instruction & Library | 0 (0.0%) | 0 (0.0%) |
| Arts, Media & Entertainment | 0 (0.0%) | 0 (0.0%) |
| Health Diagnosing & Treating | 0 (0.0%) | 0 (0.0%) |
| Health Technologists | 0 (0.0%) | 0 (0.0%) |
| Total (Category) | 0 (0.0%) | 21 (100.0%) |
| Total (Overall) | 189 (58.3%) | 135 (41.7%) |
Services Occupations
The most common Services occupations in North San Pedro are , and Healthcare Support (26 | 8.0%).
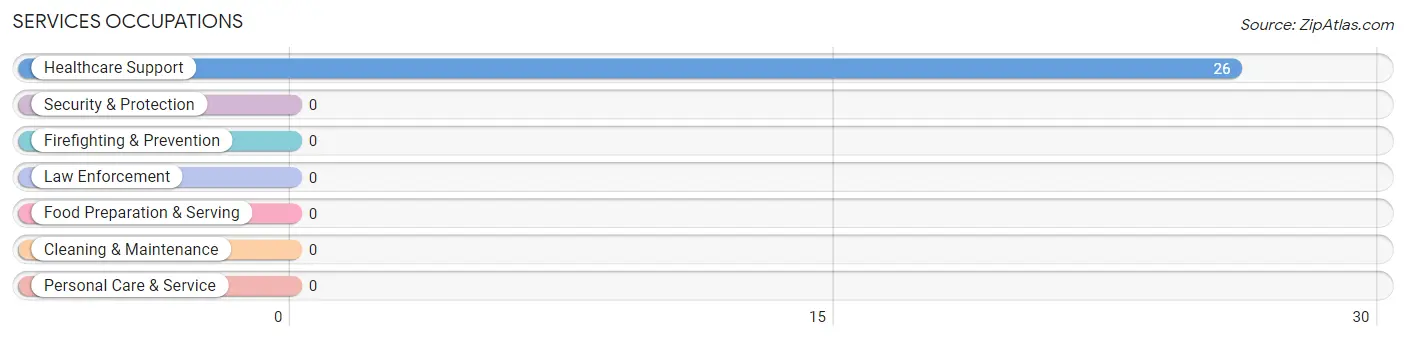
Services Occupations by Sex
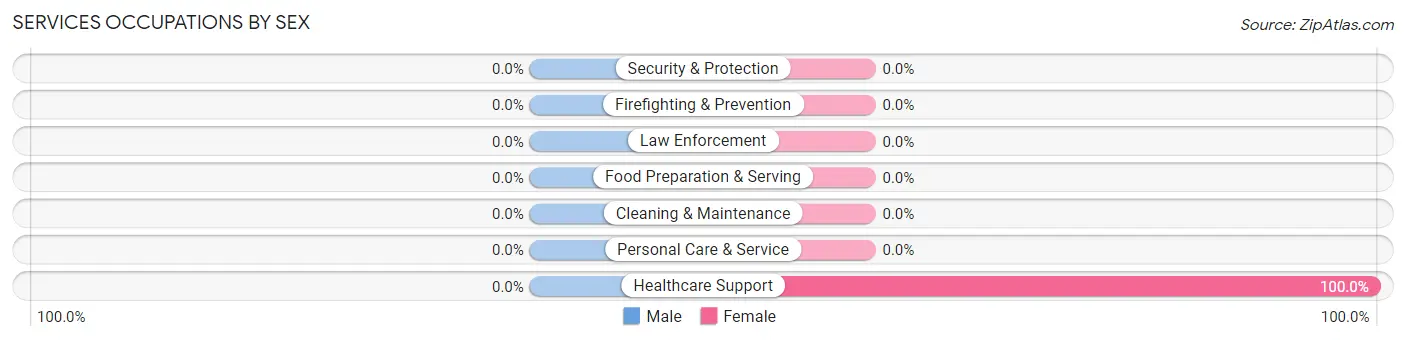
| Occupation | Male | Female |
| Healthcare Support | 0 (0.0%) | 26 (100.0%) |
| Security & Protection | 0 (0.0%) | 0 (0.0%) |
| Firefighting & Prevention | 0 (0.0%) | 0 (0.0%) |
| Law Enforcement | 0 (0.0%) | 0 (0.0%) |
| Food Preparation & Serving | 0 (0.0%) | 0 (0.0%) |
| Cleaning & Maintenance | 0 (0.0%) | 0 (0.0%) |
| Personal Care & Service | 0 (0.0%) | 0 (0.0%) |
| Total (Category) | 0 (0.0%) | 26 (100.0%) |
| Total (Overall) | 189 (58.3%) | 135 (41.7%) |
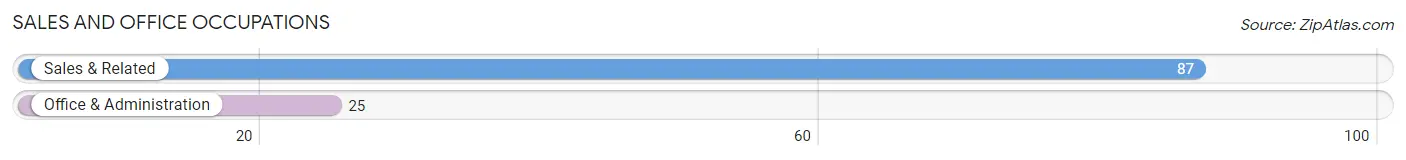
Sales and Office Occupations
The most common Sales and Office occupations in North San Pedro are Sales & Related (87 | 26.9%), and Office & Administration (25 | 7.7%).
Sales and Office Occupations by Sex
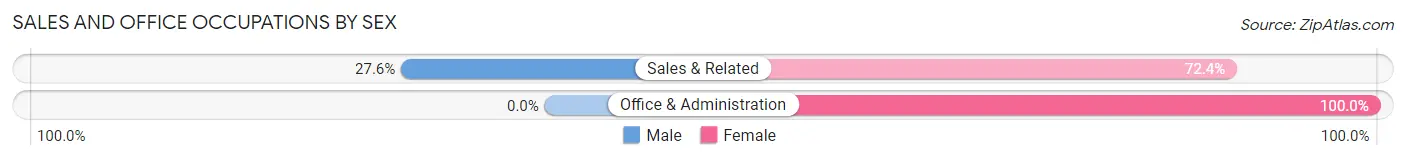
| Occupation | Male | Female |
| Sales & Related | 24 (27.6%) | 63 (72.4%) |
| Office & Administration | 0 (0.0%) | 25 (100.0%) |
| Total (Category) | 24 (21.4%) | 88 (78.6%) |
| Total (Overall) | 189 (58.3%) | 135 (41.7%) |
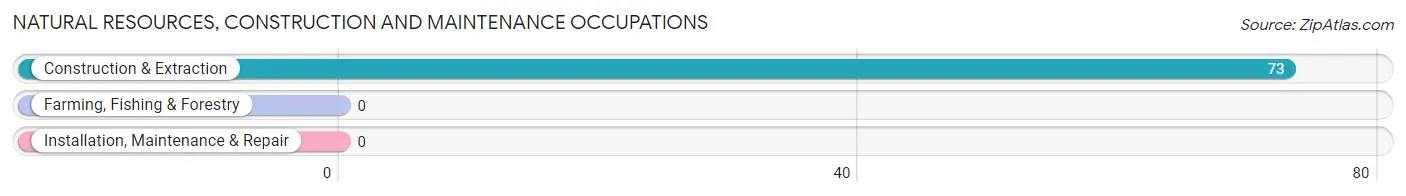
Natural Resources, Construction and Maintenance Occupations
The most common Natural Resources, Construction and Maintenance occupations in North San Pedro are , and Construction & Extraction (73 | 22.5%).
Natural Resources, Construction and Maintenance Occupations by Sex
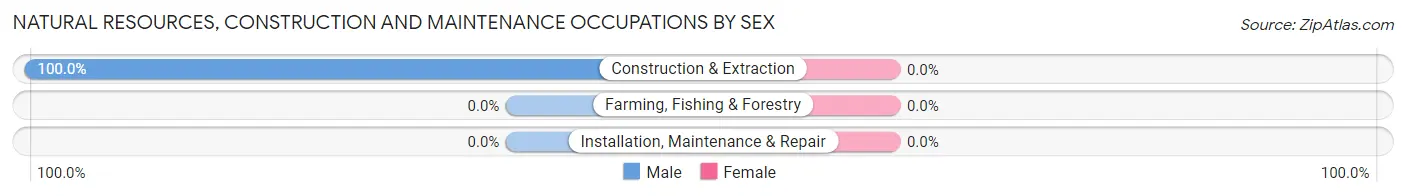
| Occupation | Male | Female |
| Farming, Fishing & Forestry | 0 (0.0%) | 0 (0.0%) |
| Construction & Extraction | 73 (100.0%) | 0 (0.0%) |
| Installation, Maintenance & Repair | 0 (0.0%) | 0 (0.0%) |
| Total (Category) | 73 (100.0%) | 0 (0.0%) |
| Total (Overall) | 189 (58.3%) | 135 (41.7%) |
Production, Transportation and Moving Occupations
The most common Production, Transportation and Moving occupations in North San Pedro are Material Moving (71 | 21.9%), and Transportation (21 | 6.5%).
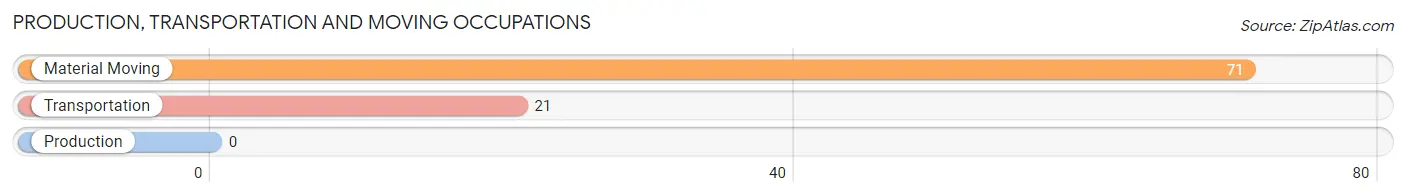
Production, Transportation and Moving Occupations by Sex
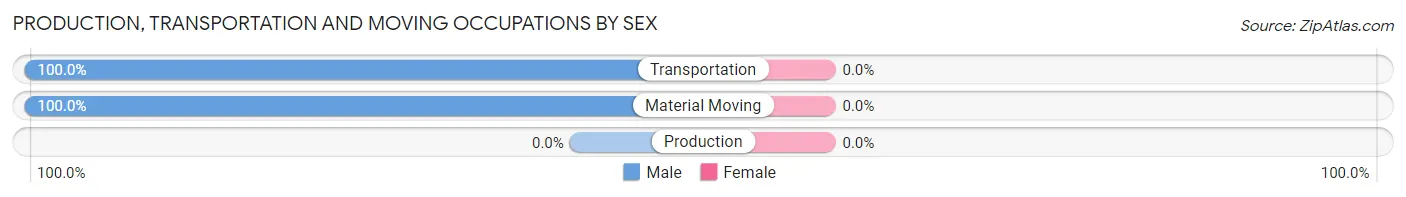
| Occupation | Male | Female |
| Production | 0 (0.0%) | 0 (0.0%) |
| Transportation | 21 (100.0%) | 0 (0.0%) |
| Material Moving | 71 (100.0%) | 0 (0.0%) |
| Total (Category) | 92 (100.0%) | 0 (0.0%) |
| Total (Overall) | 189 (58.3%) | 135 (41.7%) |
Employment Industries by Sex in North San Pedro
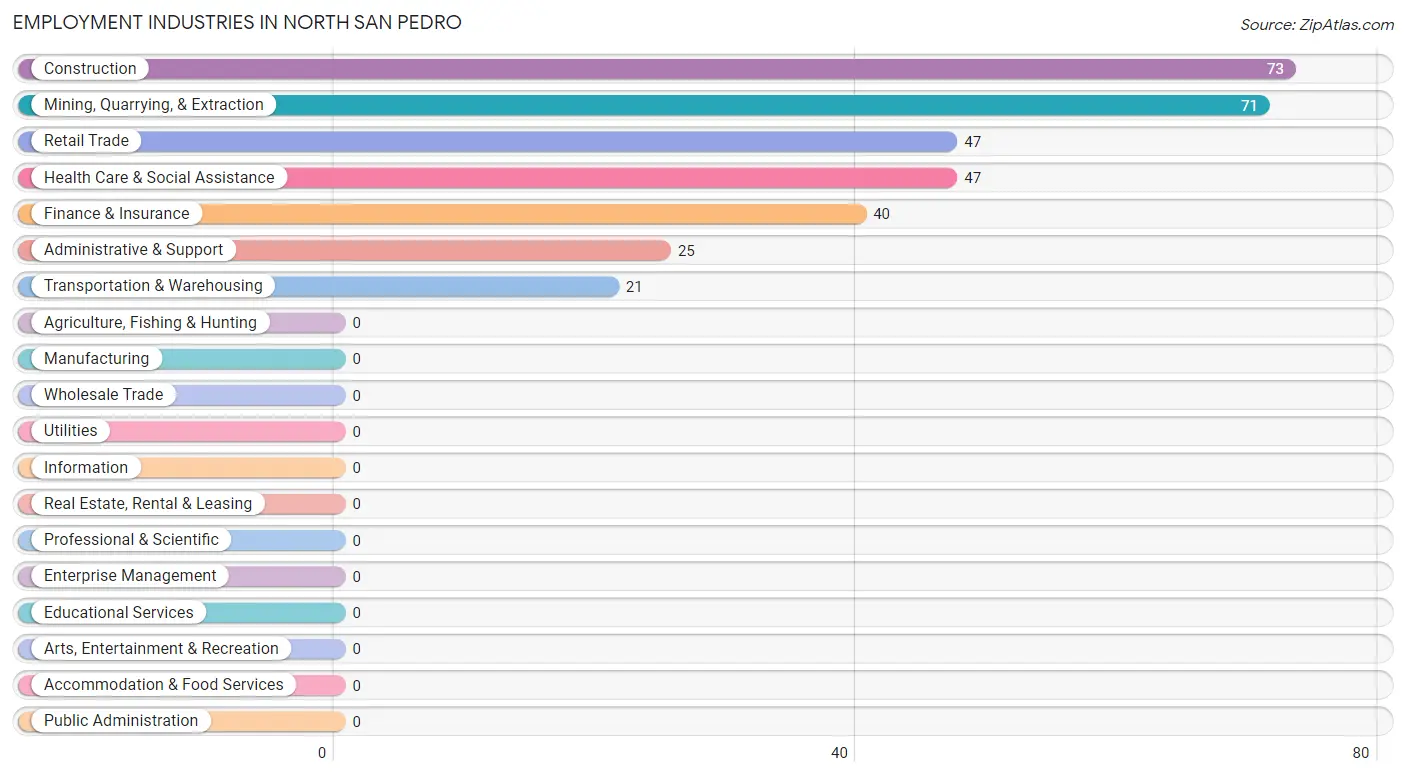
Employment Industries in North San Pedro
The major employment industries in North San Pedro include Construction (73 | 22.5%), Mining, Quarrying, & Extraction (71 | 21.9%), Retail Trade (47 | 14.5%), Health Care & Social Assistance (47 | 14.5%), and Finance & Insurance (40 | 12.3%).
Employment Industries by Sex in North San Pedro
The North San Pedro industries that see more men than women are Mining, Quarrying, & Extraction (100.0%), Construction (100.0%), and Transportation & Warehousing (100.0%), whereas the industries that tend to have a higher number of women are Finance & Insurance (100.0%), Administrative & Support (100.0%), and Health Care & Social Assistance (100.0%).
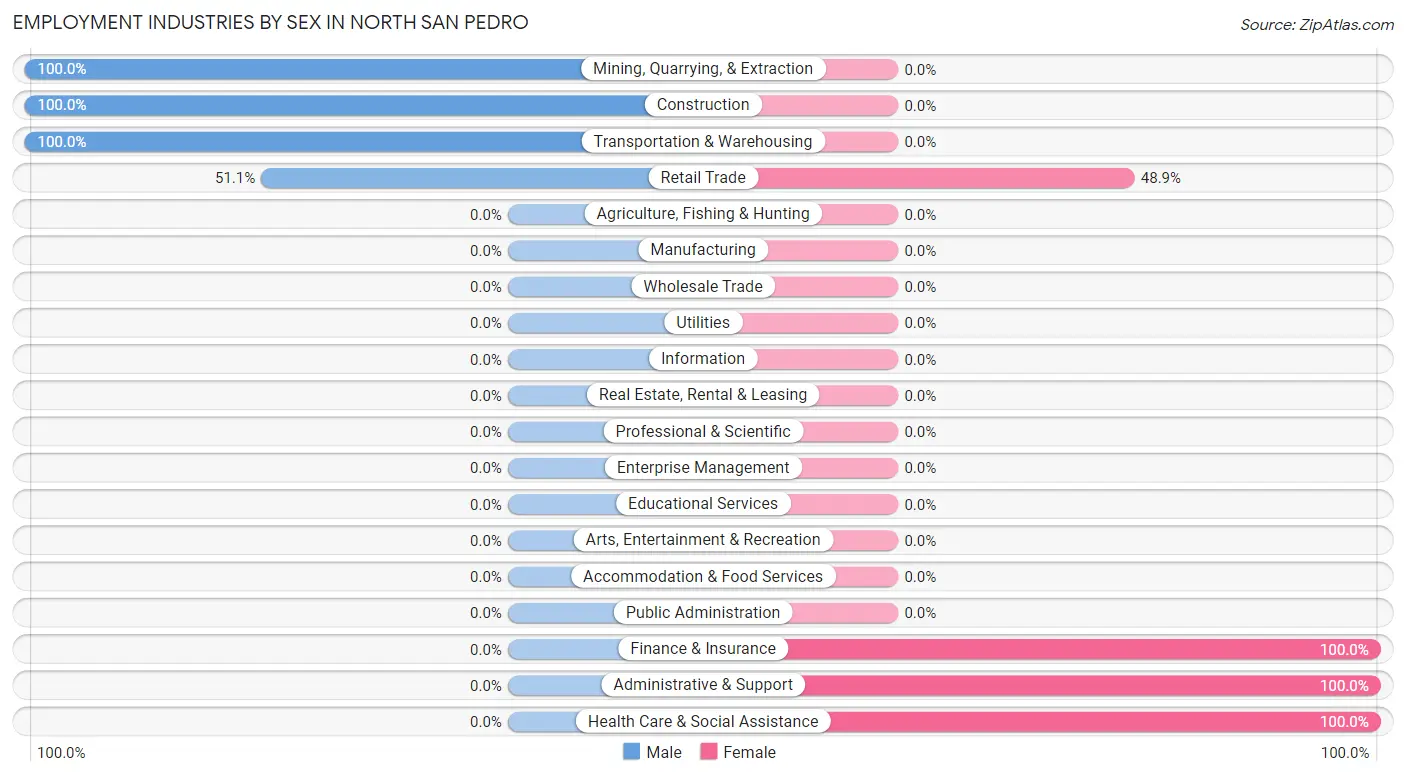
| Industry | Male | Female |
| Agriculture, Fishing & Hunting | 0 (0.0%) | 0 (0.0%) |
| Mining, Quarrying, & Extraction | 71 (100.0%) | 0 (0.0%) |
| Construction | 73 (100.0%) | 0 (0.0%) |
| Manufacturing | 0 (0.0%) | 0 (0.0%) |
| Wholesale Trade | 0 (0.0%) | 0 (0.0%) |
| Retail Trade | 24 (51.1%) | 23 (48.9%) |
| Transportation & Warehousing | 21 (100.0%) | 0 (0.0%) |
| Utilities | 0 (0.0%) | 0 (0.0%) |
| Information | 0 (0.0%) | 0 (0.0%) |
| Finance & Insurance | 0 (0.0%) | 40 (100.0%) |
| Real Estate, Rental & Leasing | 0 (0.0%) | 0 (0.0%) |
| Professional & Scientific | 0 (0.0%) | 0 (0.0%) |
| Enterprise Management | 0 (0.0%) | 0 (0.0%) |
| Administrative & Support | 0 (0.0%) | 25 (100.0%) |
| Educational Services | 0 (0.0%) | 0 (0.0%) |
| Health Care & Social Assistance | 0 (0.0%) | 47 (100.0%) |
| Arts, Entertainment & Recreation | 0 (0.0%) | 0 (0.0%) |
| Accommodation & Food Services | 0 (0.0%) | 0 (0.0%) |
| Public Administration | 0 (0.0%) | 0 (0.0%) |
| Total | 189 (58.3%) | 135 (41.7%) |
Education in North San Pedro
School Enrollment in North San Pedro
The most common levels of schooling among the 178 students in North San Pedro are middle school (87 | 48.9%), high school (49 | 27.5%), and nursery / preschool (21 | 11.8%).
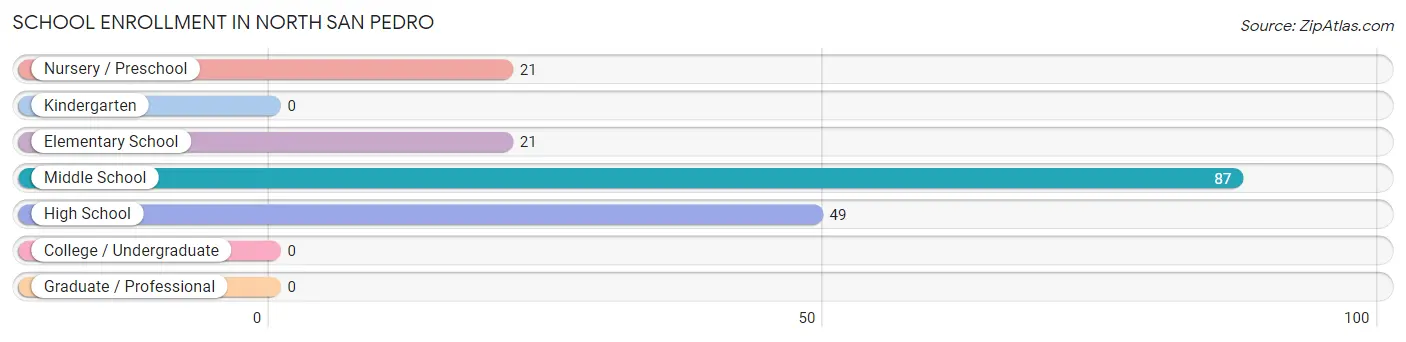
| School Level | # Students | % Students |
| Nursery / Preschool | 21 | 11.8% |
| Kindergarten | 0 | 0.0% |
| Elementary School | 21 | 11.8% |
| Middle School | 87 | 48.9% |
| High School | 49 | 27.5% |
| College / Undergraduate | 0 | 0.0% |
| Graduate / Professional | 0 | 0.0% |
| Total | 178 | 100.0% |
School Enrollment by Age by Funding Source in North San Pedro
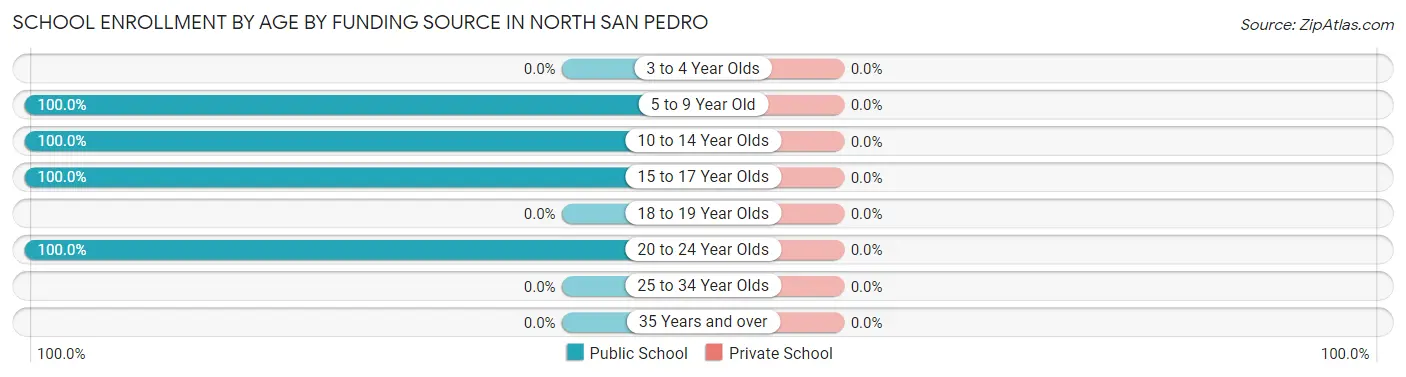
| Age Bracket | Public School | Private School |
| 3 to 4 Year Olds | 0 (0.0%) | 0 (0.0%) |
| 5 to 9 Year Old | 21 (100.0%) | 0 (0.0%) |
| 10 to 14 Year Olds | 42 (100.0%) | 0 (0.0%) |
| 15 to 17 Year Olds | 91 (100.0%) | 0 (0.0%) |
| 18 to 19 Year Olds | 0 (0.0%) | 0 (0.0%) |
| 20 to 24 Year Olds | 24 (100.0%) | 0 (0.0%) |
| 25 to 34 Year Olds | 0 (0.0%) | 0 (0.0%) |
| 35 Years and over | 0 (0.0%) | 0 (0.0%) |
| Total | 178 (100.0%) | 0 (0.0%) |
Educational Attainment by Field of Study in North San Pedro
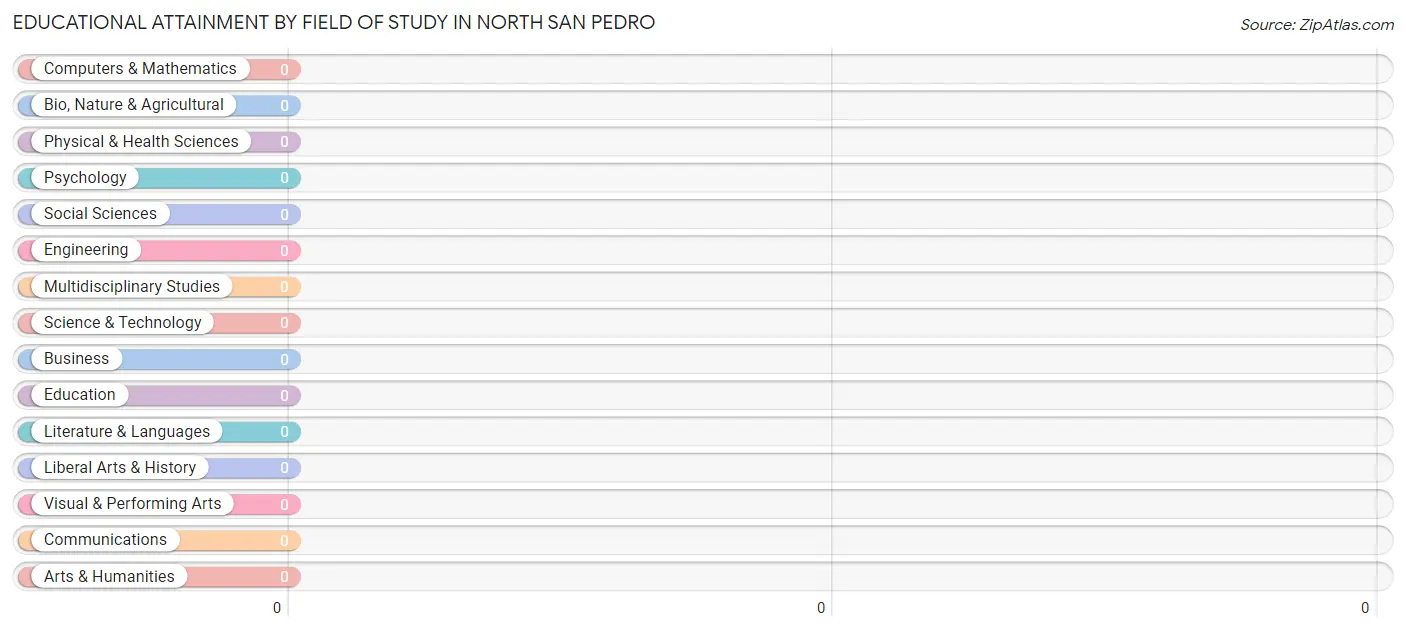
| Field of Study | # Graduates | % Graduates |
| Computers & Mathematics | 0 | 0.0% |
| Bio, Nature & Agricultural | 0 | 0.0% |
| Physical & Health Sciences | 0 | 0.0% |
| Psychology | 0 | 0.0% |
| Social Sciences | 0 | 0.0% |
| Engineering | 0 | 0.0% |
| Multidisciplinary Studies | 0 | 0.0% |
| Science & Technology | 0 | 0.0% |
| Business | 0 | 0.0% |
| Education | 0 | 0.0% |
| Literature & Languages | 0 | 0.0% |
| Liberal Arts & History | 0 | 0.0% |
| Visual & Performing Arts | 0 | 0.0% |
| Communications | 0 | 0.0% |
| Arts & Humanities | 0 | 0.0% |
| Total | 0 | 0.0% |
Transportation & Commute in North San Pedro
Vehicle Availability by Sex in North San Pedro
The most prevalent vehicle ownership categories in North San Pedro are males with 4 vehicles (117, accounting for 61.9%) and females with 4 vehicles (21, making up 86.7%).
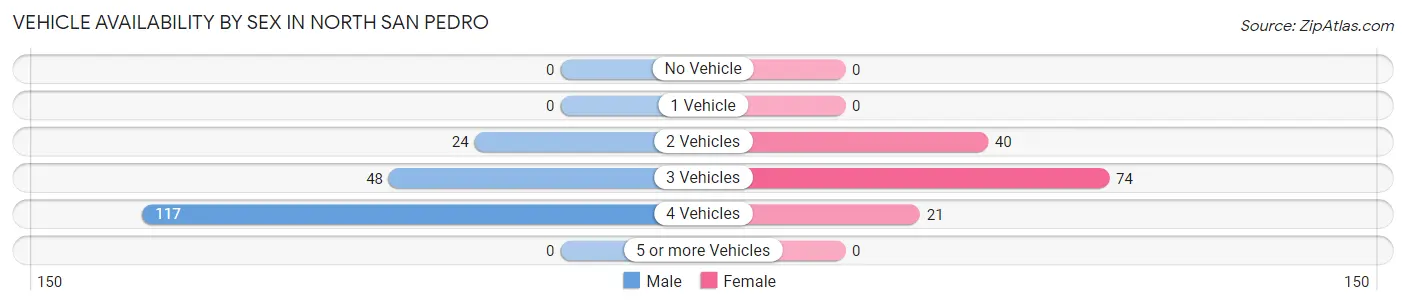
| Vehicles Available | Male | Female |
| No Vehicle | 0 (0.0%) | 0 (0.0%) |
| 1 Vehicle | 0 (0.0%) | 0 (0.0%) |
| 2 Vehicles | 24 (12.7%) | 40 (29.6%) |
| 3 Vehicles | 48 (25.4%) | 74 (54.8%) |
| 4 Vehicles | 117 (61.9%) | 21 (15.6%) |
| 5 or more Vehicles | 0 (0.0%) | 0 (0.0%) |
| Total | 189 (100.0%) | 135 (100.0%) |
Commute Time in North San Pedro
The most frequently occuring commute durations in North San Pedro are 30 to 34 minutes (111 commuters, 34.3%), 10 to 14 minutes (71 commuters, 21.9%), and 15 to 19 minutes (71 commuters, 21.9%).
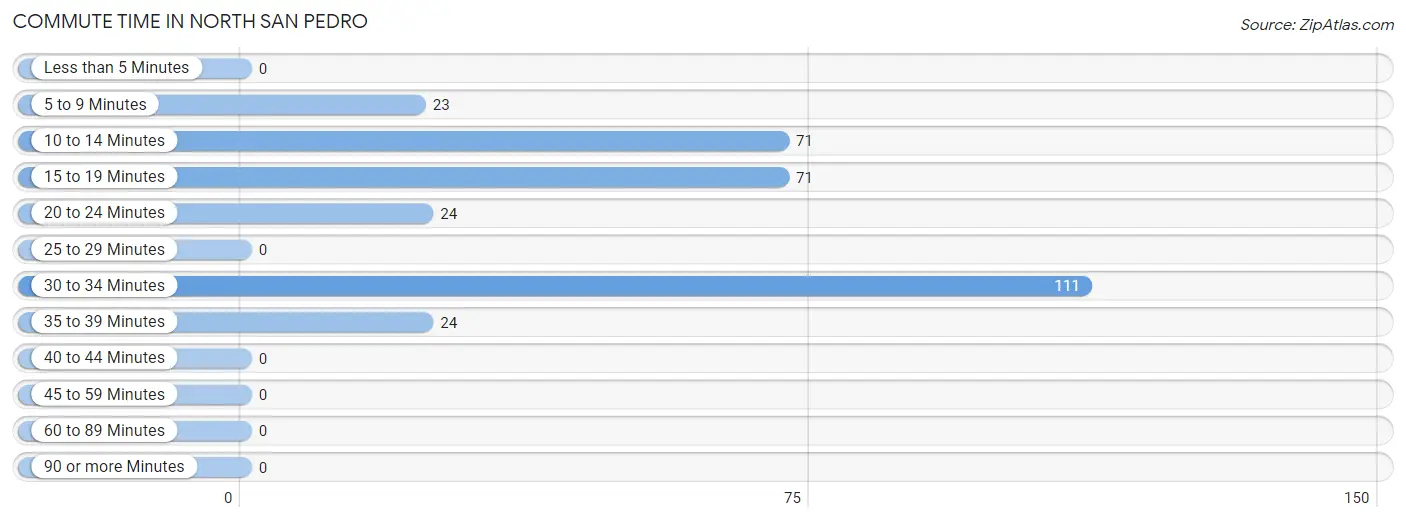
| Commute Time | # Commuters | % Commuters |
| Less than 5 Minutes | 0 | 0.0% |
| 5 to 9 Minutes | 23 | 7.1% |
| 10 to 14 Minutes | 71 | 21.9% |
| 15 to 19 Minutes | 71 | 21.9% |
| 20 to 24 Minutes | 24 | 7.4% |
| 25 to 29 Minutes | 0 | 0.0% |
| 30 to 34 Minutes | 111 | 34.3% |
| 35 to 39 Minutes | 24 | 7.4% |
| 40 to 44 Minutes | 0 | 0.0% |
| 45 to 59 Minutes | 0 | 0.0% |
| 60 to 89 Minutes | 0 | 0.0% |
| 90 or more Minutes | 0 | 0.0% |
Commute Time by Sex in North San Pedro
The most common commute times in North San Pedro are 15 to 19 minutes (71 commuters, 37.6%) for males and 30 to 34 minutes (87 commuters, 64.4%) for females.
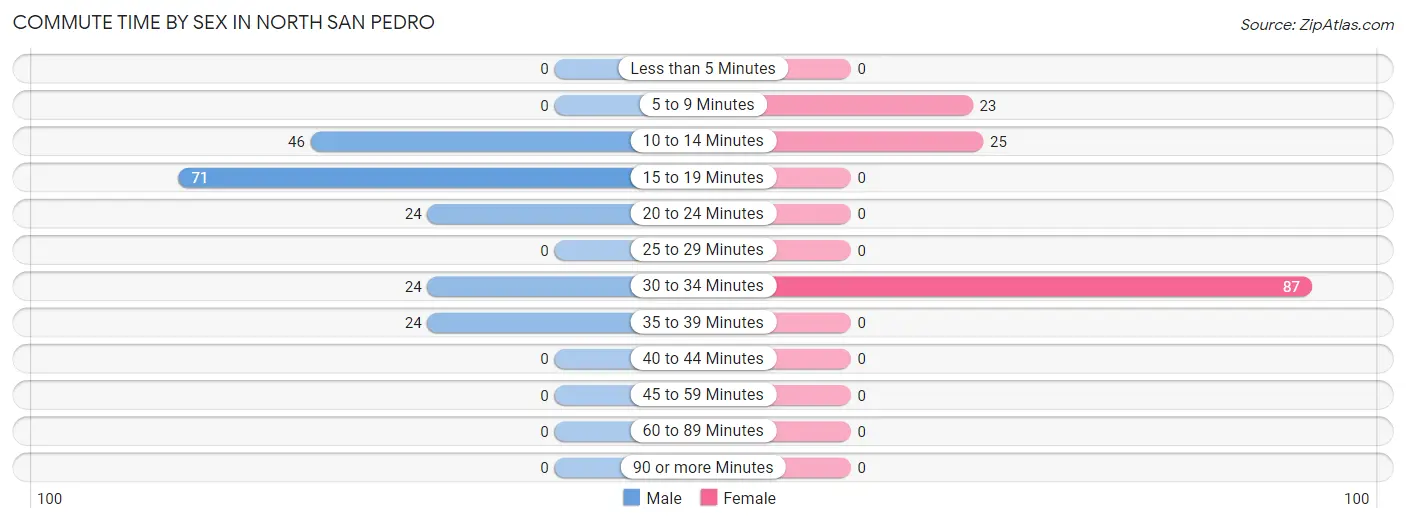
| Commute Time | Male | Female |
| Less than 5 Minutes | 0 (0.0%) | 0 (0.0%) |
| 5 to 9 Minutes | 0 (0.0%) | 23 (17.0%) |
| 10 to 14 Minutes | 46 (24.3%) | 25 (18.5%) |
| 15 to 19 Minutes | 71 (37.6%) | 0 (0.0%) |
| 20 to 24 Minutes | 24 (12.7%) | 0 (0.0%) |
| 25 to 29 Minutes | 0 (0.0%) | 0 (0.0%) |
| 30 to 34 Minutes | 24 (12.7%) | 87 (64.4%) |
| 35 to 39 Minutes | 24 (12.7%) | 0 (0.0%) |
| 40 to 44 Minutes | 0 (0.0%) | 0 (0.0%) |
| 45 to 59 Minutes | 0 (0.0%) | 0 (0.0%) |
| 60 to 89 Minutes | 0 (0.0%) | 0 (0.0%) |
| 90 or more Minutes | 0 (0.0%) | 0 (0.0%) |
Time of Departure to Work by Sex in North San Pedro
The most frequent times of departure to work in North San Pedro are 8:30 AM to 8:59 AM (48, 25.4%) for males and 7:00 AM to 7:29 AM (47, 34.8%) for females.
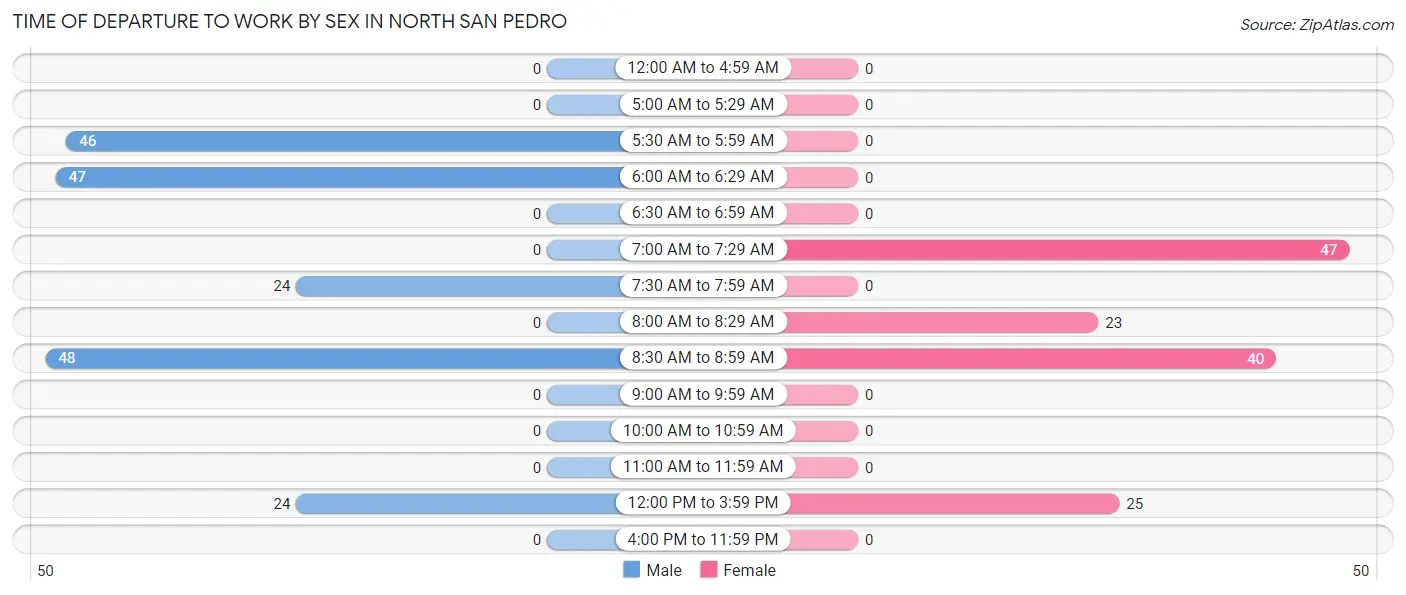
| Time of Departure | Male | Female |
| 12:00 AM to 4:59 AM | 0 (0.0%) | 0 (0.0%) |
| 5:00 AM to 5:29 AM | 0 (0.0%) | 0 (0.0%) |
| 5:30 AM to 5:59 AM | 46 (24.3%) | 0 (0.0%) |
| 6:00 AM to 6:29 AM | 47 (24.9%) | 0 (0.0%) |
| 6:30 AM to 6:59 AM | 0 (0.0%) | 0 (0.0%) |
| 7:00 AM to 7:29 AM | 0 (0.0%) | 47 (34.8%) |
| 7:30 AM to 7:59 AM | 24 (12.7%) | 0 (0.0%) |
| 8:00 AM to 8:29 AM | 0 (0.0%) | 23 (17.0%) |
| 8:30 AM to 8:59 AM | 48 (25.4%) | 40 (29.6%) |
| 9:00 AM to 9:59 AM | 0 (0.0%) | 0 (0.0%) |
| 10:00 AM to 10:59 AM | 0 (0.0%) | 0 (0.0%) |
| 11:00 AM to 11:59 AM | 0 (0.0%) | 0 (0.0%) |
| 12:00 PM to 3:59 PM | 24 (12.7%) | 25 (18.5%) |
| 4:00 PM to 11:59 PM | 0 (0.0%) | 0 (0.0%) |
| Total | 189 (100.0%) | 135 (100.0%) |
Housing Occupancy in North San Pedro
Occupancy by Ownership in North San Pedro
Of the total 233 dwellings in North San Pedro, owner-occupied units account for 233 (100.0%), while renter-occupied units make up 0 (0.0%).
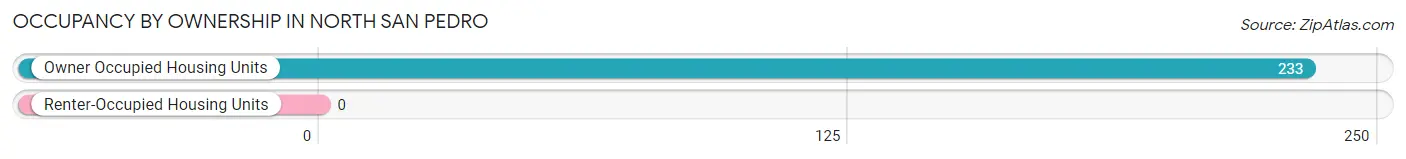
| Occupancy | # Housing Units | % Housing Units |
| Owner Occupied Housing Units | 233 | 100.0% |
| Renter-Occupied Housing Units | 0 | 0.0% |
| Total Occupied Housing Units | 233 | 100.0% |
Occupancy by Household Size in North San Pedro
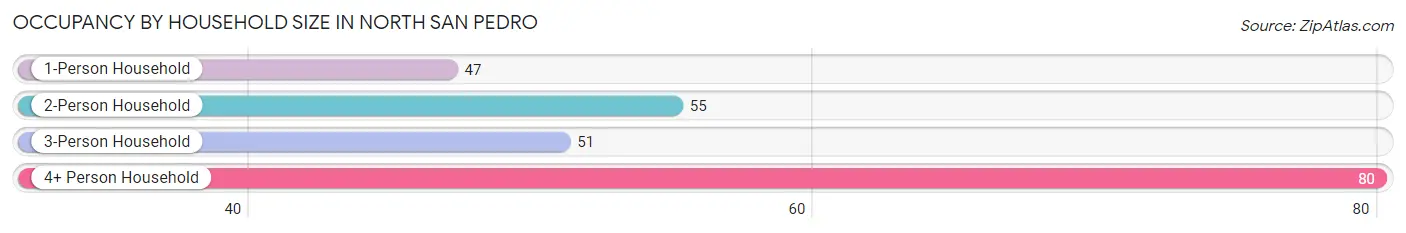
| Household Size | # Housing Units | % Housing Units |
| 1-Person Household | 47 | 20.2% |
| 2-Person Household | 55 | 23.6% |
| 3-Person Household | 51 | 21.9% |
| 4+ Person Household | 80 | 34.3% |
| Total Housing Units | 233 | 100.0% |
Occupancy by Ownership by Household Size in North San Pedro
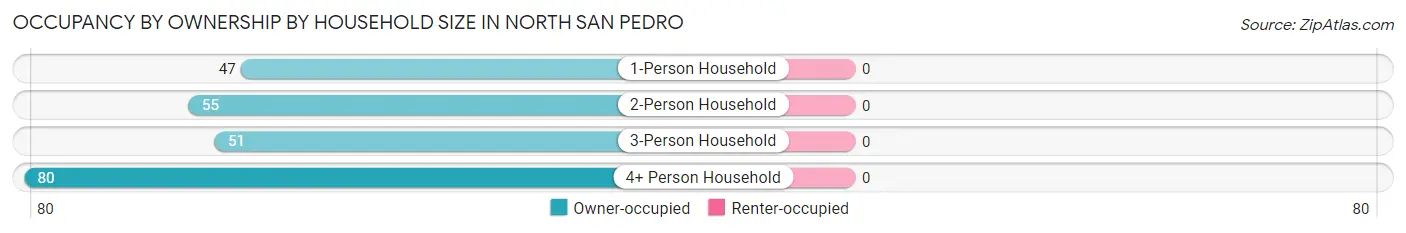
| Household Size | Owner-occupied | Renter-occupied |
| 1-Person Household | 47 (100.0%) | 0 (0.0%) |
| 2-Person Household | 55 (100.0%) | 0 (0.0%) |
| 3-Person Household | 51 (100.0%) | 0 (0.0%) |
| 4+ Person Household | 80 (100.0%) | 0 (0.0%) |
| Total Housing Units | 233 (100.0%) | 0 (0.0%) |
Occupancy by Educational Attainment in North San Pedro
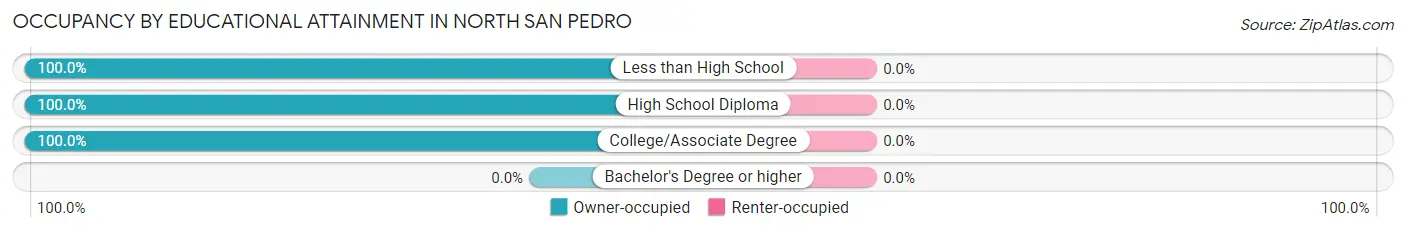
| Household Size | Owner-occupied | Renter-occupied |
| Less than High School | 123 (100.0%) | 0 (0.0%) |
| High School Diploma | 19 (100.0%) | 0 (0.0%) |
| College/Associate Degree | 91 (100.0%) | 0 (0.0%) |
| Bachelor's Degree or higher | 0 (0.0%) | 0 (0.0%) |
Occupancy by Age of Householder in North San Pedro
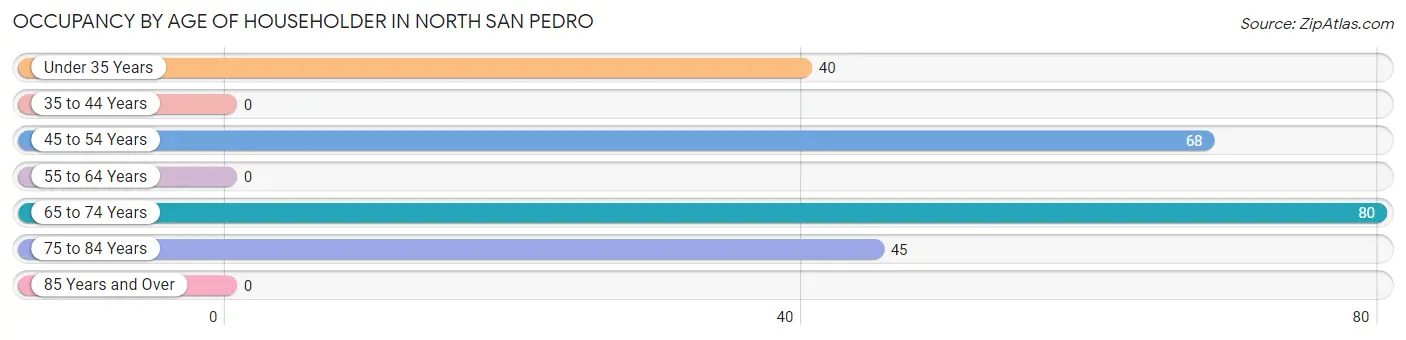
| Age Bracket | # Households | % Households |
| Under 35 Years | 40 | 17.2% |
| 35 to 44 Years | 0 | 0.0% |
| 45 to 54 Years | 68 | 29.2% |
| 55 to 64 Years | 0 | 0.0% |
| 65 to 74 Years | 80 | 34.3% |
| 75 to 84 Years | 45 | 19.3% |
| 85 Years and Over | 0 | 0.0% |
| Total | 233 | 100.0% |
Housing Finances in North San Pedro
Median Income by Occupancy in North San Pedro
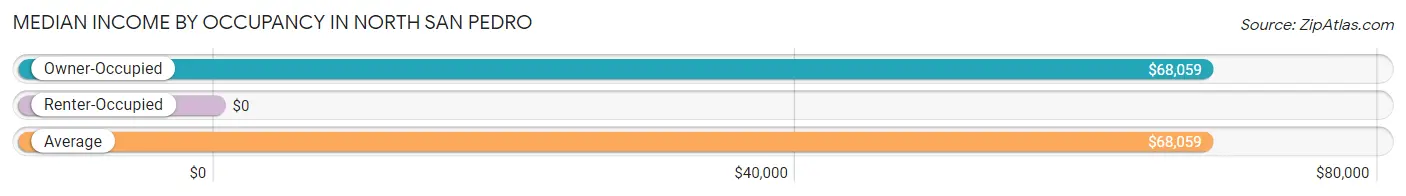
| Occupancy Type | # Households | Median Income |
| Owner-Occupied | 233 (100.0%) | $68,059 |
| Renter-Occupied | 0 (0.0%) | $0 |
| Average | 233 (100.0%) | $68,059 |
Occupancy by Householder Income Bracket in North San Pedro
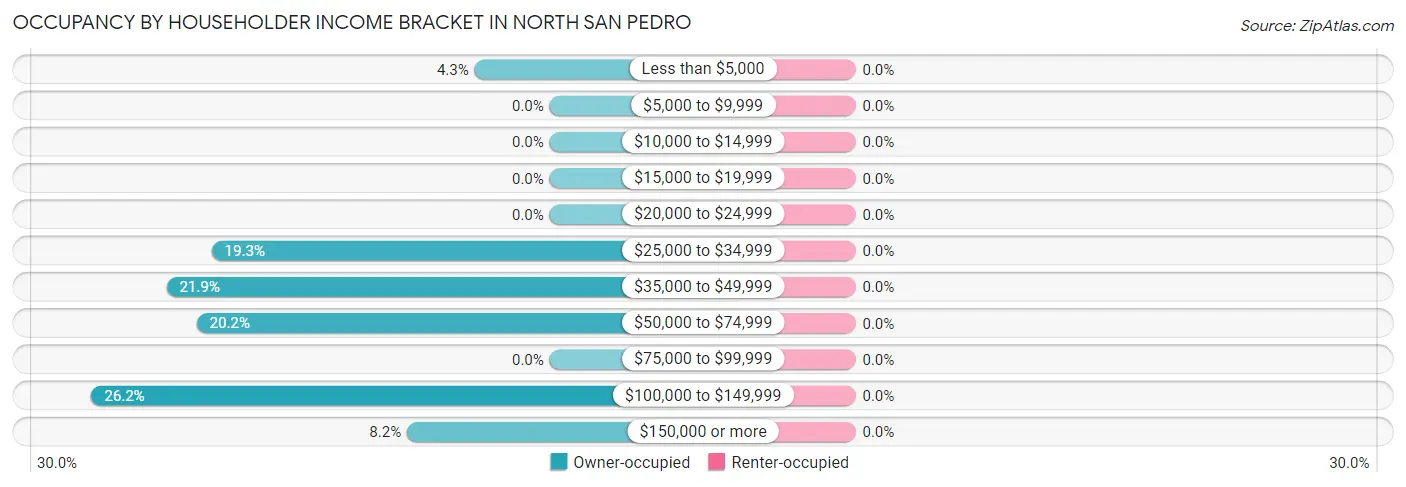
| Income Bracket | Owner-occupied | Renter-occupied |
| Less than $5,000 | 10 (4.3%) | 0 (0.0%) |
| $5,000 to $9,999 | 0 (0.0%) | 0 (0.0%) |
| $10,000 to $14,999 | 0 (0.0%) | 0 (0.0%) |
| $15,000 to $19,999 | 0 (0.0%) | 0 (0.0%) |
| $20,000 to $24,999 | 0 (0.0%) | 0 (0.0%) |
| $25,000 to $34,999 | 45 (19.3%) | 0 (0.0%) |
| $35,000 to $49,999 | 51 (21.9%) | 0 (0.0%) |
| $50,000 to $74,999 | 47 (20.2%) | 0 (0.0%) |
| $75,000 to $99,999 | 0 (0.0%) | 0 (0.0%) |
| $100,000 to $149,999 | 61 (26.2%) | 0 (0.0%) |
| $150,000 or more | 19 (8.2%) | 0 (0.0%) |
| Total | 233 (100.0%) | 0 (0.0%) |
Monthly Housing Cost Tiers in North San Pedro
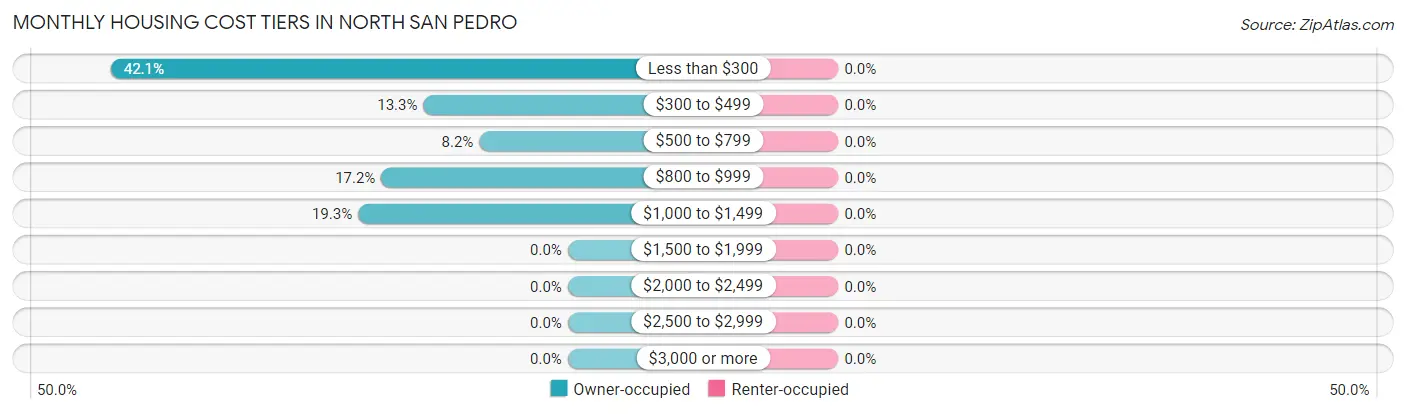
| Monthly Cost | Owner-occupied | Renter-occupied |
| Less than $300 | 98 (42.1%) | 0 (0.0%) |
| $300 to $499 | 31 (13.3%) | 0 (0.0%) |
| $500 to $799 | 19 (8.2%) | 0 (0.0%) |
| $800 to $999 | 40 (17.2%) | 0 (0.0%) |
| $1,000 to $1,499 | 45 (19.3%) | 0 (0.0%) |
| $1,500 to $1,999 | 0 (0.0%) | 0 (0.0%) |
| $2,000 to $2,499 | 0 (0.0%) | 0 (0.0%) |
| $2,500 to $2,999 | 0 (0.0%) | 0 (0.0%) |
| $3,000 or more | 0 (0.0%) | 0 (0.0%) |
| Total | 233 (100.0%) | 0 (0.0%) |
Physical Housing Characteristics in North San Pedro
Housing Structures in North San Pedro
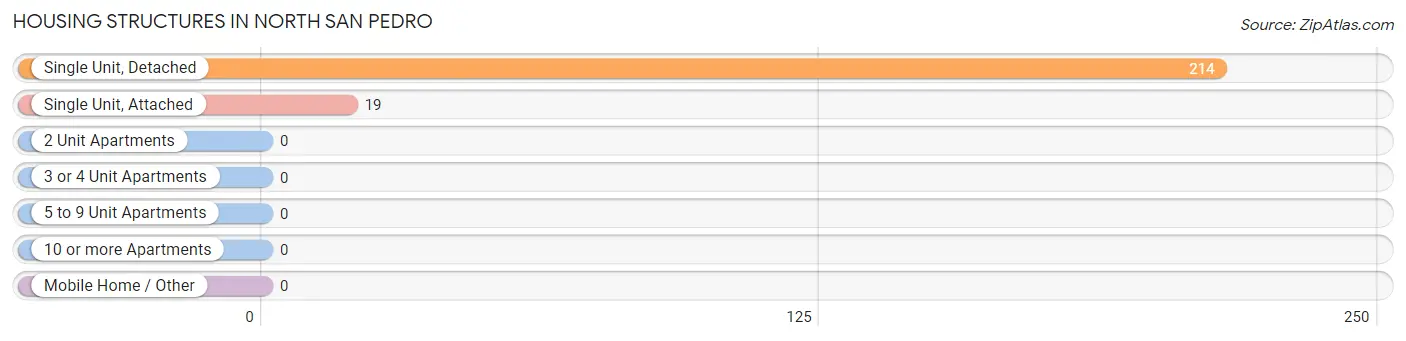
| Structure Type | # Housing Units | % Housing Units |
| Single Unit, Detached | 214 | 91.8% |
| Single Unit, Attached | 19 | 8.2% |
| 2 Unit Apartments | 0 | 0.0% |
| 3 or 4 Unit Apartments | 0 | 0.0% |
| 5 to 9 Unit Apartments | 0 | 0.0% |
| 10 or more Apartments | 0 | 0.0% |
| Mobile Home / Other | 0 | 0.0% |
| Total | 233 | 100.0% |
Housing Structures by Occupancy in North San Pedro
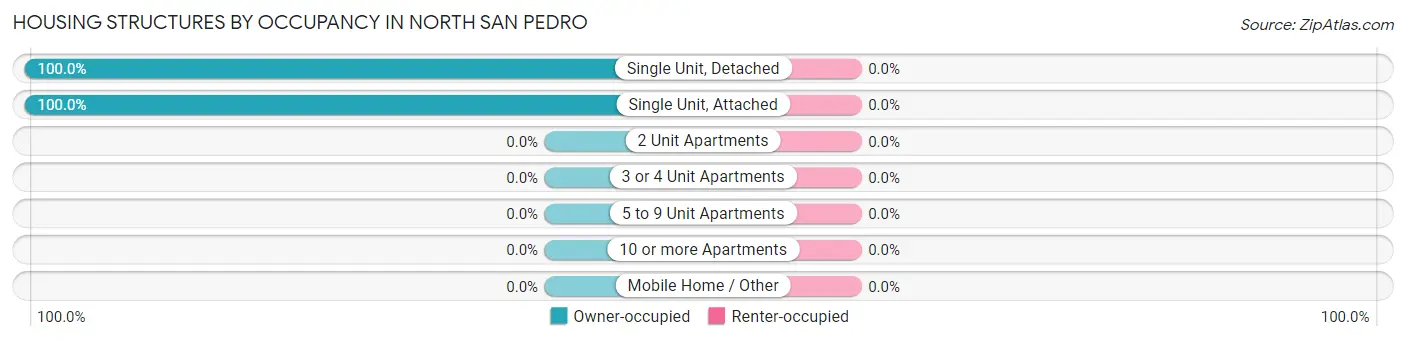
| Structure Type | Owner-occupied | Renter-occupied |
| Single Unit, Detached | 214 (100.0%) | 0 (0.0%) |
| Single Unit, Attached | 19 (100.0%) | 0 (0.0%) |
| 2 Unit Apartments | 0 (0.0%) | 0 (0.0%) |
| 3 or 4 Unit Apartments | 0 (0.0%) | 0 (0.0%) |
| 5 to 9 Unit Apartments | 0 (0.0%) | 0 (0.0%) |
| 10 or more Apartments | 0 (0.0%) | 0 (0.0%) |
| Mobile Home / Other | 0 (0.0%) | 0 (0.0%) |
| Total | 233 (100.0%) | 0 (0.0%) |
Housing Structures by Number of Rooms in North San Pedro
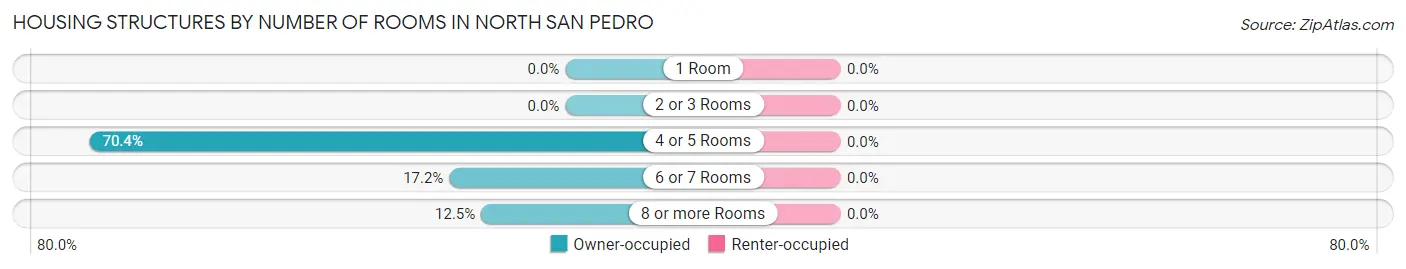
| Number of Rooms | Owner-occupied | Renter-occupied |
| 1 Room | 0 (0.0%) | 0 (0.0%) |
| 2 or 3 Rooms | 0 (0.0%) | 0 (0.0%) |
| 4 or 5 Rooms | 164 (70.4%) | 0 (0.0%) |
| 6 or 7 Rooms | 40 (17.2%) | 0 (0.0%) |
| 8 or more Rooms | 29 (12.4%) | 0 (0.0%) |
| Total | 233 (100.0%) | 0 (0.0%) |
Housing Structure by Heating Type in North San Pedro
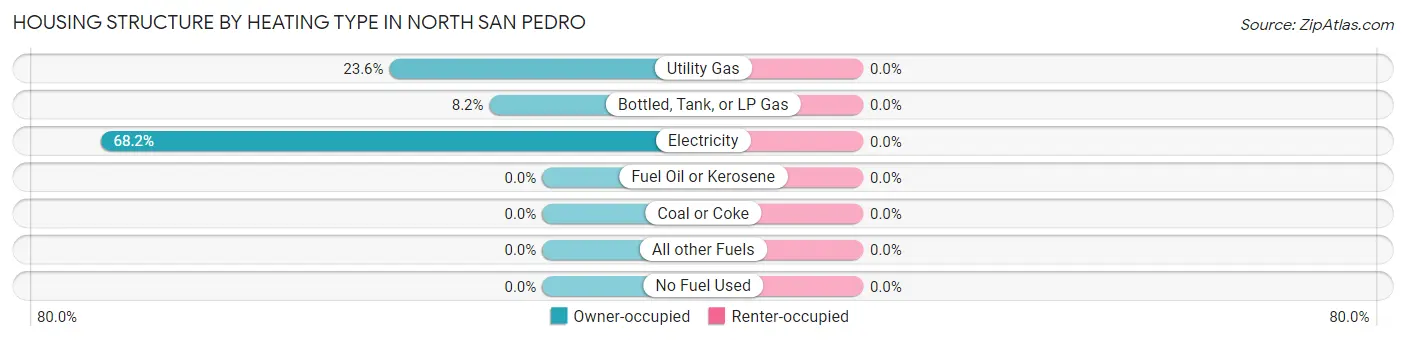
| Heating Type | Owner-occupied | Renter-occupied |
| Utility Gas | 55 (23.6%) | 0 (0.0%) |
| Bottled, Tank, or LP Gas | 19 (8.2%) | 0 (0.0%) |
| Electricity | 159 (68.2%) | 0 (0.0%) |
| Fuel Oil or Kerosene | 0 (0.0%) | 0 (0.0%) |
| Coal or Coke | 0 (0.0%) | 0 (0.0%) |
| All other Fuels | 0 (0.0%) | 0 (0.0%) |
| No Fuel Used | 0 (0.0%) | 0 (0.0%) |
| Total | 233 (100.0%) | 0 (0.0%) |
Household Vehicle Usage in North San Pedro
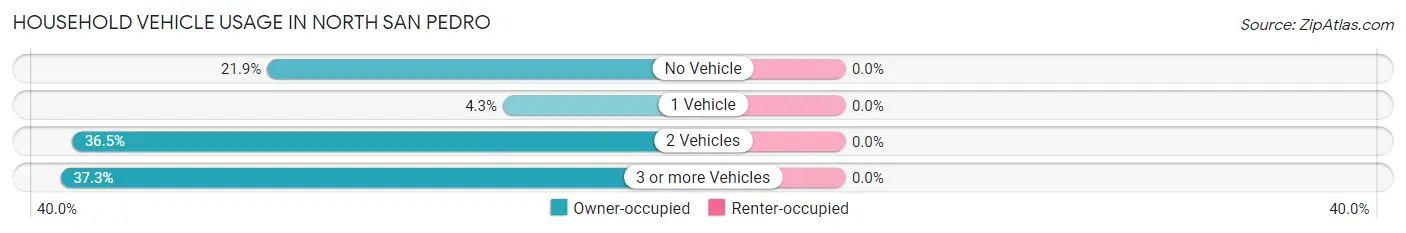
| Vehicles per Household | Owner-occupied | Renter-occupied |
| No Vehicle | 51 (21.9%) | 0 (0.0%) |
| 1 Vehicle | 10 (4.3%) | 0 (0.0%) |
| 2 Vehicles | 85 (36.5%) | 0 (0.0%) |
| 3 or more Vehicles | 87 (37.3%) | 0 (0.0%) |
| Total | 233 (100.0%) | 0 (0.0%) |
Real Estate & Mortgages in North San Pedro
Real Estate and Mortgage Overview in North San Pedro
| Characteristic | Without Mortgage | With Mortgage |
| Housing Units | 148 | 85 |
| Median Property Value | $51,600 | $0 |
| Median Household Income | $68,191 | $0 |
| Monthly Housing Costs | $276 | $0 |
| Real Estate Taxes | - | - |
Property Value by Mortgage Status in North San Pedro
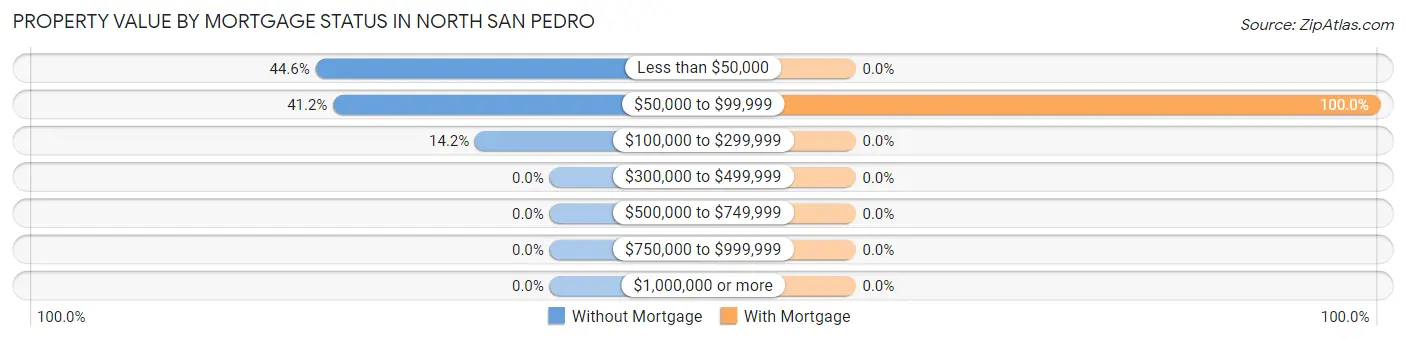
| Property Value | Without Mortgage | With Mortgage |
| Less than $50,000 | 66 (44.6%) | 0 (0.0%) |
| $50,000 to $99,999 | 61 (41.2%) | 85 (100.0%) |
| $100,000 to $299,999 | 21 (14.2%) | 0 (0.0%) |
| $300,000 to $499,999 | 0 (0.0%) | 0 (0.0%) |
| $500,000 to $749,999 | 0 (0.0%) | 0 (0.0%) |
| $750,000 to $999,999 | 0 (0.0%) | 0 (0.0%) |
| $1,000,000 or more | 0 (0.0%) | 0 (0.0%) |
| Total | 148 (100.0%) | 85 (100.0%) |
Household Income by Mortgage Status in North San Pedro
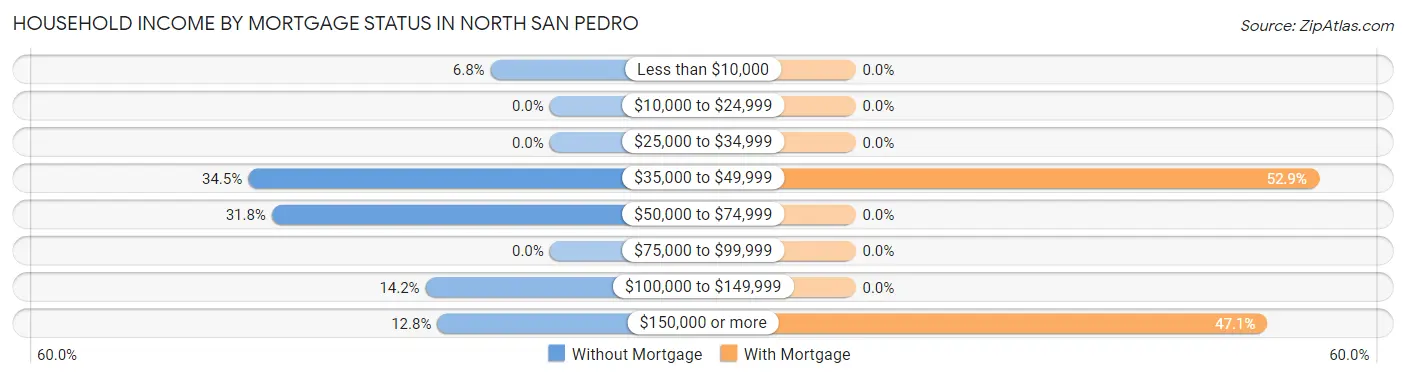
| Household Income | Without Mortgage | With Mortgage |
| Less than $10,000 | 10 (6.8%) | 0 (0.0%) |
| $10,000 to $24,999 | 0 (0.0%) | 0 (0.0%) |
| $25,000 to $34,999 | 0 (0.0%) | 0 (0.0%) |
| $35,000 to $49,999 | 51 (34.5%) | 45 (52.9%) |
| $50,000 to $74,999 | 47 (31.8%) | 0 (0.0%) |
| $75,000 to $99,999 | 0 (0.0%) | 0 (0.0%) |
| $100,000 to $149,999 | 21 (14.2%) | 0 (0.0%) |
| $150,000 or more | 19 (12.8%) | 40 (47.1%) |
| Total | 148 (100.0%) | 85 (100.0%) |
Property Value to Household Income Ratio in North San Pedro
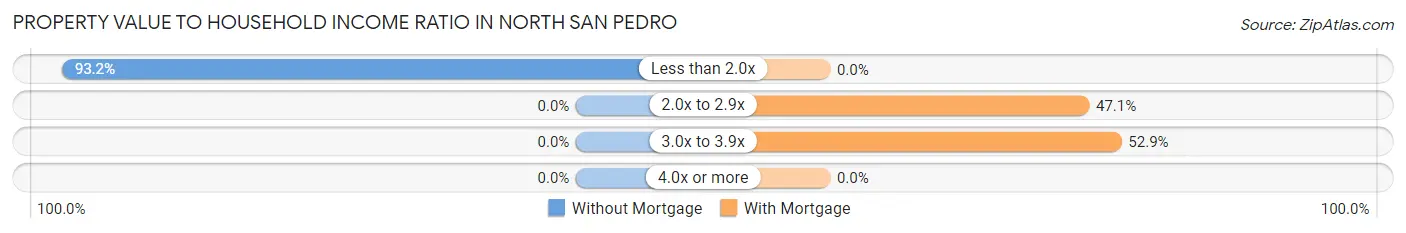
| Value-to-Income Ratio | Without Mortgage | With Mortgage |
| Less than 2.0x | 138 (93.2%) | 0 (0.0%) |
| 2.0x to 2.9x | 0 (0.0%) | 40 (47.1%) |
| 3.0x to 3.9x | 0 (0.0%) | 45 (52.9%) |
| 4.0x or more | 0 (0.0%) | 0 (0.0%) |
| Total | 148 (100.0%) | 85 (100.0%) |
Real Estate Taxes by Mortgage Status in North San Pedro
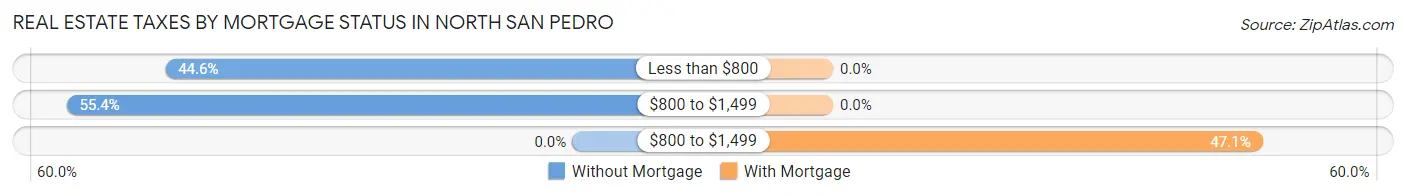
| Property Taxes | Without Mortgage | With Mortgage |
| Less than $800 | 66 (44.6%) | 0 (0.0%) |
| $800 to $1,499 | 82 (55.4%) | 0 (0.0%) |
| $800 to $1,499 | 0 (0.0%) | 40 (47.1%) |
| Total | 148 (100.0%) | 85 (100.0%) |
Health & Disability in North San Pedro
Health Insurance Coverage by Age in North San Pedro
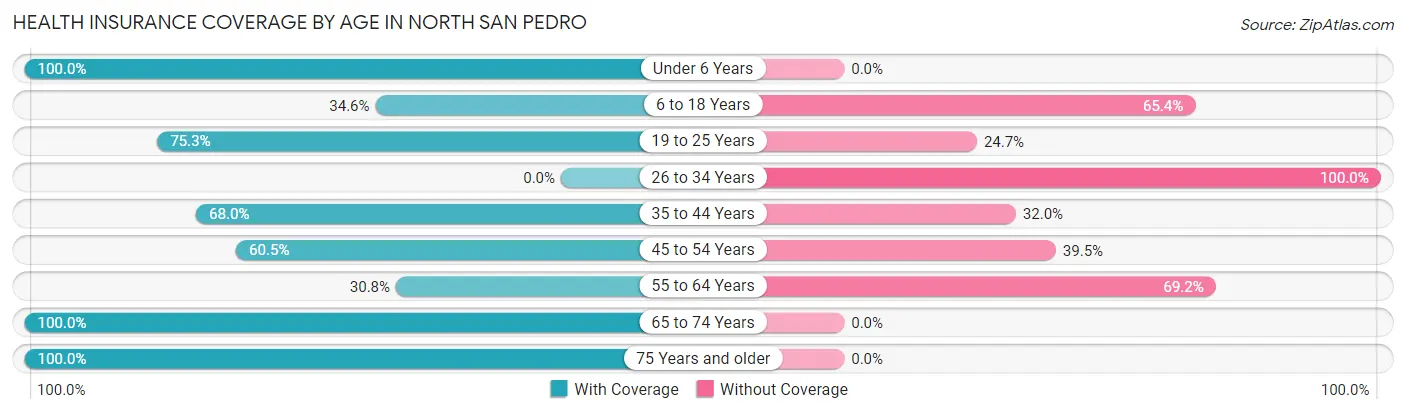
| Age Bracket | With Coverage | Without Coverage |
| Under 6 Years | 60 (100.0%) | 0 (0.0%) |
| 6 to 18 Years | 46 (34.6%) | 87 (65.4%) |
| 19 to 25 Years | 73 (75.3%) | 24 (24.7%) |
| 26 to 34 Years | 0 (0.0%) | 40 (100.0%) |
| 35 to 44 Years | 51 (68.0%) | 24 (32.0%) |
| 45 to 54 Years | 89 (60.5%) | 58 (39.5%) |
| 55 to 64 Years | 24 (30.8%) | 54 (69.2%) |
| 65 to 74 Years | 99 (100.0%) | 0 (0.0%) |
| 75 Years and older | 95 (100.0%) | 0 (0.0%) |
| Total | 537 (65.2%) | 287 (34.8%) |
Health Insurance Coverage by Citizenship Status in North San Pedro
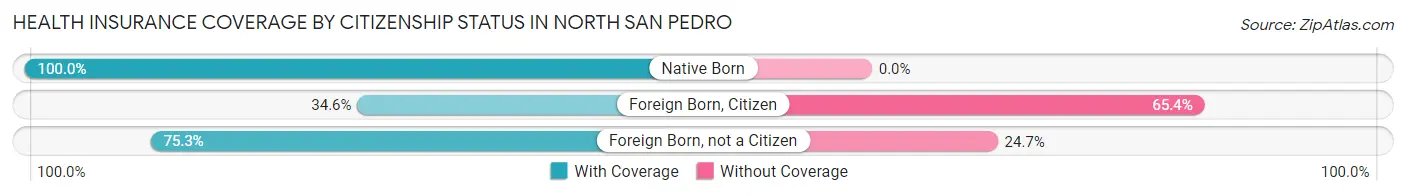
| Citizenship Status | With Coverage | Without Coverage |
| Native Born | 60 (100.0%) | 0 (0.0%) |
| Foreign Born, Citizen | 46 (34.6%) | 87 (65.4%) |
| Foreign Born, not a Citizen | 73 (75.3%) | 24 (24.7%) |
Health Insurance Coverage by Household Income in North San Pedro
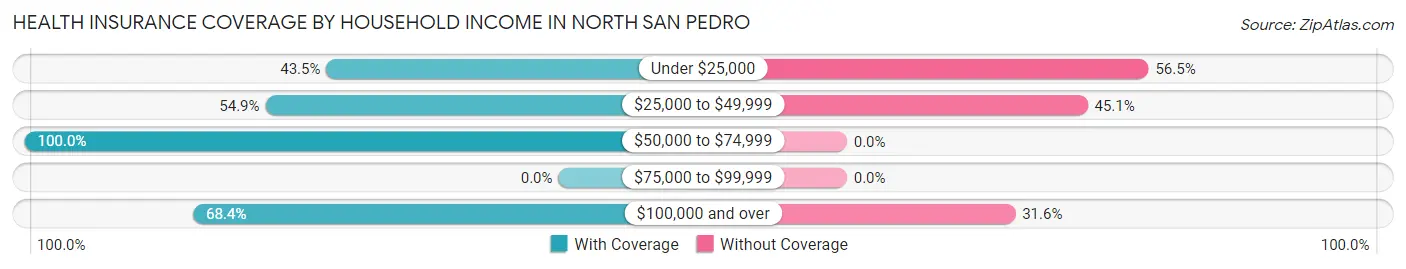
| Household Income | With Coverage | Without Coverage |
| Under $25,000 | 10 (43.5%) | 13 (56.5%) |
| $25,000 to $49,999 | 146 (54.9%) | 120 (45.1%) |
| $50,000 to $74,999 | 47 (100.0%) | 0 (0.0%) |
| $75,000 to $99,999 | 0 (0.0%) | 0 (0.0%) |
| $100,000 and over | 334 (68.4%) | 154 (31.6%) |
Public vs Private Health Insurance Coverage by Age in North San Pedro
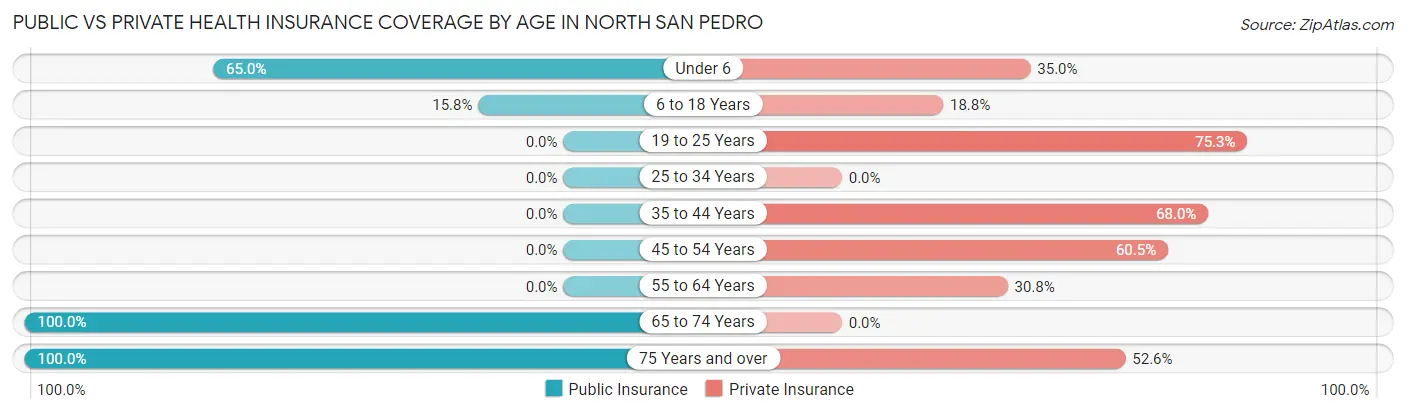
| Age Bracket | Public Insurance | Private Insurance |
| Under 6 | 39 (65.0%) | 21 (35.0%) |
| 6 to 18 Years | 21 (15.8%) | 25 (18.8%) |
| 19 to 25 Years | 0 (0.0%) | 73 (75.3%) |
| 25 to 34 Years | 0 (0.0%) | 0 (0.0%) |
| 35 to 44 Years | 0 (0.0%) | 51 (68.0%) |
| 45 to 54 Years | 0 (0.0%) | 89 (60.5%) |
| 55 to 64 Years | 0 (0.0%) | 24 (30.8%) |
| 65 to 74 Years | 99 (100.0%) | 0 (0.0%) |
| 75 Years and over | 95 (100.0%) | 50 (52.6%) |
| Total | 254 (30.8%) | 333 (40.4%) |
Disability Status by Sex by Age in North San Pedro
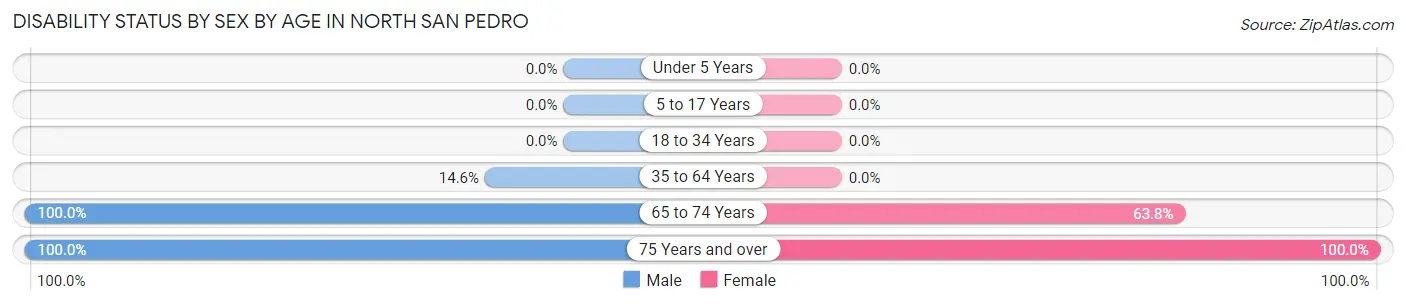
| Age Bracket | Male | Female |
| Under 5 Years | 0 (0.0%) | 0 (0.0%) |
| 5 to 17 Years | 0 (0.0%) | 0 (0.0%) |
| 18 to 34 Years | 0 (0.0%) | 0 (0.0%) |
| 35 to 64 Years | 22 (14.6%) | 0 (0.0%) |
| 65 to 74 Years | 19 (100.0%) | 51 (63.7%) |
| 75 Years and over | 50 (100.0%) | 45 (100.0%) |
Disability Class by Sex by Age in North San Pedro
Disability Class: Hearing Difficulty
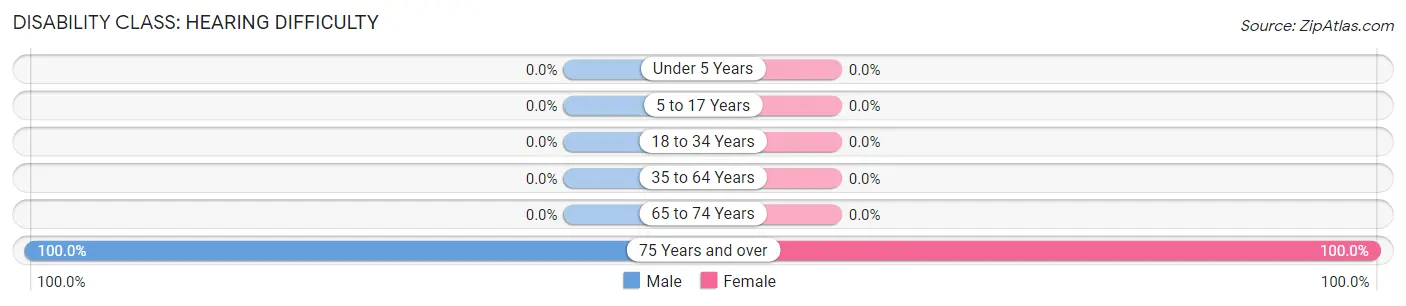
| Age Bracket | Male | Female |
| Under 5 Years | 0 (0.0%) | 0 (0.0%) |
| 5 to 17 Years | 0 (0.0%) | 0 (0.0%) |
| 18 to 34 Years | 0 (0.0%) | 0 (0.0%) |
| 35 to 64 Years | 0 (0.0%) | 0 (0.0%) |
| 65 to 74 Years | 0 (0.0%) | 0 (0.0%) |
| 75 Years and over | 50 (100.0%) | 45 (100.0%) |
Disability Class: Vision Difficulty
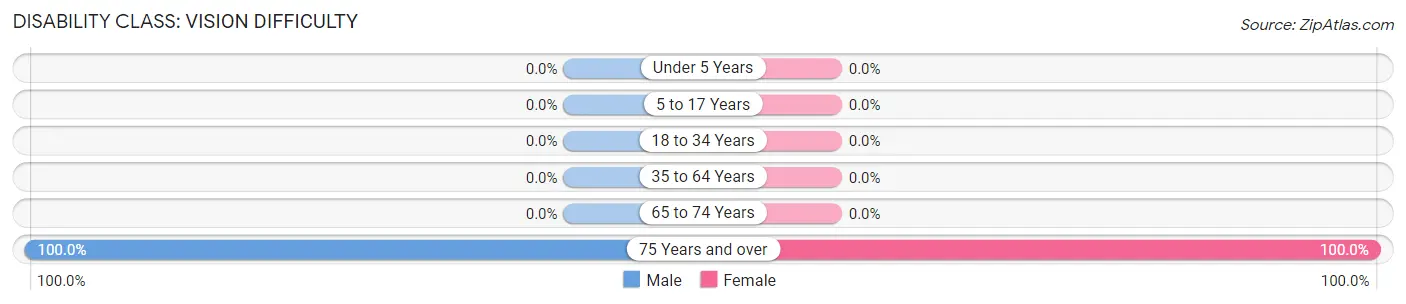
| Age Bracket | Male | Female |
| Under 5 Years | 0 (0.0%) | 0 (0.0%) |
| 5 to 17 Years | 0 (0.0%) | 0 (0.0%) |
| 18 to 34 Years | 0 (0.0%) | 0 (0.0%) |
| 35 to 64 Years | 0 (0.0%) | 0 (0.0%) |
| 65 to 74 Years | 0 (0.0%) | 0 (0.0%) |
| 75 Years and over | 50 (100.0%) | 45 (100.0%) |
Disability Class: Cognitive Difficulty
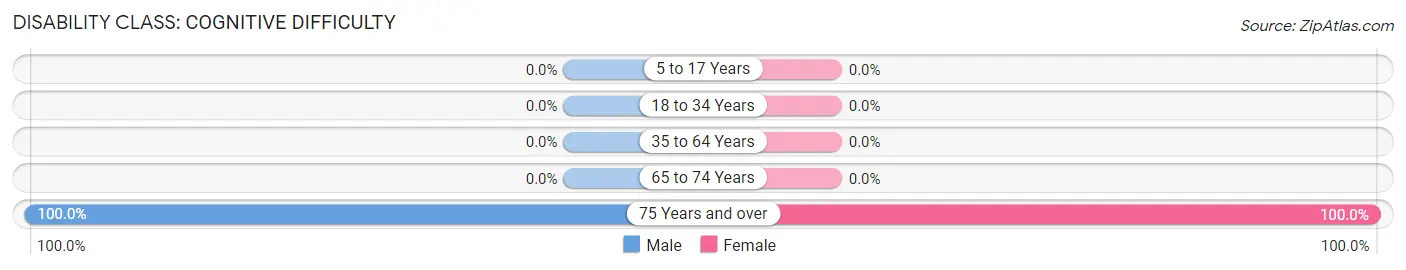
| Age Bracket | Male | Female |
| 5 to 17 Years | 0 (0.0%) | 0 (0.0%) |
| 18 to 34 Years | 0 (0.0%) | 0 (0.0%) |
| 35 to 64 Years | 0 (0.0%) | 0 (0.0%) |
| 65 to 74 Years | 0 (0.0%) | 0 (0.0%) |
| 75 Years and over | 50 (100.0%) | 45 (100.0%) |
Disability Class: Ambulatory Difficulty
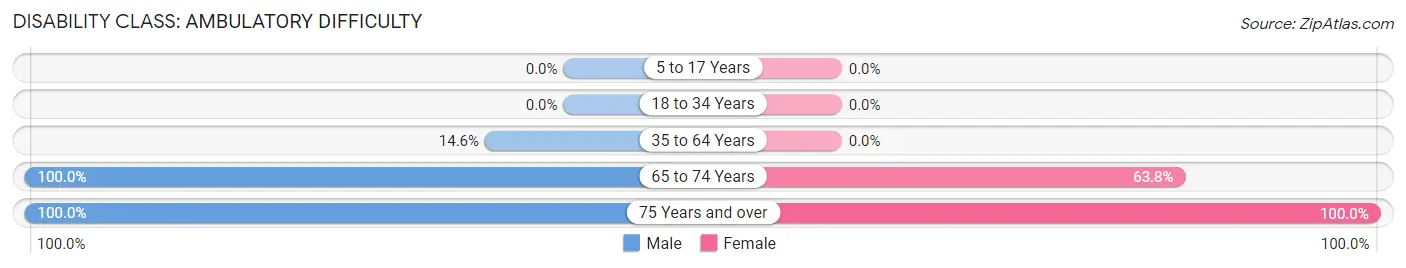
| Age Bracket | Male | Female |
| 5 to 17 Years | 0 (0.0%) | 0 (0.0%) |
| 18 to 34 Years | 0 (0.0%) | 0 (0.0%) |
| 35 to 64 Years | 22 (14.6%) | 0 (0.0%) |
| 65 to 74 Years | 19 (100.0%) | 51 (63.7%) |
| 75 Years and over | 50 (100.0%) | 45 (100.0%) |
Disability Class: Self-Care Difficulty
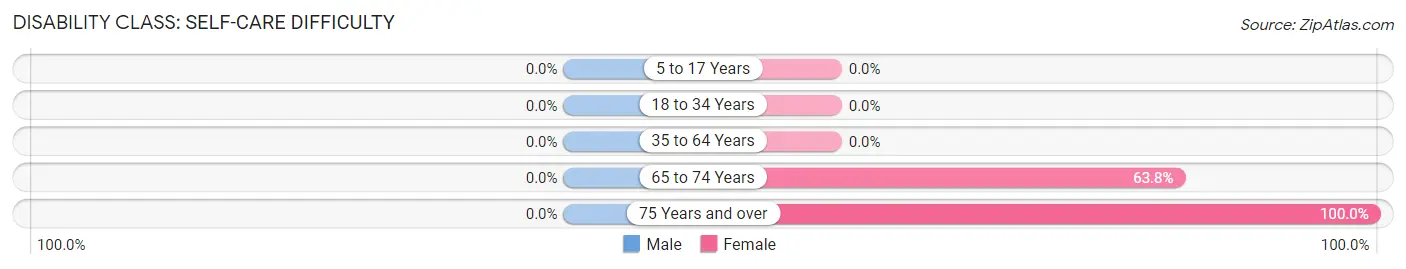
| Age Bracket | Male | Female |
| 5 to 17 Years | 0 (0.0%) | 0 (0.0%) |
| 18 to 34 Years | 0 (0.0%) | 0 (0.0%) |
| 35 to 64 Years | 0 (0.0%) | 0 (0.0%) |
| 65 to 74 Years | 0 (0.0%) | 51 (63.7%) |
| 75 Years and over | 0 (0.0%) | 45 (100.0%) |
Technology Access in North San Pedro
Computing Device Access in North San Pedro
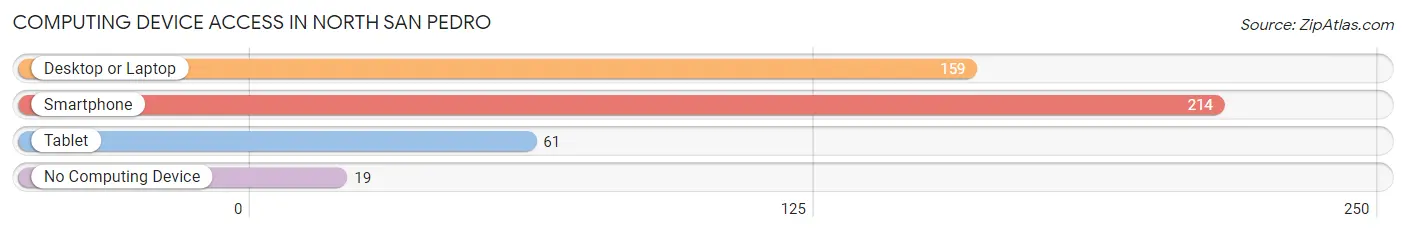
| Device Type | # Households | % Households |
| Desktop or Laptop | 159 | 68.2% |
| Smartphone | 214 | 91.8% |
| Tablet | 61 | 26.2% |
| No Computing Device | 19 | 8.2% |
| Total | 233 | 100.0% |
Internet Access in North San Pedro
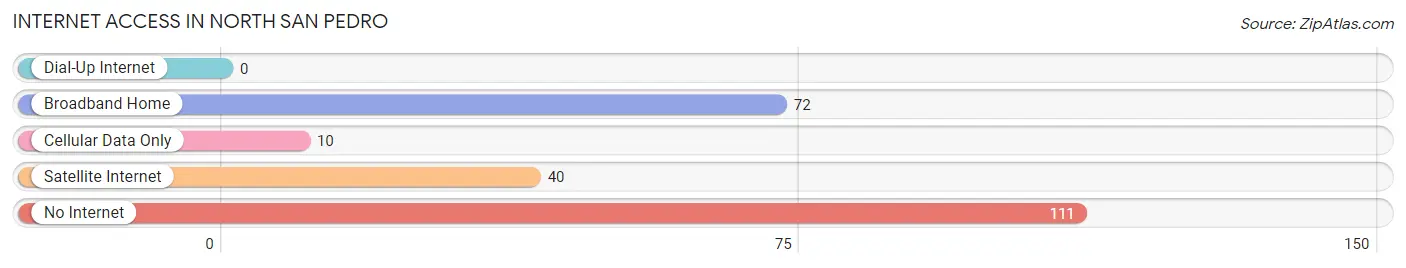
| Internet Type | # Households | % Households |
| Dial-Up Internet | 0 | 0.0% |
| Broadband Home | 72 | 30.9% |
| Cellular Data Only | 10 | 4.3% |
| Satellite Internet | 40 | 17.2% |
| No Internet | 111 | 47.6% |
| Total | 233 | 100.0% |
North San Pedro Summary
San Pedro, Texas is a small town located in the northern part of the state, just south of the Texas-Mexico border. It is part of the Rio Grande Valley, a region known for its rich cultural heritage and agricultural production. The town has a population of just over 1,000 people and is home to a variety of businesses, including a grocery store, a gas station, a post office, and a few restaurants.
History
San Pedro was founded in 1848 by a group of Mexican settlers who were looking for a place to settle and farm. The town was originally called San Pedro de la Sierra, which translates to “Saint Peter of the Mountains”. The settlers were attracted to the area due to its fertile soil and abundant water supply. The town was officially incorporated in 1876 and was named after the nearby San Pedro Creek.
In the early 1900s, San Pedro began to experience a population boom due to the influx of Mexican immigrants. This growth was largely due to the fact that the town was located close to the border and was a convenient place for immigrants to settle. The town also experienced a period of economic growth during this time, as the local economy was bolstered by the production of cotton, corn, and other agricultural products.
Geography
San Pedro is located in the northern part of the Rio Grande Valley, just south of the Texas-Mexico border. The town is situated on the banks of the San Pedro Creek, which is a tributary of the Rio Grande. The town is surrounded by a variety of natural features, including the San Pedro Mountains, the San Pedro National Wildlife Refuge, and the San Pedro River. The climate in San Pedro is generally warm and humid, with temperatures ranging from the mid-70s in the summer to the mid-50s in the winter.
Economy
San Pedro’s economy is largely based on agriculture and tourism. The town is home to a variety of farms that produce a variety of crops, including cotton, corn, and other vegetables. The town is also home to a number of tourist attractions, including the San Pedro National Wildlife Refuge, the San Pedro River, and the San Pedro Mountains. Additionally, the town is home to a variety of businesses, including a grocery store, a gas station, a post office, and a few restaurants.
Demographics
As of the 2010 census, San Pedro had a population of 1,072 people. The racial makeup of the town was 94.3% Hispanic or Latino, 4.2% White, 0.3% African American, 0.2% Native American, and 0.9% from other races. The median household income in San Pedro was $25,938, and the median age was 33.5 years. The town is served by the San Pedro Independent School District.
San Pedro is a small town with a rich history and a vibrant culture. The town is home to a variety of businesses and attractions, and its economy is largely based on agriculture and tourism. The town is also home to a diverse population, with a majority of its residents being of Hispanic or Latino descent. San Pedro is a great place to live and visit, and its unique culture and history make it a great place to explore.
Common Questions
What is Per Capita Income in North San Pedro?
Per Capita income in North San Pedro is $23,453.
What is the Median Household income in North San Pedro?
Median Household Income in North San Pedro is $68,059.
What is Income or Wage Gap in North San Pedro?
Income or Wage Gap in North San Pedro is 52.3%.
Women in North San Pedro earn 47.7 cents for every dollar earned by a man.
What is Inequality or Gini Index in North San Pedro?
Inequality or Gini Index in North San Pedro is 0.40.
What is the Total Population of North San Pedro?
Total Population of North San Pedro is 824.
What is the Total Male Population of North San Pedro?
Total Male Population of North San Pedro is 423.
What is the Total Female Population of North San Pedro?
Total Female Population of North San Pedro is 401.
What is the Ratio of Males per 100 Females in North San Pedro?
There are 105.49 Males per 100 Females in North San Pedro.
What is the Ratio of Females per 100 Males in North San Pedro?
There are 94.80 Females per 100 Males in North San Pedro.
What is the Median Population Age in North San Pedro?
Median Population Age in North San Pedro is 45.2 Years.
What is the Average Family Size in North San Pedro
Average Family Size in North San Pedro is 3.9 People.
What is the Average Household Size in North San Pedro
Average Household Size in North San Pedro is 3.5 People.
How Large is the Labor Force in North San Pedro?
There are 378 People in the Labor Forcein in North San Pedro.
What is the Percentage of People in the Labor Force in North San Pedro?
59.9% of People are in the Labor Force in North San Pedro.
What is the Unemployment Rate in North San Pedro?
Unemployment Rate in North San Pedro is 14.3%.