Lake Colorado City, TX Map & Demographics
Lake Colorado City Map
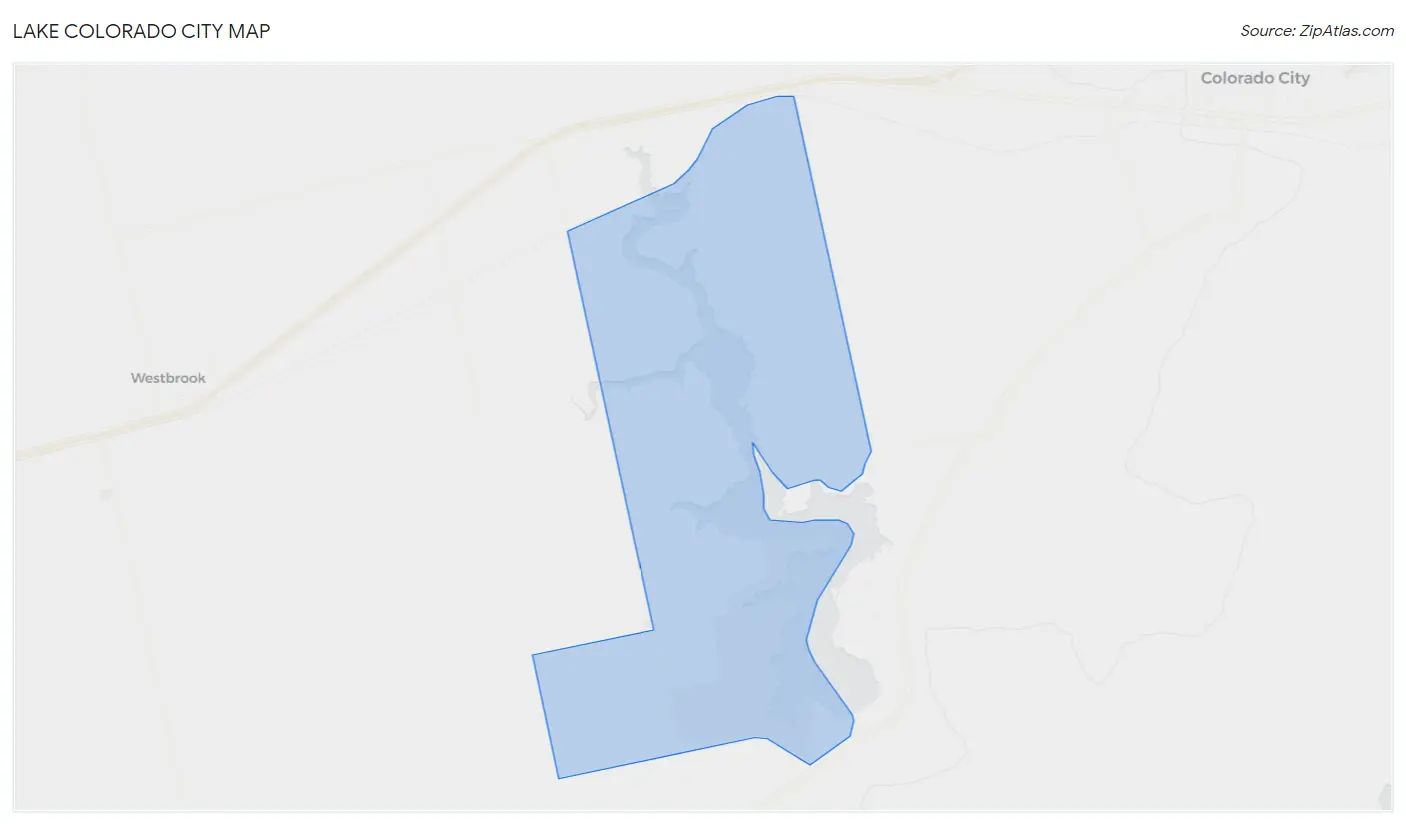
Lake Colorado City Overview
$32,788
PER CAPITA INCOME
$152,500
AVG FAMILY INCOME
$65,000
AVG HOUSEHOLD INCOME
14.0%
WAGE / INCOME GAP [ % ]
86.0¢/ $1
WAGE / INCOME GAP [ $ ]
0.47
INEQUALITY / GINI INDEX
903
TOTAL POPULATION
458
MALE POPULATION
445
FEMALE POPULATION
102.92
MALES / 100 FEMALES
97.16
FEMALES / 100 MALES
46.1
MEDIAN AGE
4.3
AVG FAMILY SIZE
3.5
AVG HOUSEHOLD SIZE
593
LABOR FORCE [ PEOPLE ]
70.2%
PERCENT IN LABOR FORCE
1.3%
UNEMPLOYMENT RATE
Income in Lake Colorado City
Income Overview in Lake Colorado City
Per Capita Income in Lake Colorado City is $32,788, while median incomes of families and households are $152,500 and $65,000 respectively.
| Characteristic | Number | Measure |
| Per Capita Income | 903 | $32,788 |
| Median Family Income | 146 | $152,500 |
| Mean Family Income | 146 | $149,571 |
| Median Household Income | 260 | $65,000 |
| Mean Household Income | 260 | $101,793 |
| Income Deficit | 146 | $0 |
| Wage / Income Gap (%) | 903 | 13.99% |
| Wage / Income Gap ($) | 903 | 86.01¢ per $1 |
| Gini / Inequality Index | 903 | 0.47 |
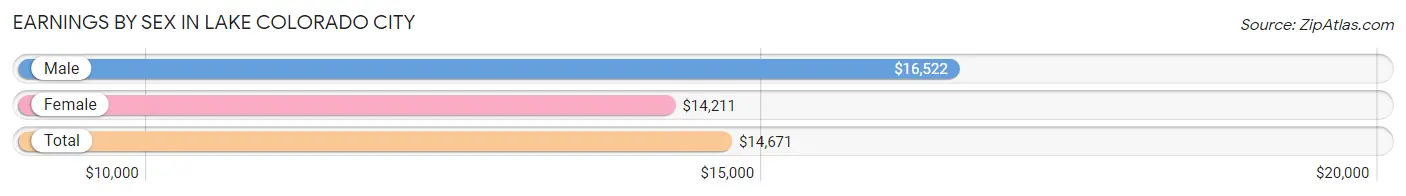
Earnings by Sex in Lake Colorado City
Average Earnings in Lake Colorado City are $14,671, $16,522 for men and $14,211 for women, a difference of 14.0%.
| Sex | Number | Average Earnings |
| Male | 348 (56.7%) | $16,522 |
| Female | 266 (43.3%) | $14,211 |
| Total | 614 (100.0%) | $14,671 |
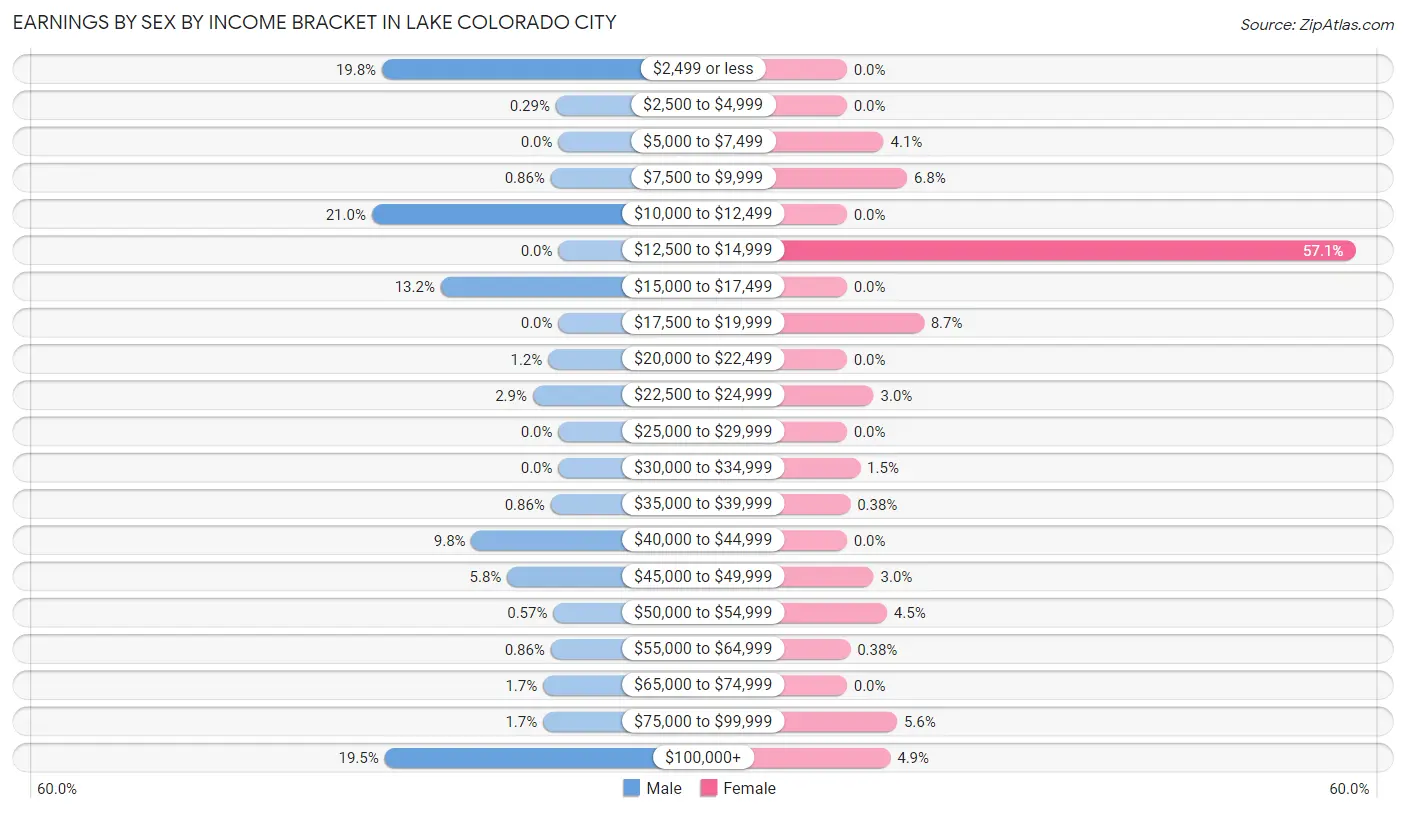
Earnings by Sex by Income Bracket in Lake Colorado City
The most common earnings brackets in Lake Colorado City are $10,000 to $12,499 for men (73 | 21.0%) and $12,500 to $14,999 for women (152 | 57.1%).
| Income | Male | Female |
| $2,499 or less | 69 (19.8%) | 0 (0.0%) |
| $2,500 to $4,999 | 1 (0.3%) | 0 (0.0%) |
| $5,000 to $7,499 | 0 (0.0%) | 11 (4.1%) |
| $7,500 to $9,999 | 3 (0.9%) | 18 (6.8%) |
| $10,000 to $12,499 | 73 (21.0%) | 0 (0.0%) |
| $12,500 to $14,999 | 0 (0.0%) | 152 (57.1%) |
| $15,000 to $17,499 | 46 (13.2%) | 0 (0.0%) |
| $17,500 to $19,999 | 0 (0.0%) | 23 (8.6%) |
| $20,000 to $22,499 | 4 (1.1%) | 0 (0.0%) |
| $22,500 to $24,999 | 10 (2.9%) | 8 (3.0%) |
| $25,000 to $29,999 | 0 (0.0%) | 0 (0.0%) |
| $30,000 to $34,999 | 0 (0.0%) | 4 (1.5%) |
| $35,000 to $39,999 | 3 (0.9%) | 1 (0.4%) |
| $40,000 to $44,999 | 34 (9.8%) | 0 (0.0%) |
| $45,000 to $49,999 | 20 (5.8%) | 8 (3.0%) |
| $50,000 to $54,999 | 2 (0.6%) | 12 (4.5%) |
| $55,000 to $64,999 | 3 (0.9%) | 1 (0.4%) |
| $65,000 to $74,999 | 6 (1.7%) | 0 (0.0%) |
| $75,000 to $99,999 | 6 (1.7%) | 15 (5.6%) |
| $100,000+ | 68 (19.5%) | 13 (4.9%) |
| Total | 348 (100.0%) | 266 (100.0%) |
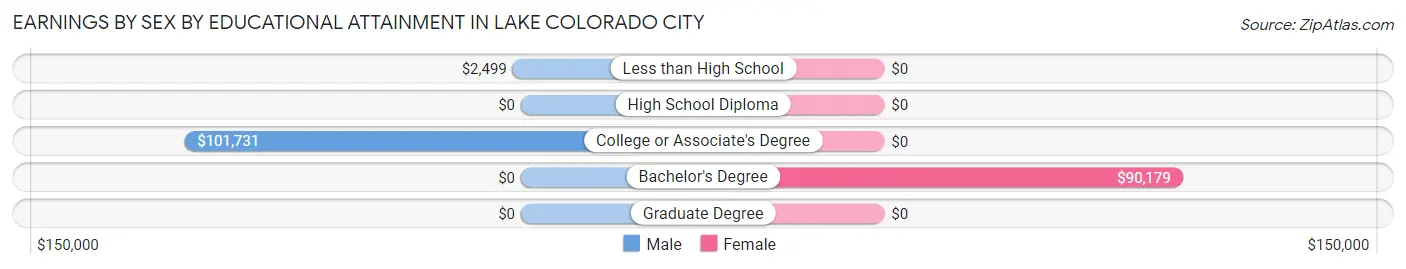
Earnings by Sex by Educational Attainment in Lake Colorado City
| Educational Attainment | Male Income | Female Income |
| Less than High School | $2,499 | $0 |
| High School Diploma | - | - |
| College or Associate's Degree | $101,731 | $0 |
| Bachelor's Degree | - | - |
| Graduate Degree | - | - |
| Total | - | - |
Family Income in Lake Colorado City
Family Income Brackets in Lake Colorado City
According to the Lake Colorado City family income data, there are 44 families falling into the $150,000 to $199,999 income range, which is the most common income bracket and makes up 30.1% of all families.
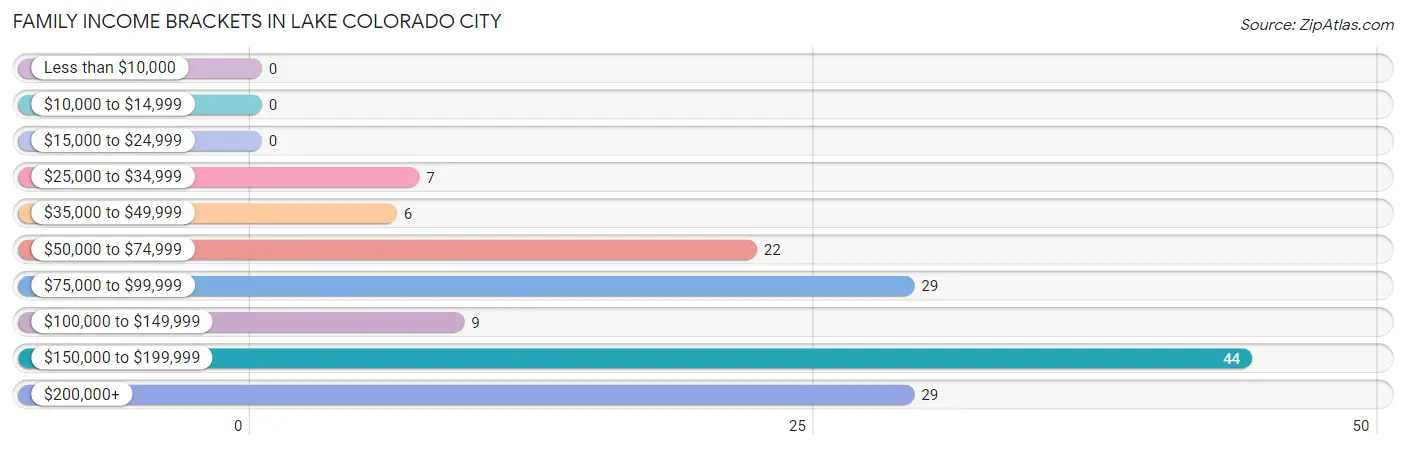
| Income Bracket | # Families | % Families |
| Less than $10,000 | 0 | 0.0% |
| $10,000 to $14,999 | 0 | 0.0% |
| $15,000 to $24,999 | 0 | 0.0% |
| $25,000 to $34,999 | 7 | 4.8% |
| $35,000 to $49,999 | 6 | 4.1% |
| $50,000 to $74,999 | 22 | 15.1% |
| $75,000 to $99,999 | 29 | 19.9% |
| $100,000 to $149,999 | 9 | 6.2% |
| $150,000 to $199,999 | 44 | 30.1% |
| $200,000+ | 29 | 19.9% |
Family Income by Famaliy Size in Lake Colorado City
3-person families (36 | 24.7%) account for the highest median family income in Lake Colorado City with $155,769 per family, while 2-person families (63 | 43.1%) have the highest median income of $52,188 per family member.
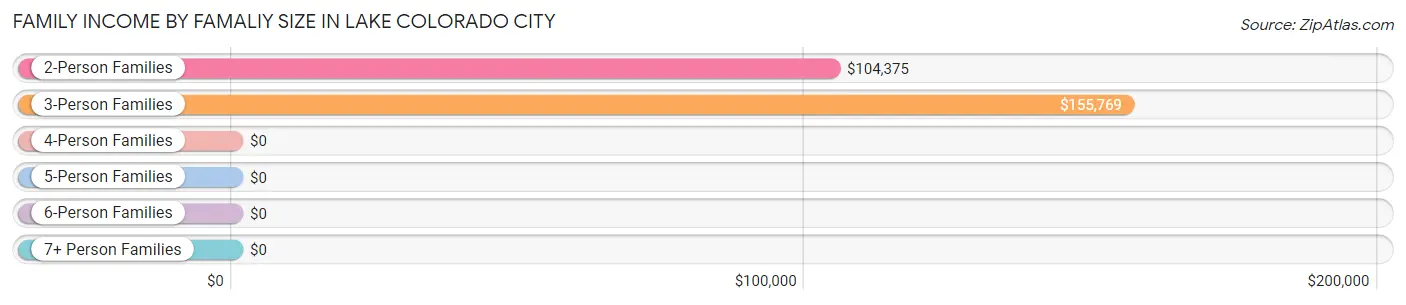
| Income Bracket | # Families | Median Income |
| 2-Person Families | 63 (43.1%) | $104,375 |
| 3-Person Families | 36 (24.7%) | $155,769 |
| 4-Person Families | 24 (16.4%) | $0 |
| 5-Person Families | 17 (11.6%) | $0 |
| 6-Person Families | 6 (4.1%) | $0 |
| 7+ Person Families | 0 (0.0%) | $0 |
| Total | 146 (100.0%) | $152,500 |
Family Income by Number of Earners in Lake Colorado City
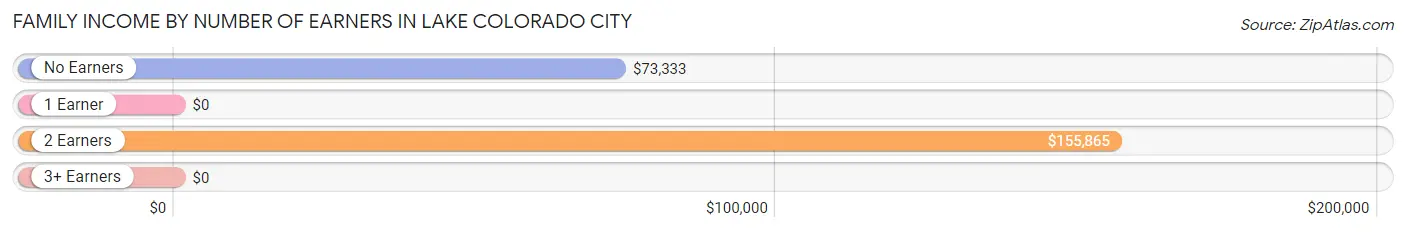
| Number of Earners | # Families | Median Income |
| No Earners | 8 (5.5%) | $73,333 |
| 1 Earner | 40 (27.4%) | $0 |
| 2 Earners | 94 (64.4%) | $155,865 |
| 3+ Earners | 4 (2.7%) | $0 |
| Total | 146 (100.0%) | $152,500 |
Household Income in Lake Colorado City
Household Income Brackets in Lake Colorado City
With 57 households falling in the category, the $50,000 to $74,999 income range is the most frequent in Lake Colorado City, accounting for 21.9% of all households. In contrast, only 9 households (3.5%) fall into the less than $10,000 income bracket, making it the least populous group.
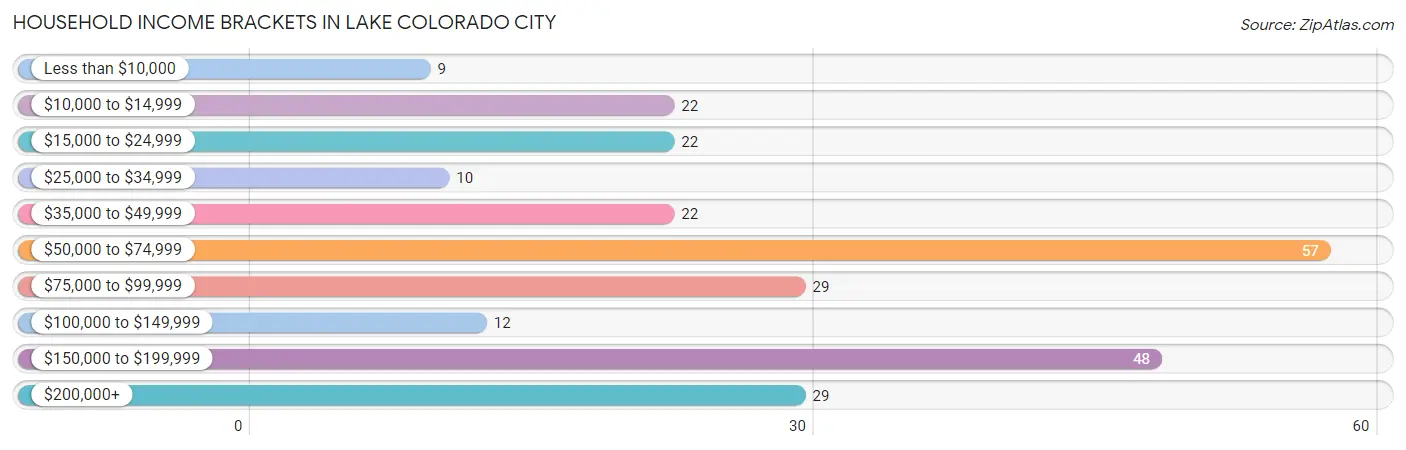
| Income Bracket | # Households | % Households |
| Less than $10,000 | 9 | 3.5% |
| $10,000 to $14,999 | 22 | 8.5% |
| $15,000 to $24,999 | 22 | 8.5% |
| $25,000 to $34,999 | 10 | 3.8% |
| $35,000 to $49,999 | 22 | 8.5% |
| $50,000 to $74,999 | 57 | 21.9% |
| $75,000 to $99,999 | 29 | 11.2% |
| $100,000 to $149,999 | 12 | 4.6% |
| $150,000 to $199,999 | 48 | 18.5% |
| $200,000+ | 29 | 11.2% |
Household Income by Householder Age in Lake Colorado City
The median household income in Lake Colorado City is $65,000, with the highest median household income of $80,938 found in the 45 to 64 years age bracket for the primary householder. A total of 137 households (52.7%) fall into this category.
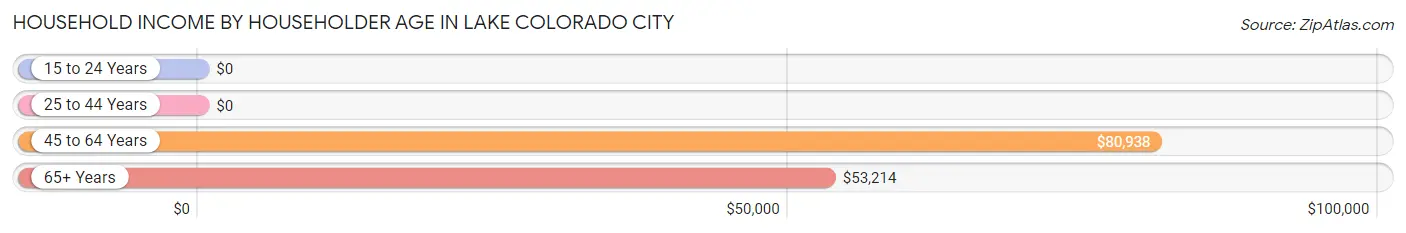
| Income Bracket | # Households | Median Income |
| 15 to 24 Years | 0 (0.0%) | $0 |
| 25 to 44 Years | 59 (22.7%) | $0 |
| 45 to 64 Years | 137 (52.7%) | $80,938 |
| 65+ Years | 64 (24.6%) | $53,214 |
| Total | 260 (100.0%) | $65,000 |
Poverty in Lake Colorado City
Income Below Poverty by Sex and Age in Lake Colorado City
With 31.6% poverty level for males and 7.9% for females among the residents of Lake Colorado City, 45 to 54 year old males and 55 to 64 year old females are the most vulnerable to poverty, with 80 males (58.0%) and 24 females (25.0%) in their respective age groups living below the poverty level.
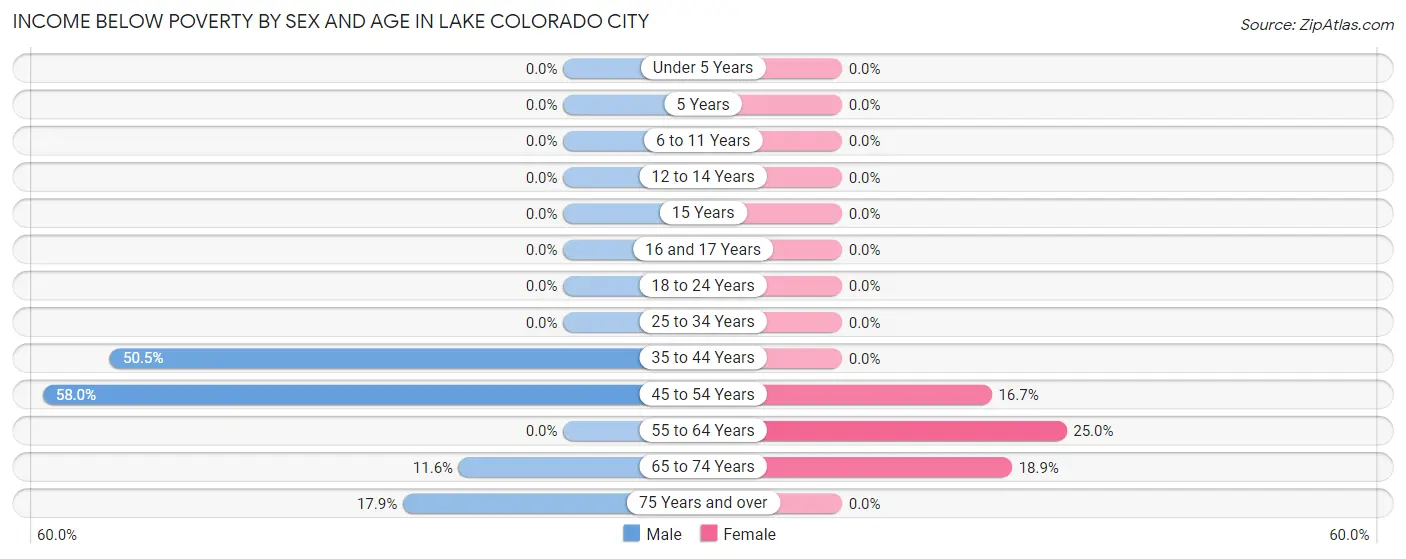
| Age Bracket | Male | Female |
| Under 5 Years | 0 (0.0%) | 0 (0.0%) |
| 5 Years | 0 (0.0%) | 0 (0.0%) |
| 6 to 11 Years | 0 (0.0%) | 0 (0.0%) |
| 12 to 14 Years | 0 (0.0%) | 0 (0.0%) |
| 15 Years | 0 (0.0%) | 0 (0.0%) |
| 16 and 17 Years | 0 (0.0%) | 0 (0.0%) |
| 18 to 24 Years | 0 (0.0%) | 0 (0.0%) |
| 25 to 34 Years | 0 (0.0%) | 0 (0.0%) |
| 35 to 44 Years | 53 (50.5%) | 0 (0.0%) |
| 45 to 54 Years | 80 (58.0%) | 4 (16.7%) |
| 55 to 64 Years | 0 (0.0%) | 24 (25.0%) |
| 65 to 74 Years | 5 (11.6%) | 7 (18.9%) |
| 75 Years and over | 5 (17.9%) | 0 (0.0%) |
| Total | 143 (31.6%) | 35 (7.9%) |
Income Above Poverty by Sex and Age in Lake Colorado City
According to the poverty statistics in Lake Colorado City, males aged 6 to 11 years and females aged 6 to 11 years are the age groups that are most secure financially, with 100.0% of males and 100.0% of females in these age groups living above the poverty line.
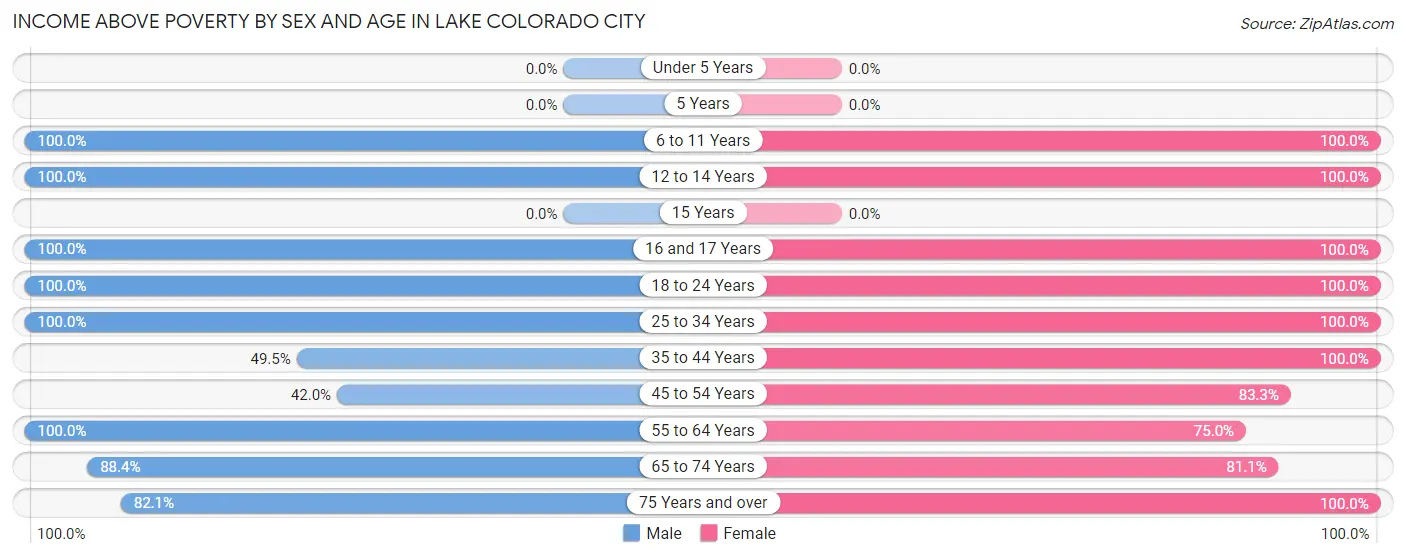
| Age Bracket | Male | Female |
| Under 5 Years | 0 (0.0%) | 0 (0.0%) |
| 5 Years | 0 (0.0%) | 0 (0.0%) |
| 6 to 11 Years | 5 (100.0%) | 20 (100.0%) |
| 12 to 14 Years | 5 (100.0%) | 23 (100.0%) |
| 15 Years | 0 (0.0%) | 0 (0.0%) |
| 16 and 17 Years | 21 (100.0%) | 14 (100.0%) |
| 18 to 24 Years | 46 (100.0%) | 162 (100.0%) |
| 25 to 34 Years | 11 (100.0%) | 2 (100.0%) |
| 35 to 44 Years | 52 (49.5%) | 23 (100.0%) |
| 45 to 54 Years | 58 (42.0%) | 20 (83.3%) |
| 55 to 64 Years | 51 (100.0%) | 72 (75.0%) |
| 65 to 74 Years | 38 (88.4%) | 30 (81.1%) |
| 75 Years and over | 23 (82.1%) | 44 (100.0%) |
| Total | 310 (68.4%) | 410 (92.1%) |
Income Below Poverty Among Married-Couple Families in Lake Colorado City
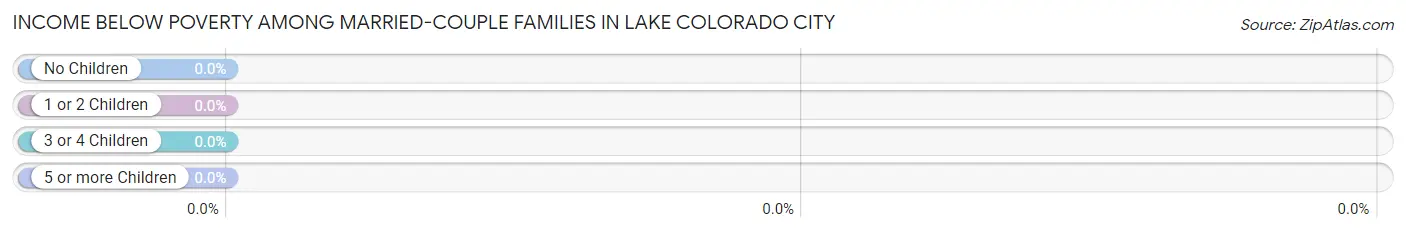
| Children | Above Poverty | Below Poverty |
| No Children | 91 (100.0%) | 0 (0.0%) |
| 1 or 2 Children | 28 (100.0%) | 0 (0.0%) |
| 3 or 4 Children | 23 (100.0%) | 0 (0.0%) |
| 5 or more Children | 0 (0.0%) | 0 (0.0%) |
| Total | 142 (100.0%) | 0 (0.0%) |
Income Below Poverty Among Single-Parent Households in Lake Colorado City
| Children | Single Father | Single Mother |
| No Children | 0 (0.0%) | 0 (0.0%) |
| 1 or 2 Children | 0 (0.0%) | 0 (0.0%) |
| 3 or 4 Children | 0 (0.0%) | 0 (0.0%) |
| 5 or more Children | 0 (0.0%) | 0 (0.0%) |
| Total | 0 (0.0%) | 0 (0.0%) |
Income Below Poverty Among Married-Couple vs Single-Parent Households in Lake Colorado City
| Children | Married-Couple Families | Single-Parent Households |
| No Children | 0 (0.0%) | 0 (0.0%) |
| 1 or 2 Children | 0 (0.0%) | 0 (0.0%) |
| 3 or 4 Children | 0 (0.0%) | 0 (0.0%) |
| 5 or more Children | 0 (0.0%) | 0 (0.0%) |
| Total | 0 (0.0%) | 0 (0.0%) |
Race in Lake Colorado City
The most populous races in Lake Colorado City are White / Caucasian (555 | 61.5%), Hispanic or Latino (256 | 28.3%), and Some other Race (204 | 22.6%).
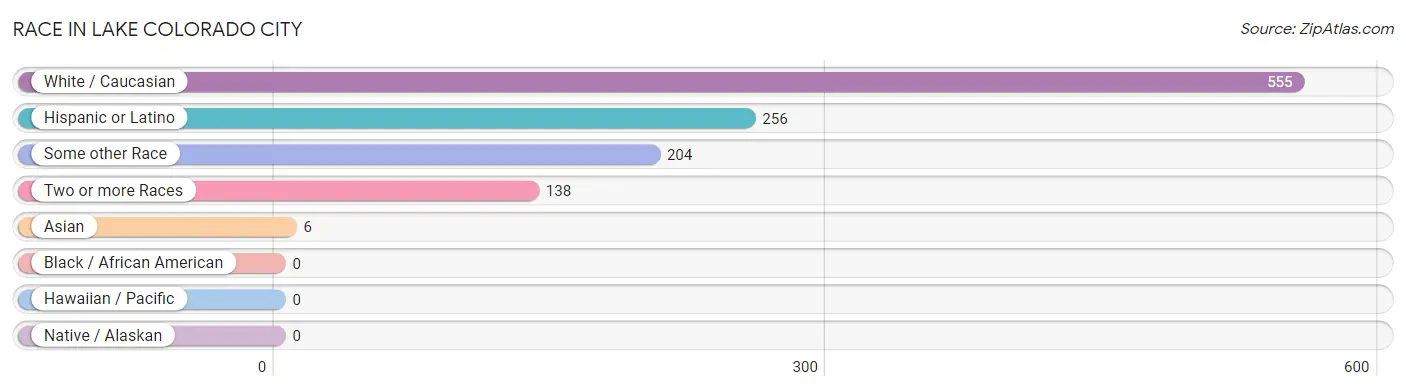
| Race | # Population | % Population |
| Asian | 6 | 0.7% |
| Black / African American | 0 | 0.0% |
| Hawaiian / Pacific | 0 | 0.0% |
| Hispanic or Latino | 256 | 28.3% |
| Native / Alaskan | 0 | 0.0% |
| White / Caucasian | 555 | 61.5% |
| Two or more Races | 138 | 15.3% |
| Some other Race | 204 | 22.6% |
| Total | 903 | 100.0% |
Ancestry in Lake Colorado City
The most populous ancestries reported in Lake Colorado City are German (392 | 43.4%), Mexican (102 | 11.3%), Irish (87 | 9.6%), English (68 | 7.5%), and American (49 | 5.4%), together accounting for 77.3% of all Lake Colorado City residents.
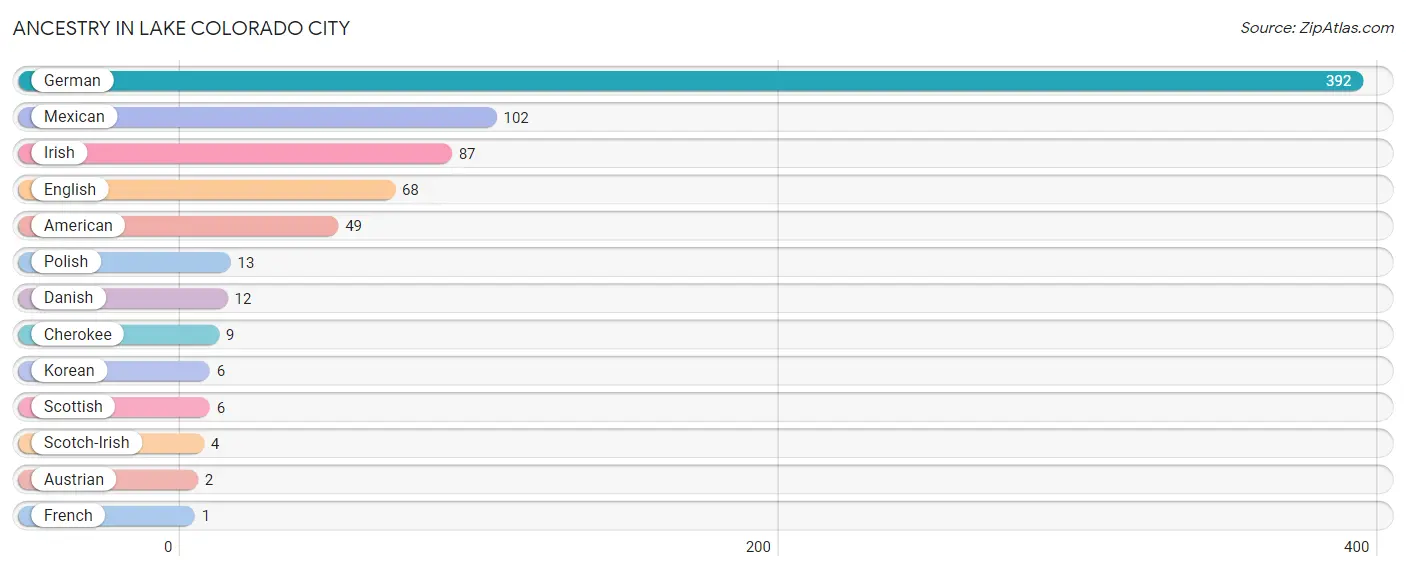
| Ancestry | # Population | % Population |
| American | 49 | 5.4% |
| Austrian | 2 | 0.2% |
| Cherokee | 9 | 1.0% |
| Danish | 12 | 1.3% |
| English | 68 | 7.5% |
| French | 1 | 0.1% |
| German | 392 | 43.4% |
| Irish | 87 | 9.6% |
| Korean | 6 | 0.7% |
| Mexican | 102 | 11.3% |
| Polish | 13 | 1.4% |
| Scotch-Irish | 4 | 0.4% |
| Scottish | 6 | 0.7% | View All 13 Rows |
Immigrants in Lake Colorado City
The most numerous immigrant groups reported in Lake Colorado City came from Asia (6 | 0.7%), Philippines (6 | 0.7%), and South Eastern Asia (6 | 0.7%), together accounting for 2.0% of all Lake Colorado City residents.
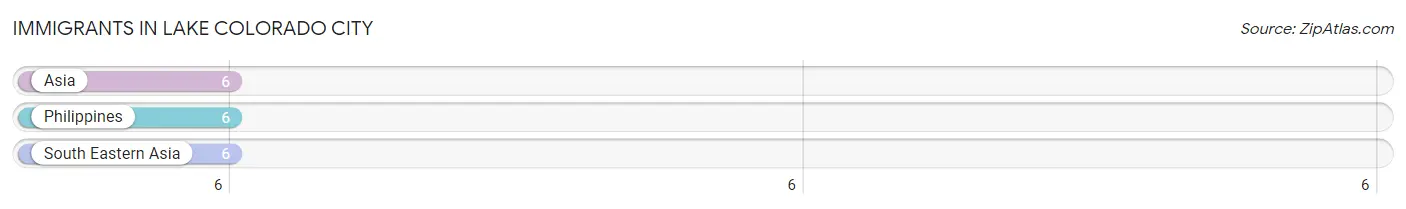
| Immigration Origin | # Population | % Population |
| Asia | 6 | 0.7% |
| Philippines | 6 | 0.7% |
| South Eastern Asia | 6 | 0.7% | View All 3 Rows |
Sex and Age in Lake Colorado City
Sex and Age in Lake Colorado City
The most populous age groups in Lake Colorado City are 45 to 49 Years (118 | 25.8%) for men and 20 to 24 Years (162 | 36.4%) for women.
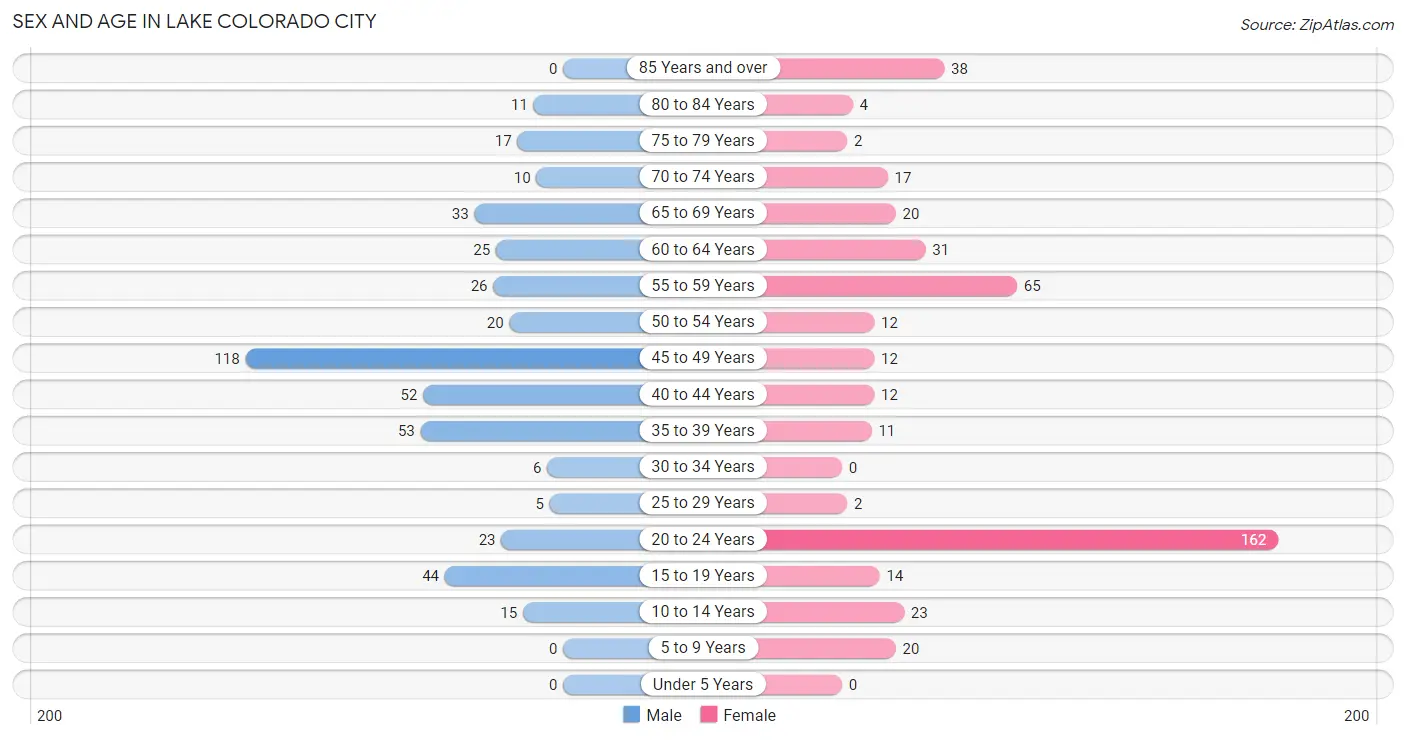
| Age Bracket | Male | Female |
| Under 5 Years | 0 (0.0%) | 0 (0.0%) |
| 5 to 9 Years | 0 (0.0%) | 20 (4.5%) |
| 10 to 14 Years | 15 (3.3%) | 23 (5.2%) |
| 15 to 19 Years | 44 (9.6%) | 14 (3.2%) |
| 20 to 24 Years | 23 (5.0%) | 162 (36.4%) |
| 25 to 29 Years | 5 (1.1%) | 2 (0.4%) |
| 30 to 34 Years | 6 (1.3%) | 0 (0.0%) |
| 35 to 39 Years | 53 (11.6%) | 11 (2.5%) |
| 40 to 44 Years | 52 (11.4%) | 12 (2.7%) |
| 45 to 49 Years | 118 (25.8%) | 12 (2.7%) |
| 50 to 54 Years | 20 (4.4%) | 12 (2.7%) |
| 55 to 59 Years | 26 (5.7%) | 65 (14.6%) |
| 60 to 64 Years | 25 (5.5%) | 31 (7.0%) |
| 65 to 69 Years | 33 (7.2%) | 20 (4.5%) |
| 70 to 74 Years | 10 (2.2%) | 17 (3.8%) |
| 75 to 79 Years | 17 (3.7%) | 2 (0.4%) |
| 80 to 84 Years | 11 (2.4%) | 4 (0.9%) |
| 85 Years and over | 0 (0.0%) | 38 (8.5%) |
| Total | 458 (100.0%) | 445 (100.0%) |
Families and Households in Lake Colorado City
Median Family Size in Lake Colorado City
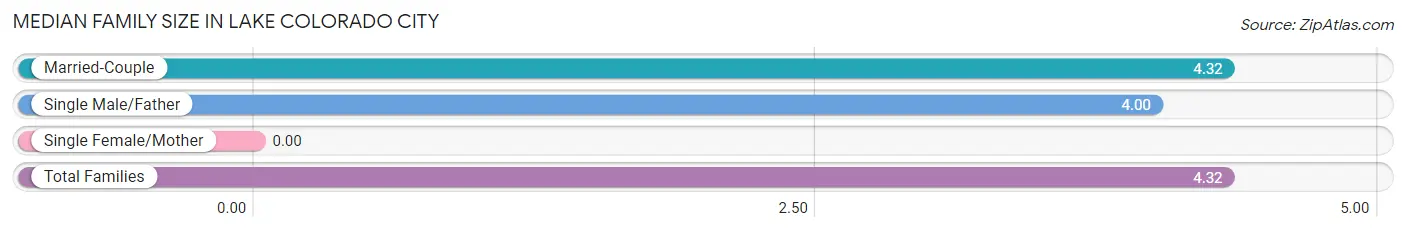
| Family Type | # Families | Family Size |
| Married-Couple | 142 (97.3%) | 4.32 |
| Single Male/Father | 4 (2.7%) | 4.00 |
| Single Female/Mother | 0 (0.0%) | - |
| Total Families | 146 (100.0%) | 4.32 |
Median Household Size in Lake Colorado City
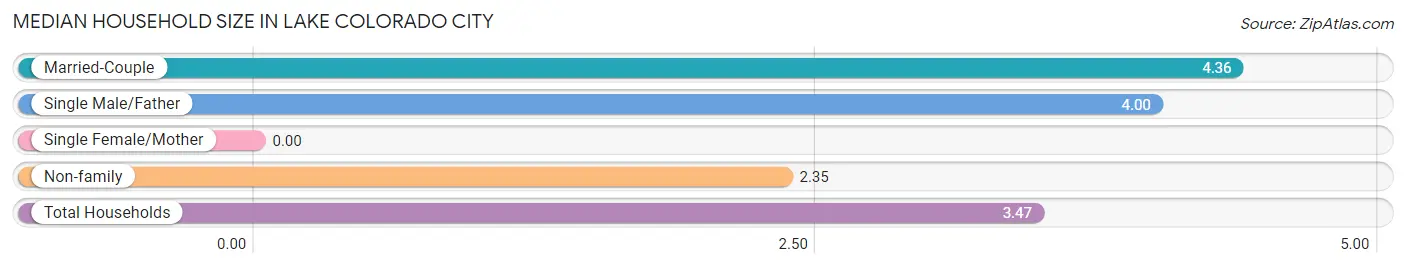
| Household Type | # Households | Household Size |
| Married-Couple | 142 (54.6%) | 4.36 |
| Single Male/Father | 4 (1.5%) | 4.00 |
| Single Female/Mother | 0 (0.0%) | - |
| Non-family | 114 (43.9%) | 2.35 |
| Total Households | 260 (100.0%) | 3.47 |
Household Size by Marriage Status in Lake Colorado City
Out of a total of 260 households in Lake Colorado City, 146 (56.1%) are family households, while 114 (43.9%) are nonfamily households. The most numerous type of family households are 2-person households, comprising 63, and the most common type of nonfamily households are 2-person households, comprising 67.
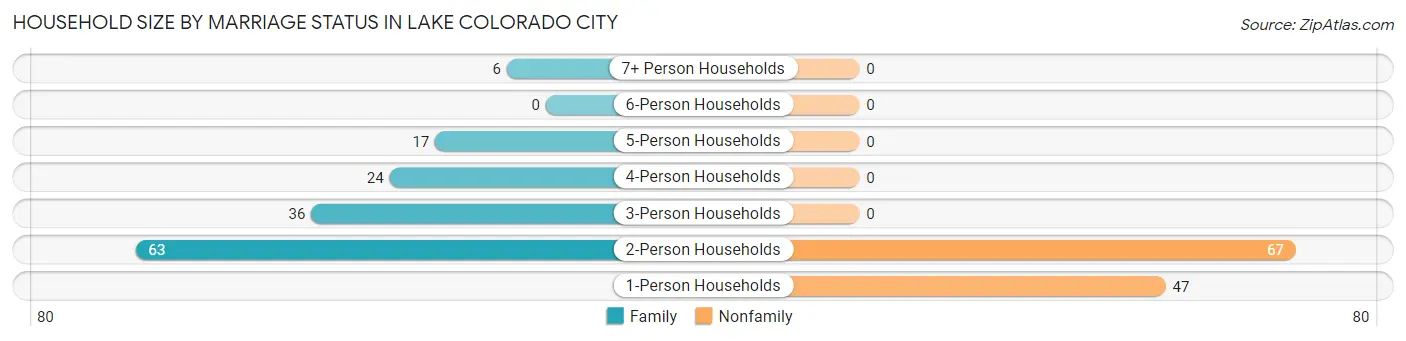
| Household Size | Family Households | Nonfamily Households |
| 1-Person Households | - | 47 (18.1%) |
| 2-Person Households | 63 (24.2%) | 67 (25.8%) |
| 3-Person Households | 36 (13.9%) | 0 (0.0%) |
| 4-Person Households | 24 (9.2%) | 0 (0.0%) |
| 5-Person Households | 17 (6.5%) | 0 (0.0%) |
| 6-Person Households | 0 (0.0%) | 0 (0.0%) |
| 7+ Person Households | 6 (2.3%) | 0 (0.0%) |
| Total | 146 (56.1%) | 114 (43.9%) |
Female Fertility in Lake Colorado City
Fertility by Age in Lake Colorado City
| Age Bracket | Women with Births | Births / 1,000 Women |
| 15 to 19 years | 0 (0.0%) | 0.0 |
| 20 to 34 years | 0 (0.0%) | 0.0 |
| 35 to 50 years | 0 (0.0%) | 0.0 |
| Total | 0 (0.0%) | 0.0 |
Fertility by Age by Marriage Status in Lake Colorado City
| Age Bracket | Married | Unmarried |
| 15 to 19 years | 0 (0.0%) | 0 (0.0%) |
| 20 to 34 years | 0 (0.0%) | 0 (0.0%) |
| 35 to 50 years | 0 (0.0%) | 0 (0.0%) |
| Total | 0 (0.0%) | 0 (0.0%) |
Fertility by Education in Lake Colorado City
| Educational Attainment | Women with Births | Births / 1,000 Women |
| Less than High School | 0 (0.0%) | 0.0 |
| High School Diploma | 0 (0.0%) | 0.0 |
| College or Associate's Degree | 0 (0.0%) | 0.0 |
| Bachelor's Degree | 0 (0.0%) | 0.0 |
| Graduate Degree | 0 (0.0%) | 0.0 |
| Total | 0 (0.0%) | 0.0 |
Fertility by Education by Marriage Status in Lake Colorado City
| Educational Attainment | Married | Unmarried |
| Less than High School | 0 (0.0%) | 0 (0.0%) |
| High School Diploma | 0 (0.0%) | 0 (0.0%) |
| College or Associate's Degree | 0 (0.0%) | 0 (0.0%) |
| Bachelor's Degree | 0 (0.0%) | 0 (0.0%) |
| Graduate Degree | 0 (0.0%) | 0 (0.0%) |
| Total | 0 (0.0%) | 0 (0.0%) |
Employment Characteristics in Lake Colorado City
Employment by Class of Employer in Lake Colorado City
Among the 585 employed individuals in Lake Colorado City, private company employees (418 | 71.5%), self-employed (not incorporated) (108 | 18.5%), and federal government employees (30 | 5.1%) make up the most common classes of employment.
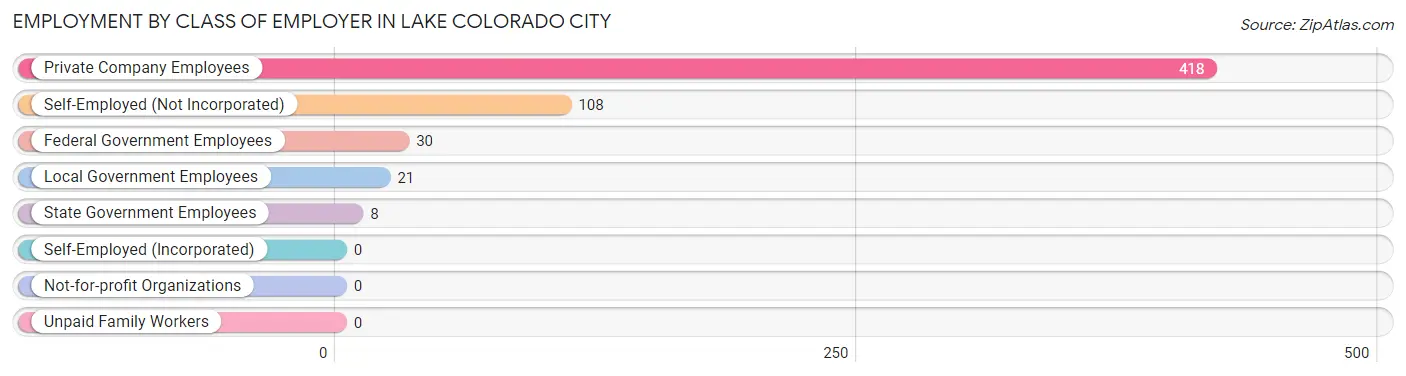
| Employer Class | # Employees | % Employees |
| Private Company Employees | 418 | 71.5% |
| Self-Employed (Incorporated) | 0 | 0.0% |
| Self-Employed (Not Incorporated) | 108 | 18.5% |
| Not-for-profit Organizations | 0 | 0.0% |
| Local Government Employees | 21 | 3.6% |
| State Government Employees | 8 | 1.4% |
| Federal Government Employees | 30 | 5.1% |
| Unpaid Family Workers | 0 | 0.0% |
| Total | 585 | 100.0% |
Employment Status by Age in Lake Colorado City
According to the labor force statistics for Lake Colorado City, out of the total population over 16 years of age (845), 70.2% or 593 individuals are in the labor force, with 1.3% or 8 of them unemployed. The age group with the highest labor force participation rate is 30 to 34 years, with 100.0% or 6 individuals in the labor force. Within the labor force, the 45 to 54 years age range has the highest percentage of unemployed individuals, with 5.9% or 8 of them being unemployed.
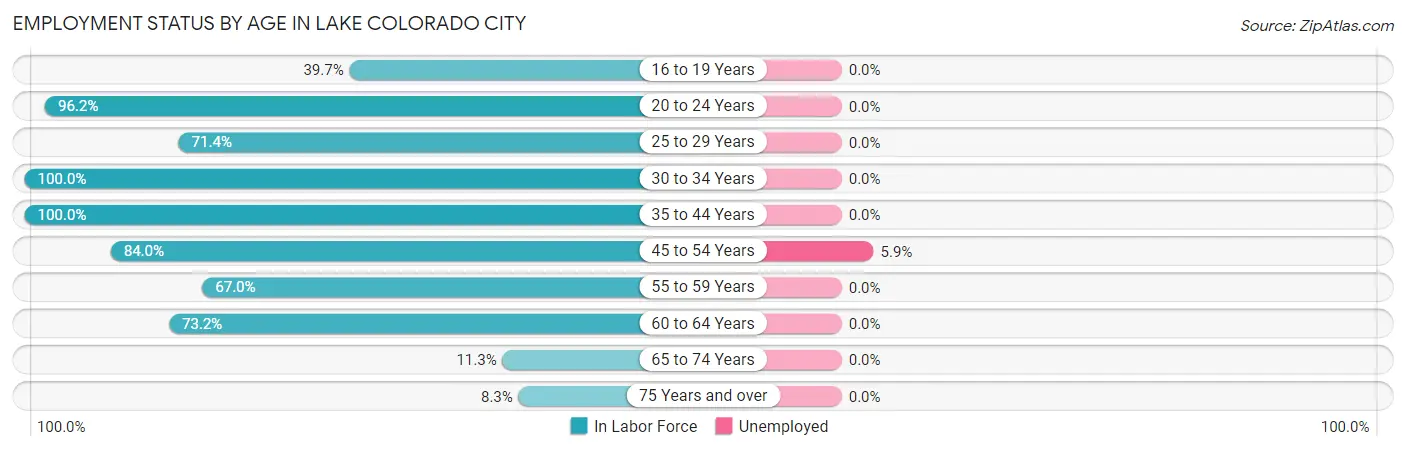
| Age Bracket | In Labor Force | Unemployed |
| 16 to 19 Years | 23 (39.7%) | 0 (0.0%) |
| 20 to 24 Years | 178 (96.2%) | 0 (0.0%) |
| 25 to 29 Years | 5 (71.4%) | 0 (0.0%) |
| 30 to 34 Years | 6 (100.0%) | 0 (0.0%) |
| 35 to 44 Years | 128 (100.0%) | 0 (0.0%) |
| 45 to 54 Years | 136 (84.0%) | 8 (5.9%) |
| 55 to 59 Years | 61 (67.0%) | 0 (0.0%) |
| 60 to 64 Years | 41 (73.2%) | 0 (0.0%) |
| 65 to 74 Years | 9 (11.3%) | 0 (0.0%) |
| 75 Years and over | 6 (8.3%) | 0 (0.0%) |
| Total | 593 (70.2%) | 8 (1.3%) |
Employment Status by Educational Attainment in Lake Colorado City
According to labor force statistics for Lake Colorado City, 83.8% of individuals (377) out of the total population between 25 and 64 years of age (450) are in the labor force, with 2.1% or 8 of them being unemployed. The group with the highest labor force participation rate are those with the educational attainment of bachelor's degree or higher, with 100.0% or 33 individuals in the labor force. Within the labor force, individuals with college / associate degree education have the highest percentage of unemployment, with 7.0% or 8 of them being unemployed.
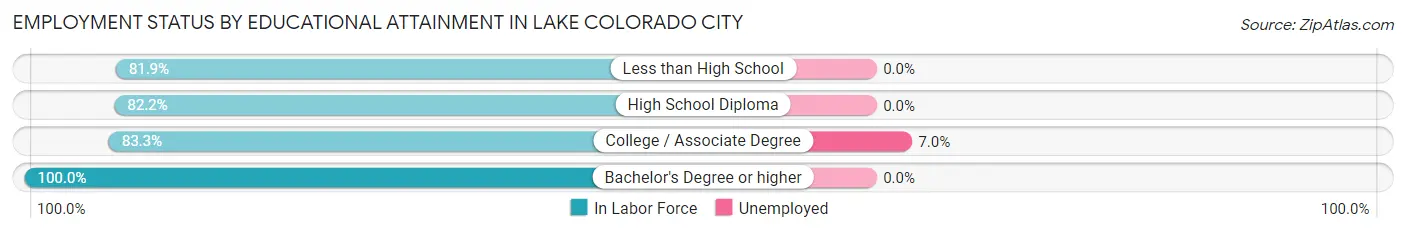
| Educational Attainment | In Labor Force | Unemployed |
| Less than High School | 95 (81.9%) | 0 (0.0%) |
| High School Diploma | 134 (82.2%) | 0 (0.0%) |
| College / Associate Degree | 115 (83.3%) | 10 (7.0%) |
| Bachelor's Degree or higher | 33 (100.0%) | 0 (0.0%) |
| Total | 377 (83.8%) | 9 (2.1%) |
Employment Occupations by Sex in Lake Colorado City
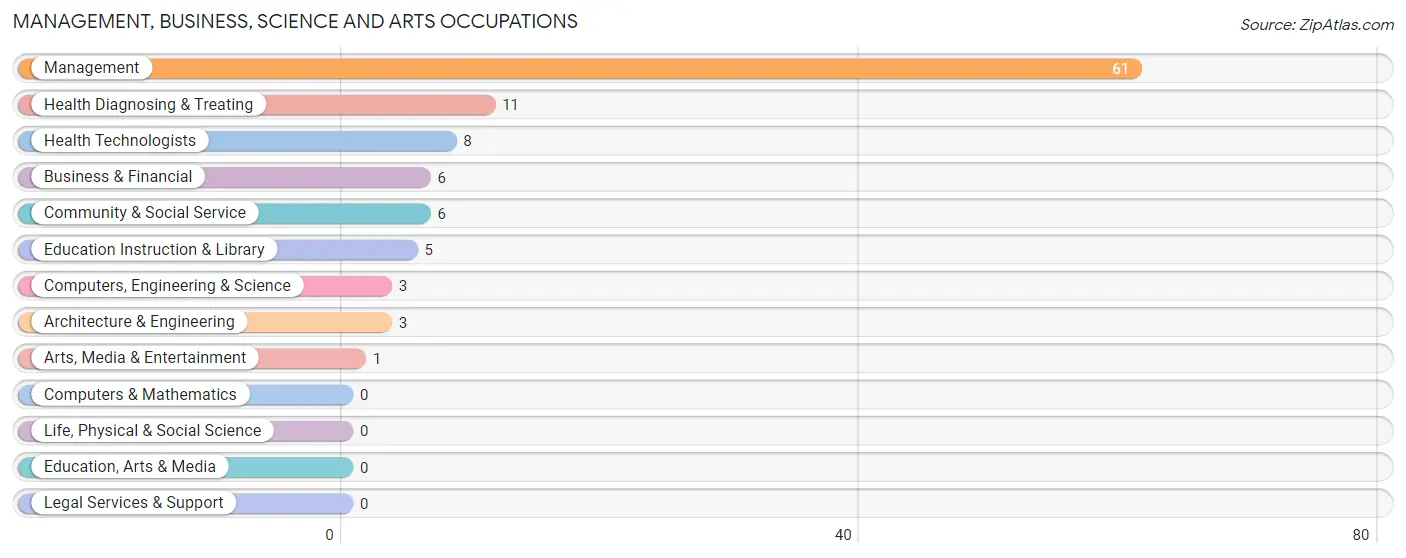
Management, Business, Science and Arts Occupations
The most common Management, Business, Science and Arts occupations in Lake Colorado City are Management (61 | 10.4%), Health Diagnosing & Treating (11 | 1.9%), Health Technologists (8 | 1.4%), Business & Financial (6 | 1.0%), and Community & Social Service (6 | 1.0%).
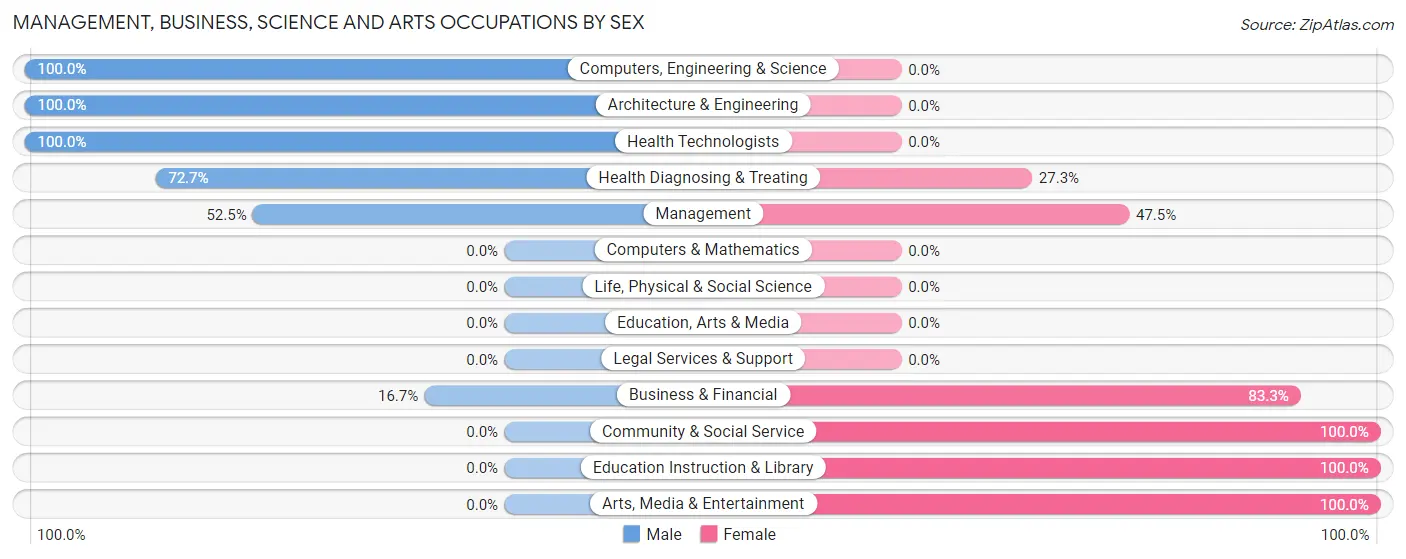
Management, Business, Science and Arts Occupations by Sex
Within the Management, Business, Science and Arts occupations in Lake Colorado City, the most male-oriented occupations are Computers, Engineering & Science (100.0%), Architecture & Engineering (100.0%), and Health Technologists (100.0%), while the most female-oriented occupations are Community & Social Service (100.0%), Education Instruction & Library (100.0%), and Arts, Media & Entertainment (100.0%).
| Occupation | Male | Female |
| Management | 32 (52.5%) | 29 (47.5%) |
| Business & Financial | 1 (16.7%) | 5 (83.3%) |
| Computers, Engineering & Science | 3 (100.0%) | 0 (0.0%) |
| Computers & Mathematics | 0 (0.0%) | 0 (0.0%) |
| Architecture & Engineering | 3 (100.0%) | 0 (0.0%) |
| Life, Physical & Social Science | 0 (0.0%) | 0 (0.0%) |
| Community & Social Service | 0 (0.0%) | 6 (100.0%) |
| Education, Arts & Media | 0 (0.0%) | 0 (0.0%) |
| Legal Services & Support | 0 (0.0%) | 0 (0.0%) |
| Education Instruction & Library | 0 (0.0%) | 5 (100.0%) |
| Arts, Media & Entertainment | 0 (0.0%) | 1 (100.0%) |
| Health Diagnosing & Treating | 8 (72.7%) | 3 (27.3%) |
| Health Technologists | 8 (100.0%) | 0 (0.0%) |
| Total (Category) | 44 (50.6%) | 43 (49.4%) |
| Total (Overall) | 342 (58.5%) | 243 (41.5%) |
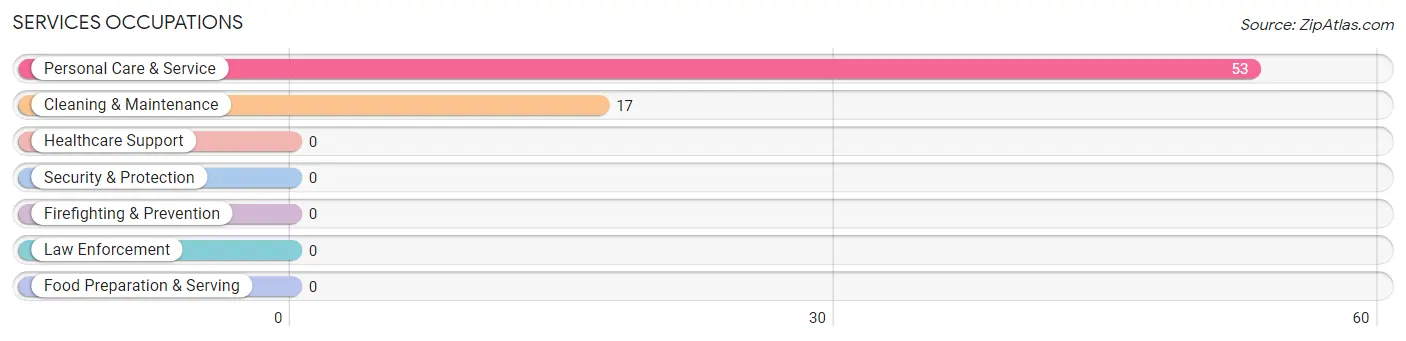
Services Occupations
The most common Services occupations in Lake Colorado City are Personal Care & Service (53 | 9.1%), and Cleaning & Maintenance (17 | 2.9%).
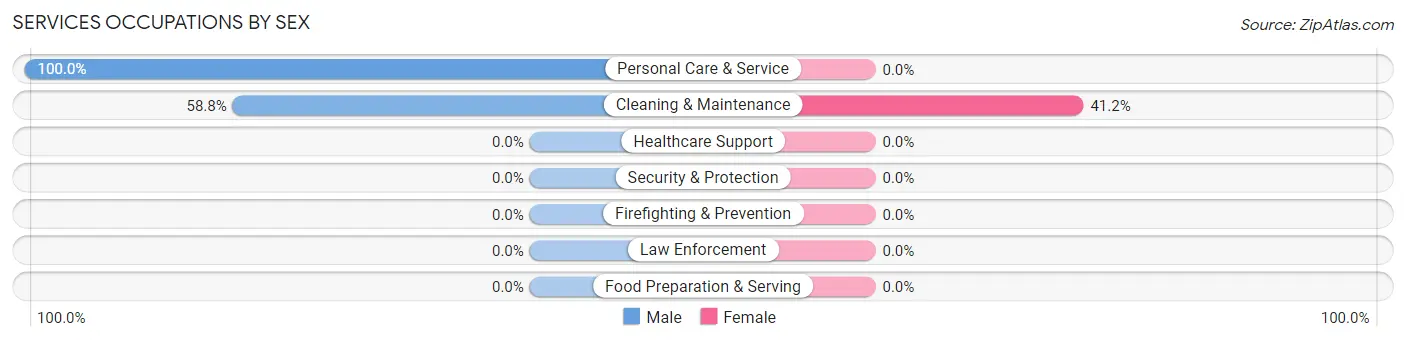
Services Occupations by Sex
| Occupation | Male | Female |
| Healthcare Support | 0 (0.0%) | 0 (0.0%) |
| Security & Protection | 0 (0.0%) | 0 (0.0%) |
| Firefighting & Prevention | 0 (0.0%) | 0 (0.0%) |
| Law Enforcement | 0 (0.0%) | 0 (0.0%) |
| Food Preparation & Serving | 0 (0.0%) | 0 (0.0%) |
| Cleaning & Maintenance | 10 (58.8%) | 7 (41.2%) |
| Personal Care & Service | 53 (100.0%) | 0 (0.0%) |
| Total (Category) | 63 (90.0%) | 7 (10.0%) |
| Total (Overall) | 342 (58.5%) | 243 (41.5%) |
Sales and Office Occupations
The most common Sales and Office occupations in Lake Colorado City are Office & Administration (47 | 8.0%), and Sales & Related (35 | 6.0%).
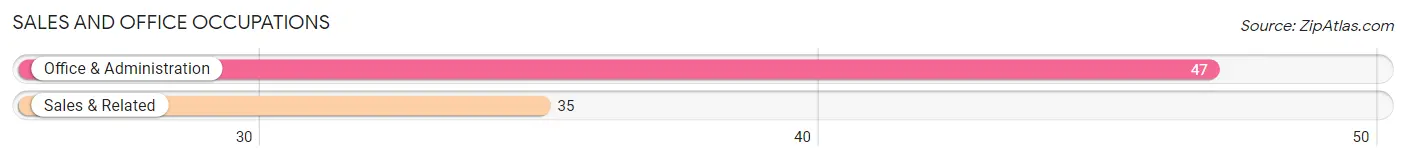
Sales and Office Occupations by Sex

| Occupation | Male | Female |
| Sales & Related | 35 (100.0%) | 0 (0.0%) |
| Office & Administration | 6 (12.8%) | 41 (87.2%) |
| Total (Category) | 41 (50.0%) | 41 (50.0%) |
| Total (Overall) | 342 (58.5%) | 243 (41.5%) |
Natural Resources, Construction and Maintenance Occupations
The most common Natural Resources, Construction and Maintenance occupations in Lake Colorado City are Construction & Extraction (141 | 24.1%), and Installation, Maintenance & Repair (48 | 8.2%).
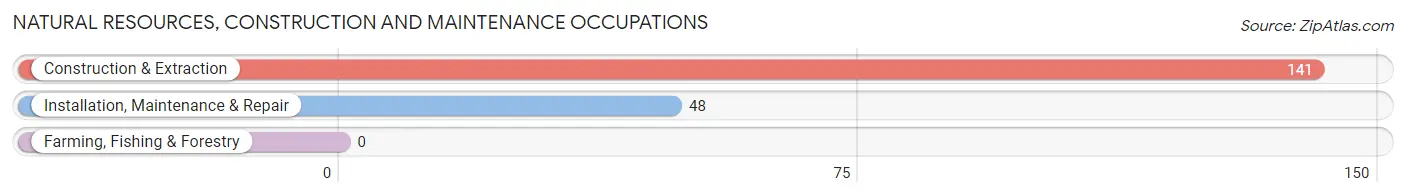
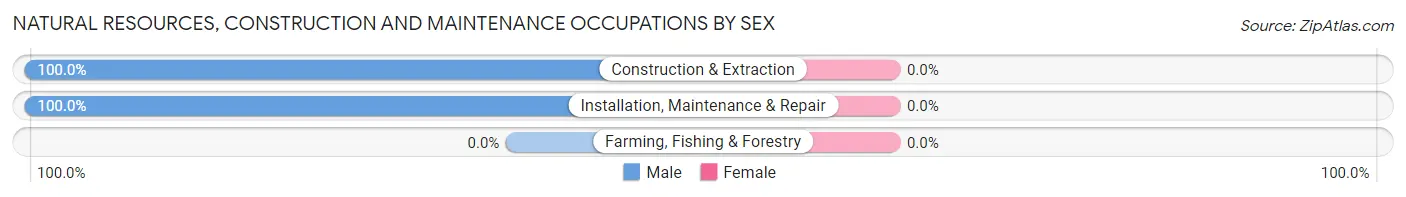
Natural Resources, Construction and Maintenance Occupations by Sex
| Occupation | Male | Female |
| Farming, Fishing & Forestry | 0 (0.0%) | 0 (0.0%) |
| Construction & Extraction | 141 (100.0%) | 0 (0.0%) |
| Installation, Maintenance & Repair | 48 (100.0%) | 0 (0.0%) |
| Total (Category) | 189 (100.0%) | 0 (0.0%) |
| Total (Overall) | 342 (58.5%) | 243 (41.5%) |
Production, Transportation and Moving Occupations
The most common Production, Transportation and Moving occupations in Lake Colorado City are Material Moving (152 | 26.0%), Transportation (4 | 0.7%), and Production (1 | 0.2%).
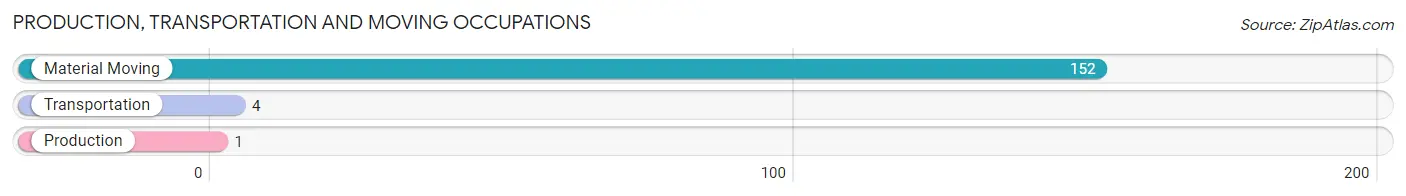
Production, Transportation and Moving Occupations by Sex
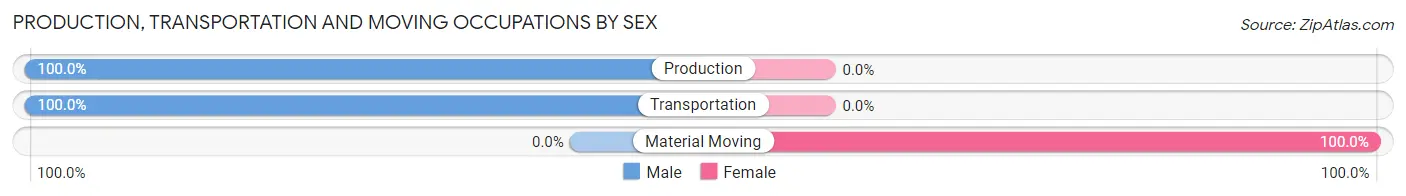
| Occupation | Male | Female |
| Production | 1 (100.0%) | 0 (0.0%) |
| Transportation | 4 (100.0%) | 0 (0.0%) |
| Material Moving | 0 (0.0%) | 152 (100.0%) |
| Total (Category) | 5 (3.2%) | 152 (96.8%) |
| Total (Overall) | 342 (58.5%) | 243 (41.5%) |
Employment Industries by Sex in Lake Colorado City
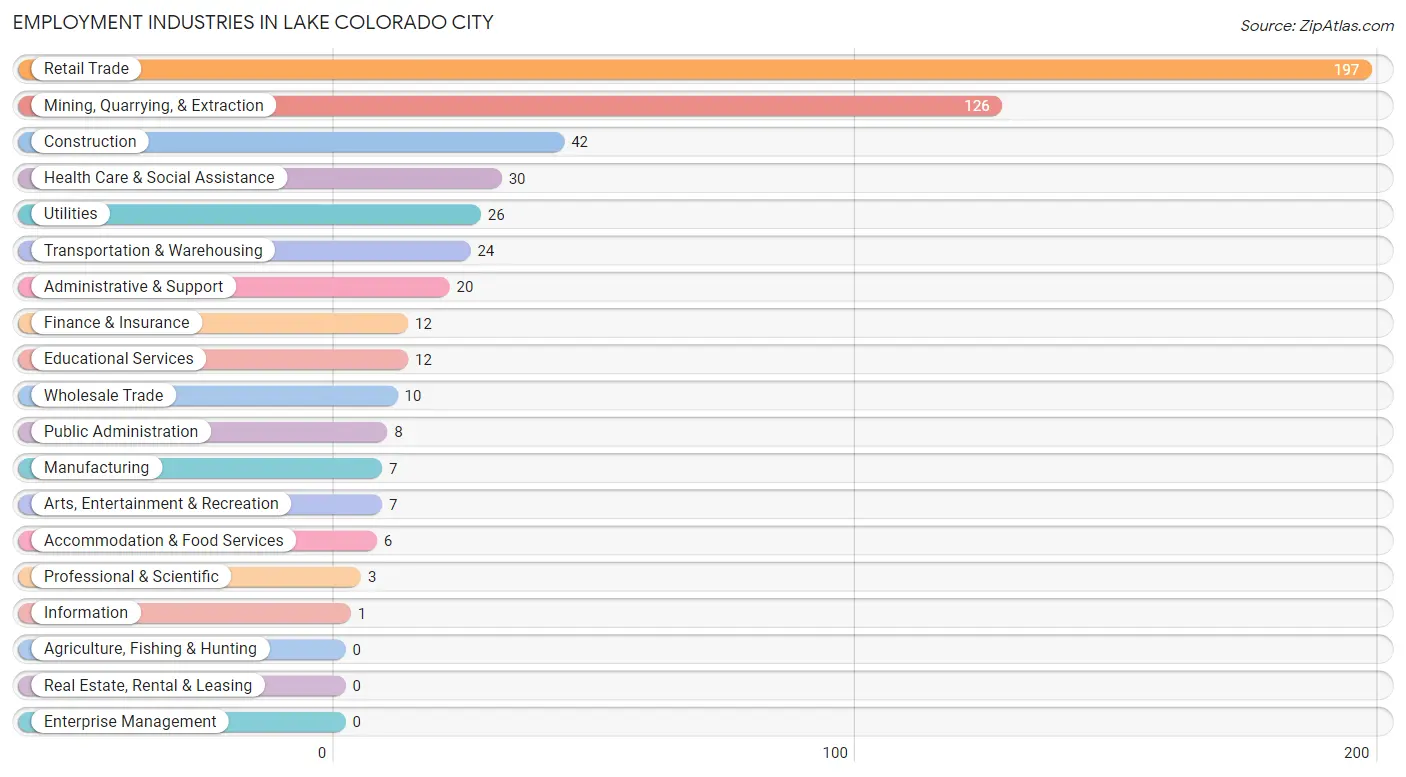
Employment Industries in Lake Colorado City
The major employment industries in Lake Colorado City include Retail Trade (197 | 33.7%), Mining, Quarrying, & Extraction (126 | 21.5%), Construction (42 | 7.2%), Health Care & Social Assistance (30 | 5.1%), and Utilities (26 | 4.4%).
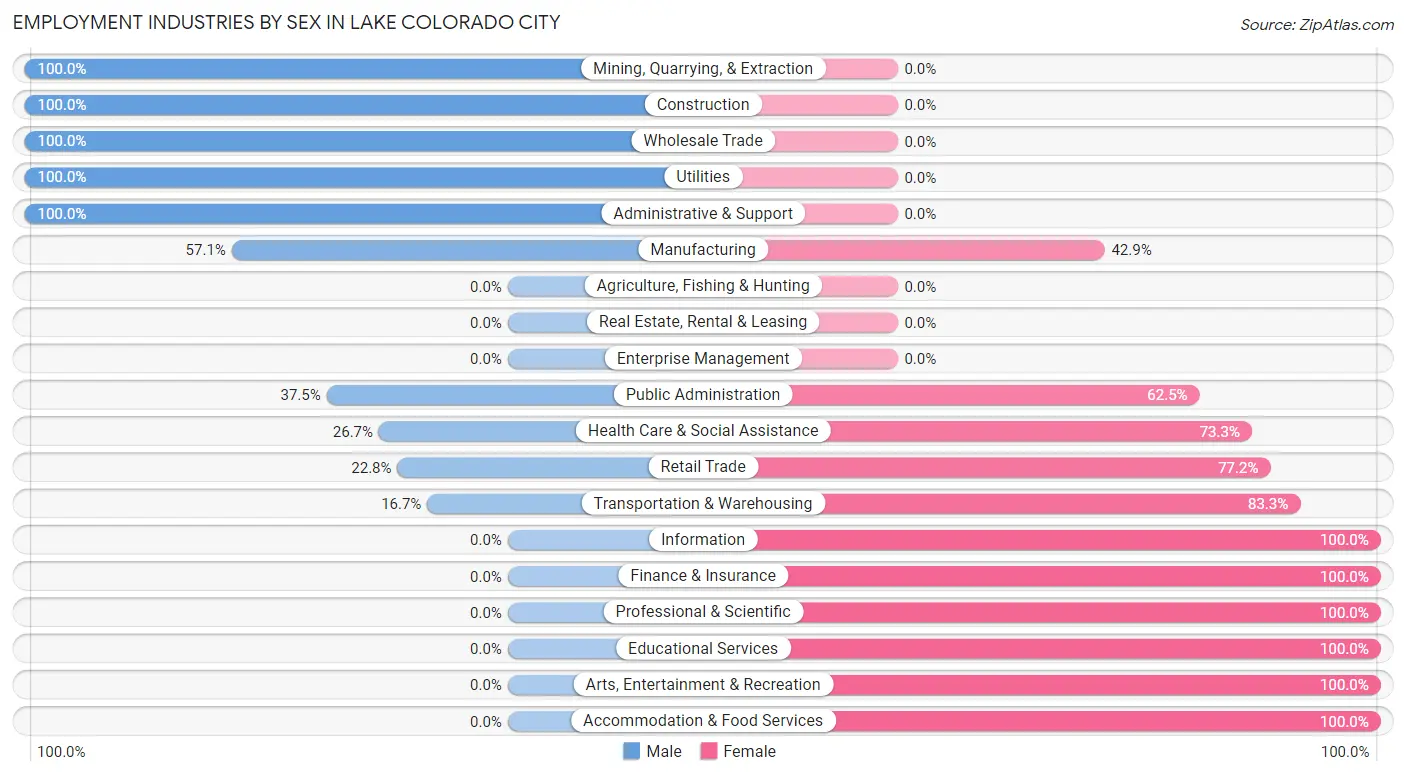
Employment Industries by Sex in Lake Colorado City
The Lake Colorado City industries that see more men than women are Mining, Quarrying, & Extraction (100.0%), Construction (100.0%), and Wholesale Trade (100.0%), whereas the industries that tend to have a higher number of women are Information (100.0%), Finance & Insurance (100.0%), and Professional & Scientific (100.0%).
| Industry | Male | Female |
| Agriculture, Fishing & Hunting | 0 (0.0%) | 0 (0.0%) |
| Mining, Quarrying, & Extraction | 126 (100.0%) | 0 (0.0%) |
| Construction | 42 (100.0%) | 0 (0.0%) |
| Manufacturing | 4 (57.1%) | 3 (42.9%) |
| Wholesale Trade | 10 (100.0%) | 0 (0.0%) |
| Retail Trade | 45 (22.8%) | 152 (77.2%) |
| Transportation & Warehousing | 4 (16.7%) | 20 (83.3%) |
| Utilities | 26 (100.0%) | 0 (0.0%) |
| Information | 0 (0.0%) | 1 (100.0%) |
| Finance & Insurance | 0 (0.0%) | 12 (100.0%) |
| Real Estate, Rental & Leasing | 0 (0.0%) | 0 (0.0%) |
| Professional & Scientific | 0 (0.0%) | 3 (100.0%) |
| Enterprise Management | 0 (0.0%) | 0 (0.0%) |
| Administrative & Support | 20 (100.0%) | 0 (0.0%) |
| Educational Services | 0 (0.0%) | 12 (100.0%) |
| Health Care & Social Assistance | 8 (26.7%) | 22 (73.3%) |
| Arts, Entertainment & Recreation | 0 (0.0%) | 7 (100.0%) |
| Accommodation & Food Services | 0 (0.0%) | 6 (100.0%) |
| Public Administration | 3 (37.5%) | 5 (62.5%) |
| Total | 342 (58.5%) | 243 (41.5%) |
Education in Lake Colorado City
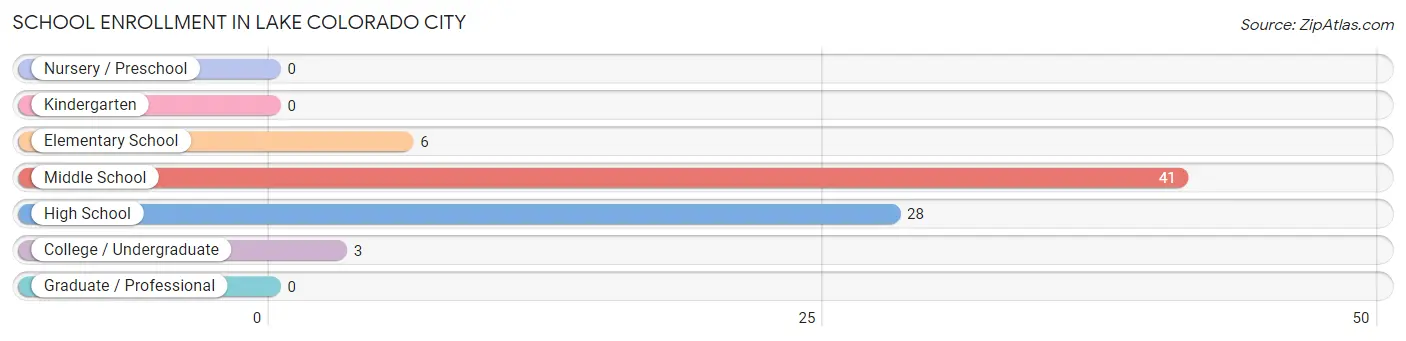
School Enrollment in Lake Colorado City
The most common levels of schooling among the 78 students in Lake Colorado City are middle school (41 | 52.6%), high school (28 | 35.9%), and elementary school (6 | 7.7%).
| School Level | # Students | % Students |
| Nursery / Preschool | 0 | 0.0% |
| Kindergarten | 0 | 0.0% |
| Elementary School | 6 | 7.7% |
| Middle School | 41 | 52.6% |
| High School | 28 | 35.9% |
| College / Undergraduate | 3 | 3.8% |
| Graduate / Professional | 0 | 0.0% |
| Total | 78 | 100.0% |
School Enrollment by Age by Funding Source in Lake Colorado City
Out of a total of 78 students who are enrolled in schools in Lake Colorado City, 14 (17.9%) attend a private institution, while the remaining 64 (82.1%) are enrolled in public schools. The age group of 5 to 9 year old has the highest likelihood of being enrolled in private schools, with 14 (70.0% in the age bracket) enrolled. Conversely, the age group of 10 to 14 year olds has the lowest likelihood of being enrolled in a private school, with 27 (100.0% in the age bracket) attending a public institution.
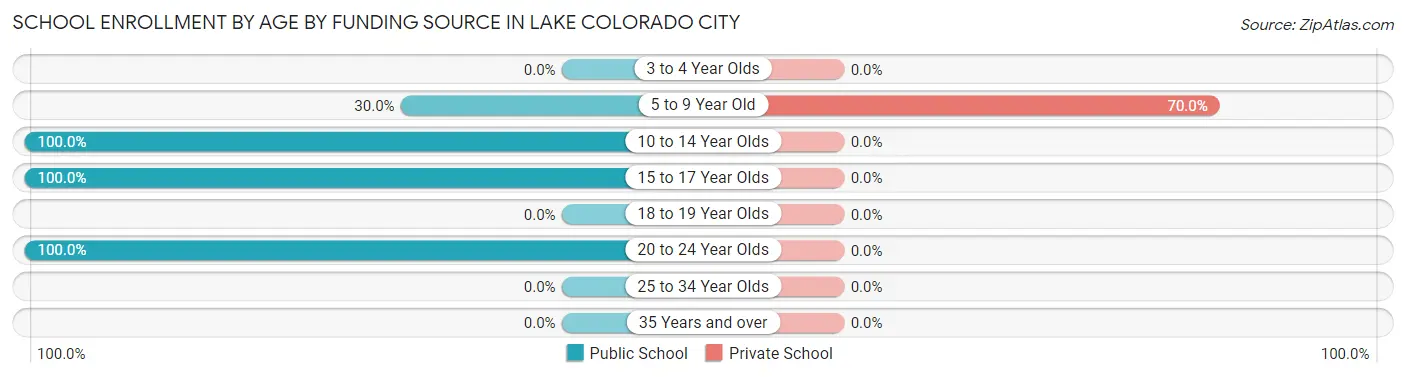
| Age Bracket | Public School | Private School |
| 3 to 4 Year Olds | 0 (0.0%) | 0 (0.0%) |
| 5 to 9 Year Old | 6 (30.0%) | 14 (70.0%) |
| 10 to 14 Year Olds | 27 (100.0%) | 0 (0.0%) |
| 15 to 17 Year Olds | 28 (100.0%) | 0 (0.0%) |
| 18 to 19 Year Olds | 0 (0.0%) | 0 (0.0%) |
| 20 to 24 Year Olds | 3 (100.0%) | 0 (0.0%) |
| 25 to 34 Year Olds | 0 (0.0%) | 0 (0.0%) |
| 35 Years and over | 0 (0.0%) | 0 (0.0%) |
| Total | 64 (82.1%) | 14 (17.9%) |
Educational Attainment by Field of Study in Lake Colorado City
Bio, nature & agricultural (21 | 42.0%), science & technology (12 | 24.0%), education (11 | 22.0%), computers & mathematics (5 | 10.0%), and social sciences (1 | 2.0%) are the most common fields of study among 50 individuals in Lake Colorado City who have obtained a bachelor's degree or higher.
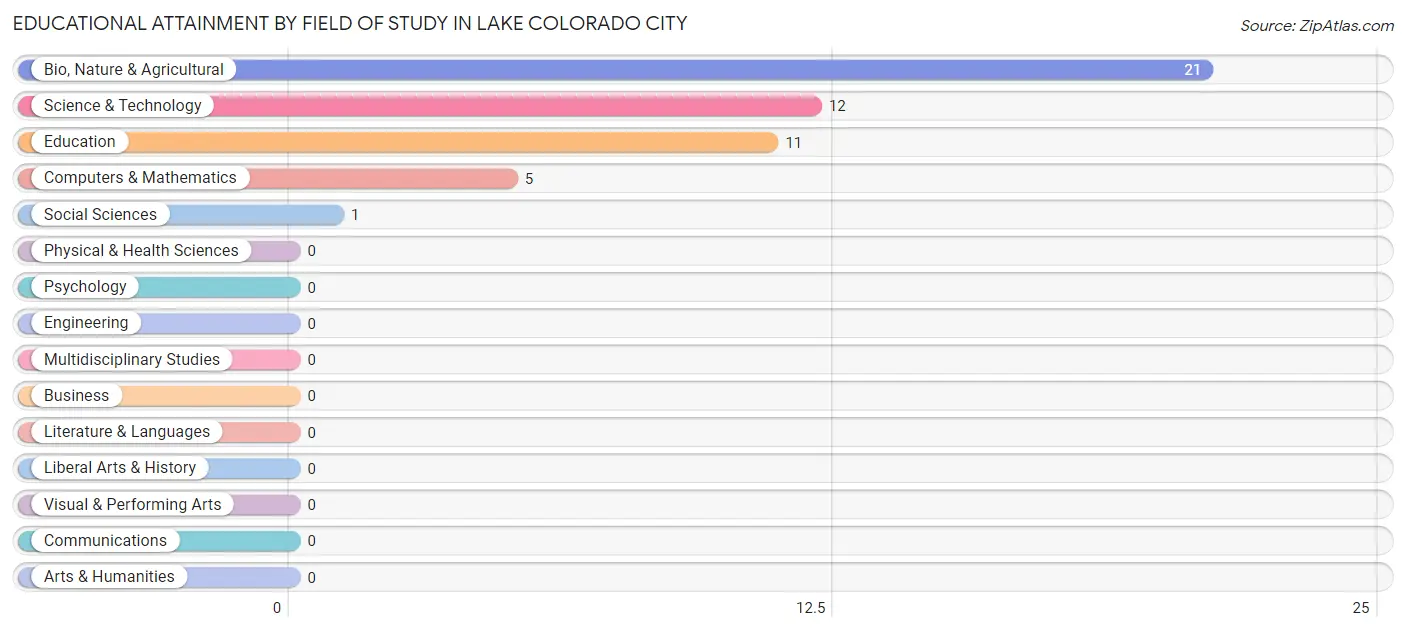
| Field of Study | # Graduates | % Graduates |
| Computers & Mathematics | 5 | 10.0% |
| Bio, Nature & Agricultural | 21 | 42.0% |
| Physical & Health Sciences | 0 | 0.0% |
| Psychology | 0 | 0.0% |
| Social Sciences | 1 | 2.0% |
| Engineering | 0 | 0.0% |
| Multidisciplinary Studies | 0 | 0.0% |
| Science & Technology | 12 | 24.0% |
| Business | 0 | 0.0% |
| Education | 11 | 22.0% |
| Literature & Languages | 0 | 0.0% |
| Liberal Arts & History | 0 | 0.0% |
| Visual & Performing Arts | 0 | 0.0% |
| Communications | 0 | 0.0% |
| Arts & Humanities | 0 | 0.0% |
| Total | 50 | 100.0% |
Transportation & Commute in Lake Colorado City
Vehicle Availability by Sex in Lake Colorado City
The most prevalent vehicle ownership categories in Lake Colorado City are males with 1 vehicle (190, accounting for 55.6%) and females with 1 vehicle (4, making up 78.2%).
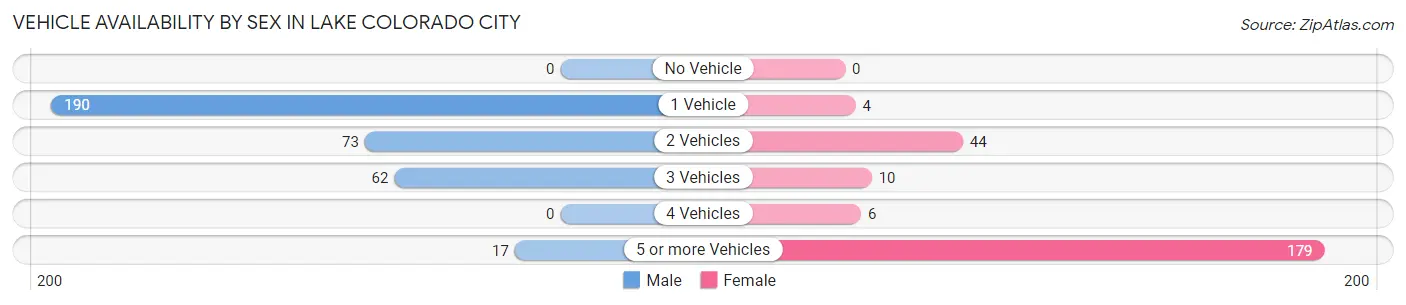
| Vehicles Available | Male | Female |
| No Vehicle | 0 (0.0%) | 0 (0.0%) |
| 1 Vehicle | 190 (55.6%) | 4 (1.7%) |
| 2 Vehicles | 73 (21.3%) | 44 (18.1%) |
| 3 Vehicles | 62 (18.1%) | 10 (4.1%) |
| 4 Vehicles | 0 (0.0%) | 6 (2.5%) |
| 5 or more Vehicles | 17 (5.0%) | 179 (73.7%) |
| Total | 342 (100.0%) | 243 (100.0%) |
Commute Time in Lake Colorado City
The most frequently occuring commute durations in Lake Colorado City are 20 to 24 minutes (178 commuters, 31.2%), 15 to 19 minutes (143 commuters, 25.1%), and 30 to 34 minutes (78 commuters, 13.7%).
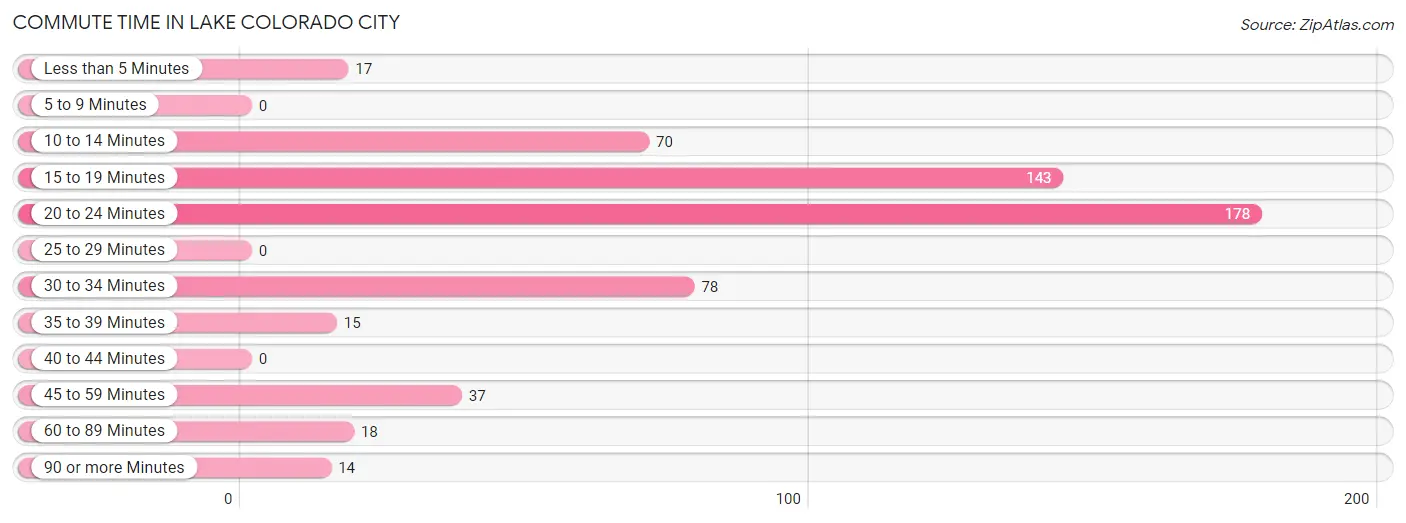
| Commute Time | # Commuters | % Commuters |
| Less than 5 Minutes | 17 | 3.0% |
| 5 to 9 Minutes | 0 | 0.0% |
| 10 to 14 Minutes | 70 | 12.3% |
| 15 to 19 Minutes | 143 | 25.1% |
| 20 to 24 Minutes | 178 | 31.2% |
| 25 to 29 Minutes | 0 | 0.0% |
| 30 to 34 Minutes | 78 | 13.7% |
| 35 to 39 Minutes | 15 | 2.6% |
| 40 to 44 Minutes | 0 | 0.0% |
| 45 to 59 Minutes | 37 | 6.5% |
| 60 to 89 Minutes | 18 | 3.2% |
| 90 or more Minutes | 14 | 2.5% |
Commute Time by Sex in Lake Colorado City
The most common commute times in Lake Colorado City are 15 to 19 minutes (136 commuters, 39.9%) for males and 20 to 24 minutes (175 commuters, 76.4%) for females.
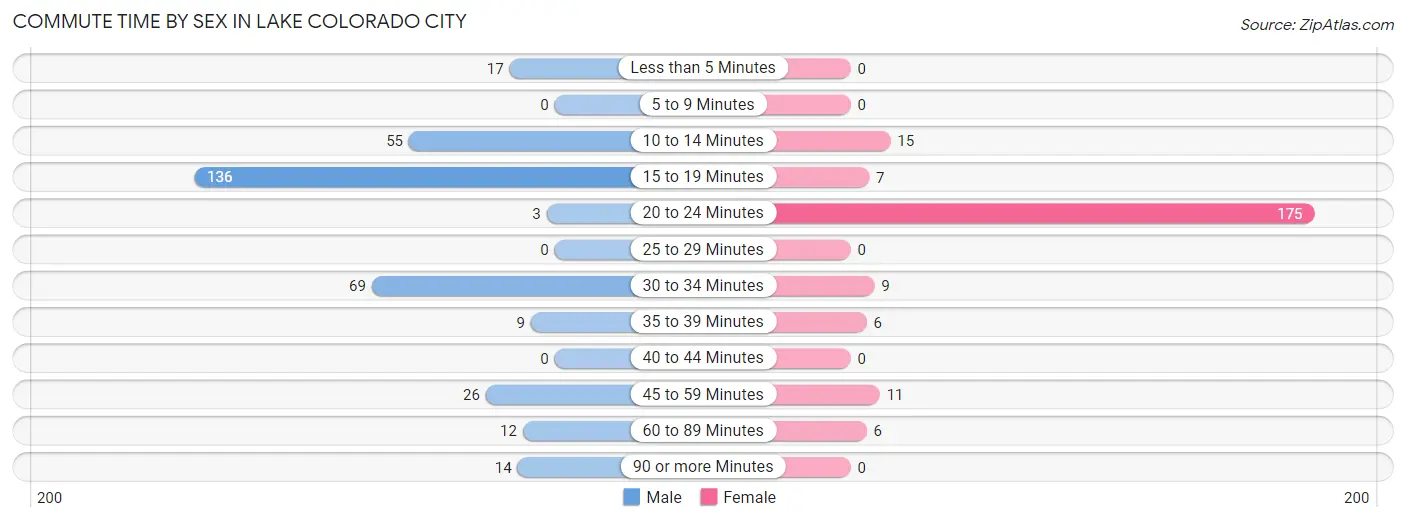
| Commute Time | Male | Female |
| Less than 5 Minutes | 17 (5.0%) | 0 (0.0%) |
| 5 to 9 Minutes | 0 (0.0%) | 0 (0.0%) |
| 10 to 14 Minutes | 55 (16.1%) | 15 (6.6%) |
| 15 to 19 Minutes | 136 (39.9%) | 7 (3.1%) |
| 20 to 24 Minutes | 3 (0.9%) | 175 (76.4%) |
| 25 to 29 Minutes | 0 (0.0%) | 0 (0.0%) |
| 30 to 34 Minutes | 69 (20.2%) | 9 (3.9%) |
| 35 to 39 Minutes | 9 (2.6%) | 6 (2.6%) |
| 40 to 44 Minutes | 0 (0.0%) | 0 (0.0%) |
| 45 to 59 Minutes | 26 (7.6%) | 11 (4.8%) |
| 60 to 89 Minutes | 12 (3.5%) | 6 (2.6%) |
| 90 or more Minutes | 14 (4.1%) | 0 (0.0%) |
Time of Departure to Work by Sex in Lake Colorado City
The most frequent times of departure to work in Lake Colorado City are 8:00 AM to 8:29 AM (155, 45.5%) for males and 12:00 PM to 3:59 PM (152, 66.4%) for females.
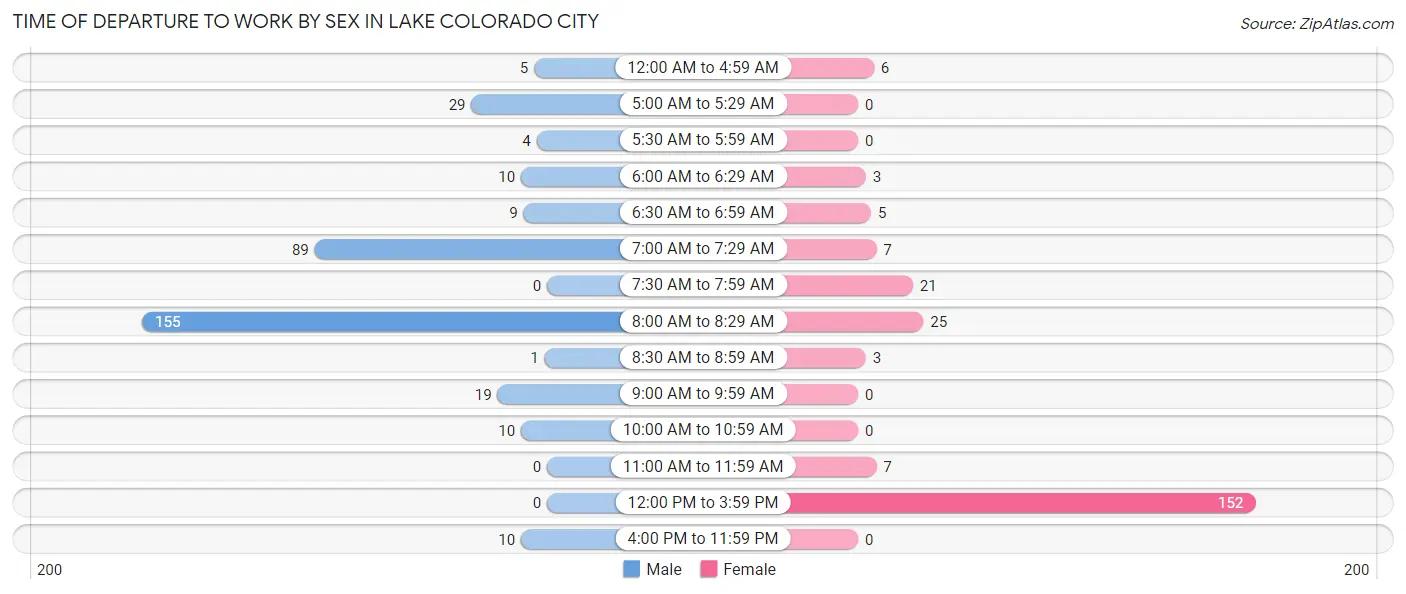
| Time of Departure | Male | Female |
| 12:00 AM to 4:59 AM | 5 (1.5%) | 6 (2.6%) |
| 5:00 AM to 5:29 AM | 29 (8.5%) | 0 (0.0%) |
| 5:30 AM to 5:59 AM | 4 (1.2%) | 0 (0.0%) |
| 6:00 AM to 6:29 AM | 10 (2.9%) | 3 (1.3%) |
| 6:30 AM to 6:59 AM | 9 (2.6%) | 5 (2.2%) |
| 7:00 AM to 7:29 AM | 89 (26.1%) | 7 (3.1%) |
| 7:30 AM to 7:59 AM | 0 (0.0%) | 21 (9.2%) |
| 8:00 AM to 8:29 AM | 155 (45.5%) | 25 (10.9%) |
| 8:30 AM to 8:59 AM | 1 (0.3%) | 3 (1.3%) |
| 9:00 AM to 9:59 AM | 19 (5.6%) | 0 (0.0%) |
| 10:00 AM to 10:59 AM | 10 (2.9%) | 0 (0.0%) |
| 11:00 AM to 11:59 AM | 0 (0.0%) | 7 (3.1%) |
| 12:00 PM to 3:59 PM | 0 (0.0%) | 152 (66.4%) |
| 4:00 PM to 11:59 PM | 10 (2.9%) | 0 (0.0%) |
| Total | 341 (100.0%) | 229 (100.0%) |
Housing Occupancy in Lake Colorado City
Occupancy by Ownership in Lake Colorado City
Of the total 260 dwellings in Lake Colorado City, owner-occupied units account for 193 (74.2%), while renter-occupied units make up 67 (25.8%).
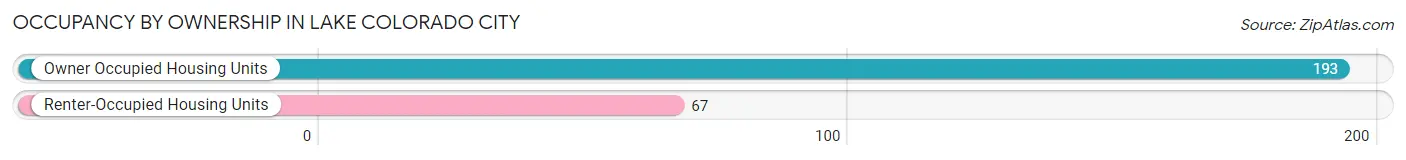
| Occupancy | # Housing Units | % Housing Units |
| Owner Occupied Housing Units | 193 | 74.2% |
| Renter-Occupied Housing Units | 67 | 25.8% |
| Total Occupied Housing Units | 260 | 100.0% |
Occupancy by Household Size in Lake Colorado City
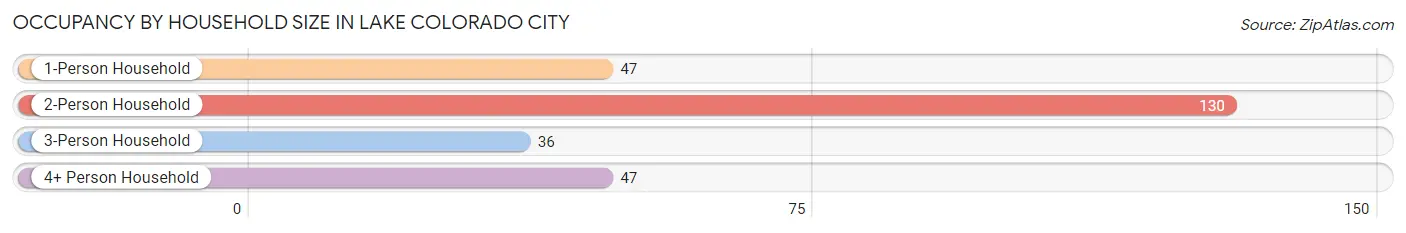
| Household Size | # Housing Units | % Housing Units |
| 1-Person Household | 47 | 18.1% |
| 2-Person Household | 130 | 50.0% |
| 3-Person Household | 36 | 13.9% |
| 4+ Person Household | 47 | 18.1% |
| Total Housing Units | 260 | 100.0% |
Occupancy by Ownership by Household Size in Lake Colorado City
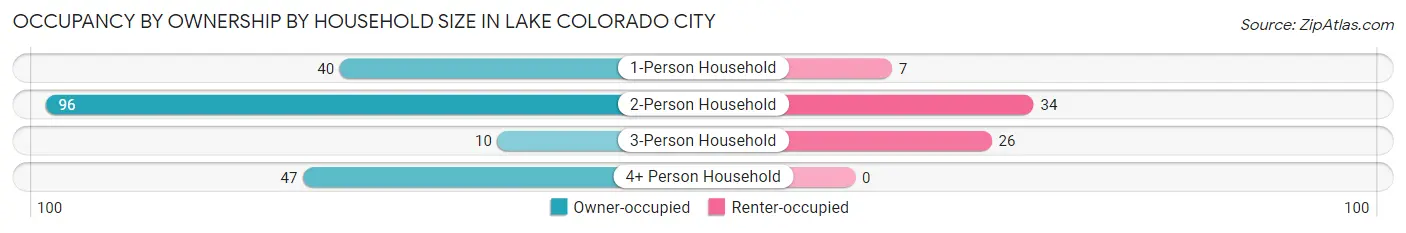
| Household Size | Owner-occupied | Renter-occupied |
| 1-Person Household | 40 (85.1%) | 7 (14.9%) |
| 2-Person Household | 96 (73.9%) | 34 (26.2%) |
| 3-Person Household | 10 (27.8%) | 26 (72.2%) |
| 4+ Person Household | 47 (100.0%) | 0 (0.0%) |
| Total Housing Units | 193 (74.2%) | 67 (25.8%) |
Occupancy by Educational Attainment in Lake Colorado City
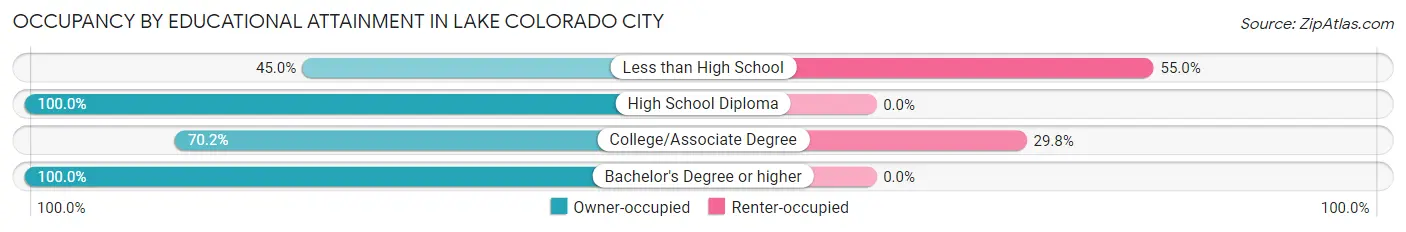
| Household Size | Owner-occupied | Renter-occupied |
| Less than High School | 27 (45.0%) | 33 (55.0%) |
| High School Diploma | 58 (100.0%) | 0 (0.0%) |
| College/Associate Degree | 80 (70.2%) | 34 (29.8%) |
| Bachelor's Degree or higher | 28 (100.0%) | 0 (0.0%) |
Occupancy by Age of Householder in Lake Colorado City
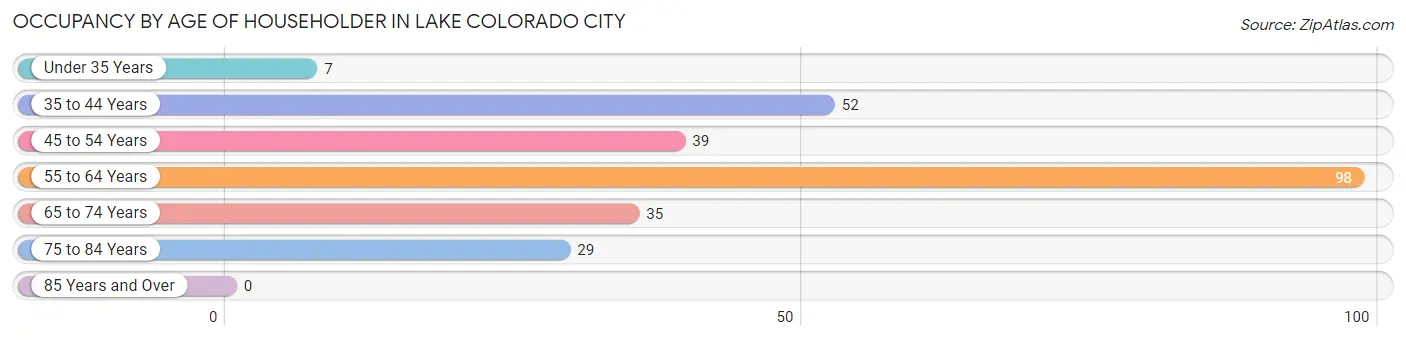
| Age Bracket | # Households | % Households |
| Under 35 Years | 7 | 2.7% |
| 35 to 44 Years | 52 | 20.0% |
| 45 to 54 Years | 39 | 15.0% |
| 55 to 64 Years | 98 | 37.7% |
| 65 to 74 Years | 35 | 13.5% |
| 75 to 84 Years | 29 | 11.2% |
| 85 Years and Over | 0 | 0.0% |
| Total | 260 | 100.0% |
Housing Finances in Lake Colorado City
Median Income by Occupancy in Lake Colorado City
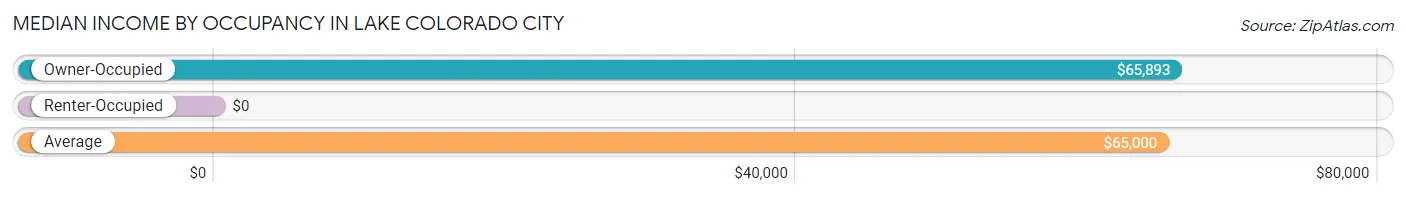
| Occupancy Type | # Households | Median Income |
| Owner-Occupied | 193 (74.2%) | $65,893 |
| Renter-Occupied | 67 (25.8%) | $0 |
| Average | 260 (100.0%) | $65,000 |
Occupancy by Householder Income Bracket in Lake Colorado City
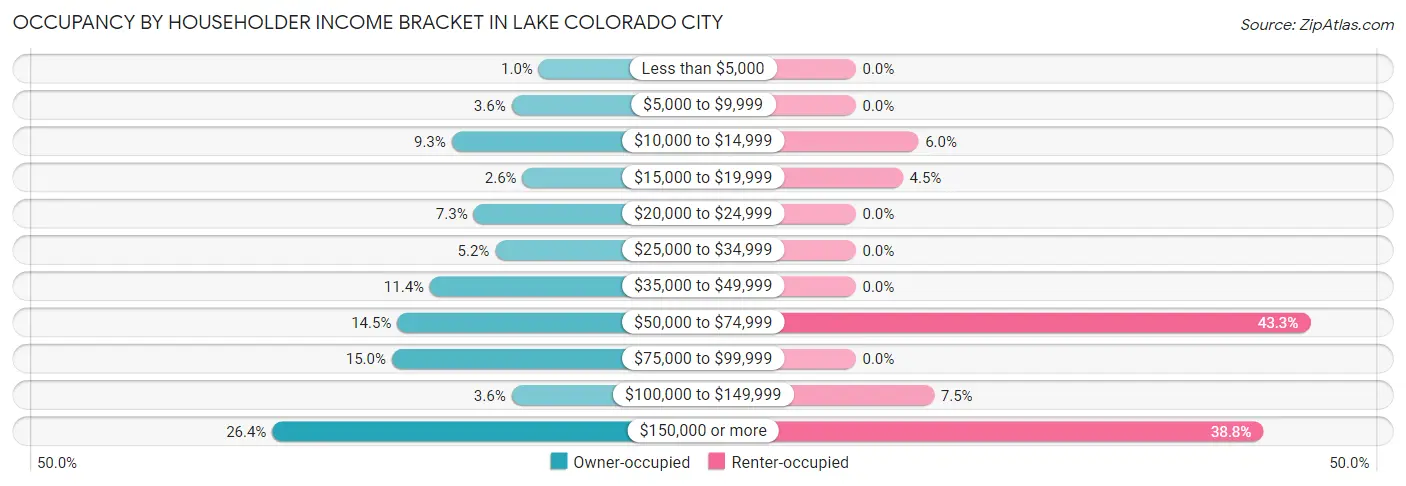
| Income Bracket | Owner-occupied | Renter-occupied |
| Less than $5,000 | 2 (1.0%) | 0 (0.0%) |
| $5,000 to $9,999 | 7 (3.6%) | 0 (0.0%) |
| $10,000 to $14,999 | 18 (9.3%) | 4 (6.0%) |
| $15,000 to $19,999 | 5 (2.6%) | 3 (4.5%) |
| $20,000 to $24,999 | 14 (7.2%) | 0 (0.0%) |
| $25,000 to $34,999 | 10 (5.2%) | 0 (0.0%) |
| $35,000 to $49,999 | 22 (11.4%) | 0 (0.0%) |
| $50,000 to $74,999 | 28 (14.5%) | 29 (43.3%) |
| $75,000 to $99,999 | 29 (15.0%) | 0 (0.0%) |
| $100,000 to $149,999 | 7 (3.6%) | 5 (7.5%) |
| $150,000 or more | 51 (26.4%) | 26 (38.8%) |
| Total | 193 (100.0%) | 67 (100.0%) |
Monthly Housing Cost Tiers in Lake Colorado City
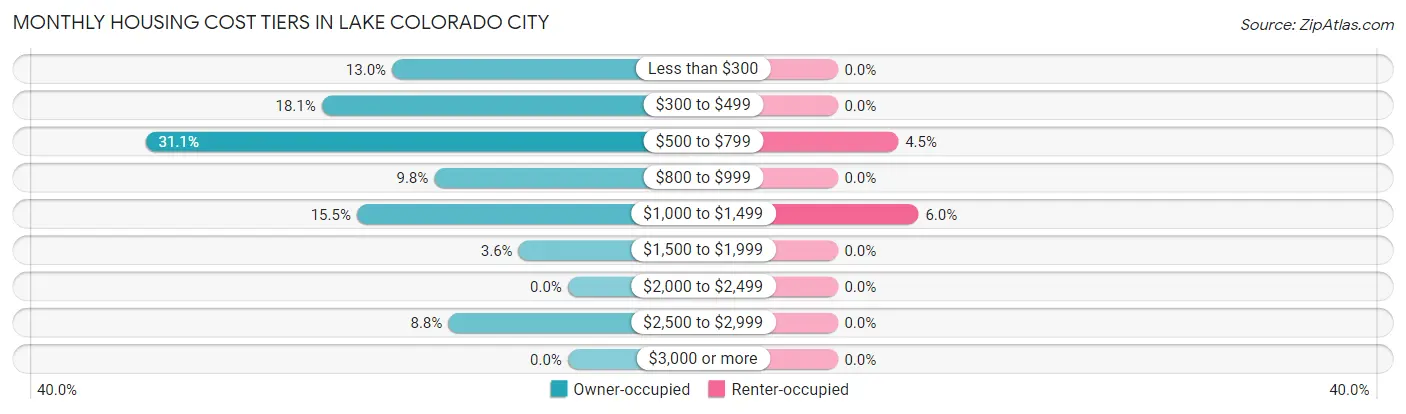
| Monthly Cost | Owner-occupied | Renter-occupied |
| Less than $300 | 25 (13.0%) | 0 (0.0%) |
| $300 to $499 | 35 (18.1%) | 0 (0.0%) |
| $500 to $799 | 60 (31.1%) | 3 (4.5%) |
| $800 to $999 | 19 (9.8%) | 0 (0.0%) |
| $1,000 to $1,499 | 30 (15.5%) | 4 (6.0%) |
| $1,500 to $1,999 | 7 (3.6%) | 0 (0.0%) |
| $2,000 to $2,499 | 0 (0.0%) | 0 (0.0%) |
| $2,500 to $2,999 | 17 (8.8%) | 0 (0.0%) |
| $3,000 or more | 0 (0.0%) | 0 (0.0%) |
| Total | 193 (100.0%) | 67 (100.0%) |
Physical Housing Characteristics in Lake Colorado City
Housing Structures in Lake Colorado City
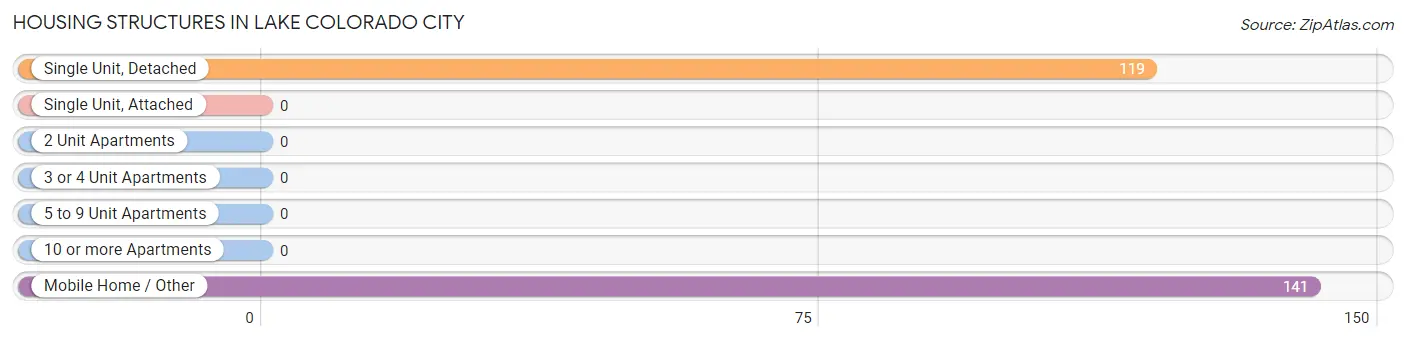
| Structure Type | # Housing Units | % Housing Units |
| Single Unit, Detached | 119 | 45.8% |
| Single Unit, Attached | 0 | 0.0% |
| 2 Unit Apartments | 0 | 0.0% |
| 3 or 4 Unit Apartments | 0 | 0.0% |
| 5 to 9 Unit Apartments | 0 | 0.0% |
| 10 or more Apartments | 0 | 0.0% |
| Mobile Home / Other | 141 | 54.2% |
| Total | 260 | 100.0% |
Housing Structures by Occupancy in Lake Colorado City
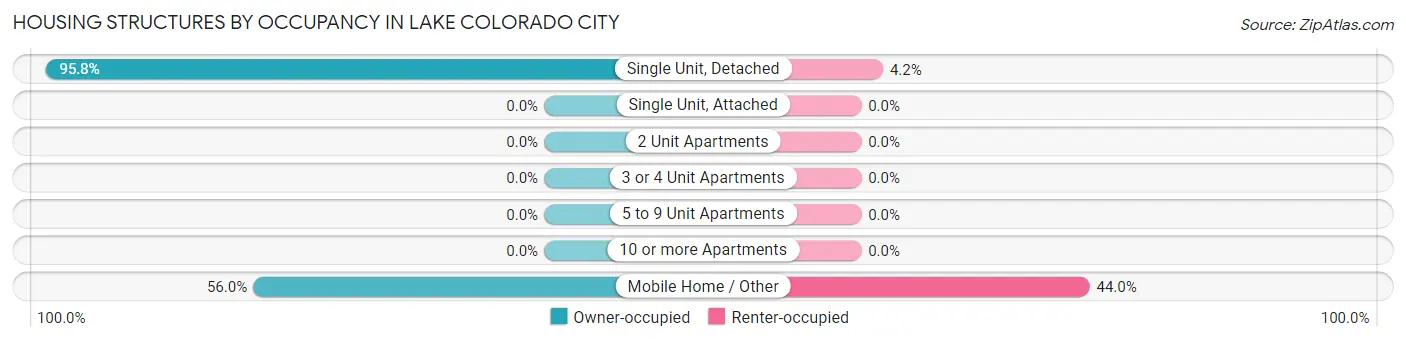
| Structure Type | Owner-occupied | Renter-occupied |
| Single Unit, Detached | 114 (95.8%) | 5 (4.2%) |
| Single Unit, Attached | 0 (0.0%) | 0 (0.0%) |
| 2 Unit Apartments | 0 (0.0%) | 0 (0.0%) |
| 3 or 4 Unit Apartments | 0 (0.0%) | 0 (0.0%) |
| 5 to 9 Unit Apartments | 0 (0.0%) | 0 (0.0%) |
| 10 or more Apartments | 0 (0.0%) | 0 (0.0%) |
| Mobile Home / Other | 79 (56.0%) | 62 (44.0%) |
| Total | 193 (74.2%) | 67 (25.8%) |
Housing Structures by Number of Rooms in Lake Colorado City
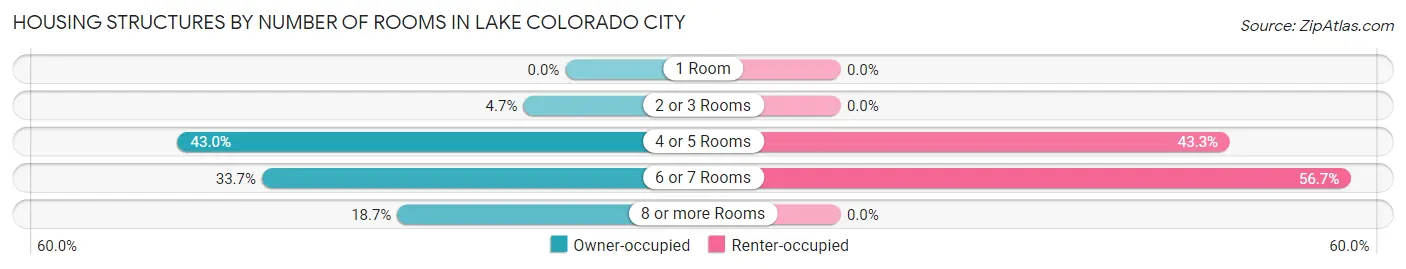
| Number of Rooms | Owner-occupied | Renter-occupied |
| 1 Room | 0 (0.0%) | 0 (0.0%) |
| 2 or 3 Rooms | 9 (4.7%) | 0 (0.0%) |
| 4 or 5 Rooms | 83 (43.0%) | 29 (43.3%) |
| 6 or 7 Rooms | 65 (33.7%) | 38 (56.7%) |
| 8 or more Rooms | 36 (18.6%) | 0 (0.0%) |
| Total | 193 (100.0%) | 67 (100.0%) |
Housing Structure by Heating Type in Lake Colorado City
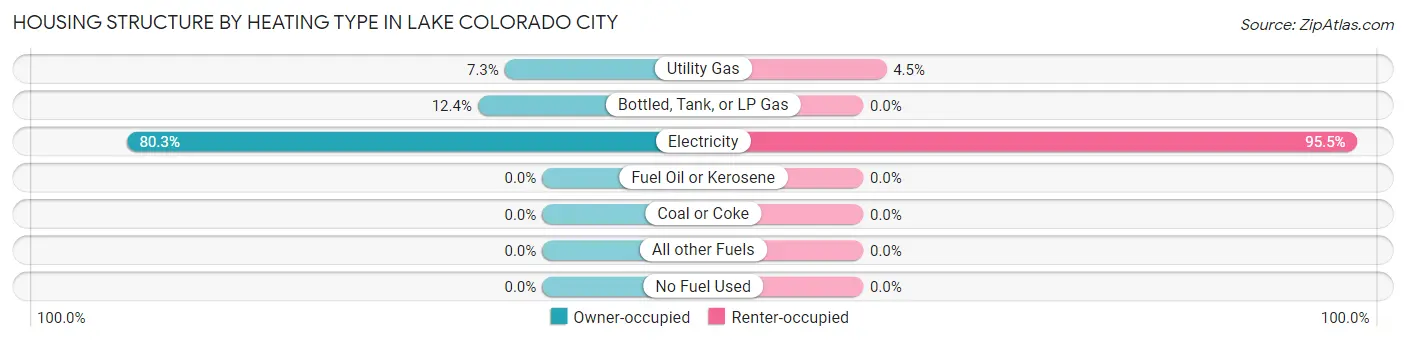
| Heating Type | Owner-occupied | Renter-occupied |
| Utility Gas | 14 (7.2%) | 3 (4.5%) |
| Bottled, Tank, or LP Gas | 24 (12.4%) | 0 (0.0%) |
| Electricity | 155 (80.3%) | 64 (95.5%) |
| Fuel Oil or Kerosene | 0 (0.0%) | 0 (0.0%) |
| Coal or Coke | 0 (0.0%) | 0 (0.0%) |
| All other Fuels | 0 (0.0%) | 0 (0.0%) |
| No Fuel Used | 0 (0.0%) | 0 (0.0%) |
| Total | 193 (100.0%) | 67 (100.0%) |
Household Vehicle Usage in Lake Colorado City
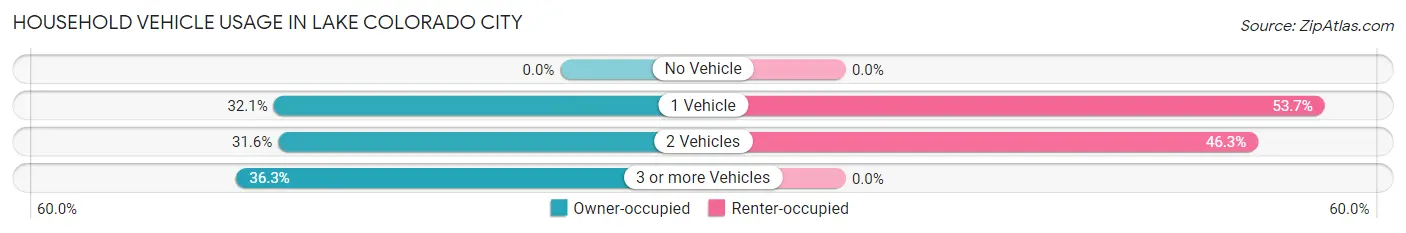
| Vehicles per Household | Owner-occupied | Renter-occupied |
| No Vehicle | 0 (0.0%) | 0 (0.0%) |
| 1 Vehicle | 62 (32.1%) | 36 (53.7%) |
| 2 Vehicles | 61 (31.6%) | 31 (46.3%) |
| 3 or more Vehicles | 70 (36.3%) | 0 (0.0%) |
| Total | 193 (100.0%) | 67 (100.0%) |
Real Estate & Mortgages in Lake Colorado City
Real Estate and Mortgage Overview in Lake Colorado City
| Characteristic | Without Mortgage | With Mortgage |
| Housing Units | 119 | 74 |
| Median Property Value | $90,700 | $86,700 |
| Median Household Income | $54,821 | $27 |
| Monthly Housing Costs | $531 | $0 |
| Real Estate Taxes | $1,071 | $7 |
Property Value by Mortgage Status in Lake Colorado City
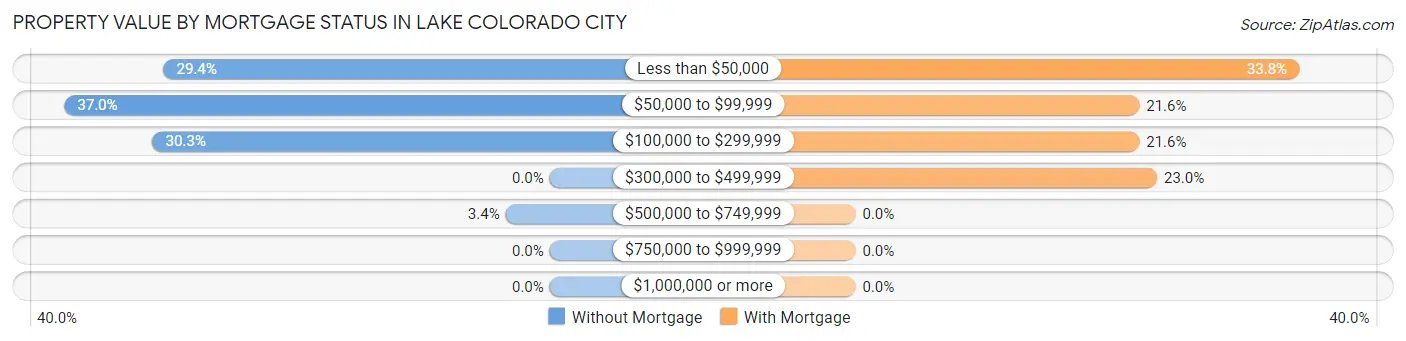
| Property Value | Without Mortgage | With Mortgage |
| Less than $50,000 | 35 (29.4%) | 25 (33.8%) |
| $50,000 to $99,999 | 44 (37.0%) | 16 (21.6%) |
| $100,000 to $299,999 | 36 (30.2%) | 16 (21.6%) |
| $300,000 to $499,999 | 0 (0.0%) | 17 (23.0%) |
| $500,000 to $749,999 | 4 (3.4%) | 0 (0.0%) |
| $750,000 to $999,999 | 0 (0.0%) | 0 (0.0%) |
| $1,000,000 or more | 0 (0.0%) | 0 (0.0%) |
| Total | 119 (100.0%) | 74 (100.0%) |
Household Income by Mortgage Status in Lake Colorado City
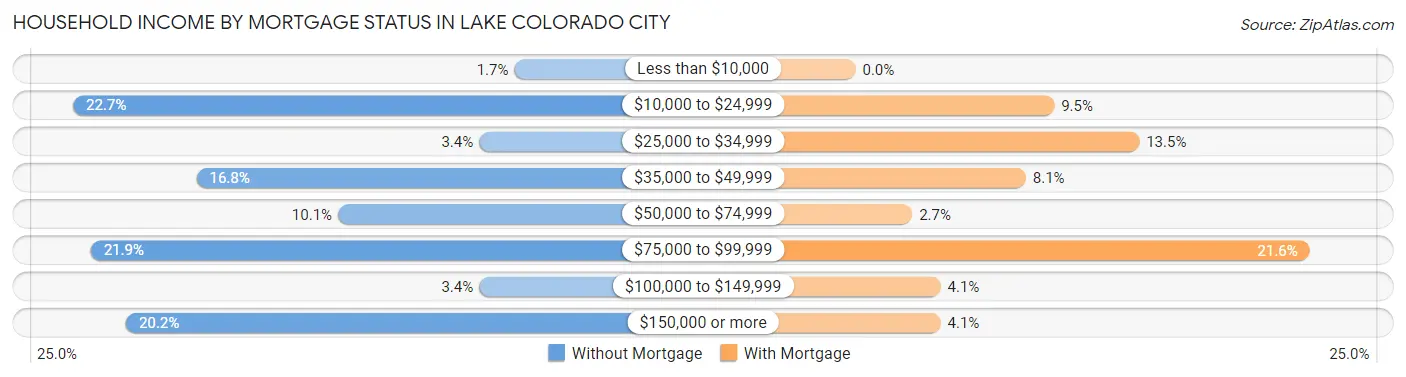
| Household Income | Without Mortgage | With Mortgage |
| Less than $10,000 | 2 (1.7%) | 0 (0.0%) |
| $10,000 to $24,999 | 27 (22.7%) | 7 (9.5%) |
| $25,000 to $34,999 | 4 (3.4%) | 10 (13.5%) |
| $35,000 to $49,999 | 20 (16.8%) | 6 (8.1%) |
| $50,000 to $74,999 | 12 (10.1%) | 2 (2.7%) |
| $75,000 to $99,999 | 26 (21.8%) | 16 (21.6%) |
| $100,000 to $149,999 | 4 (3.4%) | 3 (4.1%) |
| $150,000 or more | 24 (20.2%) | 3 (4.1%) |
| Total | 119 (100.0%) | 74 (100.0%) |
Property Value to Household Income Ratio in Lake Colorado City
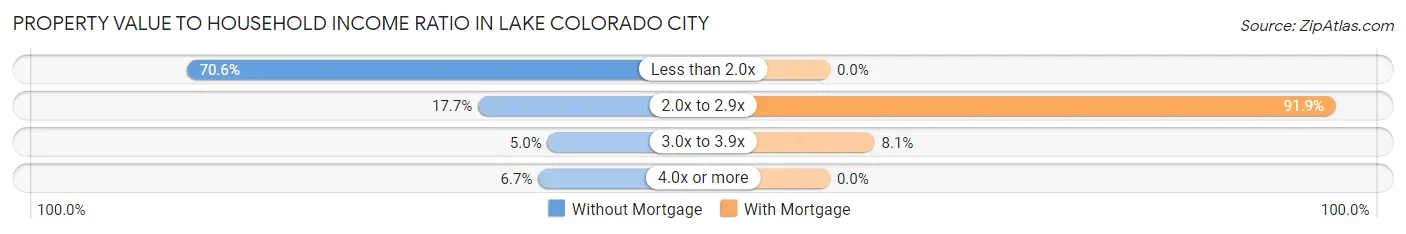
| Value-to-Income Ratio | Without Mortgage | With Mortgage |
| Less than 2.0x | 84 (70.6%) | 0 (0.0%) |
| 2.0x to 2.9x | 21 (17.6%) | 68 (91.9%) |
| 3.0x to 3.9x | 6 (5.0%) | 6 (8.1%) |
| 4.0x or more | 8 (6.7%) | 0 (0.0%) |
| Total | 119 (100.0%) | 74 (100.0%) |
Real Estate Taxes by Mortgage Status in Lake Colorado City
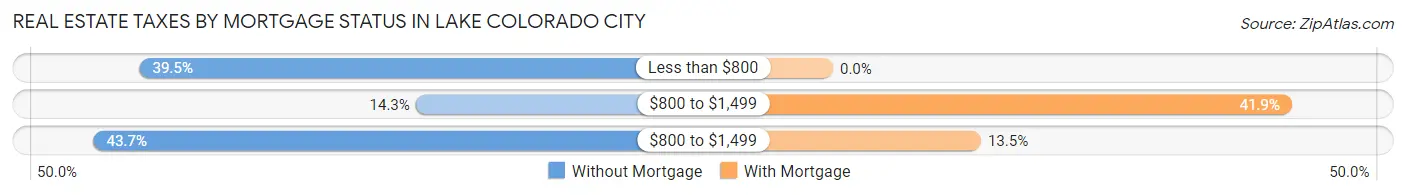
| Property Taxes | Without Mortgage | With Mortgage |
| Less than $800 | 47 (39.5%) | 0 (0.0%) |
| $800 to $1,499 | 17 (14.3%) | 31 (41.9%) |
| $800 to $1,499 | 52 (43.7%) | 10 (13.5%) |
| Total | 119 (100.0%) | 74 (100.0%) |
Health & Disability in Lake Colorado City
Health Insurance Coverage by Age in Lake Colorado City
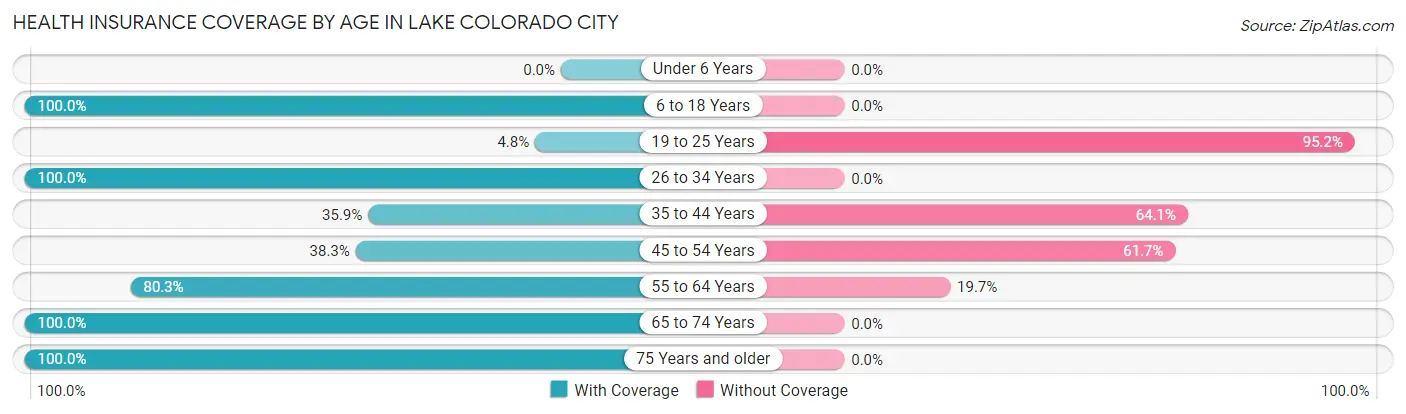
| Age Bracket | With Coverage | Without Coverage |
| Under 6 Years | 0 (0.0%) | 0 (0.0%) |
| 6 to 18 Years | 93 (100.0%) | 0 (0.0%) |
| 19 to 25 Years | 10 (4.8%) | 198 (95.2%) |
| 26 to 34 Years | 13 (100.0%) | 0 (0.0%) |
| 35 to 44 Years | 46 (35.9%) | 82 (64.1%) |
| 45 to 54 Years | 62 (38.3%) | 100 (61.7%) |
| 55 to 64 Years | 118 (80.3%) | 29 (19.7%) |
| 65 to 74 Years | 80 (100.0%) | 0 (0.0%) |
| 75 Years and older | 72 (100.0%) | 0 (0.0%) |
| Total | 494 (54.7%) | 409 (45.3%) |
Health Insurance Coverage by Citizenship Status in Lake Colorado City
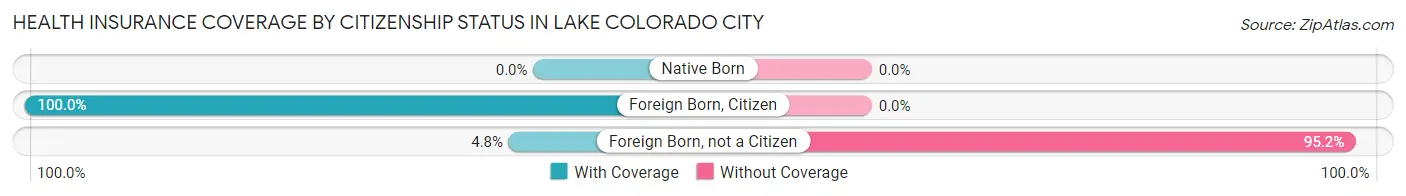
| Citizenship Status | With Coverage | Without Coverage |
| Native Born | 0 (0.0%) | 0 (0.0%) |
| Foreign Born, Citizen | 93 (100.0%) | 0 (0.0%) |
| Foreign Born, not a Citizen | 10 (4.8%) | 198 (95.2%) |
Health Insurance Coverage by Household Income in Lake Colorado City
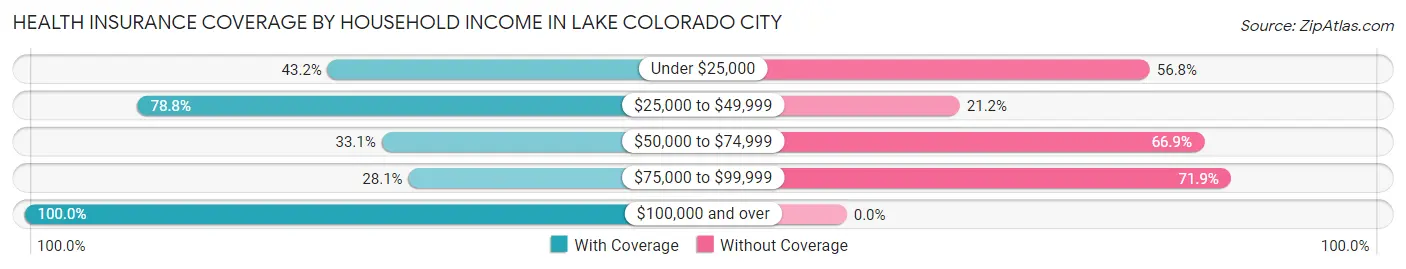
| Household Income | With Coverage | Without Coverage |
| Under $25,000 | 51 (43.2%) | 67 (56.8%) |
| $25,000 to $49,999 | 67 (78.8%) | 18 (21.2%) |
| $50,000 to $74,999 | 54 (33.1%) | 109 (66.9%) |
| $75,000 to $99,999 | 84 (28.1%) | 215 (71.9%) |
| $100,000 and over | 238 (100.0%) | 0 (0.0%) |
Public vs Private Health Insurance Coverage by Age in Lake Colorado City
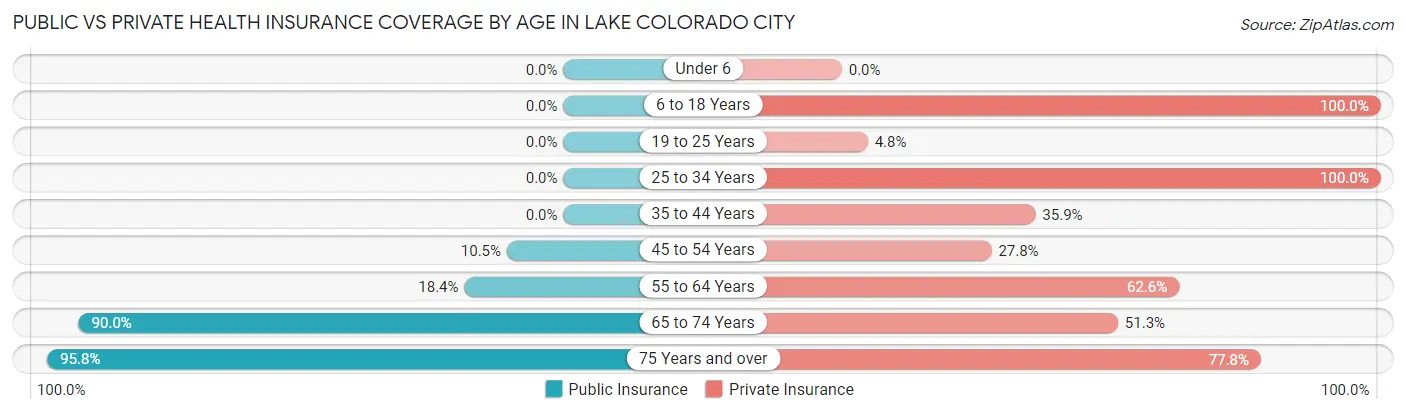
| Age Bracket | Public Insurance | Private Insurance |
| Under 6 | 0 (0.0%) | 0 (0.0%) |
| 6 to 18 Years | 0 (0.0%) | 93 (100.0%) |
| 19 to 25 Years | 0 (0.0%) | 10 (4.8%) |
| 25 to 34 Years | 0 (0.0%) | 13 (100.0%) |
| 35 to 44 Years | 0 (0.0%) | 46 (35.9%) |
| 45 to 54 Years | 17 (10.5%) | 45 (27.8%) |
| 55 to 64 Years | 27 (18.4%) | 92 (62.6%) |
| 65 to 74 Years | 72 (90.0%) | 41 (51.2%) |
| 75 Years and over | 69 (95.8%) | 56 (77.8%) |
| Total | 185 (20.5%) | 396 (43.9%) |
Disability Status by Sex by Age in Lake Colorado City
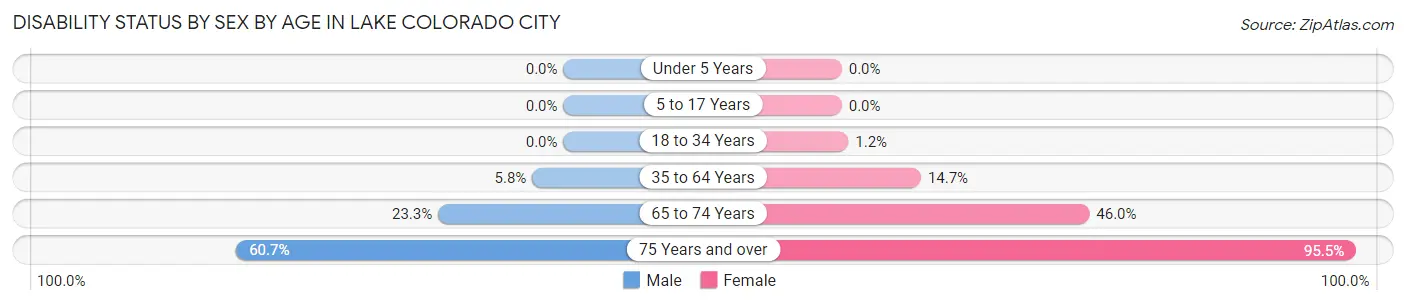
| Age Bracket | Male | Female |
| Under 5 Years | 0 (0.0%) | 0 (0.0%) |
| 5 to 17 Years | 0 (0.0%) | 0 (0.0%) |
| 18 to 34 Years | 0 (0.0%) | 2 (1.2%) |
| 35 to 64 Years | 17 (5.8%) | 21 (14.7%) |
| 65 to 74 Years | 10 (23.3%) | 17 (46.0%) |
| 75 Years and over | 17 (60.7%) | 42 (95.5%) |
Disability Class by Sex by Age in Lake Colorado City
Disability Class: Hearing Difficulty
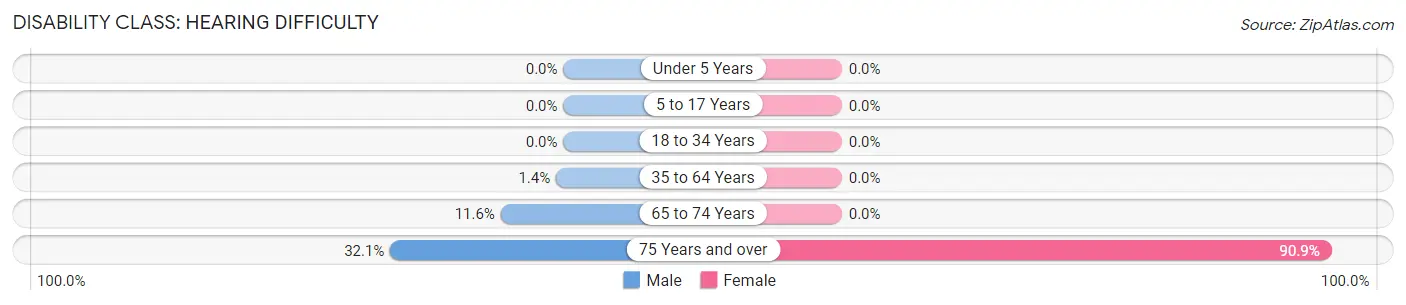
| Age Bracket | Male | Female |
| Under 5 Years | 0 (0.0%) | 0 (0.0%) |
| 5 to 17 Years | 0 (0.0%) | 0 (0.0%) |
| 18 to 34 Years | 0 (0.0%) | 0 (0.0%) |
| 35 to 64 Years | 4 (1.4%) | 0 (0.0%) |
| 65 to 74 Years | 5 (11.6%) | 0 (0.0%) |
| 75 Years and over | 9 (32.1%) | 40 (90.9%) |
Disability Class: Vision Difficulty
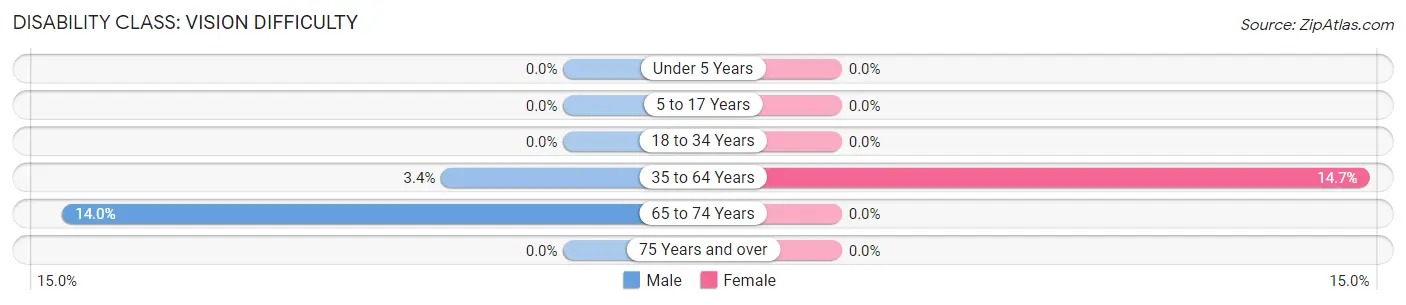
| Age Bracket | Male | Female |
| Under 5 Years | 0 (0.0%) | 0 (0.0%) |
| 5 to 17 Years | 0 (0.0%) | 0 (0.0%) |
| 18 to 34 Years | 0 (0.0%) | 0 (0.0%) |
| 35 to 64 Years | 10 (3.4%) | 21 (14.7%) |
| 65 to 74 Years | 6 (14.0%) | 0 (0.0%) |
| 75 Years and over | 0 (0.0%) | 0 (0.0%) |
Disability Class: Cognitive Difficulty
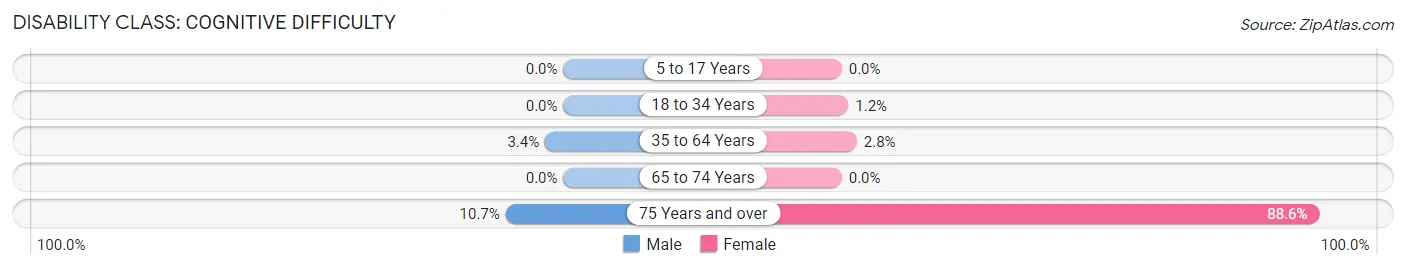
| Age Bracket | Male | Female |
| 5 to 17 Years | 0 (0.0%) | 0 (0.0%) |
| 18 to 34 Years | 0 (0.0%) | 2 (1.2%) |
| 35 to 64 Years | 10 (3.4%) | 4 (2.8%) |
| 65 to 74 Years | 0 (0.0%) | 0 (0.0%) |
| 75 Years and over | 3 (10.7%) | 39 (88.6%) |
Disability Class: Ambulatory Difficulty
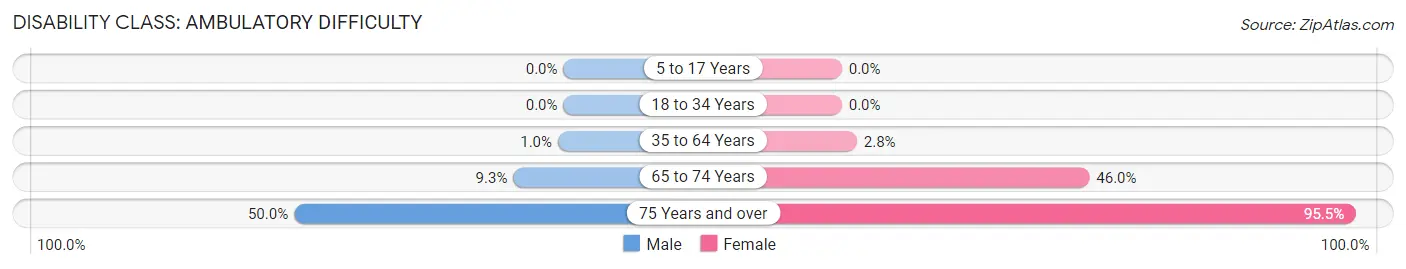
| Age Bracket | Male | Female |
| 5 to 17 Years | 0 (0.0%) | 0 (0.0%) |
| 18 to 34 Years | 0 (0.0%) | 0 (0.0%) |
| 35 to 64 Years | 3 (1.0%) | 4 (2.8%) |
| 65 to 74 Years | 4 (9.3%) | 17 (46.0%) |
| 75 Years and over | 14 (50.0%) | 42 (95.5%) |
Disability Class: Self-Care Difficulty
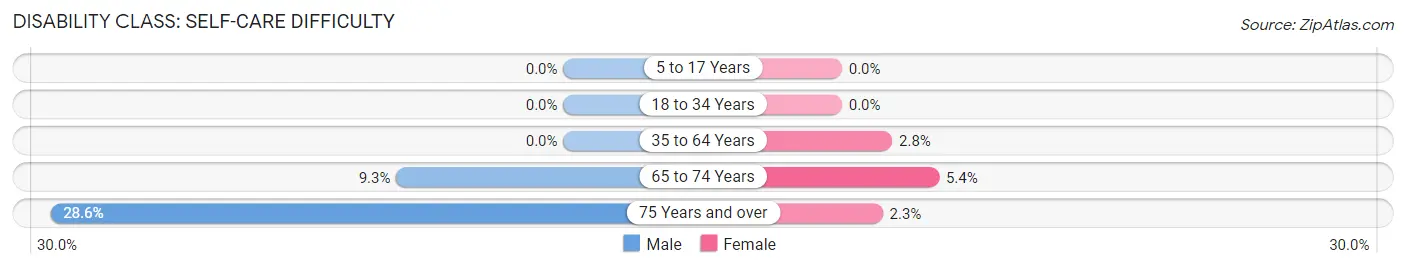
| Age Bracket | Male | Female |
| 5 to 17 Years | 0 (0.0%) | 0 (0.0%) |
| 18 to 34 Years | 0 (0.0%) | 0 (0.0%) |
| 35 to 64 Years | 0 (0.0%) | 4 (2.8%) |
| 65 to 74 Years | 4 (9.3%) | 2 (5.4%) |
| 75 Years and over | 8 (28.6%) | 1 (2.3%) |
Technology Access in Lake Colorado City
Computing Device Access in Lake Colorado City
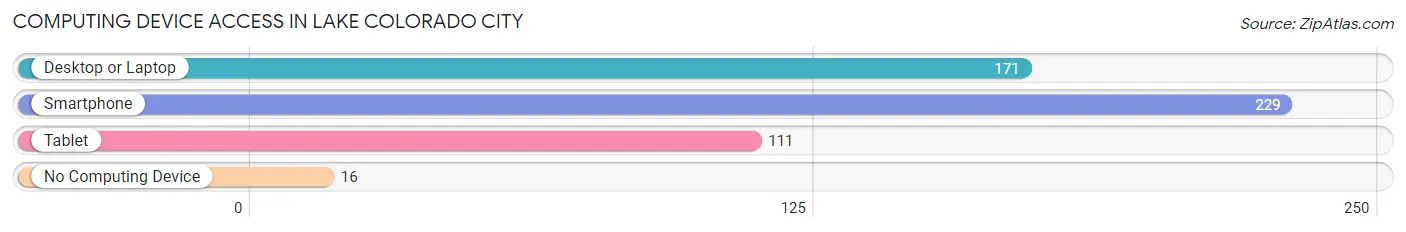
| Device Type | # Households | % Households |
| Desktop or Laptop | 171 | 65.8% |
| Smartphone | 229 | 88.1% |
| Tablet | 111 | 42.7% |
| No Computing Device | 16 | 6.1% |
| Total | 260 | 100.0% |
Internet Access in Lake Colorado City
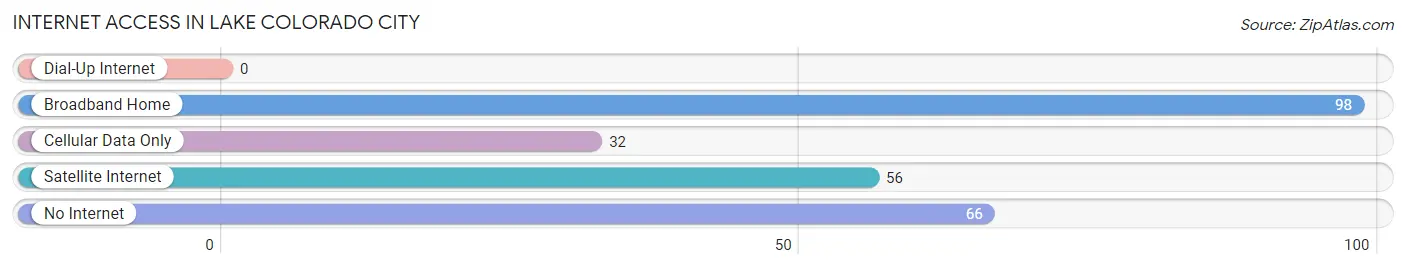
| Internet Type | # Households | % Households |
| Dial-Up Internet | 0 | 0.0% |
| Broadband Home | 98 | 37.7% |
| Cellular Data Only | 32 | 12.3% |
| Satellite Internet | 56 | 21.5% |
| No Internet | 66 | 25.4% |
| Total | 260 | 100.0% |
Lake Colorado City Summary
Colorado City, Texas is a small town located in Mitchell County, Texas, United States. It is situated on the banks of the Colorado River, approximately 90 miles west of Abilene. The town was founded in 1882 and was named after the river. The population of Colorado City was 4,146 at the 2010 census.
Geography
Colorado City is located at 32°22′N 100°51′W (32.36, -100.85). According to the United States Census Bureau, the city has a total area of 4.2 square miles (10.8 km2), all of it land.
History
The area around Colorado City was first settled in the late 1870s by ranchers and farmers. The town was founded in 1882 and was named after the nearby Colorado River. The town was incorporated in 1885 and the first post office was established in 1887.
The town grew rapidly in the early 1900s, and by 1910 the population had reached 1,000. The town was a center for the local ranching and farming industry, and it was also a stop on the Texas and Pacific Railway.
In the 1920s, the town began to decline as the railroad moved its operations elsewhere. The population dropped to just over 500 by 1930.
The town experienced a resurgence in the 1940s and 1950s, as the oil and gas industry began to develop in the area. The population increased to over 2,000 by 1960.
Economy
The economy of Colorado City is largely based on oil and gas production, agriculture, and tourism. The town is home to several oil and gas companies, including Apache Corporation, Chevron, and ConocoPhillips.
Agriculture is also an important part of the local economy. The town is home to several large farms, including the Mitchell County Farm Bureau, which produces cotton, wheat, and sorghum.
Tourism is also an important part of the local economy. The town is home to several attractions, including the Mitchell County Historical Museum, the Colorado City State Park, and the Colorado City Golf Course.
Demographics
As of the 2010 census, there were 4,146 people, 1,541 households, and 1,072 families residing in the city. The population density was 990.3 people per square mile (382.2/km2). There were 1,717 housing units at an average density of 411.3 per square mile (158.7/km2). The racial makeup of the city was 79.2% White, 0.7% African American, 0.7% Native American, 0.3% Asian, 0.1% Pacific Islander, 16.7% from other races, and 2.3% from two or more races. Hispanic or Latino of any race were 33.2% of the population.
There were 1,541 households, out of which 33.2% had children under the age of 18 living with them, 51.2% were married couples living together, 13.2% had a female householder with no husband present, and 30.2% were non-families. 25.7% of all households were made up of individuals, and 11.7% had someone living alone who was 65 years of age or older. The average household size was 2.63 and the average family size was 3.17.
In the city, the population was spread out, with 28.2% under the age of 18, 8.3% from 18 to 24, 25.3% from 25 to 44, 22.7% from 45 to 64, and 15.5% who were 65 years of age or older. The median age was 36 years. For every 100 females, there were 92.2 males. For every 100 females age 18 and over, there were 88.2 males.
The median income for a household in the city was $30,938, and the median income for a family was $36,250. Males had a median income of $30,000 versus $20,000 for females. The per capita income for the city was $15,845. About 14.2% of families and 17.2% of the population were below the poverty line, including 22.2% of those under age 18 and 14.2% of those age 65 or over.
Common Questions
What is Per Capita Income in Lake Colorado City?
Per Capita income in Lake Colorado City is $32,788.
What is the Median Family Income in Lake Colorado City?
Median Family Income in Lake Colorado City is $152,500.
What is the Median Household income in Lake Colorado City?
Median Household Income in Lake Colorado City is $65,000.
What is Income or Wage Gap in Lake Colorado City?
Income or Wage Gap in Lake Colorado City is 14.0%.
Women in Lake Colorado City earn 86.0 cents for every dollar earned by a man.
What is Inequality or Gini Index in Lake Colorado City?
Inequality or Gini Index in Lake Colorado City is 0.47.
What is the Total Population of Lake Colorado City?
Total Population of Lake Colorado City is 903.
What is the Total Male Population of Lake Colorado City?
Total Male Population of Lake Colorado City is 458.
What is the Total Female Population of Lake Colorado City?
Total Female Population of Lake Colorado City is 445.
What is the Ratio of Males per 100 Females in Lake Colorado City?
There are 102.92 Males per 100 Females in Lake Colorado City.
What is the Ratio of Females per 100 Males in Lake Colorado City?
There are 97.16 Females per 100 Males in Lake Colorado City.
What is the Median Population Age in Lake Colorado City?
Median Population Age in Lake Colorado City is 46.1 Years.
What is the Average Family Size in Lake Colorado City
Average Family Size in Lake Colorado City is 4.3 People.
What is the Average Household Size in Lake Colorado City
Average Household Size in Lake Colorado City is 3.5 People.
How Large is the Labor Force in Lake Colorado City?
There are 593 People in the Labor Forcein in Lake Colorado City.
What is the Percentage of People in the Labor Force in Lake Colorado City?
70.2% of People are in the Labor Force in Lake Colorado City.
What is the Unemployment Rate in Lake Colorado City?
Unemployment Rate in Lake Colorado City is 1.3%.