Coyote Flats, TX Map & Demographics
Coyote Flats Map
Coyote Flats Overview
$32,378
PER CAPITA INCOME
$53,750
AVG FAMILY INCOME
$61,250
AVG HOUSEHOLD INCOME
55.6%
WAGE / INCOME GAP [ % ]
44.4¢/ $1
WAGE / INCOME GAP [ $ ]
0.39
INEQUALITY / GINI INDEX
337
TOTAL POPULATION
173
MALE POPULATION
164
FEMALE POPULATION
105.49
MALES / 100 FEMALES
94.80
FEMALES / 100 MALES
53.2
MEDIAN AGE
2.7
AVG FAMILY SIZE
2.7
AVG HOUSEHOLD SIZE
154
LABOR FORCE [ PEOPLE ]
55.0%
PERCENT IN LABOR FORCE
1.9%
UNEMPLOYMENT RATE
Income in Coyote Flats
Income Overview in Coyote Flats
Per Capita Income in Coyote Flats is $32,378, while median incomes of families and households are $53,750 and $61,250 respectively.
| Characteristic | Number | Measure |
| Per Capita Income | 337 | $32,378 |
| Median Family Income | 108 | $53,750 |
| Mean Family Income | 108 | $77,693 |
| Median Household Income | 123 | $61,250 |
| Mean Household Income | 123 | $86,694 |
| Income Deficit | 108 | $0 |
| Wage / Income Gap (%) | 337 | 55.55% |
| Wage / Income Gap ($) | 337 | 44.45¢ per $1 |
| Gini / Inequality Index | 337 | 0.39 |
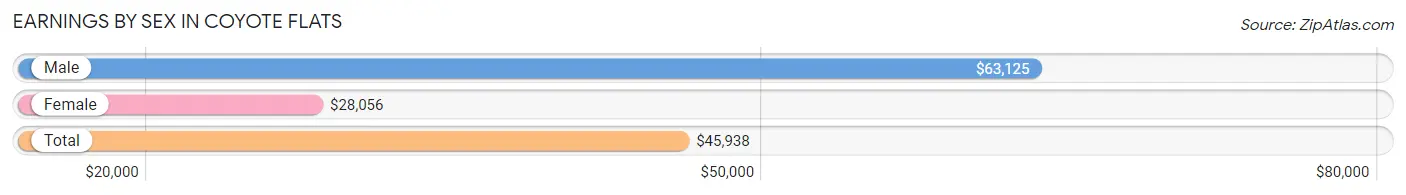
Earnings by Sex in Coyote Flats
Average Earnings in Coyote Flats are $45,938, $63,125 for men and $28,056 for women, a difference of 55.5%.
| Sex | Number | Average Earnings |
| Male | 91 (58.0%) | $63,125 |
| Female | 66 (42.0%) | $28,056 |
| Total | 157 (100.0%) | $45,938 |
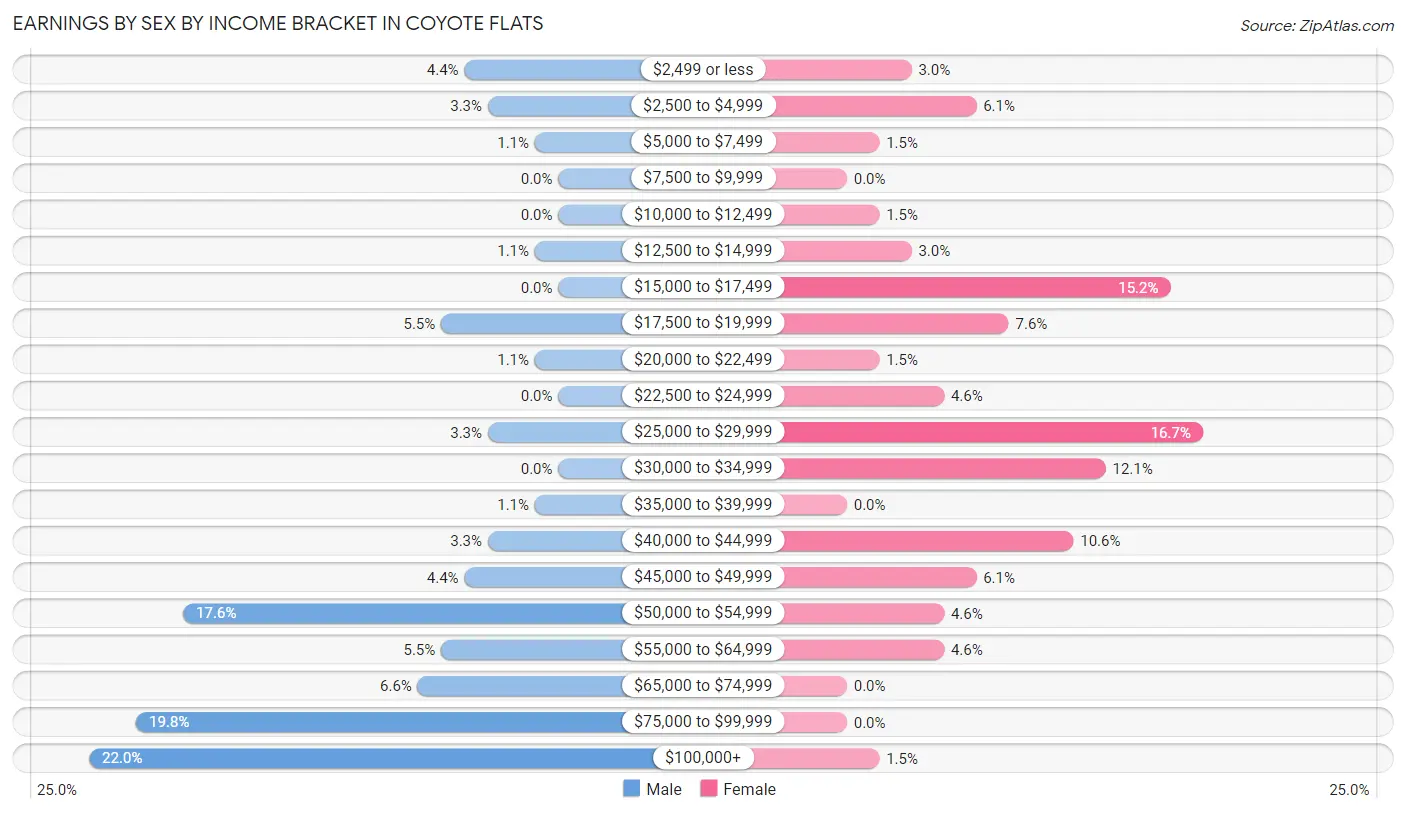
Earnings by Sex by Income Bracket in Coyote Flats
The most common earnings brackets in Coyote Flats are $100,000+ for men (20 | 22.0%) and $25,000 to $29,999 for women (11 | 16.7%).
| Income | Male | Female |
| $2,499 or less | 4 (4.4%) | 2 (3.0%) |
| $2,500 to $4,999 | 3 (3.3%) | 4 (6.1%) |
| $5,000 to $7,499 | 1 (1.1%) | 1 (1.5%) |
| $7,500 to $9,999 | 0 (0.0%) | 0 (0.0%) |
| $10,000 to $12,499 | 0 (0.0%) | 1 (1.5%) |
| $12,500 to $14,999 | 1 (1.1%) | 2 (3.0%) |
| $15,000 to $17,499 | 0 (0.0%) | 10 (15.1%) |
| $17,500 to $19,999 | 5 (5.5%) | 5 (7.6%) |
| $20,000 to $22,499 | 1 (1.1%) | 1 (1.5%) |
| $22,500 to $24,999 | 0 (0.0%) | 3 (4.5%) |
| $25,000 to $29,999 | 3 (3.3%) | 11 (16.7%) |
| $30,000 to $34,999 | 0 (0.0%) | 8 (12.1%) |
| $35,000 to $39,999 | 1 (1.1%) | 0 (0.0%) |
| $40,000 to $44,999 | 3 (3.3%) | 7 (10.6%) |
| $45,000 to $49,999 | 4 (4.4%) | 4 (6.1%) |
| $50,000 to $54,999 | 16 (17.6%) | 3 (4.5%) |
| $55,000 to $64,999 | 5 (5.5%) | 3 (4.5%) |
| $65,000 to $74,999 | 6 (6.6%) | 0 (0.0%) |
| $75,000 to $99,999 | 18 (19.8%) | 0 (0.0%) |
| $100,000+ | 20 (22.0%) | 1 (1.5%) |
| Total | 91 (100.0%) | 66 (100.0%) |
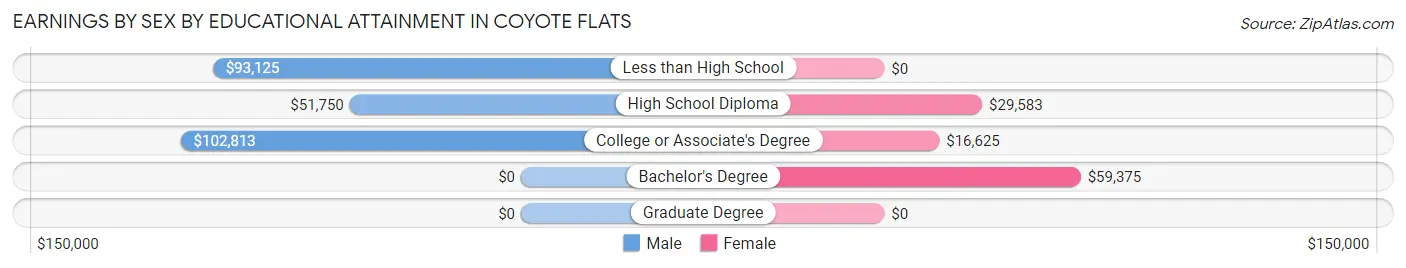
Earnings by Sex by Educational Attainment in Coyote Flats
Average earnings in Coyote Flats are $68,438 for men and $28,056 for women, a difference of 59.0%. Men with an educational attainment of college or associate's degree enjoy the highest average annual earnings of $102,813, while those with high school diploma education earn the least with $51,750. Women with an educational attainment of bachelor's degree earn the most with the average annual earnings of $59,375, while those with college or associate's degree education have the smallest earnings of $16,625.
| Educational Attainment | Male Income | Female Income |
| Less than High School | $93,125 | $0 |
| High School Diploma | $51,750 | $29,583 |
| College or Associate's Degree | $102,813 | $16,625 |
| Bachelor's Degree | - | - |
| Graduate Degree | - | - |
| Total | $68,438 | $28,056 |
Family Income in Coyote Flats
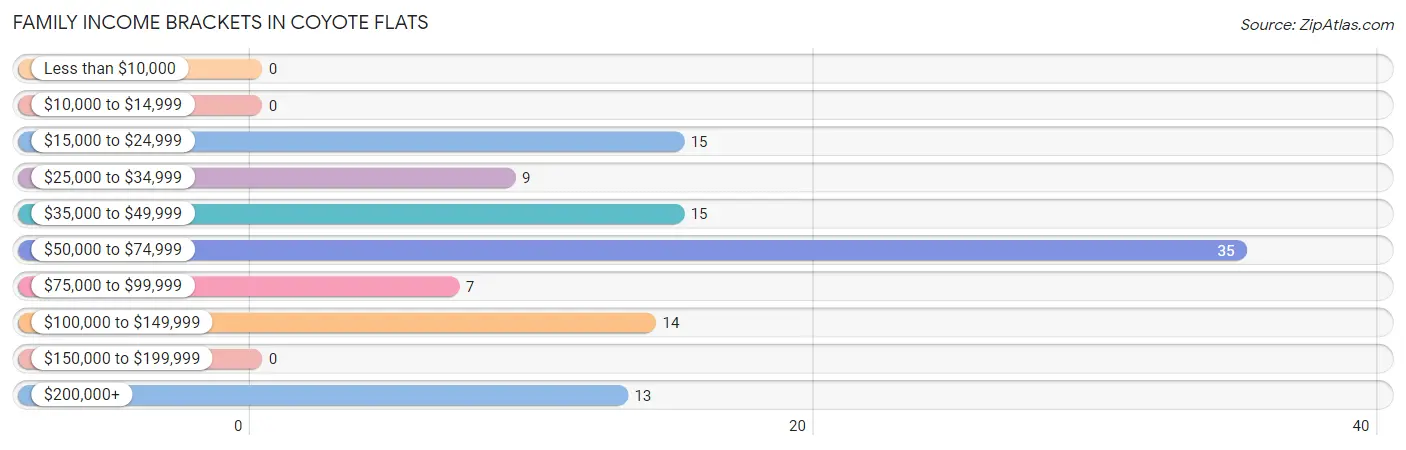
Family Income Brackets in Coyote Flats
According to the Coyote Flats family income data, there are 35 families falling into the $50,000 to $74,999 income range, which is the most common income bracket and makes up 32.4% of all families.
| Income Bracket | # Families | % Families |
| Less than $10,000 | 0 | 0.0% |
| $10,000 to $14,999 | 0 | 0.0% |
| $15,000 to $24,999 | 15 | 13.9% |
| $25,000 to $34,999 | 9 | 8.3% |
| $35,000 to $49,999 | 15 | 13.9% |
| $50,000 to $74,999 | 35 | 32.4% |
| $75,000 to $99,999 | 7 | 6.5% |
| $100,000 to $149,999 | 14 | 13.0% |
| $150,000 to $199,999 | 0 | 0.0% |
| $200,000+ | 13 | 12.0% |
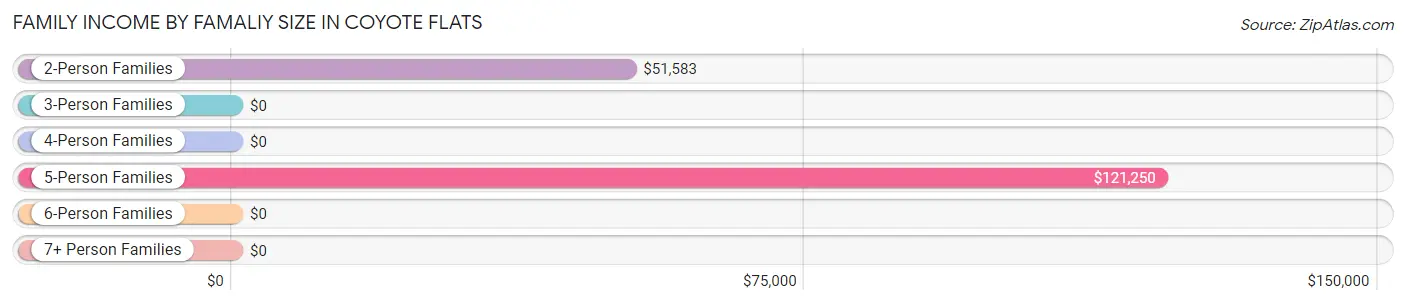
Family Income by Famaliy Size in Coyote Flats
5-person families (4 | 3.7%) account for the highest median family income in Coyote Flats with $121,250 per family, while 2-person families (69 | 63.9%) have the highest median income of $25,792 per family member.
| Income Bracket | # Families | Median Income |
| 2-Person Families | 69 (63.9%) | $51,583 |
| 3-Person Families | 9 (8.3%) | $0 |
| 4-Person Families | 24 (22.2%) | $0 |
| 5-Person Families | 4 (3.7%) | $121,250 |
| 6-Person Families | 2 (1.8%) | $0 |
| 7+ Person Families | 0 (0.0%) | $0 |
| Total | 108 (100.0%) | $53,750 |
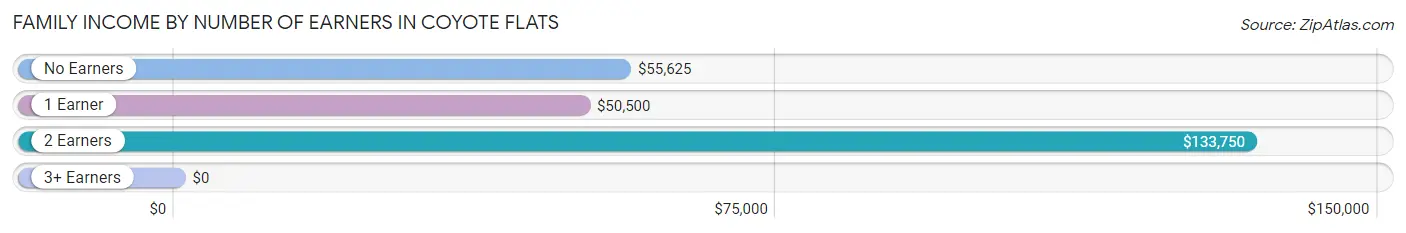
Family Income by Number of Earners in Coyote Flats
| Number of Earners | # Families | Median Income |
| No Earners | 13 (12.0%) | $55,625 |
| 1 Earner | 72 (66.7%) | $50,500 |
| 2 Earners | 18 (16.7%) | $133,750 |
| 3+ Earners | 5 (4.6%) | $0 |
| Total | 108 (100.0%) | $53,750 |
Household Income in Coyote Flats
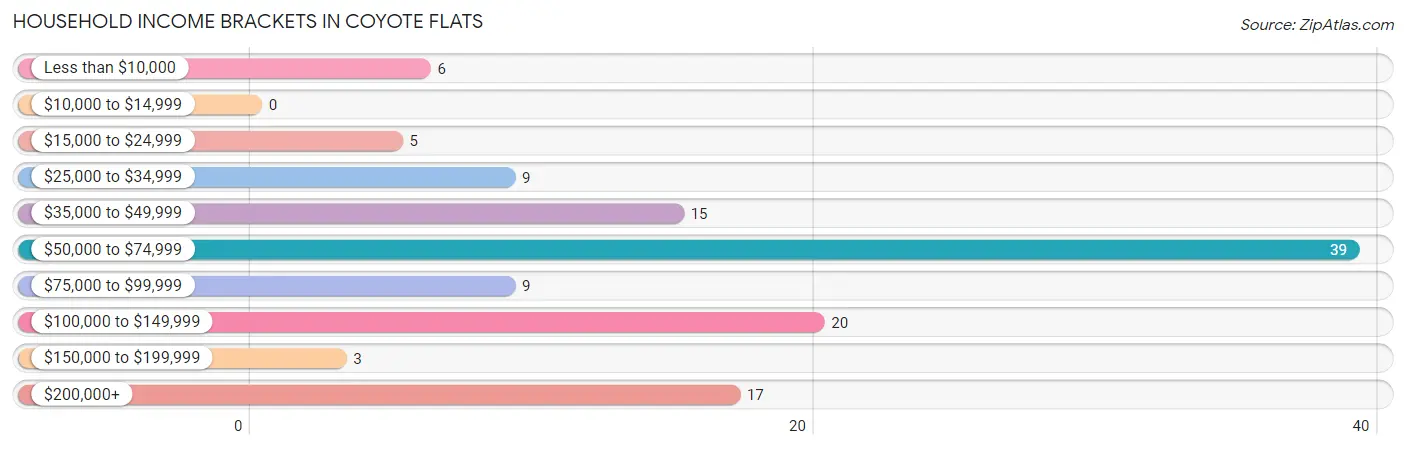
Household Income Brackets in Coyote Flats
With 39 households falling in the category, the $50,000 to $74,999 income range is the most frequent in Coyote Flats, accounting for 31.7% of all households.
| Income Bracket | # Households | % Households |
| Less than $10,000 | 6 | 4.9% |
| $10,000 to $14,999 | 0 | 0.0% |
| $15,000 to $24,999 | 5 | 4.1% |
| $25,000 to $34,999 | 9 | 7.3% |
| $35,000 to $49,999 | 15 | 12.2% |
| $50,000 to $74,999 | 39 | 31.7% |
| $75,000 to $99,999 | 9 | 7.3% |
| $100,000 to $149,999 | 20 | 16.3% |
| $150,000 to $199,999 | 3 | 2.4% |
| $200,000+ | 17 | 13.8% |
Household Income by Householder Age in Coyote Flats
The median household income in Coyote Flats is $61,250, with the highest median household income of $62,250 found in the 65+ years age bracket for the primary householder. A total of 33 households (26.8%) fall into this category. Meanwhile, the 15 to 24 years age bracket for the primary householder has the lowest median household income of $0, with 2 households (1.6%) in this group.
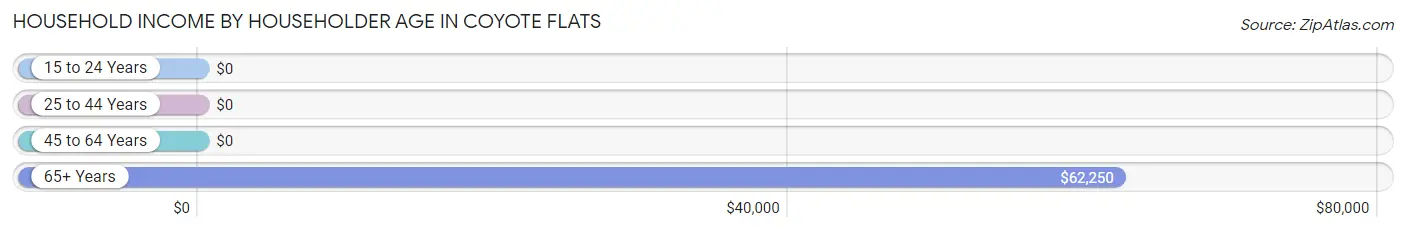
| Income Bracket | # Households | Median Income |
| 15 to 24 Years | 2 (1.6%) | $0 |
| 25 to 44 Years | 29 (23.6%) | $0 |
| 45 to 64 Years | 59 (48.0%) | $0 |
| 65+ Years | 33 (26.8%) | $62,250 |
| Total | 123 (100.0%) | $61,250 |
Poverty in Coyote Flats
Income Below Poverty by Sex and Age in Coyote Flats
With 11.0% poverty level for males and 25.0% for females among the residents of Coyote Flats, under 5 year old males and 15 year old females are the most vulnerable to poverty, with 12 males (75.0%) and 9 females (100.0%) in their respective age groups living below the poverty level.
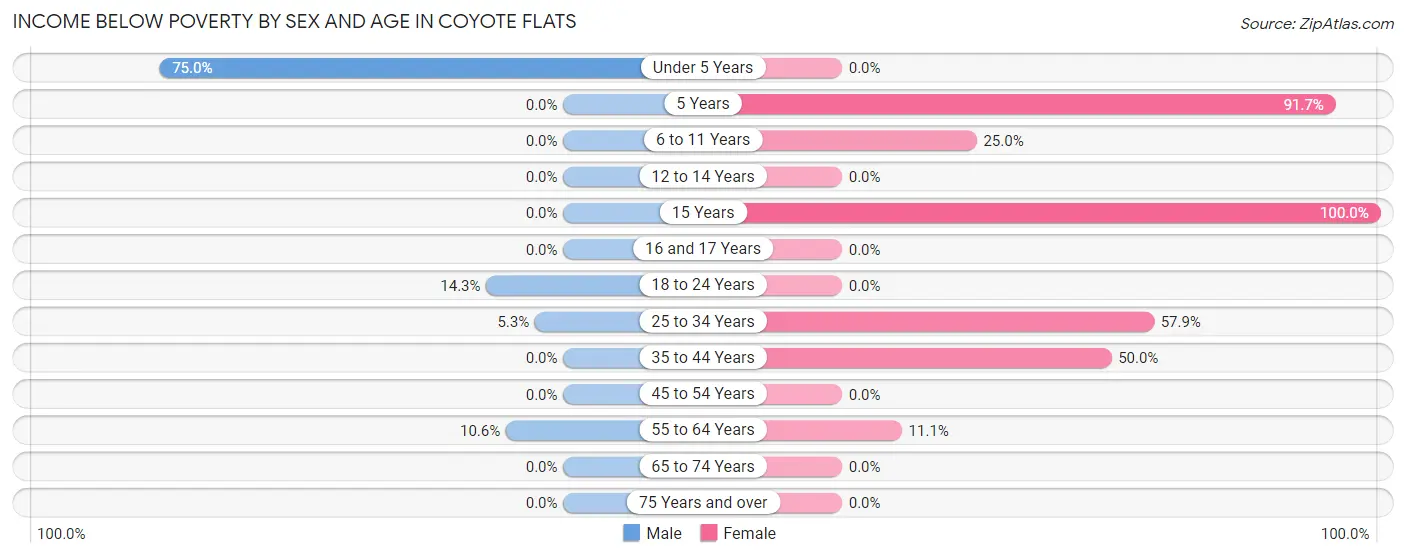
| Age Bracket | Male | Female |
| Under 5 Years | 12 (75.0%) | 0 (0.0%) |
| 5 Years | 0 (0.0%) | 11 (91.7%) |
| 6 to 11 Years | 0 (0.0%) | 1 (25.0%) |
| 12 to 14 Years | 0 (0.0%) | 0 (0.0%) |
| 15 Years | 0 (0.0%) | 9 (100.0%) |
| 16 and 17 Years | 0 (0.0%) | 0 (0.0%) |
| 18 to 24 Years | 1 (14.3%) | 0 (0.0%) |
| 25 to 34 Years | 1 (5.3%) | 11 (57.9%) |
| 35 to 44 Years | 0 (0.0%) | 4 (50.0%) |
| 45 to 54 Years | 0 (0.0%) | 0 (0.0%) |
| 55 to 64 Years | 5 (10.6%) | 5 (11.1%) |
| 65 to 74 Years | 0 (0.0%) | 0 (0.0%) |
| 75 Years and over | 0 (0.0%) | 0 (0.0%) |
| Total | 19 (11.0%) | 41 (25.0%) |
Income Above Poverty by Sex and Age in Coyote Flats
According to the poverty statistics in Coyote Flats, males aged 6 to 11 years and females aged under 5 years are the age groups that are most secure financially, with 100.0% of males and 100.0% of females in these age groups living above the poverty line.
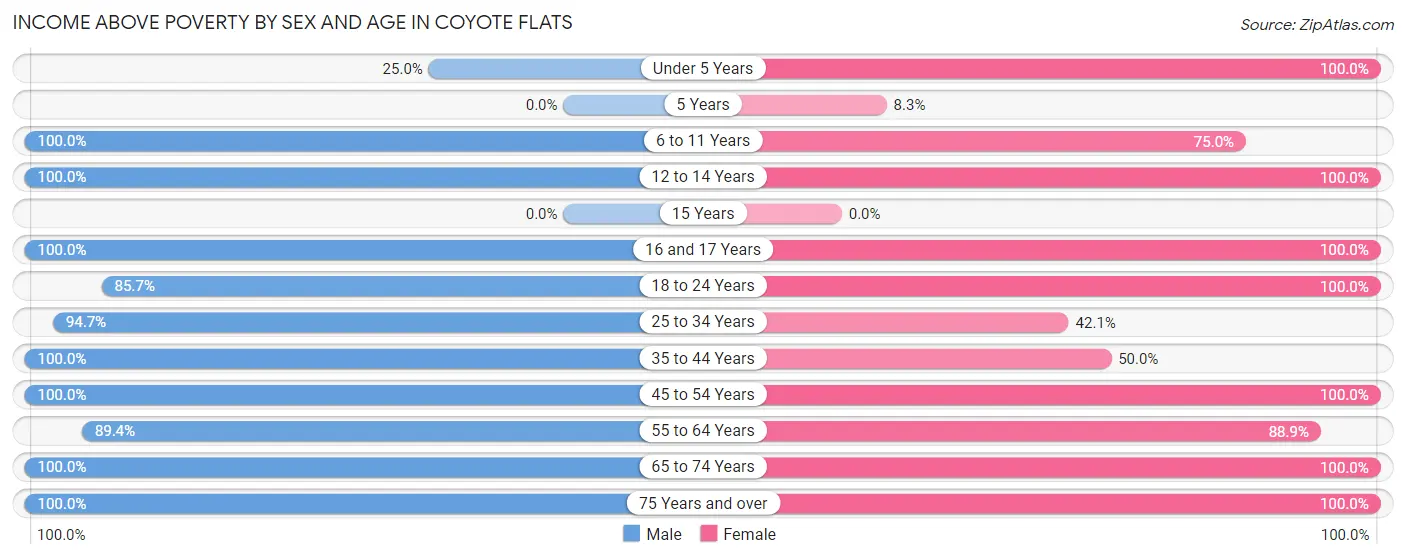
| Age Bracket | Male | Female |
| Under 5 Years | 4 (25.0%) | 2 (100.0%) |
| 5 Years | 0 (0.0%) | 1 (8.3%) |
| 6 to 11 Years | 1 (100.0%) | 3 (75.0%) |
| 12 to 14 Years | 9 (100.0%) | 4 (100.0%) |
| 15 Years | 0 (0.0%) | 0 (0.0%) |
| 16 and 17 Years | 4 (100.0%) | 2 (100.0%) |
| 18 to 24 Years | 6 (85.7%) | 11 (100.0%) |
| 25 to 34 Years | 18 (94.7%) | 8 (42.1%) |
| 35 to 44 Years | 9 (100.0%) | 4 (50.0%) |
| 45 to 54 Years | 25 (100.0%) | 19 (100.0%) |
| 55 to 64 Years | 42 (89.4%) | 40 (88.9%) |
| 65 to 74 Years | 19 (100.0%) | 15 (100.0%) |
| 75 Years and over | 17 (100.0%) | 14 (100.0%) |
| Total | 154 (89.0%) | 123 (75.0%) |
Income Below Poverty Among Married-Couple Families in Coyote Flats
The poverty statistics for married-couple families in Coyote Flats show that 5.6% or 5 of the total 89 families live below the poverty line. Families with 1 or 2 children have the highest poverty rate of 6.2%, comprising of 1 families. On the other hand, families with 3 or 4 children have the lowest poverty rate of 0.0%, which includes 0 families.
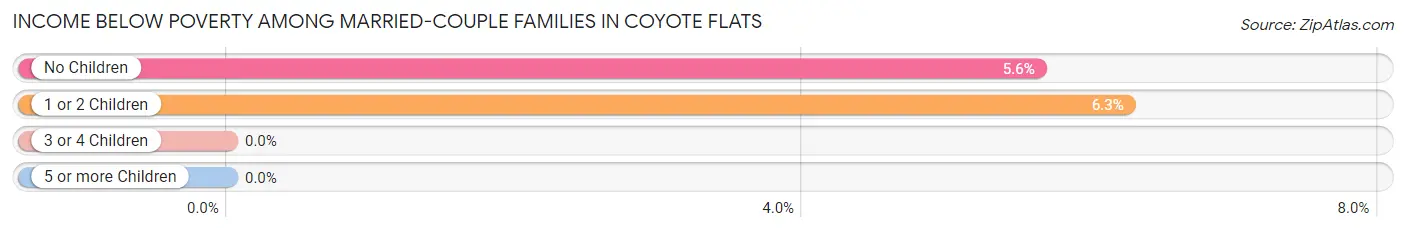
| Children | Above Poverty | Below Poverty |
| No Children | 67 (94.4%) | 4 (5.6%) |
| 1 or 2 Children | 15 (93.8%) | 1 (6.2%) |
| 3 or 4 Children | 2 (100.0%) | 0 (0.0%) |
| 5 or more Children | 0 (0.0%) | 0 (0.0%) |
| Total | 84 (94.4%) | 5 (5.6%) |
Income Below Poverty Among Single-Parent Households in Coyote Flats
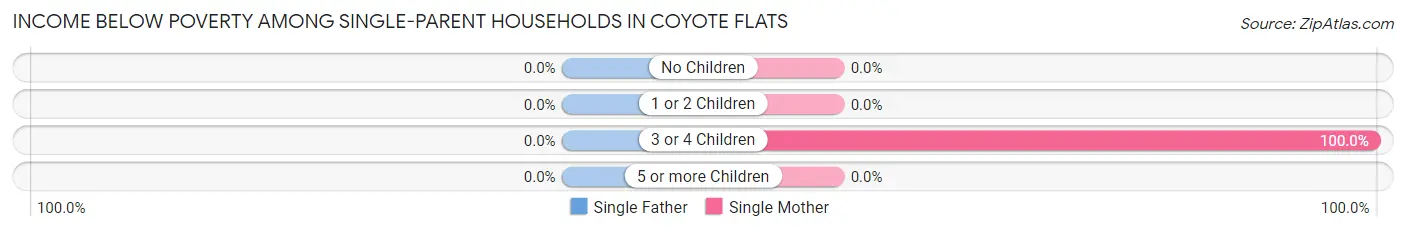
| Children | Single Father | Single Mother |
| No Children | 0 (0.0%) | 0 (0.0%) |
| 1 or 2 Children | 0 (0.0%) | 0 (0.0%) |
| 3 or 4 Children | 0 (0.0%) | 10 (100.0%) |
| 5 or more Children | 0 (0.0%) | 0 (0.0%) |
| Total | 0 (0.0%) | 10 (62.5%) |
Income Below Poverty Among Married-Couple vs Single-Parent Households in Coyote Flats
The poverty data for Coyote Flats shows that 5 of the married-couple family households (5.6%) and 10 of the single-parent households (52.6%) are living below the poverty level. Within the married-couple family households, those with 1 or 2 children have the highest poverty rate, with 1 households (6.2%) falling below the poverty line. Among the single-parent households, those with 3 or 4 children have the highest poverty rate, with 10 household (100.0%) living below poverty.
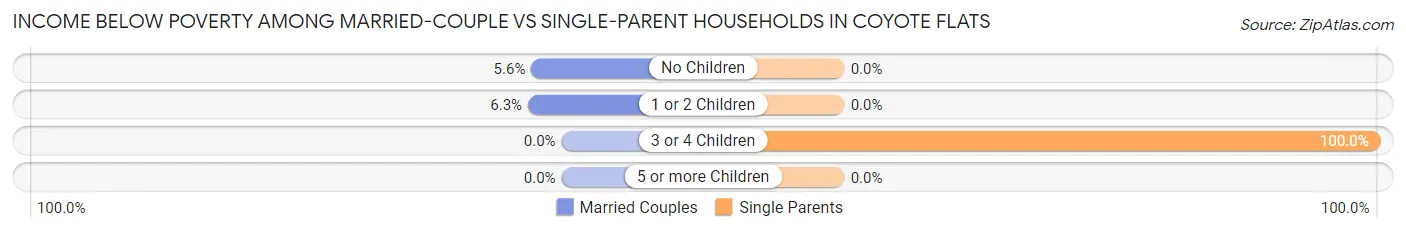
| Children | Married-Couple Families | Single-Parent Households |
| No Children | 4 (5.6%) | 0 (0.0%) |
| 1 or 2 Children | 1 (6.2%) | 0 (0.0%) |
| 3 or 4 Children | 0 (0.0%) | 10 (100.0%) |
| 5 or more Children | 0 (0.0%) | 0 (0.0%) |
| Total | 5 (5.6%) | 10 (52.6%) |
Race in Coyote Flats
The most populous races in Coyote Flats are White / Caucasian (264 | 78.3%), Hispanic or Latino (75 | 22.3%), and Some other Race (68 | 20.2%).
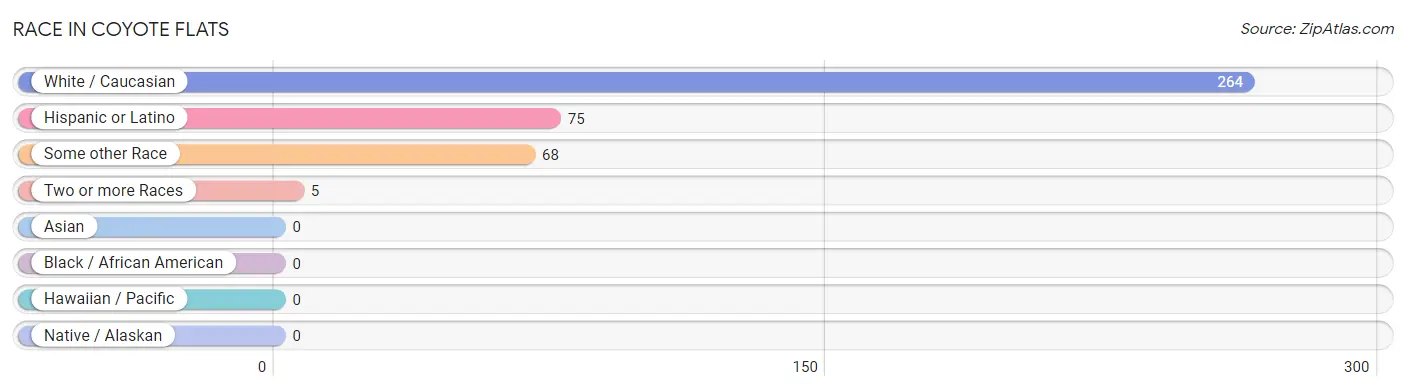
| Race | # Population | % Population |
| Asian | 0 | 0.0% |
| Black / African American | 0 | 0.0% |
| Hawaiian / Pacific | 0 | 0.0% |
| Hispanic or Latino | 75 | 22.3% |
| Native / Alaskan | 0 | 0.0% |
| White / Caucasian | 264 | 78.3% |
| Two or more Races | 5 | 1.5% |
| Some other Race | 68 | 20.2% |
| Total | 337 | 100.0% |
Ancestry in Coyote Flats
The most populous ancestries reported in Coyote Flats are American (121 | 35.9%), Mexican (73 | 21.7%), English (34 | 10.1%), Irish (19 | 5.6%), and Scottish (9 | 2.7%), together accounting for 76.0% of all Coyote Flats residents.
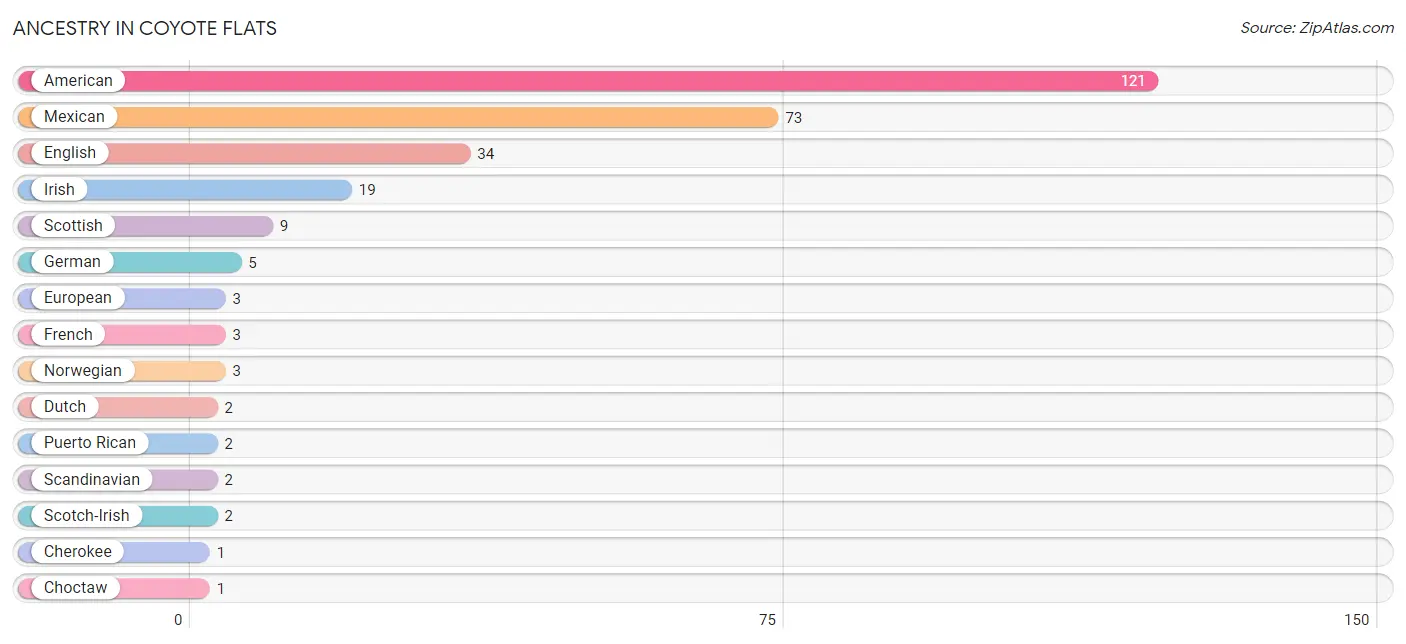
| Ancestry | # Population | % Population |
| American | 121 | 35.9% |
| Cherokee | 1 | 0.3% |
| Choctaw | 1 | 0.3% |
| Dutch | 2 | 0.6% |
| English | 34 | 10.1% |
| European | 3 | 0.9% |
| French | 3 | 0.9% |
| German | 5 | 1.5% |
| Irish | 19 | 5.6% |
| Mexican | 73 | 21.7% |
| Norwegian | 3 | 0.9% |
| Puerto Rican | 2 | 0.6% |
| Scandinavian | 2 | 0.6% |
| Scotch-Irish | 2 | 0.6% |
| Scottish | 9 | 2.7% |
| Welsh | 1 | 0.3% | View All 16 Rows |
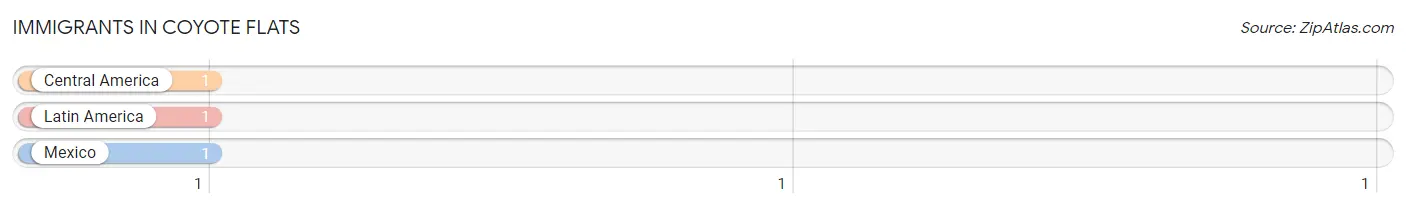
Immigrants in Coyote Flats
The most numerous immigrant groups reported in Coyote Flats came from Central America (1 | 0.3%), Latin America (1 | 0.3%), and Mexico (1 | 0.3%), together accounting for 0.9% of all Coyote Flats residents.
| Immigration Origin | # Population | % Population |
| Central America | 1 | 0.3% |
| Latin America | 1 | 0.3% |
| Mexico | 1 | 0.3% | View All 3 Rows |
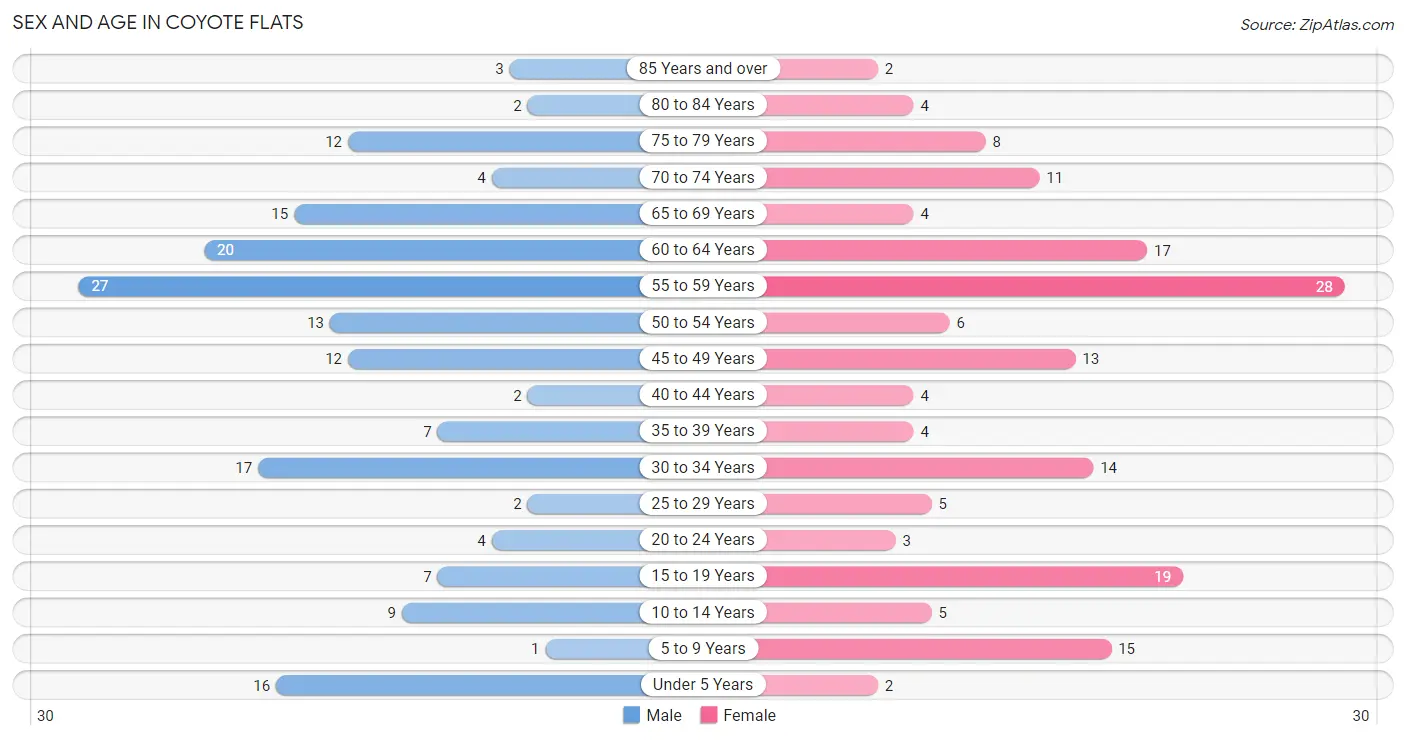
Sex and Age in Coyote Flats
Sex and Age in Coyote Flats
The most populous age groups in Coyote Flats are 55 to 59 Years (27 | 15.6%) for men and 55 to 59 Years (28 | 17.1%) for women.
| Age Bracket | Male | Female |
| Under 5 Years | 16 (9.2%) | 2 (1.2%) |
| 5 to 9 Years | 1 (0.6%) | 15 (9.1%) |
| 10 to 14 Years | 9 (5.2%) | 5 (3.0%) |
| 15 to 19 Years | 7 (4.1%) | 19 (11.6%) |
| 20 to 24 Years | 4 (2.3%) | 3 (1.8%) |
| 25 to 29 Years | 2 (1.2%) | 5 (3.0%) |
| 30 to 34 Years | 17 (9.8%) | 14 (8.5%) |
| 35 to 39 Years | 7 (4.1%) | 4 (2.4%) |
| 40 to 44 Years | 2 (1.2%) | 4 (2.4%) |
| 45 to 49 Years | 12 (6.9%) | 13 (7.9%) |
| 50 to 54 Years | 13 (7.5%) | 6 (3.7%) |
| 55 to 59 Years | 27 (15.6%) | 28 (17.1%) |
| 60 to 64 Years | 20 (11.6%) | 17 (10.4%) |
| 65 to 69 Years | 15 (8.7%) | 4 (2.4%) |
| 70 to 74 Years | 4 (2.3%) | 11 (6.7%) |
| 75 to 79 Years | 12 (6.9%) | 8 (4.9%) |
| 80 to 84 Years | 2 (1.2%) | 4 (2.4%) |
| 85 Years and over | 3 (1.7%) | 2 (1.2%) |
| Total | 173 (100.0%) | 164 (100.0%) |
Families and Households in Coyote Flats
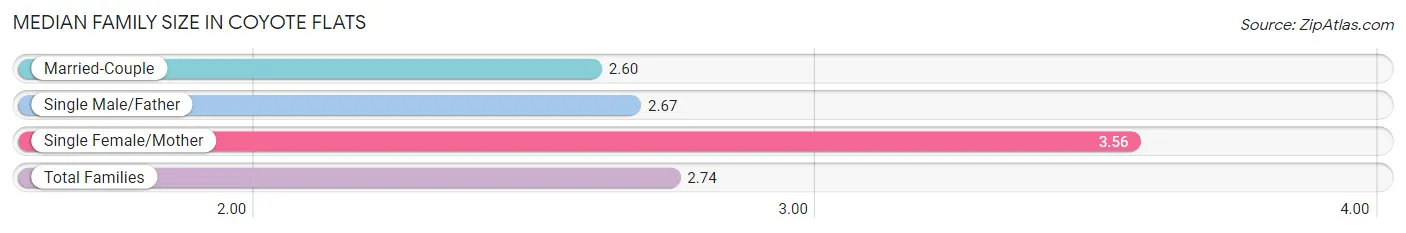
Median Family Size in Coyote Flats
The median family size in Coyote Flats is 2.74 persons per family, with single female/mother families (16 | 14.8%) accounting for the largest median family size of 3.56 persons per family. On the other hand, married-couple families (89 | 82.4%) represent the smallest median family size with 2.60 persons per family.
| Family Type | # Families | Family Size |
| Married-Couple | 89 (82.4%) | 2.60 |
| Single Male/Father | 3 (2.8%) | 2.67 |
| Single Female/Mother | 16 (14.8%) | 3.56 |
| Total Families | 108 (100.0%) | 2.74 |
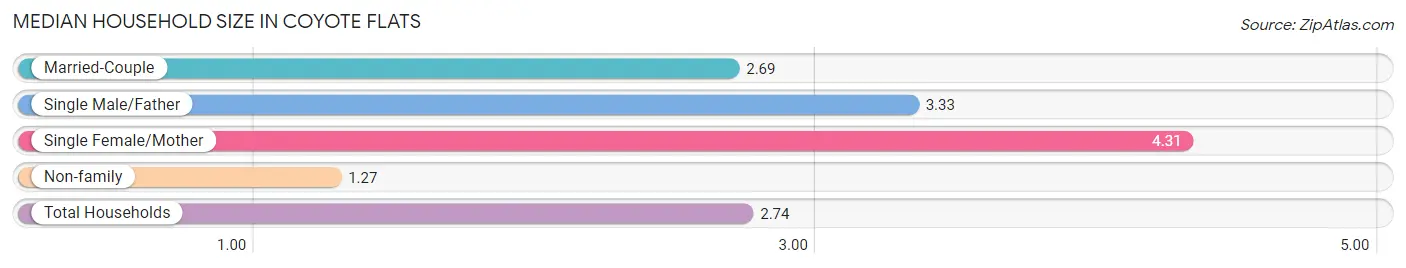
Median Household Size in Coyote Flats
The median household size in Coyote Flats is 2.74 persons per household, with single female/mother households (16 | 13.0%) accounting for the largest median household size of 4.31 persons per household. non-family households (15 | 12.2%) represent the smallest median household size with 1.27 persons per household.
| Household Type | # Households | Household Size |
| Married-Couple | 89 (72.4%) | 2.69 |
| Single Male/Father | 3 (2.4%) | 3.33 |
| Single Female/Mother | 16 (13.0%) | 4.31 |
| Non-family | 15 (12.2%) | 1.27 |
| Total Households | 123 (100.0%) | 2.74 |
Household Size by Marriage Status in Coyote Flats
Out of a total of 123 households in Coyote Flats, 108 (87.8%) are family households, while 15 (12.2%) are nonfamily households. The most numerous type of family households are 2-person households, comprising 67, and the most common type of nonfamily households are 1-person households, comprising 11.
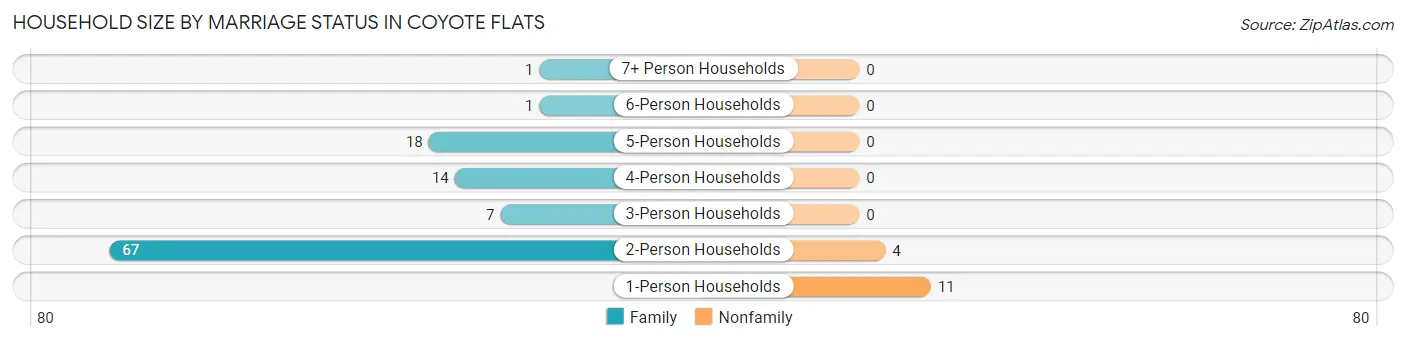
| Household Size | Family Households | Nonfamily Households |
| 1-Person Households | - | 11 (8.9%) |
| 2-Person Households | 67 (54.5%) | 4 (3.3%) |
| 3-Person Households | 7 (5.7%) | 0 (0.0%) |
| 4-Person Households | 14 (11.4%) | 0 (0.0%) |
| 5-Person Households | 18 (14.6%) | 0 (0.0%) |
| 6-Person Households | 1 (0.8%) | 0 (0.0%) |
| 7+ Person Households | 1 (0.8%) | 0 (0.0%) |
| Total | 108 (87.8%) | 15 (12.2%) |
Female Fertility in Coyote Flats
Fertility by Age in Coyote Flats
| Age Bracket | Women with Births | Births / 1,000 Women |
| 15 to 19 years | 0 (0.0%) | 0.0 |
| 20 to 34 years | 0 (0.0%) | 0.0 |
| 35 to 50 years | 0 (0.0%) | 0.0 |
| Total | 0 (0.0%) | 0.0 |
Fertility by Age by Marriage Status in Coyote Flats
| Age Bracket | Married | Unmarried |
| 15 to 19 years | 0 (0.0%) | 0 (0.0%) |
| 20 to 34 years | 0 (0.0%) | 0 (0.0%) |
| 35 to 50 years | 0 (0.0%) | 0 (0.0%) |
| Total | 0 (0.0%) | 0 (0.0%) |
Fertility by Education in Coyote Flats
| Educational Attainment | Women with Births | Births / 1,000 Women |
| Less than High School | 0 (0.0%) | 0.0 |
| High School Diploma | 0 (0.0%) | 0.0 |
| College or Associate's Degree | 0 (0.0%) | 0.0 |
| Bachelor's Degree | 0 (0.0%) | 0.0 |
| Graduate Degree | 0 (0.0%) | 0.0 |
| Total | 0 (0.0%) | 0.0 |
Fertility by Education by Marriage Status in Coyote Flats
| Educational Attainment | Married | Unmarried |
| Less than High School | 0 (0.0%) | 0 (0.0%) |
| High School Diploma | 0 (0.0%) | 0 (0.0%) |
| College or Associate's Degree | 0 (0.0%) | 0 (0.0%) |
| Bachelor's Degree | 0 (0.0%) | 0 (0.0%) |
| Graduate Degree | 0 (0.0%) | 0 (0.0%) |
| Total | 0 (0.0%) | 0 (0.0%) |
Employment Characteristics in Coyote Flats
Employment by Class of Employer in Coyote Flats
Among the 150 employed individuals in Coyote Flats, private company employees (130 | 86.7%), local government employees (9 | 6.0%), and self-employed (not incorporated) (8 | 5.3%) make up the most common classes of employment.
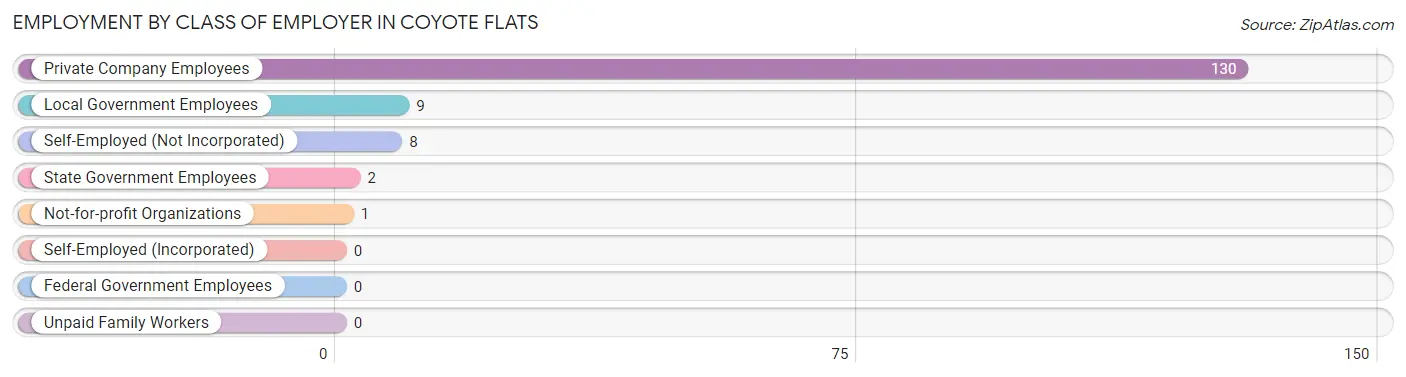
| Employer Class | # Employees | % Employees |
| Private Company Employees | 130 | 86.7% |
| Self-Employed (Incorporated) | 0 | 0.0% |
| Self-Employed (Not Incorporated) | 8 | 5.3% |
| Not-for-profit Organizations | 1 | 0.7% |
| Local Government Employees | 9 | 6.0% |
| State Government Employees | 2 | 1.3% |
| Federal Government Employees | 0 | 0.0% |
| Unpaid Family Workers | 0 | 0.0% |
| Total | 150 | 100.0% |
Employment Status by Age in Coyote Flats
According to the labor force statistics for Coyote Flats, out of the total population over 16 years of age (280), 55.0% or 154 individuals are in the labor force, with 1.9% or 3 of them unemployed. The age group with the highest labor force participation rate is 20 to 24 years, with 85.7% or 6 individuals in the labor force. Within the labor force, the 16 to 19 years age range has the highest percentage of unemployed individuals, with 33.3% or 2 of them being unemployed.
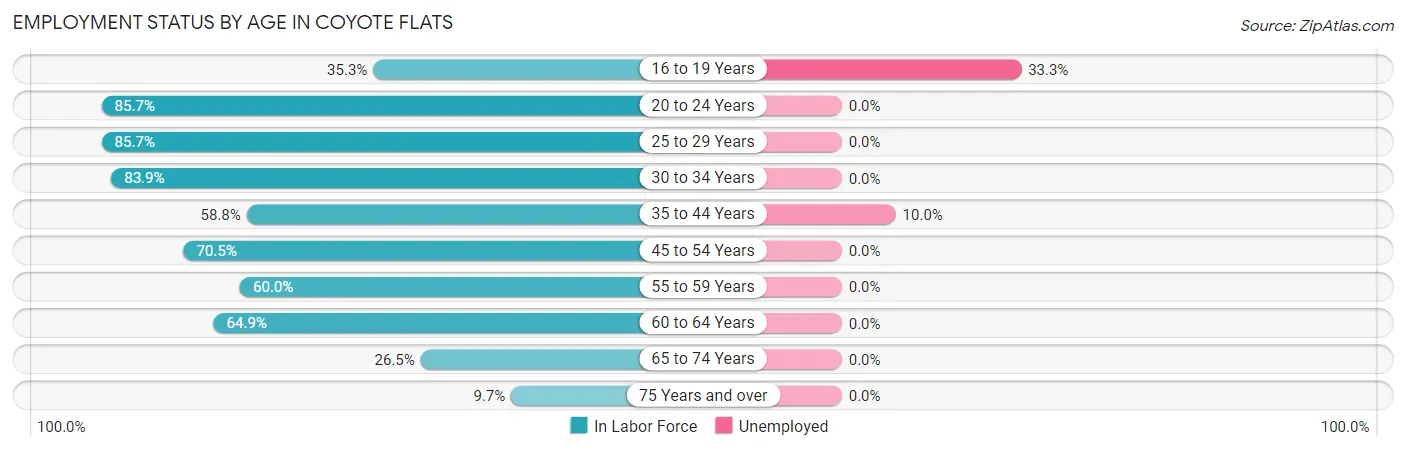
| Age Bracket | In Labor Force | Unemployed |
| 16 to 19 Years | 6 (35.3%) | 2 (33.3%) |
| 20 to 24 Years | 6 (85.7%) | 0 (0.0%) |
| 25 to 29 Years | 6 (85.7%) | 0 (0.0%) |
| 30 to 34 Years | 26 (83.9%) | 0 (0.0%) |
| 35 to 44 Years | 10 (58.8%) | 1 (10.0%) |
| 45 to 54 Years | 31 (70.5%) | 0 (0.0%) |
| 55 to 59 Years | 33 (60.0%) | 0 (0.0%) |
| 60 to 64 Years | 24 (64.9%) | 0 (0.0%) |
| 65 to 74 Years | 9 (26.5%) | 0 (0.0%) |
| 75 Years and over | 3 (9.7%) | 0 (0.0%) |
| Total | 154 (55.0%) | 3 (1.9%) |
Employment Status by Educational Attainment in Coyote Flats
According to labor force statistics for Coyote Flats, 68.1% of individuals (130) out of the total population between 25 and 64 years of age (191) are in the labor force, with 0.8% or 1 of them being unemployed. The group with the highest labor force participation rate are those with the educational attainment of less than high school, with 76.0% or 19 individuals in the labor force. Within the labor force, individuals with less than high school education have the highest percentage of unemployment, with 5.3% or 1 of them being unemployed.
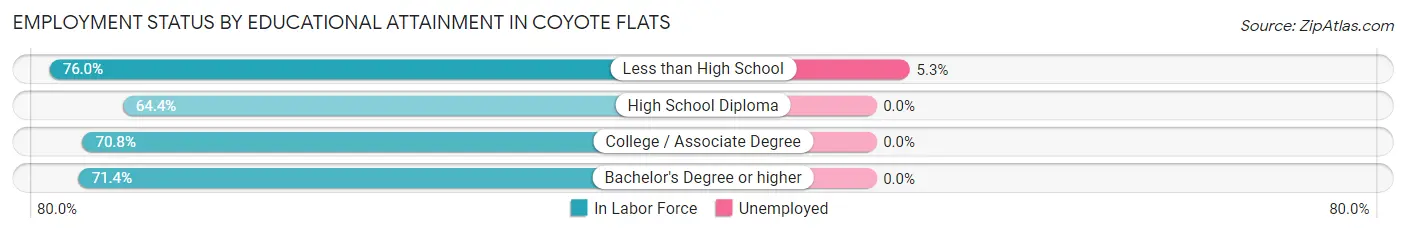
| Educational Attainment | In Labor Force | Unemployed |
| Less than High School | 19 (76.0%) | 1 (5.3%) |
| High School Diploma | 67 (64.4%) | 0 (0.0%) |
| College / Associate Degree | 34 (70.8%) | 0 (0.0%) |
| Bachelor's Degree or higher | 10 (71.4%) | 0 (0.0%) |
| Total | 130 (68.1%) | 2 (0.8%) |
Employment Occupations by Sex in Coyote Flats
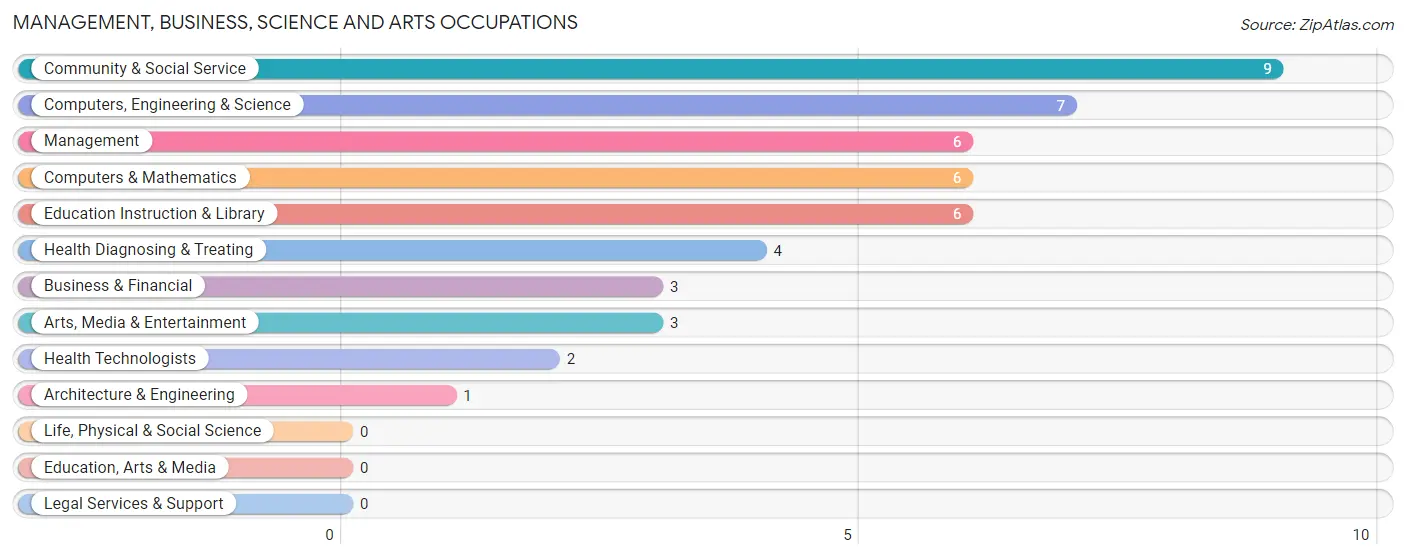
Management, Business, Science and Arts Occupations
The most common Management, Business, Science and Arts occupations in Coyote Flats are Community & Social Service (9 | 6.0%), Computers, Engineering & Science (7 | 4.6%), Management (6 | 4.0%), Computers & Mathematics (6 | 4.0%), and Education Instruction & Library (6 | 4.0%).
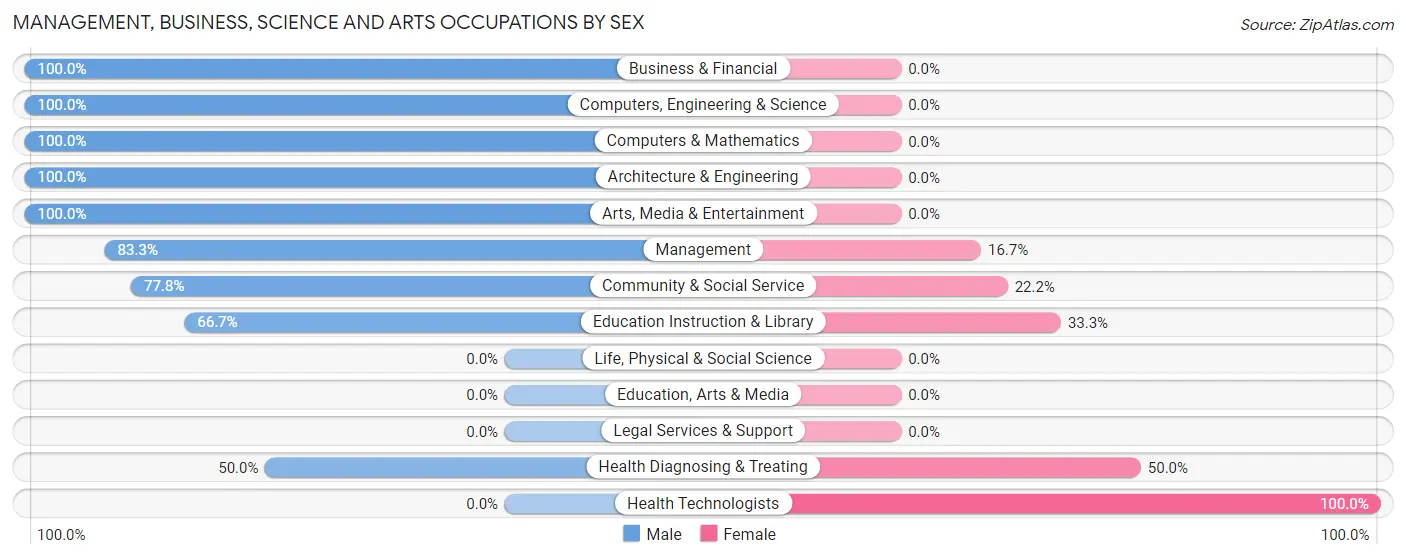
Management, Business, Science and Arts Occupations by Sex
Within the Management, Business, Science and Arts occupations in Coyote Flats, the most male-oriented occupations are Business & Financial (100.0%), Computers, Engineering & Science (100.0%), and Computers & Mathematics (100.0%), while the most female-oriented occupations are Health Technologists (100.0%), Health Diagnosing & Treating (50.0%), and Education Instruction & Library (33.3%).
| Occupation | Male | Female |
| Management | 5 (83.3%) | 1 (16.7%) |
| Business & Financial | 3 (100.0%) | 0 (0.0%) |
| Computers, Engineering & Science | 7 (100.0%) | 0 (0.0%) |
| Computers & Mathematics | 6 (100.0%) | 0 (0.0%) |
| Architecture & Engineering | 1 (100.0%) | 0 (0.0%) |
| Life, Physical & Social Science | 0 (0.0%) | 0 (0.0%) |
| Community & Social Service | 7 (77.8%) | 2 (22.2%) |
| Education, Arts & Media | 0 (0.0%) | 0 (0.0%) |
| Legal Services & Support | 0 (0.0%) | 0 (0.0%) |
| Education Instruction & Library | 4 (66.7%) | 2 (33.3%) |
| Arts, Media & Entertainment | 3 (100.0%) | 0 (0.0%) |
| Health Diagnosing & Treating | 2 (50.0%) | 2 (50.0%) |
| Health Technologists | 0 (0.0%) | 2 (100.0%) |
| Total (Category) | 24 (82.8%) | 5 (17.2%) |
| Total (Overall) | 91 (60.3%) | 60 (39.7%) |
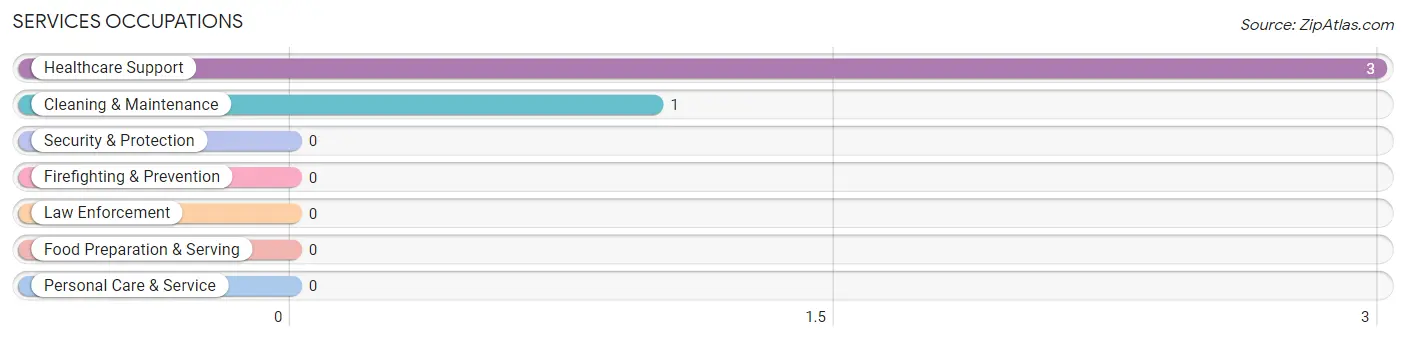
Services Occupations
The most common Services occupations in Coyote Flats are Healthcare Support (3 | 2.0%), and Cleaning & Maintenance (1 | 0.7%).
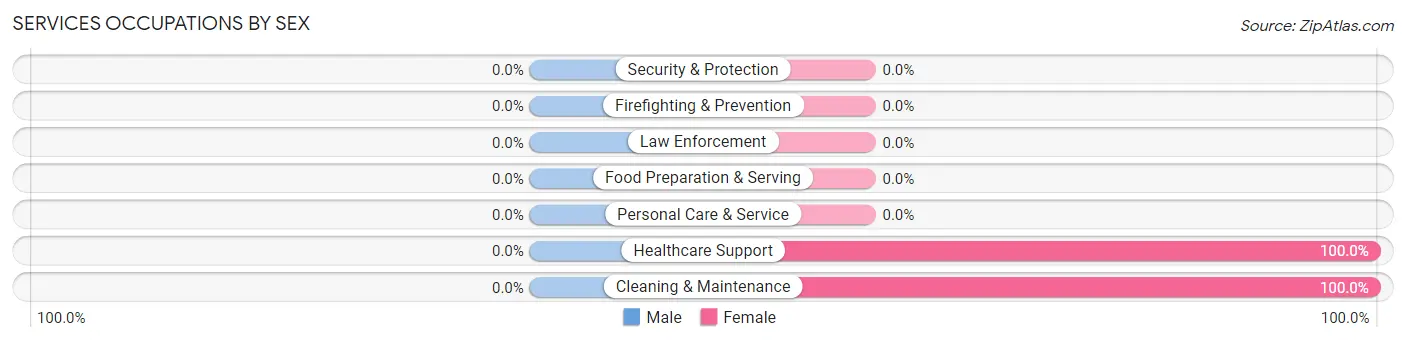
Services Occupations by Sex
| Occupation | Male | Female |
| Healthcare Support | 0 (0.0%) | 3 (100.0%) |
| Security & Protection | 0 (0.0%) | 0 (0.0%) |
| Firefighting & Prevention | 0 (0.0%) | 0 (0.0%) |
| Law Enforcement | 0 (0.0%) | 0 (0.0%) |
| Food Preparation & Serving | 0 (0.0%) | 0 (0.0%) |
| Cleaning & Maintenance | 0 (0.0%) | 1 (100.0%) |
| Personal Care & Service | 0 (0.0%) | 0 (0.0%) |
| Total (Category) | 0 (0.0%) | 4 (100.0%) |
| Total (Overall) | 91 (60.3%) | 60 (39.7%) |
Sales and Office Occupations
The most common Sales and Office occupations in Coyote Flats are Office & Administration (34 | 22.5%), and Sales & Related (3 | 2.0%).
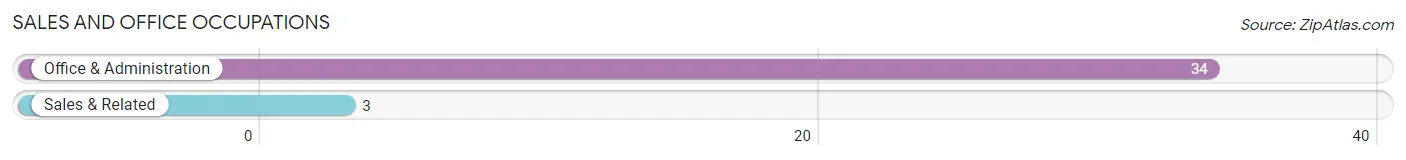
Sales and Office Occupations by Sex
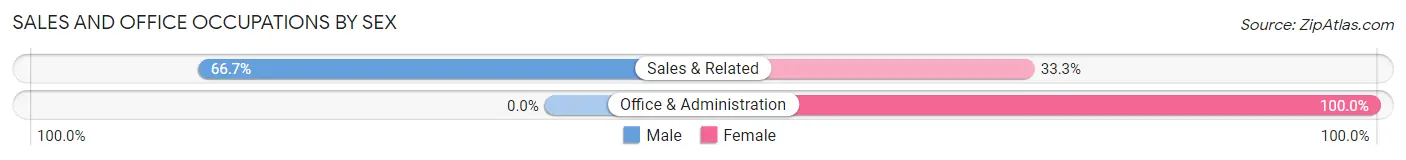
| Occupation | Male | Female |
| Sales & Related | 2 (66.7%) | 1 (33.3%) |
| Office & Administration | 0 (0.0%) | 34 (100.0%) |
| Total (Category) | 2 (5.4%) | 35 (94.6%) |
| Total (Overall) | 91 (60.3%) | 60 (39.7%) |
Natural Resources, Construction and Maintenance Occupations
The most common Natural Resources, Construction and Maintenance occupations in Coyote Flats are Construction & Extraction (9 | 6.0%), and Installation, Maintenance & Repair (4 | 2.6%).
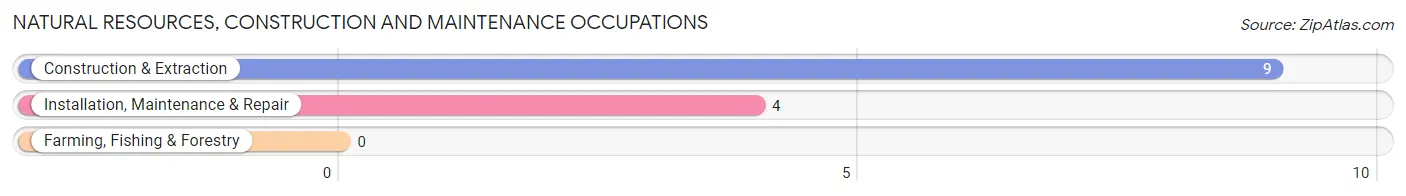
Natural Resources, Construction and Maintenance Occupations by Sex
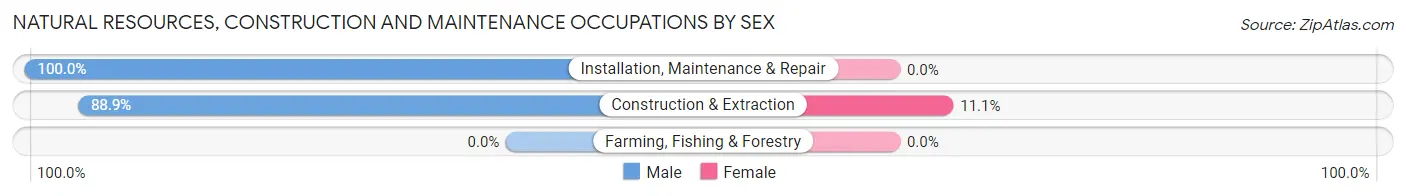
| Occupation | Male | Female |
| Farming, Fishing & Forestry | 0 (0.0%) | 0 (0.0%) |
| Construction & Extraction | 8 (88.9%) | 1 (11.1%) |
| Installation, Maintenance & Repair | 4 (100.0%) | 0 (0.0%) |
| Total (Category) | 12 (92.3%) | 1 (7.7%) |
| Total (Overall) | 91 (60.3%) | 60 (39.7%) |
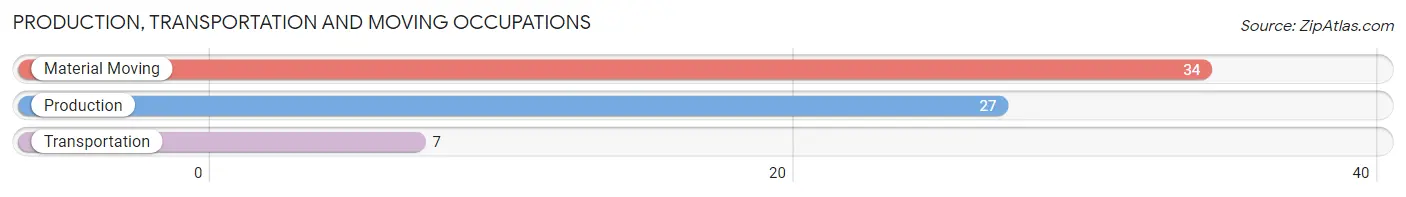
Production, Transportation and Moving Occupations
The most common Production, Transportation and Moving occupations in Coyote Flats are Material Moving (34 | 22.5%), Production (27 | 17.9%), and Transportation (7 | 4.6%).
Production, Transportation and Moving Occupations by Sex
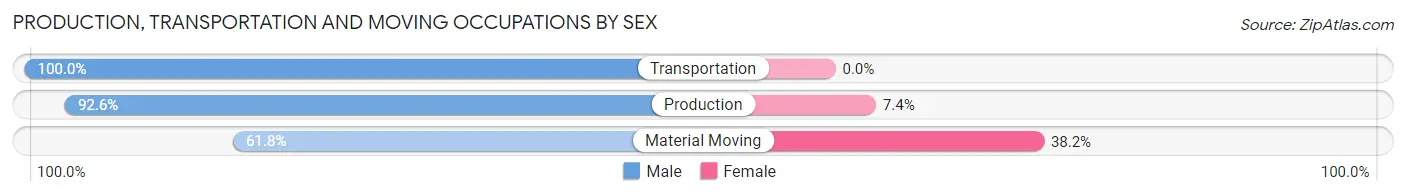
| Occupation | Male | Female |
| Production | 25 (92.6%) | 2 (7.4%) |
| Transportation | 7 (100.0%) | 0 (0.0%) |
| Material Moving | 21 (61.8%) | 13 (38.2%) |
| Total (Category) | 53 (77.9%) | 15 (22.1%) |
| Total (Overall) | 91 (60.3%) | 60 (39.7%) |
Employment Industries by Sex in Coyote Flats
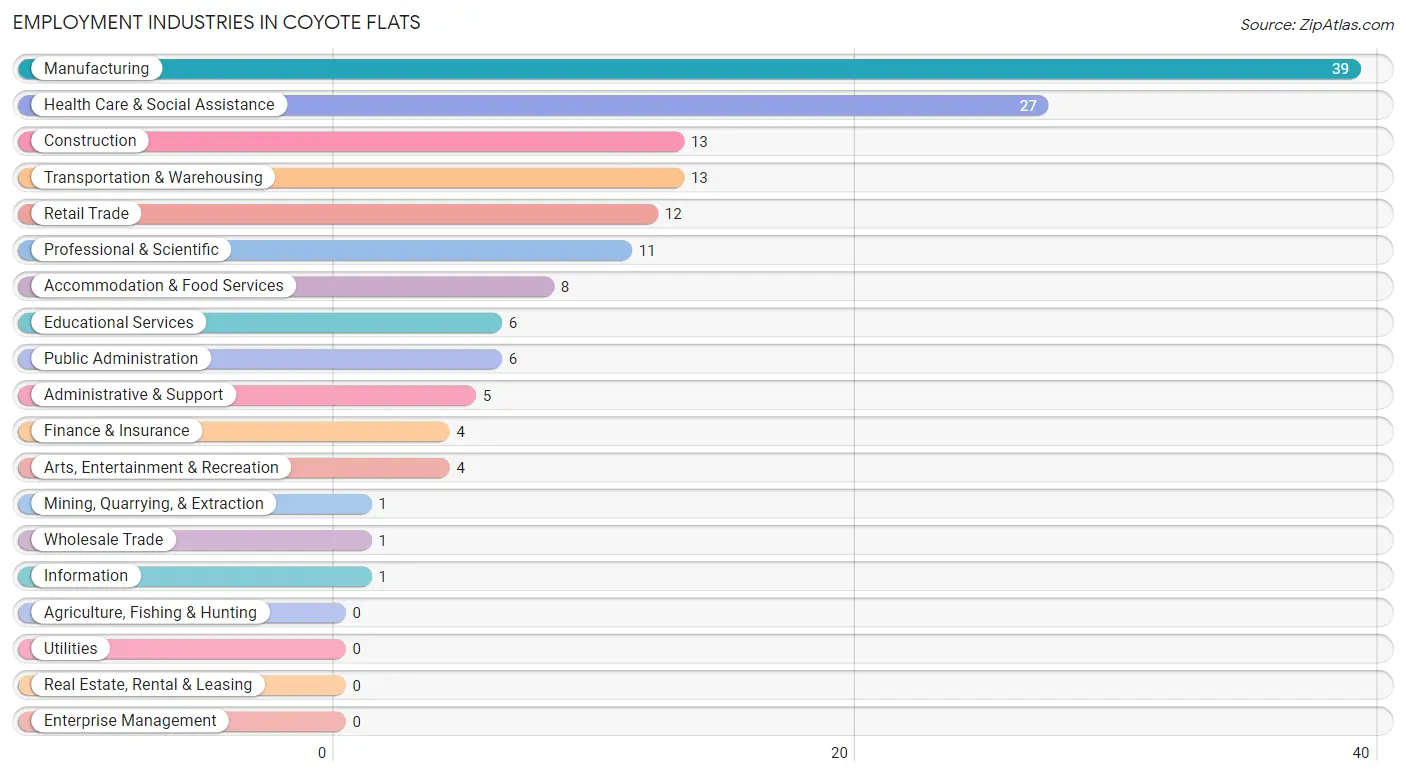
Employment Industries in Coyote Flats
The major employment industries in Coyote Flats include Manufacturing (39 | 25.8%), Health Care & Social Assistance (27 | 17.9%), Construction (13 | 8.6%), Transportation & Warehousing (13 | 8.6%), and Retail Trade (12 | 8.0%).
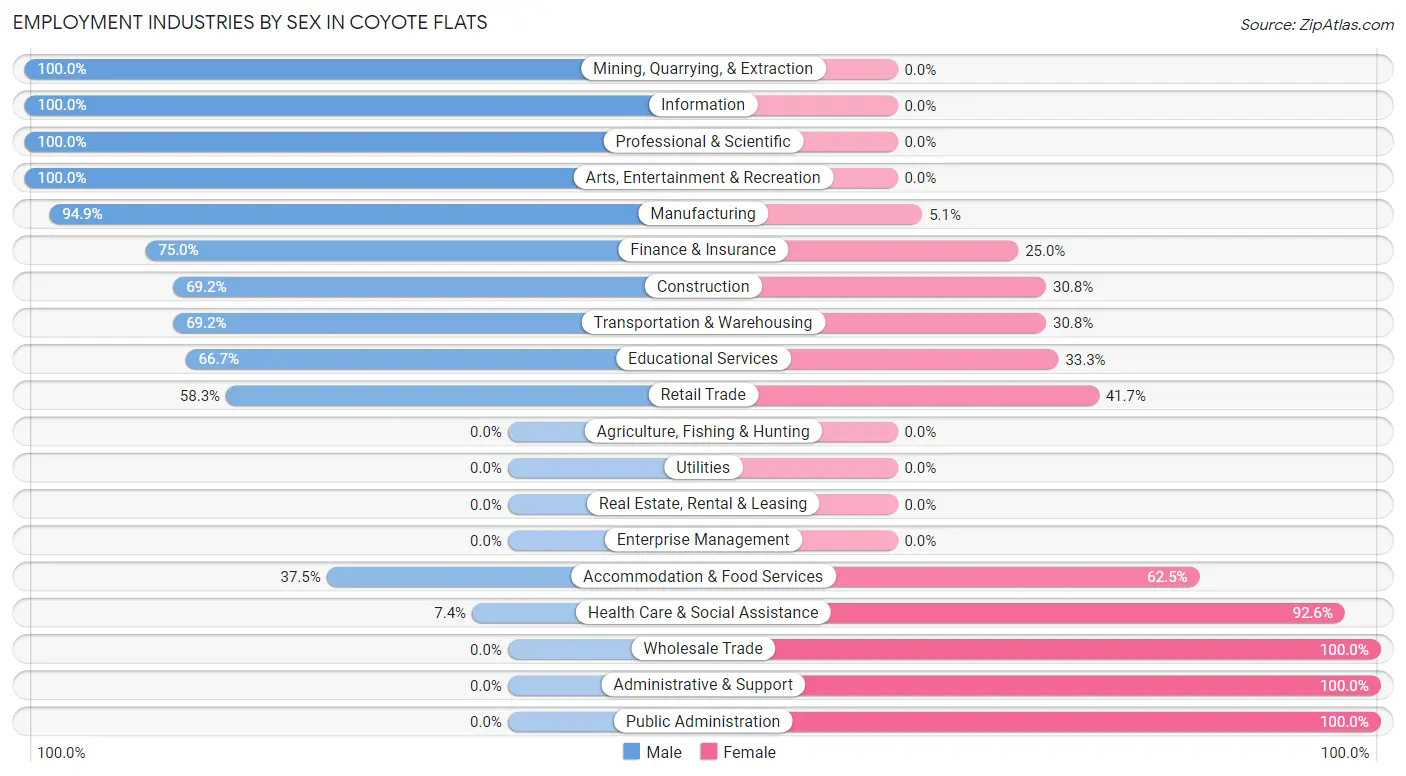
Employment Industries by Sex in Coyote Flats
The Coyote Flats industries that see more men than women are Mining, Quarrying, & Extraction (100.0%), Information (100.0%), and Professional & Scientific (100.0%), whereas the industries that tend to have a higher number of women are Wholesale Trade (100.0%), Administrative & Support (100.0%), and Public Administration (100.0%).
| Industry | Male | Female |
| Agriculture, Fishing & Hunting | 0 (0.0%) | 0 (0.0%) |
| Mining, Quarrying, & Extraction | 1 (100.0%) | 0 (0.0%) |
| Construction | 9 (69.2%) | 4 (30.8%) |
| Manufacturing | 37 (94.9%) | 2 (5.1%) |
| Wholesale Trade | 0 (0.0%) | 1 (100.0%) |
| Retail Trade | 7 (58.3%) | 5 (41.7%) |
| Transportation & Warehousing | 9 (69.2%) | 4 (30.8%) |
| Utilities | 0 (0.0%) | 0 (0.0%) |
| Information | 1 (100.0%) | 0 (0.0%) |
| Finance & Insurance | 3 (75.0%) | 1 (25.0%) |
| Real Estate, Rental & Leasing | 0 (0.0%) | 0 (0.0%) |
| Professional & Scientific | 11 (100.0%) | 0 (0.0%) |
| Enterprise Management | 0 (0.0%) | 0 (0.0%) |
| Administrative & Support | 0 (0.0%) | 5 (100.0%) |
| Educational Services | 4 (66.7%) | 2 (33.3%) |
| Health Care & Social Assistance | 2 (7.4%) | 25 (92.6%) |
| Arts, Entertainment & Recreation | 4 (100.0%) | 0 (0.0%) |
| Accommodation & Food Services | 3 (37.5%) | 5 (62.5%) |
| Public Administration | 0 (0.0%) | 6 (100.0%) |
| Total | 91 (60.3%) | 60 (39.7%) |
Education in Coyote Flats
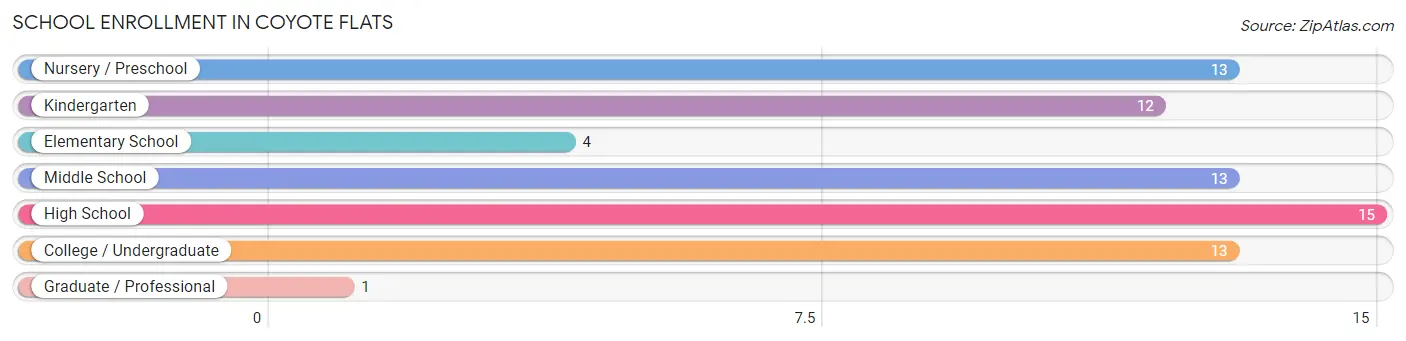
School Enrollment in Coyote Flats
The most common levels of schooling among the 71 students in Coyote Flats are high school (15 | 21.1%), nursery / preschool (13 | 18.3%), and middle school (13 | 18.3%).
| School Level | # Students | % Students |
| Nursery / Preschool | 13 | 18.3% |
| Kindergarten | 12 | 16.9% |
| Elementary School | 4 | 5.6% |
| Middle School | 13 | 18.3% |
| High School | 15 | 21.1% |
| College / Undergraduate | 13 | 18.3% |
| Graduate / Professional | 1 | 1.4% |
| Total | 71 | 100.0% |
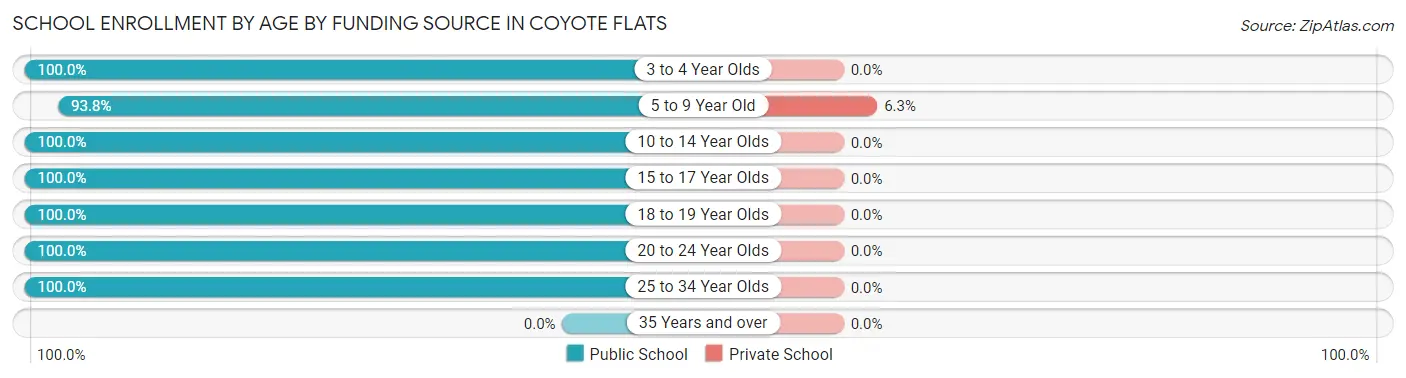
School Enrollment by Age by Funding Source in Coyote Flats
Out of a total of 71 students who are enrolled in schools in Coyote Flats, 1 (1.4%) attend a private institution, while the remaining 70 (98.6%) are enrolled in public schools. The age group of 5 to 9 year old has the highest likelihood of being enrolled in private schools, with 1 (6.2% in the age bracket) enrolled. Conversely, the age group of 3 to 4 year olds has the lowest likelihood of being enrolled in a private school, with 12 (100.0% in the age bracket) attending a public institution.
| Age Bracket | Public School | Private School |
| 3 to 4 Year Olds | 12 (100.0%) | 0 (0.0%) |
| 5 to 9 Year Old | 15 (93.8%) | 1 (6.2%) |
| 10 to 14 Year Olds | 14 (100.0%) | 0 (0.0%) |
| 15 to 17 Year Olds | 15 (100.0%) | 0 (0.0%) |
| 18 to 19 Year Olds | 10 (100.0%) | 0 (0.0%) |
| 20 to 24 Year Olds | 2 (100.0%) | 0 (0.0%) |
| 25 to 34 Year Olds | 2 (100.0%) | 0 (0.0%) |
| 35 Years and over | 0 (0.0%) | 0 (0.0%) |
| Total | 70 (98.6%) | 1 (1.4%) |
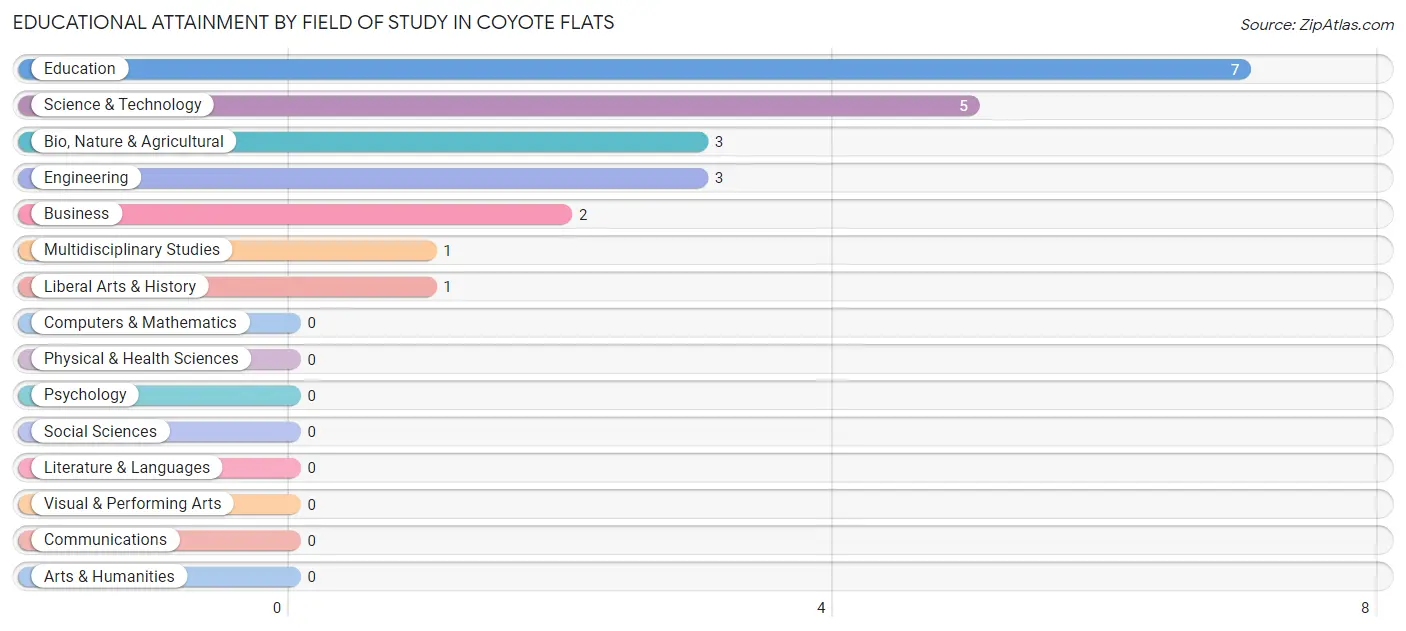
Educational Attainment by Field of Study in Coyote Flats
Education (7 | 31.8%), science & technology (5 | 22.7%), bio, nature & agricultural (3 | 13.6%), engineering (3 | 13.6%), and business (2 | 9.1%) are the most common fields of study among 22 individuals in Coyote Flats who have obtained a bachelor's degree or higher.
| Field of Study | # Graduates | % Graduates |
| Computers & Mathematics | 0 | 0.0% |
| Bio, Nature & Agricultural | 3 | 13.6% |
| Physical & Health Sciences | 0 | 0.0% |
| Psychology | 0 | 0.0% |
| Social Sciences | 0 | 0.0% |
| Engineering | 3 | 13.6% |
| Multidisciplinary Studies | 1 | 4.5% |
| Science & Technology | 5 | 22.7% |
| Business | 2 | 9.1% |
| Education | 7 | 31.8% |
| Literature & Languages | 0 | 0.0% |
| Liberal Arts & History | 1 | 4.5% |
| Visual & Performing Arts | 0 | 0.0% |
| Communications | 0 | 0.0% |
| Arts & Humanities | 0 | 0.0% |
| Total | 22 | 100.0% |
Transportation & Commute in Coyote Flats
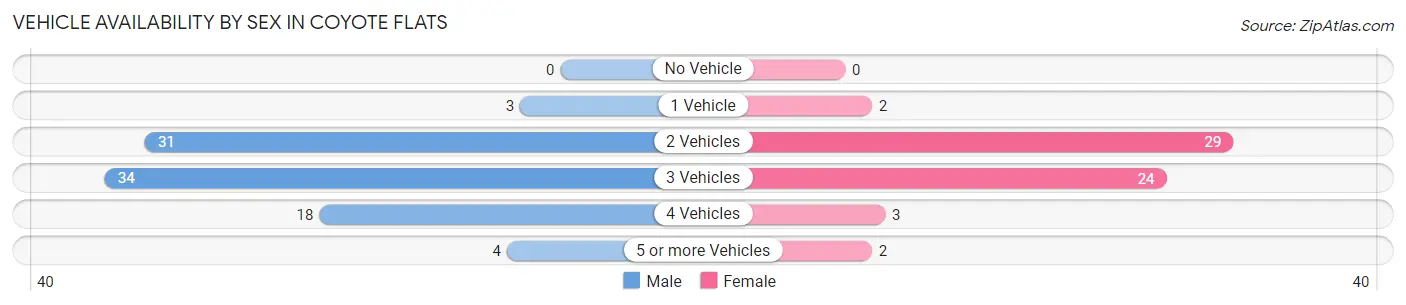
Vehicle Availability by Sex in Coyote Flats
The most prevalent vehicle ownership categories in Coyote Flats are males with 3 vehicles (34, accounting for 37.8%) and females with 3 vehicles (24, making up 56.7%).
| Vehicles Available | Male | Female |
| No Vehicle | 0 (0.0%) | 0 (0.0%) |
| 1 Vehicle | 3 (3.3%) | 2 (3.3%) |
| 2 Vehicles | 31 (34.4%) | 29 (48.3%) |
| 3 Vehicles | 34 (37.8%) | 24 (40.0%) |
| 4 Vehicles | 18 (20.0%) | 3 (5.0%) |
| 5 or more Vehicles | 4 (4.4%) | 2 (3.3%) |
| Total | 90 (100.0%) | 60 (100.0%) |
Commute Time in Coyote Flats
The most frequently occuring commute durations in Coyote Flats are 45 to 59 minutes (38 commuters, 26.6%), 30 to 34 minutes (29 commuters, 20.3%), and 60 to 89 minutes (21 commuters, 14.7%).
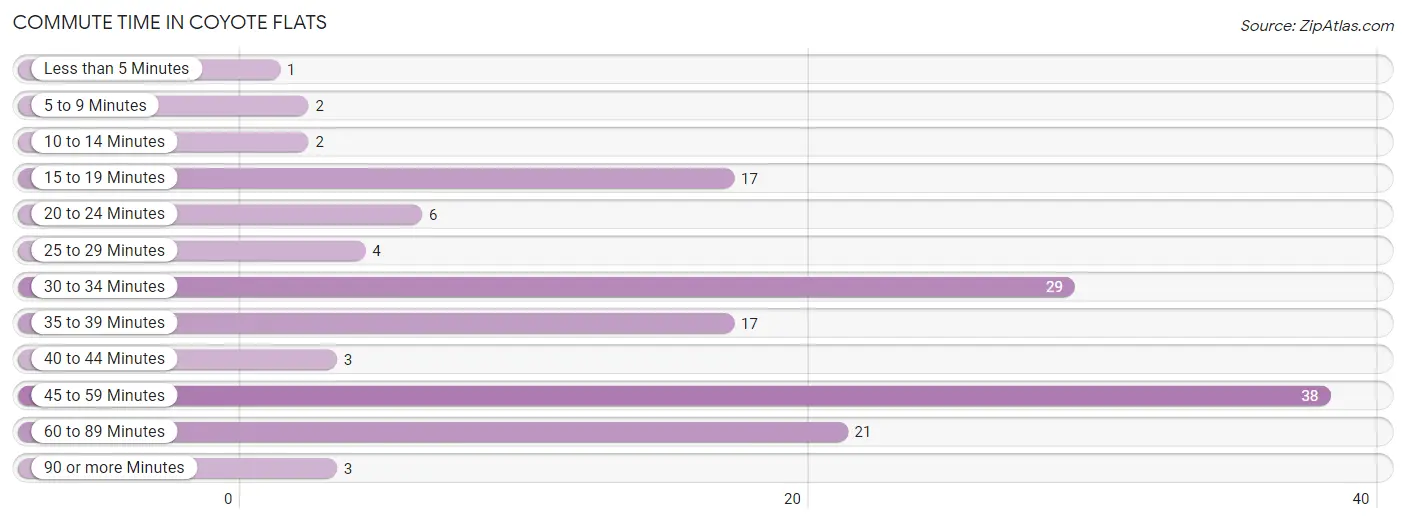
| Commute Time | # Commuters | % Commuters |
| Less than 5 Minutes | 1 | 0.7% |
| 5 to 9 Minutes | 2 | 1.4% |
| 10 to 14 Minutes | 2 | 1.4% |
| 15 to 19 Minutes | 17 | 11.9% |
| 20 to 24 Minutes | 6 | 4.2% |
| 25 to 29 Minutes | 4 | 2.8% |
| 30 to 34 Minutes | 29 | 20.3% |
| 35 to 39 Minutes | 17 | 11.9% |
| 40 to 44 Minutes | 3 | 2.1% |
| 45 to 59 Minutes | 38 | 26.6% |
| 60 to 89 Minutes | 21 | 14.7% |
| 90 or more Minutes | 3 | 2.1% |
Commute Time by Sex in Coyote Flats
The most common commute times in Coyote Flats are 45 to 59 minutes (29 commuters, 34.5%) for males and 30 to 34 minutes (14 commuters, 23.7%) for females.
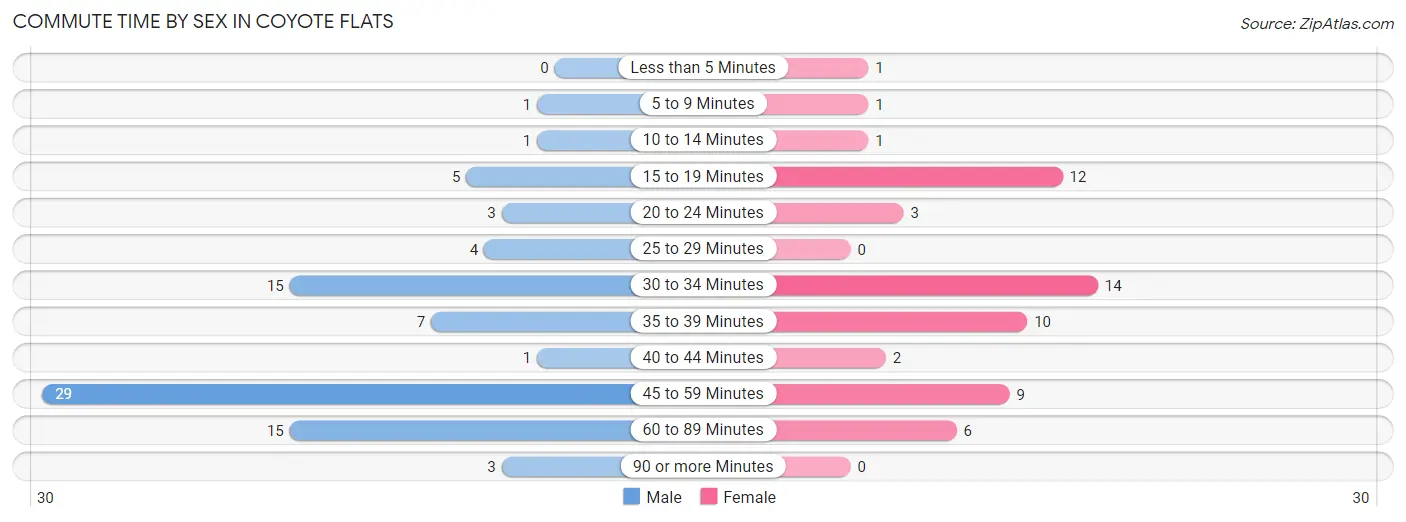
| Commute Time | Male | Female |
| Less than 5 Minutes | 0 (0.0%) | 1 (1.7%) |
| 5 to 9 Minutes | 1 (1.2%) | 1 (1.7%) |
| 10 to 14 Minutes | 1 (1.2%) | 1 (1.7%) |
| 15 to 19 Minutes | 5 (5.9%) | 12 (20.3%) |
| 20 to 24 Minutes | 3 (3.6%) | 3 (5.1%) |
| 25 to 29 Minutes | 4 (4.8%) | 0 (0.0%) |
| 30 to 34 Minutes | 15 (17.9%) | 14 (23.7%) |
| 35 to 39 Minutes | 7 (8.3%) | 10 (17.0%) |
| 40 to 44 Minutes | 1 (1.2%) | 2 (3.4%) |
| 45 to 59 Minutes | 29 (34.5%) | 9 (15.2%) |
| 60 to 89 Minutes | 15 (17.9%) | 6 (10.2%) |
| 90 or more Minutes | 3 (3.6%) | 0 (0.0%) |
Time of Departure to Work by Sex in Coyote Flats
The most frequent times of departure to work in Coyote Flats are 5:00 AM to 5:29 AM (24, 28.6%) for males and 7:30 AM to 7:59 AM (24, 40.7%) for females.
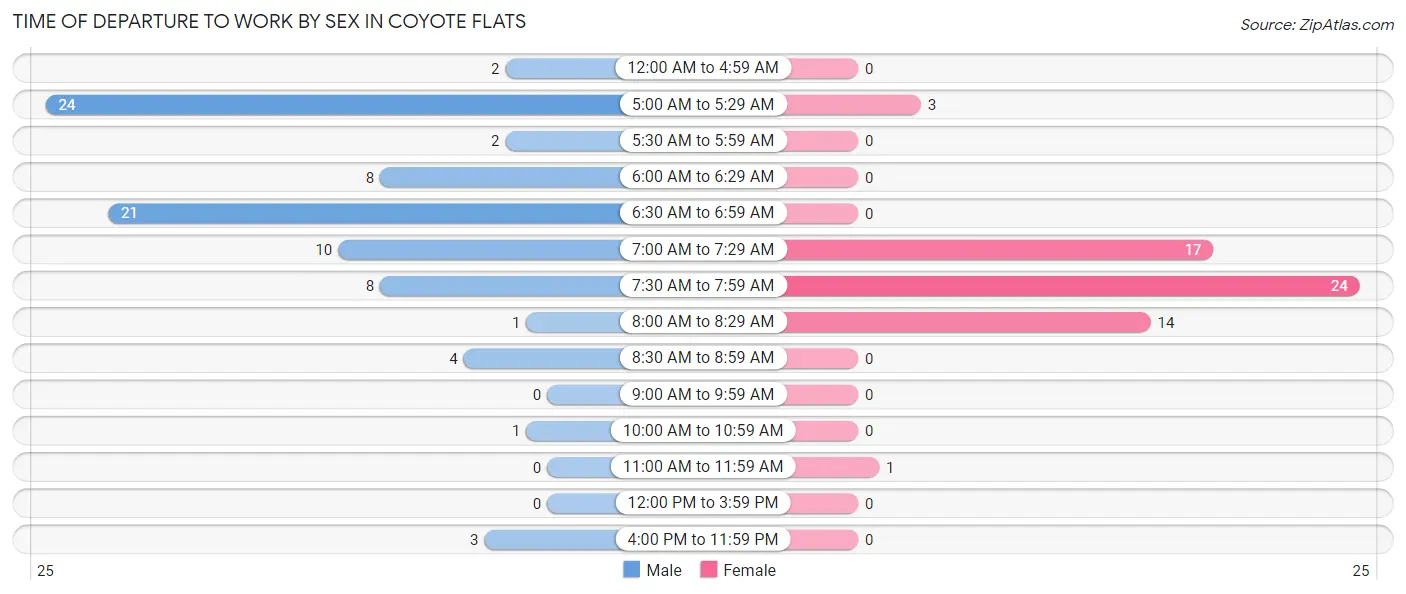
| Time of Departure | Male | Female |
| 12:00 AM to 4:59 AM | 2 (2.4%) | 0 (0.0%) |
| 5:00 AM to 5:29 AM | 24 (28.6%) | 3 (5.1%) |
| 5:30 AM to 5:59 AM | 2 (2.4%) | 0 (0.0%) |
| 6:00 AM to 6:29 AM | 8 (9.5%) | 0 (0.0%) |
| 6:30 AM to 6:59 AM | 21 (25.0%) | 0 (0.0%) |
| 7:00 AM to 7:29 AM | 10 (11.9%) | 17 (28.8%) |
| 7:30 AM to 7:59 AM | 8 (9.5%) | 24 (40.7%) |
| 8:00 AM to 8:29 AM | 1 (1.2%) | 14 (23.7%) |
| 8:30 AM to 8:59 AM | 4 (4.8%) | 0 (0.0%) |
| 9:00 AM to 9:59 AM | 0 (0.0%) | 0 (0.0%) |
| 10:00 AM to 10:59 AM | 1 (1.2%) | 0 (0.0%) |
| 11:00 AM to 11:59 AM | 0 (0.0%) | 1 (1.7%) |
| 12:00 PM to 3:59 PM | 0 (0.0%) | 0 (0.0%) |
| 4:00 PM to 11:59 PM | 3 (3.6%) | 0 (0.0%) |
| Total | 84 (100.0%) | 59 (100.0%) |
Housing Occupancy in Coyote Flats
Occupancy by Ownership in Coyote Flats
Of the total 123 dwellings in Coyote Flats, owner-occupied units account for 112 (91.1%), while renter-occupied units make up 11 (8.9%).
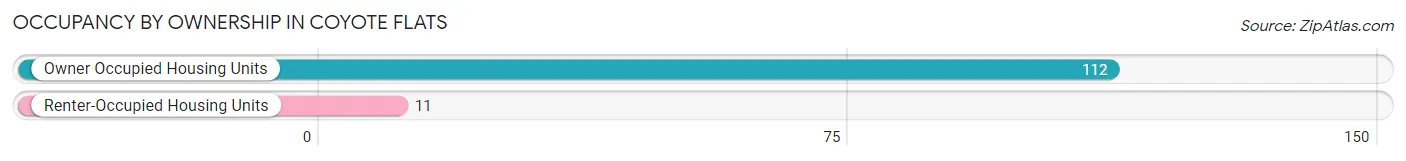
| Occupancy | # Housing Units | % Housing Units |
| Owner Occupied Housing Units | 112 | 91.1% |
| Renter-Occupied Housing Units | 11 | 8.9% |
| Total Occupied Housing Units | 123 | 100.0% |
Occupancy by Household Size in Coyote Flats
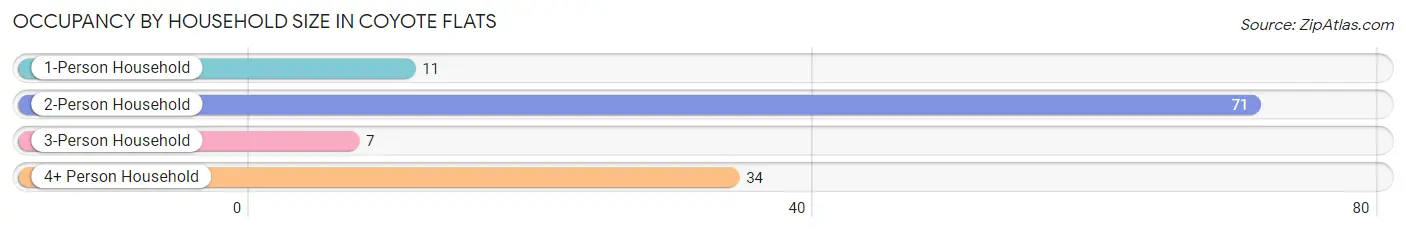
| Household Size | # Housing Units | % Housing Units |
| 1-Person Household | 11 | 8.9% |
| 2-Person Household | 71 | 57.7% |
| 3-Person Household | 7 | 5.7% |
| 4+ Person Household | 34 | 27.6% |
| Total Housing Units | 123 | 100.0% |
Occupancy by Ownership by Household Size in Coyote Flats
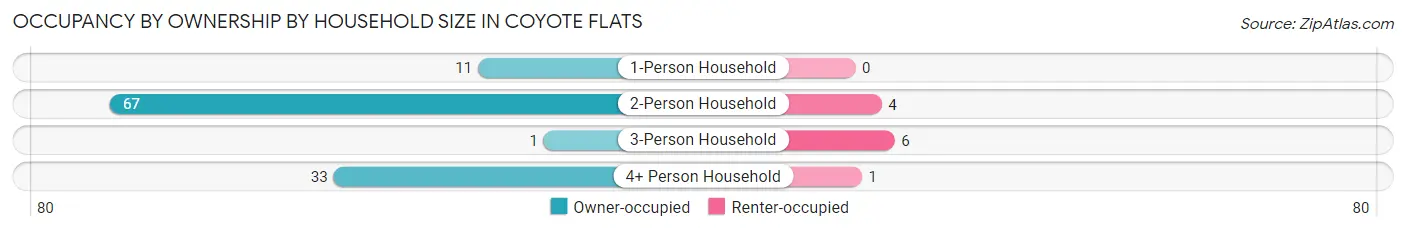
| Household Size | Owner-occupied | Renter-occupied |
| 1-Person Household | 11 (100.0%) | 0 (0.0%) |
| 2-Person Household | 67 (94.4%) | 4 (5.6%) |
| 3-Person Household | 1 (14.3%) | 6 (85.7%) |
| 4+ Person Household | 33 (97.1%) | 1 (2.9%) |
| Total Housing Units | 112 (91.1%) | 11 (8.9%) |
Occupancy by Educational Attainment in Coyote Flats
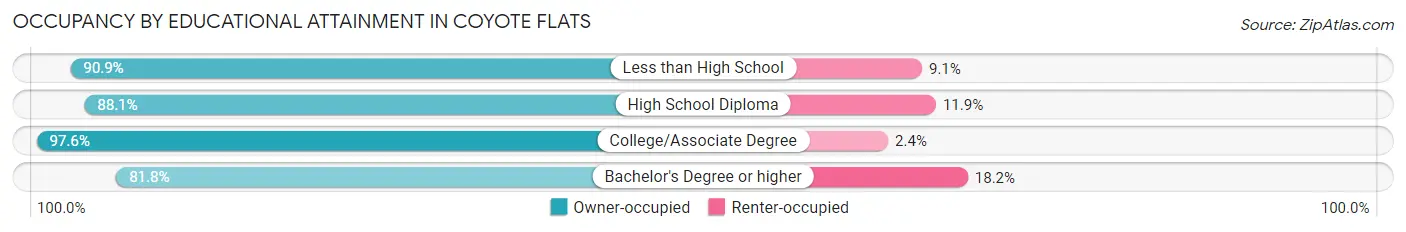
| Household Size | Owner-occupied | Renter-occupied |
| Less than High School | 10 (90.9%) | 1 (9.1%) |
| High School Diploma | 52 (88.1%) | 7 (11.9%) |
| College/Associate Degree | 41 (97.6%) | 1 (2.4%) |
| Bachelor's Degree or higher | 9 (81.8%) | 2 (18.2%) |
Occupancy by Age of Householder in Coyote Flats
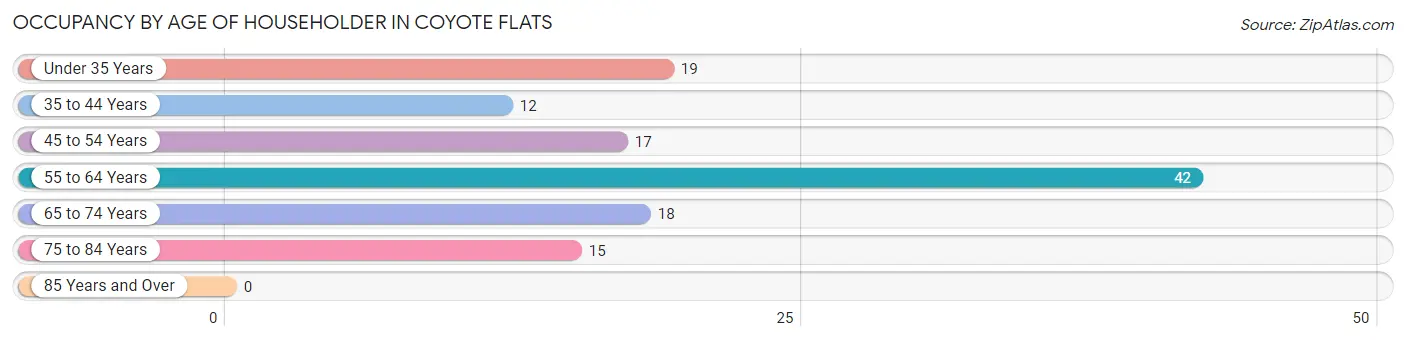
| Age Bracket | # Households | % Households |
| Under 35 Years | 19 | 15.4% |
| 35 to 44 Years | 12 | 9.8% |
| 45 to 54 Years | 17 | 13.8% |
| 55 to 64 Years | 42 | 34.2% |
| 65 to 74 Years | 18 | 14.6% |
| 75 to 84 Years | 15 | 12.2% |
| 85 Years and Over | 0 | 0.0% |
| Total | 123 | 100.0% |
Housing Finances in Coyote Flats
Median Income by Occupancy in Coyote Flats
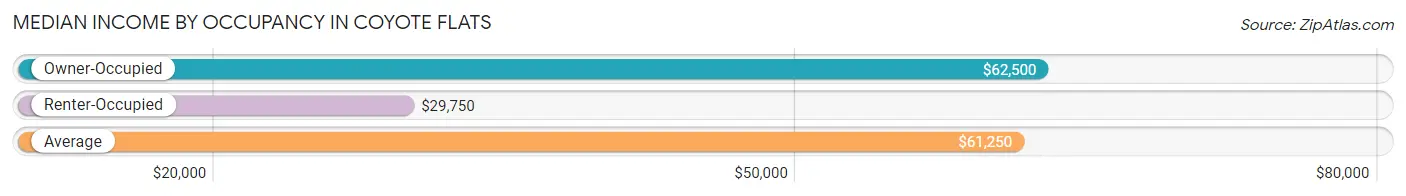
| Occupancy Type | # Households | Median Income |
| Owner-Occupied | 112 (91.1%) | $62,500 |
| Renter-Occupied | 11 (8.9%) | $29,750 |
| Average | 123 (100.0%) | $61,250 |
Occupancy by Householder Income Bracket in Coyote Flats
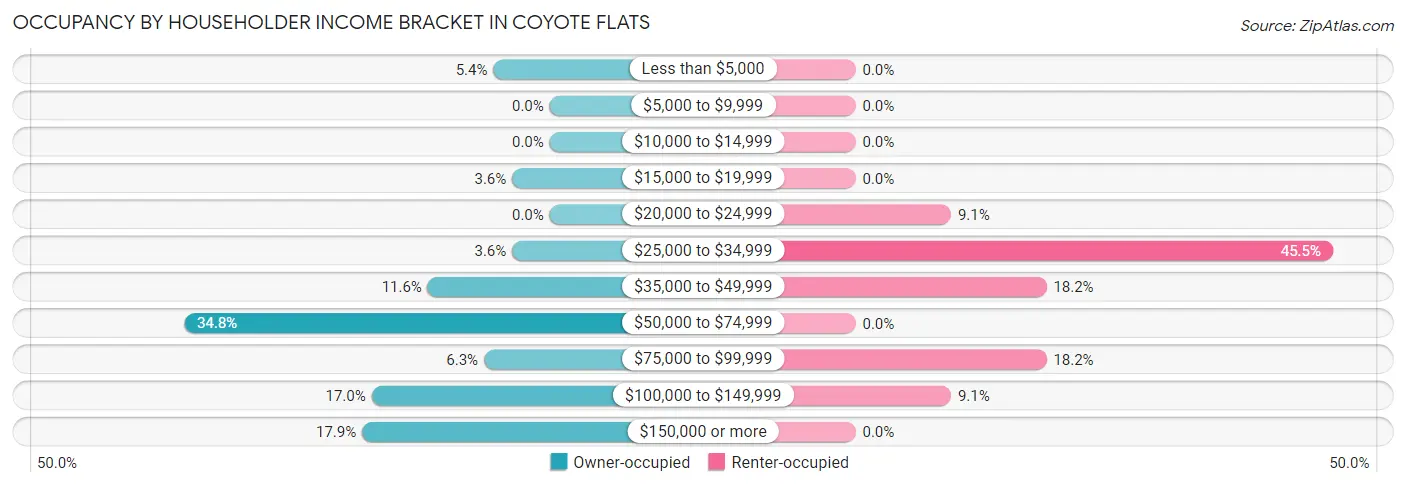
| Income Bracket | Owner-occupied | Renter-occupied |
| Less than $5,000 | 6 (5.4%) | 0 (0.0%) |
| $5,000 to $9,999 | 0 (0.0%) | 0 (0.0%) |
| $10,000 to $14,999 | 0 (0.0%) | 0 (0.0%) |
| $15,000 to $19,999 | 4 (3.6%) | 0 (0.0%) |
| $20,000 to $24,999 | 0 (0.0%) | 1 (9.1%) |
| $25,000 to $34,999 | 4 (3.6%) | 5 (45.5%) |
| $35,000 to $49,999 | 13 (11.6%) | 2 (18.2%) |
| $50,000 to $74,999 | 39 (34.8%) | 0 (0.0%) |
| $75,000 to $99,999 | 7 (6.2%) | 2 (18.2%) |
| $100,000 to $149,999 | 19 (17.0%) | 1 (9.1%) |
| $150,000 or more | 20 (17.9%) | 0 (0.0%) |
| Total | 112 (100.0%) | 11 (100.0%) |
Monthly Housing Cost Tiers in Coyote Flats
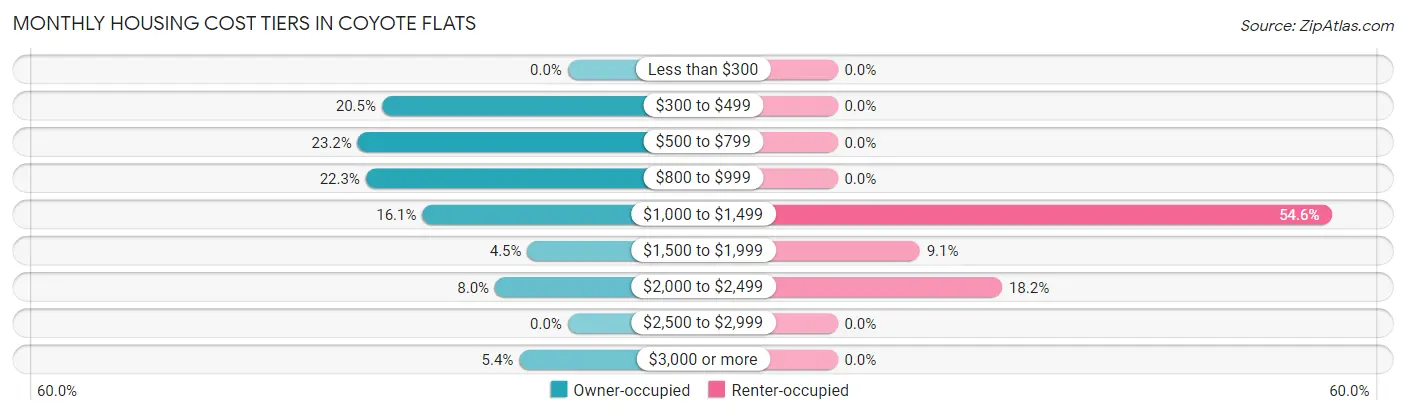
| Monthly Cost | Owner-occupied | Renter-occupied |
| Less than $300 | 0 (0.0%) | 0 (0.0%) |
| $300 to $499 | 23 (20.5%) | 0 (0.0%) |
| $500 to $799 | 26 (23.2%) | 0 (0.0%) |
| $800 to $999 | 25 (22.3%) | 0 (0.0%) |
| $1,000 to $1,499 | 18 (16.1%) | 6 (54.5%) |
| $1,500 to $1,999 | 5 (4.5%) | 1 (9.1%) |
| $2,000 to $2,499 | 9 (8.0%) | 2 (18.2%) |
| $2,500 to $2,999 | 0 (0.0%) | 0 (0.0%) |
| $3,000 or more | 6 (5.4%) | 0 (0.0%) |
| Total | 112 (100.0%) | 11 (100.0%) |
Physical Housing Characteristics in Coyote Flats
Housing Structures in Coyote Flats
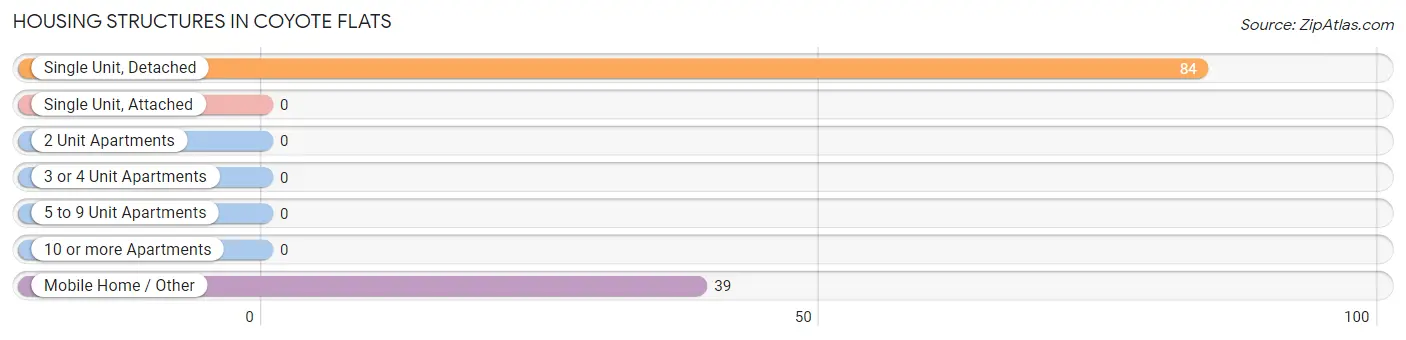
| Structure Type | # Housing Units | % Housing Units |
| Single Unit, Detached | 84 | 68.3% |
| Single Unit, Attached | 0 | 0.0% |
| 2 Unit Apartments | 0 | 0.0% |
| 3 or 4 Unit Apartments | 0 | 0.0% |
| 5 to 9 Unit Apartments | 0 | 0.0% |
| 10 or more Apartments | 0 | 0.0% |
| Mobile Home / Other | 39 | 31.7% |
| Total | 123 | 100.0% |
Housing Structures by Occupancy in Coyote Flats
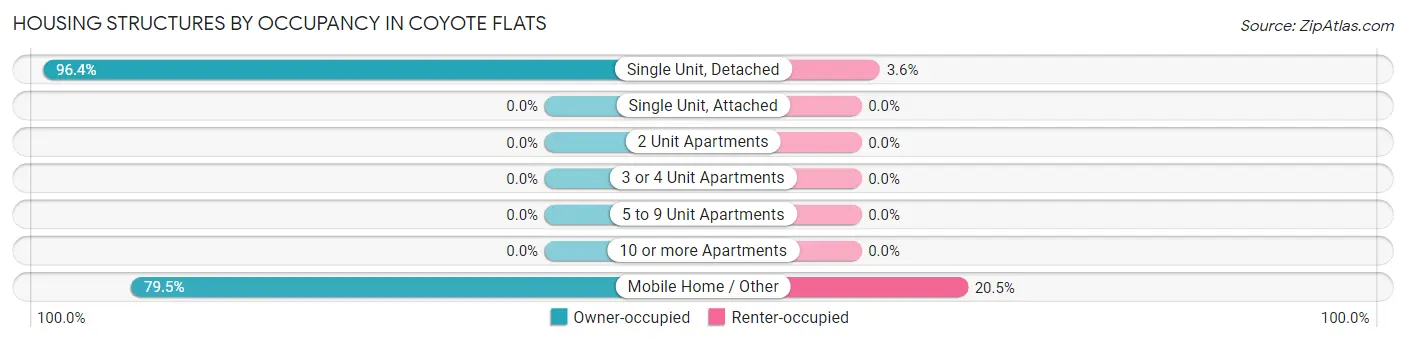
| Structure Type | Owner-occupied | Renter-occupied |
| Single Unit, Detached | 81 (96.4%) | 3 (3.6%) |
| Single Unit, Attached | 0 (0.0%) | 0 (0.0%) |
| 2 Unit Apartments | 0 (0.0%) | 0 (0.0%) |
| 3 or 4 Unit Apartments | 0 (0.0%) | 0 (0.0%) |
| 5 to 9 Unit Apartments | 0 (0.0%) | 0 (0.0%) |
| 10 or more Apartments | 0 (0.0%) | 0 (0.0%) |
| Mobile Home / Other | 31 (79.5%) | 8 (20.5%) |
| Total | 112 (91.1%) | 11 (8.9%) |
Housing Structures by Number of Rooms in Coyote Flats
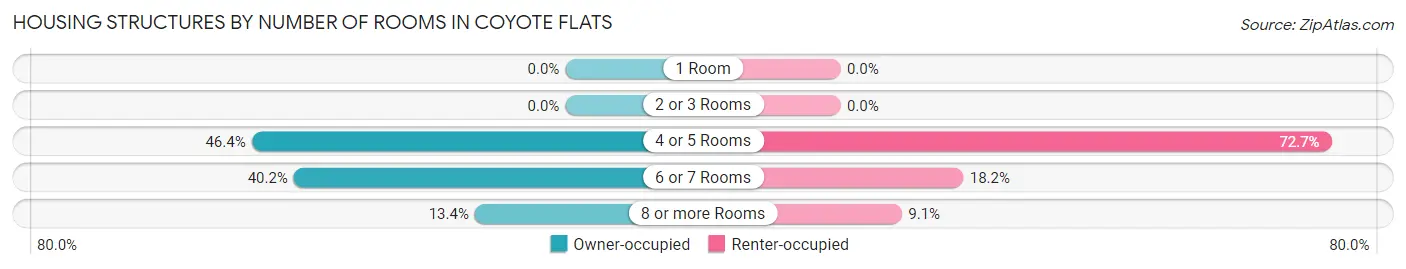
| Number of Rooms | Owner-occupied | Renter-occupied |
| 1 Room | 0 (0.0%) | 0 (0.0%) |
| 2 or 3 Rooms | 0 (0.0%) | 0 (0.0%) |
| 4 or 5 Rooms | 52 (46.4%) | 8 (72.7%) |
| 6 or 7 Rooms | 45 (40.2%) | 2 (18.2%) |
| 8 or more Rooms | 15 (13.4%) | 1 (9.1%) |
| Total | 112 (100.0%) | 11 (100.0%) |
Housing Structure by Heating Type in Coyote Flats
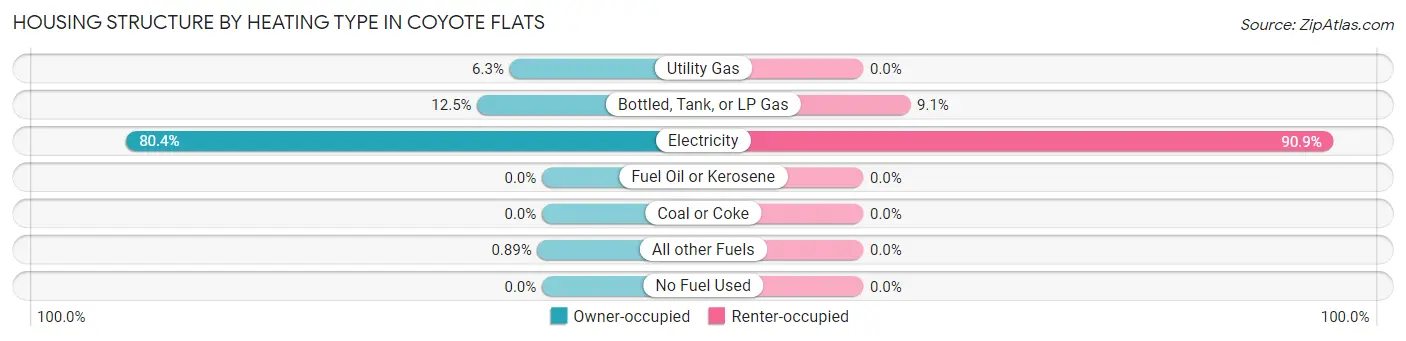
| Heating Type | Owner-occupied | Renter-occupied |
| Utility Gas | 7 (6.2%) | 0 (0.0%) |
| Bottled, Tank, or LP Gas | 14 (12.5%) | 1 (9.1%) |
| Electricity | 90 (80.4%) | 10 (90.9%) |
| Fuel Oil or Kerosene | 0 (0.0%) | 0 (0.0%) |
| Coal or Coke | 0 (0.0%) | 0 (0.0%) |
| All other Fuels | 1 (0.9%) | 0 (0.0%) |
| No Fuel Used | 0 (0.0%) | 0 (0.0%) |
| Total | 112 (100.0%) | 11 (100.0%) |
Household Vehicle Usage in Coyote Flats
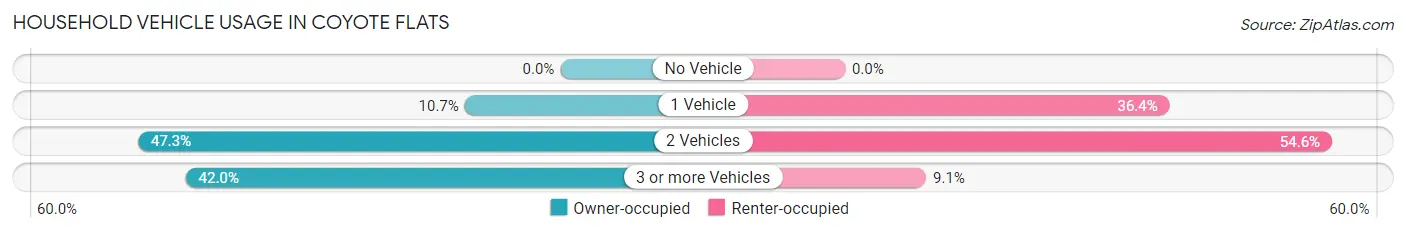
| Vehicles per Household | Owner-occupied | Renter-occupied |
| No Vehicle | 0 (0.0%) | 0 (0.0%) |
| 1 Vehicle | 12 (10.7%) | 4 (36.4%) |
| 2 Vehicles | 53 (47.3%) | 6 (54.5%) |
| 3 or more Vehicles | 47 (42.0%) | 1 (9.1%) |
| Total | 112 (100.0%) | 11 (100.0%) |
Real Estate & Mortgages in Coyote Flats
Real Estate and Mortgage Overview in Coyote Flats
| Characteristic | Without Mortgage | With Mortgage |
| Housing Units | 54 | 58 |
| Median Property Value | $212,500 | $263,200 |
| Median Household Income | $61,500 | $12 |
| Monthly Housing Costs | $533 | $6 |
| Real Estate Taxes | $1,667 | $0 |
Property Value by Mortgage Status in Coyote Flats
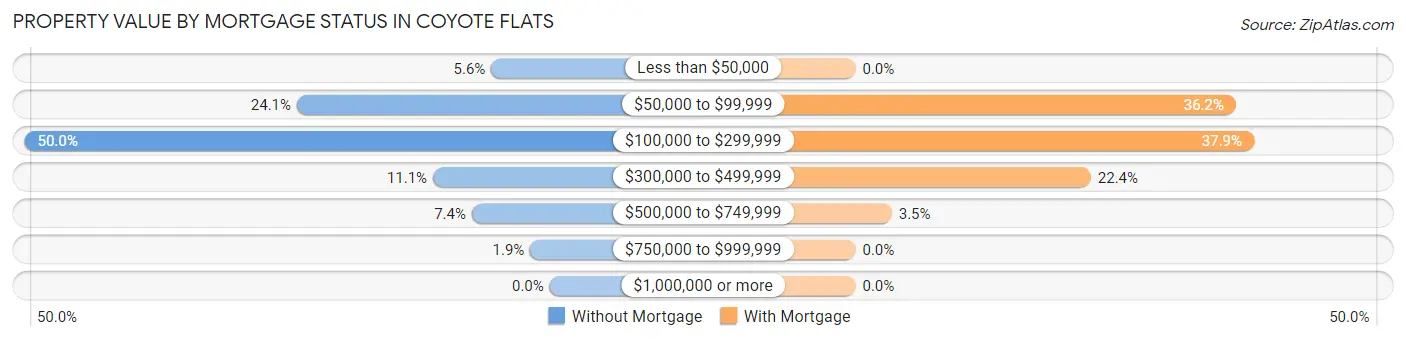
| Property Value | Without Mortgage | With Mortgage |
| Less than $50,000 | 3 (5.6%) | 0 (0.0%) |
| $50,000 to $99,999 | 13 (24.1%) | 21 (36.2%) |
| $100,000 to $299,999 | 27 (50.0%) | 22 (37.9%) |
| $300,000 to $499,999 | 6 (11.1%) | 13 (22.4%) |
| $500,000 to $749,999 | 4 (7.4%) | 2 (3.5%) |
| $750,000 to $999,999 | 1 (1.8%) | 0 (0.0%) |
| $1,000,000 or more | 0 (0.0%) | 0 (0.0%) |
| Total | 54 (100.0%) | 58 (100.0%) |
Household Income by Mortgage Status in Coyote Flats
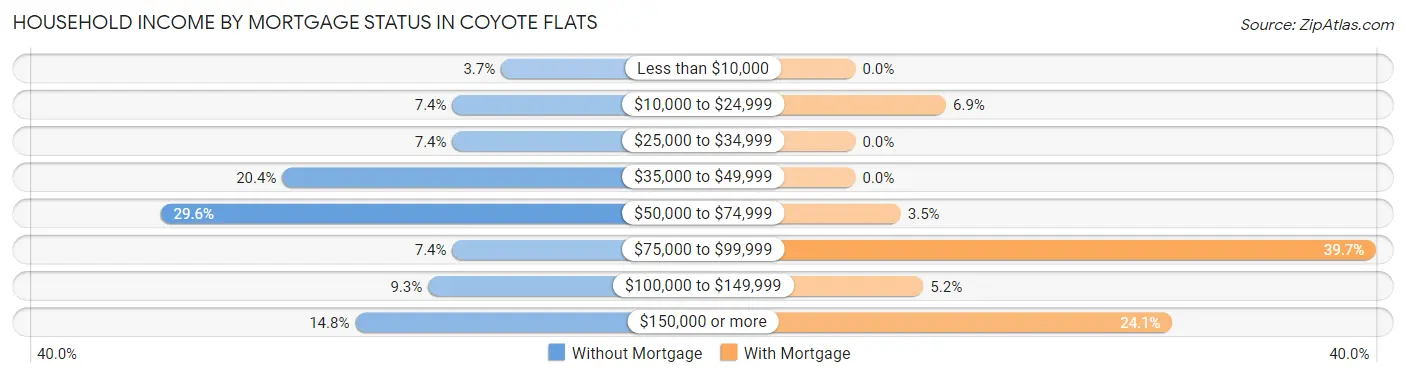
| Household Income | Without Mortgage | With Mortgage |
| Less than $10,000 | 2 (3.7%) | 0 (0.0%) |
| $10,000 to $24,999 | 4 (7.4%) | 4 (6.9%) |
| $25,000 to $34,999 | 4 (7.4%) | 0 (0.0%) |
| $35,000 to $49,999 | 11 (20.4%) | 0 (0.0%) |
| $50,000 to $74,999 | 16 (29.6%) | 2 (3.5%) |
| $75,000 to $99,999 | 4 (7.4%) | 23 (39.7%) |
| $100,000 to $149,999 | 5 (9.3%) | 3 (5.2%) |
| $150,000 or more | 8 (14.8%) | 14 (24.1%) |
| Total | 54 (100.0%) | 58 (100.0%) |
Property Value to Household Income Ratio in Coyote Flats
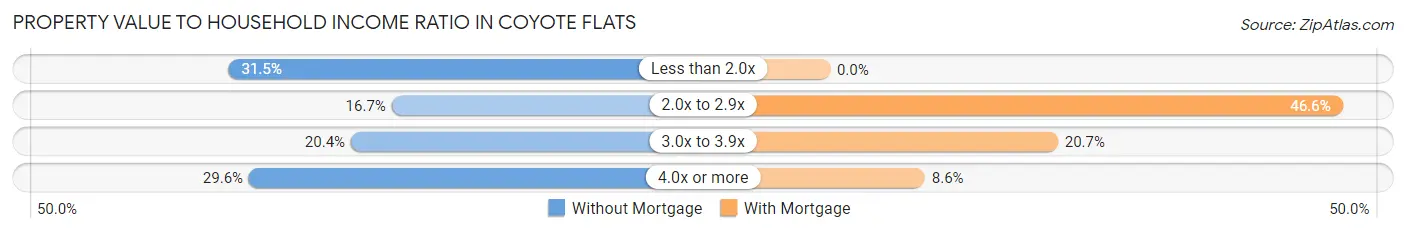
| Value-to-Income Ratio | Without Mortgage | With Mortgage |
| Less than 2.0x | 17 (31.5%) | 0 (0.0%) |
| 2.0x to 2.9x | 9 (16.7%) | 27 (46.6%) |
| 3.0x to 3.9x | 11 (20.4%) | 12 (20.7%) |
| 4.0x or more | 16 (29.6%) | 5 (8.6%) |
| Total | 54 (100.0%) | 58 (100.0%) |
Real Estate Taxes by Mortgage Status in Coyote Flats
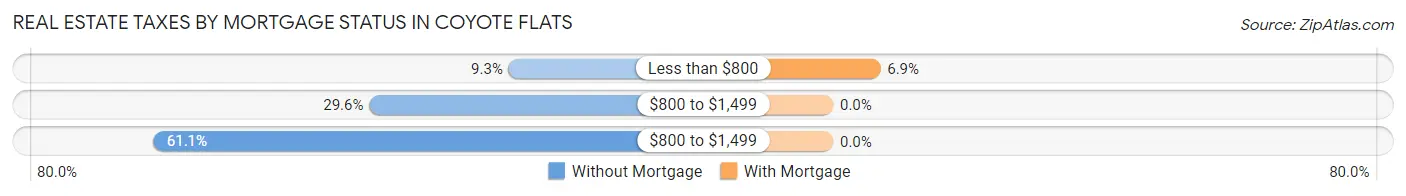
| Property Taxes | Without Mortgage | With Mortgage |
| Less than $800 | 5 (9.3%) | 4 (6.9%) |
| $800 to $1,499 | 16 (29.6%) | 0 (0.0%) |
| $800 to $1,499 | 33 (61.1%) | 0 (0.0%) |
| Total | 54 (100.0%) | 58 (100.0%) |
Health & Disability in Coyote Flats
Health Insurance Coverage by Age in Coyote Flats
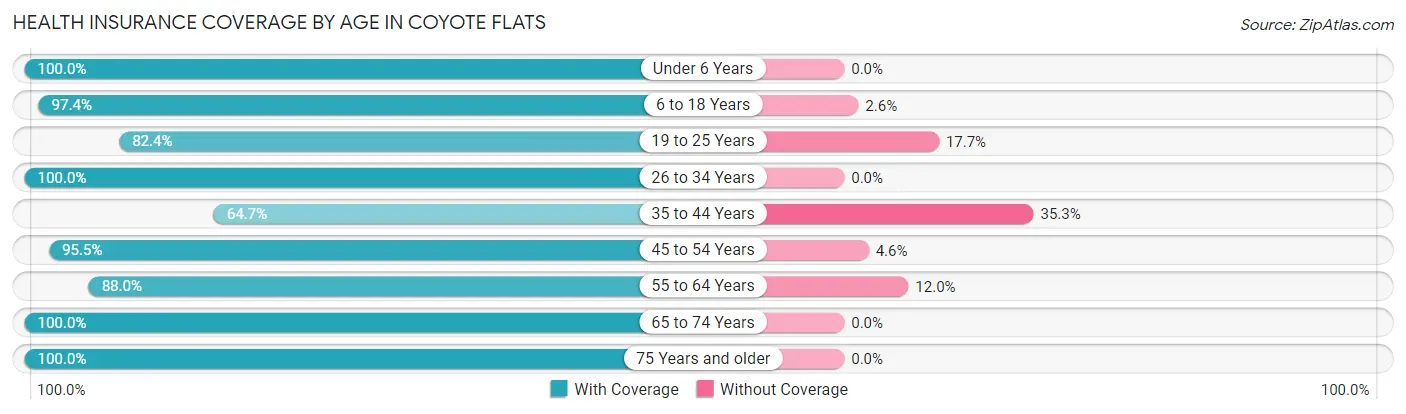
| Age Bracket | With Coverage | Without Coverage |
| Under 6 Years | 30 (100.0%) | 0 (0.0%) |
| 6 to 18 Years | 37 (97.4%) | 1 (2.6%) |
| 19 to 25 Years | 14 (82.4%) | 3 (17.6%) |
| 26 to 34 Years | 34 (100.0%) | 0 (0.0%) |
| 35 to 44 Years | 11 (64.7%) | 6 (35.3%) |
| 45 to 54 Years | 42 (95.5%) | 2 (4.5%) |
| 55 to 64 Years | 81 (88.0%) | 11 (12.0%) |
| 65 to 74 Years | 34 (100.0%) | 0 (0.0%) |
| 75 Years and older | 31 (100.0%) | 0 (0.0%) |
| Total | 314 (93.2%) | 23 (6.8%) |
Health Insurance Coverage by Citizenship Status in Coyote Flats
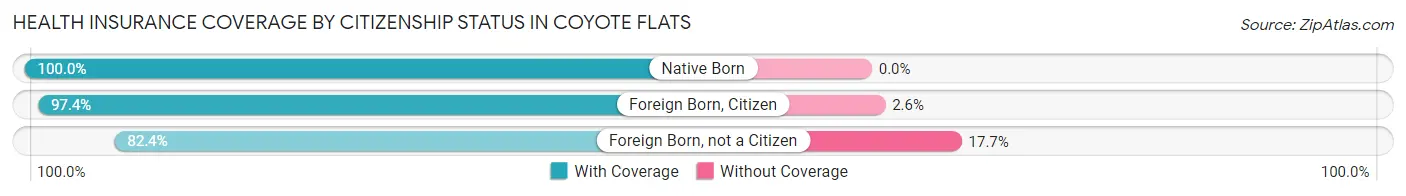
| Citizenship Status | With Coverage | Without Coverage |
| Native Born | 30 (100.0%) | 0 (0.0%) |
| Foreign Born, Citizen | 37 (97.4%) | 1 (2.6%) |
| Foreign Born, not a Citizen | 14 (82.4%) | 3 (17.6%) |
Health Insurance Coverage by Household Income in Coyote Flats
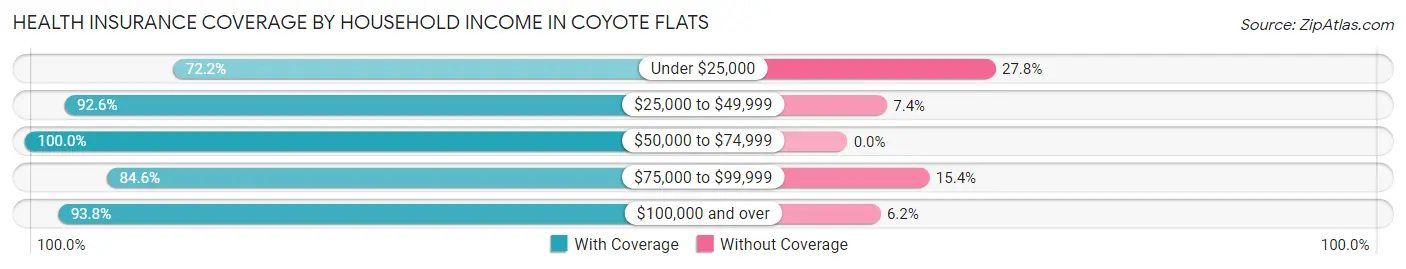
| Household Income | With Coverage | Without Coverage |
| Under $25,000 | 13 (72.2%) | 5 (27.8%) |
| $25,000 to $49,999 | 50 (92.6%) | 4 (7.4%) |
| $50,000 to $74,999 | 78 (100.0%) | 0 (0.0%) |
| $75,000 to $99,999 | 22 (84.6%) | 4 (15.4%) |
| $100,000 and over | 151 (93.8%) | 10 (6.2%) |
Public vs Private Health Insurance Coverage by Age in Coyote Flats
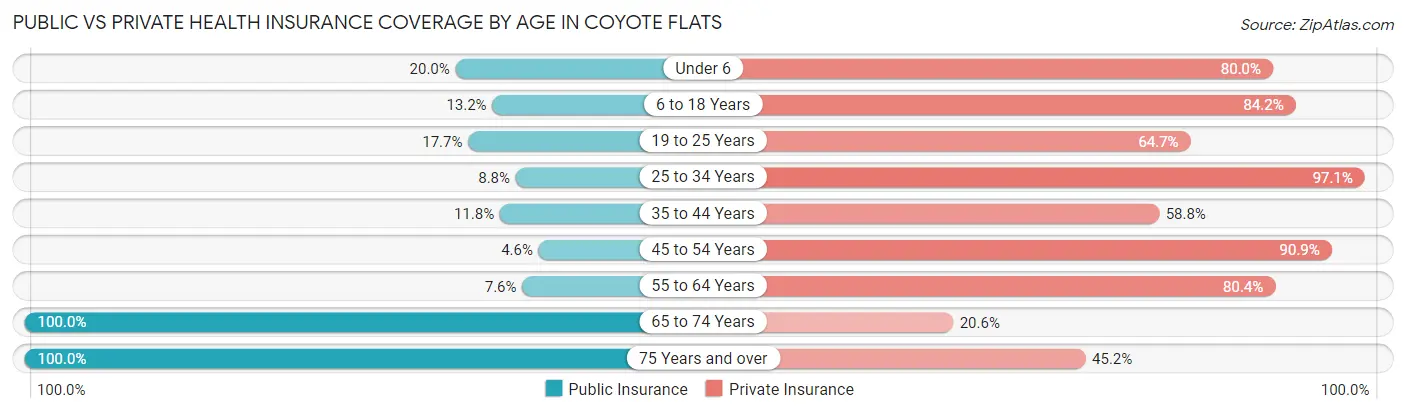
| Age Bracket | Public Insurance | Private Insurance |
| Under 6 | 6 (20.0%) | 24 (80.0%) |
| 6 to 18 Years | 5 (13.2%) | 32 (84.2%) |
| 19 to 25 Years | 3 (17.6%) | 11 (64.7%) |
| 25 to 34 Years | 3 (8.8%) | 33 (97.1%) |
| 35 to 44 Years | 2 (11.8%) | 10 (58.8%) |
| 45 to 54 Years | 2 (4.5%) | 40 (90.9%) |
| 55 to 64 Years | 7 (7.6%) | 74 (80.4%) |
| 65 to 74 Years | 34 (100.0%) | 7 (20.6%) |
| 75 Years and over | 31 (100.0%) | 14 (45.2%) |
| Total | 93 (27.6%) | 245 (72.7%) |
Disability Status by Sex by Age in Coyote Flats
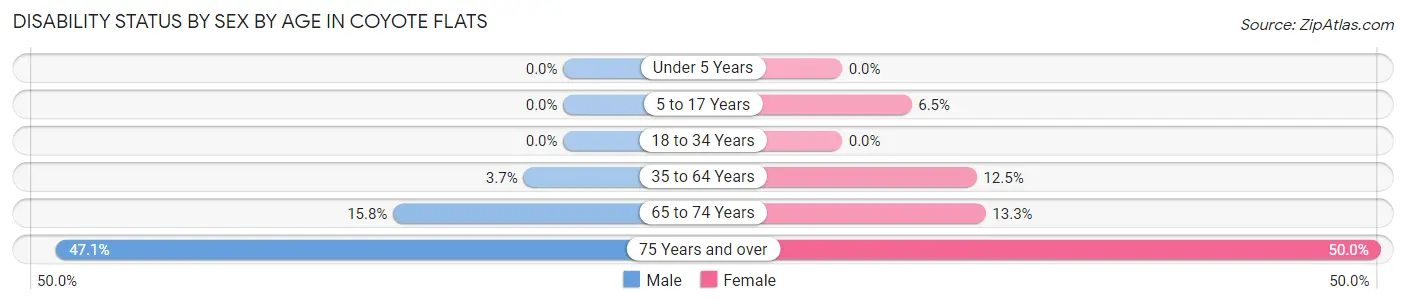
| Age Bracket | Male | Female |
| Under 5 Years | 0 (0.0%) | 0 (0.0%) |
| 5 to 17 Years | 0 (0.0%) | 2 (6.5%) |
| 18 to 34 Years | 0 (0.0%) | 0 (0.0%) |
| 35 to 64 Years | 3 (3.7%) | 9 (12.5%) |
| 65 to 74 Years | 3 (15.8%) | 2 (13.3%) |
| 75 Years and over | 8 (47.1%) | 7 (50.0%) |
Disability Class by Sex by Age in Coyote Flats
Disability Class: Hearing Difficulty
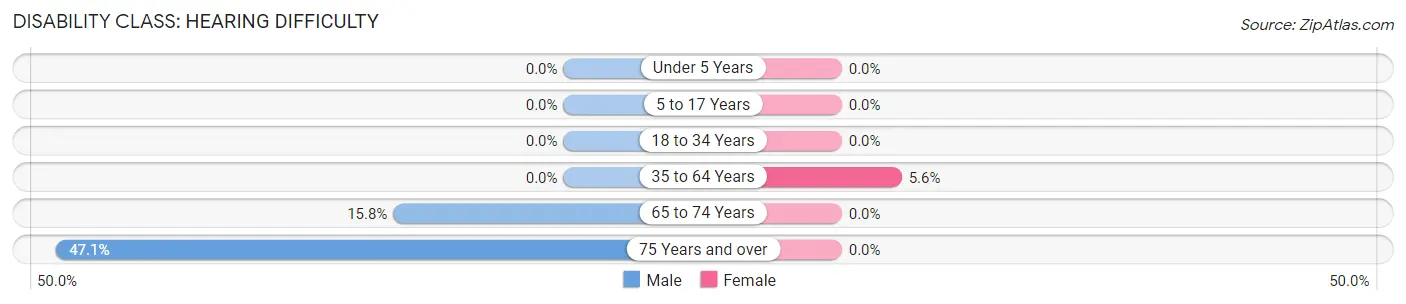
| Age Bracket | Male | Female |
| Under 5 Years | 0 (0.0%) | 0 (0.0%) |
| 5 to 17 Years | 0 (0.0%) | 0 (0.0%) |
| 18 to 34 Years | 0 (0.0%) | 0 (0.0%) |
| 35 to 64 Years | 0 (0.0%) | 4 (5.6%) |
| 65 to 74 Years | 3 (15.8%) | 0 (0.0%) |
| 75 Years and over | 8 (47.1%) | 0 (0.0%) |
Disability Class: Vision Difficulty
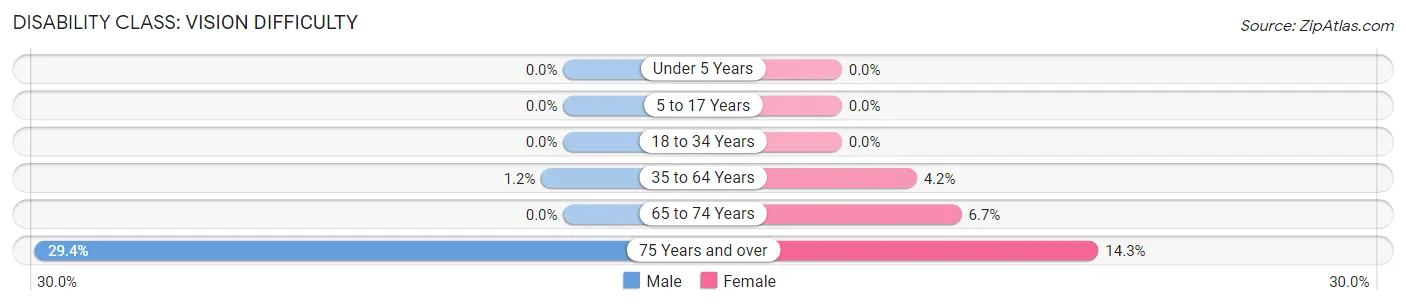
| Age Bracket | Male | Female |
| Under 5 Years | 0 (0.0%) | 0 (0.0%) |
| 5 to 17 Years | 0 (0.0%) | 0 (0.0%) |
| 18 to 34 Years | 0 (0.0%) | 0 (0.0%) |
| 35 to 64 Years | 1 (1.2%) | 3 (4.2%) |
| 65 to 74 Years | 0 (0.0%) | 1 (6.7%) |
| 75 Years and over | 5 (29.4%) | 2 (14.3%) |
Disability Class: Cognitive Difficulty
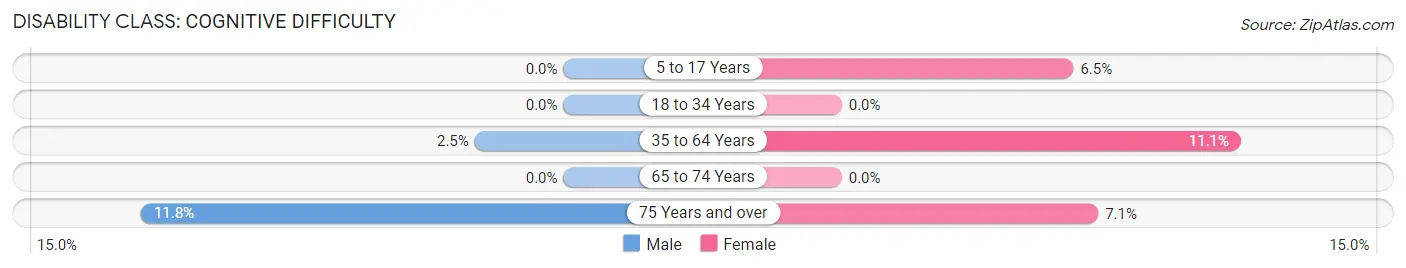
| Age Bracket | Male | Female |
| 5 to 17 Years | 0 (0.0%) | 2 (6.5%) |
| 18 to 34 Years | 0 (0.0%) | 0 (0.0%) |
| 35 to 64 Years | 2 (2.5%) | 8 (11.1%) |
| 65 to 74 Years | 0 (0.0%) | 0 (0.0%) |
| 75 Years and over | 2 (11.8%) | 1 (7.1%) |
Disability Class: Ambulatory Difficulty
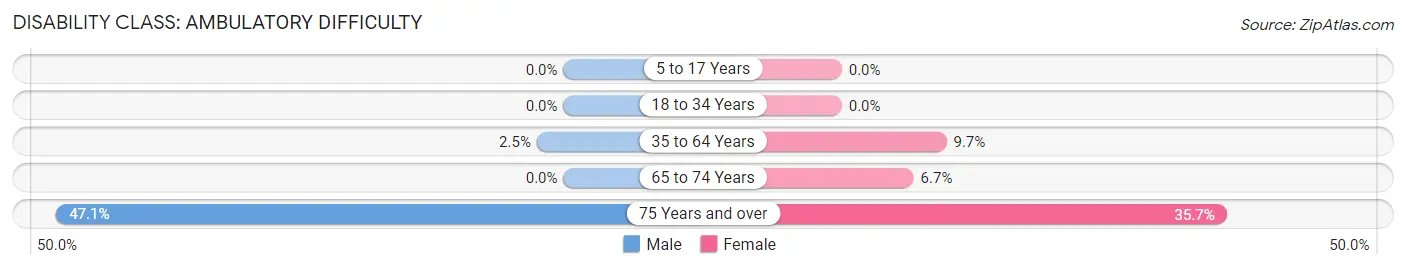
| Age Bracket | Male | Female |
| 5 to 17 Years | 0 (0.0%) | 0 (0.0%) |
| 18 to 34 Years | 0 (0.0%) | 0 (0.0%) |
| 35 to 64 Years | 2 (2.5%) | 7 (9.7%) |
| 65 to 74 Years | 0 (0.0%) | 1 (6.7%) |
| 75 Years and over | 8 (47.1%) | 5 (35.7%) |
Disability Class: Self-Care Difficulty
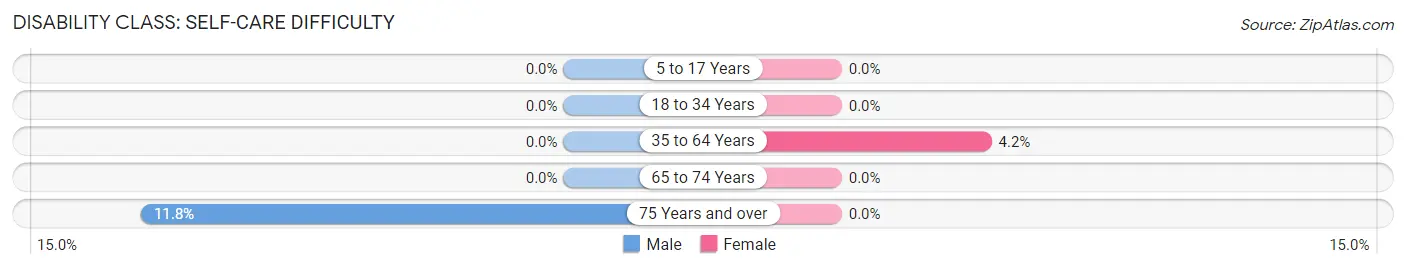
| Age Bracket | Male | Female |
| 5 to 17 Years | 0 (0.0%) | 0 (0.0%) |
| 18 to 34 Years | 0 (0.0%) | 0 (0.0%) |
| 35 to 64 Years | 0 (0.0%) | 3 (4.2%) |
| 65 to 74 Years | 0 (0.0%) | 0 (0.0%) |
| 75 Years and over | 2 (11.8%) | 0 (0.0%) |
Technology Access in Coyote Flats
Computing Device Access in Coyote Flats
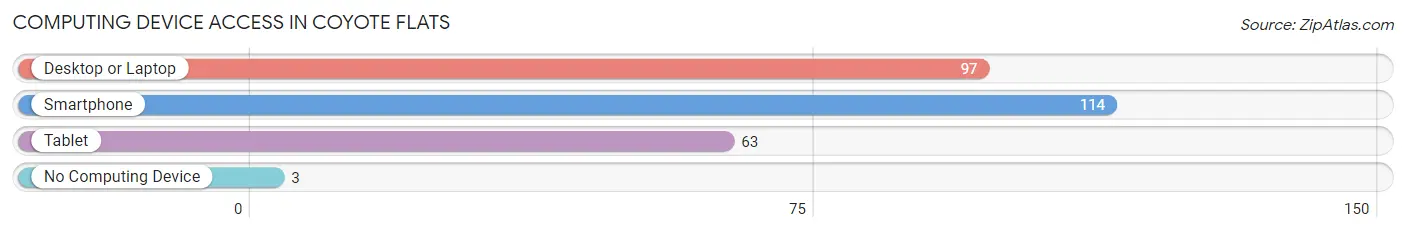
| Device Type | # Households | % Households |
| Desktop or Laptop | 97 | 78.9% |
| Smartphone | 114 | 92.7% |
| Tablet | 63 | 51.2% |
| No Computing Device | 3 | 2.4% |
| Total | 123 | 100.0% |
Internet Access in Coyote Flats
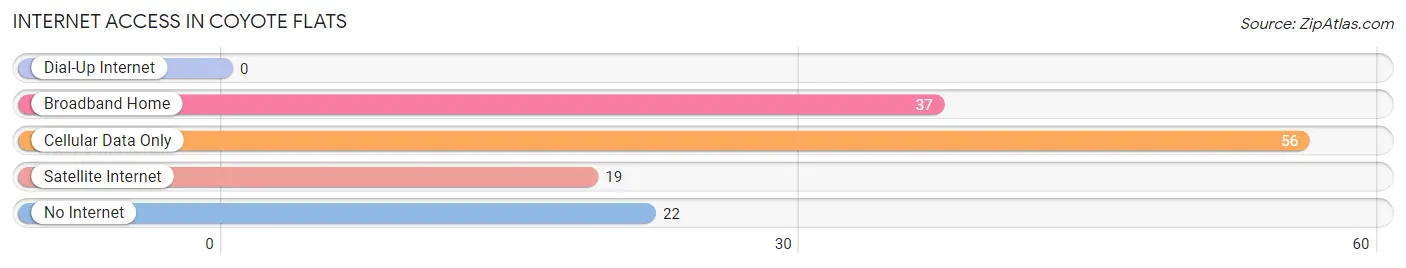
| Internet Type | # Households | % Households |
| Dial-Up Internet | 0 | 0.0% |
| Broadband Home | 37 | 30.1% |
| Cellular Data Only | 56 | 45.5% |
| Satellite Internet | 19 | 15.4% |
| No Internet | 22 | 17.9% |
| Total | 123 | 100.0% |
Coyote Flats Summary
Coyote Flats, Texas is a small unincorporated community located in the western part of the state, in the county of Presidio. It is situated on the banks of the Rio Grande, near the border with Mexico. The town is home to a population of just over 200 people, and is known for its unique culture and history.
History
Coyote Flats was first settled in the late 1800s by a group of Mexican settlers who were looking for a place to call home. The area was originally known as El Coyote, and the settlers named it after the coyote, a wild animal that was common in the area. The settlers built a small village and began to farm the land. The village grew slowly, and by the early 1900s, it had become a thriving community.
In the early 1900s, the town was home to a number of businesses, including a general store, a blacksmith, a saloon, and a post office. The town also had a school, which was attended by the children of the settlers.
In the 1920s, the town began to experience a population boom, as more people moved to the area. This growth was largely due to the fact that the town was located near the border with Mexico, and many people were looking for a place to escape the violence and poverty of their homeland.
Geography
Coyote Flats is located in the western part of Texas, in the county of Presidio. It is situated on the banks of the Rio Grande, near the border with Mexico. The town is surrounded by desert and mountains, and is located in a region known as the Chihuahuan Desert. The climate in the area is hot and dry, with temperatures reaching up to 100 degrees Fahrenheit in the summer months.
Economy
The economy of Coyote Flats is largely based on agriculture. The town is home to a number of farms, which produce a variety of crops, including cotton, corn, and wheat. The town also has a number of small businesses, including a general store, a blacksmith, and a saloon.
Demographics
As of the 2010 census, the population of Coyote Flats was just over 200 people. The majority of the population is of Hispanic or Latino origin, with a small percentage of other ethnicities. The median household income in the town is just over $20,000, and the median age is just over 30 years old.
Conclusion
Coyote Flats, Texas is a small unincorporated community located in the western part of the state, in the county of Presidio. It is situated on the banks of the Rio Grande, near the border with Mexico. The town is home to a population of just over 200 people, and is known for its unique culture and history. The economy of Coyote Flats is largely based on agriculture, and the majority of the population is of Hispanic or Latino origin. The town is surrounded by desert and mountains, and is located in a region known as the Chihuahuan Desert.
Common Questions
What is Per Capita Income in Coyote Flats?
Per Capita income in Coyote Flats is $32,378.
What is the Median Family Income in Coyote Flats?
Median Family Income in Coyote Flats is $53,750.
What is the Median Household income in Coyote Flats?
Median Household Income in Coyote Flats is $61,250.
What is Income or Wage Gap in Coyote Flats?
Income or Wage Gap in Coyote Flats is 55.6%.
Women in Coyote Flats earn 44.4 cents for every dollar earned by a man.
What is Inequality or Gini Index in Coyote Flats?
Inequality or Gini Index in Coyote Flats is 0.39.
What is the Total Population of Coyote Flats?
Total Population of Coyote Flats is 337.
What is the Total Male Population of Coyote Flats?
Total Male Population of Coyote Flats is 173.
What is the Total Female Population of Coyote Flats?
Total Female Population of Coyote Flats is 164.
What is the Ratio of Males per 100 Females in Coyote Flats?
There are 105.49 Males per 100 Females in Coyote Flats.
What is the Ratio of Females per 100 Males in Coyote Flats?
There are 94.80 Females per 100 Males in Coyote Flats.
What is the Median Population Age in Coyote Flats?
Median Population Age in Coyote Flats is 53.2 Years.
What is the Average Family Size in Coyote Flats
Average Family Size in Coyote Flats is 2.7 People.
What is the Average Household Size in Coyote Flats
Average Household Size in Coyote Flats is 2.7 People.
How Large is the Labor Force in Coyote Flats?
There are 154 People in the Labor Forcein in Coyote Flats.
What is the Percentage of People in the Labor Force in Coyote Flats?
55.0% of People are in the Labor Force in Coyote Flats.
What is the Unemployment Rate in Coyote Flats?
Unemployment Rate in Coyote Flats is 1.9%.