Mineral Wells, TX Map & Demographics
Mineral Wells Map
Mineral Wells Overview
$25,216
PER CAPITA INCOME
$67,294
AVG FAMILY INCOME
$58,529
AVG HOUSEHOLD INCOME
40.2%
WAGE / INCOME GAP [ % ]
59.8¢/ $1
WAGE / INCOME GAP [ $ ]
$9,676
FAMILY INCOME DEFICIT
0.43
INEQUALITY / GINI INDEX
15,049
TOTAL POPULATION
7,478
MALE POPULATION
7,571
FEMALE POPULATION
98.77
MALES / 100 FEMALES
101.24
FEMALES / 100 MALES
34.9
MEDIAN AGE
3.4
AVG FAMILY SIZE
2.8
AVG HOUSEHOLD SIZE
6,971
LABOR FORCE [ PEOPLE ]
60.2%
PERCENT IN LABOR FORCE
8.2%
UNEMPLOYMENT RATE
Mineral Wells Zip Codes
Mineral Wells Area Codes
Income in Mineral Wells
Income Overview in Mineral Wells
Per Capita Income in Mineral Wells is $25,216, while median incomes of families and households are $67,294 and $58,529 respectively.
| Characteristic | Number | Measure |
| Per Capita Income | 15,049 | $25,216 |
| Median Family Income | 3,457 | $67,294 |
| Mean Family Income | 3,457 | $82,645 |
| Median Household Income | 5,209 | $58,529 |
| Mean Household Income | 5,209 | $71,124 |
| Income Deficit | 3,457 | $9,676 |
| Wage / Income Gap (%) | 15,049 | 40.19% |
| Wage / Income Gap ($) | 15,049 | 59.81¢ per $1 |
| Gini / Inequality Index | 15,049 | 0.43 |
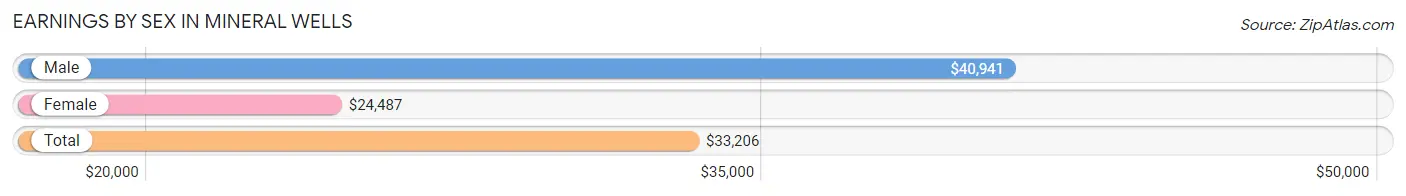
Earnings by Sex in Mineral Wells
Average Earnings in Mineral Wells are $33,206, $40,941 for men and $24,487 for women, a difference of 40.2%.
| Sex | Number | Average Earnings |
| Male | 3,894 (53.7%) | $40,941 |
| Female | 3,350 (46.3%) | $24,487 |
| Total | 7,244 (100.0%) | $33,206 |
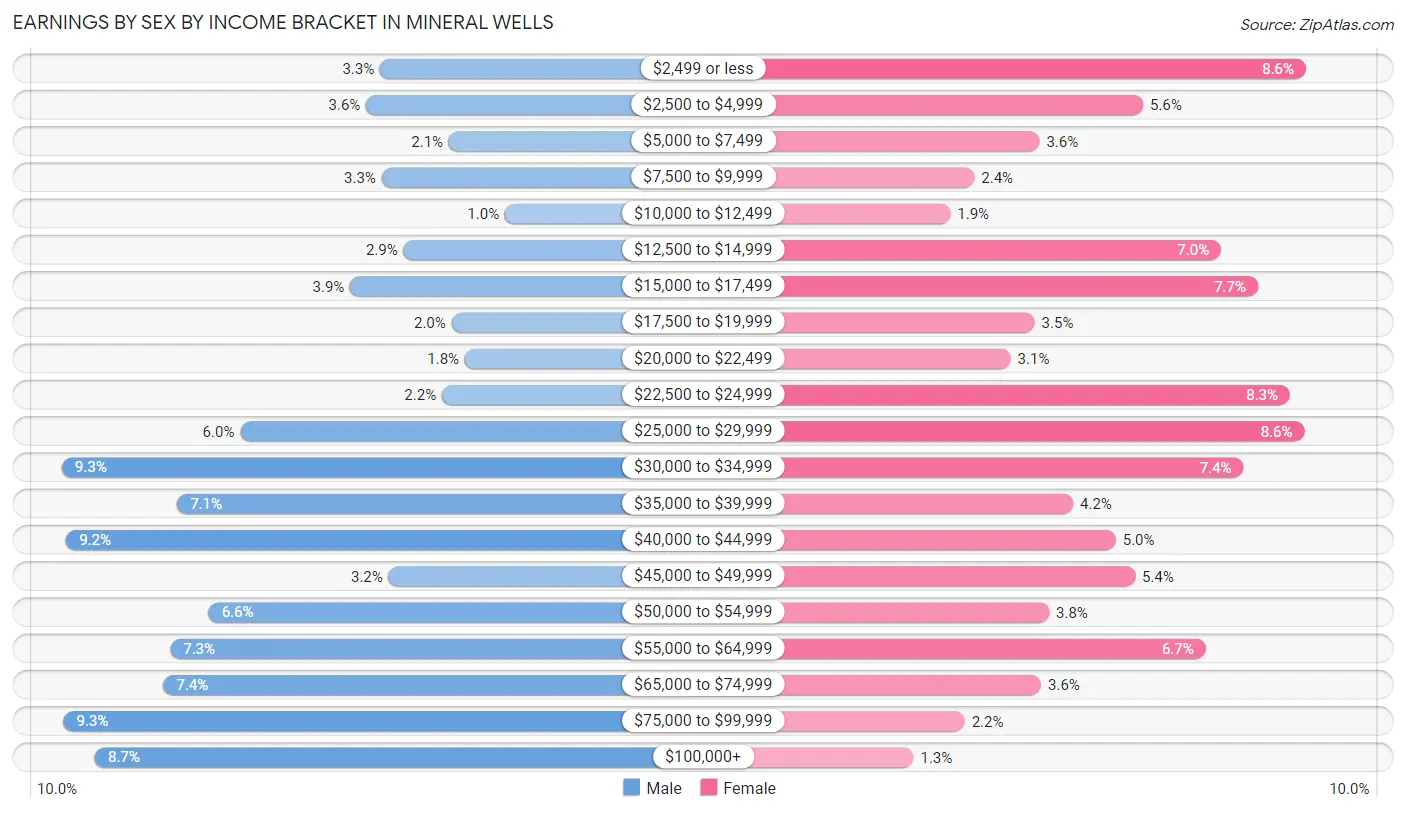
Earnings by Sex by Income Bracket in Mineral Wells
The most common earnings brackets in Mineral Wells are $30,000 to $34,999 for men (362 | 9.3%) and $2,499 or less for women (288 | 8.6%).
| Income | Male | Female |
| $2,499 or less | 130 (3.3%) | 288 (8.6%) |
| $2,500 to $4,999 | 140 (3.6%) | 186 (5.6%) |
| $5,000 to $7,499 | 80 (2.1%) | 121 (3.6%) |
| $7,500 to $9,999 | 129 (3.3%) | 80 (2.4%) |
| $10,000 to $12,499 | 39 (1.0%) | 65 (1.9%) |
| $12,500 to $14,999 | 113 (2.9%) | 235 (7.0%) |
| $15,000 to $17,499 | 152 (3.9%) | 258 (7.7%) |
| $17,500 to $19,999 | 78 (2.0%) | 118 (3.5%) |
| $20,000 to $22,499 | 68 (1.8%) | 103 (3.1%) |
| $22,500 to $24,999 | 85 (2.2%) | 278 (8.3%) |
| $25,000 to $29,999 | 232 (6.0%) | 287 (8.6%) |
| $30,000 to $34,999 | 362 (9.3%) | 249 (7.4%) |
| $35,000 to $39,999 | 278 (7.1%) | 142 (4.2%) |
| $40,000 to $44,999 | 359 (9.2%) | 169 (5.0%) |
| $45,000 to $49,999 | 124 (3.2%) | 181 (5.4%) |
| $50,000 to $54,999 | 255 (6.6%) | 127 (3.8%) |
| $55,000 to $64,999 | 283 (7.3%) | 225 (6.7%) |
| $65,000 to $74,999 | 288 (7.4%) | 122 (3.6%) |
| $75,000 to $99,999 | 361 (9.3%) | 74 (2.2%) |
| $100,000+ | 338 (8.7%) | 42 (1.3%) |
| Total | 3,894 (100.0%) | 3,350 (100.0%) |
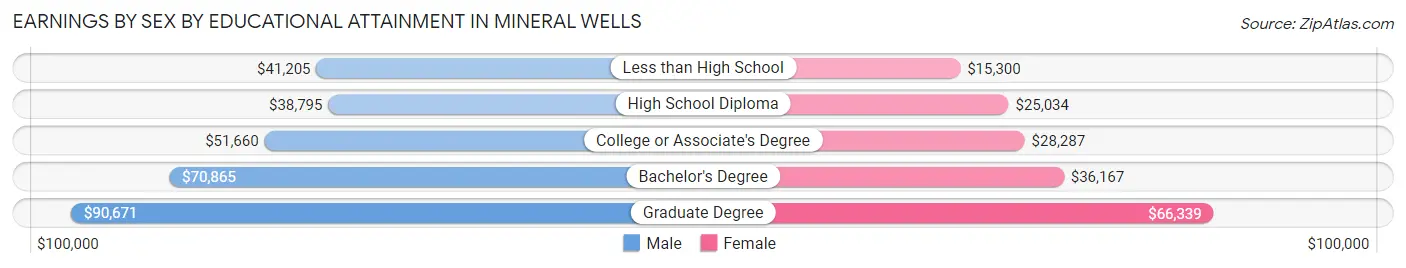
Earnings by Sex by Educational Attainment in Mineral Wells
Average earnings in Mineral Wells are $44,055 for men and $25,941 for women, a difference of 41.1%. Men with an educational attainment of graduate degree enjoy the highest average annual earnings of $90,671, while those with high school diploma education earn the least with $38,795. Women with an educational attainment of graduate degree earn the most with the average annual earnings of $66,339, while those with less than high school education have the smallest earnings of $15,300.
| Educational Attainment | Male Income | Female Income |
| Less than High School | $41,205 | $15,300 |
| High School Diploma | $38,795 | $25,034 |
| College or Associate's Degree | $51,660 | $28,287 |
| Bachelor's Degree | $70,865 | $36,167 |
| Graduate Degree | $90,671 | $66,339 |
| Total | $44,055 | $25,941 |
Family Income in Mineral Wells
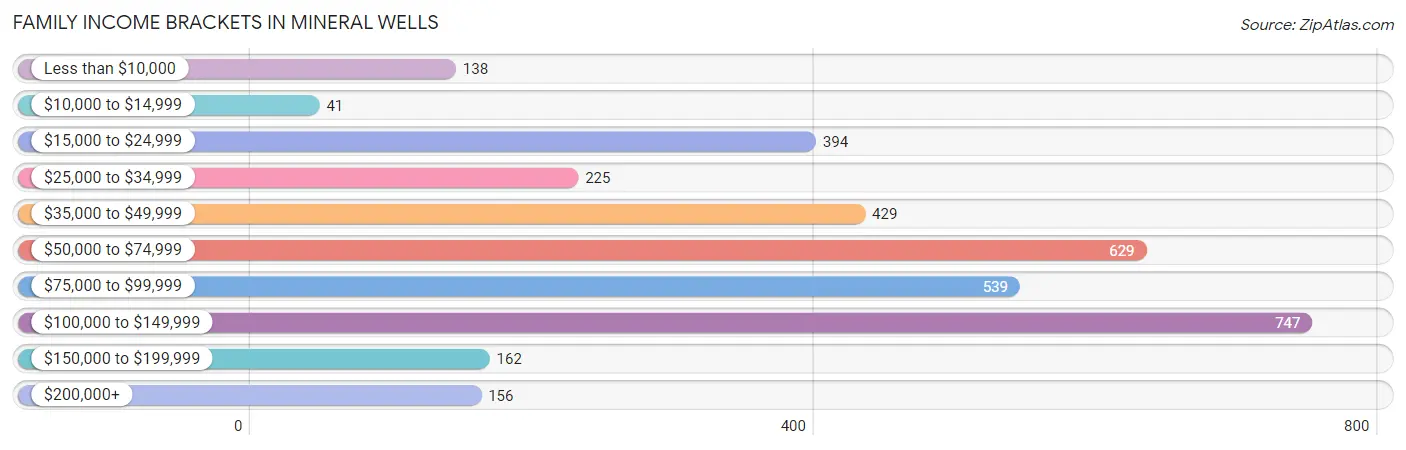
Family Income Brackets in Mineral Wells
According to the Mineral Wells family income data, there are 747 families falling into the $100,000 to $149,999 income range, which is the most common income bracket and makes up 21.6% of all families. Conversely, the $10,000 to $14,999 income bracket is the least frequent group with only 41 families (1.2%) belonging to this category.
| Income Bracket | # Families | % Families |
| Less than $10,000 | 138 | 4.0% |
| $10,000 to $14,999 | 41 | 1.2% |
| $15,000 to $24,999 | 394 | 11.4% |
| $25,000 to $34,999 | 225 | 6.5% |
| $35,000 to $49,999 | 429 | 12.4% |
| $50,000 to $74,999 | 629 | 18.2% |
| $75,000 to $99,999 | 539 | 15.6% |
| $100,000 to $149,999 | 747 | 21.6% |
| $150,000 to $199,999 | 162 | 4.7% |
| $200,000+ | 156 | 4.5% |
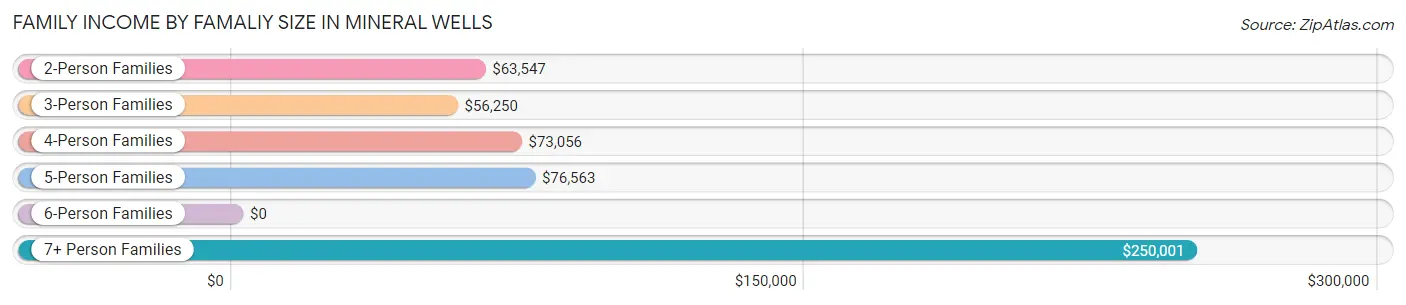
Family Income by Famaliy Size in Mineral Wells
7+ person families (113 | 3.3%) account for the highest median family income in Mineral Wells with $250,001 per family, while 7+ person families (113 | 3.3%) have the highest median income of $35,714 per family member.
| Income Bracket | # Families | Median Income |
| 2-Person Families | 1,639 (47.4%) | $63,547 |
| 3-Person Families | 612 (17.7%) | $56,250 |
| 4-Person Families | 662 (19.2%) | $73,056 |
| 5-Person Families | 304 (8.8%) | $76,563 |
| 6-Person Families | 127 (3.7%) | $0 |
| 7+ Person Families | 113 (3.3%) | $250,001 |
| Total | 3,457 (100.0%) | $67,294 |
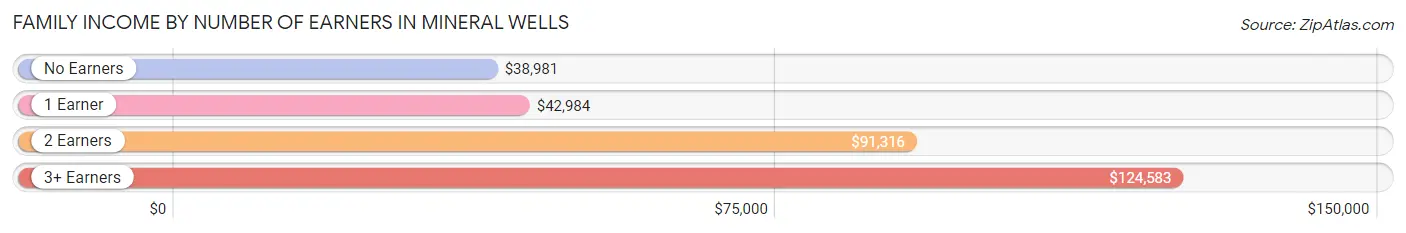
Family Income by Number of Earners in Mineral Wells
The median family income in Mineral Wells is $67,294, with families comprising 3+ earners (517) having the highest median family income of $124,583, while families with no earners (576) have the lowest median family income of $38,981, accounting for 15.0% and 16.7% of families, respectively.
| Number of Earners | # Families | Median Income |
| No Earners | 576 (16.7%) | $38,981 |
| 1 Earner | 1,266 (36.6%) | $42,984 |
| 2 Earners | 1,098 (31.8%) | $91,316 |
| 3+ Earners | 517 (15.0%) | $124,583 |
| Total | 3,457 (100.0%) | $67,294 |
Household Income in Mineral Wells
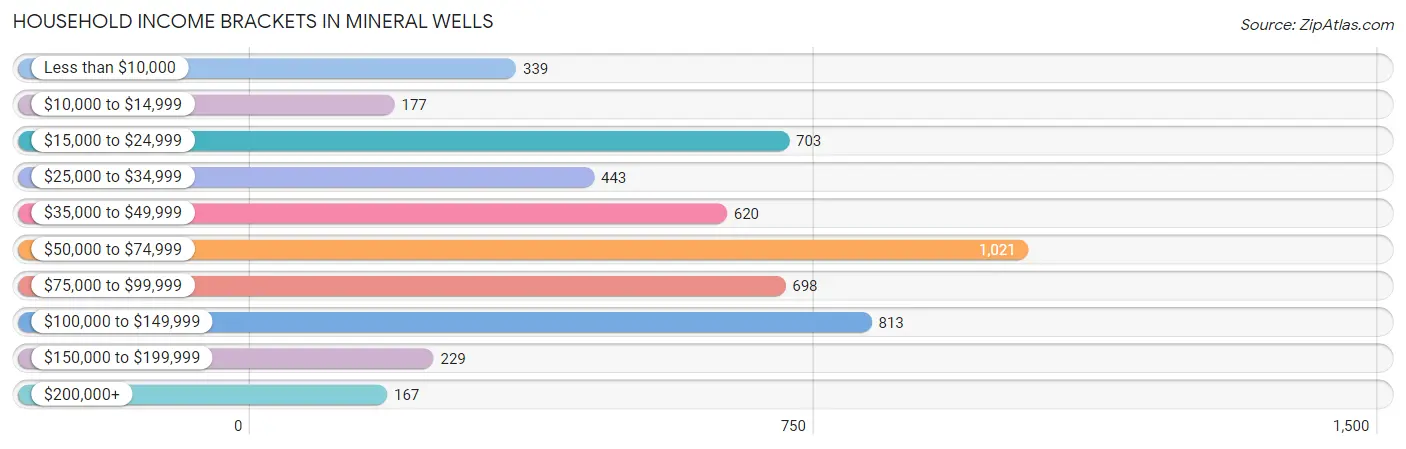
Household Income Brackets in Mineral Wells
With 1,021 households falling in the category, the $50,000 to $74,999 income range is the most frequent in Mineral Wells, accounting for 19.6% of all households. In contrast, only 167 households (3.2%) fall into the $200,000+ income bracket, making it the least populous group.
| Income Bracket | # Households | % Households |
| Less than $10,000 | 339 | 6.5% |
| $10,000 to $14,999 | 177 | 3.4% |
| $15,000 to $24,999 | 703 | 13.5% |
| $25,000 to $34,999 | 443 | 8.5% |
| $35,000 to $49,999 | 620 | 11.9% |
| $50,000 to $74,999 | 1,021 | 19.6% |
| $75,000 to $99,999 | 698 | 13.4% |
| $100,000 to $149,999 | 813 | 15.6% |
| $150,000 to $199,999 | 229 | 4.4% |
| $200,000+ | 167 | 3.2% |
Household Income by Householder Age in Mineral Wells
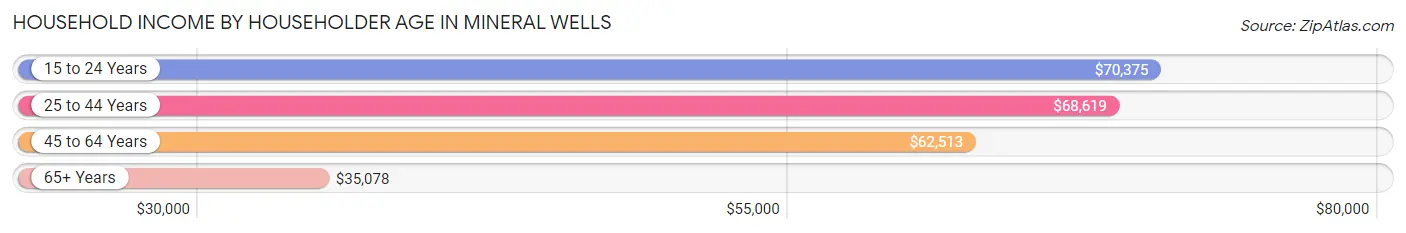
The median household income in Mineral Wells is $58,529, with the highest median household income of $70,375 found in the 15 to 24 years age bracket for the primary householder. A total of 276 households (5.3%) fall into this category. Meanwhile, the 65+ years age bracket for the primary householder has the lowest median household income of $35,078, with 1,319 households (25.3%) in this group.
| Income Bracket | # Households | Median Income |
| 15 to 24 Years | 276 (5.3%) | $70,375 |
| 25 to 44 Years | 1,665 (32.0%) | $68,619 |
| 45 to 64 Years | 1,949 (37.4%) | $62,513 |
| 65+ Years | 1,319 (25.3%) | $35,078 |
| Total | 5,209 (100.0%) | $58,529 |
Poverty in Mineral Wells
Income Below Poverty by Sex and Age in Mineral Wells
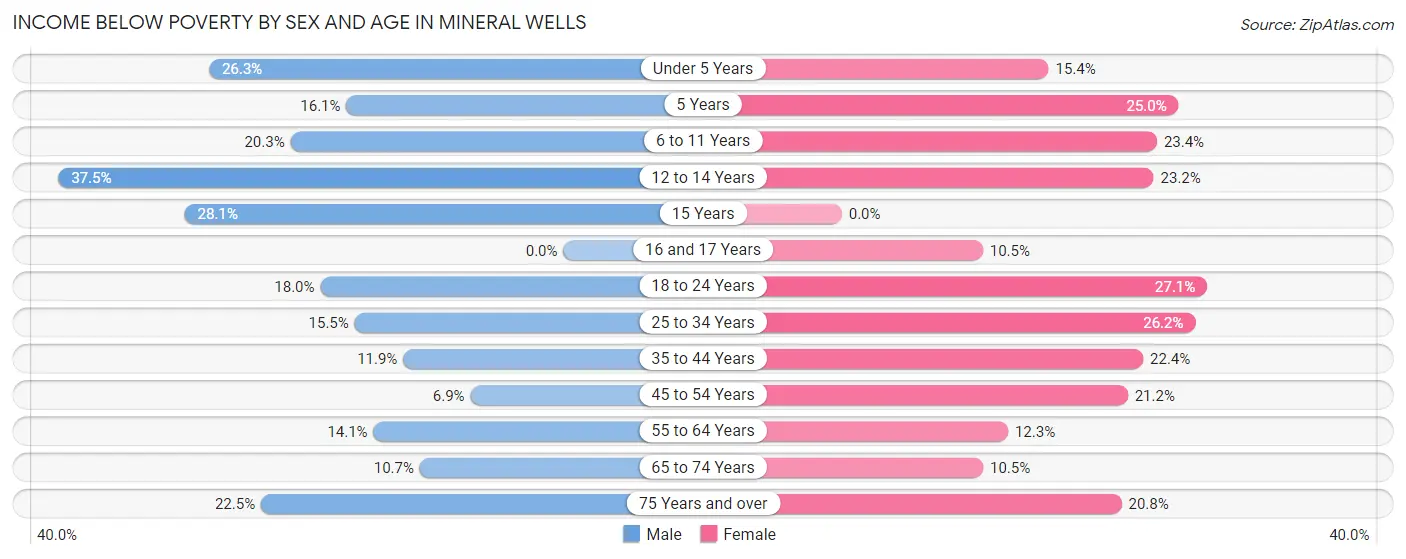
With 16.3% poverty level for males and 20.0% for females among the residents of Mineral Wells, 12 to 14 year old males and 18 to 24 year old females are the most vulnerable to poverty, with 138 males (37.5%) and 253 females (27.1%) in their respective age groups living below the poverty level.
| Age Bracket | Male | Female |
| Under 5 Years | 136 (26.3%) | 76 (15.3%) |
| 5 Years | 29 (16.1%) | 22 (25.0%) |
| 6 to 11 Years | 126 (20.3%) | 128 (23.4%) |
| 12 to 14 Years | 138 (37.5%) | 75 (23.2%) |
| 15 Years | 45 (28.1%) | 0 (0.0%) |
| 16 and 17 Years | 0 (0.0%) | 9 (10.5%) |
| 18 to 24 Years | 140 (18.0%) | 253 (27.1%) |
| 25 to 34 Years | 173 (15.5%) | 233 (26.2%) |
| 35 to 44 Years | 92 (11.9%) | 208 (22.4%) |
| 45 to 54 Years | 64 (6.9%) | 224 (21.2%) |
| 55 to 64 Years | 110 (14.1%) | 108 (12.3%) |
| 65 to 74 Years | 53 (10.7%) | 75 (10.5%) |
| 75 Years and over | 77 (22.5%) | 81 (20.8%) |
| Total | 1,183 (16.3%) | 1,492 (20.0%) |
Income Above Poverty by Sex and Age in Mineral Wells
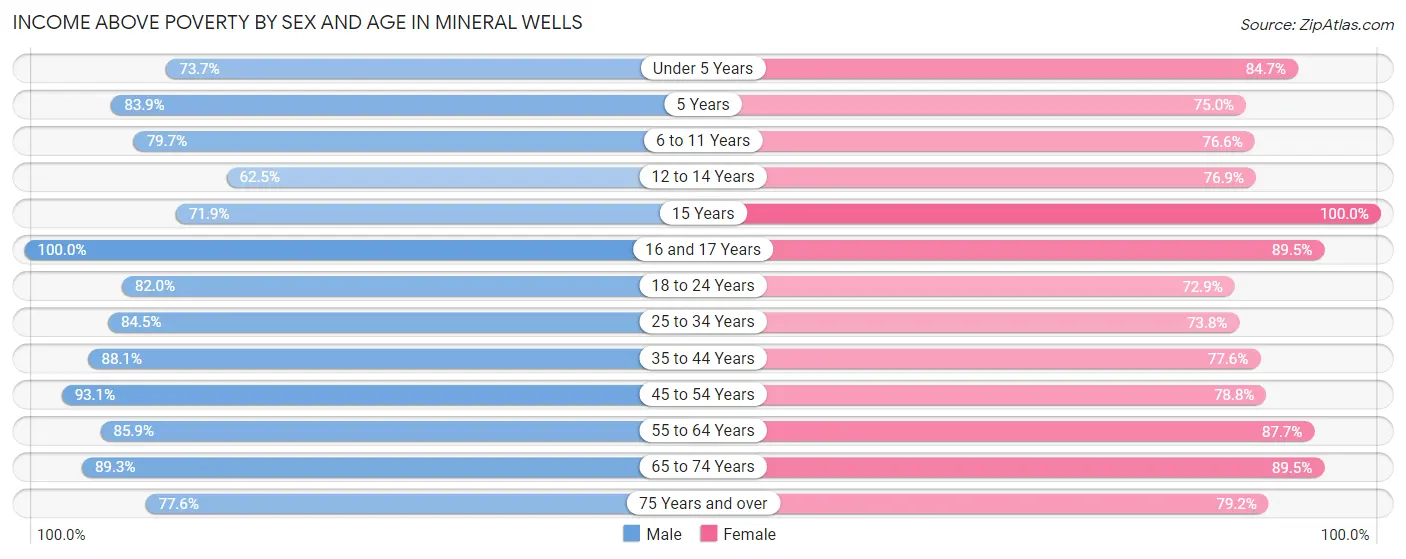
According to the poverty statistics in Mineral Wells, males aged 16 and 17 years and females aged 15 years are the age groups that are most secure financially, with 100.0% of males and 100.0% of females in these age groups living above the poverty line.
| Age Bracket | Male | Female |
| Under 5 Years | 381 (73.7%) | 419 (84.7%) |
| 5 Years | 151 (83.9%) | 66 (75.0%) |
| 6 to 11 Years | 496 (79.7%) | 419 (76.6%) |
| 12 to 14 Years | 230 (62.5%) | 249 (76.8%) |
| 15 Years | 115 (71.9%) | 130 (100.0%) |
| 16 and 17 Years | 197 (100.0%) | 77 (89.5%) |
| 18 to 24 Years | 636 (82.0%) | 680 (72.9%) |
| 25 to 34 Years | 943 (84.5%) | 655 (73.8%) |
| 35 to 44 Years | 682 (88.1%) | 722 (77.6%) |
| 45 to 54 Years | 863 (93.1%) | 831 (78.8%) |
| 55 to 64 Years | 670 (85.9%) | 767 (87.7%) |
| 65 to 74 Years | 444 (89.3%) | 640 (89.5%) |
| 75 Years and over | 266 (77.5%) | 309 (79.2%) |
| Total | 6,074 (83.7%) | 5,964 (80.0%) |
Income Below Poverty Among Married-Couple Families in Mineral Wells
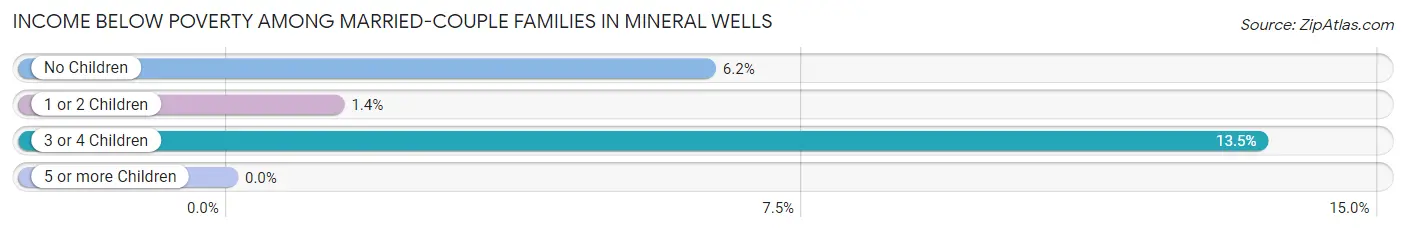
The poverty statistics for married-couple families in Mineral Wells show that 5.7% or 128 of the total 2,239 families live below the poverty line. Families with 3 or 4 children have the highest poverty rate of 13.5%, comprising of 39 families. On the other hand, families with 5 or more children have the lowest poverty rate of 0.0%, which includes 0 families.
| Children | Above Poverty | Below Poverty |
| No Children | 1,203 (93.8%) | 80 (6.2%) |
| 1 or 2 Children | 638 (98.6%) | 9 (1.4%) |
| 3 or 4 Children | 251 (86.6%) | 39 (13.5%) |
| 5 or more Children | 19 (100.0%) | 0 (0.0%) |
| Total | 2,111 (94.3%) | 128 (5.7%) |
Income Below Poverty Among Single-Parent Households in Mineral Wells
According to the poverty data in Mineral Wells, 21.7% or 75 single-father households and 28.6% or 249 single-mother households are living below the poverty line. Among single-father households, those with 1 or 2 children have the highest poverty rate, with 75 households (40.5%) experiencing poverty. Likewise, among single-mother households, those with 3 or 4 children have the highest poverty rate, with 88 households (42.7%) falling below the poverty line.
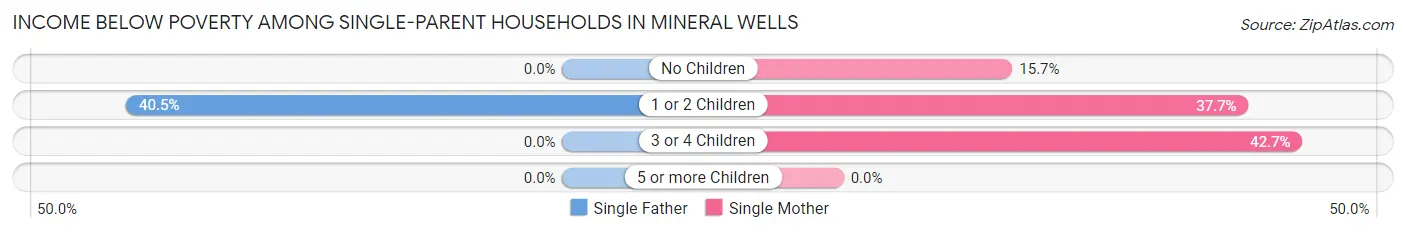
| Children | Single Father | Single Mother |
| No Children | 0 (0.0%) | 63 (15.7%) |
| 1 or 2 Children | 75 (40.5%) | 98 (37.7%) |
| 3 or 4 Children | 0 (0.0%) | 88 (42.7%) |
| 5 or more Children | 0 (0.0%) | 0 (0.0%) |
| Total | 75 (21.7%) | 249 (28.6%) |
Income Below Poverty Among Married-Couple vs Single-Parent Households in Mineral Wells
The poverty data for Mineral Wells shows that 128 of the married-couple family households (5.7%) and 324 of the single-parent households (26.6%) are living below the poverty level. Within the married-couple family households, those with 3 or 4 children have the highest poverty rate, with 39 households (13.5%) falling below the poverty line. Among the single-parent households, those with 3 or 4 children have the highest poverty rate, with 88 household (41.1%) living below poverty.
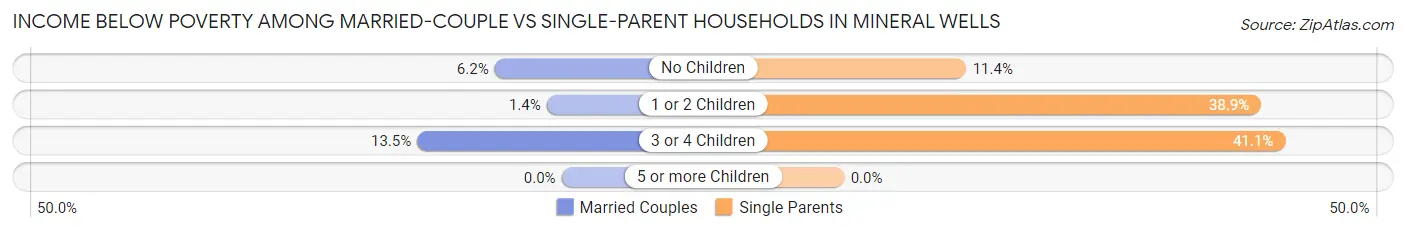
| Children | Married-Couple Families | Single-Parent Households |
| No Children | 80 (6.2%) | 63 (11.4%) |
| 1 or 2 Children | 9 (1.4%) | 173 (38.9%) |
| 3 or 4 Children | 39 (13.5%) | 88 (41.1%) |
| 5 or more Children | 0 (0.0%) | 0 (0.0%) |
| Total | 128 (5.7%) | 324 (26.6%) |
Race in Mineral Wells
The most populous races in Mineral Wells are White / Caucasian (11,531 | 76.6%), Hispanic or Latino (4,196 | 27.9%), and Two or more Races (1,357 | 9.0%).
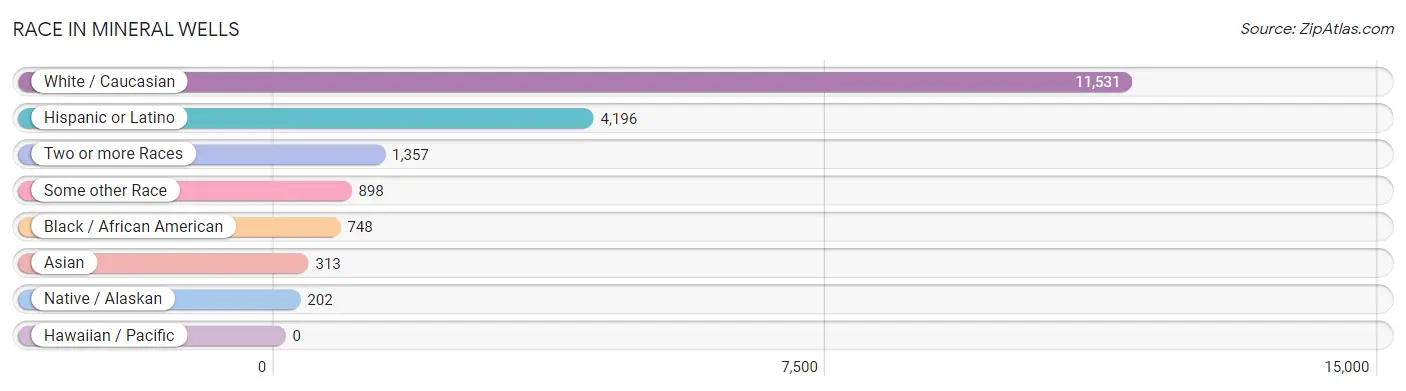
| Race | # Population | % Population |
| Asian | 313 | 2.1% |
| Black / African American | 748 | 5.0% |
| Hawaiian / Pacific | 0 | 0.0% |
| Hispanic or Latino | 4,196 | 27.9% |
| Native / Alaskan | 202 | 1.3% |
| White / Caucasian | 11,531 | 76.6% |
| Two or more Races | 1,357 | 9.0% |
| Some other Race | 898 | 6.0% |
| Total | 15,049 | 100.0% |
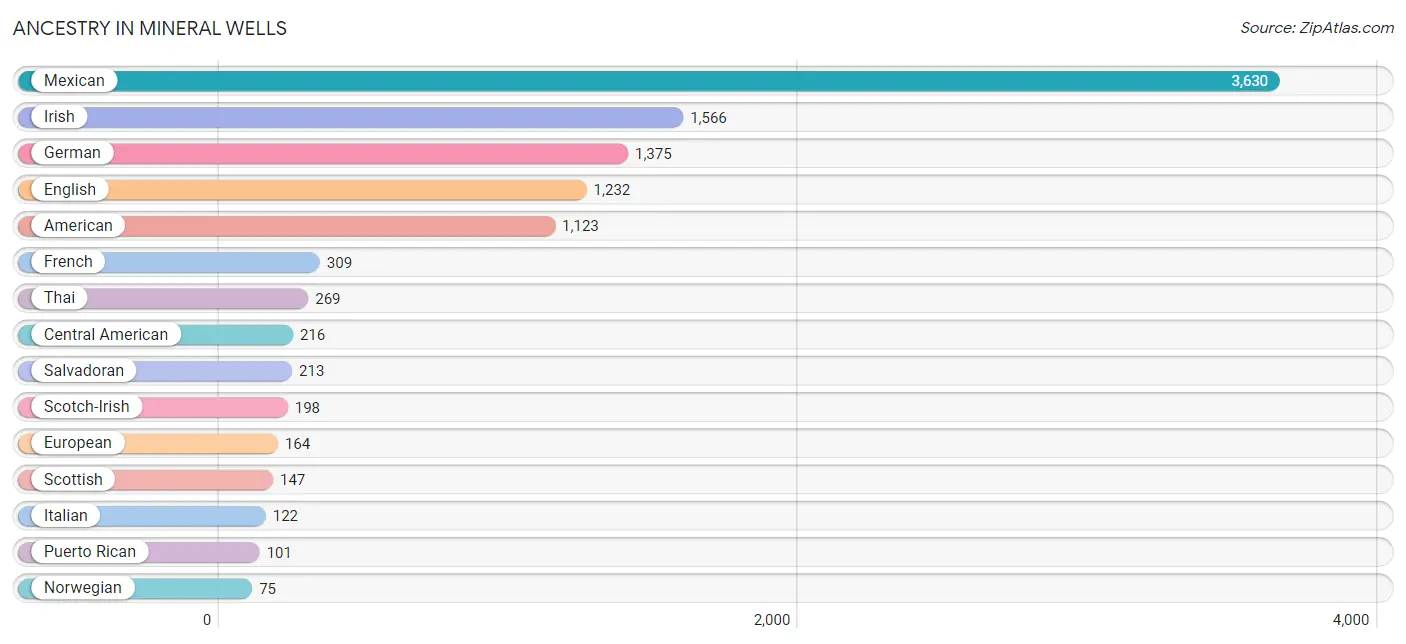
Ancestry in Mineral Wells
The most populous ancestries reported in Mineral Wells are Mexican (3,630 | 24.1%), Irish (1,566 | 10.4%), German (1,375 | 9.1%), English (1,232 | 8.2%), and American (1,123 | 7.5%), together accounting for 59.3% of all Mineral Wells residents.
| Ancestry | # Population | % Population |
| African | 24 | 0.2% |
| American | 1,123 | 7.5% |
| Austrian | 5 | 0.0% |
| Bhutanese | 21 | 0.1% |
| Blackfeet | 9 | 0.1% |
| British | 27 | 0.2% |
| Central American | 216 | 1.4% |
| Central American Indian | 29 | 0.2% |
| Cherokee | 72 | 0.5% |
| Choctaw | 7 | 0.1% |
| Cuban | 11 | 0.1% |
| Dutch | 70 | 0.5% |
| Dutch West Indian | 12 | 0.1% |
| English | 1,232 | 8.2% |
| European | 164 | 1.1% |
| French | 309 | 2.1% |
| French Canadian | 7 | 0.1% |
| German | 1,375 | 9.1% |
| Guatemalan | 3 | 0.0% |
| Hungarian | 4 | 0.0% |
| Icelander | 15 | 0.1% |
| Indian (Asian) | 7 | 0.1% |
| Irish | 1,566 | 10.4% |
| Italian | 122 | 0.8% |
| Mexican | 3,630 | 24.1% |
| Northern European | 10 | 0.1% |
| Norwegian | 75 | 0.5% |
| Polish | 51 | 0.3% |
| Puerto Rican | 101 | 0.7% |
| Russian | 6 | 0.0% |
| Salvadoran | 213 | 1.4% |
| Scotch-Irish | 198 | 1.3% |
| Scottish | 147 | 1.0% |
| Sioux | 13 | 0.1% |
| Slovene | 8 | 0.1% |
| South American | 2 | 0.0% |
| Spaniard | 49 | 0.3% |
| Spanish | 48 | 0.3% |
| Sri Lankan | 16 | 0.1% |
| Subsaharan African | 24 | 0.2% |
| Swedish | 59 | 0.4% |
| Swiss | 2 | 0.0% |
| Thai | 269 | 1.8% |
| Venezuelan | 2 | 0.0% |
| Welsh | 36 | 0.2% | View All 45 Rows |
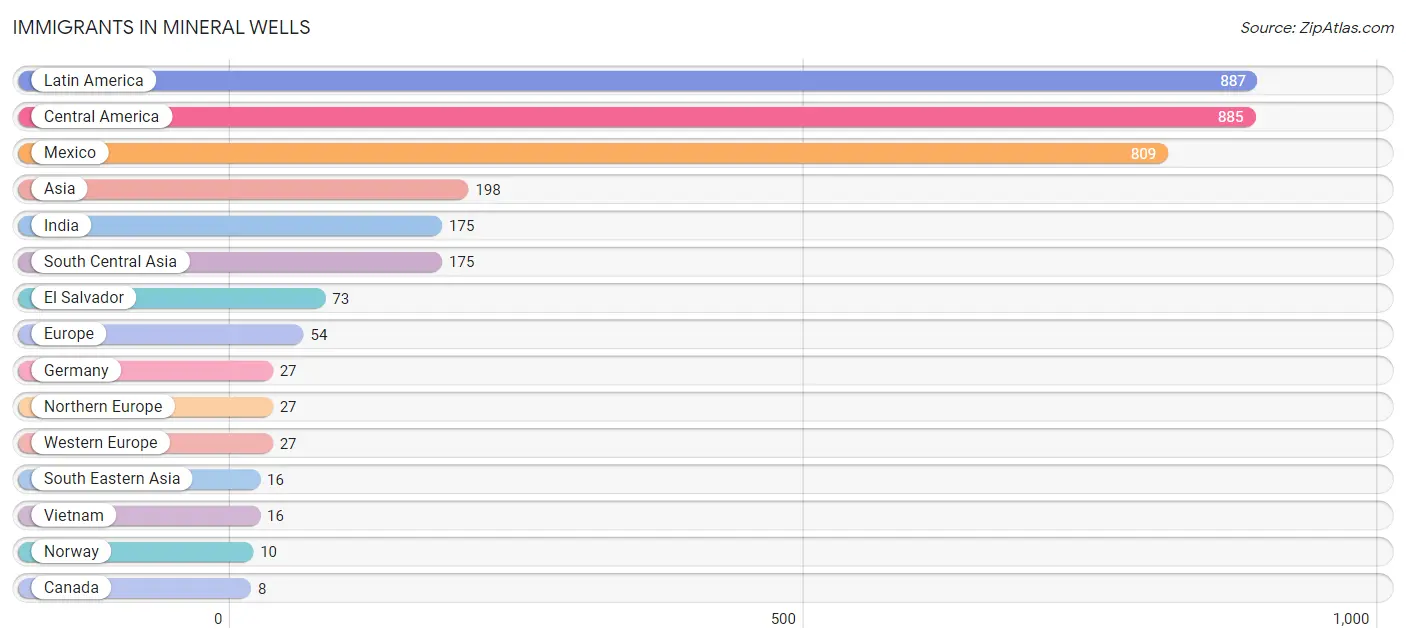
Immigrants in Mineral Wells
The most numerous immigrant groups reported in Mineral Wells came from Latin America (887 | 5.9%), Central America (885 | 5.9%), Mexico (809 | 5.4%), Asia (198 | 1.3%), and India (175 | 1.2%), together accounting for 19.6% of all Mineral Wells residents.
| Immigration Origin | # Population | % Population |
| Asia | 198 | 1.3% |
| Canada | 8 | 0.1% |
| Central America | 885 | 5.9% |
| China | 7 | 0.1% |
| Eastern Asia | 7 | 0.1% |
| El Salvador | 73 | 0.5% |
| Europe | 54 | 0.4% |
| Germany | 27 | 0.2% |
| Guatemala | 3 | 0.0% |
| India | 175 | 1.2% |
| Ireland | 4 | 0.0% |
| Latin America | 887 | 5.9% |
| Mexico | 809 | 5.4% |
| Northern Europe | 27 | 0.2% |
| Norway | 10 | 0.1% |
| South America | 2 | 0.0% |
| South Central Asia | 175 | 1.2% |
| South Eastern Asia | 16 | 0.1% |
| Taiwan | 7 | 0.1% |
| Venezuela | 2 | 0.0% |
| Vietnam | 16 | 0.1% |
| Western Europe | 27 | 0.2% | View All 22 Rows |
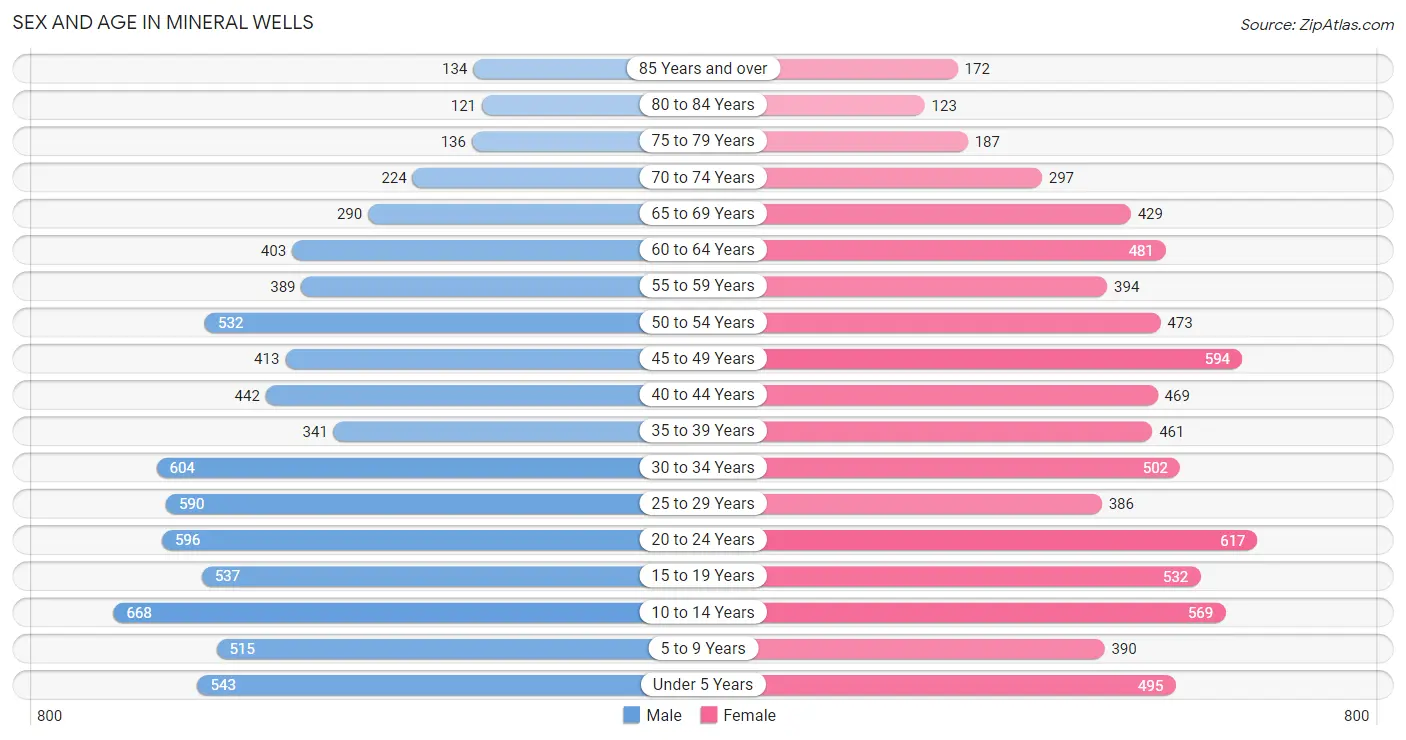
Sex and Age in Mineral Wells
Sex and Age in Mineral Wells
The most populous age groups in Mineral Wells are 10 to 14 Years (668 | 8.9%) for men and 20 to 24 Years (617 | 8.2%) for women.
| Age Bracket | Male | Female |
| Under 5 Years | 543 (7.3%) | 495 (6.5%) |
| 5 to 9 Years | 515 (6.9%) | 390 (5.1%) |
| 10 to 14 Years | 668 (8.9%) | 569 (7.5%) |
| 15 to 19 Years | 537 (7.2%) | 532 (7.0%) |
| 20 to 24 Years | 596 (8.0%) | 617 (8.2%) |
| 25 to 29 Years | 590 (7.9%) | 386 (5.1%) |
| 30 to 34 Years | 604 (8.1%) | 502 (6.6%) |
| 35 to 39 Years | 341 (4.6%) | 461 (6.1%) |
| 40 to 44 Years | 442 (5.9%) | 469 (6.2%) |
| 45 to 49 Years | 413 (5.5%) | 594 (7.9%) |
| 50 to 54 Years | 532 (7.1%) | 473 (6.2%) |
| 55 to 59 Years | 389 (5.2%) | 394 (5.2%) |
| 60 to 64 Years | 403 (5.4%) | 481 (6.4%) |
| 65 to 69 Years | 290 (3.9%) | 429 (5.7%) |
| 70 to 74 Years | 224 (3.0%) | 297 (3.9%) |
| 75 to 79 Years | 136 (1.8%) | 187 (2.5%) |
| 80 to 84 Years | 121 (1.6%) | 123 (1.6%) |
| 85 Years and over | 134 (1.8%) | 172 (2.3%) |
| Total | 7,478 (100.0%) | 7,571 (100.0%) |
Families and Households in Mineral Wells
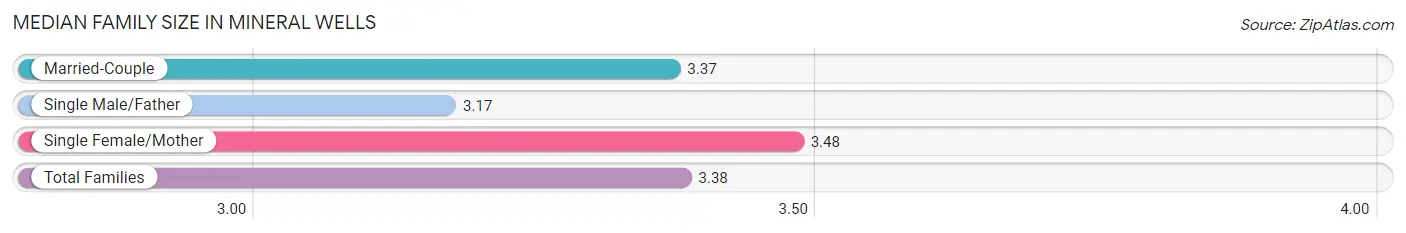
Median Family Size in Mineral Wells
The median family size in Mineral Wells is 3.38 persons per family, with single female/mother families (872 | 25.2%) accounting for the largest median family size of 3.48 persons per family. On the other hand, single male/father families (346 | 10.0%) represent the smallest median family size with 3.17 persons per family.
| Family Type | # Families | Family Size |
| Married-Couple | 2,239 (64.8%) | 3.37 |
| Single Male/Father | 346 (10.0%) | 3.17 |
| Single Female/Mother | 872 (25.2%) | 3.48 |
| Total Families | 3,457 (100.0%) | 3.38 |
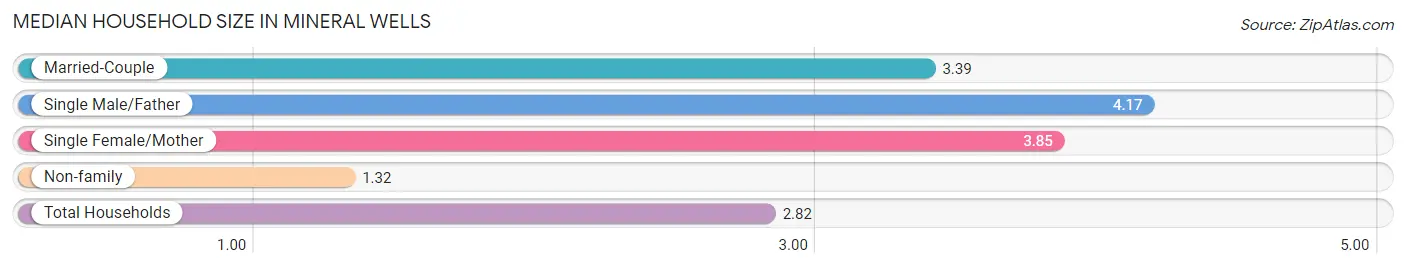
Median Household Size in Mineral Wells
The median household size in Mineral Wells is 2.82 persons per household, with single male/father households (346 | 6.6%) accounting for the largest median household size of 4.17 persons per household. non-family households (1,752 | 33.6%) represent the smallest median household size with 1.32 persons per household.
| Household Type | # Households | Household Size |
| Married-Couple | 2,239 (43.0%) | 3.39 |
| Single Male/Father | 346 (6.6%) | 4.17 |
| Single Female/Mother | 872 (16.7%) | 3.85 |
| Non-family | 1,752 (33.6%) | 1.32 |
| Total Households | 5,209 (100.0%) | 2.82 |
Household Size by Marriage Status in Mineral Wells
Out of a total of 5,209 households in Mineral Wells, 3,457 (66.4%) are family households, while 1,752 (33.6%) are nonfamily households. The most numerous type of family households are 2-person households, comprising 1,436, and the most common type of nonfamily households are 1-person households, comprising 1,376.
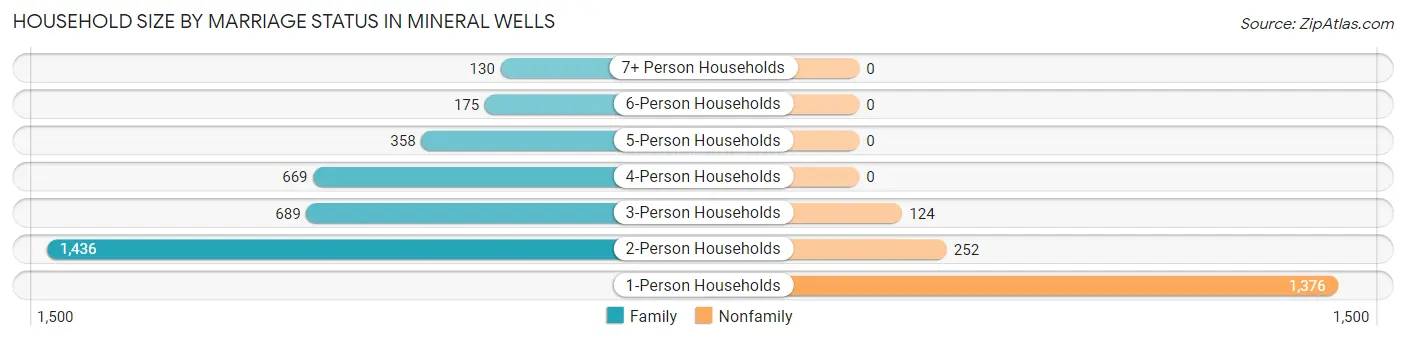
| Household Size | Family Households | Nonfamily Households |
| 1-Person Households | - | 1,376 (26.4%) |
| 2-Person Households | 1,436 (27.6%) | 252 (4.8%) |
| 3-Person Households | 689 (13.2%) | 124 (2.4%) |
| 4-Person Households | 669 (12.8%) | 0 (0.0%) |
| 5-Person Households | 358 (6.9%) | 0 (0.0%) |
| 6-Person Households | 175 (3.4%) | 0 (0.0%) |
| 7+ Person Households | 130 (2.5%) | 0 (0.0%) |
| Total | 3,457 (66.4%) | 1,752 (33.6%) |
Female Fertility in Mineral Wells
Fertility by Age in Mineral Wells
Average fertility rate in Mineral Wells is 61.0 births per 1,000 women. Women in the age bracket of 20 to 34 years have the highest fertility rate with 121.0 births per 1,000 women. Women in the age bracket of 20 to 34 years acount for 83.1% of all women with births.
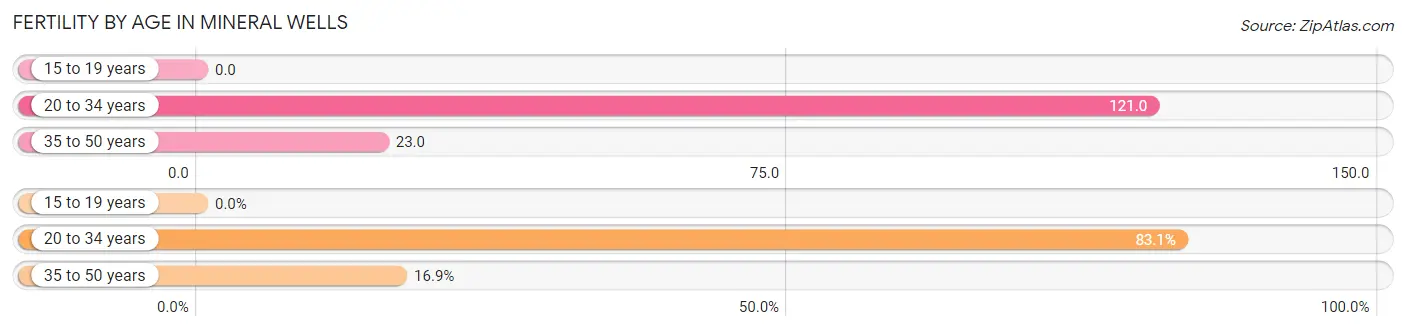
| Age Bracket | Women with Births | Births / 1,000 Women |
| 15 to 19 years | 0 (0.0%) | 0.0 |
| 20 to 34 years | 182 (83.1%) | 121.0 |
| 35 to 50 years | 37 (16.9%) | 23.0 |
| Total | 219 (100.0%) | 61.0 |
Fertility by Age by Marriage Status in Mineral Wells
48.4% of women with births (219) in Mineral Wells are married. The highest percentage of unmarried women with births falls into 35 to 50 years age bracket with 89.2% of them unmarried at the time of birth, while the lowest percentage of unmarried women with births belong to 20 to 34 years age bracket with 44.0% of them unmarried.
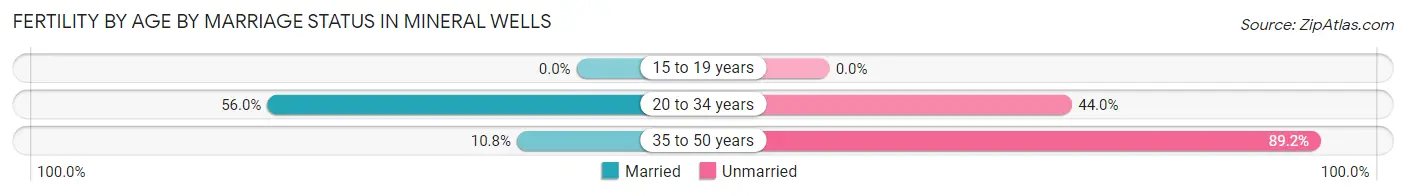
| Age Bracket | Married | Unmarried |
| 15 to 19 years | 0 (0.0%) | 0 (0.0%) |
| 20 to 34 years | 102 (56.0%) | 80 (44.0%) |
| 35 to 50 years | 4 (10.8%) | 33 (89.2%) |
| Total | 106 (48.4%) | 113 (51.6%) |
Fertility by Education in Mineral Wells
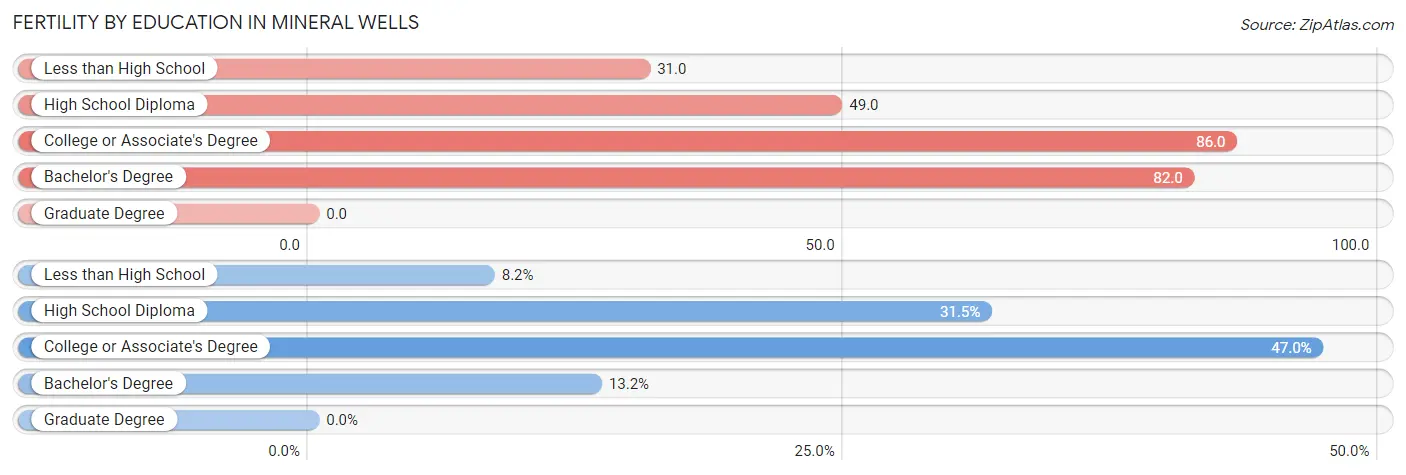
| Educational Attainment | Women with Births | Births / 1,000 Women |
| Less than High School | 18 (8.2%) | 31.0 |
| High School Diploma | 69 (31.5%) | 49.0 |
| College or Associate's Degree | 103 (47.0%) | 86.0 |
| Bachelor's Degree | 29 (13.2%) | 82.0 |
| Graduate Degree | 0 (0.0%) | 0.0 |
| Total | 219 (100.0%) | 61.0 |
Fertility by Education by Marriage Status in Mineral Wells
51.6% of women with births in Mineral Wells are unmarried. Women with the educational attainment of less than high school are most likely to be married with 100.0% of them married at childbirth, while women with the educational attainment of high school diploma are least likely to be married with 76.8% of them unmarried at childbirth.
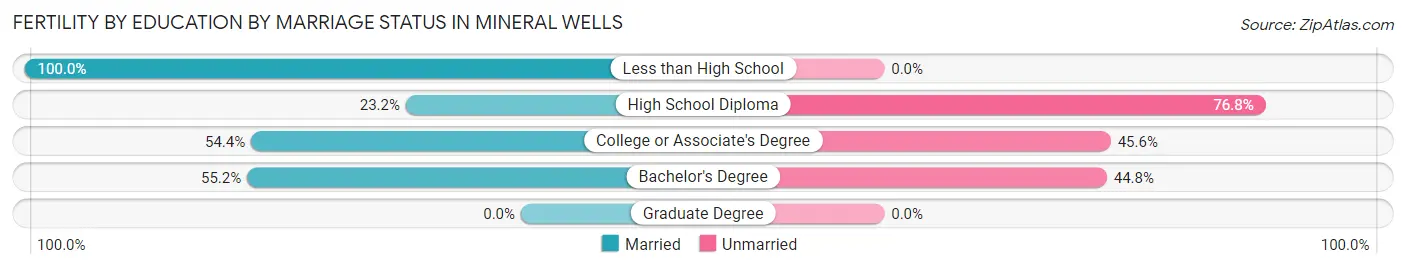
| Educational Attainment | Married | Unmarried |
| Less than High School | 18 (100.0%) | 0 (0.0%) |
| High School Diploma | 16 (23.2%) | 53 (76.8%) |
| College or Associate's Degree | 56 (54.4%) | 47 (45.6%) |
| Bachelor's Degree | 16 (55.2%) | 13 (44.8%) |
| Graduate Degree | 0 (0.0%) | 0 (0.0%) |
| Total | 106 (48.4%) | 113 (51.6%) |
Employment Characteristics in Mineral Wells
Employment by Class of Employer in Mineral Wells
Among the 6,302 employed individuals in Mineral Wells, private company employees (4,328 | 68.7%), self-employed (not incorporated) (616 | 9.8%), and local government employees (557 | 8.8%) make up the most common classes of employment.
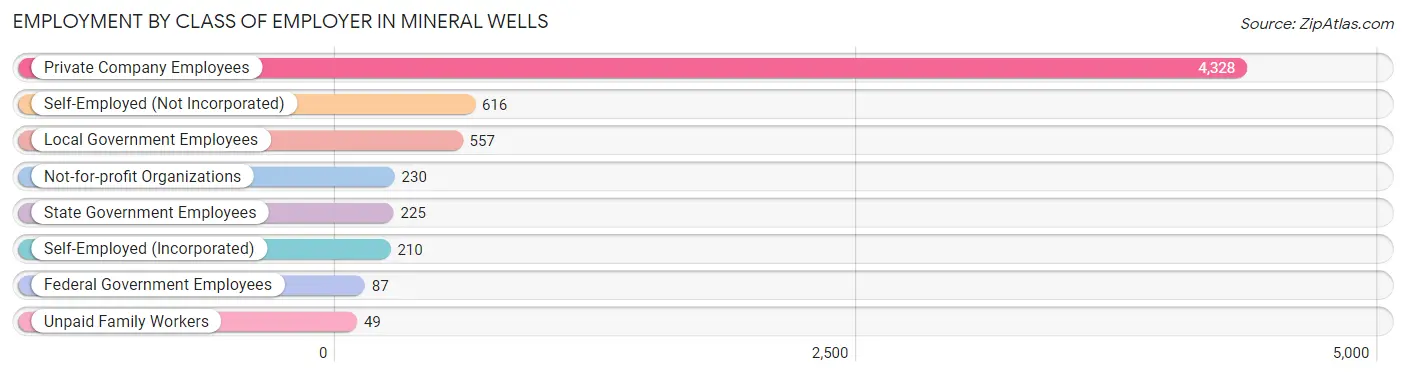
| Employer Class | # Employees | % Employees |
| Private Company Employees | 4,328 | 68.7% |
| Self-Employed (Incorporated) | 210 | 3.3% |
| Self-Employed (Not Incorporated) | 616 | 9.8% |
| Not-for-profit Organizations | 230 | 3.6% |
| Local Government Employees | 557 | 8.8% |
| State Government Employees | 225 | 3.6% |
| Federal Government Employees | 87 | 1.4% |
| Unpaid Family Workers | 49 | 0.8% |
| Total | 6,302 | 100.0% |
Employment Status by Age in Mineral Wells
According to the labor force statistics for Mineral Wells, out of the total population over 16 years of age (11,579), 60.2% or 6,971 individuals are in the labor force, with 8.2% or 572 of them unemployed. The age group with the highest labor force participation rate is 20 to 24 years, with 84.3% or 1,023 individuals in the labor force. Within the labor force, the 16 to 19 years age range has the highest percentage of unemployed individuals, with 31.1% or 107 of them being unemployed.
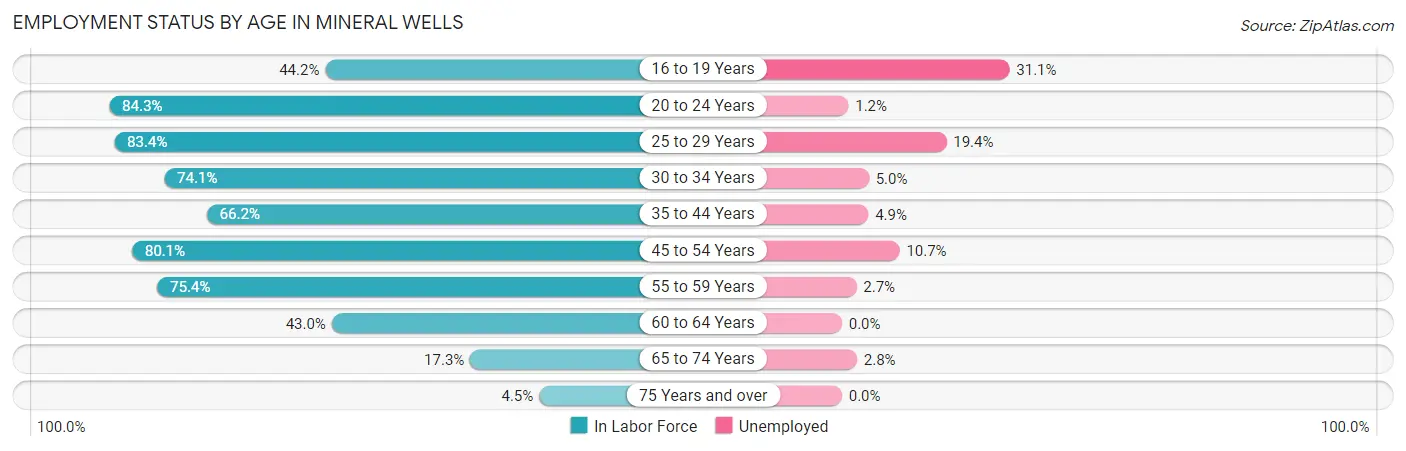
| Age Bracket | In Labor Force | Unemployed |
| 16 to 19 Years | 344 (44.2%) | 107 (31.1%) |
| 20 to 24 Years | 1,023 (84.3%) | 12 (1.2%) |
| 25 to 29 Years | 814 (83.4%) | 158 (19.4%) |
| 30 to 34 Years | 820 (74.1%) | 41 (5.0%) |
| 35 to 44 Years | 1,134 (66.2%) | 56 (4.9%) |
| 45 to 54 Years | 1,612 (80.1%) | 172 (10.7%) |
| 55 to 59 Years | 590 (75.4%) | 16 (2.7%) |
| 60 to 64 Years | 380 (43.0%) | 0 (0.0%) |
| 65 to 74 Years | 215 (17.3%) | 6 (2.8%) |
| 75 Years and over | 39 (4.5%) | 0 (0.0%) |
| Total | 6,971 (60.2%) | 572 (8.2%) |
Employment Status by Educational Attainment in Mineral Wells
According to labor force statistics for Mineral Wells, 71.6% of individuals (5,351) out of the total population between 25 and 64 years of age (7,474) are in the labor force, with 8.3% or 444 of them being unemployed. The group with the highest labor force participation rate are those with the educational attainment of bachelor's degree or higher, with 75.3% or 660 individuals in the labor force. Within the labor force, individuals with less than high school education have the highest percentage of unemployment, with 10.2% or 71 of them being unemployed.
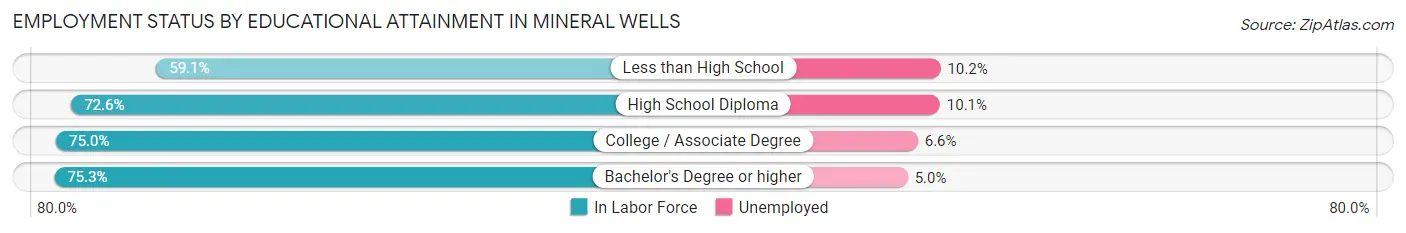
| Educational Attainment | In Labor Force | Unemployed |
| Less than High School | 696 (59.1%) | 120 (10.2%) |
| High School Diploma | 2,140 (72.6%) | 298 (10.1%) |
| College / Associate Degree | 1,854 (75.0%) | 163 (6.6%) |
| Bachelor's Degree or higher | 660 (75.3%) | 44 (5.0%) |
| Total | 5,351 (71.6%) | 620 (8.3%) |
Employment Occupations by Sex in Mineral Wells
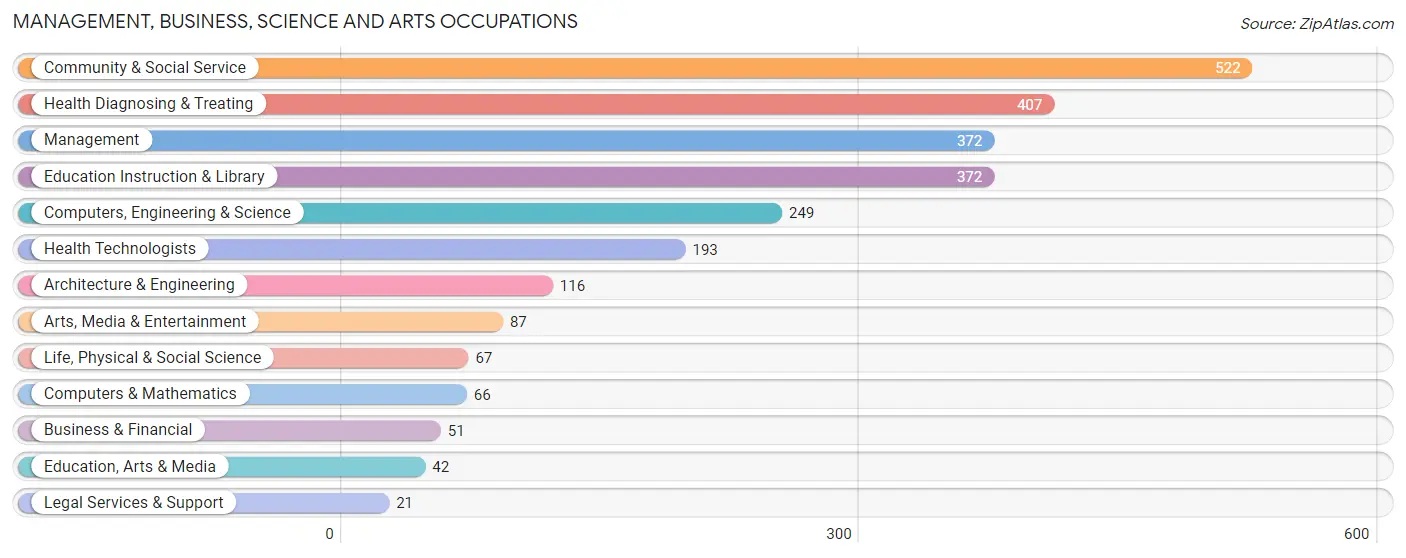
Management, Business, Science and Arts Occupations
The most common Management, Business, Science and Arts occupations in Mineral Wells are Community & Social Service (522 | 8.2%), Health Diagnosing & Treating (407 | 6.4%), Management (372 | 5.8%), Education Instruction & Library (372 | 5.8%), and Computers, Engineering & Science (249 | 3.9%).
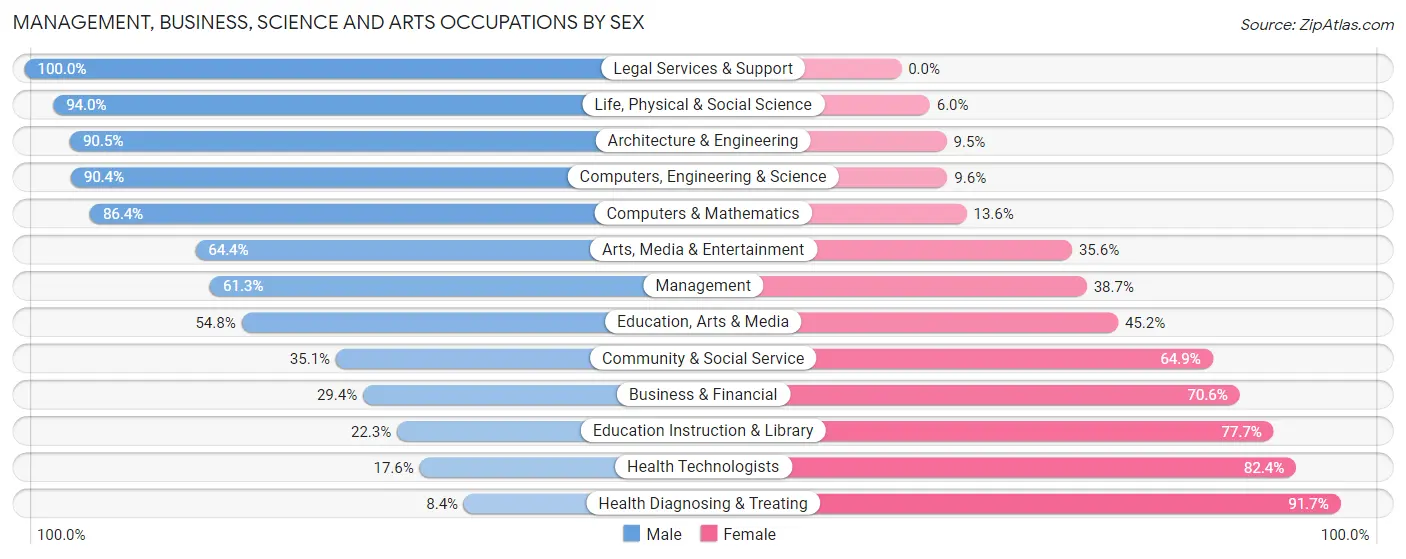
Management, Business, Science and Arts Occupations by Sex
Within the Management, Business, Science and Arts occupations in Mineral Wells, the most male-oriented occupations are Legal Services & Support (100.0%), Life, Physical & Social Science (94.0%), and Architecture & Engineering (90.5%), while the most female-oriented occupations are Health Diagnosing & Treating (91.6%), Health Technologists (82.4%), and Education Instruction & Library (77.7%).
| Occupation | Male | Female |
| Management | 228 (61.3%) | 144 (38.7%) |
| Business & Financial | 15 (29.4%) | 36 (70.6%) |
| Computers, Engineering & Science | 225 (90.4%) | 24 (9.6%) |
| Computers & Mathematics | 57 (86.4%) | 9 (13.6%) |
| Architecture & Engineering | 105 (90.5%) | 11 (9.5%) |
| Life, Physical & Social Science | 63 (94.0%) | 4 (6.0%) |
| Community & Social Service | 183 (35.1%) | 339 (64.9%) |
| Education, Arts & Media | 23 (54.8%) | 19 (45.2%) |
| Legal Services & Support | 21 (100.0%) | 0 (0.0%) |
| Education Instruction & Library | 83 (22.3%) | 289 (77.7%) |
| Arts, Media & Entertainment | 56 (64.4%) | 31 (35.6%) |
| Health Diagnosing & Treating | 34 (8.4%) | 373 (91.6%) |
| Health Technologists | 34 (17.6%) | 159 (82.4%) |
| Total (Category) | 685 (42.8%) | 916 (57.2%) |
| Total (Overall) | 3,601 (56.3%) | 2,800 (43.7%) |
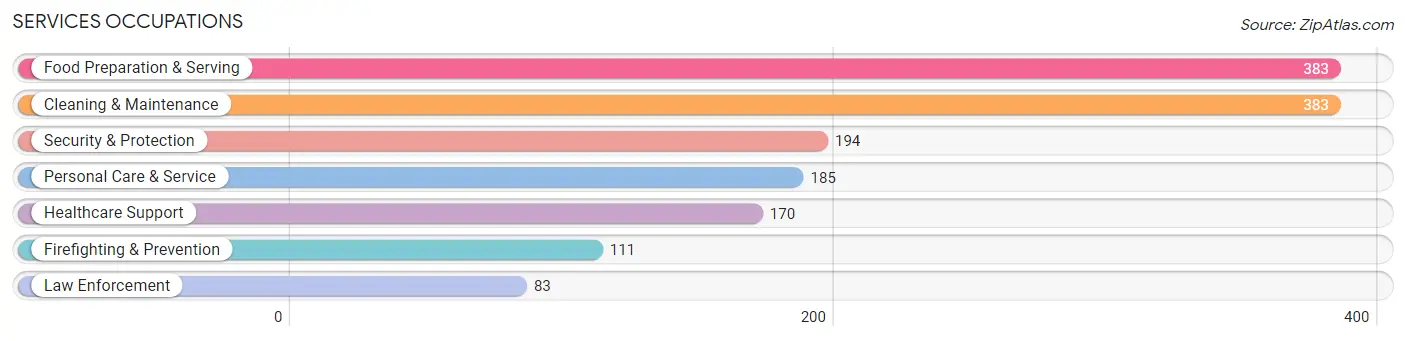
Services Occupations
The most common Services occupations in Mineral Wells are Food Preparation & Serving (383 | 6.0%), Cleaning & Maintenance (383 | 6.0%), Security & Protection (194 | 3.0%), Personal Care & Service (185 | 2.9%), and Healthcare Support (170 | 2.7%).
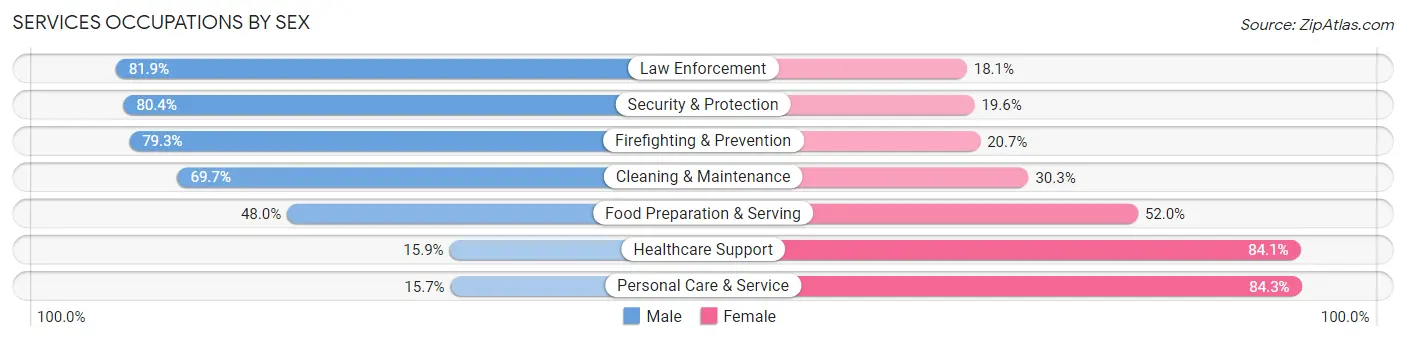
Services Occupations by Sex
Within the Services occupations in Mineral Wells, the most male-oriented occupations are Law Enforcement (81.9%), Security & Protection (80.4%), and Firefighting & Prevention (79.3%), while the most female-oriented occupations are Personal Care & Service (84.3%), Healthcare Support (84.1%), and Food Preparation & Serving (52.0%).
| Occupation | Male | Female |
| Healthcare Support | 27 (15.9%) | 143 (84.1%) |
| Security & Protection | 156 (80.4%) | 38 (19.6%) |
| Firefighting & Prevention | 88 (79.3%) | 23 (20.7%) |
| Law Enforcement | 68 (81.9%) | 15 (18.1%) |
| Food Preparation & Serving | 184 (48.0%) | 199 (52.0%) |
| Cleaning & Maintenance | 267 (69.7%) | 116 (30.3%) |
| Personal Care & Service | 29 (15.7%) | 156 (84.3%) |
| Total (Category) | 663 (50.4%) | 652 (49.6%) |
| Total (Overall) | 3,601 (56.3%) | 2,800 (43.7%) |
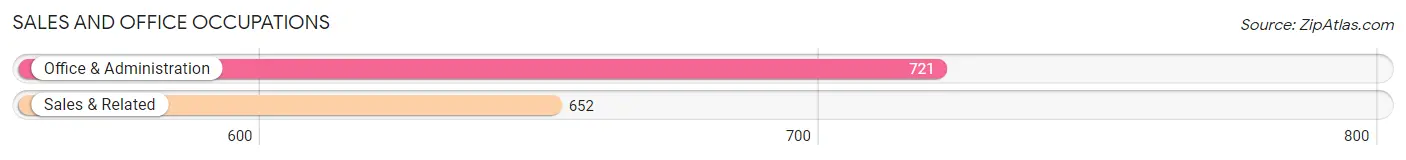
Sales and Office Occupations
The most common Sales and Office occupations in Mineral Wells are Office & Administration (721 | 11.3%), and Sales & Related (652 | 10.2%).
Sales and Office Occupations by Sex
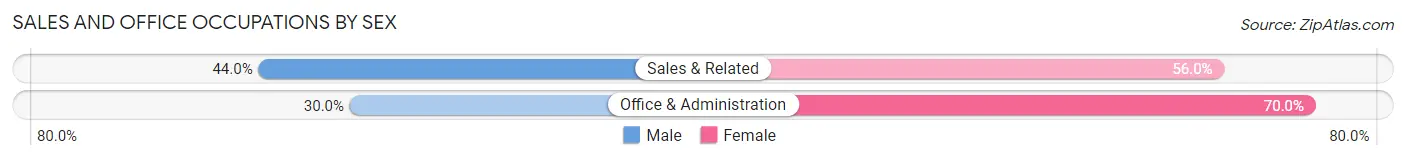
| Occupation | Male | Female |
| Sales & Related | 287 (44.0%) | 365 (56.0%) |
| Office & Administration | 216 (30.0%) | 505 (70.0%) |
| Total (Category) | 503 (36.6%) | 870 (63.4%) |
| Total (Overall) | 3,601 (56.3%) | 2,800 (43.7%) |
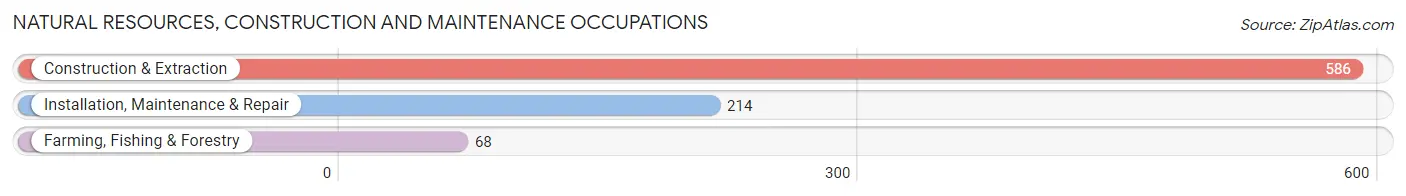
Natural Resources, Construction and Maintenance Occupations
The most common Natural Resources, Construction and Maintenance occupations in Mineral Wells are Construction & Extraction (586 | 9.1%), Installation, Maintenance & Repair (214 | 3.3%), and Farming, Fishing & Forestry (68 | 1.1%).
Natural Resources, Construction and Maintenance Occupations by Sex
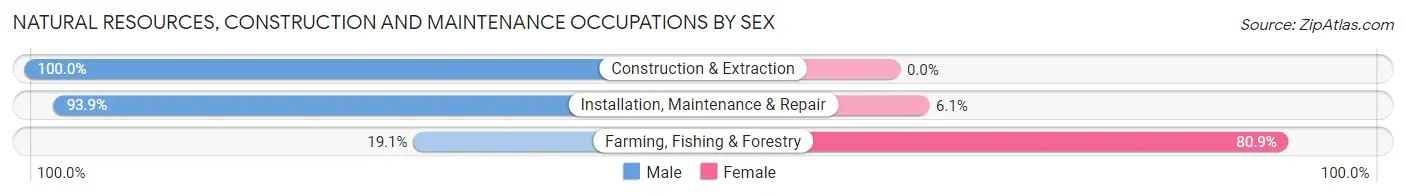
| Occupation | Male | Female |
| Farming, Fishing & Forestry | 13 (19.1%) | 55 (80.9%) |
| Construction & Extraction | 586 (100.0%) | 0 (0.0%) |
| Installation, Maintenance & Repair | 201 (93.9%) | 13 (6.1%) |
| Total (Category) | 800 (92.2%) | 68 (7.8%) |
| Total (Overall) | 3,601 (56.3%) | 2,800 (43.7%) |
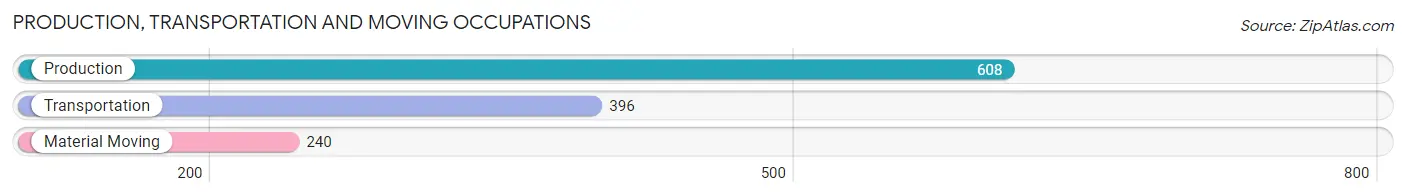
Production, Transportation and Moving Occupations
The most common Production, Transportation and Moving occupations in Mineral Wells are Production (608 | 9.5%), Transportation (396 | 6.2%), and Material Moving (240 | 3.7%).
Production, Transportation and Moving Occupations by Sex
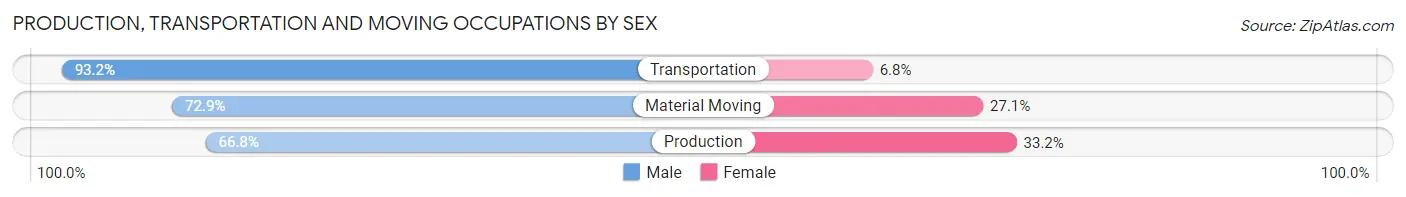
| Occupation | Male | Female |
| Production | 406 (66.8%) | 202 (33.2%) |
| Transportation | 369 (93.2%) | 27 (6.8%) |
| Material Moving | 175 (72.9%) | 65 (27.1%) |
| Total (Category) | 950 (76.4%) | 294 (23.6%) |
| Total (Overall) | 3,601 (56.3%) | 2,800 (43.7%) |
Employment Industries by Sex in Mineral Wells
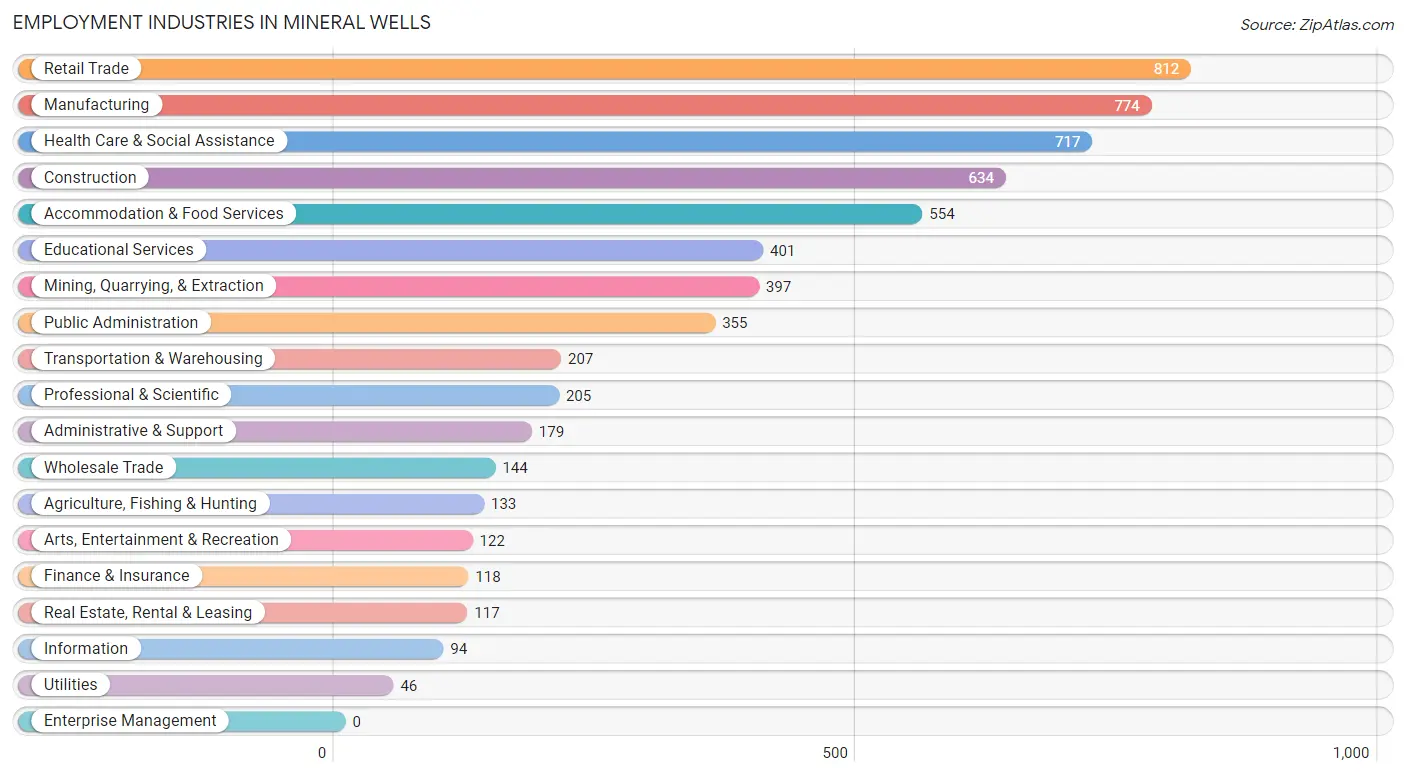
Employment Industries in Mineral Wells
The major employment industries in Mineral Wells include Retail Trade (812 | 12.7%), Manufacturing (774 | 12.1%), Health Care & Social Assistance (717 | 11.2%), Construction (634 | 9.9%), and Accommodation & Food Services (554 | 8.6%).
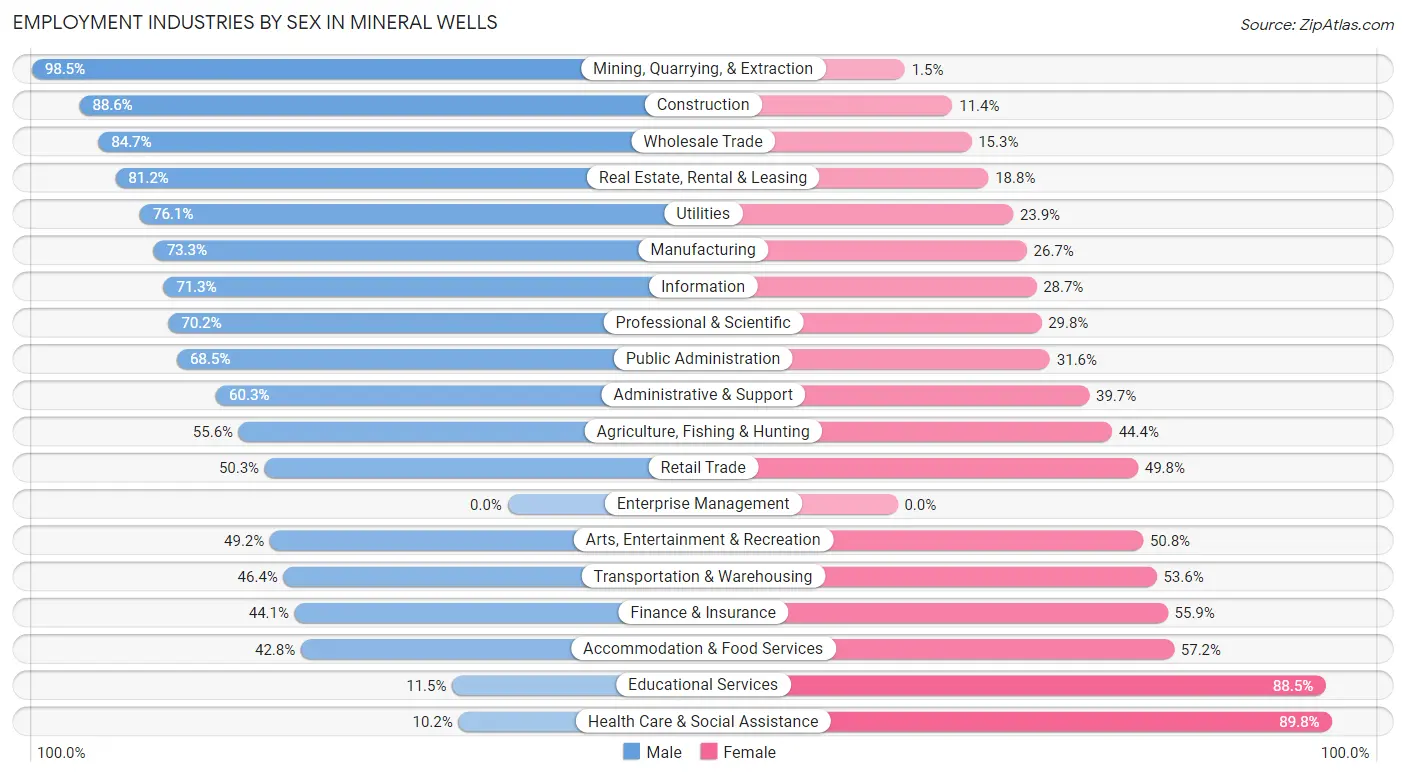
Employment Industries by Sex in Mineral Wells
The Mineral Wells industries that see more men than women are Mining, Quarrying, & Extraction (98.5%), Construction (88.6%), and Wholesale Trade (84.7%), whereas the industries that tend to have a higher number of women are Health Care & Social Assistance (89.8%), Educational Services (88.5%), and Accommodation & Food Services (57.2%).
| Industry | Male | Female |
| Agriculture, Fishing & Hunting | 74 (55.6%) | 59 (44.4%) |
| Mining, Quarrying, & Extraction | 391 (98.5%) | 6 (1.5%) |
| Construction | 562 (88.6%) | 72 (11.4%) |
| Manufacturing | 567 (73.3%) | 207 (26.7%) |
| Wholesale Trade | 122 (84.7%) | 22 (15.3%) |
| Retail Trade | 408 (50.2%) | 404 (49.7%) |
| Transportation & Warehousing | 96 (46.4%) | 111 (53.6%) |
| Utilities | 35 (76.1%) | 11 (23.9%) |
| Information | 67 (71.3%) | 27 (28.7%) |
| Finance & Insurance | 52 (44.1%) | 66 (55.9%) |
| Real Estate, Rental & Leasing | 95 (81.2%) | 22 (18.8%) |
| Professional & Scientific | 144 (70.2%) | 61 (29.8%) |
| Enterprise Management | 0 (0.0%) | 0 (0.0%) |
| Administrative & Support | 108 (60.3%) | 71 (39.7%) |
| Educational Services | 46 (11.5%) | 355 (88.5%) |
| Health Care & Social Assistance | 73 (10.2%) | 644 (89.8%) |
| Arts, Entertainment & Recreation | 60 (49.2%) | 62 (50.8%) |
| Accommodation & Food Services | 237 (42.8%) | 317 (57.2%) |
| Public Administration | 243 (68.4%) | 112 (31.6%) |
| Total | 3,601 (56.3%) | 2,800 (43.7%) |
Education in Mineral Wells
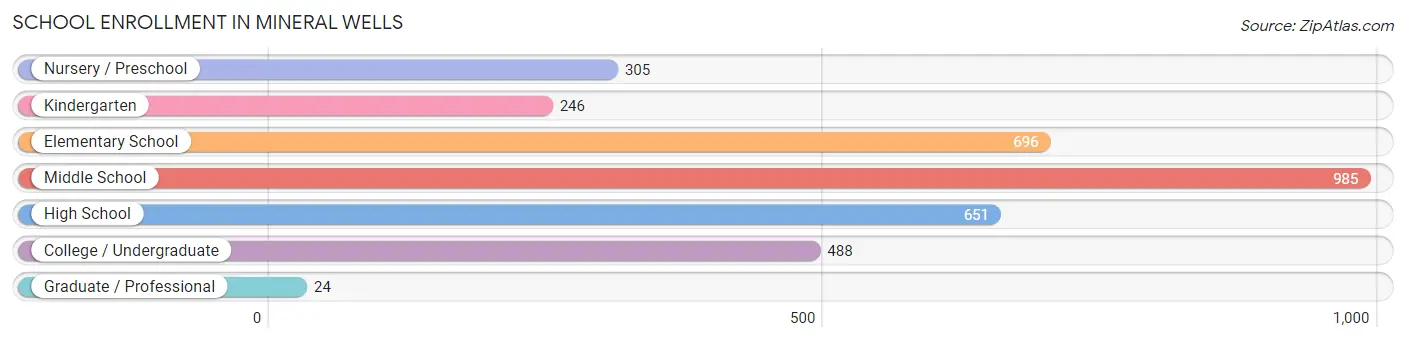
School Enrollment in Mineral Wells
The most common levels of schooling among the 3,395 students in Mineral Wells are middle school (985 | 29.0%), elementary school (696 | 20.5%), and high school (651 | 19.2%).
| School Level | # Students | % Students |
| Nursery / Preschool | 305 | 9.0% |
| Kindergarten | 246 | 7.2% |
| Elementary School | 696 | 20.5% |
| Middle School | 985 | 29.0% |
| High School | 651 | 19.2% |
| College / Undergraduate | 488 | 14.4% |
| Graduate / Professional | 24 | 0.7% |
| Total | 3,395 | 100.0% |
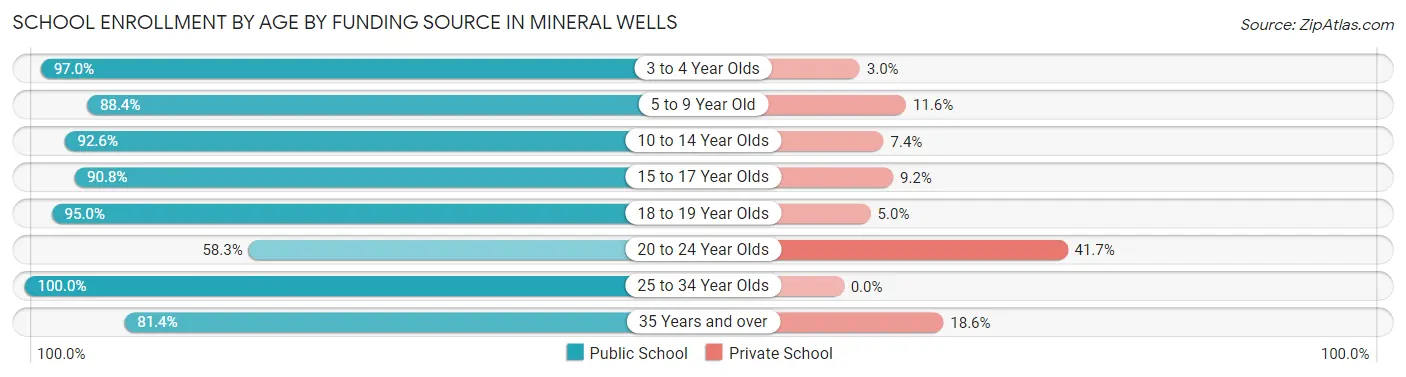
School Enrollment by Age by Funding Source in Mineral Wells
Out of a total of 3,395 students who are enrolled in schools in Mineral Wells, 367 (10.8%) attend a private institution, while the remaining 3,028 (89.2%) are enrolled in public schools. The age group of 20 to 24 year olds has the highest likelihood of being enrolled in private schools, with 103 (41.7% in the age bracket) enrolled. Conversely, the age group of 25 to 34 year olds has the lowest likelihood of being enrolled in a private school, with 149 (100.0% in the age bracket) attending a public institution.
| Age Bracket | Public School | Private School |
| 3 to 4 Year Olds | 161 (97.0%) | 5 (3.0%) |
| 5 to 9 Year Old | 760 (88.4%) | 100 (11.6%) |
| 10 to 14 Year Olds | 1,145 (92.6%) | 92 (7.4%) |
| 15 to 17 Year Olds | 424 (90.8%) | 43 (9.2%) |
| 18 to 19 Year Olds | 189 (95.0%) | 10 (5.0%) |
| 20 to 24 Year Olds | 144 (58.3%) | 103 (41.7%) |
| 25 to 34 Year Olds | 149 (100.0%) | 0 (0.0%) |
| 35 Years and over | 57 (81.4%) | 13 (18.6%) |
| Total | 3,028 (89.2%) | 367 (10.8%) |
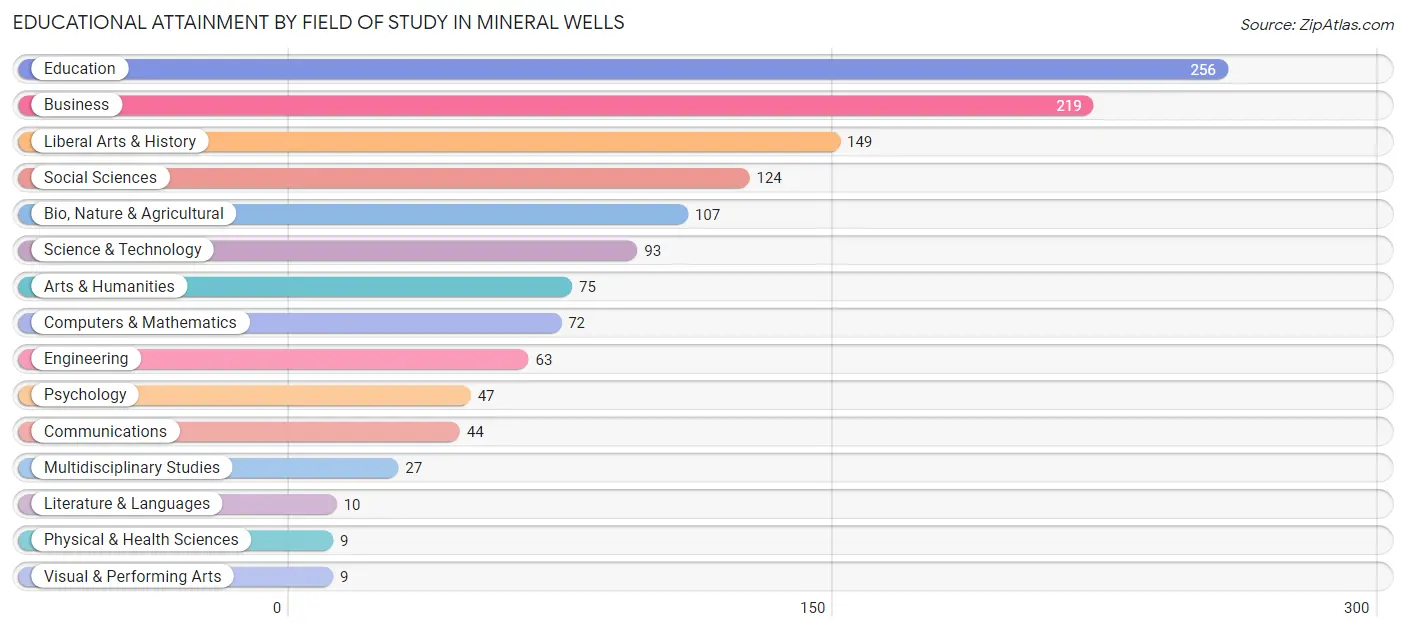
Educational Attainment by Field of Study in Mineral Wells
Education (256 | 19.6%), business (219 | 16.8%), liberal arts & history (149 | 11.4%), social sciences (124 | 9.5%), and bio, nature & agricultural (107 | 8.2%) are the most common fields of study among 1,304 individuals in Mineral Wells who have obtained a bachelor's degree or higher.
| Field of Study | # Graduates | % Graduates |
| Computers & Mathematics | 72 | 5.5% |
| Bio, Nature & Agricultural | 107 | 8.2% |
| Physical & Health Sciences | 9 | 0.7% |
| Psychology | 47 | 3.6% |
| Social Sciences | 124 | 9.5% |
| Engineering | 63 | 4.8% |
| Multidisciplinary Studies | 27 | 2.1% |
| Science & Technology | 93 | 7.1% |
| Business | 219 | 16.8% |
| Education | 256 | 19.6% |
| Literature & Languages | 10 | 0.8% |
| Liberal Arts & History | 149 | 11.4% |
| Visual & Performing Arts | 9 | 0.7% |
| Communications | 44 | 3.4% |
| Arts & Humanities | 75 | 5.8% |
| Total | 1,304 | 100.0% |
Transportation & Commute in Mineral Wells
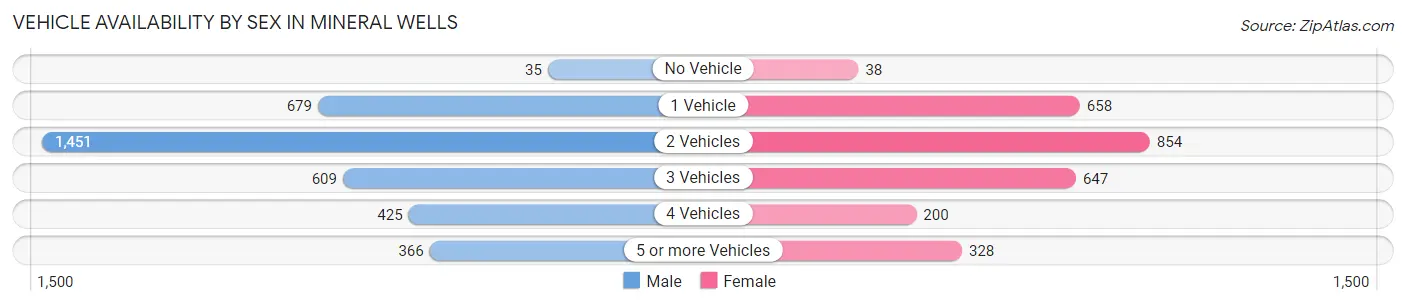
Vehicle Availability by Sex in Mineral Wells
The most prevalent vehicle ownership categories in Mineral Wells are males with 2 vehicles (1,451, accounting for 40.7%) and females with 2 vehicles (854, making up 53.2%).
| Vehicles Available | Male | Female |
| No Vehicle | 35 (1.0%) | 38 (1.4%) |
| 1 Vehicle | 679 (19.1%) | 658 (24.1%) |
| 2 Vehicles | 1,451 (40.7%) | 854 (31.3%) |
| 3 Vehicles | 609 (17.1%) | 647 (23.7%) |
| 4 Vehicles | 425 (11.9%) | 200 (7.3%) |
| 5 or more Vehicles | 366 (10.3%) | 328 (12.0%) |
| Total | 3,565 (100.0%) | 2,725 (100.0%) |
Commute Time in Mineral Wells
The most frequently occuring commute durations in Mineral Wells are 5 to 9 minutes (1,045 commuters, 17.5%), 10 to 14 minutes (981 commuters, 16.5%), and 30 to 34 minutes (698 commuters, 11.7%).
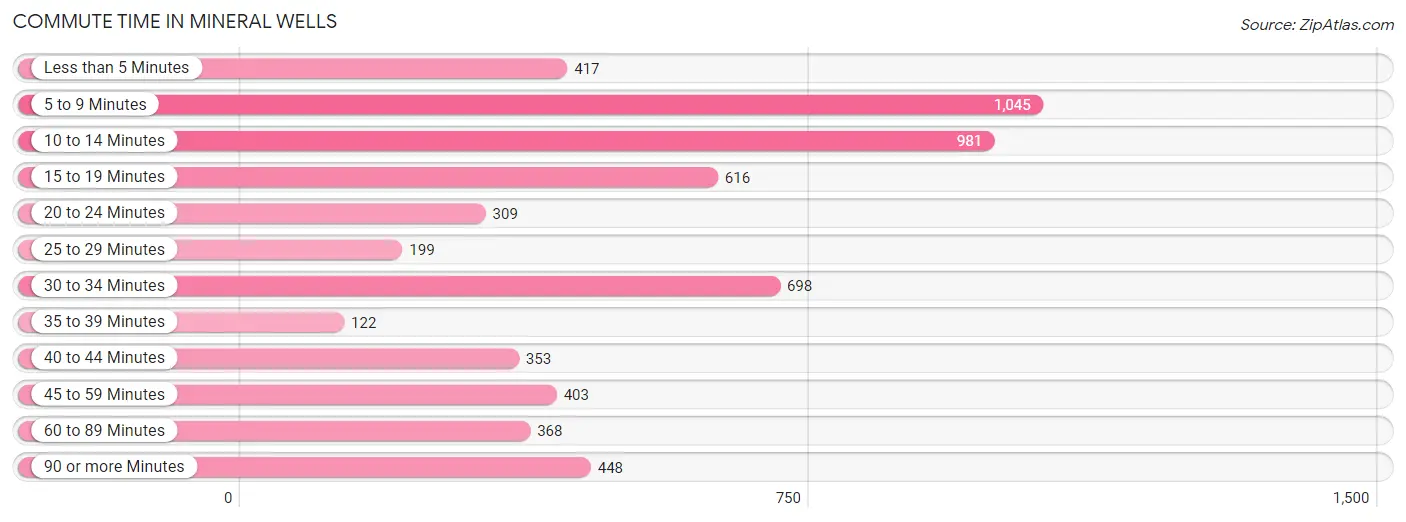
| Commute Time | # Commuters | % Commuters |
| Less than 5 Minutes | 417 | 7.0% |
| 5 to 9 Minutes | 1,045 | 17.5% |
| 10 to 14 Minutes | 981 | 16.5% |
| 15 to 19 Minutes | 616 | 10.3% |
| 20 to 24 Minutes | 309 | 5.2% |
| 25 to 29 Minutes | 199 | 3.3% |
| 30 to 34 Minutes | 698 | 11.7% |
| 35 to 39 Minutes | 122 | 2.1% |
| 40 to 44 Minutes | 353 | 5.9% |
| 45 to 59 Minutes | 403 | 6.8% |
| 60 to 89 Minutes | 368 | 6.2% |
| 90 or more Minutes | 448 | 7.5% |
Commute Time by Sex in Mineral Wells
The most common commute times in Mineral Wells are 5 to 9 minutes (472 commuters, 14.0%) for males and 10 to 14 minutes (599 commuters, 23.1%) for females.
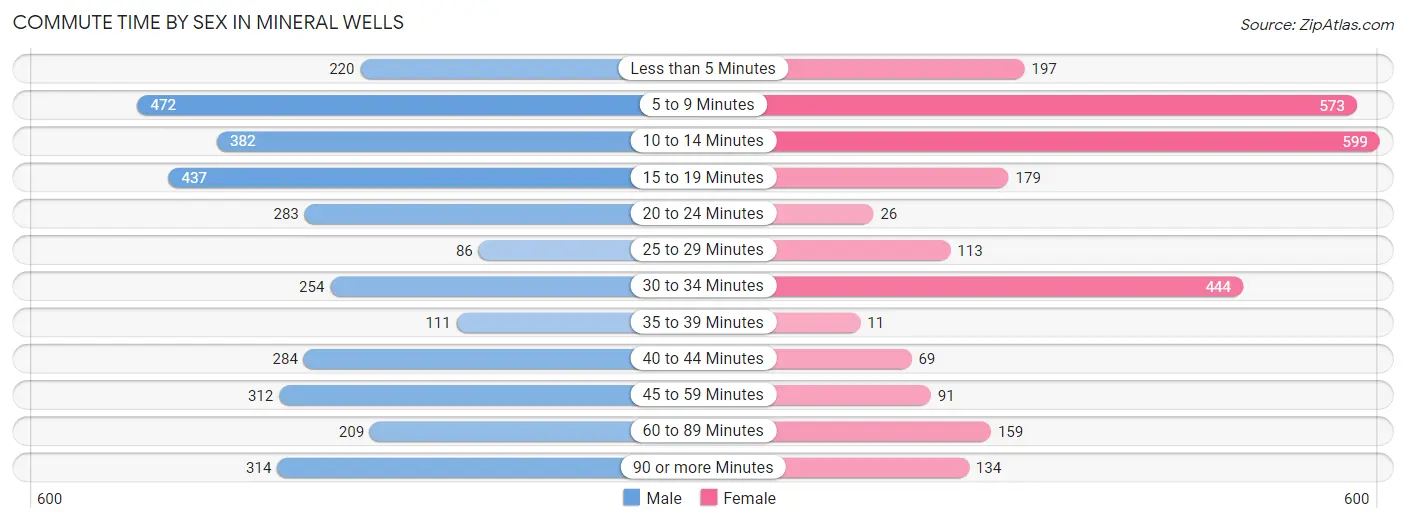
| Commute Time | Male | Female |
| Less than 5 Minutes | 220 (6.5%) | 197 (7.6%) |
| 5 to 9 Minutes | 472 (14.0%) | 573 (22.1%) |
| 10 to 14 Minutes | 382 (11.4%) | 599 (23.1%) |
| 15 to 19 Minutes | 437 (13.0%) | 179 (6.9%) |
| 20 to 24 Minutes | 283 (8.4%) | 26 (1.0%) |
| 25 to 29 Minutes | 86 (2.6%) | 113 (4.3%) |
| 30 to 34 Minutes | 254 (7.5%) | 444 (17.1%) |
| 35 to 39 Minutes | 111 (3.3%) | 11 (0.4%) |
| 40 to 44 Minutes | 284 (8.4%) | 69 (2.7%) |
| 45 to 59 Minutes | 312 (9.3%) | 91 (3.5%) |
| 60 to 89 Minutes | 209 (6.2%) | 159 (6.1%) |
| 90 or more Minutes | 314 (9.3%) | 134 (5.2%) |
Time of Departure to Work by Sex in Mineral Wells
The most frequent times of departure to work in Mineral Wells are 7:00 AM to 7:29 AM (672, 20.0%) for males and 7:30 AM to 7:59 AM (492, 19.0%) for females.
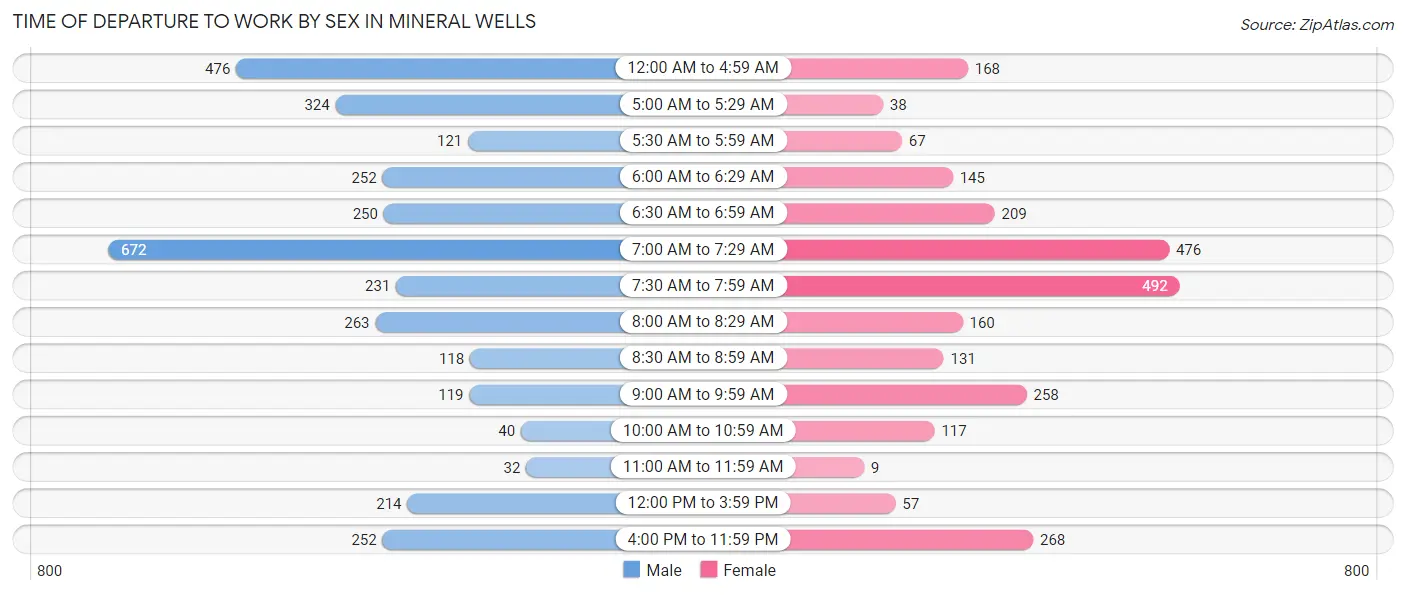
| Time of Departure | Male | Female |
| 12:00 AM to 4:59 AM | 476 (14.1%) | 168 (6.5%) |
| 5:00 AM to 5:29 AM | 324 (9.6%) | 38 (1.5%) |
| 5:30 AM to 5:59 AM | 121 (3.6%) | 67 (2.6%) |
| 6:00 AM to 6:29 AM | 252 (7.5%) | 145 (5.6%) |
| 6:30 AM to 6:59 AM | 250 (7.4%) | 209 (8.1%) |
| 7:00 AM to 7:29 AM | 672 (20.0%) | 476 (18.3%) |
| 7:30 AM to 7:59 AM | 231 (6.9%) | 492 (19.0%) |
| 8:00 AM to 8:29 AM | 263 (7.8%) | 160 (6.2%) |
| 8:30 AM to 8:59 AM | 118 (3.5%) | 131 (5.1%) |
| 9:00 AM to 9:59 AM | 119 (3.5%) | 258 (9.9%) |
| 10:00 AM to 10:59 AM | 40 (1.2%) | 117 (4.5%) |
| 11:00 AM to 11:59 AM | 32 (0.9%) | 9 (0.4%) |
| 12:00 PM to 3:59 PM | 214 (6.4%) | 57 (2.2%) |
| 4:00 PM to 11:59 PM | 252 (7.5%) | 268 (10.3%) |
| Total | 3,364 (100.0%) | 2,595 (100.0%) |
Housing Occupancy in Mineral Wells
Occupancy by Ownership in Mineral Wells
Of the total 5,209 dwellings in Mineral Wells, owner-occupied units account for 3,053 (58.6%), while renter-occupied units make up 2,156 (41.4%).
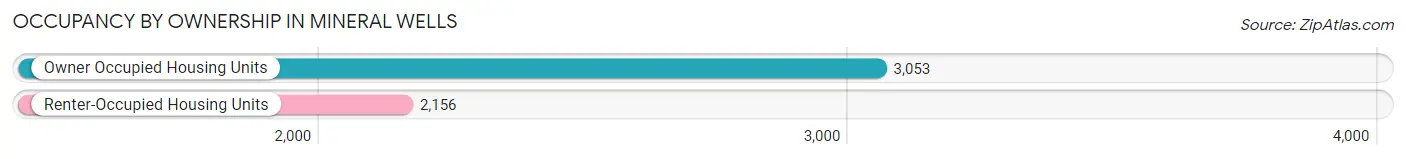
| Occupancy | # Housing Units | % Housing Units |
| Owner Occupied Housing Units | 3,053 | 58.6% |
| Renter-Occupied Housing Units | 2,156 | 41.4% |
| Total Occupied Housing Units | 5,209 | 100.0% |
Occupancy by Household Size in Mineral Wells
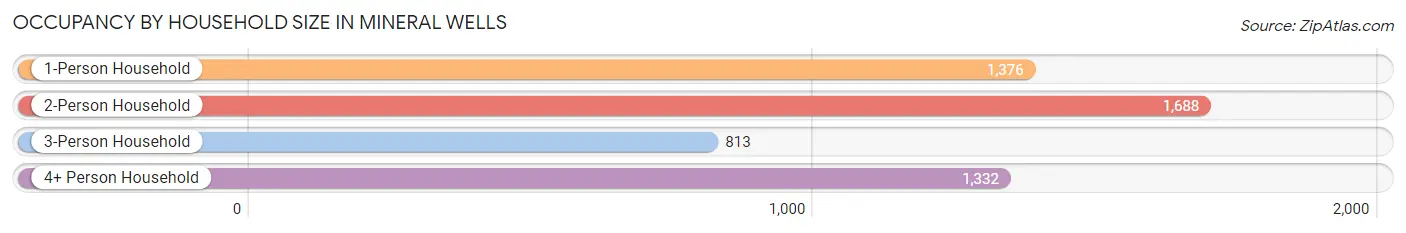
| Household Size | # Housing Units | % Housing Units |
| 1-Person Household | 1,376 | 26.4% |
| 2-Person Household | 1,688 | 32.4% |
| 3-Person Household | 813 | 15.6% |
| 4+ Person Household | 1,332 | 25.6% |
| Total Housing Units | 5,209 | 100.0% |
Occupancy by Ownership by Household Size in Mineral Wells
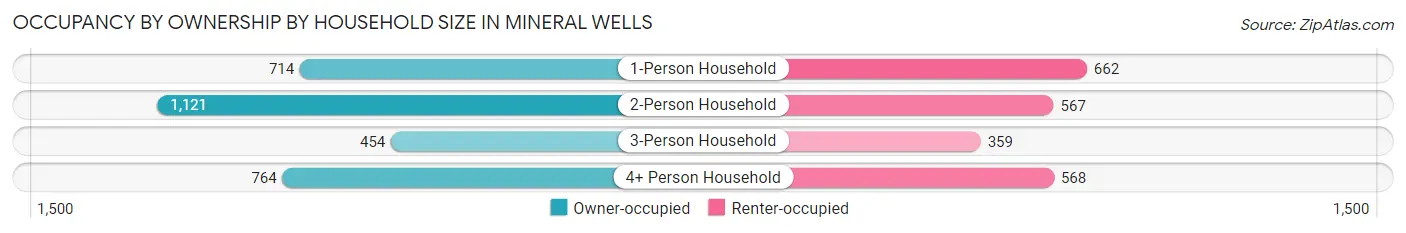
| Household Size | Owner-occupied | Renter-occupied |
| 1-Person Household | 714 (51.9%) | 662 (48.1%) |
| 2-Person Household | 1,121 (66.4%) | 567 (33.6%) |
| 3-Person Household | 454 (55.8%) | 359 (44.2%) |
| 4+ Person Household | 764 (57.4%) | 568 (42.6%) |
| Total Housing Units | 3,053 (58.6%) | 2,156 (41.4%) |
Occupancy by Educational Attainment in Mineral Wells
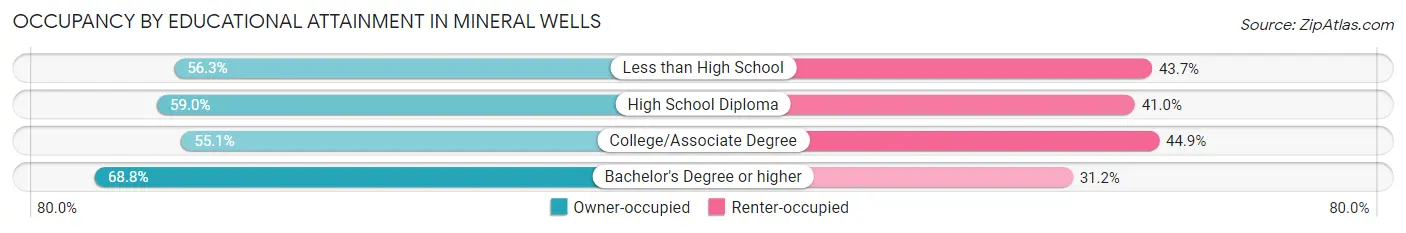
| Household Size | Owner-occupied | Renter-occupied |
| Less than High School | 445 (56.3%) | 346 (43.7%) |
| High School Diploma | 1,089 (59.0%) | 757 (41.0%) |
| College/Associate Degree | 1,011 (55.1%) | 823 (44.9%) |
| Bachelor's Degree or higher | 508 (68.8%) | 230 (31.2%) |
Occupancy by Age of Householder in Mineral Wells
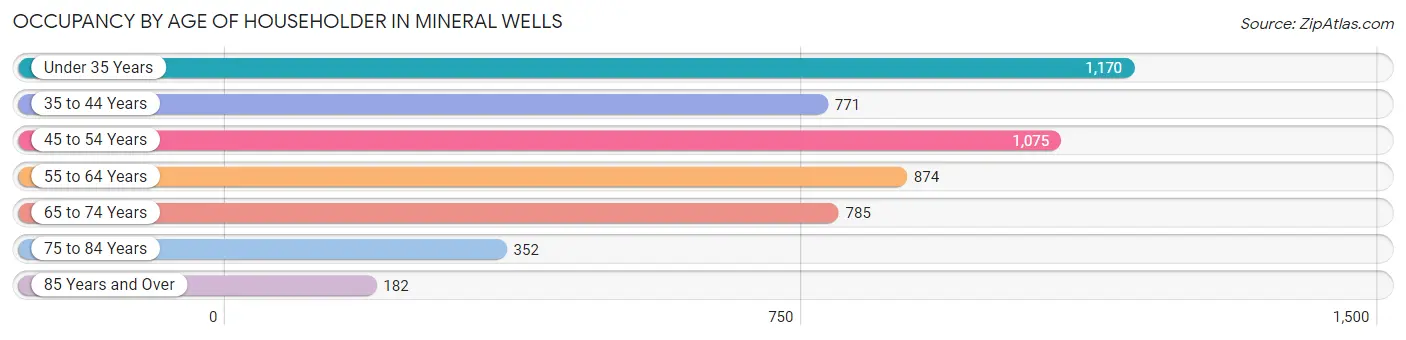
| Age Bracket | # Households | % Households |
| Under 35 Years | 1,170 | 22.5% |
| 35 to 44 Years | 771 | 14.8% |
| 45 to 54 Years | 1,075 | 20.6% |
| 55 to 64 Years | 874 | 16.8% |
| 65 to 74 Years | 785 | 15.1% |
| 75 to 84 Years | 352 | 6.8% |
| 85 Years and Over | 182 | 3.5% |
| Total | 5,209 | 100.0% |
Housing Finances in Mineral Wells
Median Income by Occupancy in Mineral Wells
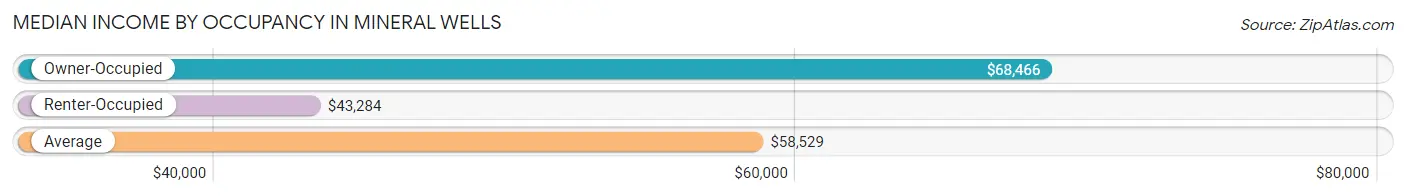
| Occupancy Type | # Households | Median Income |
| Owner-Occupied | 3,053 (58.6%) | $68,466 |
| Renter-Occupied | 2,156 (41.4%) | $43,284 |
| Average | 5,209 (100.0%) | $58,529 |
Occupancy by Householder Income Bracket in Mineral Wells
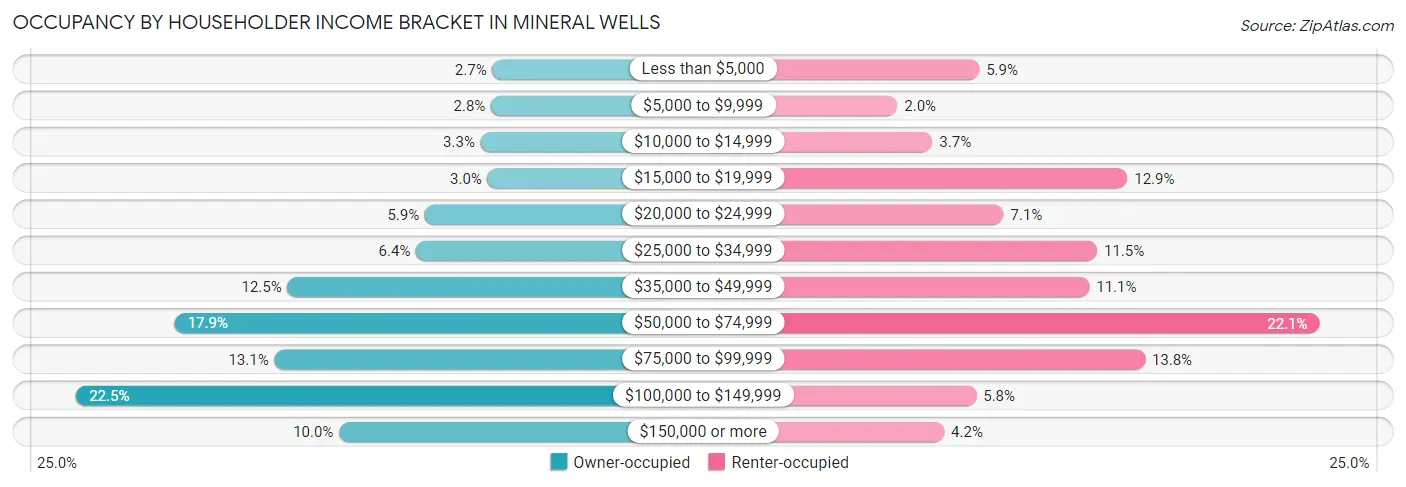
| Income Bracket | Owner-occupied | Renter-occupied |
| Less than $5,000 | 83 (2.7%) | 127 (5.9%) |
| $5,000 to $9,999 | 85 (2.8%) | 43 (2.0%) |
| $10,000 to $14,999 | 100 (3.3%) | 79 (3.7%) |
| $15,000 to $19,999 | 90 (2.9%) | 279 (12.9%) |
| $20,000 to $24,999 | 181 (5.9%) | 152 (7.0%) |
| $25,000 to $34,999 | 194 (6.4%) | 248 (11.5%) |
| $35,000 to $49,999 | 381 (12.5%) | 240 (11.1%) |
| $50,000 to $74,999 | 545 (17.8%) | 476 (22.1%) |
| $75,000 to $99,999 | 400 (13.1%) | 297 (13.8%) |
| $100,000 to $149,999 | 688 (22.5%) | 124 (5.8%) |
| $150,000 or more | 306 (10.0%) | 91 (4.2%) |
| Total | 3,053 (100.0%) | 2,156 (100.0%) |
Monthly Housing Cost Tiers in Mineral Wells
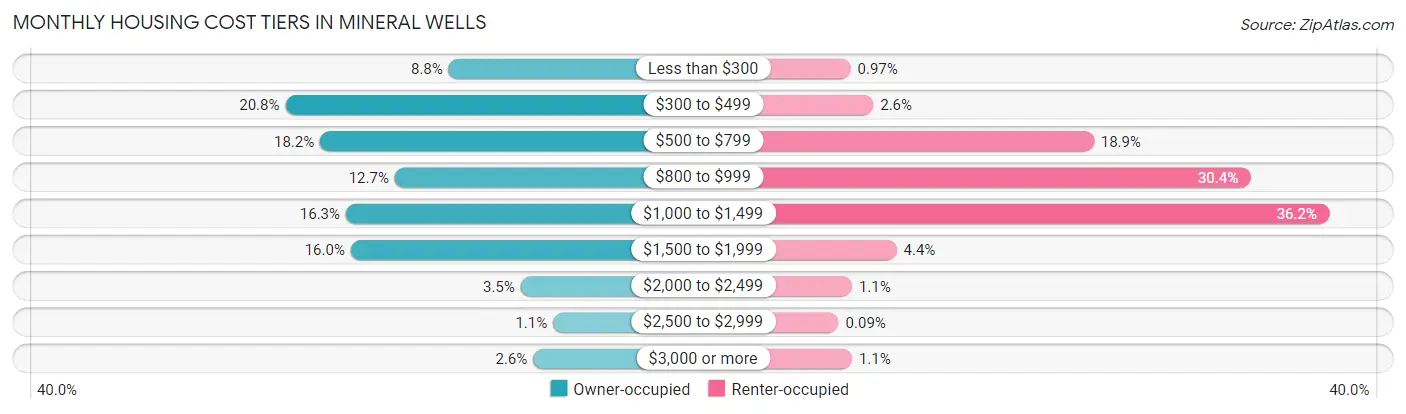
| Monthly Cost | Owner-occupied | Renter-occupied |
| Less than $300 | 268 (8.8%) | 21 (1.0%) |
| $300 to $499 | 635 (20.8%) | 57 (2.6%) |
| $500 to $799 | 557 (18.2%) | 407 (18.9%) |
| $800 to $999 | 389 (12.7%) | 655 (30.4%) |
| $1,000 to $1,499 | 499 (16.3%) | 780 (36.2%) |
| $1,500 to $1,999 | 488 (16.0%) | 94 (4.4%) |
| $2,000 to $2,499 | 106 (3.5%) | 23 (1.1%) |
| $2,500 to $2,999 | 33 (1.1%) | 2 (0.1%) |
| $3,000 or more | 78 (2.5%) | 23 (1.1%) |
| Total | 3,053 (100.0%) | 2,156 (100.0%) |
Physical Housing Characteristics in Mineral Wells
Housing Structures in Mineral Wells
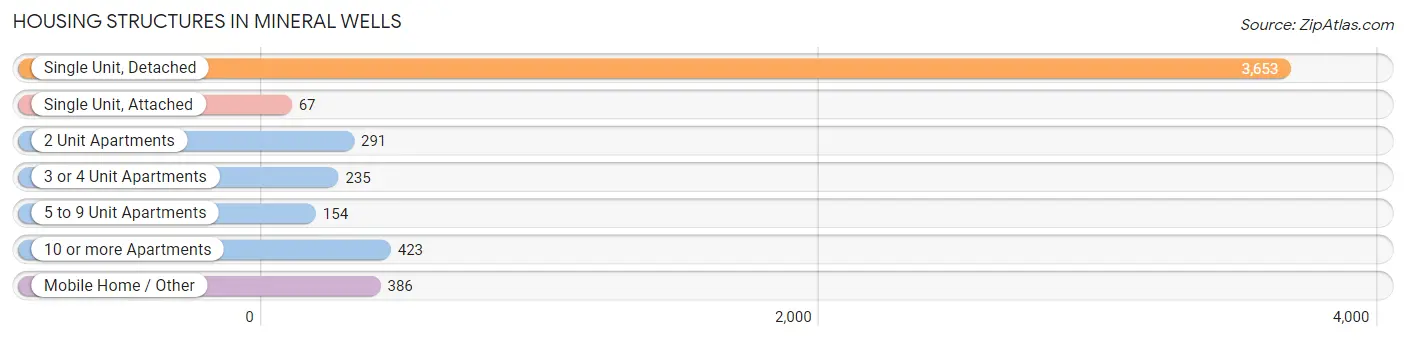
| Structure Type | # Housing Units | % Housing Units |
| Single Unit, Detached | 3,653 | 70.1% |
| Single Unit, Attached | 67 | 1.3% |
| 2 Unit Apartments | 291 | 5.6% |
| 3 or 4 Unit Apartments | 235 | 4.5% |
| 5 to 9 Unit Apartments | 154 | 3.0% |
| 10 or more Apartments | 423 | 8.1% |
| Mobile Home / Other | 386 | 7.4% |
| Total | 5,209 | 100.0% |
Housing Structures by Occupancy in Mineral Wells
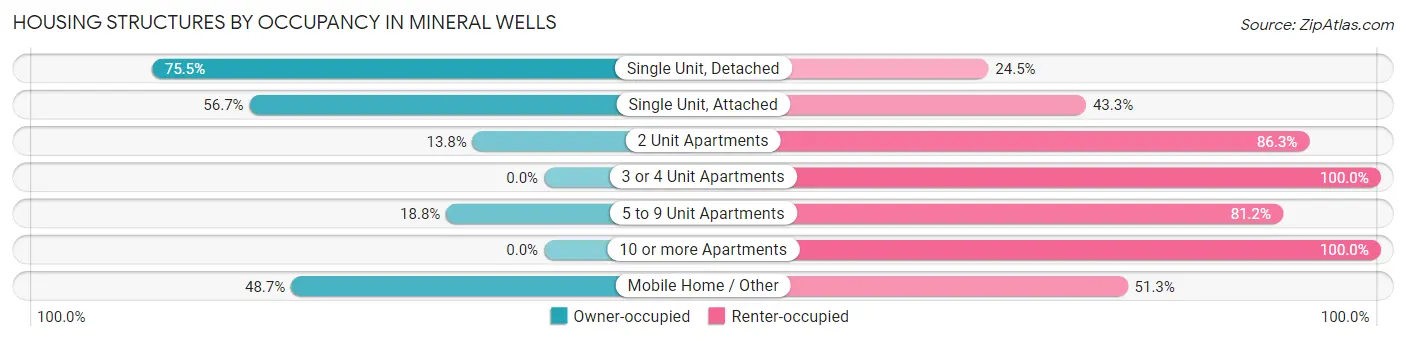
| Structure Type | Owner-occupied | Renter-occupied |
| Single Unit, Detached | 2,758 (75.5%) | 895 (24.5%) |
| Single Unit, Attached | 38 (56.7%) | 29 (43.3%) |
| 2 Unit Apartments | 40 (13.8%) | 251 (86.3%) |
| 3 or 4 Unit Apartments | 0 (0.0%) | 235 (100.0%) |
| 5 to 9 Unit Apartments | 29 (18.8%) | 125 (81.2%) |
| 10 or more Apartments | 0 (0.0%) | 423 (100.0%) |
| Mobile Home / Other | 188 (48.7%) | 198 (51.3%) |
| Total | 3,053 (58.6%) | 2,156 (41.4%) |
Housing Structures by Number of Rooms in Mineral Wells
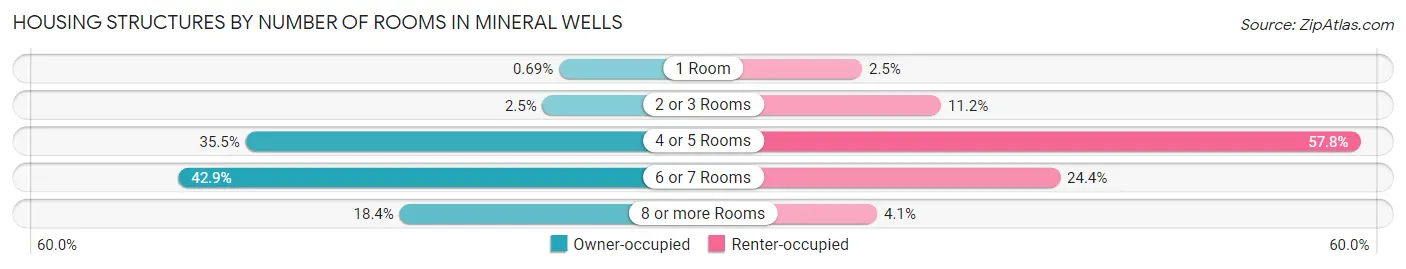
| Number of Rooms | Owner-occupied | Renter-occupied |
| 1 Room | 21 (0.7%) | 53 (2.5%) |
| 2 or 3 Rooms | 77 (2.5%) | 242 (11.2%) |
| 4 or 5 Rooms | 1,083 (35.5%) | 1,245 (57.8%) |
| 6 or 7 Rooms | 1,311 (42.9%) | 527 (24.4%) |
| 8 or more Rooms | 561 (18.4%) | 89 (4.1%) |
| Total | 3,053 (100.0%) | 2,156 (100.0%) |
Housing Structure by Heating Type in Mineral Wells
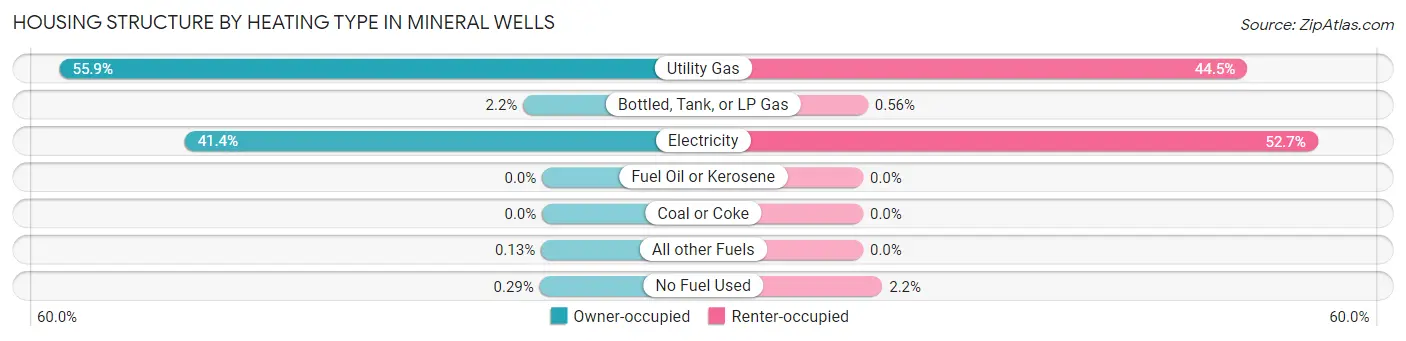
| Heating Type | Owner-occupied | Renter-occupied |
| Utility Gas | 1,708 (55.9%) | 960 (44.5%) |
| Bottled, Tank, or LP Gas | 67 (2.2%) | 12 (0.6%) |
| Electricity | 1,265 (41.4%) | 1,136 (52.7%) |
| Fuel Oil or Kerosene | 0 (0.0%) | 0 (0.0%) |
| Coal or Coke | 0 (0.0%) | 0 (0.0%) |
| All other Fuels | 4 (0.1%) | 0 (0.0%) |
| No Fuel Used | 9 (0.3%) | 48 (2.2%) |
| Total | 3,053 (100.0%) | 2,156 (100.0%) |
Household Vehicle Usage in Mineral Wells
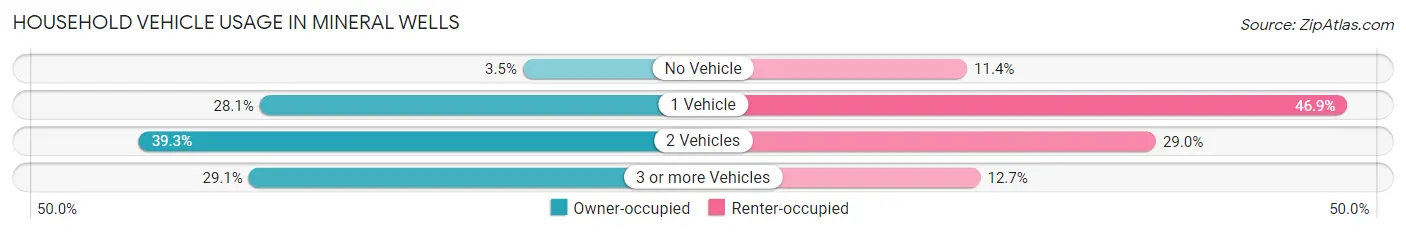
| Vehicles per Household | Owner-occupied | Renter-occupied |
| No Vehicle | 107 (3.5%) | 246 (11.4%) |
| 1 Vehicle | 857 (28.1%) | 1,011 (46.9%) |
| 2 Vehicles | 1,201 (39.3%) | 626 (29.0%) |
| 3 or more Vehicles | 888 (29.1%) | 273 (12.7%) |
| Total | 3,053 (100.0%) | 2,156 (100.0%) |
Real Estate & Mortgages in Mineral Wells
Real Estate and Mortgage Overview in Mineral Wells
| Characteristic | Without Mortgage | With Mortgage |
| Housing Units | 1,840 | 1,213 |
| Median Property Value | $94,500 | $161,700 |
| Median Household Income | $51,087 | $155 |
| Monthly Housing Costs | $506 | $78 |
| Real Estate Taxes | $1,413 | $69 |
Property Value by Mortgage Status in Mineral Wells
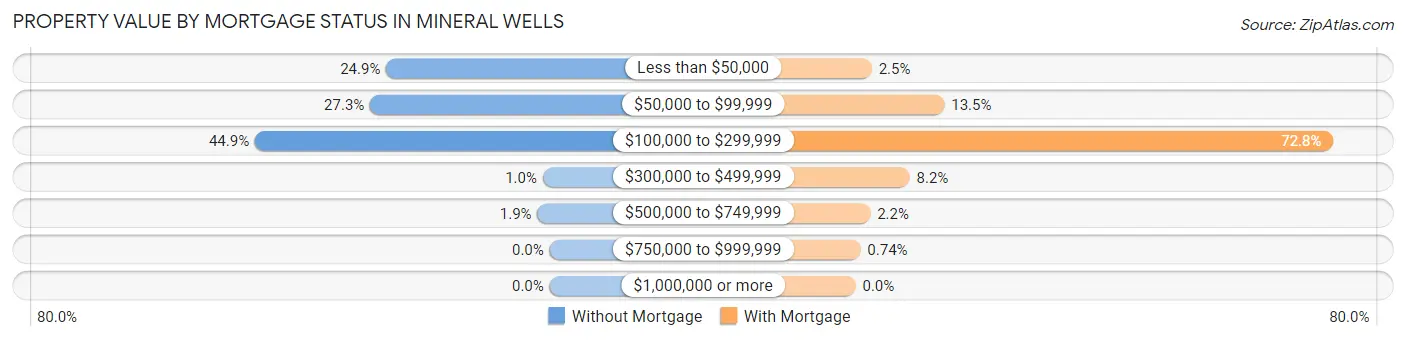
| Property Value | Without Mortgage | With Mortgage |
| Less than $50,000 | 458 (24.9%) | 30 (2.5%) |
| $50,000 to $99,999 | 503 (27.3%) | 164 (13.5%) |
| $100,000 to $299,999 | 826 (44.9%) | 883 (72.8%) |
| $300,000 to $499,999 | 19 (1.0%) | 100 (8.2%) |
| $500,000 to $749,999 | 34 (1.8%) | 27 (2.2%) |
| $750,000 to $999,999 | 0 (0.0%) | 9 (0.7%) |
| $1,000,000 or more | 0 (0.0%) | 0 (0.0%) |
| Total | 1,840 (100.0%) | 1,213 (100.0%) |
Household Income by Mortgage Status in Mineral Wells
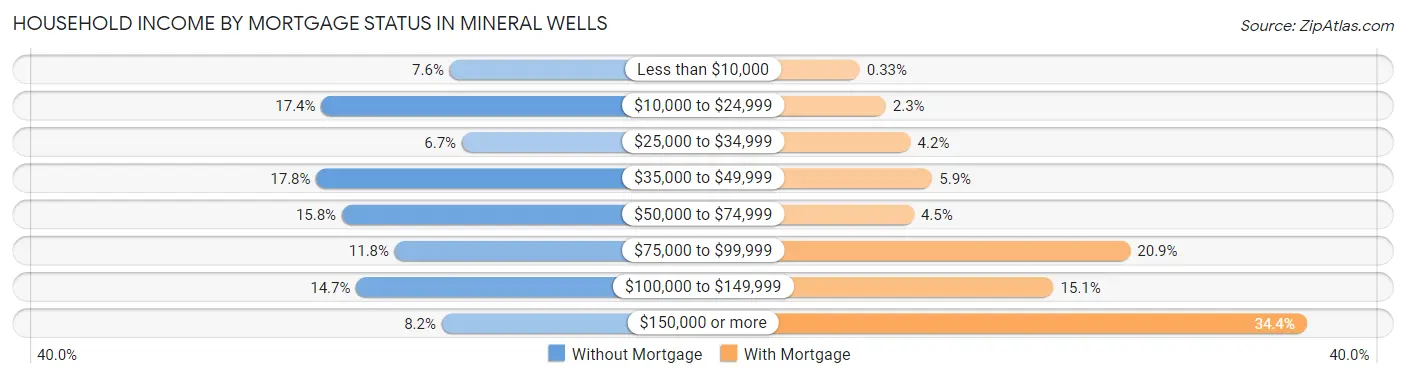
| Household Income | Without Mortgage | With Mortgage |
| Less than $10,000 | 140 (7.6%) | 4 (0.3%) |
| $10,000 to $24,999 | 320 (17.4%) | 28 (2.3%) |
| $25,000 to $34,999 | 123 (6.7%) | 51 (4.2%) |
| $35,000 to $49,999 | 327 (17.8%) | 71 (5.9%) |
| $50,000 to $74,999 | 291 (15.8%) | 54 (4.4%) |
| $75,000 to $99,999 | 217 (11.8%) | 254 (20.9%) |
| $100,000 to $149,999 | 271 (14.7%) | 183 (15.1%) |
| $150,000 or more | 151 (8.2%) | 417 (34.4%) |
| Total | 1,840 (100.0%) | 1,213 (100.0%) |
Property Value to Household Income Ratio in Mineral Wells
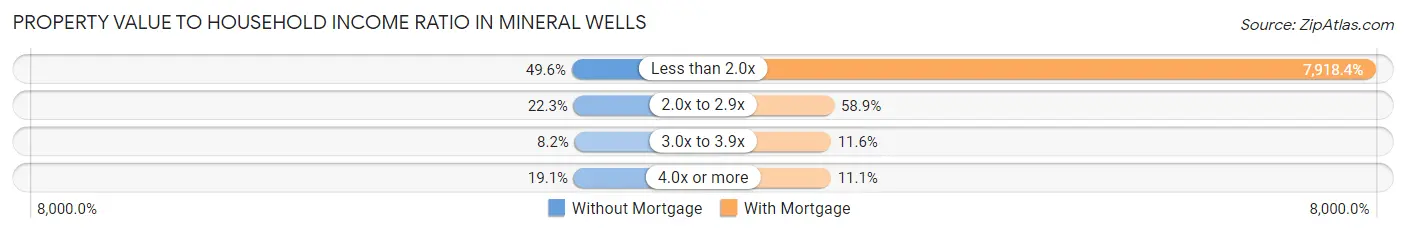
| Value-to-Income Ratio | Without Mortgage | With Mortgage |
| Less than 2.0x | 913 (49.6%) | 96,050 (7,918.4%) |
| 2.0x to 2.9x | 411 (22.3%) | 714 (58.9%) |
| 3.0x to 3.9x | 150 (8.2%) | 141 (11.6%) |
| 4.0x or more | 351 (19.1%) | 135 (11.1%) |
| Total | 1,840 (100.0%) | 1,213 (100.0%) |
Real Estate Taxes by Mortgage Status in Mineral Wells
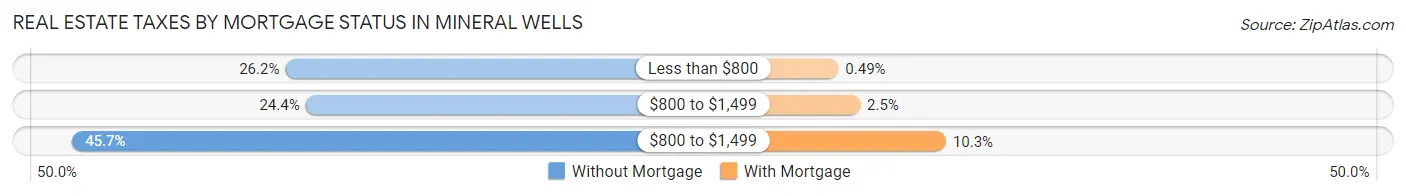
| Property Taxes | Without Mortgage | With Mortgage |
| Less than $800 | 482 (26.2%) | 6 (0.5%) |
| $800 to $1,499 | 448 (24.3%) | 30 (2.5%) |
| $800 to $1,499 | 840 (45.7%) | 125 (10.3%) |
| Total | 1,840 (100.0%) | 1,213 (100.0%) |
Health & Disability in Mineral Wells
Health Insurance Coverage by Age in Mineral Wells
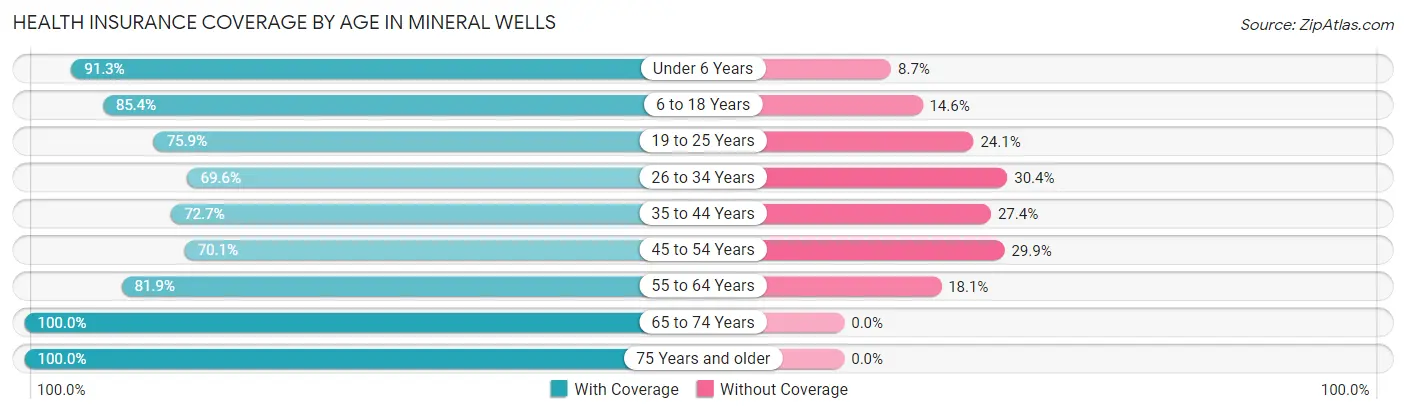
| Age Bracket | With Coverage | Without Coverage |
| Under 6 Years | 1,192 (91.3%) | 114 (8.7%) |
| 6 to 18 Years | 2,443 (85.4%) | 417 (14.6%) |
| 19 to 25 Years | 1,084 (75.9%) | 344 (24.1%) |
| 26 to 34 Years | 1,303 (69.6%) | 569 (30.4%) |
| 35 to 44 Years | 1,238 (72.7%) | 466 (27.4%) |
| 45 to 54 Years | 1,390 (70.1%) | 592 (29.9%) |
| 55 to 64 Years | 1,356 (81.9%) | 299 (18.1%) |
| 65 to 74 Years | 1,212 (100.0%) | 0 (0.0%) |
| 75 Years and older | 733 (100.0%) | 0 (0.0%) |
| Total | 11,951 (81.0%) | 2,801 (19.0%) |
Health Insurance Coverage by Citizenship Status in Mineral Wells
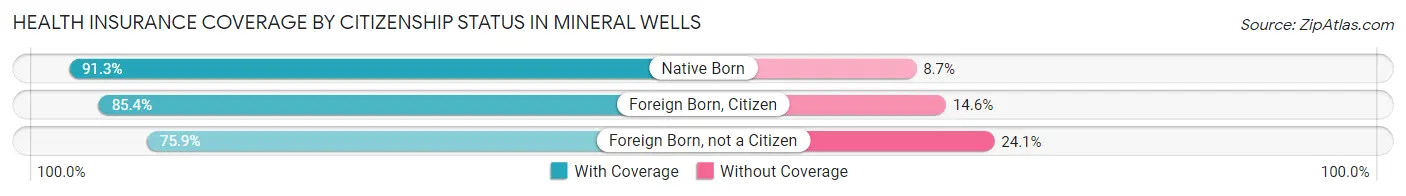
| Citizenship Status | With Coverage | Without Coverage |
| Native Born | 1,192 (91.3%) | 114 (8.7%) |
| Foreign Born, Citizen | 2,443 (85.4%) | 417 (14.6%) |
| Foreign Born, not a Citizen | 1,084 (75.9%) | 344 (24.1%) |
Health Insurance Coverage by Household Income in Mineral Wells
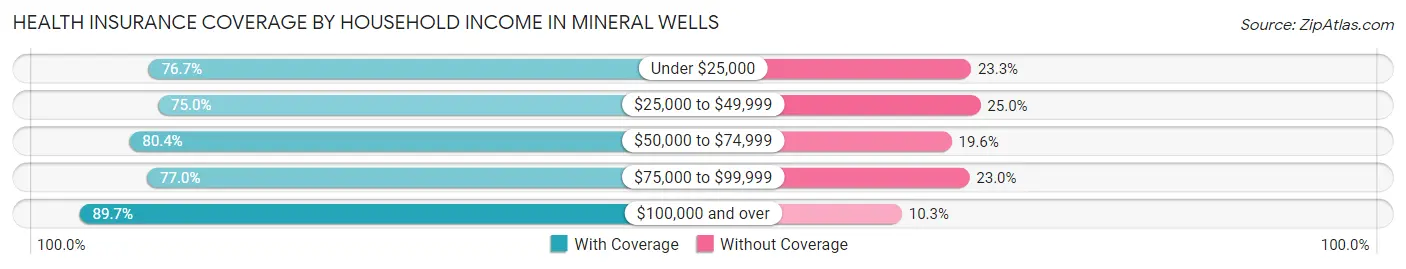
| Household Income | With Coverage | Without Coverage |
| Under $25,000 | 1,739 (76.7%) | 527 (23.3%) |
| $25,000 to $49,999 | 2,064 (75.0%) | 689 (25.0%) |
| $50,000 to $74,999 | 2,532 (80.4%) | 619 (19.6%) |
| $75,000 to $99,999 | 1,728 (77.0%) | 515 (23.0%) |
| $100,000 and over | 3,855 (89.7%) | 443 (10.3%) |
Public vs Private Health Insurance Coverage by Age in Mineral Wells
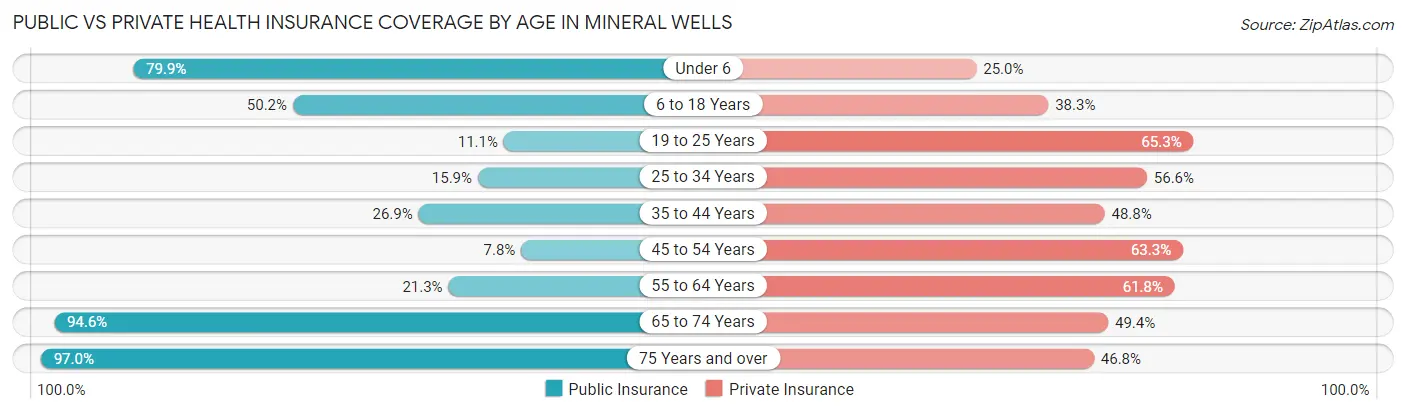
| Age Bracket | Public Insurance | Private Insurance |
| Under 6 | 1,043 (79.9%) | 326 (25.0%) |
| 6 to 18 Years | 1,436 (50.2%) | 1,096 (38.3%) |
| 19 to 25 Years | 158 (11.1%) | 932 (65.3%) |
| 25 to 34 Years | 297 (15.9%) | 1,060 (56.6%) |
| 35 to 44 Years | 458 (26.9%) | 831 (48.8%) |
| 45 to 54 Years | 155 (7.8%) | 1,255 (63.3%) |
| 55 to 64 Years | 353 (21.3%) | 1,023 (61.8%) |
| 65 to 74 Years | 1,146 (94.6%) | 599 (49.4%) |
| 75 Years and over | 711 (97.0%) | 343 (46.8%) |
| Total | 5,757 (39.0%) | 7,465 (50.6%) |
Disability Status by Sex by Age in Mineral Wells
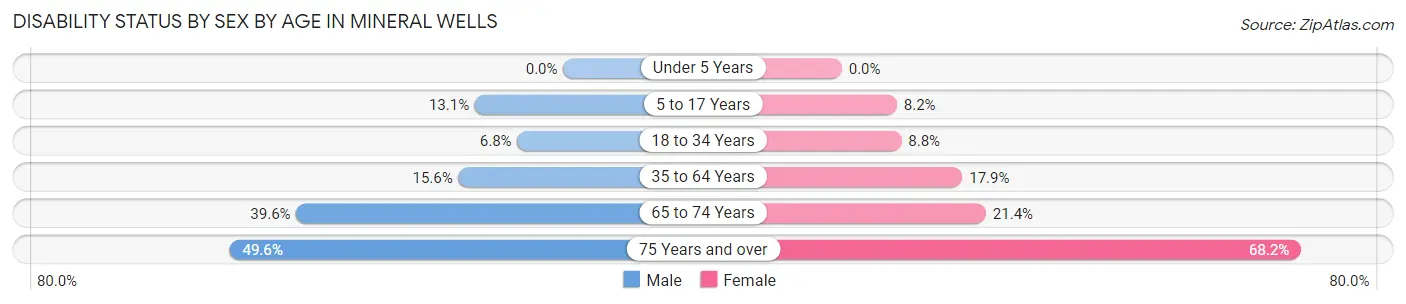
| Age Bracket | Male | Female |
| Under 5 Years | 0 (0.0%) | 0 (0.0%) |
| 5 to 17 Years | 202 (13.1%) | 96 (8.2%) |
| 18 to 34 Years | 129 (6.8%) | 161 (8.8%) |
| 35 to 64 Years | 386 (15.6%) | 512 (17.9%) |
| 65 to 74 Years | 197 (39.6%) | 153 (21.4%) |
| 75 Years and over | 170 (49.6%) | 266 (68.2%) |
Disability Class by Sex by Age in Mineral Wells
Disability Class: Hearing Difficulty
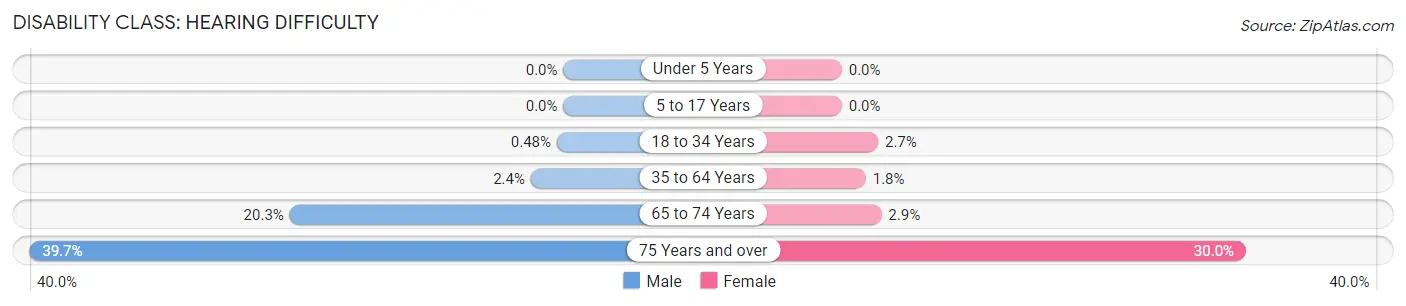
| Age Bracket | Male | Female |
| Under 5 Years | 0 (0.0%) | 0 (0.0%) |
| 5 to 17 Years | 0 (0.0%) | 0 (0.0%) |
| 18 to 34 Years | 9 (0.5%) | 49 (2.7%) |
| 35 to 64 Years | 60 (2.4%) | 51 (1.8%) |
| 65 to 74 Years | 101 (20.3%) | 21 (2.9%) |
| 75 Years and over | 136 (39.7%) | 117 (30.0%) |
Disability Class: Vision Difficulty
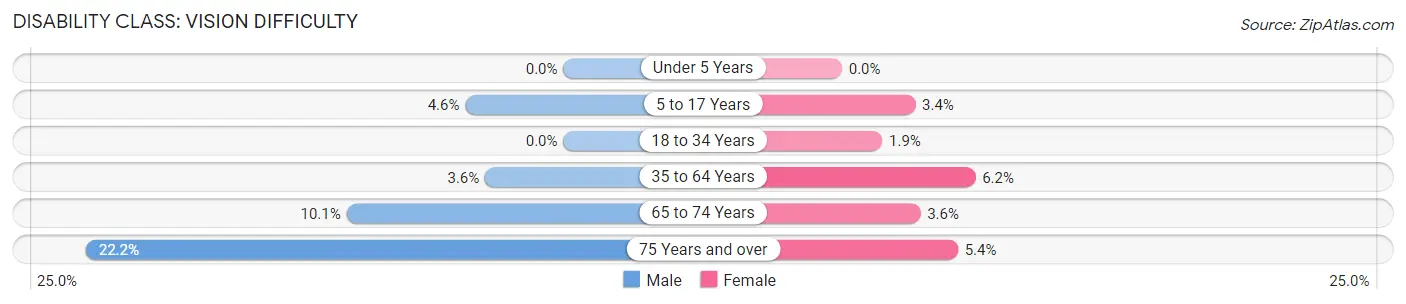
| Age Bracket | Male | Female |
| Under 5 Years | 0 (0.0%) | 0 (0.0%) |
| 5 to 17 Years | 70 (4.5%) | 40 (3.4%) |
| 18 to 34 Years | 0 (0.0%) | 34 (1.9%) |
| 35 to 64 Years | 90 (3.6%) | 177 (6.2%) |
| 65 to 74 Years | 50 (10.1%) | 26 (3.6%) |
| 75 Years and over | 76 (22.2%) | 21 (5.4%) |
Disability Class: Cognitive Difficulty
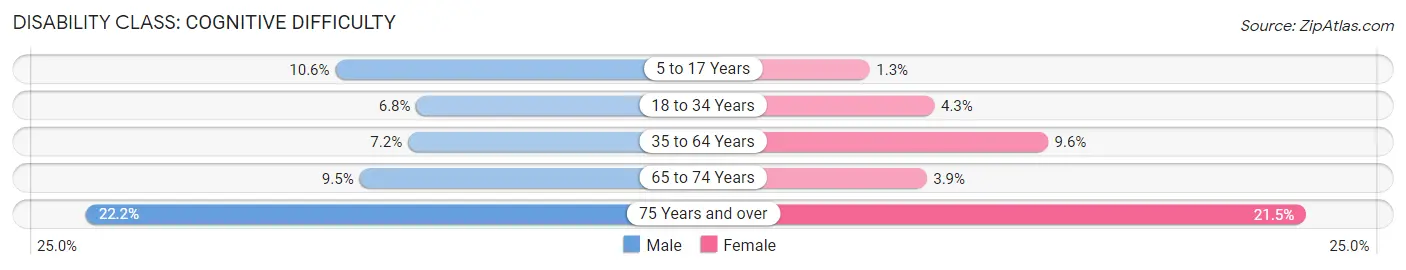
| Age Bracket | Male | Female |
| 5 to 17 Years | 163 (10.6%) | 15 (1.3%) |
| 18 to 34 Years | 129 (6.8%) | 78 (4.3%) |
| 35 to 64 Years | 179 (7.2%) | 273 (9.6%) |
| 65 to 74 Years | 47 (9.5%) | 28 (3.9%) |
| 75 Years and over | 76 (22.2%) | 84 (21.5%) |
Disability Class: Ambulatory Difficulty
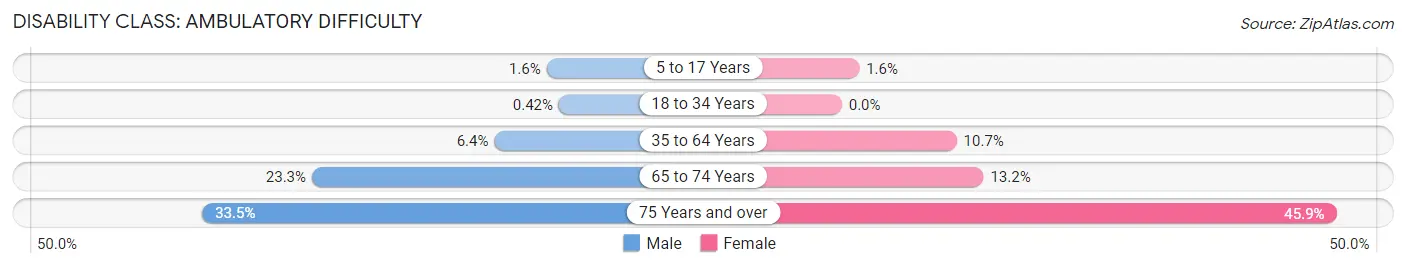
| Age Bracket | Male | Female |
| 5 to 17 Years | 24 (1.6%) | 19 (1.6%) |
| 18 to 34 Years | 8 (0.4%) | 0 (0.0%) |
| 35 to 64 Years | 159 (6.4%) | 305 (10.7%) |
| 65 to 74 Years | 116 (23.3%) | 94 (13.2%) |
| 75 Years and over | 115 (33.5%) | 179 (45.9%) |
Disability Class: Self-Care Difficulty
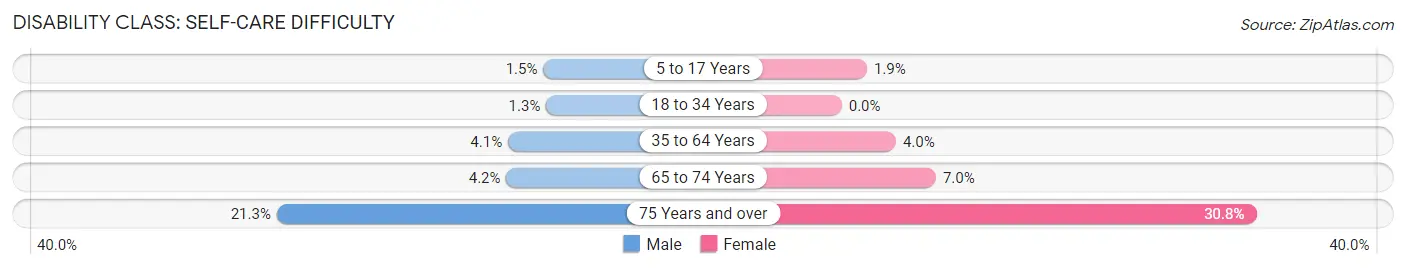
| Age Bracket | Male | Female |
| 5 to 17 Years | 23 (1.5%) | 22 (1.9%) |
| 18 to 34 Years | 24 (1.3%) | 0 (0.0%) |
| 35 to 64 Years | 102 (4.1%) | 115 (4.0%) |
| 65 to 74 Years | 21 (4.2%) | 50 (7.0%) |
| 75 Years and over | 73 (21.3%) | 120 (30.8%) |
Technology Access in Mineral Wells
Computing Device Access in Mineral Wells
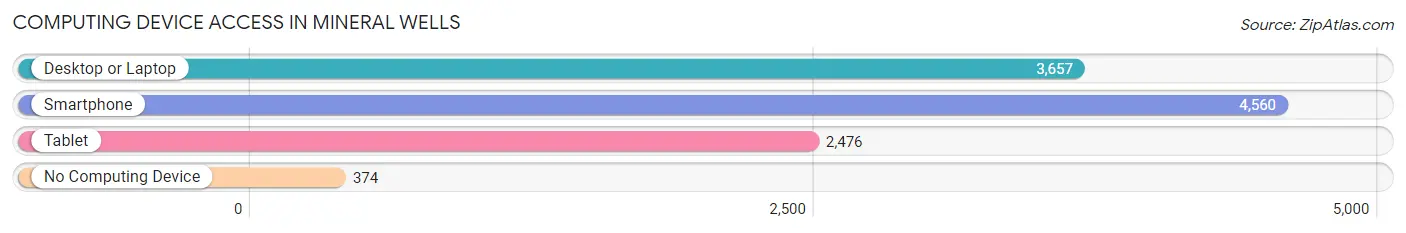
| Device Type | # Households | % Households |
| Desktop or Laptop | 3,657 | 70.2% |
| Smartphone | 4,560 | 87.5% |
| Tablet | 2,476 | 47.5% |
| No Computing Device | 374 | 7.2% |
| Total | 5,209 | 100.0% |
Internet Access in Mineral Wells
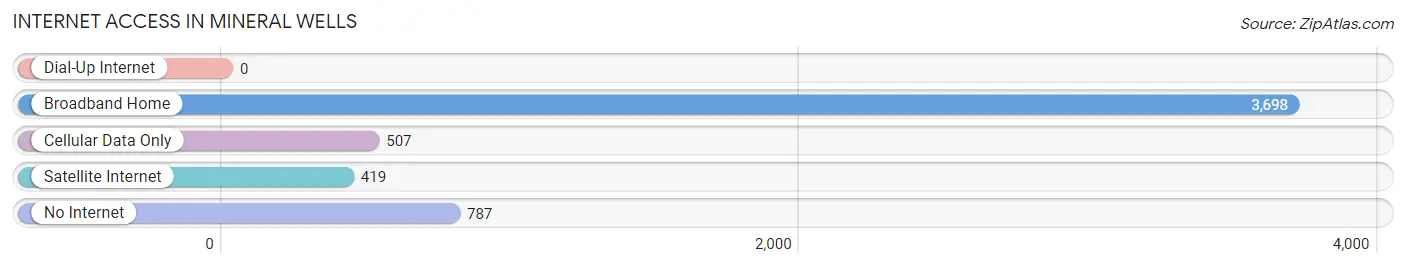
| Internet Type | # Households | % Households |
| Dial-Up Internet | 0 | 0.0% |
| Broadband Home | 3,698 | 71.0% |
| Cellular Data Only | 507 | 9.7% |
| Satellite Internet | 419 | 8.0% |
| No Internet | 787 | 15.1% |
| Total | 5,209 | 100.0% |
Mineral Wells Summary
Mineral Wells is a city located in Palo Pinto County, Texas, United States. It is located approximately 45 miles west of Fort Worth and is part of the Dallas-Fort Worth Metroplex. The population was 16,788 at the 2010 census.
History
Mineral Wells was founded in 1877 by a group of settlers who discovered mineral water springs in the area. The town was named after the springs, which were believed to have healing properties. The first post office was established in 1878 and the town was incorporated in 1909.
In the early 1900s, Mineral Wells became a popular tourist destination due to its mineral springs. The town was home to several large hotels, including the Baker Hotel, which opened in 1929 and was the largest hotel in Texas at the time. The hotel was a popular destination for celebrities and politicians, including President Franklin D. Roosevelt, who visited in 1933.
The town also became known for its “crazy water”, a mineral-rich water that was believed to have healing properties. The water was bottled and sold throughout the United States.
In the 1940s, Mineral Wells became a popular destination for military personnel due to its proximity to Fort Wolters, a U.S. Army base. The base was closed in 1973 and the town’s economy shifted to focus on tourism and manufacturing.
Geography
Mineral Wells is located at 32°48'25" North, 98°4'17" West (32.806944, -98.071389). According to the United States Census Bureau, the city has a total area of 11.2 square miles, of which 11.1 square miles is land and 0.1 square miles is water.
Economy
The economy of Mineral Wells is largely based on tourism and manufacturing. The city is home to several manufacturing companies, including a plant that produces plastic containers and a plant that produces automotive parts.
The city is also home to several tourist attractions, including the Crazy Water Hotel, the Mineral Wells Fossil Park, and the Mineral Wells State Park. The city is also home to the Palo Pinto County Historical Museum, which houses artifacts from the area’s history.
Demographics
As of the 2010 census, there were 16,788 people, 6,717 households, and 4,541 families residing in the city. The population density was 1,509.3 people per square mile. There were 7,541 housing units at an average density of 676.3 per square mile. The racial makeup of the city was 81.2% White, 8.3% African American, 0.7% Native American, 0.7% Asian, 0.1% Pacific Islander, 6.7% from other races, and 2.2% from two or more races. Hispanic or Latino of any race were 15.3% of the population.
There were 6,717 households, out of which 30.2% had children under the age of 18 living with them, 48.2% were married couples living together, 14.2% had a female householder with no husband present, and 32.7% were non-families. 28.2% of all households were made up of individuals, and 13.2% had someone living alone who was 65 years of age or older. The average household size was 2.48 and the average family size was 3.02.
In the city, the population was spread out, with 25.2% under the age of 18, 8.7% from 18 to 24, 25.7% from 25 to 44, 23.3% from 45 to 64, and 17.1% who were 65 years of age or older. The median age was 38 years. For every 100 females, there were 91.2 males. For every 100 females age 18 and over, there were 87.2 males.
The median income for a household in the city was $30,945, and the median income for a family was $37,813. Males had a median income of $30,945 versus $21,813 for females. The per capita income for the city was $17,845. About 13.2% of families and 16.3% of the population were below the poverty line, including 22.2% of those under age 18 and 11.7% of those age 65 or over.
Common Questions
What is Per Capita Income in Mineral Wells?
Per Capita income in Mineral Wells is $25,216.
What is the Median Family Income in Mineral Wells?
Median Family Income in Mineral Wells is $67,294.
What is the Median Household income in Mineral Wells?
Median Household Income in Mineral Wells is $58,529.
What is Income or Wage Gap in Mineral Wells?
Income or Wage Gap in Mineral Wells is 40.2%.
Women in Mineral Wells earn 59.8 cents for every dollar earned by a man.
What is Family Income Deficit in Mineral Wells?
Family Income Deficit in Mineral Wells is $9,676.
Families that are below poverty line in Mineral Wells earn $9,676 less on average than the poverty threshold level.
What is Inequality or Gini Index in Mineral Wells?
Inequality or Gini Index in Mineral Wells is 0.43.
What is the Total Population of Mineral Wells?
Total Population of Mineral Wells is 15,049.
What is the Total Male Population of Mineral Wells?
Total Male Population of Mineral Wells is 7,478.
What is the Total Female Population of Mineral Wells?
Total Female Population of Mineral Wells is 7,571.
What is the Ratio of Males per 100 Females in Mineral Wells?
There are 98.77 Males per 100 Females in Mineral Wells.
What is the Ratio of Females per 100 Males in Mineral Wells?
There are 101.24 Females per 100 Males in Mineral Wells.
What is the Median Population Age in Mineral Wells?
Median Population Age in Mineral Wells is 34.9 Years.
What is the Average Family Size in Mineral Wells
Average Family Size in Mineral Wells is 3.4 People.
What is the Average Household Size in Mineral Wells
Average Household Size in Mineral Wells is 2.8 People.
How Large is the Labor Force in Mineral Wells?
There are 6,971 People in the Labor Forcein in Mineral Wells.
What is the Percentage of People in the Labor Force in Mineral Wells?
60.2% of People are in the Labor Force in Mineral Wells.
What is the Unemployment Rate in Mineral Wells?
Unemployment Rate in Mineral Wells is 8.2%.